the survey of detection methods and testbeds for …282821/fulltext01.pdf · the survey of...
TRANSCRIPT
Master Program in Electronic Engineer Examiner: Magnus Isaksson Supervisor: Niclas Björsell
DEPARTMENT OF TECHNOLOGY AND BUILT ENVIRONMENT
The Survey of Detection Methods and Testbeds For Cognitive Radio Application
Xing Wu
Sep 4, 2009
1
Abstract
The need for RF spectrum for the rapidly growing broadband access services is
evident. Cognitive radio is an emerging technology that aims to introduce secondary
usage of the spectrum resources without interfering with the primary usage of the
licensed users but with a lower priority.
Signal detection for cognitive radios has drawn a lot of interest in the research
community, where different algorithms are suggested. The most commonly used
algorithms are energy detection, feature detection, eigenvalue based detection. Energy
detection is the simplest and most common way to detect signals. It has fast sensing
time but poor performance. The feature detection and eigenvalue based detection
methods are more sophisticated and offer better performance but they are more
complex and expensive. This thesis will present the pros and cons of each method and
offer comparisons between them.
To evaluate the performance of different algorithms used in cognitive radio, different
research testbeds have been suggested in the literature. Some of the most frequently
used testbeds are based on GNU-radio, WARP, or BEE2. GNU-radio is the simplest
testbed and is free, but it has low bandwidth and poor performance. WARP and BEE2
are more advanced testbeds. They offer good performance and are easy to update, but
they are more complex and expensive. These three testbeds will be described, compared,
and their advantages and disadvantages will be observed in this thesis.
2
Acknowledgement
This master’s thesis is the most challenging project I have done during my studies at
the University of Gavle.
I would like to thank my supervisor Mr. Niclas Björsell, who has provided me with
comprehensive theoretical resources and the structure upon which my conceptual
framework. Without his efforts and support this thesis could never have been
accomplished.
I would like to thank to my beloved parents from the bottom of my heart. Without
their unconditional love and support, it would have been impossible for me to complete
this thesis work.
Xing Wu
Gavle, Sep 4, 2009
3
List of Figures
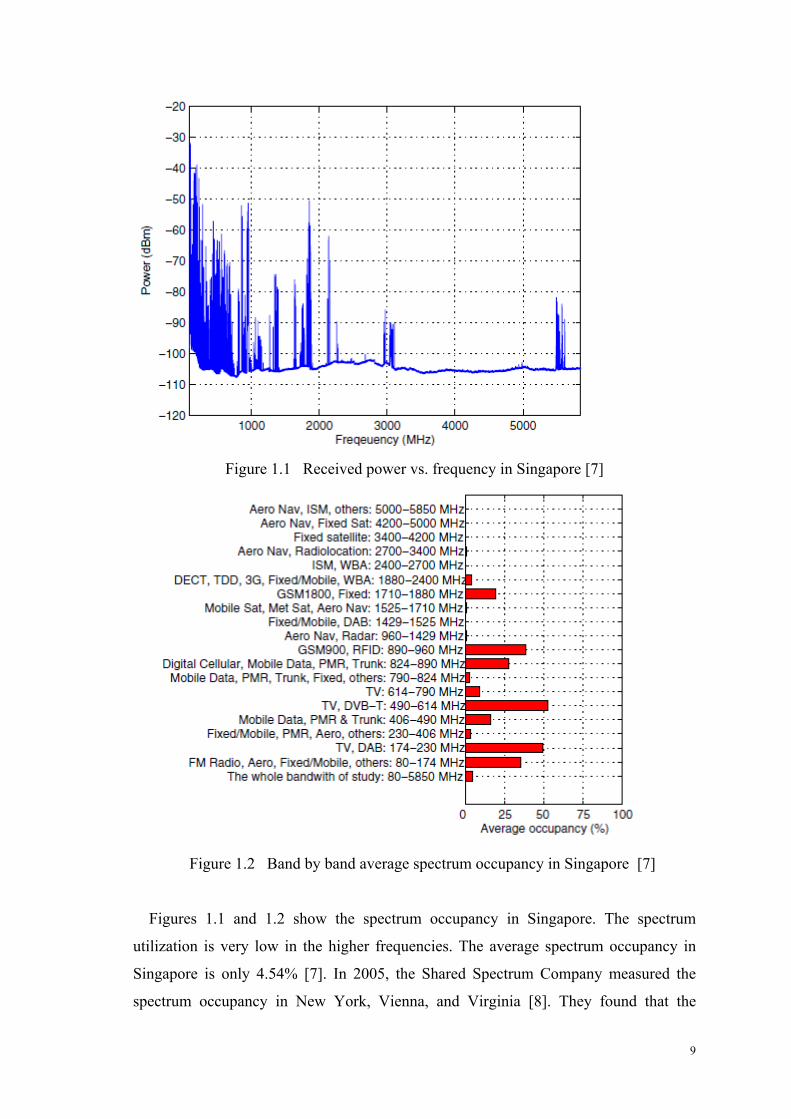
Figure 1.1 Received power vs. frequency in Singapore
Figure 1.2 Band by band average spectrum occupancy in Singapore
Figure 1.3 Measurement of 0-6 GHz spectrum utilization at Berkeley Wireless
Research Center (BWRC)
Figure 2.1 Bluetooth transmission with and without AFH. AFH prevents collusions
between WLAN and Bluetooth transmissions.
Figure 2.2 Illustration of hidden PU problem in cognitive radio system
Figure 3.1 Various aspects of spectrum sensing for cognitive radio
Figure 3.2 Implementation of energy detector
Figure 3.3 Implementation of a cyclostationary feature detector
Figure 3.4 Performance of energy detector in negative SNR regime
Figure 4.1 GNU Radio flowgraph for a simple FM Receiver
Figure 4.2 Block diagram of SDR on GNU Radio, USRP, and associated
daughterboard.
Figure 4.3 Block diagram of the USRP
Figure 4.4 Components of the platform design
Figure 4.5 WARP Design Flows
Figure 4.6 BEE2 computation module
Figure 4.7 Global communication network

4
List of Tables
Table 3.1 Comparison of energy detection, cyclostationary feature detection and
eigenvalue based detection
Table 4.1 Comparison of testbed platforms

5
Table of Contents
Abstract.............................................................................................................................1
Acknowledgement ............................................................................................................2
List of Figures...................................................................................................................3
List of Tables ....................................................................................................................4
1 Introduction ...............................................................................................................7
1.1 Background.........................................................................................................7
1.2 Motivation ........................................................................................................11
1.3 Purpose .............................................................................................................11
1.4 Delimitations ....................................................................................................12
1.5 Outline ..............................................................................................................12
2 Cognitive radio........................................................................................................13
2.1 Definitions ........................................................................................................13
2.2 History ..............................................................................................................13
2.3 Software Defined Radio ...................................................................................15
2.4 Terminology .....................................................................................................16
2.5 Main functions..................................................................................................16
2.6 Challenges in spectrum sensing........................................................................17
3 Detection for cognitive radio...................................................................................20
3.1 Introduction to detection methods ....................................................................21
3.1.1 Energy detection........................................................................................21
3.1.2 Feature detection........................................................................................23
3.1.3 Eigenvalue based detection .......................................................................26
3.2 Pros, Cons and Comparison .............................................................................28
3.2.1 Energy detection........................................................................................28
3.2.2 Feature detection........................................................................................29
3.2.3 Eigenvalue based detection .......................................................................30
4 Testbed platforms for cognitive radio .....................................................................32
4.1 Introduction to Testbeds ...................................................................................32
4.1.1 GNU Radio ................................................................................................32
6
4.1.2 WARP........................................................................................................35
4.1.3 BEE2..........................................................................................................37
4.2 Pros, Cons and comparison ..............................................................................39
5 Conclusion...............................................................................................................41
References ......................................................................................................................42

7
1 Introduction
1.1 Background
In the 1920s, most people thought that new transmitters would interfere with other
users of the radio spectrum. In those days every wireless system got its own license to
avoid interference. Now it is difficult for new wireless technologies to operate their
own radio spectra since commercial operators and governments already occupy most of
the available radio frequencies. Former U.S. Federal Communications Commission
(FCC) chair William Kennard referred to a “spectrum drought:” from satellite
broadcasting to wireless local-area networks, every new commercial service must fight
for licenses with large numbers of existing users. Sometimes the development of new
market players, new services, and new technologies is delayed by this competition. For
example, cellular phone service demonstrated in the lab in 1949 but not put into reality
until the 1980s, mainly due to the delay in licensing [1].
With the appearance of more and more new wireless system, the demand for a finite
supply of spectrum is increasing The scarcity of electromagnetic spectrum is becoming
more and more obvious. The FCC’s released strategic plan indicates that its general
spectrum management goal is to “encourage the highest and best use of spectrum
domestically and internationally to encourage the growth and rapid deployment of
innovative and efficient communications technologies and services” [2]. To address
the scarcity of spectrum, the FCC published a report prepared by Spectrum Policy Task
Force [3]. This report indicates that some bands are crowded while other bands have
fewer users, and also introduces different steps to improve spectrum efficiency for
different situations. The actual scarcity in spectrum utilization is due to the legacy
regulation imposed by the FCC.
In Europe, the European parliament and the council of the European Union establish
the regulatory framework [4] and Radio Spectrum Decisions [5]. These reports require
the spectrum policy in the European Union to consider many factors, such as economic,
political, cultural, health and social considerations, not only technical parameters, and
should supply sufficient flexibility to support developing markets and innovative
8
technologies. The reports also indicate that it is important that the radio spectrum be
allocated and managed as efficiently as possible.
In Sweden, the National Post and Telecom Agency (PTS) Spectrum Policy [6]
indicates that under the traditional management policy the radio spectrum cannot be
used efficiently and large parts of the radio spectrum often remain unused. The long
term aim of PTS is “to ensure the efficient use of the spectrum resource and to promote
a competitive range of radio-based services in the interests of the consumers and other
end-users.” [6]. PTS employs different policies to achieve an efficient allocation of the
radio spectrum. For example, on February 1, 2008, PTS turned off the analog television
broadcasting and made the transition to digital television broadcasting. As a result, the
800 MHz band is available for new wireless service. On January 1, 2010, PTS will start
to use a new model for spectrum charges. From that time, PTS will distinguish between
different spectrum license holders and impose different charges. Higher charges will be
imposed on license holders who hold large proportions of the spectrum without rollout.
Lower charges are imposed to holders who are small holding of spectrum and with a
high degree of rollout. The license holders will have to pay more for low frequency
bands. This model will lead to more efficient spectrum utilization and less
administrative burden.
In fact, if we scan the radio spectrum, we find the following three situations:
1) Some frequency bands in the spectrum are crowded.
2) Some other frequency bands are only partially used.
3) The remaining frequency bands are less used most of the time.
9
Figure 1.1 Received power vs. frequency in Singapore [7]
Figure 1.2 Band by band average spectrum occupancy in Singapore [7]
Figures 1.1 and 1.2 show the spectrum occupancy in Singapore. The spectrum
utilization is very low in the higher frequencies. The average spectrum occupancy in
Singapore is only 4.54% [7]. In 2005, the Shared Spectrum Company measured the
spectrum occupancy in New York, Vienna, and Virginia [8]. They found that the
10
average spectrum occupancy was only 5.2%. The spectral occupancy measurements in
Auckland, New Zealand indicates the actual spectral occupancy is only about 6.2%
over the frequency range between 806 MHz and 2750 MHz [9].
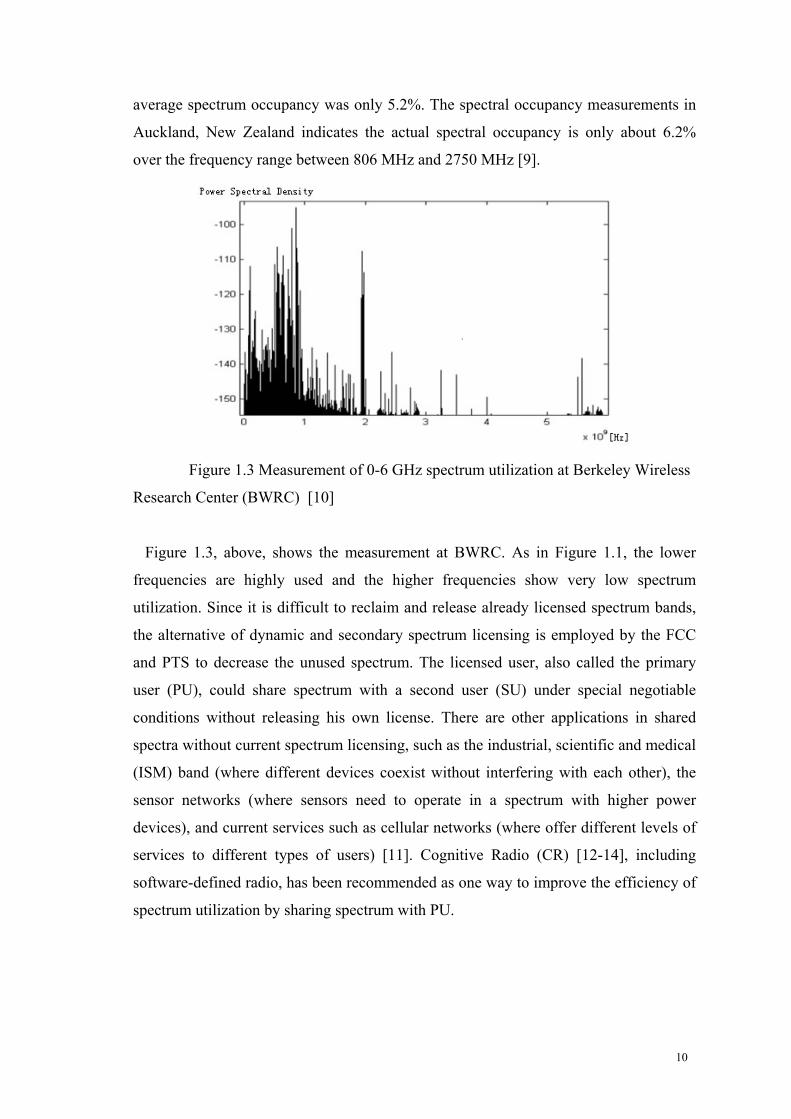
Figure 1.3 Measurement of 0-6 GHz spectrum utilization at Berkeley Wireless
Research Center (BWRC) [10]
Figure 1.3, above, shows the measurement at BWRC. As in Figure 1.1, the lower
frequencies are highly used and the higher frequencies show very low spectrum
utilization. Since it is difficult to reclaim and release already licensed spectrum bands,
the alternative of dynamic and secondary spectrum licensing is employed by the FCC
and PTS to decrease the unused spectrum. The licensed user, also called the primary
user (PU), could share spectrum with a second user (SU) under special negotiable
conditions without releasing his own license. There are other applications in shared
spectra without current spectrum licensing, such as the industrial, scientific and medical
(ISM) band (where different devices coexist without interfering with each other), the
sensor networks (where sensors need to operate in a spectrum with higher power
devices), and current services such as cellular networks (where offer different levels of
services to different types of users) [11]. Cognitive Radio (CR) [12-14], including
software-defined radio, has been recommended as one way to improve the efficiency of
spectrum utilization by sharing spectrum with PU.
11
1.2 Motivation
Cognitive Radio, one of today’s most significant emerging technologies, is a kind of
radio that can automatically make decisions about its own behaviors and operations
according to its environment. For example, CR can find and employ unused spectrum
without interfering with existing radio users. It has a low priority of spectrum allocation
and must avoid interfering PU in its vicinity. On the other hand, the PU would not
require any changes in their infrastructure in order to share spectrum with cognitive
networks, as cognitive radio should be able to detect the presence of the PU
independently during its operation. The detection ability is the key function of CR
networks. Networks with good detection ability can detect PU very quickly and
accurately and are able to avoid interference with PU.
Most research work currently focuses on spectrum sensing in CR, particularly in the
TV bands. Designing high quality spectrum sensing devices and algorithms for
exchanging spectrum sensing data between nodes is the essential problem in spectrum
sensing CR [15]. Several sensing algorithms have been proposed, including energy
detection, feature detection, and eigenvalue-based detection, which will be described
and compared in the next chapter.
In the real world, the theoretical detection algorithms are not enough. A hardware
test platform is required to test and check the performance of the CR networks. In the
past, engineers had to spend a lot of time to design a platform to test the radio network,
but now there are testbed platforms that can be used to test and evaluate the
performance of the radio network. The engineer can use the available testbed platform
to estimate the radio network and save significant time and research work. Later in this
thesis, the different testbed platforms will be introduced and compared.
1.3 Purpose
In cognitive radio, it is important to avoid interference with PU and guarantee the
performance quality of the PU. Spectrum sensing plays a main role in CR. There are
different spectrum sensing methods to sense PU and different testbeds to measure the
performance of the radio network. In this thesis, different detection methods and
12
different testbeds will be introduced and compared based on previously published
papers from journals and conferences within the field of cognitive radio.
1.4 Delimitations
There is a vast literature on cognitive radio. Most of the studies focus on spectrum
sensing and management, which are fundamental components of cognitive radio. In this
thesis, I only focus on detection methods and testbed platforms in CR. Many methods
of detection have been proposed, such as matched filtering, energy detectors, feature
detectors, eigenvalue-based detectors, radio identification based sensing, waveform
based sensing, multi-dimensional spectrum sensing, cooperative sensing, and so on.
There are also many testbed platforms for CR, such as GNU Radio, Click, SCA, BEE2,
CTVR, WARP and so on. Due to limitations of time and space, only the most
commonly used detection algorithms and most frequently used testbed platforms will
be introduced.
1.5 Outline
This master’s thesis consists of five chapters, beginning with an overview of the
research background and an outline briefly presenting the contents of the study. The
following chapters present the comprehensive analysis as follows: Chapter 2 begins
with an extensive introduction to cognitive radio. Chapters 3 and 4 introduce and
compare three signal detection methods and three software defined radio (SDR)
platforms, respectively. Finally, Chapter 5 presents the conclusions of this study.
13
2 Cognitive radio
2.1 Definitions
As Joseph Mitola wrote in his dissertation, “the term cognitive radio identifies the
point at which wireless personal digital assistants (PDAs) and the related networks are
sufficiently computationally intelligent about radio resources and related computer-to-
computer communications to detect user communications needs as a function of use
context, and to provide radio resources and wireless services most appropriate to those
needs. ” [14]. Just imagine that your assistant can help you to find everything you want.
They will help you find people, things, and opportunities. Similarly, smart radio
functions like an assistant. It could detect the spectrum and choose a frequency to avoid
interference with the PU, and could communicate with the network in its preferred
protocols. So it will be smart enough to help users and the network avoid spectral
congestion.
Cognitive radio [16] is
1) A type of radio in which communication systems are aware of their environment
and internal state and can make decisions about their radio operating behavior
based on that information and predefined objectives. The environmental
information may or may not include location information related to
communication systems.
2) Cognitive radio that used software-defined radio, adaptive radio, and other
technologies to adjust automatically its behavior or operations to achieve
desired objectives.
2.2 History
In August 1999, Mitola Ш and Maguire first officially introduced the cognitive radio
paradigm [13], which has a built-in programmable and optimized new wireless system.
Later, Mitola described this innovative approach in wireless systems as follows:
“The term cognitive radio identifies the point at which wireless personal digital
assistants (PDAs) and the related networks are sufficiently computationally intelligent
about radio resources and related computer-to-computer communications to detect
14
user communications needs as a function of use context, and to provide radio resources
and wireless services most appropriate to those needs.” [14]. After that time,
regulatory departments in various countries (including the FCC in the United States,
Ofcom in the United Kingdom, and PTS in Sweden ) found that most of the radio
frequency spectrum was inefficiently used [1, 3, 6, 10]. In December 2003, the FCC
proposed regulation that would consider cognitive radio to implement opportunistic
spectrum sharing [17]. Recently the cognitive feature has been included in some
wireless standards. The first is IEEE 802.11k, which is an update of the IEEE 802.11
standard for radio resource management. IEEE 802.11k can supply sensing (or
measurement) information. The sensing information includes channel load report, noise
histogram report and station statistic report and is also used to increase the efficiency of
the traffic distribution within a network. Usually, wireless local area network (WLAN)
devices prefer to connect to the access point (AP) that supplies strongest signal.
Sometimes, this arrangement strategy causes one AP to be overloaded and others to be
underutilized. In 802.11k, if the AP with the strongest signal level is overloading its full
capacity, the wireless device will connect to another AP that is underutilized. Despite of
the weaker signal that the wireless device receives, the overall network is more
efficiently utilized. A second example is Bluetooth. Adaptive Frequency Hopping
(AFH) is included in the Bluetooth standard to avoid interference with other wireless
technologies in the 2.4 GHz unlicensed radio spectrum [18]. Thus, IEEE 802.11b/g
devices, cordless telephones, microwave ovens and Bluetooth can use the same 2.4
GHz wireless frequencies.
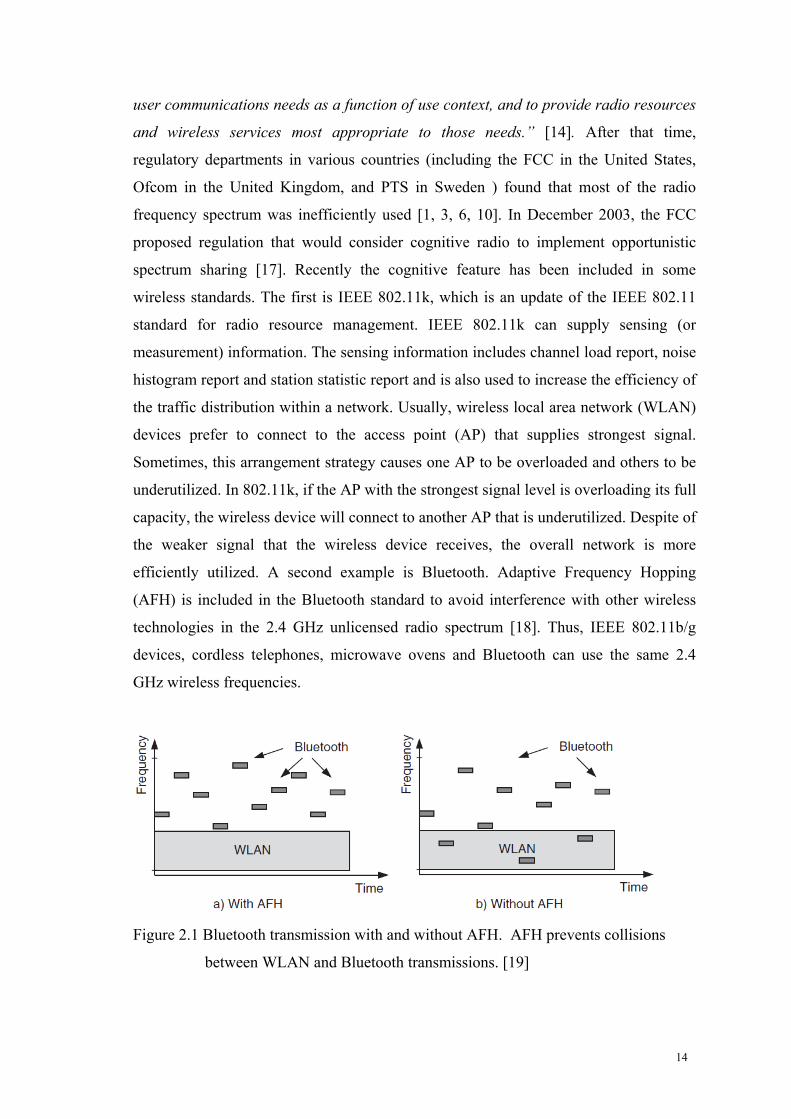
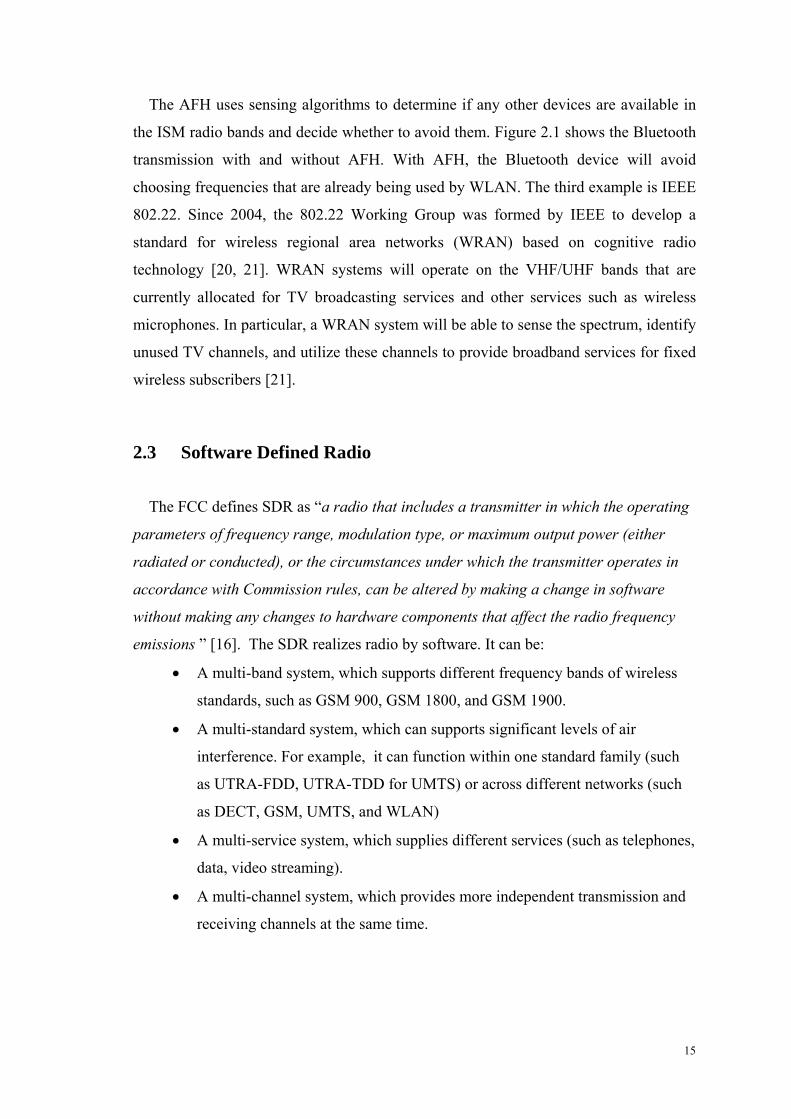
Figure 2.1 Bluetooth transmission with and without AFH. AFH prevents collisions
between WLAN and Bluetooth transmissions. [19]
15
The AFH uses sensing algorithms to determine if any other devices are available in
the ISM radio bands and decide whether to avoid them. Figure 2.1 shows the Bluetooth
transmission with and without AFH. With AFH, the Bluetooth device will avoid
choosing frequencies that are already being used by WLAN. The third example is IEEE
802.22. Since 2004, the 802.22 Working Group was formed by IEEE to develop a
standard for wireless regional area networks (WRAN) based on cognitive radio
technology [20, 21]. WRAN systems will operate on the VHF/UHF bands that are
currently allocated for TV broadcasting services and other services such as wireless
microphones. In particular, a WRAN system will be able to sense the spectrum, identify
unused TV channels, and utilize these channels to provide broadband services for fixed
wireless subscribers [21].
2.3 Software Defined Radio
The FCC defines SDR as “a radio that includes a transmitter in which the operating
parameters of frequency range, modulation type, or maximum output power (either
radiated or conducted), or the circumstances under which the transmitter operates in
accordance with Commission rules, can be altered by making a change in software
without making any changes to hardware components that affect the radio frequency
emissions ” [16]. The SDR realizes radio by software. It can be:
• A multi-band system, which supports different frequency bands of wireless
standards, such as GSM 900, GSM 1800, and GSM 1900.
• A multi-standard system, which can supports significant levels of air
interference. For example, it can function within one standard family (such
as UTRA-FDD, UTRA-TDD for UMTS) or across different networks (such
as DECT, GSM, UMTS, and WLAN)
• A multi-service system, which supplies different services (such as telephones,
data, video streaming).
• A multi-channel system, which provides more independent transmission and
receiving channels at the same time.

16
2.4 Terminology
Cognitive radio can be classified into two main types. The first type is full cognitive
radio ("Mitola radio"), in which every parameter in the wireless network is under
consideration [13]. The second type is spectrum sensing cognitive radio, in which we
only consider the radio frequency spectrum [12].
We can also differentiate types of Cognitive Radio in terms of the parts of the
spectrum available.
• Licensed Band Cognitive Radio is cognitive radio used in the bands that are
used and sold by license. That IEEE 802.22 working group is developing a
standard for a wireless regional area network (WRAN) that will work in unused
television channels [22, 23].
• Unlicensed Band Cognitive Radio can only utilize unlicensed parts of the
radio frequency spectrum. There is one system in the IEEE 802.15 Coexistence
Task Group 2 (TG2), which focuses on the coexistence of WLAN and
Bluetooth [24].
2.5 Main functions
The main functions of cognitive radios are as follows:
• Spectrum Sensing: action of a radio measuring signal features [16]. Detecting
the unused spectrum and sharing it while avoiding the spectrum that is occupied
by PU. There are three categories of detection methods in the spectrum sensing
techniques:
o Transmitter detection: detecting the signal from the primary transmitter.
Several approaches have been proposed, such as Matched filter detection,
Energy detection, Cyclostationary feature detection, and Eigenvalue
based detection.
17
o Cooperative detection: refers to combining information from different
cognitive radios for more accurate spectrum sensing. Multiple cognitive
radios cooperate together in performing the spectrum sensing task.
o Interference based detection: under the assumption that if a signal A can
interfere with signal B, then signal B is within the communication range
of signal A. An signal can be detected by checking the interference with
the detector’s signal.
• Spectrum Management: the process of developing and executing policies,
regulations, procedures, and techniques used to allocate, assign, and authorize
frequencies in the radio spectrum to specific services and users [16].
• Spectrum Sharing: a method for multiple users in the same region of spectrum
to coexist [16].
2.6 Challenges in spectrum sensing
A. The problem of Hidden PU
Channel shadowing and multipath fading would normally be expected to interfere
with the signals between the target under detection and the CR. It is difficult to
differentiate between a spectrum hole and a weak signal reduced by a bad channel.
Multipath fading or shadowing would result in a hidden PU problem when the SU is
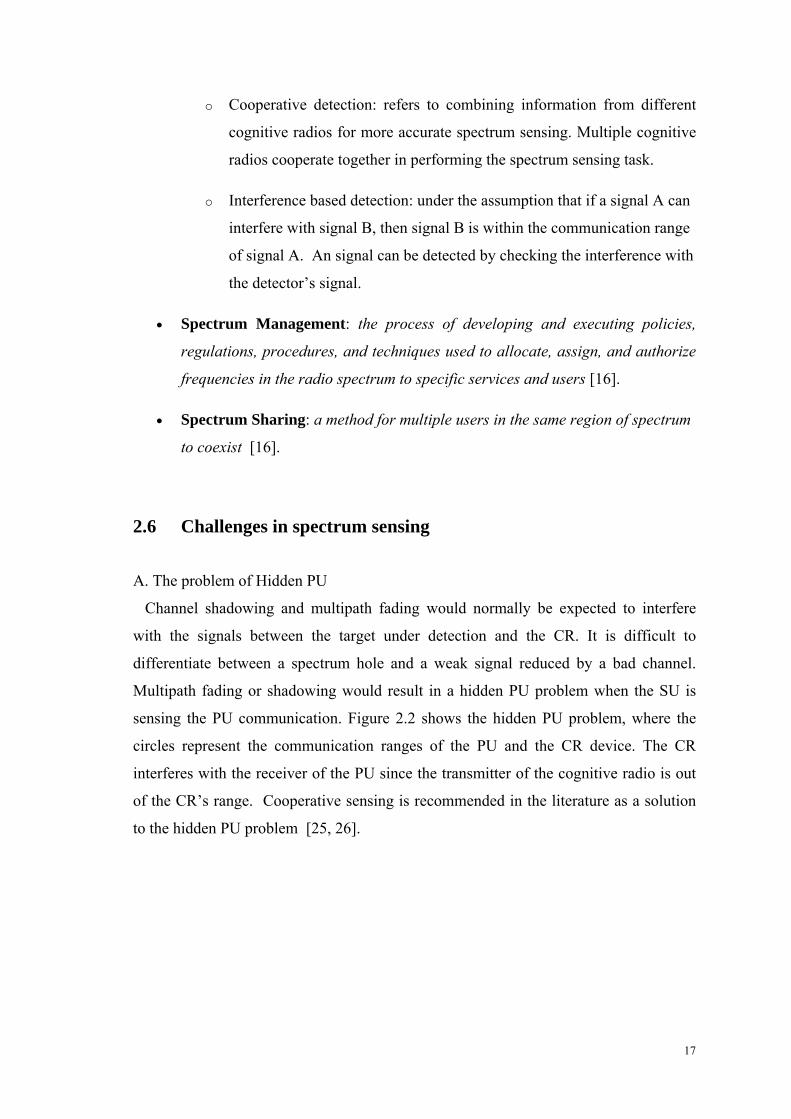
sensing the PU communication. Figure 2.2 shows the hidden PU problem, where the
circles represent the communication ranges of the PU and the CR device. The CR
interferes with the receiver of the PU since the transmitter of the cognitive radio is out
of the CR’s range. Cooperative sensing is recommended in the literature as a solution
to the hidden PU problem [25, 26].

18
Figure 2.2 Illustration of the hidden PU problem in cognitive radio system [27]
B. Spread Spectrum PU
It is difficult to sense a PU that uses spread spectrum signaling because the power of
the PU has a wider frequency but the actual information bandwidth is much narrower.
This problem can be partially alleviated if the hopping pattern is known and perfect
synchronization to the signal can be achieved [19].
C. Sensing Time
The cognitive radio must detect the PU as soon as possible when the PU appears and
vacate the band for the PU immediately to avoid interference with PU. Hence, the
sensing method should be able to recognize the PU within a definite time. This
requirement poses a challenge for different detection methods of cognitive radio.
D. Cooperation in multi-user environment
The CR network usually consists of multiple SU and PU. As a result, interference
between SU can occur and makes the detection of CR more unreliable. Hence,
cooperation is necessary in a multi-user environment. To ensure adequate performance,
the delays should be very short and the signaling must be kept low. Otherwise it is
difficult for CR transmission to find the available resources in a reasonable time.
E. Other Challenges
19
When designing a spectrum sensing algorithm, some other challenges must also be
considered, such as implementation complexity, cooperation, wideband sensing,
interference measurement, and power consumption.

20
3 Detection for cognitive radio
In licensed band Cognitive Radio, the PU is the licensed user and has higher priority.
On the other hand, the SU has lower priority and must avoid interfering with the PU
using its spectrum sensing ability. Therefore, the SU should have cognitive radio
abilities, such as sensing spectrum holes and changing its parameters to use the unused
spectrum.
Spectrum Sensing Factors
Cooperative sensing
Transmitter sensing
SNR
Fading and multipath
Noise uncertainty
Sensing time
Energy Detecion
Cyclastationary feature detection
Eigenvalue detection
Figure 3.1 Various aspects of spectrum sensing for cognitive radio
Various aspects of the spectrum sensing task are illustrated in Figure 3.1. The goal
of this section is to show the factors involved in transmitter sensing in spectrum sensing.
Spectrum sensing, the focus of this chapter, is the fundamental component of cognitive
radio. There are several factors that make the sensing difficult [21].
First, the signal-noise-ratio (SNR) may be very low. For instance, in the TV band, if
a wireless microphone with a 50mW transmitted power signal in the 200 kHz
bandwidth is several hundred meters away from the sensor, the received SNR might be
below -20dB.
Second, fading and multipath in wireless signals make the detection more difficult.
Fading causes the signal power to fluctuate, while unknown multipaths make coherent
detection methods unreliable.
Third, the noise level is unstable (noise uncertainty). There are two types of noise
uncertainty: receiver device noise uncertainty and environment noise uncertainty. Since
there are noise uncertainties, it is difficult to detect the noise power accurately.

21
Last, the sensing time should be low. While a cognitive user stays in one spectrum
hole, it should be able to vacate the spectrum in a very short time (in order to avoid
interference with the PU).
There is another important detection method in spectrum sensing, which is
cooperative sensing. In fading channels, single radio spectrum sensing will be
introduced to the worst case channel conditions by multipath, shadowing and local
interference. Under these conditions, the detection will not be available. In this case, if
multiple radios share their individual sensing measurements, the worst case condition
could be avoided and reliable sensing could be available in the whole. Cooperative
sensing has been suggested to improve the performance of the spectrum sensing,
decrease the probabilities of mis-detection and avoid the hidden PU problem. However,
cooperation requires a control system and increases the complexity of the system. Due
to limitations of time and space, this thesis only focuses on single spectrum sensing. In
the next chapter, the various detection methods will be introduced.
3.1 Introduction to detection methods
3.1.1 Energy detection
Energy detection is a basic and common approach to spectrum sensing since it has
low computational and execution complexities [28, 29]. An energy detector sets a
threshold according to the noise floor and compares it with the output of energy
detector to detect the signal. Energy detection only requires minimal information about
the signal, such as the signal bandwidth and carrier frequency.
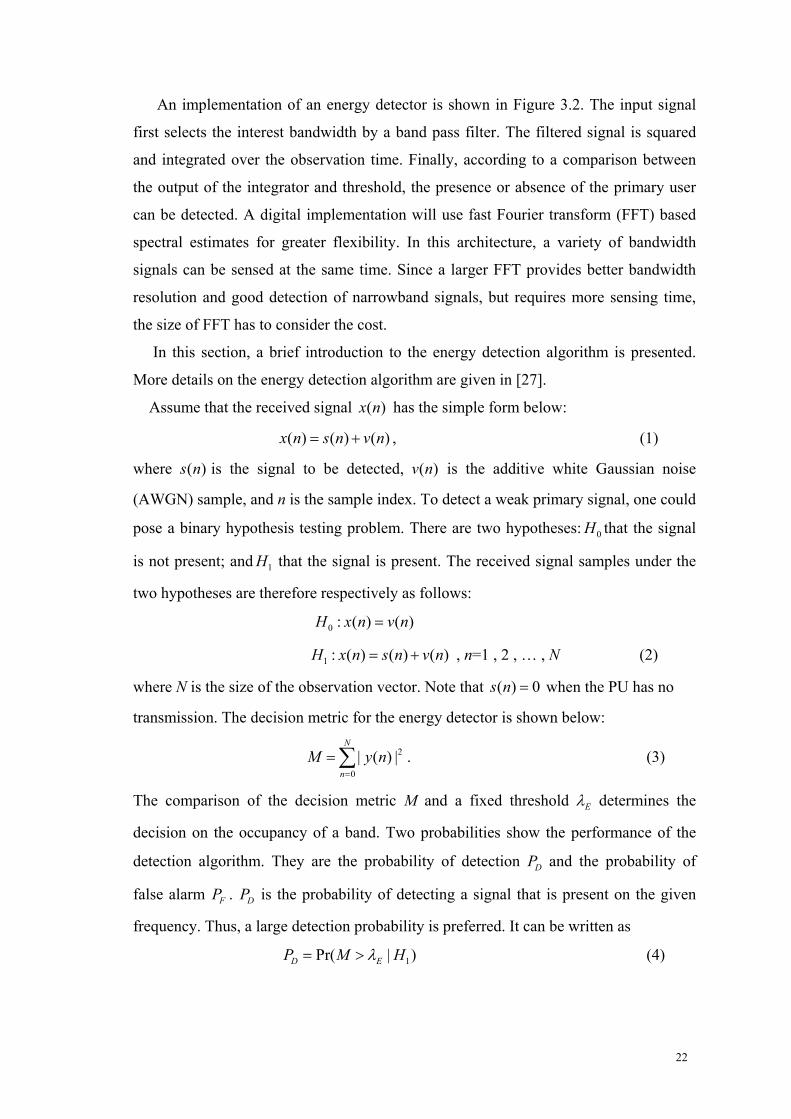
Figure 3.2 Implementation of energy detector [30]
22
An implementation of an energy detector is shown in Figure 3.2. The input signal
first selects the interest bandwidth by a band pass filter. The filtered signal is squared
and integrated over the observation time. Finally, according to a comparison between
the output of the integrator and threshold, the presence or absence of the primary user
can be detected. A digital implementation will use fast Fourier transform (FFT) based
spectral estimates for greater flexibility. In this architecture, a variety of bandwidth
signals can be sensed at the same time. Since a larger FFT provides better bandwidth
resolution and good detection of narrowband signals, but requires more sensing time,
the size of FFT has to consider the cost.
In this section, a brief introduction to the energy detection algorithm is presented.
More details on the energy detection algorithm are given in [27].
Assume that the received signal ( )x n has the simple form below:
( ) ( ) ( )x n s n v n= + , (1)
where ( )s n is the signal to be detected, ( )v n is the additive white Gaussian noise
(AWGN) sample, and n is the sample index. To detect a weak primary signal, one could
pose a binary hypothesis testing problem. There are two hypotheses: 0H that the signal
is not present; and 1H that the signal is present. The received signal samples under the
two hypotheses are therefore respectively as follows:
0 : ( ) ( )H x n v n=
1 : ( ) ( ) ( )H x n s n v n= + , n=1 , 2 , … , N (2)
where N is the size of the observation vector. Note that ( ) 0s n = when the PU has no
transmission. The decision metric for the energy detector is shown below:
2
0| ( ) |
N
nM y n
=
= ∑ . (3)
The comparison of the decision metric M and a fixed threshold Eλ determines the
decision on the occupancy of a band. Two probabilities show the performance of the
detection algorithm. They are the probability of detection DP and the probability of
false alarm FP . DP is the probability of detecting a signal that is present on the given
frequency. Thus, a large detection probability is preferred. It can be written as
1Pr( | )D EP M Hλ= > (4)

23
FP is the probability of a false alarm, in which the test reports a detection when the
signal is in fact not present, and it can be written as
0Pr( | )F EP M Hλ= > (5)
FP should be kept as small as possible to avoid underutilization of transmission
opportunities. The decision threshold Eλ can be selected to find an optimal balance
between DP and FP .
The white noise can be modeled as a zero-mean Gaussian random variable with
variance 2vσ , i.e., 2( ) (0, )vv n N σ= . To simplify the analysis, let us model the signal
term as a zero-mean Gaussian variable as well, i.e., 2( ) (0, )ss n N σ= . The model for
( )s n is more complex, as fading should also be considered. Because of these
assumptions, the decision metric (3) follows a chi-squared distribution with 2N degrees
of freedom 22Nχ , and hence, it can be modeled as
222 0
2 222 1
2
2
vN
v sN
HM
H
σ χ
σ σ χ
⎧⎪⎪= ⎨
+⎪⎪⎩
(6)
3.1.2 Feature detection
Cyclostationary feature detection is a method that uses cyclostationary features to
detect the signal. Most signals have statistical properties that vary periodically with
time, which are called cyclostationary features. Hence, more accurate detection can be
achieved by exploiting the inherent periodicity of the signals. The cyclostationary
feature detection method can detect modulated signals by analyzing their features, such
as sine wave carrier, symbol rate, and modulation type. The main advantage of
cyclostationary feature detection is the differentiation between modulated signals,
interference and noise [28, 31, 32]. The reason is that noise is wide-sense stationary
(WSS) with no correlation, while modulated signals are cyclostationary with spectral
correlations due to the embedded redundancy of signal periodicities.

24
A block diagram of a cyclostationary feature detector is showed in Figure 3.3. The
parameter α is the cycle frequency, which means the frequency separation of the
correlated spectral components.
Feature detect
Average over T
Multiply X(f+α/2)X(f-α/2) FFTFilter and
ADC
Figure 3.3 Implementation of a cyclostationary feature detector [30]
There is one example of the use of feature detection. In [33] a feature detection
method is recommended to monitor continuously for the signal of the PU in a cognitive
radio system. A Global System for Mobile Communications (GSM) network is the PU,
and an orthogonal frequency division multiplexing (OFDM) based WLAN is the SU.
Since the cyclic features of the GSM and the WLAN signals differ sufficiently from
each other, the channel can be continuously monitored.
A brief review of feature detection is presented below; more information on the
feature detection algorithm is available in [25].
The modulated signal ( )s n can be characterized as a wide-sense second-order
cyclostationary process since both its mean and autocorrelation exhibit periodicity.
Specifically, let
[ ( )]su s n= Ε (7)
and
*1 2 1 2( , ) [ ( ) ( )]sR n n s n s n= Ε (8)
Then, for all n , 1n , and 2n ,
0( ) ( )s su n u n T= + (9)
and WSS,
1 2 1 0 2 0( , ) ( , )s sR n n R n T n T= + + , (10)
where 0T >0 is a fundamental period. The cyclic autocorrelation function of a wide-
sense second-order cyclostationary process with cyclic frequency 0α ≠ is defined as
* 2( ) [ ( ) ( ) ]nsR m E s n s n m eα πα−= + , (11)
which has the following property [11]:
0/( )
0s
finite if i TR m
otherwiseα α =⎧
= ⎨⎩
(12)
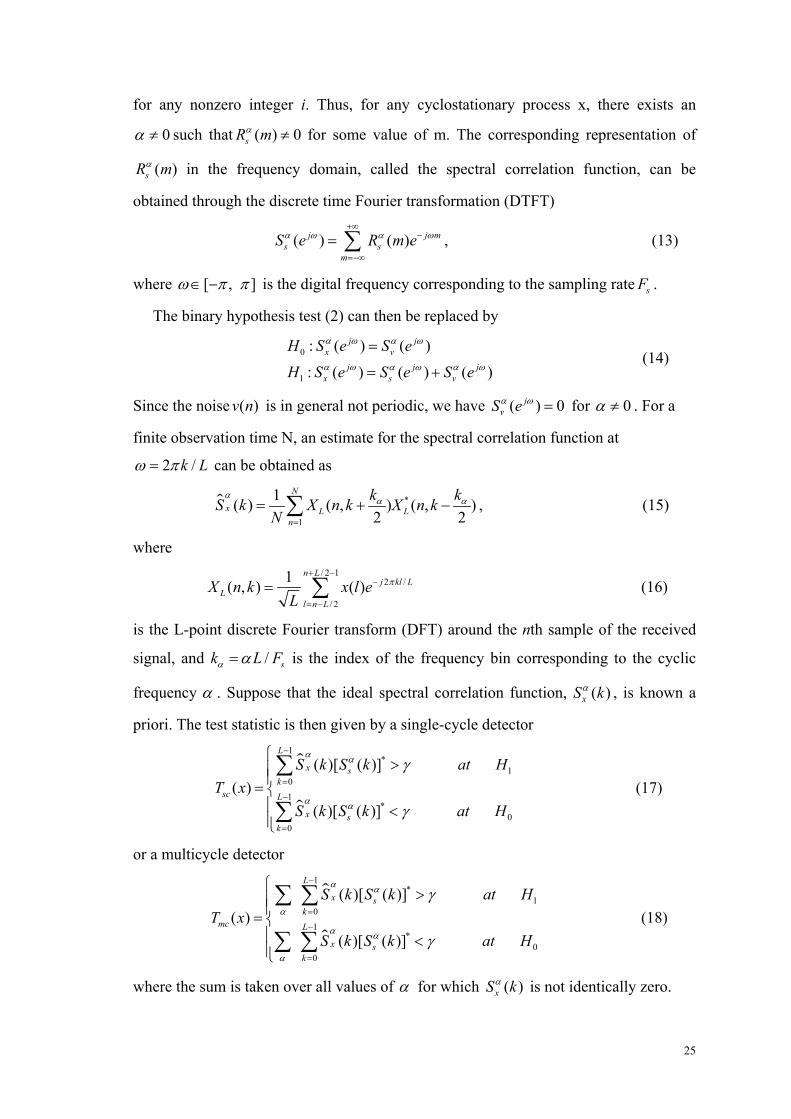
25
for any nonzero integer i. Thus, for any cyclostationary process x, there exists an
0α ≠ such that ( ) 0sR mα ≠ for some value of m. The corresponding representation of
( )sR mα in the frequency domain, called the spectral correlation function, can be
obtained through the discrete time Fourier transformation (DTFT)
( ) ( )j j ms s
mS e R m eα ω α ω
+∞−
=−∞
= ∑ , (13)
where [ , ]ω π π∈ − is the digital frequency corresponding to the sampling rate sF .
The binary hypothesis test (2) can then be replaced by
0
1
: ( ) ( )
: ( ) ( ) ( )
j jx v
j j jx s v
H S e S e
H S e S e S e
α ω α ω
α ω α ω α ω
=
= + (14)
Since the noise ( )v n is in general not periodic, we have ( ) 0jvS eα ω = for 0α ≠ . For a
finite observation time N, an estimate for the spectral correlation function at
2 /k Lω π= can be obtained as
*
1
1( ) ( , ) ( , )2 2
N
x L Ln
k kS k X n k X n kN
αα α
=
= + −∑ , (15)
where
/ 2 1
2 /
/ 2
1( , ) ( )n L
j kl LL
l n LX n k x l e
Lπ
+ −−
= −
= ∑ (16)
is the L-point discrete Fourier transform (DFT) around the nth sample of the received
signal, and / sk L Fα α= is the index of the frequency bin corresponding to the cyclic
frequency α . Suppose that the ideal spectral correlation function, ( )xS kα , is known a
priori. The test statistic is then given by a single-cycle detector
1*
10
1*
00
( )[ ( )]( )
( )[ ( )]
L
x sk
sc L
x sk
S k S k at HT x
S k S k at H
α α
α α
γ
γ
−
=
−
=
⎧>⎪⎪= ⎨
⎪ <⎪⎩
∑
∑ (17)
or a multicycle detector
1*
10
1*
00
( )[ ( )]( )
( )[ ( )]
L
x sk
mc L
x sk
S k S k at HT x
S k S k at H
α α
α
α α
α
γ
γ
−
=
−
=
⎧ >⎪⎪= ⎨⎪ <⎪⎩
∑ ∑
∑ ∑ (18)
where the sum is taken over all values of α for which ( )xS kα is not identically zero.

26
3.1.3 Eigenvalue based detection
The eigenvalue based detection is a method based on the eigenvalues of the
covariance matrix of the received signal [34]. The eigenvalue based detection method
detects the existence of the signal by checking the ratio of the maximum eigenvalue to
the minimum eigenvalue. The threshold and the probability of false alarm can be found
with the ratio and the latest random matrix theories [35].
The eigenvalue based detection algorithm is briefly described below; more details are
given in [34].
The binary hypothesis test (2) can be replaced by
0 : ( ) ( )i iH x n v n=
11 0
: ( ) ( ) ( ) ( )ijNP
i ij j ij k
H x n h k s n k v n= =
= − +∑∑ , n=1 , 2 , … , (19)
where ( )js n (j=1 , 2 , … , P) are P ≥ 1 source signals, ( )ijh k is the channel response
from source signal j to receiver i , ijN is the order of channel ( )ijh k , and ( )iv n are the
noise samples. Given the channel responses and noise power, a sensing algorithm
should be able to make a decision on the existence of the signals because the received
signals contain little or no information on the source signals.
Defining max( )j ijiN N= , zero-padding ( )ijh k if necessary, and defining
1 2( ) [ ( ), ( ),..., ( )] ,TMn x n x n x n=x (20)
1 2( ) [ ( ), ( ),..., ( )] ,Tj j j Mjn h n h n h n=h (21)
1 2( ) [ ( ), ( ),..., ( )] ,TMn v n v n v n=v (22)
where M is the number of receivers, Equation (19) can be expressed in vector form as
1 0
( ) ( ) ( ) ( )jNP
j jj k
n k s n k n= =
= − +∑∑x h v , n = 0 , 1, … , (23)
Considering a subsample L of consecutive outputs and defining
( ) [ ( ), ( 1),..., ( 1)] ,T T T Tx n n n n L= − − +x x x (24)
( ) [ ( ), ( 1), ( 1)] ,T T T Tv n n n n L= − − +v v v (25)
1 1 1[ ( ),..., ( 1),..., ( ),..., ( 1)] ,TP P Ps s n s n N L s n s n N L= − − + − − + (26)
we get
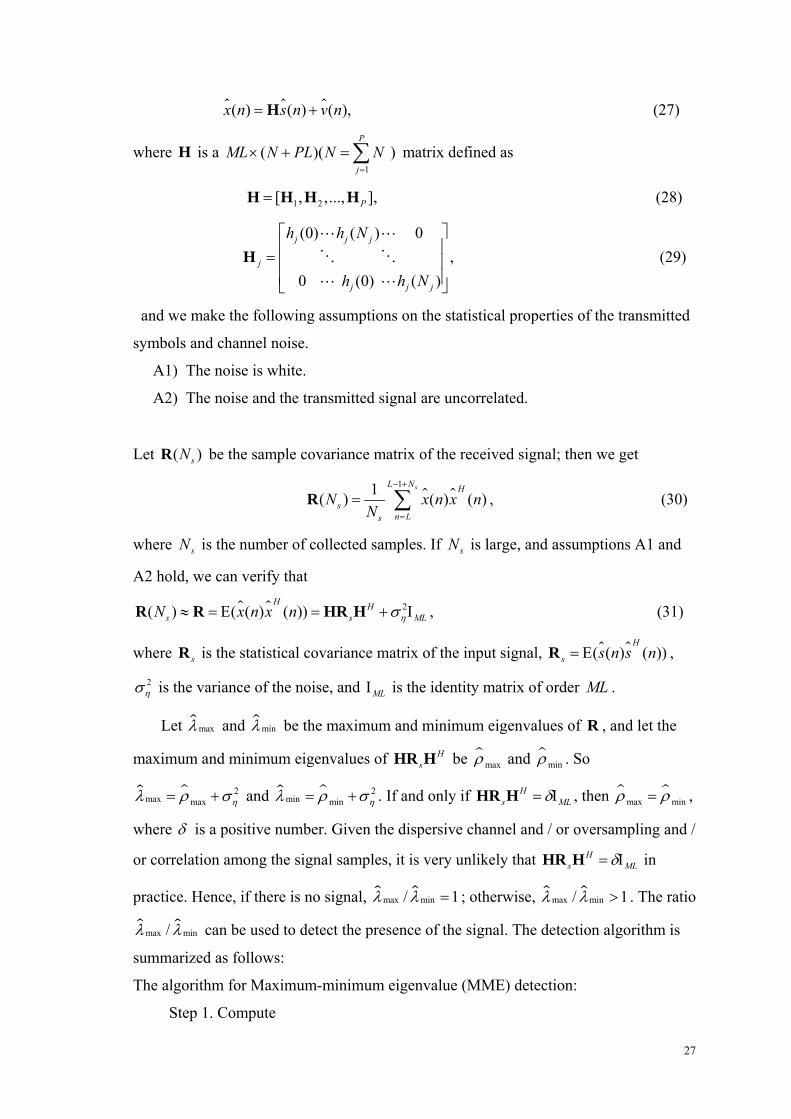
27
( ) ( ) ( ),x n s n v n= +H (27)
where H is a 1
( )( )P
jML N PL N N
=
× + =∑ matrix defined as
1 2[ , ,..., ],P=H H H H (28)
(0) ( ) 0
,0 (0) ( )
j j j
j
j j j
h h N
h h N
⎡ ⎤⎢ ⎥= ⎢ ⎥⎢ ⎥⎣ ⎦
H (29)
and we make the following assumptions on the statistical properties of the transmitted
symbols and channel noise.
A1) The noise is white.
A2) The noise and the transmitted signal are uncorrelated.
Let ( )sNR be the sample covariance matrix of the received signal; then we get
11( ) ( ) ( )
sL N H
sn Ls
N x n x nN
− +
=
= ∑R , (30)
where sN is the number of collected samples. If sN is large, and assumptions A1 and
A2 hold, we can verify that
2( ) ( ( ) ( ))H H
s s MLN x n x n ησ≈ = Ε = + ΙR R HR H , (31)
where sR is the statistical covariance matrix of the input signal, ( ( ) ( ))H
s s n s n= ΕR ,
2ησ is the variance of the noise, and MLΙ is the identity matrix of order ML .
Let maxλ and minλ be the maximum and minimum eigenvalues of R , and let the
maximum and minimum eigenvalues of HsHR H be maxρ and minρ . So
2max max ηλ ρ σ= + and 2
min min ηλ ρ σ= + . If and only if Hs MLδ= ΙHR H , then max minρ ρ= ,
where δ is a positive number. Given the dispersive channel and / or oversampling and /
or correlation among the signal samples, it is very unlikely that Hs MLδ= ΙHR H in
practice. Hence, if there is no signal, max min/ 1λ λ = ; otherwise, max min/ 1λ λ > . The ratio
max min/λ λ can be used to detect the presence of the signal. The detection algorithm is
summarized as follows:
The algorithm for Maximum-minimum eigenvalue (MME) detection:
Step 1. Compute

28
11( ) ( ) ( )
sL N H
sn Ls
N x n x nN
− +
=
= ∑R , (32)
where ( )sNR is the sample covariance matrix of the received signal and ( )H
x n is the
Hermitian transpose of ( )x n .
Step 2. Obtain the maximum and minimum eigenvalues of the matrix ( )sNR , that
is, maxλ and minλ .
Step 3. Decision: if max minλ γλ> , the signal exists (“yes” decision); otherwise,
signal does not exist (“no” decision), where 1γ > is the threshold.
3.2 Pros, Cons and Comparison
The choice of different detection methods for signal in the presence of noise is based
on what is known of the noise characteristics and of the signal [36]. Knowledge of
signal features, such as sine wave carrier, symbol rate, and modulation type can be used
in the cyclostationary feature detection. If little information is available on the signal, it
is better to use an energy detector or eigenvalue detector to detect the presence of the
signal.
3.2.1 Energy detection
Energy detection is a simple, cheap and commonly used detection method. It is
appropriate to be considered as a device for detecting an unknown signal since an
energy detector only detect the signal energy [36].
There are also some challenges with energy detector based sensing:
A. Choosing the threshold for detecting the PU; the threshold used for PU detection
is depended on the knowledge of unknown or unstable noise levels. The noise
level uncertainty generally arises from thermal noise, the nonlinearities of
components, and the inaccuracy of the noise estimator. In the channel there are
nonstationary noise and an extraneous signal [37]. Actually, because the noise
variance continually fluctuates, it is very difficult to get an accurate noise
threshold without a priori knowledge of the accurate noise level.
29
B. It is unable to differentiate between modulated signals, noise and interference,
but can only detect the presence of the signal.
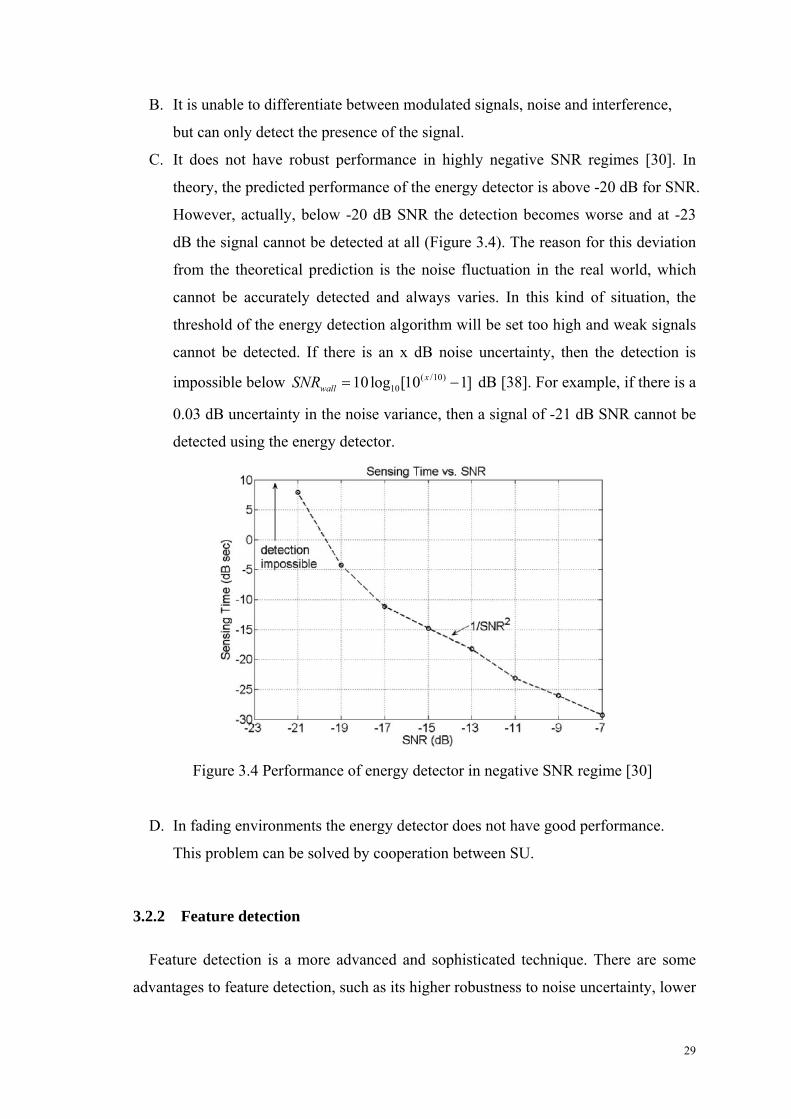
C. It does not have robust performance in highly negative SNR regimes [30]. In
theory, the predicted performance of the energy detector is above -20 dB for SNR.
However, actually, below -20 dB SNR the detection becomes worse and at -23
dB the signal cannot be detected at all (Figure 3.4). The reason for this deviation
from the theoretical prediction is the noise fluctuation in the real world, which
cannot be accurately detected and always varies. In this kind of situation, the
threshold of the energy detection algorithm will be set too high and weak signals
cannot be detected. If there is an x dB noise uncertainty, then the detection is
impossible below ( /10)1010 log [10 1]x
wallSNR = − dB [38]. For example, if there is a
0.03 dB uncertainty in the noise variance, then a signal of -21 dB SNR cannot be
detected using the energy detector.
Figure 3.4 Performance of energy detector in negative SNR regime [30]
D. In fading environments the energy detector does not have good performance.
This problem can be solved by cooperation between SU.
3.2.2 Feature detection
Feature detection is a more advanced and sophisticated technique. There are some
advantages to feature detection, such as its higher robustness to noise uncertainty, lower

30
SNR values and separation of the noise energy. It is well suited to signal detection and
modulation recognition, signal parameter estimation, and the design of communication
signals and systems [28, 31]. On the other hand, feature detection is more
computationally complex, requires significantly longer observation times and requires
partial information on the primary user.
3.2.3 Eigenvalue based detection
Eigenvalue based detection is a sophisticated method. It is more accurate than energy
detection. As introduced in [34], eigenvalue based detection uses the method of
eigenvalues of the covariance matrix and checks the ratio of the maximum eigenvalue
to the minimum eigenvalue to detect the signal existence. It can overcome the noise
uncertainty problem and also retains the advantages of the energy detection method. It
can be exploited for different signal detection applications with unknown signals,
unknown channel and unknown noise power [34]. However, this method is more
complex and more costly.
There are two methods of eigenvalue based detection. One is maximum-minimum
eigenvalue detection, which compares the ratio of the maximum eigenvalue and the
minimum eigenvalue with a given threshold. The other is energy with minimum
eigenvalue detection, which compares the ratio of the average energy and the minimum
eigenvalue with a given threshold.
As summarized in Table 3.1, several aspects of three detection methods are
compared, including the algorithm, model, gain, performance, advantages and
disadvantages.
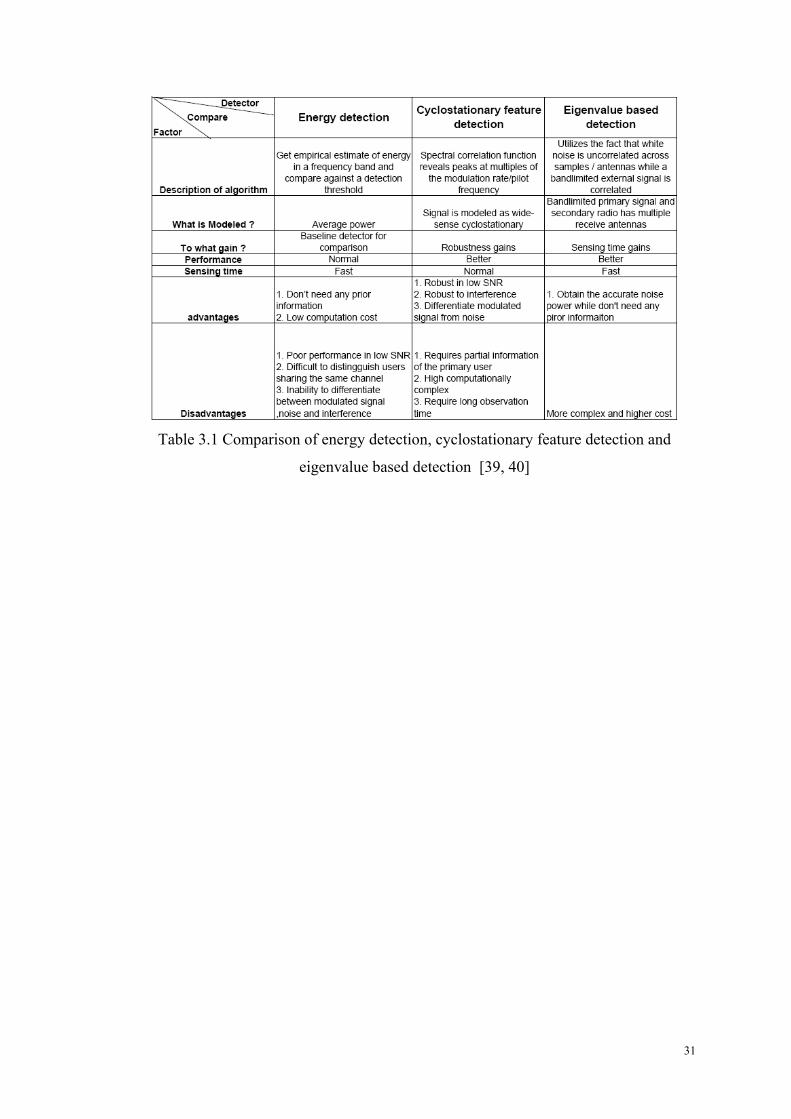
31
Table 3.1 Comparison of energy detection, cyclostationary feature detection and
eigenvalue based detection [39, 40]
32
4 Testbed platforms for cognitive radio
Cognitive radio is a technology intended for the efficient use of spectrum. The
primary concern of commercial operators is the interference with PU from cognitive
radio. On the other hand, several technologies have been proposed for spectrum sensing
and non-interference with PU. All of these technologies have only been demonstrated
in theory. Thus there is a need to find a set of test cases for experimenting with different
technologies in the real world. The testbed platform will evaluate the experimental
performance of a system at any realistic scale at real speeds. The following are some
requirements for a testbed platform:
• Ability to implement advanced wireless algorithms.
• Scalability to allocate more processing resources when a single processor is not enough.
• Extensibility to support different peripheral and interface expansion to satisfy future applications.
• Ability to support several radios working at the same time and emulate PU and SU together.
• Ability to support the Physical Layer (PHY), the Medium Access Control (MAC) layer, and high speed data transfer.
In this chapter, three testbed platforms will be introduced. The first is GNU-radio,
which is a free software toolkit for building software radios. The second is Wireless
Open Access Research Platform (WARP), which is a custom platform for research in
advanced wireless networks. The third is Emulation Engine 2 (BEE2), which is a
platform designed to facilitate the development of multiple layer functionalities for CR.
4.1 Introduction to Testbeds
4.1.1 GNU Radio
As the founder of the GNU Radio, Eric Blossom, introduces it, “GNU Radio is a free
software toolkit for building software radios” [41]. In early 2000, Eric Blossom and his
colleague created a sophisticated software infrastructure to explore software radio [31].
33
GNU Radio was originally designed only for radio amateurs. However, more and more
research groups have expressed interest in GNU Radio and made it more sophisticated.
Now many developers support this testbed platform. It is designed to operate in
computers and simulate the construction of simple software radios with minimal
hardware.
The GNU Radio signal processing library supplies lots of blocks for most signal
processing functions, such as modulation, demodulation, filter creation and I/O
operations. The block of communication with the Universal Software Radio Peripheral
(USRP) is also supplied by the signal processing library. New blocks can be added as
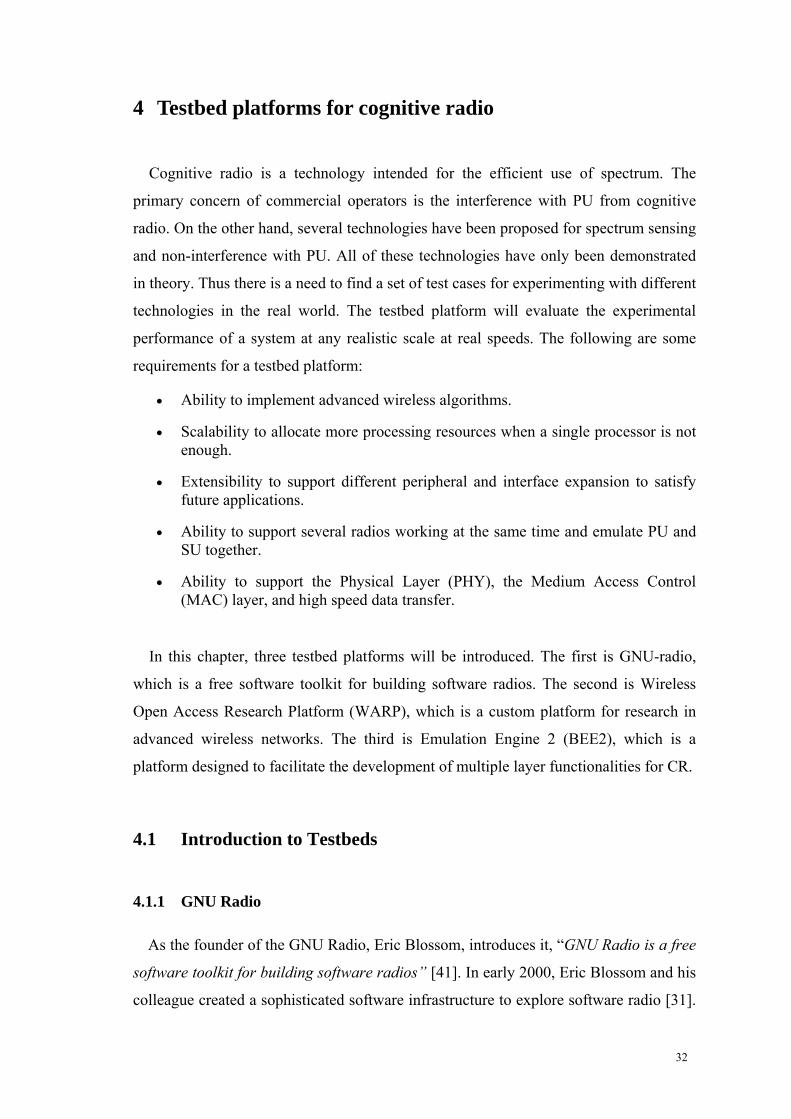
needed. The GNU Radio combines a flowgraph with different blocks to build a radio.
The flowgraph is an acyclic graph of GNU Radio blocks and data streams. Figure 4.1
shows how a FIR filter, Quadrature Demodulator and Audio Sink are connected in a
flowgraph to build a simple FM receiver.
Figure 4.1 GNU Radio flowgraph for a simple FM Receiver [42]
The programming in the GNU Radio the supports C++ and Python languages. C++ is
used for the computational processing blocks, while Python is the glue that controls and
coordinate these blocks.
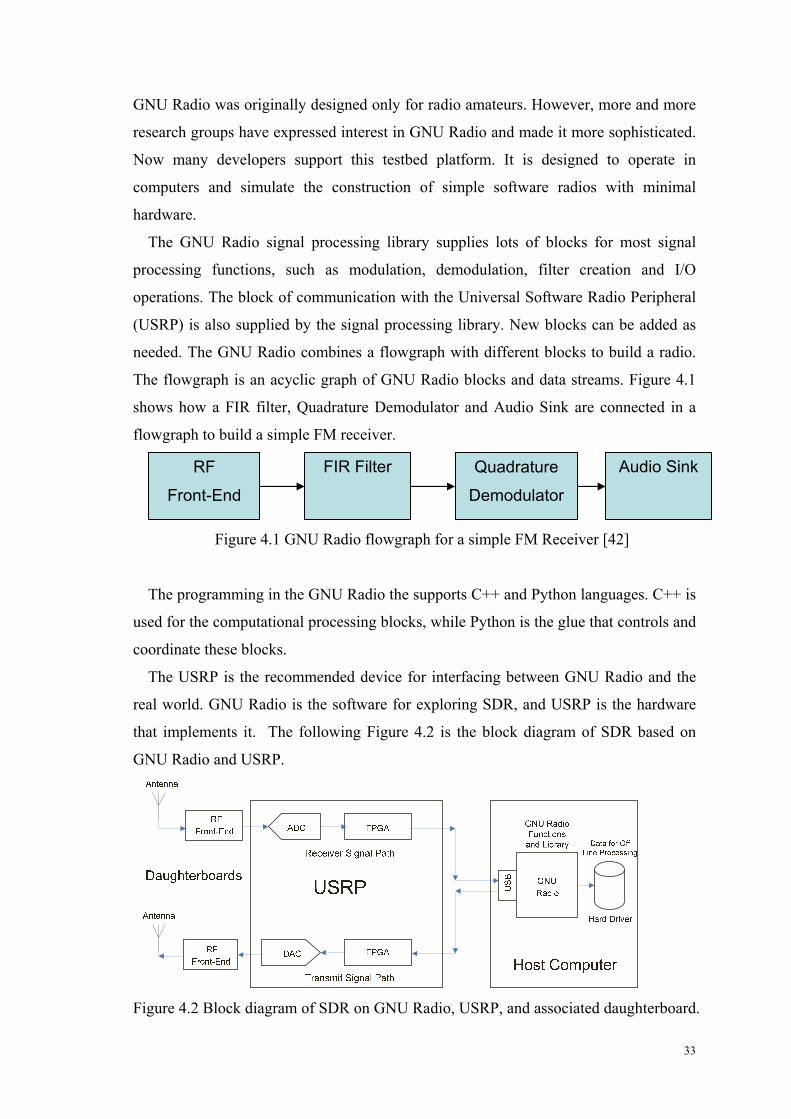
The USRP is the recommended device for interfacing between GNU Radio and the
real world. GNU Radio is the software for exploring SDR, and USRP is the hardware
that implements it. The following Figure 4.2 is the block diagram of SDR based on
GNU Radio and USRP.
Figure 4.2 Block diagram of SDR on GNU Radio, USRP, and associated daughterboard.
RF
Front-End
FIR Filter Quadrature
Demodulator
Audio Sink
34
The USRP is an openly comparatively inexpensive hardware device that executes
radio front-end functionality, A/D and D/A conversion. The USRP connects to the PC
by the Universal Serial Bus (USB2). There are 32 bits of I/Q samples in the typical I/Q
stream, out of which 16 bits each are assigned to the in-phase and quadrature
components. Since the maximum USB2 rate is 60 MB/sec and the USRP can transfer
data up to 15 Msamples/sec, the maximal spectral bandwidth of USRP is 7.5 MHz.
Sometimes this maximum speed cannot be achieved since the hosts have slower USB
implementations.
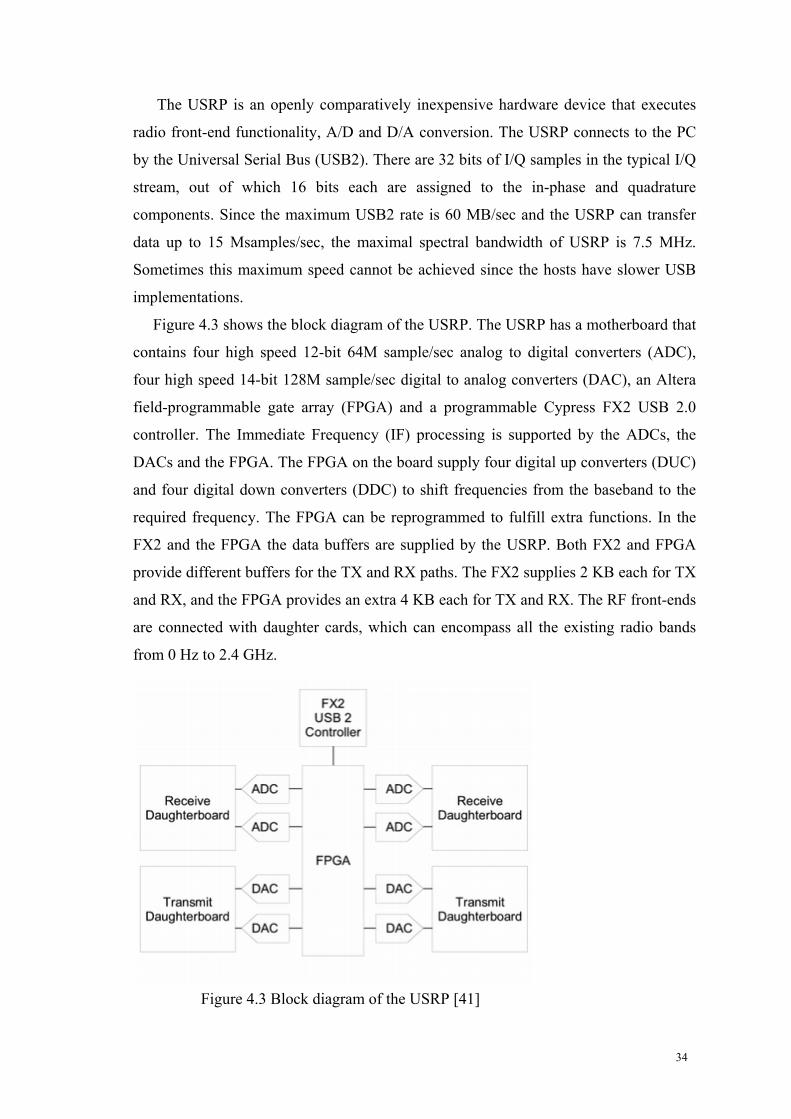
Figure 4.3 shows the block diagram of the USRP. The USRP has a motherboard that
contains four high speed 12-bit 64M sample/sec analog to digital converters (ADC),
four high speed 14-bit 128M sample/sec digital to analog converters (DAC), an Altera
field-programmable gate array (FPGA) and a programmable Cypress FX2 USB 2.0
controller. The Immediate Frequency (IF) processing is supported by the ADCs, the
DACs and the FPGA. The FPGA on the board supply four digital up converters (DUC)
and four digital down converters (DDC) to shift frequencies from the baseband to the
required frequency. The FPGA can be reprogrammed to fulfill extra functions. In the
FX2 and the FPGA the data buffers are supplied by the USRP. Both FX2 and FPGA
provide different buffers for the TX and RX paths. The FX2 supplies 2 KB each for TX
and RX, and the FPGA provides an extra 4 KB each for TX and RX. The RF front-ends
are connected with daughter cards, which can encompass all the existing radio bands
from 0 Hz to 2.4 GHz.
Figure 4.3 Block diagram of the USRP [41]
35
4.1.2 WARP
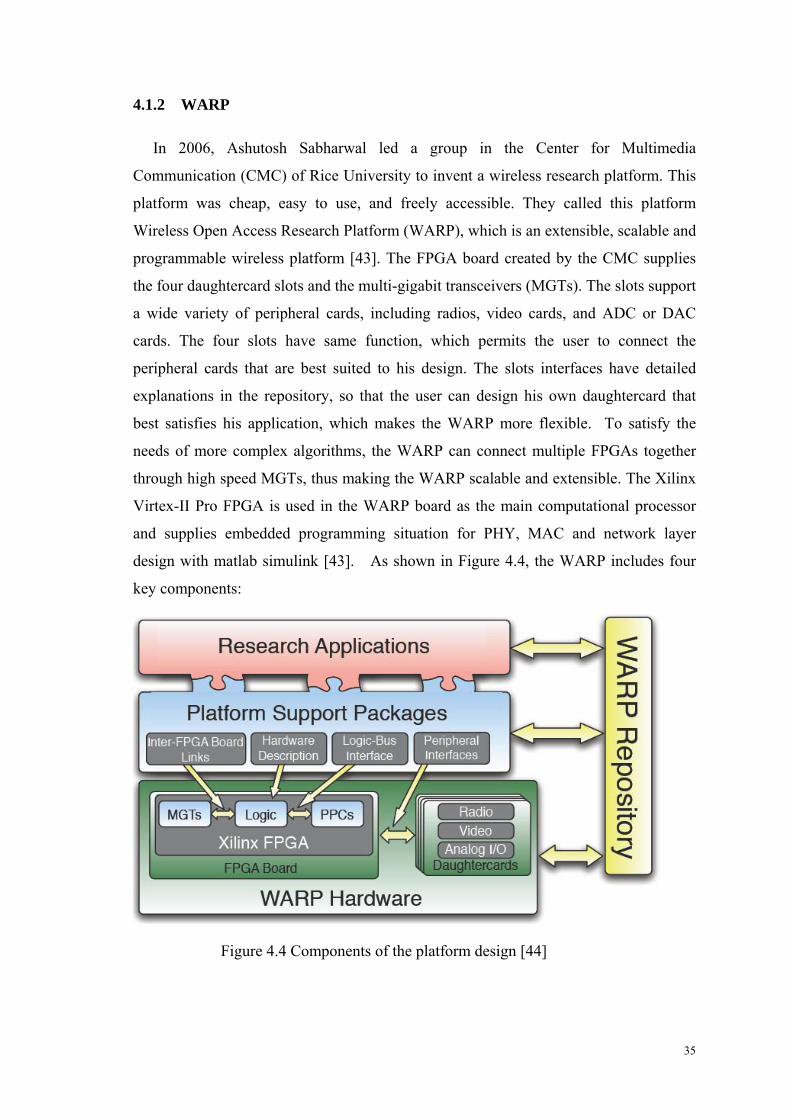
In 2006, Ashutosh Sabharwal led a group in the Center for Multimedia
Communication (CMC) of Rice University to invent a wireless research platform. This
platform was cheap, easy to use, and freely accessible. They called this platform
Wireless Open Access Research Platform (WARP), which is an extensible, scalable and
programmable wireless platform [43]. The FPGA board created by the CMC supplies
the four daughtercard slots and the multi-gigabit transceivers (MGTs). The slots support
a wide variety of peripheral cards, including radios, video cards, and ADC or DAC
cards. The four slots have same function, which permits the user to connect the
peripheral cards that are best suited to his design. The slots interfaces have detailed
explanations in the repository, so that the user can design his own daughtercard that
best satisfies his application, which makes the WARP more flexible. To satisfy the
needs of more complex algorithms, the WARP can connect multiple FPGAs together
through high speed MGTs, thus making the WARP scalable and extensible. The Xilinx
Virtex-II Pro FPGA is used in the WARP board as the main computational processor
and supplies embedded programming situation for PHY, MAC and network layer
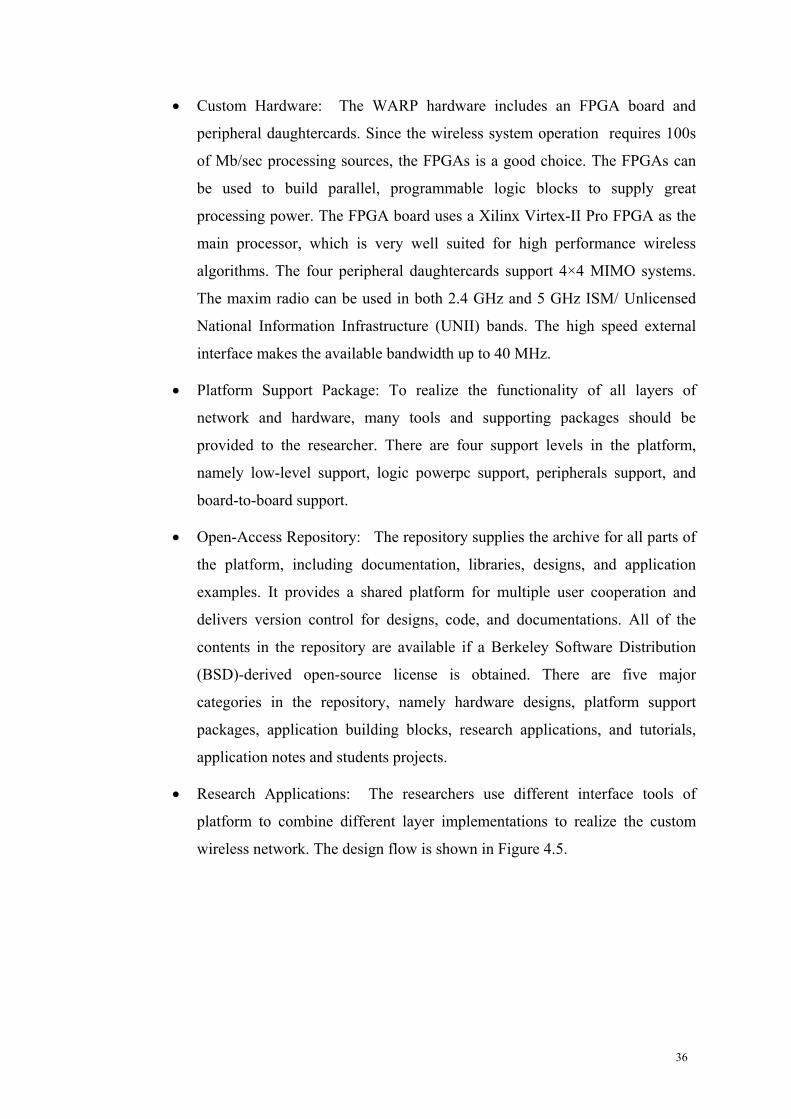
design with matlab simulink [43]. As shown in Figure 4.4, the WARP includes four
key components:
Figure 4.4 Components of the platform design [44]
36
• Custom Hardware: The WARP hardware includes an FPGA board and
peripheral daughtercards. Since the wireless system operation requires 100s
of Mb/sec processing sources, the FPGAs is a good choice. The FPGAs can
be used to build parallel, programmable logic blocks to supply great
processing power. The FPGA board uses a Xilinx Virtex-II Pro FPGA as the
main processor, which is very well suited for high performance wireless
algorithms. The four peripheral daughtercards support 4×4 MIMO systems.
The maxim radio can be used in both 2.4 GHz and 5 GHz ISM/ Unlicensed
National Information Infrastructure (UNII) bands. The high speed external
interface makes the available bandwidth up to 40 MHz.
• Platform Support Package: To realize the functionality of all layers of
network and hardware, many tools and supporting packages should be
provided to the researcher. There are four support levels in the platform,
namely low-level support, logic powerpc support, peripherals support, and
board-to-board support.
• Open-Access Repository: The repository supplies the archive for all parts of
the platform, including documentation, libraries, designs, and application
examples. It provides a shared platform for multiple user cooperation and
delivers version control for designs, code, and documentations. All of the
contents in the repository are available if a Berkeley Software Distribution
(BSD)-derived open-source license is obtained. There are five major
categories in the repository, namely hardware designs, platform support
packages, application building blocks, research applications, and tutorials,
application notes and students projects.
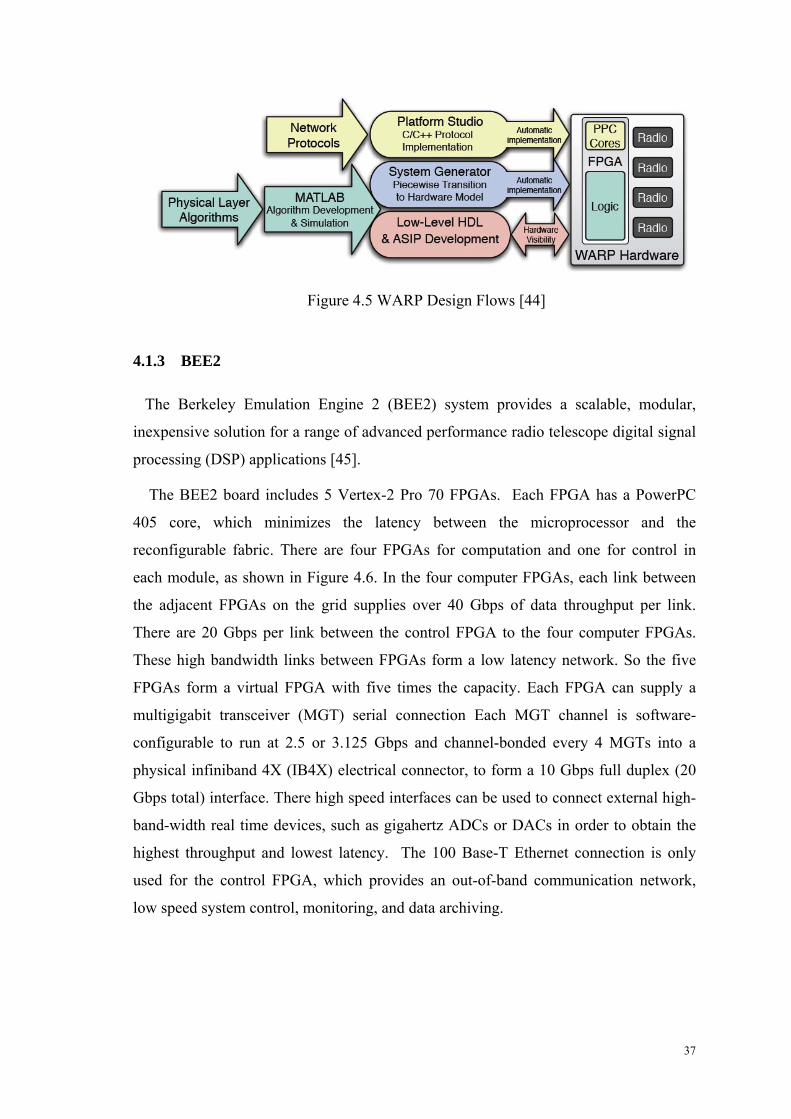
• Research Applications: The researchers use different interface tools of
platform to combine different layer implementations to realize the custom
wireless network. The design flow is shown in Figure 4.5.
37
Figure 4.5 WARP Design Flows [44]
4.1.3 BEE2
The Berkeley Emulation Engine 2 (BEE2) system provides a scalable, modular,
inexpensive solution for a range of advanced performance radio telescope digital signal
processing (DSP) applications [45].
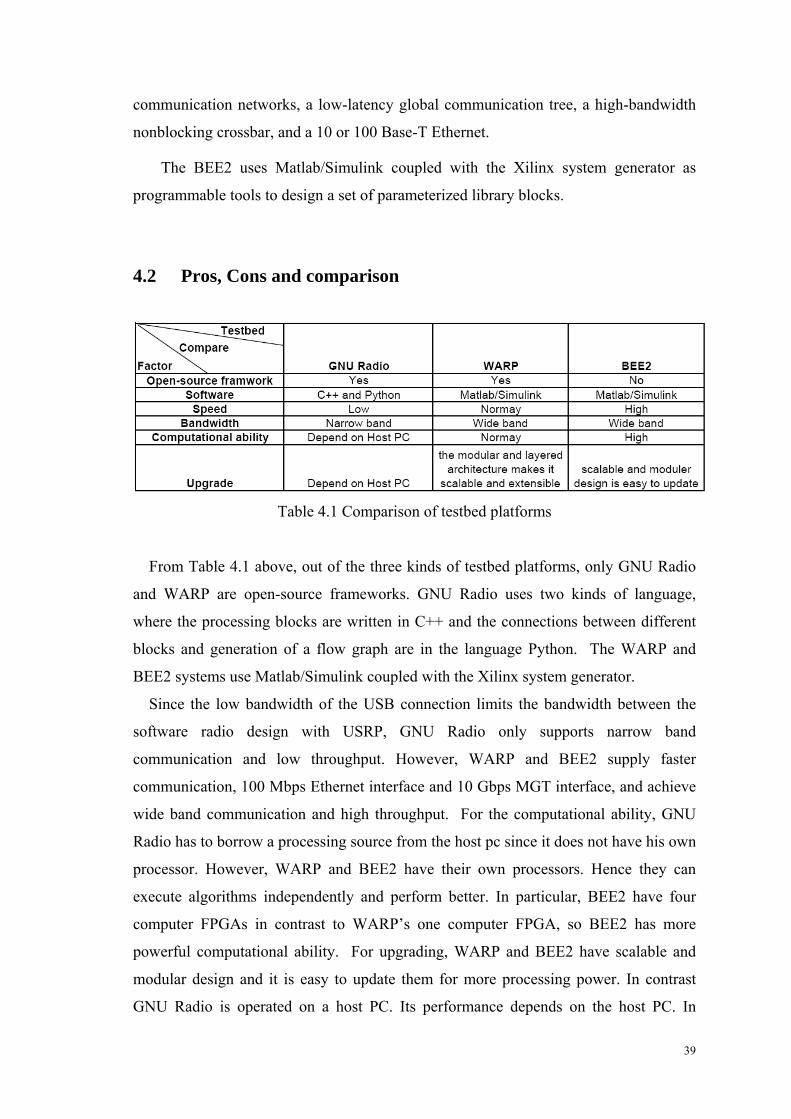
The BEE2 board includes 5 Vertex-2 Pro 70 FPGAs. Each FPGA has a PowerPC
405 core, which minimizes the latency between the microprocessor and the
reconfigurable fabric. There are four FPGAs for computation and one for control in
each module, as shown in Figure 4.6. In the four computer FPGAs, each link between
the adjacent FPGAs on the grid supplies over 40 Gbps of data throughput per link.
There are 20 Gbps per link between the control FPGA to the four computer FPGAs.
These high bandwidth links between FPGAs form a low latency network. So the five
FPGAs form a virtual FPGA with five times the capacity. Each FPGA can supply a
multigigabit transceiver (MGT) serial connection Each MGT channel is software-
configurable to run at 2.5 or 3.125 Gbps and channel-bonded every 4 MGTs into a
physical infiniband 4X (IB4X) electrical connector, to form a 10 Gbps full duplex (20
Gbps total) interface. There high speed interfaces can be used to connect external high-
band-width real time devices, such as gigahertz ADCs or DACs in order to obtain the
highest throughput and lowest latency. The 100 Base-T Ethernet connection is only
used for the control FPGA, which provides an out-of-band communication network,
low speed system control, monitoring, and data archiving.

38
Figure 4.6 BEE2 computer module [46]
Figure 4.7 Global communication network [45]
To satisfy a variety of applications, the BEE2 design includes a global
communication network as shown in Figure 4.7. There are three basic types of global
39
communication networks, a low-latency global communication tree, a high-bandwidth
nonblocking crossbar, and a 10 or 100 Base-T Ethernet.
The BEE2 uses Matlab/Simulink coupled with the Xilinx system generator as
programmable tools to design a set of parameterized library blocks.
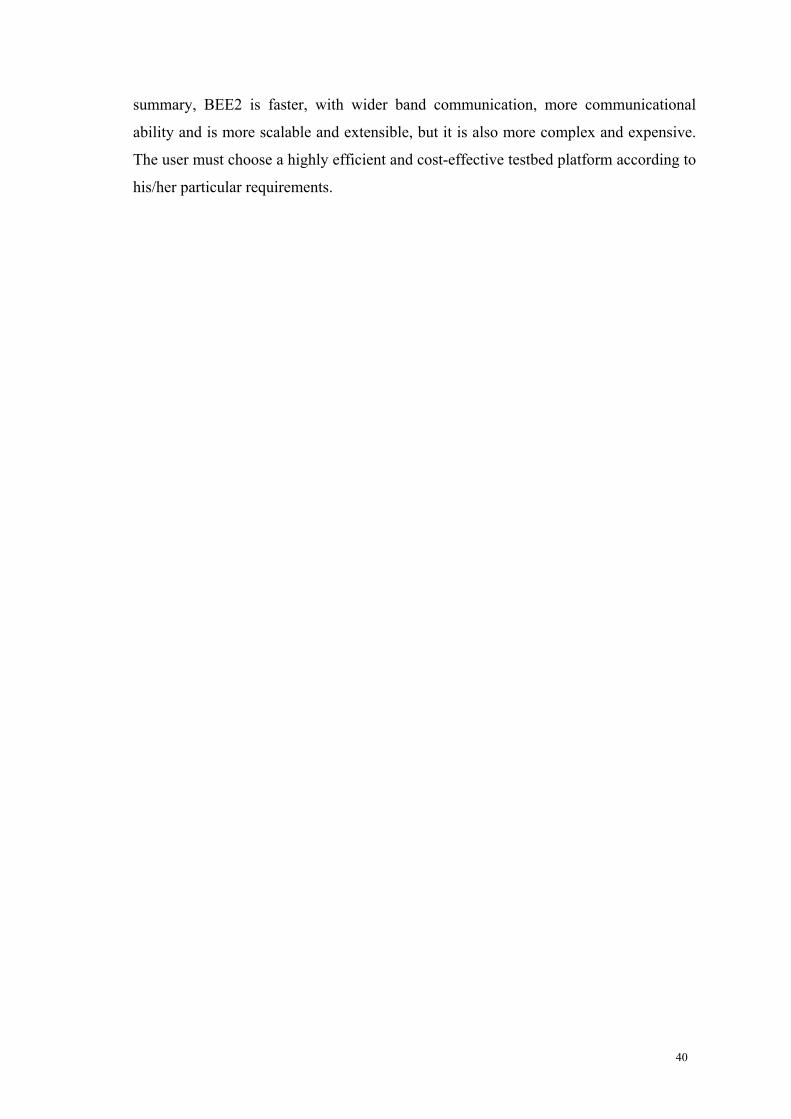
4.2 Pros, Cons and comparison
Table 4.1 Comparison of testbed platforms
From Table 4.1 above, out of the three kinds of testbed platforms, only GNU Radio
and WARP are open-source frameworks. GNU Radio uses two kinds of language,
where the processing blocks are written in C++ and the connections between different
blocks and generation of a flow graph are in the language Python. The WARP and
BEE2 systems use Matlab/Simulink coupled with the Xilinx system generator.
Since the low bandwidth of the USB connection limits the bandwidth between the
software radio design with USRP, GNU Radio only supports narrow band
communication and low throughput. However, WARP and BEE2 supply faster
communication, 100 Mbps Ethernet interface and 10 Gbps MGT interface, and achieve
wide band communication and high throughput. For the computational ability, GNU
Radio has to borrow a processing source from the host pc since it does not have his own
processor. However, WARP and BEE2 have their own processors. Hence they can
execute algorithms independently and perform better. In particular, BEE2 have four
computer FPGAs in contrast to WARP’s one computer FPGA, so BEE2 has more
powerful computational ability. For upgrading, WARP and BEE2 have scalable and
modular design and it is easy to update them for more processing power. In contrast
GNU Radio is operated on a host PC. Its performance depends on the host PC. In
40
summary, BEE2 is faster, with wider band communication, more communicational
ability and is more scalable and extensible, but it is also more complex and expensive.
The user must choose a highly efficient and cost-effective testbed platform according to
his/her particular requirements.

41
5 Conclusion
In this thesis we have discussed cognitive radio and the issues in spectrum sensing
and testbed platforms. We have introduced some of most commonly used detection
algorithms and presented their pros and cons. After comparing these detection methods,
we conclude that the simplest and most common detection method is energy detection,
which also has faster sensing time and lower cost. The feature detection and eigenvalue
based detection methods are more sophisticated. They are more accurate, more complex
and have longer sensing times. In the real world, the choice of detection methods is
dependent on the specific situation.
Testbed platforms are used to evaluate the performance of the different algorithms
used in cognitive radio. We have described several testbed platforms. The GNU Radio
only can be used for narrow band applications. The WARP and the BEE2 platforms
support wide band communication. The BEE2 can emulate a PU together with SU.
According to their different characteristics, they are each suited to different types of
wireless research.
42
References
[1] Gregory Staple and Kevin Werbach, "The End of Spectrum Scarcity,"March,2004, [online], Available: http://www.spectrum.ieee.org/mar04/3811
[2] "Federal Communications Commission Strategic Plan FY 2003-FY 2008," [online], Available: http://www.fcc.gov/omd/strategicplan/strategicplan2003-2008.pdf
[3] Federal Communications Commission, "Spectrum Policy Task Force " Rep. ET Docket no. 02-135Nov 15 2002.
[4] The European Parliament and of the Council, "A common regulatory framework for electronic communications networks and services (Framework directive)," Official Journal of the European communities, vol. Directive 2002/21/EC, Martch 7 2002.
[5] The European Parliament and Council, "A regulatory framework for radio spectrum policy in the European Community (Radio Spectrum Decision)," Official Journal of the European communities, vol. Decision No 676/2002/EC, Martch 7 2002.
[6] The National Post and Telecom Agency, "PTS Spectrum Policy," 2006. [7] M. H. Islam, C. L. Koh, S. W. Oh, X. Qing, Y. Y. Lai, C. Wang, Y. C. Liang, B. E.
Toh, F. Chin, G. L. Tan, and W. Toh, "Spectrum Survey in Singapore: Occupancy Measurements and Analyses," Inst. for Infocomm Res. (I2R), Singapore, July 15 2008.
[8] Shared Spectrum Company(Ssc),August,2005, [online], Available: http://www.sharedspectrum.com/measurements/
[9] Robin I. C. Chiang, Gerard B. Rowe, and Kevin W. Sowerby, "A Quantitative Analysis of Spectral Occupancy Measurements for Cognitive Radio," Proc. of IEEE Vehicular Technology Conference (VTC), Dublin, Ireland, April 2007.
[10] Danijela Cabric, Shridhar Mubaraq Mishra, and Robert W. Brodersen, "Implementation Issues in Spectrum Sensing for Cognitive Radios," Berkeley Wireless Research Center, University of California, Berkeley2004.
[11] Natasha Devroye, Mai Vu, and Vahid Tarokh, "Cognitive Radio Networks," IEEE SIGNAL PROCESSING MAGAZINE, November 2008.
[12] Simon Haykin and Life Fellow, "Cognitive Radio: Brain-Empowered Wireless communications," IEEE Journal in communications, Feb 2005.
[13] Joseph Mitola Iii and Gerald Q.Maguire, "Cognitive Radio: Making software Radios More Personal," IEEE Personal communications, August 1999.
[14] Joseph Mitola, "Cognitive radio : An Integrated Agent Architecture for Software Defined Radio," in Royal Institute of Technology (KTH) Sweden: Royal Institute of Technology (KTH), 2000, pp. xi, 313 p.
[15] Wikipedia, "Cognitive Radio," [online], Available: http://en.wikipedia.org/wiki/Cognitive_radio
[16] "IEEE Standard Definitions and Concepts for Dynamic Spectrum Access: Terminology Relating to Emerging Wireless Networks, System functionality, and Spectrum Management," IEEE Communications Society, vol. IEEE Std 1900.1 TM, September 2008.
[17] Fcc, "Facilitating Opportunities for Flexible, Efficient, and Reliable Spectrum Use Employing Cognitive Radio Technologies," in FCC 03-322, 2003.
[18] Bluetooth Sig, "Specification of the Bluetooth system, Master Table of Contents and Compliance Requirements," Nov 2004.
[19] Huseyin Arslan, Cognitive Radio, software Defined Radio, and Adaptive Wireless Systems: Springer, 2007.
[20] Ieee 802.22 Wrieless Ran, "Functional requirements for the 802.22 WRAN standard," IEEE 802.22- 05/0007r46, Oct 2005.
[21] Yonghong Zeng and Ying-Chang Liang, "Covariance Based Signal Detections For Cognitive Radio," Institute for Infocomm Research, A*STAR, IEEE 2007.

43
[22] Stevenson Carl, G. Chouinard, Zhongding Lei, Wendong Hu, S. Shellhammer, and W. Caldwell, "IEEE 802.22: The first cognitive radio wireless regional area network standard," IEEE Communications Magazine, vol. 47, pp. 130 - 138, Jan 2009.
[23] "IEEE Draft Standard for Information technology--Telecommunications and information exchange between systems--Local and metropolitan area networks--Specific requirements--Part 22.1: Standard to Enhance Harmful Interference Protection for Low Power Licensed Devices Operating in the TV Broadcast Bands," [online], Available: http://ieee802.org/22/
[24] "IEEE recommended practice for information technology - telecommunications and information exchange between systems - local and metropolitan area networks - specific requirements part 15.2: coexistence of wireless personal area networks with other wireless devices operating in unlicensed frequency bands," [online], Available: http://ieee802.org/15/pub/TG2.html
[25] Zhi Quan, Shuguang Cui, H.Vincent Poor, and Ali H.Sayed, "Collaborative Wideband Sensing for Cognitive Radios," IEEE SIGNAL PROCESSING MAGAZINE, Novermber 2008.
[26] Danijela Cabric, Artem Tkachenko, and Robert W. Brodersen, "Spectrum sensing measurements of pilot, energy, and collaborative detection," Proc. IEEE Military Commun. Conf. Washington, D.C., USA, Oct 2006.
[27] Tevfik Yucek and Huseyin Arslan, "A Survey of Spectrum Sensing Algorithms for Cognitive Radio Applications," IEEE Communications Sruveys & tutorials, VOL.11, NO.1, p. 15, First Quarter 2009.
[28] Danijela Cabric, Shridhar Mubaraq Mishra, and Bobert W. Brodersen, "Implementation Issues in Spectrum Sensing for Cognitive Radios," Berkeley Wireless Research Center, University of California, BerkeleyNov 2004.
[29] Przemystaw Pawetczak, Geard J.M.Janssen, and R.Venkatesha Prasad, "Performance Measures of Dynamic Spectrum Access Networks," IEEE Global Telecomm. Conf. San Francisco, California, USA, 2006.
[30] Frank H.P. Fitzek and Marcos D. Katz, Cognitive Wireless Networks: Springer, 2007. [31] Feng Ge, Qinqin Chen, Ying Wang, Charles W. Bostian, Thomas W. Rondeau, and Bin
Le, "Cognitive Radio: From Spectrum Sharing to Adaptive Learning and Reconfiguration," IEEEAC Paper, Jan 14 2008.
[32] Matthias Wellens, Janne Riihijarvi, Martin Gordziel, and Petri Mahonen, "Evaluation of Cooperative Spectrum Sensing based on large Scale Measurements," Department of Wireless Networks, RWTH Aachen University , Aachen, Germany2008.
[33] Menguc Oner and Friedrich Jondral, "Cyclostationarity-Based Methods for the Extraction of the Channel Allocation Information in a Spectrum Pooling System," In IEEE Radio and Wireless Conference, September 2004.
[34] Yonghong Zeng and Ying-Chang Liang, "Maximum-minimum eigenvalue detection for cognitive radio," Proc. IEEE 18th Int. Symp. Pers., Indoor Mobile Radio Commun.(PIMRC) Sep 2007.
[35] A. M. Tulino and S. Verdu, "Random Matrix Theory and Wireless Communications," Communications and Information Theory, vol. 1, p. 182, 2004.
[36] Harry Urkowitz, "Energy Detection of Unknown Deterministic Signals," IEEE Proceedings, vol. 55, April 1967.
[37] A. Sonnenschein and P.M. Fishman, "Radiometric detection of spread-spectrum signals in noise of uncertain power," IEEE Transactions on Aerospace and Electronic Systems, 1992.
[38] R. Tandra and A. Sahai, "Fundamental Limits on Detection in Low SNR," Proc. of the WirelessComm05 Symposium on Signal Processing, June 2005.
[39] Yingpei Lin and Chen He, "Subsection-average cyclostationary feature detection in cognitive radio," IEEE Int. Conference Neural Netowrks & Signal Processing, June 2008.

44
[40] Rahul Tandra, Shridhar Mubaraq Mishra, and Anant Sahai, "What is a Spectrum Hole and What Does it Take to Recognize One?," IProceedings of the IEEE, vol. 97, May 2009.
[41] Eric Blossom, "GNU Radio: Tools for Exploring the Radio Frequency Spectrum," Linux Journal, vol. 2004, June 2004.
[42] Rahul Dhar, Gesly George, Amit Malani, and Peter Steenkiste, "Supporting Integrated MAC and PHY Software Development for the USRP SDR," 1st IEEE Workshop on Networking Technologies for Software Defined Radio Networks, September 2006.
[43] Kiarash Amiri, Yang Sun, Patrick Murphy, Chris Hunter, Joseph R. Cavallaro, and Ashutosh Sabharwal, "WARP, a Modular Testbed for Configurable Wireless Network Research at Rice," Proc. SWRIF Houston, May 2007.
[44] Patrick Murphy, Ashu Sabharwal, and Behnaam Aazhang, "Design of WARP: a Wireless Open-Access Research Platform," Department of Electrical and Computer Engineering, Rice UniversitySep 2006.
[45] Chen Chang, John Wawrzynek, and Robert W. Brodersen, "BEE2: A High-End Reconfigurable Computing System," IEEE Design & Test of Computers, p. 12, April 2005.
[46] Shridhar Mubaraqu Mishra, Danijela Cabric, Chen Chang, Daniel Willkomm, Barbara Van Scheiwck, Adam Wolisz, and Robert W. Brodersen, "A real time cognitive radio testbed for physical and link layer experiments," School of Electrical Engineering and Computer Science, University of California, Berkeley, CaliforniaNov 2005.