the sustainable development goals report 2016ggim.un.org/documents/the sustainable development...
TRANSCRIPT

United Nations
The Sustainable Development Goals Report2016

Contents
2 Foreword
3 Overview
12 Goal 1: No poverty
14 Goal 2: Zero hunger
16 Goal 3: Good health and well-being
18 Goal 4: Quality education
20 Goal 5: Gender equality
22 Goal 6: Clean water and sanitation
24 Goal 7: Affordable and clean energy
26 Goal 8: Decent work and economic growth
28 Goal 9: Industry, innovation and infrastructure
30 Goal 10: Reduced inequalities
32 Goal 11: Sustainable cities and communities
34 Goal 12: Responsible consumption and production
36 Goal 13: Climate action
38 Goal 14: Life below water
40 Goal 15: Life on land
42 Goal 16: Peace, justice and strong institutions
44 Goal 17: Partnerships for the Goals
48 Leaving no one behind
50 A note to the reader
51 Regional groupings

United Nations New York, 2016
The Sustainable Development Goals Report 2016

Foreword
On 1 January 2016, the world officially began implementation of the 2030 Agenda for Sustainable Development—the transformative plan of action based on 17 Sustainable Development Goals—to address urgent global challenges over the next 15 years.
This agenda is a road map for people and the planet that will build on the success of the Millennium Development Goals and ensure sustainable social and economic progress world-wide. It seeks not only to eradicate extreme poverty, but also to integrate and balance the three dimensions of sustainable development—economic, social and environmental—in a comprehensive global vision.
It is vital that we begin implementation with a sense of opportunity and purpose based on an accurate evaluation of where the world stands now.
That is the aim of this report. It presents an overview of the 17 Goals using data currently available to highlight the most significant gaps and challenges.
The latest data show that about one in eight people still lived in extreme poverty, nearly 800 million people suffered from hunger, the births of nearly a quarter of children under 5 had not been recorded, 1.1 billion people were living without elec-tricity, and water scarcity affected more than 2 billion people.
These statistics show how important coordinated global data-generation efforts will be in supplying reliable and timely data for systematic follow-up and progress reviews.
The Goals apply to all societies. Even the wealthiest countries have yet to fully empower women or eliminate discrimination. All nations will need to build the Sustainable Development Goals into their national policies and plans if we are to achieve them.
This first report is a starting point. With collective global action, we can seize the opportunities before us and, together, fulfil the pledge of the 2030 Agenda to leave no one behind.
BAn Ki-moon Secretary-General, United nations

3
Overview
This inaugural report on the global Sustainable Development Goals (SDGs) is a first accounting of where the world stands at the start of our collective journey to 2030. The report analyses selected indicators from the global indicator frame-work for which data are available as examples to highlight some critical gaps and challenges. The list of SDG indicators agreed upon by the UN Statistical Commission in March 2016 will be subject to refinements and improvements as methods and data availability improve.
Every journey has a beginning and an end. Plotting that jour-ney and establishing key milestones along the way requires accessible, timely and reliable disaggregated data. The data requirements for the global indicators are almost as unprece-dented as the SDGs themselves and constitute a tremendous challenge to all countries. Nevertheless, fulfilling these requirements through building national statistical capacity is an essential step in establishing where we are now, charting a way forward and bringing our collective vision closer to reality.
Goal 1: End poverty in all its forms everywhere
Goal 1 calls for an end to poverty in all its manifestations, including extreme pov-erty, over the next 15 years. All people everywhere, including the poorest and most vulnerable, should enjoy a basic standard of living and social protection benefits.
fThe proportion of the global population living below the extreme poverty line dropped by half between 2002 and 2012, from 26 to 13 per cent. This trans-lated to one in eight people worldwide living in extreme poverty in 2012. Poverty remains widespread in sub-Saharan Africa, where more than 40 per cent of people lived on less than 1.90 US dollars a day in 2012.
fIn 2015, 10 per cent of the world’s workers and their families were living on less than 1.90 US dollars per person per day, down from 28 per cent in 2000.
fYoung people aged 15 to 24 are most likely to be among the working poor: 16 per cent of all employed youth were living below the poverty line in 2015, compared to 9 per cent of working adults.
fAbout one in five people received any type of social assistance or social protection benefits in low-income countries compared with two in three people in upper-middle-income countries.
1 in 8 people lived in extreme poverty in 2012
Social assistance or social protection benefits
1 in 5 in low-income
countries
2 in 3 in upper-middle-income countries

The Sustainable Development Goals Report 2016 4
Goal 2: End hunger, achieve food security and improved nutrition and promote sustainable agriculture
Goal 2 seeks to end hunger and all forms of malnutrition and to achieve sustain-able food production by 2030. It is premised on the idea that everyone should have access to sufficient nutritious food, which will require widespread promo-tion of sustainable agriculture, a doubling of agricultural productivity, increased investments and properly functioning food markets.
fThe proportion of the population suffering from hunger declined globally from 15 per cent in 2000-2002 to 11 per cent in 2014-2016. However, nearly 800 million people worldwide still lack access to adequate food.
fMore than half of the adult population in sub-Saharan Africa faced moderate or severe food insecurity in 2015; the level was severe for one-quarter of adults in the region.
fOne in four children under age 5 had stunted growth in 2014—an estimated 158.6 million children.
fThe share of overweight children under age 5 increased by nearly 20 per cent between 2000 and 2014. Approximately 41 million children in this age group worldwide were overweight in 2014; almost half of them lived in Asia.
Goal 3: Ensure healthy lives and promote well-being for all at all ages
Goal 3 aims to ensure health and well-being for all at all ages by improving repro-ductive, maternal and child health; ending the epidemics of major communicable diseases; reducing non-communicable and environmental diseases; achieving universal health coverage; and ensuring access to safe, affordable and effective medicines and vaccines for all.
fBetween 1990 and 2015, the global maternal mortality ratio declined by 44 per cent, and the mortality rate of children under age 5 fell by more than half. Still, an estimated 5.9 million children under 5 died in 2015, mostly from preventable causes.
fThe incidence of HIV, malaria and tuberculosis declined globally between 2000 and 2015. However, in 2015, 2.1 million people became newly infected with HIV, and an estimated 214 million people contracted malaria. Almost half the world’s population is at risk of malaria, but sub-Saharan Africa accounted for 89 per cent of all cases in 2015.
fWorldwide in 2015, approximately three in four women of reproductive age (15 to 49 years) who were married or in a union satisfied their need for family planning by using modern contraceptive methods.
fIn 2012, almost two-thirds of deaths from non-communicable diseases in people under age 70 were attributed to cardiovascular diseases and cancer.
Under-5 mortality ratesfell by more than halffrom 1990 to 2015
Sub-Saharan Africa accounted for 89 per cent of all malaria casesworldwide in 2015
89%
91
43
8
Deaths per 1,000 live births
20151990
15%
11%Global population
suffering from hunger declined
from 15 to 11 per cent
Nearly 800 millionstill suffer from hunger
1 in 4 children under age 5had stunted growth in 2014

5 Overview
Goal 4: Ensure inclusive and equitable quality education and promote lifelong learning opportunities for all
Goal 4 focuses on the acquisition of foundational and higher-order skills; greater and more equitable access to technical and vocational education and training and higher education; training throughout life; and the knowledge, skills and values needed to function well and contribute to society.
fIn 2013, 59 million children of primary school age were out of school.
fSurveys from 63 low- and middle-income countries between 2008 and 2012 show that children from the poorest 20 per cent of households are more than four times as likely to be out of school as their richest peers.
fData from 38 countries in developed regions show that, in the majority of these countries, 75 per cent or more of young people had at least minimum proficiency in reading and/or mathematics; the same was true for only 5 of the 22 developing countries with data.
fIn 2013, there were still 757 million adults (aged 15 and over) unable to read and write, of whom two-thirds were women.
Goal 5: Achieve gender equality and empower all women and girls
Goal 5 aims to empower women and girls to reach their full potential, which requires eliminating all forms of discrimination and violence against them, includ-ing harmful practices. It seeks to ensure that they have every opportunity for sexual and reproductive health and reproductive rights; receive due recognition for their unpaid work; have full access to productive resources; and enjoy equal participation with men in political, economic and public life.
fGlobally, the proportion of women aged 20 to 24 who reported that they were married before their eighteenth birthdays dropped from 32 per cent around 1990 to 26 per cent around 2015.
fIn 30 countries where the practice of female genital mutilation is concentrated, more than a third of girls aged 15 to 19 have undergone the procedure.
fBased on time-use surveys conducted between 2000 and 2014 in 59 coun-tries, women said they spend 19 per cent of their time each day on unpaid labour versus 8 per cent for men.
fThe proportion of seats held by women in single or lower houses of parliament rose to 23 per cent in 2016—a rise of 6 percentage points over the last decade.
757 million adultswere unable to read and write in 2013, two-thirds were women
59 million childrenof primary school agewere out of schoolin 2013
ABC
Women in parliament:23 per cent in 2016
Time spent each dayon unpaid labour
0
10
20
19%
Women Men
8%

The Sustainable Development Goals Report 2016 6
Goal 6: Ensure availability and sustainable management of water and sanitation for all
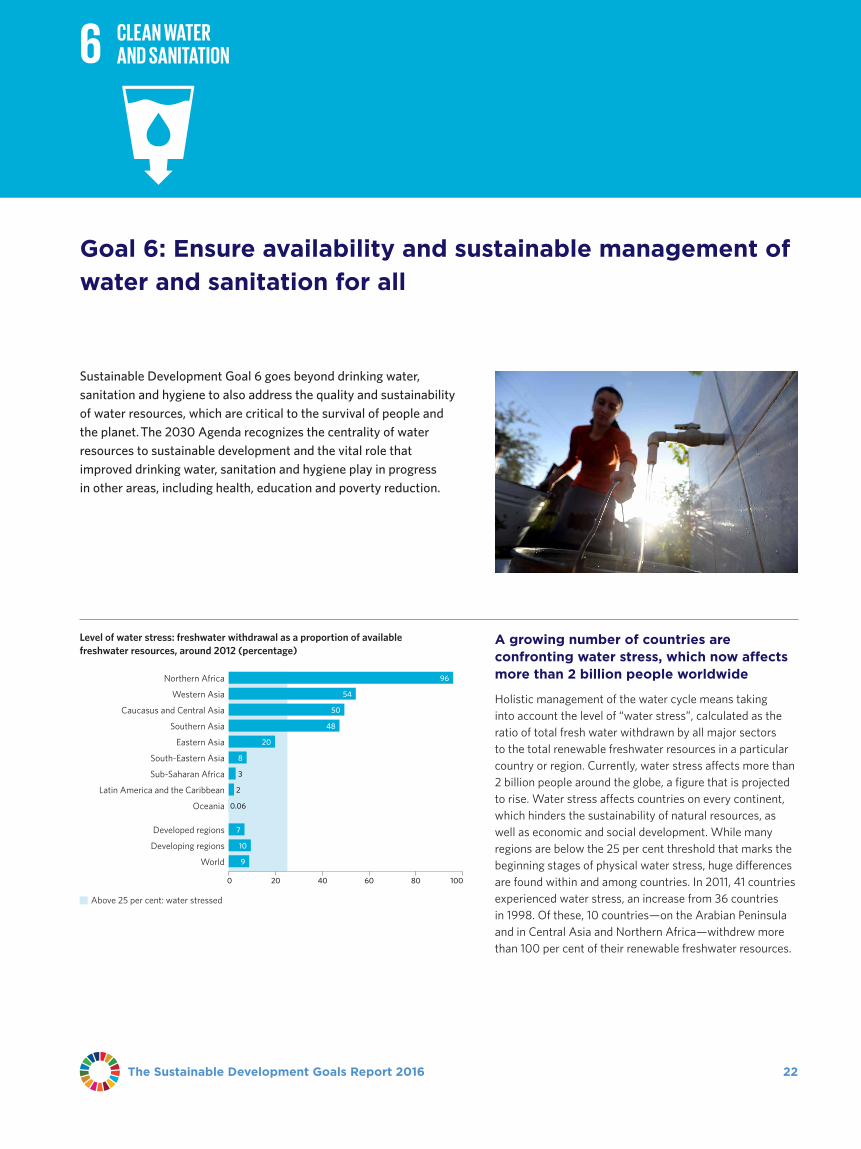
Goal 6 goes beyond drinking water, sanitation and hygiene to also address the quality and sustainability of water resources. Achieving this Goal, which is critical to the survival of people and the planet, means expanding international co- operation and garnering the support of local communities in improving water and sanitation management.
fIn 2015, 6.6 billion people, or 91 per cent of the global population, used an improved drinking water source, compared with 82 per cent in 2000. However, in 2015 an estimated 663 million people were still using unimproved sources or surface water.
fBetween 2000 and 2015, the proportion of the global population using improved sanitation increased from 59 per cent to 68 per cent. However, 2.4 billion were left behind. Among them were 946 million people without any facilities at all who continue to practise open defecation.
fWater stress affects more than 2 billion people around the globe, a figure that is projected to rise.
fIntegrated Water Resources Management plans are under way in every region of the world.
Goal 7: Ensure access to affordable, reliable, sustainable and modern energy for all
1.1 billion people lacked access to electricity in 2012
Modern renewablesincreased 4 per centa year between2010 and 2012
Goal 7 seeks to promote broader energy access and increased use of renewable energy, including through enhanced international cooperation and expanded infrastructure and technology for clean energy.
fThe proportion of the global population with access to electricity increased steadily, from 79 per cent in 2000 to 85 per cent in 2012. Despite these improvements, 1.1 billion people were still without this essential service in 2012.
fIn 2014, some 3 billion people, over 40 per cent of the world’s population, relied on polluting and unhealthy fuels for cooking.
fModern renewables grew rapidly, at a rate of 4 per cent a year between 2010 and 2012.
fGlobal energy intensity improved by 1.3 per cent a year from 2000 to 2012. About 68 per cent of the energy savings between 2010 and 2012 came from developing regions, with Eastern Asia as the largest contributor.
39%
663 million still use unimproved water sources
2.4 billion are without improved sanitation
Integrated Water Resources Management plans inevery region of the world
2 billion worldwideaffected by water stress

7 Overview
Goal 8: Promote sustained, inclusive and sustainable economic growth, full and productive employment and decent work for all
Continued, inclusive and sustainable economic growth is a prerequisite for global prosperity. Goal 8 aims to provide opportunities for full and productive employ-ment and decent work for all while eradicating forced labour, human trafficking and child labour.
fThe average annual growth rate of real gross domestic product (GDP) per capita in the least developed countries (LDCs) declined from 4.7 per cent over the period 2005-2009 to 2.6 per cent in 2010-2014. This was less than half the target rate of 7 per cent per year.
fWhile labour productivity increased in the developing regions from 2005 to 2015, the value for developed regions was still more than twice that of any developing region, and around 20 times greater than the values for sub-Saharan Africa and Southern Asia.
fIn 2015, the unemployment rate for women was 6.7 per cent versus 5.8 per cent for men. Gender disparities were most striking in Western Asia and Northern Africa, where the unemployment rate of women was more than twice that of men.
fWhile the share of adults with bank accounts rose by 20 per cent in four years, some 2 billion people still lack this important financial service.
Goal 9: Build resilient infrastructure, promote inclusive and sustainable industrialization and foster innovation
Goal 9 focuses on the promotion of infrastructure development, industrialization and innovation. This can be accomplished through enhanced international and domestic financial, technological and technical support, research and innovation, and increased access to information and communication technology.
fIn 2015, manufacturing value added per capita was less than 100 US dollars a year in the LDCs versus nearly 5,000 US dollars in developed regions.
fGlobally, energy efficiency and cleaner fuels and technologies reduced carbon dioxide (CO2) emissions per unit of value added by 13 per cent from 2000 to 2013.
fIn 2013, global investment in research and development (R&D) stood at 1.7 trillion US dollars (purchasing power parity, PPP), up from 732 billion US dollars in 2000. Developed regions dedicated almost 2.4 per cent of their GDP to R&D in 2013, while the average for LDCs and landlocked developing coun-tries was less than 0.3 per cent.
fThird-generation (3G) mobile-broadband covered 89 per cent of the urban population but only 29 per cent of the rural population in 2015.
Manufacturing value added per capita in 2015
LDCs
100 USD
Developedregions
5,000 USD
29%
Rural
89%
Urban
3G mobile-broadband coveragein 2015 worldwide
Proportion of fish stockswithin biologically sustainable levels
Average annualgrowth rate ofreal GDP per capitain LDCs
4.7%
7%
2.6%2010-20142005-2009
2
4
6
8
2015 Paris Climate Agreement
Women are twice as likely to be unemployed as men in Western Asia and Northern Africa
0 10 20 30
Western Asia
Northern Africa
9%
20%
10%
25%

The Sustainable Development Goals Report 2016 8
Goal 10: Reduce inequality within and among countries
Goal 10 calls for reducing inequalities in income, as well as those based on sex, age, disability, race, class, ethnicity, religion and opportunity—both within and among countries. It also aims to ensure safe, orderly and regular migration and addresses issues related to representation of developing countries in global decision-making and development assistance.
fIn 56 out of 94 countries with data for the period 2007-2012, the per capita income of the poorest 40 per cent of households grew more rapidly than the national average.
fThe share of imports from the least developed and developing countries entering developed countries duty-free increased between 2000 to 2014, from 70 to 84 per cent and from 65 to 79 per cent, respectively.
fThe cost of sending money across international borders averaged 7.5 per cent of the amount remitted in 2015, more than double the target rate of 3 per cent.
Goal 11: Make cities and human settlements inclusive, safe, resilient and sustainable
Goal 11 aims to renew and plan cities and other human settlements in a way that fosters community cohesion and personal security while stimulating innovation and employment.
fIn 2014, 880 million people lived in urban slums, or 30 per cent of the global urban population, compared to 39 per cent in 2000.
fIn many burgeoning cities around the world, populations are moving outwards, far beyond administrative boundaries.
fIn 2014, about half the urban population globally was exposed to air pollution levels at least 2.5 times above the standard of safety set by the World Health Organization.
fAs of 2015, 142 countries were developing national-level urban policies; of these, 82 countries were already in the process of implementation and 23 had reached the monitoring and evaluation stage.
Goal 12: Ensure sustainable consumption and production patterns
Goal 12 aims to promote sustainable consumption and production patterns through measures such as specific policies and international agreements on the management of materials that are toxic to the environment.
fIn 2010, the material footprint (amount of primary materials used) of devel-oped regions stood at 23.6 kilograms per unit of GDP, compared with 14.5 kilograms per unit of GDP in developing regions.
fThat same year, domestic material consumption per capita in developed regions was 72 per cent higher than in developing regions.
fWith six exceptions, all Member States of the United Nations are party to at least one of the conventions (Basel, Rotterdam or Stockholm) dedicated to the management of hazardous wastes and other chemicals.
Material footprintin 2010
Developing regions
Developedregions
14.5 kg
23.6 kg
Number of Parties to conventions on hazardous wastes and other chemicals
183 180 155
Basel StockholmRotterdam
Per capita incomein 56 of 94 countries grew more rapidlyin the pooresthouseholds
Poorest 40%of households
Nationalaverage
Share of duty-free imports from LDCsto developed countries
0 50 100
70%
84%
2000
2014
Proportion of globalurban populationliving in slums
Almost half the global urban population isexposed to ambientair pollution levels at least 2.5 times the maximumrecommended level
2000 2014
39%
30%
0
20
40

9 Overview
Goal 13: Take urgent action to combat climate change and its impacts
Climate change presents the single biggest threat to development, and its widespread, unprecedented effects disproportionately burden the poorest and the most vulnerable. Urgent action is needed not only to combat climate change and its impacts, but also to build resilience in responding to climate-related hazards and natural disasters.
fIn April 2016, 175 Member States signed the historic Paris Agreement, which sets the stage for ambitious climate action by all to ensure that global temper-atures rise no more than 2 degrees Celsius.
fAn average of 83,000 people died and 211 million were affected each year as a result of natural disasters occurring from 2000 to 2013.
fIn 2015, only 83 countries reportedly had legislative and/or regulatory provi-sions in place for managing disaster risk.
Goal 14: Conserve and sustainably use the oceans, seas and marine resources for sustainable development
This Goal seeks to promote the conservation and sustainable use of marine and coastal ecosystems, prevent marine pollution and increase the economic benefits to small island developing States and LDCs from the sustainable use of marine resources.
fMarine resources are particularly important for people living in coastal com-munities, who represented 37 per cent of world population in 2010.
fThe proportion of global marine fish stocks within biologically sustainable levels declined from 90 per cent in 1974 to 69 per cent in 2013.
fIn 2014, 8.4 per cent of the marine environment under national jurisdiction (up to 200 nautical miles from shore) was under protection. From 2000 to 2016, the share of marine key biodiversity areas that were completely covered by protected areas increased from 15 per cent to 19 per cent.
fThe five large marine ecosystems most at risk from coastal eutrophication are the Bay of Bengal, East China Sea, Gulf of Mexico, North Brazil Shelf and South China Sea—areas that provided ecosystem services for coastal populations totalling 781 million in 2010.
An average of 83,000 people diedand 211 million wereaffected each yearby natural disastersfrom 2000 to 2013
2015 Paris Climate Agreement
MAX2°C
0
10
20
0
10
20
Proportion of marine keybiodiversity areasunder protectionworldwide
2000 2016
15%
19%
1974 90%
2013 69%
Proportion of fish stockswithin biologically sustainable levels

The Sustainable Development Goals Report 2016 10
Goal 15: Protect, restore and promote sustainable use of terrestrial ecosystems, sustainably manage forests, combat desertification, and halt and reverse land degradation and halt biodiversity loss
Goal 15 focuses on managing forests sustainably, restoring degraded lands and successfully combating desertification, reducing degraded natural habitats and ending biodiversity loss. All of these efforts in combination will help ensure that livelihoods are preserved for those that depend directly on forests and other ecosystems, that biodiversity will thrive, and that the benefits of these natural resources will be enjoyed for generations to come.
fGlobal net loss in forest area declined from 7.3 million hectares per year in the 1990s to 3.3 million hectares per year during the period 2010-2015.
fThe percentage of global terrestrial, inland freshwater and mountain key biodiversity areas covered by protected areas increased from 16.5 per cent to 19.3 per cent, 13.8 per cent to 16.6 per cent and 18.1 per cent to 20.1 per cent, respectively, from 2000 to 2016.
fAs of 2015, over 23,000 species of plants, fungi and animals were known to face a high probability of extinction. Human activities are causing species extinctions at rates three orders of magnitude higher than those normal throughout the Earth’s history.
fSince 1999, at least 7,000 species of animals and plants have been detected in illegal trade affecting 120 countries.
Goal 16: Promote peaceful and inclusive societies for sustainable development, provide access to justice for all and build effective, accountable and inclusive institutions at all levels
Goal 16 envisages peaceful and inclusive societies based on respect for human rights, the rule of law, good governance at all levels, and transparent, effective and accountable institutions. Many countries still face protracted violence and armed conflict, and far too many people are poorly supported by weak institutions and lack access to justice, information and other fundamental freedoms.
fBetween 2008 and 2014, the homicide rate in developing countries was twice that of developed countries.
fAt the peak in 2011, 34 per cent of the victims of human trafficking at the global level were children, up from 13 per cent in 2004.
fGlobally, 30 per cent of people held in detention over the period 2012-2014 had not been sentenced.
fThe births of more than one in four children under age 5 worldwide go unre-corded. In the LDCs, one in two children have not been registered by their fifth birthdays.
-7.3 millionhectares
1990-2000 2010-2015
-3.3 millionhectares
-8
-4
0
Global annual net forest loss
Over 23,000 speciesface extinction across the globe
Proportion of childvictims of human trafficking worldwide
1 in 2 childrenhave not been registered bytheir fifth birthdaysin LDCs
34%
13%
2004 2011

11 Overview
Ensuring that no one is left behind
In launching the 2030 Agenda for Sustainable Development, Member States recognized that the dignity of the individual is fundamental and that the Agenda’s Goals and targets should be met for all nations and people and for all segments of society. Furthermore, they will endeavour to reach first those who are furthest behind. Going beyond rhetoric in this regard will be no simple matter because disaggregated data tell us that the benefits of development are far from equally shared.
fIn 2015, the youth unemployment rate (among people aged 15 to 24) globally was 15 per cent—more than three times the rate for adults (4.6 per cent).
fGlobally in 2015, births in the richest 20 per cent of house-holds were more than twice as likely to be attended by skilled health personnel as those in the poorest 20 per cent of households (89 per cent versus 43 per cent).
fChildren from the poorest households are more than twice as likely to be stunted as their richest peers.
fAlmost 80 per cent of urban inhabitants have access to piped water versus one-third of the rural population.
fThe LDCs, landlocked developing countries and small island developing States all reported a prevalence of undernourish-ment that was substantially higher than that of developing regions as a whole (13.6, 9.8 and 5.1 percentage points higher, respectively) in 2014-2016.
Leaving no one behind is the overarching principle of the 2030 Agenda. However, without data and indicators that address specific groups within a population, including the most vulnerable, full implementation of the commitments made in the SDGs will not be possible. A global effort to improve data availability and use, including through improvements in the integration of data sources, has already begun. But much work lies ahead. The global statistical community stands ready to transform and modernize the way this work is undertaken in order to fully meet current needs and to fulfil our promise to present and future generations.
WU Hongbo Under-Secretary-General for Economic and Social Affairs
Goal 17: Strengthen the means of implementation and revitalize the Global Partnership for Sustainable Development
The 2030 Agenda requires a revitalized and enhanced global partnership that mobilizes all available resources from Governments, civil society, the private sec-tor, the United Nations system and other actors. Increasing support to developing countries, in particular LDCs, landlocked developing countries and small island developing States is fundamental to equitable progress for all.
fOfficial development assistance totalled 131.6 billion US dollars in 2015, which was 6.9 per cent higher in real terms than in 2014 and represents the highest level ever reached.
fThe debt service to export ratio fell significantly over the period 2000-2012, dropping from 11.7 in 2000 to under 2.7 in 2012.
fIn 2015, fixed-broadband Internet penetration reached 29 per cent in developed regions, but only 7.1 per cent in developing regions and 0.5 per cent in LDCs.
fAlthough the share of LDC merchandise exports in total exports nearly doubled from 2000 to 2014, it still represented only a small fraction of global exports in 2014, at 1.1 per cent.
fNinety per cent of all countries and 88 per cent of developing countries conducted population and housing censuses over the period 2006-2015, a key source of essential data.
90 per centof all countries conducted populationand housing censuses over the period2006-2015
ODA totalled131.6 billion US dollarsin 2015, an increase of6.9 per cent in real termsfrom 2014
2014 2015
6.9%
CENSUS

The Sustainable Development Goals Report 2016 12
Poverty was halved over a decade, but one in eight people around the world still lived in extreme poverty in 2012
The international poverty line is currently defined as 1.90 US dollars per person per day using 2011 purchasing power parity (PPP). In the decade from 2002 to 2012, the proportion of the global population living below the poverty line dropped by half, from 26 to 13 per cent. If economic growth rates observed during those 10 years prevail for the next 15, the global rate for extreme poverty will likely fall to 4 per cent by 2030, assuming that growth benefits all income groups equally. Poverty remains widespread in sub-Saharan Africa, where more than 40 per cent of people lived on less than 1.90 US dollars a day in 2012.
In signing Agenda 2030, Governments around the world com-mitted to ending poverty in all its manifestations, including its most extreme forms, over the next 15 years. They resolved that all people everywhere should enjoy a basic standard of living. This includes social protection benefits for the poor and most vulnerable and ensuring that people harmed by conflict and natural hazards receive adequate support, including access to basic services.
Goal 1: End poverty in all its forms everywhere
Developing regions 3315
Developed regions 1.20.1
Proportion of the population living below 1.90 US dollars a day, 2002 and 2012 (percentage)
2002 2012
Note: The regional estimates for Northern Africa and Western Asia could not be calculated because the available data do not have sufficient population coverage.
0 10 20 30 40 50 60
World
Latin America and the Caribbean
Eastern Asia
South-Eastern Asia
Caucasus and Central Asia
Southern Asia
Oceania
Sub-Saharan Africa 5743
4830
3615
3312
21
613
6
2613
43
832

13 GOAL 1 | No poverty
About one in five people receive any type of social protection benefit in low-income countries
One way of further reducing poverty is to improve coverage of social protection programmes and target benefits to the poor and most vulnerable. Social protection programmes include social assistance, such as cash transfers, school feeding and targeted food assistance. Social insurance and labour market programmes are other forms of social protection, covering old-age and disability pensions, maternity benefits, unemployment insurance, skills training and wage subsidies, among others. Most poor people remain outside social protection systems, especially in poorer countries: about one in five people receive any type of benefit in low-income countries compared with two in three in upper-middle-income countries.
Among the working poor, young people are most likely to live in extreme poverty
In 2015, 10 per cent of the world’s workers and their families were living on less than 1.90 US dollars per person per day, down from 28 per cent in 2000. Young people aged 15 to 24 are most likely to be among the working poor: 16 per cent of all employed youth were living below the poverty line in 2015, compared with 9 per cent of working adults. One-third of all workers in sub-Saharan Africa and more than 18 per cent of workers in Southern Asia were among the working poor that year.
Proportion of employed population living below 1.90 US dollars a day, total, youth and adults, 2000 and 2015 (percentage)
Youths TotalAdults
0
10
20
30
40
50
60
200
0
2015
WorldEasternAsia
NorthernAfrica
South-Eastern
Asia
Caucasusand
CentralAsia
WesternAsia
LatinAmericaand the
Caribbean
Sub-SaharanAfrica
SouthernAsia
200
0
2015
200
0
2015
200
0
2015
200
0
2015
200
0
2015
200
0
2015
200
0
2015
200
0
2015
Proportion of the population receiving social protection benefits, most recent data available during 2000-2014 (percentage)
Social insurance Labour marketSocial assistance
Upper-middle-income countries
Lower-middle-income countries
Low-income countries 15
21
45 28
4 8
2
21

The Sustainable Development Goals Report 2016 14
Despite progress, more than 790 million people worldwide still suffer from hunger
The fight against hunger has seen some progress over the past 15 years. Globally, the proportion of undernourished people declined from 15 per cent in 2000-2002 to 11 per cent in 2014-2016. However, more than 790 million people still lack regular access to adequate food. If current trends continue, the zero hunger target will be largely missed by 2030. The persistence of hunger is no longer a matter of food availability. Rather, in many countries that failed to reach the Millennium Development Goals (MDGs) hunger target, natural and human- induced disasters or political instability have resulted in food insecurity affecting large swathes of the population. Preliminary estimates from the Food Insecurity Experience Scale—available for about 150 countries in 2014 and 2015—reveal that food insecurity is most prevalent in sub-Saharan Africa. More than half of the adult population in that region faced moderate or severe levels of food insecurity, and one-quarter faced severe levels. Southern Asia had the second highest prevalence: around 25 per cent of adults there experienced moderate or severe food insecurity, and 12 per cent experienced severe levels.
Goal 2 seeks sustainable solutions to end hunger in all its forms by 2030 and to achieve food security. The aim is to ensure that every-one everywhere has enough good-quality food to lead a healthy life. Achieving this Goal will require better access to food and the wide-spread promotion of sustainable agriculture. This entails improving the productivity and incomes of small-scale farmers by promoting equal access to land, technology and markets, sustainable food pro-duction systems and resilient agricultural practices. It also requires increased investments through international cooperation to bolster the productive capacity of agriculture in developing countries.
Goal 2: End hunger, achieve food security and improved
nutrition and promote sustainable agriculture
Number and proportion of undernourished people, 2000-2002 and 2014-2016 (millions and percentage)
0
5
10
15
20
25
30
35
Perc
enta
ge
21mil
15mil
Latin America and the Caribbean
Eastern Asia
Northern Afric
a
Western Asia
South-Eastern Asia
Southern Asia
Sub-Saharan Africa
Caucasus and Central A
sia
Oceania
Developing regionsWorld
Developed regions
272mil
281mil
204mil
220mil222mil
145mil
60mil
34mil
11mil
6mil
118mil
61mil
908mil
780mil
930mil
794.6mil7mil
4mil
14mil
19mil
1.3mil
1.4mil
2000-2002 2014-2016
Note: Vertical position of the bubbles represents the percentage of the population that is undernourished. The size of the bubbles represents the number of undernourished people.

15 GOAL 2 | Zero hunger
Agriculture share of government expenditures increasingly lags behind its economic contribution
The productive capacity of agriculture depends on invest-ments from public and private sources, both domestic and foreign. Recent trends in government spending have not been favourable. The agriculture orientation index (AOI)—the agriculture share of government expenditures divided by the agriculture share of GDP—fell from 0.37 to 0.33 between 2001 and 2013 in developing countries. The decline was interrupted only during the food price crisis of 2006 to 2008, when governments boosted agricultural spending. Since the late 1990s, aid to agriculture in developing countries has languished at around 8 per cent of the total, down from a high of 20 per cent in the mid-1980s, when donors began focusing more on improving govern-ance, building social capital and bolstering fragile States.
The share of overweight children under age 5 has increased by nearly 20 per cent
Worldwide, the proportion of children under age 5 who are overweight increased from 5 per cent in 2000 to 6 per cent in 2014. Overweight is a growing problem affecting nearly every region. Northern Africa has the highest prevalence of overweight children under 5 (16 per cent), followed by the Caucasus and Central Asia (12 per cent). Globally, 41 million children in this age group are overweight; almost half of them live in Asia and one quarter live in Africa.
Chronic undernutrition, or stunted growth, still affects one in four children under age 5
In 2014, an estimated 158.6 million children under age 5 were affected by stunting, a chronic form of under-nutrition defined as inadequate height for age. Chronic undernutrition puts children at greater risk of dying from common infections, increases the frequency and severity of infections and contributes to delayed recovery. It is also associated with impaired cognitive ability and reduced school and work performance. Globally, the proportion of stunted children has fallen in all regions except Oceania. Southern Asia made the most progress between 2000 and 2014, but the region is still home to the largest number of stunted children in the world, 63.9 million. In sub- Saharan Africa, population growth outpaced progress: the number of stunted children increased from an estimated 50.1 mil-lion in 2000 to 57.3 million in 2014. Together, Southern Asia and sub-Saharan Africa accounted for three-quarters of children under 5 with stunted growth in 2014.
Proportion of children under age 5 who are overweight, 2000 and 2014 (percentage)
2000 2014
0 8 10 14 1612642
World
Developing regions
Developed regions
Southern Asia
Sub-Saharan Africa
Eastern Asia
South-Eastern Asia
Latin America and the Caribbean
Western Asia
Oceania
Caucasus and Central Asia
Northern Africa 1216
912
59
6.57.5
7.57.0
37.4
65
4.44.5
34
910
56
56
Note: The population coverage for developed regions is less than 50 per cent for all periods between 2000 and 2014.
Proportion of children under age 5 with stunted growth, 2000 and 2014 (percentage)
2000 2014
0 10 30 40 5020
World
Developing regions
Developed regions
Eastern Asia
Latin America and the Caribbean
Caucasus and Central Asia
Western Asia
Northern Africa
South-Eastern Asia
Southern Asia
Sub-Saharan Africa
Oceania 3839
4336
5035
3827
24
2418
1727
1517
11
2433
197
26
54
36
Note: The population coverage for developed regions is less than 50 per cent for all periods between 2000 and 2014.
Agriculture share of government expenditure, agriculture share of GDP (percentage) and agriculture orientation index for world, developing and developed regions, 2001-2013
0
2
4
6
8
10
12
Shar
es (
perc
enta
ge)
0.0
0.2
0.4
0.6
0.8
1.0
1.2
Agriculture O
rientation Index
Agriculture share of GDP (left axis)Agriculture share of government expenditures (left axis)Agriculture orientation index (right axis)
2013
200
9
200
5
200
1
World Developing regions Developed regions
2013
200
9
200
5
200
1
2013
200
9
200
5
200
1
WO
RLD
FO
OD
PRI
CE
CRI
SIS
WO
RLD
FO
OD
PRI
CE
CRI
SIS
WO
RLD
FO
OD
PRI
CE
CRI
SIS

The Sustainable Development Goals Report 2016 16
Maternal, newborn and child mortality rates have declined sharply since 1990 but are still unacceptably high
Between 1990 and 2015, the global maternal mortality ratio declined by 44 per cent to an estimated 216 deaths per 100,000 live births, falling short of the MDGs and far from the target of 70 maternal deaths per 100,000 live births established in the 2030 Agenda. Almost all maternal deaths occur in low-resource settings and can be prevented, including by expanding access to appropriate sexual and reproductive health services. Globally in 2015, approximately three in four women of reproductive age (15 to 49 years) who were married or in a union satisfied their need for family planning by using modern contraceptive methods. Only three in four births took place with the assistance of a skilled birth attendant.
The global under-5 mortality rate declined by more than half to 43 per 1,000 live births from 1990 to 2015. This was short of the two-thirds reduction envisaged in the MDGs. In 2015, an estimated 5.9 million children under age 5 died; most of these deaths were preventable. Over this period, progress in child survival among children aged 1 to 59 months outpaced advances in reducing neonatal mortality; as a result, a growing share of all under-5 deaths occurs in the first month of life (45 per cent in 2015).
Goal 3 seeks to ensure health and well-being for all at every stage of life. The aim is to improve reproductive and maternal and child health; end the epidemics of HIV/AIDS, malaria, tuberculosis and neglected tropical diseases; reduce non-communicable and envi-ronmental diseases; achieve universal health coverage; and ensure universal access to safe, affordable and effective medicines and vaccines. Towards that end, world leaders committed to support research and development, increase health financing, and strengthen the capacity of all countries to reduce and manage health risks.
Goal 3: Ensure healthy lives and promote well-being for all
at all ages
Maternal mortality ratio worldwide, 1990-2015
Neonatal and under-5 mortality rates worldwide, 1990-2015
0
100
200
300
400
201520102005200019951990
Mat
erna
l dea
ths
per
100
,00
0 li
ve b
irth
s
0
25
50
75
100
201520102005200019951990
Neo
nata
l and
und
er-5
dea
ths
per
1,00
0 li
ve b
irth
s
NeonatalUnder-5

17 GOAL 3 | Good health and well-being
Number of road traffic deaths (thousands) and vehicles (millions) in high-, low- and middle-income countries, 2000-2013
0
200
400
1,000
1,200
800
600
2013201020052000
Deaths, high-income countries (left axis)
Deaths, low- and middle-income countries (left axis)
Vehicles, high-income countries (right axis)
Vehicles, low- and middle-income countries (right axis)
Dea
ths
(tho
usan
ds)
0
0.2
0.4
1.0
1.2
0.8
0.6
Num
ber of vehicles (millions)
Share of premature deaths* due to non-communicable diseases by type, 2012 (percentage)
Diabetes
Cardiovascular diseases
Respiratory diseases
Cancer
Other NDCs
4
37
27
23
8
* Premature deaths refer to deaths in the population under age 70.
Note: Because of rounding, percentages do not add up to 100.
Road traffic deaths have slowly declined since 2000 in high-income countries, while increasing significantly in low- and middle-income countries
Around 1.25 million people died from road traffic acci-dents in 2013, an average of 3,400 each day. In addition, tens of millions of people are injured or disabled each year from traffic accidents, with children, pedestrians, cyclists and older people among the most vulnerable. Halving the number of global deaths and injuries from road traffic accidents by 2020 is an ambitious goal given the dramatic increase in the number of vehicles, which nearly doubled between 2000 and 2013.
Among people under age 70, cardiovascular diseases and cancer account for almost two-thirds of deaths from non-communicable diseases
In 2012, non-communicable diseases (NCDs) were responsible for around 38 million deaths per year, accounting for 68 per cent of all deaths worldwide. Among deaths in the population under age 70, commonly referred to as premature deaths, NCDs accounted for 52 per cent of all deaths. Over three-quarters of prema-ture deaths from NCDs were caused by cardiovascular diseases, cancer, diabetes and chronic respiratory disease. Globally, premature mortality from these four main NCDs declined by 15 per cent between 2000 and 2012.
The incidence of major communicable diseases is declining, although hundreds of millions of people are still newly infected each year
The incidence of HIV, malaria and tuberculosis declined globally between 2000 and 2015, indicating that MDG 6 was achieved. Ending these epidemics, however, will require reinvigorated efforts. In 2015, the number of new HIV infections globally was 0.3 per 1,000 uninfected people, and an estimated 2.1 million people became newly infected that year. The incidence of HIV was highest in sub-Saharan Africa, with 1.5 new cases per 1,000 uninfected people. In 2014, 9.6 million new cases of tuberculosis (133 per 100,000 people) were reported worldwide, with 58 per cent of them in South-Eastern Asia and the Western Pacific. Almost half of the world’s population is at risk of malaria and, in 2015, the incidence rate was 91 new cases per 1,000 people at risk—an estimated 214 million cases. Sub-Saharan Africa accounted for 89 per cent of all malaria cases worldwide, with an incidence rate of 235 per 1,000 people at risk.
Global HIV, malaria and tuberculosis incidence rates, 2000-2015
0
50
100
150
200
2015201020052000
Tuberculosis (new cases per 100,000 people)
Malaria (new cases per 1,000 people at risk)
HIV (new cases per 100,000 uninfected people)

The Sustainable Development Goals Report 2016 18
Children are less likely to attend school if they live in rural areas, are poor or have parents with little or no education
Despite progress, the world failed to meet the MDG of universal primary education by 2015. In 2013, the latest year for which data are available, 59 million children of primary school age and 65 million adolescents of lower secondary age were out of school. Most of them were girls. Survey data from 63 low- and middle-income countries between 2008 and 2012 show that children of primary school age from the poorest 20 per cent of households were more than four times as likely to be out of school as their richest peers. Children, especially girls, from households headed by someone with less than a primary education were more than four times as likely to be out of school as children from households headed by someone with a secondary or higher education.
Goal 4 aims to ensure that all people have access to quality education and lifelong learning opportunities. This Goal focuses on the acquisition of foundational and higher-order skills at all stages of education and development; greater and more equitable access to quality education at all levels, as well as technical and vocational education and training (TVET); and the knowledge, skills and values needed to function well and contribute to society.
Goal 4: Ensure inclusive and equitable quality education
and promote lifelong learning opportunities for all
Proportion of out-of-school children of primary school age in selected countries by sex, location, household wealth and education of the household head, 2008-2012 (percentage)
0 10 20 30 40 50 60 70
Household wealth
Education of household head
National values Median values
Note: Data are based on nationally representative household surveys from 63 low- and middle-income countries between 2008 and 2012.
Boys7.1
Girls7.3
Rural7.7
Urban5.1
Richest quintile2.9
Second richest quintile4.2
Secondary or higher3.5
Middle quintile6.4
Primary6.4
Second poorest quintile8.4
Poorest quintile12.5
Less than primary16.0

19 GOAL 4 | Quality education
Learning opportunities of many types should extend throughout life
Education for sustainable development and global citizenship addresses pressing and overarching requirements of society: “living together” and the “relationship with nature”. These are critical avenues for a sustainable and peaceful future for all.
Equitable access to TVET and higher education should also be promoted. Although enrolments in TVET in upper secondary school rose by one-third between 2000 and 2013, the share of TVET in secondary education overall fell from 26 per cent to 22 per cent. Tertiary education has expanded rapidly over the same period, with enrolments doubling globally and increasing by 2.5 times in developing regions and with almost equal numbers of men and women enrolled. However, world-wide in 2013, there were still 757 million adults unable to read and write, of whom two-thirds were women.
More than half of children aged 3 and 4 in selected countries are developmentally on track in physical, learning and psycho-social well-being
Early childhood development is multidimensional, encompassing several aspects of a child’s well-being: physical, social, emotional and mental. Despite varia-tions in the pace and rate at which children develop, all children have an inherent right to develop to their fullest potential. In 54 of 58 countries with available data for the period 2009-2015, at least half of children aged 3 and 4 were developmentally on track in at least three of the following domains: literacy-numeracy, physical devel-opment, social-emotional development and learning.
Fundamental skills provide a solid foundation to young people for further learning throughout their lives
Quality education should lead to the acquisition of fundamental skills, such as literacy and numeracy, and higher-order skills. The end of lower secondary school often coincides with the end of compulsory education. By this stage, students should be able to master subject-related knowledge and skills, possess personal and social skills and have a solid foundation for further learning throughout life. Data from 38 countries in developed regions show that, in the majority of these countries, at least 75 per cent of young people achieved at least minimum proficiency in reading and/or mathematics; the same was true for only 5 of the 22 countries with data in developing regions.
TVET enrolment at theupper secondary levelrose by nearly one-thirdbetween 2000 and 2013
VOCATIONAL¬TECHNICAL TRAINING
The share of TVET of all enrolments in secondary educationfell from 26 per centto 22 per cent
0
25
50
2000 2013
26%22%
Proportion of children aged 36-59 months who are developmentally on track in at least three of the following domains: literacy-numeracy, physical development, social-emotional development and learning, 2009-2015 (percentage)
0 20 40 60 80 100
Developed regions (7)
South-Eastern Asia (4)Latin America and the Caribbean (14)
Caucasus and Central Asia (3)Eastern Asia (2)
Western Asia (5)Northern Africa (2)
Southern Asia (3)Sub-Saharan Africa (18) 60
64
71
71
75
84
84
86
91
Note: Data are available for 58 countries for the period 2009-2015 covering 18 per cent of the world’s population. The number of countries in each region with available data is in parentheses.
Proportion of young people at the end of lower secondary education achieving at least minimum levels of proficiency in reading and mathematics, selected countries in developing and developed regions, 2012 (percentage)
0 20 40 60 80 100
Dev
elop
ed r
egio
ns(3
8 c
ount
ries
)
Reading81
Mathematics78
Dev
elop
ing
regi
ons
(22
coun
trie
s)
Reading56
Mathematics47
National values Median values

The Sustainable Development Goals Report 2016 20
Rates of child marriage have declined overall but remain at unacceptable levels, especially in Southern Asia and sub-Saharan Africa
The practice of child marriage has been declining slowly. Globally, the proportion of women aged 20 to 24 who reported that they were married before their eighteenth birthdays dropped from 32 per cent around 1990 to 26 per cent around 2015. Child marriage is most common in Southern Asia and sub-Saharan Africa, with rates of 44 per cent and 37 per cent, respectively. In fact, the 10 countries with the highest rates in the world are found in these two regions. Marriage rates for girls under age 15 are also highest in Southern Asia and sub-Saharan Africa, at 16 per cent and 11 per cent, respectively. But social norms can and do change: the marriage of girls under age 15 declined globally from 12 per cent in 1990 to 7 per cent today, although disparities persist across regions and even countries. The fastest progress in reducing child marriage overall has been recorded in Northern Africa, where the share of child brides dropped by more than half over the last 25 years, from 29 per cent to 13 per cent.
Empowering women and girls to reach their full potential requires that they have equal opportunities to those of men and boys. This means eliminating all forms of discrimination and violence against them, including violence by intimate partners, sexual violence and harmful practices, such as child marriage and female genital mutilation (FGM). Ensuring that women have better access to paid employment, sexual and reproductive health and reproductive rights, and real decision-making power in public and private spheres will further ensure that development is equitable and sustainable.
Goal 5: Achieve gender equality and empower all women
and girls
Proportion of women aged 20 to 24 years who were married or in a union before ages 15 and 18, 1990 and 2015 (percentage)
0
10
20
40
60
70
30
50
WorldSouthernAsia
Sub-SaharanAfrica
LatinAmericaand the
Caribbean
OceaniaWesternAsia
South-Eastern
Asia
NorthernAfrica
Caucasusand
Central Asia
1990
2015
1990
2015
1990
2015
1990
2015
1990
2015
1990
2015
1990
2015
1990
2015
1990
2015
11 8
19
20
11
2
2020
117 7 7 79
3
19
30
16
18
28
32
26
28
2123
1925
16
21
14
2 2 2
12
Note: The values for 2015 refer to the latest available data collected between 2010 and 2014. Because of rounding, percentages in chart may not add up to totals.
Married/in a union before age 15 Married/in a union after age 15 but before age 18

21 GOAL 5 | Gender equality
Women hold only 23 per cent of parliamentary seats worldwide
The proportion of seats held by women in single or lower houses of parliament rose to 23 per cent in 2016. This represents an average increase of 0.6 percentage points a year since 2006 and a rise of 6 percentage points over a decade. Slow progress in this area contrasts with more rapid developments for women in parliamentary leadership positions. In 2016, the number of women speakers of parliament increased from 43 to 49 (out of the 273 posts globally); women accounted for 18 per cent of all speakers of parliament in January 2016.
Women in developing countries spend four times as many hours on unpaid work as men
In every region, women and girls do the bulk of unpaid work, including caregiving and household tasks such as cooking and cleaning. Women report that on average they spend 19 per cent of their time each day on unpaid labour versus 8 per cent for men. The responsibilities of unpaid care and domestic work, combined with paid labour, mean that women and girls work longer hours than men and boys and have less time for rest, self-care, learning and other activities.
Despite progress, more than one in three girls aged 15 to 19 in the 30 countries where the practice is concentrated have undergone female genital mutilation
FGM is a human rights violation that affects girls and women worldwide, especially in countries where it is an entrenched social norm. At least 200 million have been cut in the 30 countries where the practice is concentrated and that have representative prevalence data. Rates of FGM overall have declined by more than 25 per cent over the last three decades. However, not all countries have made progress, and the pace of decline has been uneven. Today, in these 30 countries, more than one in three girls aged 15 to 19 have undergone the procedure versus one in two in the mid-1980s.
Different forms of violence, including physical, sexual, psychological and economic, as well as trafficking and other forms of sexual exploitation affect millions of women and girls worldwide. This not only constitutes a grave violation of human rights, but also hinders the process of develop-ment. Available comparable data from 52 countries (includ-ing only one country from the developed regions) indicate that 21 per cent of girls and women interviewed aged 15 to 49 years experienced physical and/or sexual violence at the hands of an intimate partner in the previous 12 months.
Proportion of girls aged 15 to 19 who have undergone female genital mutilation in 30 countries where the practice is concentrated, 1985-2015 (percentage)
Note: The figures are population-weighted averages based on comparable data from 30 countries. The values for 2015 refer to the latest available data collected between 2010 and 2014.
0
10
20
30
40
50
60
2015201020052000199519901985
5149 48
4644
41
37
Proportion of time spent on unpaid and paid work in selected countries, women and men, 2000-2014 (percentage of time spent per day)
0
5
10
15
20
25
30
Women
10
18
Men
10
16
Women
10
19
Men
21
5
Women
10
19
Men
19
8
30 countriesin developing regions
29 countriesin developed regions
59 countriesworldwide
Note: Data are based on time-use surveys conducted between 2000 and 2014 in 59 countries, 30 from developing regions and 29 from developed regions.
Unpaid work Paid work
Proportion of seats held by women in single or lower houses of national parliament, 2016 (percentage)
0 5 10 15 20 25 30
WorldDeveloping regionsDeveloped regions
Latin America and the CaribbeanSub-Saharan Africa
Eastern AsiaNorthern Africa
South-Eastern AsiaSouthern Asia
Caucasus and Central AsiaWestern Asia
Oceania 5
13
17.6
17.7
18.3
21.5
21.7
24
28
26
21
23
The Sustainable Development Goals Report 2016 22
A growing number of countries are confronting water stress, which now affects more than 2 billion people worldwide
Holistic management of the water cycle means taking into account the level of “water stress”, calculated as the ratio of total fresh water withdrawn by all major sectors to the total renewable freshwater resources in a particular country or region. Currently, water stress affects more than 2 billion people around the globe, a figure that is projected to rise. Water stress affects countries on every continent, which hinders the sustainability of natural resources, as well as economic and social development. While many regions are below the 25 per cent threshold that marks the beginning stages of physical water stress, huge differences are found within and among countries. In 2011, 41 countries experienced water stress, an increase from 36 countries in 1998. Of these, 10 countries—on the Arabian Peninsula and in Central Asia and Northern Africa—withdrew more than 100 per cent of their renewable freshwater resources.
Sustainable Development Goal 6 goes beyond drinking water, sanitation and hygiene to also address the quality and sustainability of water resources, which are critical to the survival of people and the planet. The 2030 Agenda recognizes the centrality of water resources to sustainable development and the vital role that improved drinking water, sanitation and hygiene play in progress in other areas, including health, education and poverty reduction.
Goal 6: Ensure availability and sustainable management of
water and sanitation for all
Level of water stress: freshwater withdrawal as a proportion of available freshwater resources, around 2012 (percentage)
Above 25 per cent: water stressed
Northern Africa 96
Western Asia 54
Caucasus and Central Asia 50
Southern Asia 48
Eastern Asia 20
South-Eastern Asia 8
Sub-Saharan Africa 3
Oceania 0.06
Latin America and the Caribbean 2
Developed regions 7
Developing regions 10
World 9
0 20 40 60 80 100

23 GOAL 6 | Clean water and sanitation
Plans for the integrated management of water resources are under way in countries in every region, with varying progress on implementation
A key aspect of sustainable water management is the implementation of Integrated Water Resources Management (IWRM), a follow-up to the 2002 Johannesburg Plan of Implementation. In 2012, 65 per cent of the 130 countries that responded to an IWRM survey question reported that management plans were in place at the national level, although full implementation varies across regions.
Inadequate sanitation facilities are still a reality for one-third of the global population
Between 2000 and 2015, the proportion of the global population using improved sanitation increased from 59 per cent to 68 per cent. This means that 4.9 billion people globally were using an improved sanitation facility in 2015. However, 2.4 billion were not; among them were 946 million people without any facilities at all, who continued to practise open defecation. The unsafe management of faecal waste and wastewater continues to pose a major risk to public health and the environment.
Over 90 per cent of people worldwide use improved drinking water sources, but not all sources are safely managed
In 2015, 6.6 billion people, or 91 per cent of the global population, used an improved drinking water source compared with 82 per cent in 2000. An estimated 663 million people in 2015 were still using unimproved sources or surface water. While coverage was around 90 per cent or more in all regions except sub-Saharan Africa and Oceania, widespread in equalities persist within and among countries. Moreover, not all improved water sources are safely managed. In 2012, for example, it was estimated that at least 1.8 billion people were exposed to drinking water contaminated with faecal matter.
Developing regions
Proportion of countries in various stages of implementing national IntegratedWater Resources Management plans or equivalent, 2012 (percentage)
Not relevant
Implementation started
Under development
Implementation advanced
Developed, not implemented
Fully implemented
World
Western Asia
Latin America and the Caribbean
Oceania
Southern Asia
Sub-Saharan Africa
South-Eastern Asia
Eastern Asia
Caucasus and Central Asia
Northern Africa
0 20 40 60 80 100
Developed regions
Proportion of population using improved drinking water sources, 2000 and 2015 (percentage)
Oceania
Sub-Saharan Africa
Caucasus and Central Asia
South-Eastern Asia
Southern Asia
Northern Africa
Western Asia
Latin America and the Caribbean
Eastern Asia
Developed regions
Developing regions
World
56
68
89
90
93
93
95
95
96
99
89
91
53
55
83
80
81
90
87
90
81
98
79
82
2000 2015
0 20 40 60 80 100
Proportion of population using improved sanitation facilities, 2000 and 2015 (percentage)
Sub-Saharan Africa
Oceania
Southern Asia
South-Eastern Asia
Eastern Asia
Latin America and the Caribbean
Northern Africa
Caucasus and Central Asia
Western Asia
Developed regions
Developing regions
World
2630
3636
3247
5972
6077
7583
8090
8394
8896
9596
5062
5968
2000 2015
0 20 40 60 80 100

The Sustainable Development Goals Report 2016 24
An increasing proportion of the population has gained access to electricity, but 1.1 billion people still live without it
The proportion of the global population with access to electricity increased steadily, from 79 per cent in 2000 to 85 per cent in 2012. Recent progress was driven largely by advancements in Southern Asia, South-Eastern Asia and sub-Saharan Africa. Despite these improve-ments, 1.1 billion people are still without this essential service, including over 65 per cent of the population of sub-Saharan Africa and 70 per cent in Oceania. Of those gaining access to electricity worldwide since 2010, the vast majority (80 per cent) are urban dwellers.
Access to affordable, reliable and sustainable energy is crucial to achieving many of the Sustainable Development Goals—from poverty eradication through advancements in health, education, water supply and industrialization to mitigating climate change. Energy access, however, varies widely across countries, and the current rate of progress falls short of what will be required to achieve this Goal. Redoubled efforts will be needed, particularly for countries with large energy access deficits and high energy consumption.
Goal 7: Ensure access to affordable, reliable, sustainable
and modern energy for all
Proportion of the population with access to electricity, 2000 and 2012 (percentage)
2000 2012
0 20 40 60 80 100
World
Caucasus and Central Asia
Northern Africa
Eastern Asia
Latin America and the Caribbean
Western Asia
South-Eastern Asia
Southern Asia
Sub-Saharan Africa
Oceania 2329
63
90
35
79
26
79
8993
97
100
96
92
93
99
99100
8579
Developing regions 8174
Developed regions 100100

25 GOAL 7 | Affordable and clean energy
Global economic growth is being decoupled from energy use, but not quickly enough
Energy intensity—calculated by dividing total primary energy supply by GDP—reveals how much energy is used to produce one unit of economic output. Global energy inten-sity improved by 1.3 per cent per year from 2000 to 2012, falling from 6.7 megajoules per unit of GDP (2011 US dollars PPP) in 2000 to 5.7 in 2012. A contributing factor was the proportion of energy use covered by mandatory energy effi-ciency regulation, which almost doubled in the last decade (from 14 per cent in 2005 to 27 per cent in 2014). Still, pro-gress is proceeding at only two-thirds of the pace needed to double the global rate of improvement in energy efficiency by 2030. Among end-use sectors, industry was the largest contributor to reduced energy intensity, followed closely by transportation. About 68 per cent of the savings in energy intensity between 2010 and 2012 came from developing regions, with Eastern Asia as the largest contributor.
Use of renewable energy is growing only modestly, but modern renewables comprise a large and expanding share
The share of renewable energy—derived from hydropower, solid and liquid biofuels, the wind, sun, biogas, geothermal and marine sources, and waste—in the world’s total final energy consumption increased marginally, from 17.4 per cent in 2000 to 18.1 per cent in 2012. However, modern renew-ables, which exclude solid biofuels, grew at a rate of 4 per cent a year between 2010 and 2012. The contribution of renewables to the electricity sector has been growing significantly. Modern renewables accounted for 60 per cent of all new power-generating capacity in 2014. In absolute terms, about 72 per cent of the increase in energy consump-tion from modern renewable sources between 2010 and 2012 came from developing regions, mostly Eastern Asia.
More than 40 per cent of the world’s people still rely on polluting and unhealthy fuels for cooking
From 2005 to 2014, the proportion of the global population with access to clean fuels and technologies for cooking, such as gas and electricity, increased from 54 per cent to 58 per cent. Advancements have been slow in some regions, such as sub-Saharan Africa, where access remains very low. Limited progress since 2010 falls substantially short of global population growth and is almost exclusively confined to urban areas. As a result, the absolute number of people relying on polluting fuels and technologies for cooking has actually increased, reaching an estimated 3 billion people.
Proportion of the population with primary reliance on clean fuels and technologies for cooking, 2005 and 2014 (percentage)
2005 2014
0 20 40 60 80 100
Sub-Saharan Africa 1213
South-Eastern Asia 5333
Oceania 3021
Southern Asia 2935
Eastern Asia 5158
Western Asia 9594
Latin America and the Caribbean 8781
Caucasus and Central Asia 8188
Northern Africa 95100
Developed regions 9998
World 5458
Renewable energy share in total final energy consumption, 2000, 2005, 2010 and 2012 (percentage)
Other renewables Modern renewables
0
5
10
15
20
2000 2005 2010 2012
10.2
7.2 7.3
9.7 9.4
8.4 8.8
9.3
17.4 17.017.8 18.1
Energy intensity measured in terms of primary energy and gross domestic product, 2000 and 2012 (megajoules per 2011 US dollars PPP)
2000 2012
0 5 10 15 20
World
Developing regions
Developed regions
Northern Africa 3.73.9
Latin America and the Caribbean 4.44.1
South-Eastern Asia 5.54.5
Western Asia 4.74.9
Southern Asia 6.85.4
Sub-Saharan Africa 10.47.8
Eastern Asia 10.08.1
Caucasus and Central Asia 16.79.2
Oceania 10.311.0
6.65.3
6.86.1
6.75.7

The Sustainable Development Goals Report 2016 26
Increased economic growth is needed to meet the target of 7 per cent GDP growth in the least developed countries
In the period 2010-2014, the global average annual growth rate of real GDP per capita was 1.6 per cent, slightly below the rate achieved over the period of 2000-2004. The growth rate of countries in developing regions was more than triple that of developed regions (4.1 per cent versus 1.3 per cent, respectively), yet the rates for both regions were below their historical averages. This suggests that much work remains to achieve the goal of sustained and inclusive economic growth. The challenge is particularly steep for the least developed countries, whose per capita growth accelerated for a time but has since slowed to only 2.6 per cent on average during 2010-2014, less than half the target rate of at least 7 per cent a year.
Sustained and inclusive economic growth is a prerequisite for sustainable development, which can contribute to improved livelihoods for people around the world. Economic growth can lead to new and better employment opportunities and provide greater economic security for all. Moreover, rapid growth, especially among the least developed and developing countries, can help them reduce the wage gap relative to developed countries, thereby diminishing glaring inequalities between the rich and poor.
Goal 8: Promote sustained, inclusive and sustainable
economic growth, full and productive employment
and decent work for all
Average annual growth rate of real GDP per capita, 2000-2004, 2005-2009 and 2010-2014 (percentage)
World
Developing regions
Developed regions
Least developed countries
Landlocked developing countries
Small island developing States
0 1 2 3 4 65
2005-2009 2010-20142000-2004
2.42.3
2.5
3.55.5
3.6
3.44.7
2.6
2.10.5
1.3
3.64.5
4.1
1.81.0
1.6

27 GOAL 8 | Decent work and economic growth
While the share of adults with bank accounts rose by 20 per cent in four years, some 2 billion people still lack this important financial service
Between 2011 and 2014, the proportion of the world’s adult population with an account at a financial institution or a mobile money service increased from 51 per cent to 62 per cent, meaning that 700 million adults became account holders during this period. However, 2 billion adults worldwide still lack an account at a financial institution. Financial exclusion disproportionately affected women and the poor. The proportion of women who are account holders is 9 percentage points lower than the proportion of men account holders. Moreover, the proportion of account holders among the poorest 40 per cent of households is 14 percentage points lower than among those living in the richest 60 per cent of households.
Women are 15 per cent more likely to be unemployed than men worldwide, but the gender gap is far larger in Northern Africa and Western Asia
The global unemployment rate stood at 6.1 per cent in 2015, down from a peak of 6.6 per cent in 2009. The unemployment rate was lowest in Southern, Eastern and South-Eastern Asia, below 5 per cent, compared with other regions of the world, where the average rates were around 7 per cent or higher. Globally, women are more likely to be unemployed than men. Differences are most striking in Western Asia and Northern Africa, where the unem-ployment rate of women is more than twice that of men.
Labour productivity in developing regions, despite improvements, remains far below that of developed regions
Growth in labour productivity in developing regions outpaced that of developed regions, especially in Asia. That said, the productivity of workers in the poorest regions is still only a small fraction of that of workers in the developed world. Workers in Southern Asia and sub-Saharan Africa, for example, are only about 5 per cent as productive as those in developed regions, when measured as a percentage of GDP. Even the developing region with the highest labour productivity, Western Asia, has only about 40 per cent of the labour productivity of developed regions, and this rate has declined slightly since 2000.
Labour productivity (GDP per worker) in constant 2005 US dollars, 2005 and 2015 (thousands of US dollars)
2005 2015
World
Developed regions
Western Asia
Latin America and the Caribbean
Eastern Asia
Northern Africa
Caucasus and Central Asia
South-Eastern Asia
Oceania
Southern Asia
Sub-Saharan Africa
0 10 20 30 40 50 60 70 80
2.52.9
2.13.53.84.9
3.65.0
3.65.8
7.58.1
4.48.9
12.013.4
25.527.2
62.768.2
16.518.5
Unemployment rates by sex, 2015 (percentage)
Women Men
0 5 10 15 20 25 30
World
Developed regions
Eastern Asia
South-Eastern Asia
Southern Asia
Oceania
Latin America and the Caribbean
Sub-Saharan Africa
Caucasus and Central Asia
Western Asia
Northern Africa 25.210.2
19.79.0
9.79.49.5
7.18.8
5.76.9
6.05.2
4.04.54.44.2
5.3
7.57.8
6.75.8
Proportion of the world’s adult population that has an account at a financial institution, 2011 and 2014 (percentage)
51 per centof the world’s
adult populationhave an account2.5
billionunbanked
62 per centof the world’s
adult populationhave an account2
billionunbanked
20142011

The Sustainable Development Goals Report 2016 28
The untapped manufacturing potential of the least developed countries suggests significant growth opportunities
Manufacturing is one of the principal engines of economic growth. However, inequalities in the value added in the manufacturing sector point to the steep challenges faced by the most disadvantaged countries, as well as their potential for growth. For example, in 2015, manufacturing value added (MVA) per capita was less than 100 US dollars a year in the least developed countries (LDCs) compared to 4,926 US dollars in developed regions. Significant invest-ment is needed in the LDCs to boost technological progress and economic growth, and to achieve the target of doubling industry’s share in the gross domestic product of these countries. Trends in MVA show steady increases in devel-oping regions and a slight decline in developed regions, which is similar to trends in manufacturing jobs. The poten-tial for growth in manufacturing employment is particularly high in the LDCs because large segments of the population continue to work in agricultural and traditional sectors.
Sustainable Development Goal 9 addresses three important aspects of sustainable development: infrastructure, industriali-zation and innovation. Infrastructure provides the basic physical facilities essential to business and society; industrialization drives economic growth and job creation, thereby reducing income inequality; and innovation expands the technological capabilities of industrial sectors and leads to the development of new skills.
Goal 9: Build resilient infrastructure, promote inclusive
and sustainable industrialization and foster innovation
Manufacturing value added per capita, 2005 and 2015 (constant 2010 US dollars)
2005 2015
0 1,000 2,000 3,000 4,000 5,000
Least developed countries6298
Landlocked developing countries119149
Small island developing States1,068
1,363
Developed regions4,710
4,926
Developing regions552
923
World1,347
1,630

29 GOAL 9 | Industry, innovation and infrastructure
Mobile-broadband networks reach almost 90 per cent of the urban population but less than 30 per cent of the rural population
Technological advances in the communications sector, expanding networks and falling prices have driven the spread of mobile-cellular services around the world. People in previously unconnected areas have joined the global information society and, in 2015, 95 per cent of people living in the LDCs were covered by a mobile- cellular signal. However, higher-speed Internet access through third-generation (3G) mobile-broadband networks is less widespread: only 29 per cent of the rural population are covered. Increasingly, Internet access is a requirement for producers and entrepreneurs to remain competitive, and greater efforts are needed to expand this type of coverage to rural and remote parts of the world.
Although expenditures on research and development have grown, the poorest countries lag behind
In 2013, global investment in research and development (R&D) stood at 1.7 trillion US dollars (PPP), up from 732 billion US dollars in 2000. This represents an annual growth rate of 4.6 per cent, which suggests 1.7 per cent of global GDP was devoted to R&D in 2013. While substantial, this global average masks wide disparities among regions: developed regions dedicated almost 2.4 per cent of their GDP to R&D in 2013, while the average for the LDCs and landlocked developing countries stood at less than 0.3 per cent. More concerted efforts are urgently needed to enhance research capabilities in these countries.
Energy efficiency and cleaner fuels and technologies have reduced carbon dioxide emissions per unit of value added
As countries shift to less energy intensive industries, cleaner fuels and technologies and stronger energy efficiency policies, almost all regions have shown a reduction in the carbon intensity of their GDP. The pro-portion of the world’s energy use covered by mandatory energy efficiency regulations has almost doubled over the last decade, from 14 per cent in 2005 to 27 per cent in 2014. More extensive deployment of clean technologies will increase the likelihood of achieving the proposed target of upgrading infrastructure and retrofitting industries to make them sustainable, with increasingly efficient use of resources and greater adoption of clean and environ-mentally sound technologies and industrial processes.
Carbon dioxide emissions per unit of value added, 2000 and 2013 (kilograms per constant 2010 US dollars)
2000 2013
0.0 0.2 0.4 0.6 0.8 1.0 1.2
World
Developing regions
Developed regions
Latin America and the Caribbean
Sub-Saharan Africa
Northern Africa
Western Asia
Eastern, Southern, South-EasternAsia and Oceania
Caucasus and Central Asia 1.020.55
0.450.41
0.290.28
0.220.23
0.270.21
0.210.19
0.370.29
0.360.34
0.380.33
Research and development expenditure as a proportion of GDP, 2005 and 2013 (percentage)
2005 2013
0.0 0.5 1.0 1.5 2.0 2.5
Least developed countries 0.190.24
Landlocked developing countries 0.240.28
Small island developing States 0.960.98
Developed regions 2.152.36
Developing regions 0.791.16
World 1.541.70
Proportion of the population covered by a third-generation mobile-broadband network, by location and technology, 2015 (percentage)
3G coverage No 3G coverage
World population: 7.4 billion
69 per centof the population
covered by 3G
World rural population: 3.4 billion
World urban population: 4 billion
89 per centof urban
populationcovered by 3G
29 per centof rural
populationcovered by 3G

The Sustainable Development Goals Report 2016 30
Many countries in Latin America and the Caribbean and in Asia saw a decline in income inequality
When income growth among the poorest people in a country is faster than the national average, income inequality is reduced. In 56 out of 94 countries with data for the period 2007-2012, the per capita income of the poorest 40 per cent of households grew more rapidly than the national average. This was especially true in Latin America and the Caribbean and in Asia, where 88 per cent and 67 per cent of countries, respectively, saw gains for the poorest 40 per cent of households. That said, faster growth for the poorest does not necessarily imply greater prosperity because 9 of the 56 countries experienced negative income growth rates over this period.
Goal 10 calls for reducing inequalities in income, as well as those based on sex, age, disability, race, class, ethnicity, religion and opportunity—both within and among countries. World leaders recognized the positive contribution of international migra-tion to inclusive growth and sustainable development, while acknowledging that it demands coherent and comprehensive responses. Accordingly, they committed to cooperate interna-tionally to ensure safe, orderly and regular migration. The Goal also addresses issues related to representation of developing countries in global decision-making and development assistance.
Goal 10: Reduce inequality within and among countries
Proportion of countries in each region where the average annual growth rates of real income per capita were greater in the bottom 40 per cent of the population than the national average, 2007-2012 (percentage)
0 20 40 60 80 100
World
Developed regions
Latin America and the Caribbean
Asia
Africa 50
67
88
49
60
Note: The chart represents 94 countries with data: 43 in developed regions, 16 in Africa, 19 in Asia and 16 in Latin America and the Caribbean.

31 GOAL 10 | Reduced inequalities
World average cost of sending the equivalent of 200 US dollars in remittancesas a proportion of amount remitted, 2008-2015 (percentage)
0
1
2
3
4
9
10
7
6
5
8
2008 2009 2010 2011 2012 2013 20302014
3.0Target
9.89.5
8.89.1 9.2
8.9
8.3
7.5
2015
Proportion of imports (excluding arms and oil) from least developed countries and developing countries entering developed countries duty free, 2000-2014 (percentage)
50
55
60
65
70
90
100
85
80
75
90
2000 2002 2004 2006 2008 2010 2012 2014
LDCs Developing countries
The cost of sending money across international borders has declined
Migrants contribute positively to inclusive growth and sustainable development. They also contribute to the development of their countries of origin and destination through their work and the remittances they send home. Total remittances to developing countries increased slightly in 2015 to 431.6 billion US dollars (up 0.4 per cent from 2014), but the cost of sending money across international borders remains high. Even though the cost declined from 2012 to 2015, it still averaged 7.5 per cent of the amount remitted in 2015, more than double the target rate of 3 per cent.
The share of imports from LDCs and developing countries that enter developed countries duty free has been continuously on the rise
The share of imports from LDCs and developing countries that benefited from duty-free treatment increased from 2000 to 2014, reaching 84 per cent and 79 per cent, respectively, although the pace of change was faster for developing countries. The comparative advantage of LDCs in duty-free access varied depending on the product groups: almost all agricultural products from LDCs (98 per cent) were exempted from duties by developed countries versus 74 per cent of products from developing countries. The relative advantage for LDCs was even greater for textiles and clothing: rates for both product groups were around 70 per cent for LDCs; for developing countries, the rates were 41 per cent for textiles and 34 per cent for clothing.
Labour’s contribution to GDP has decreased across most regions
The share of GDP that is attributed to labour has been trending downward over the past 15 years as processes have become more mechanized and capital assumes a growing share of GDP. Over this period, the labour share of GDP increased only in Oceania and Latin America and the Caribbean, where it was at 48 and 52 per cent, respectively, in 2015. Eastern Asia saw flat growth of the labour share of GDP and continues to maintain the highest share in the world at 61.4 per cent of GDP. While the labour share of GDP fell from almost 58 per cent in 2000 to just over 55 per cent in 2015 for developed regions, developing regions experienced a slight improve-ment from 54 to 55 per cent. Stagnating wages across all regions contributed significantly to these results.
Labour share of GDP (PPP), comprising wages and social protection transfers, 2000 and 2015 (percentage)
2000 2015
0 10 20 30 40 50 60 70
World
Developing regions
Developed regions
Eastern Asia
Latin America and the Caribbean
Western Asia
Northern Africa
Oceania
Sub-Saharan Africa
Southern Asia 50
5047
4747.748.2
5249
49
52
53
51
6161
55
55
58
54
5755
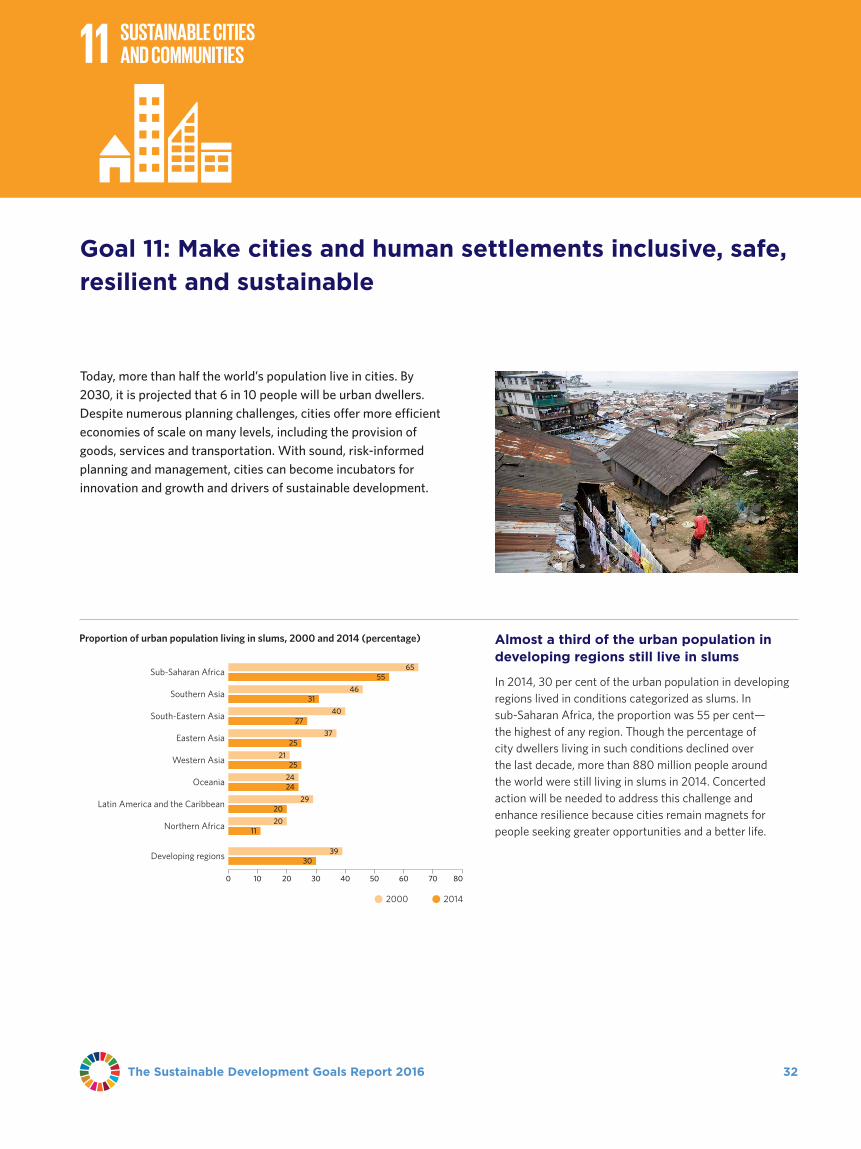
The Sustainable Development Goals Report 2016 32
Almost a third of the urban population in developing regions still live in slums
In 2014, 30 per cent of the urban population in developing regions lived in conditions categorized as slums. In sub-Saharan Africa, the proportion was 55 per cent— the highest of any region. Though the percentage of city dwellers living in such conditions declined over the last decade, more than 880 million people around the world were still living in slums in 2014. Concerted action will be needed to address this challenge and enhance resilience because cities remain magnets for people seeking greater opportunities and a better life.
Today, more than half the world’s population live in cities. By 2030, it is projected that 6 in 10 people will be urban dwellers. Despite numerous planning challenges, cities offer more efficient economies of scale on many levels, including the provision of goods, services and transportation. With sound, risk-informed planning and management, cities can become incubators for innovation and growth and drivers of sustainable development.
Goal 11: Make cities and human settlements inclusive, safe,
resilient and sustainable
Proportion of urban population living in slums, 2000 and 2014 (percentage)
0 10 20 30 40 50 60 70 80
Sub-Saharan Africa 6555
South-Eastern Asia 4027
Southern Asia 4631
Eastern Asia 3725
Western Asia 2125
Latin America and the Caribbean 2029
Oceania 2424
Northern Africa 2011
2000 2014
Developing regions 3930

33 GOAL 11 | Sustainable cities and communities
Nearly three-quarters of countries have implemented or are working to implement national-level urban policies
National policies and regional development plans that take into account the specific needs and characteristics of urban areas are essential to sustainable development. As of 2015, 142 countries were developing national-level urban policies; of these, 82 countries were already in the process of implementation and 23 had reached the monitoring and evaluation stage. The vast majority of these urban policies can be further aligned with SDGs and can be disaggregated by key themes of the sustainability agenda. They are a way to connect national policy to local action.
Cities in every part of the world have dangerously high levels of air pollution
Air pollution is a major environmental risk to health. Globally, ambient (outdoor) air pollution in both cities and rural areas is estimated to have caused 3.7 million premature deaths in 2012. In 2014, about half the urban population worldwide was exposed to air pollution levels at least 2.5 times above the safety standard set by the World Health Organization (WHO). No region had annual average mean concentrations of particulate matter below the maximum level set by WHO of 10 micrograms per cubic metre (μg/m3).
Urban sprawl is found in many cities around the world
In many burgeoning cities around the world, growing populations are moving outwards, far beyond administra-tive boundaries. Urban sprawl is found in many regions: Eastern Asia and Oceania had the highest ratio of land consumption to population growth in the world from 2000 to 2015, developed regions were second. Only Latin America and the Caribbean and Southern and Central Asia saw a ratio of less than 1.0, meaning that cities in these regions became more densely populated. Unfortunately, a low value for this ratio is not necessarily an indication that urban dwellers are faring well because it can indicate a prevalence of overcrowded slums. Unplanned urban sprawl is associated with increased per capita emissions of carbon dioxide and hazardous pollution and often drives housing prices up, all of which hamper sustainable development.
Average ratio of land consumption rate to population growth rate, 1990-2000 and 2000-2015, based on a stratified sample of 194 cities
1990-2000 2000-2015
0.0 0.5 1.0 1.5 2.0 2.5
Latin America and the Caribbean 1.50.9
Sub-Saharan Africa 1.21.3
Southern and Central Asia 0.940.91
South-Eastern Asia 1.41.3
Western Asia and Northern Africa 1.41.5
Developing regions 1.71.5
Eastern Asia and Oceania 2.12.0
Developed regions 2.11.9
World 1.681.74
Average annual mean of particulate matter of 2.5 microns in diameter or smaller (PM2.5) concentration levels in urban areas (μg/m3), 2014
Note: Data reported only for WHO member States.
WHO maximum recommended air pollution level: 10 μg/m3
0 10 20 30 40 50 60 70 80
World
Developed regions
Southern Asia
Northern Africa
Eastern Asia
Western Asia
Sub-Saharan Africa
Caucasus and Central Asia
South-Eastern Asia
Latin America and the Caribbean
Oceania 11
19
73
45
26
31
14
64
39
60
55
Developing regions 52
Proportion and number of countries that are implementing national urban policies by stage of implementation, 2015 (percentage)
Diagnostic (7 countries)
Formulation (21 countries)
Feasibility (9 countries)
Implementation (82 countries)
Monitoring and evaluation (23 countries)
166
5
15
58

The Sustainable Development Goals Report 2016 34
As developing regions industrialized, their use of raw materials grew
The material footprint is an accounting of fossil fuels and other raw materials extracted globally and used in a par-ticular country. It reflects the amount of primary materials required to meet a country’s needs and can be interpreted as an indicator of the material standard of living or level of capitalization of an economy. From 2000 to 2010, the material footprint per GDP of developed regions dropped as a result of greater efficiency in industrial processes. But at 23.6 kilograms per unit of GDP in 2010, it was still substantially higher than the figure for developing regions at 14.5 kilograms per unit of GDP. As developing countries industrialized, the material footprint of the regions as a whole grew over this 10-year period. Non-metallic minerals showed the largest increase, rising from 5.3 to 6.9 kilograms per unit of GDP. This component represents almost half the material footprint of developing regions.
Sustainable growth and development requires minimizing the natural resources and toxic materials used, and the waste and pollutants generated, throughout the entire production and consumption process. Sustainable Development Goal 12 encourages more sustainable consumption and production patterns through various measures, including specific policies and international agreements on the management of materials that are toxic to the environment.
Goal 12: Ensure sustainable consumption and production
patterns
Material footprint per GDP by type of raw material, 2000 and 2010,(kilogram per unit of GDP at constant 2005 US dollars)
0
5
10
15
20
30
25
6.3
6.9
3.1
9.6
5.5
6.4
2.7
9.0
3.2
2.0
1.4
5.3
3.4
2.4
1.7
6.9
2000 2010 2000 2010Developed regions Developing regions
Material footprint (Non-metallic minerals) Material footprint (Fossil fuels)
Material footprint (Metal ores) Material footprint (Biomass)
Note: The sum of the raw material categories may not add up to the total because of rounding.
25.9
23.6
11.8
14.5

35 GOAL 12 | Responsible consumption and production
Almost all countries are party to at least one international environmental agreement on hazardous wastes and other chemicals
International frameworks to achieve environmentally sound management of hazardous wastes, chemicals and persistent organic pollutants have been established by the Basel, Rotterdam and Stockholm conventions. With six exceptions, all Member States of the United Nations are party to at least one of these conventions. The number of parties to these conventions increased significantly from 2005 to 2015, particularly in Africa and Oceania. Currently, there are 183 parties to the Basel Convention, 180 to the Stockholm Convention and 155 to the Rotterdam Convention (including the European Union as a party in all three conventions). Becoming a party to these international agreements brings certain obligations, including the estab-lishment of a contact person to transmit relevant commu-nication. All but one of the parties to the Basel Convention and the majority of parties to the Rotterdam and Stockholm conventions have designated such contacts. However, the number of countries submitting national progress reports, which are also obligatory under the Basel and Stockholm conventions, has been declining since 2009-2010.
Per capita consumption of natural resources declined in developed regions, while increasing in most developing regions
Another measure of the flow or use of materials in individual countries is domestic material consumption, which measures the amount of natural resources used in economic processes. Domestic material consumption declined slightly in developed regions, from 17.5 tons per capita in 2000 to 15.3 tons per capita in 2010. However, it remained 72 per cent higher than the value for developing regions, which stood at 8.9 tons per capita in 2010. Domestic material consumption increased in almost all developing regions over this period, except in sub-Saharan Africa, where it remained relatively stable, and Oceania, where it decreased from 10.7 to 7.7 tons per capita. The dramatic rise in the consumption of raw materials in Asia, particularly Eastern Asia, during this period is primarily due to rapid industrialization.
Domestic material consumption per capita, 2000 and 2010 (tons per capita)
2000 2010
0 5 10 15 20
World
Developing regions
Developed regions
Sub-Saharan Africa
Southern Asia
South-Eastern Asia
Oceania
Northern Africa
Caucasus and Central Asia
Latin American and the Caribbean
Western Asia
Eastern Asia 7.417.0
9.112.2
9.711.6
8.211.5
6.18.6
10.77.7
5.66.9
3.14.1
3.43.6
17.515.3
5.78.9
8.010.1
Note: Domestic material consumption measures the total amount of materials used by an economy. It is defined as the annual quantity of raw materials extracted from the domestic territory, plus all physical imports and minus all physical exports. It includes intermediate and final consumption until released to the environment.
Proportion of parties to international multilateral environmental agreements on hazardous wastes and other chemicals (Basel, Rotterdam and Stockholm conventions), 2005 and 2015 (percentage)
Note: Data for Asia include Caucasus and Central Asia, Eastern, Southern, South-Eastern and Western Asia. Data for Africa include Northern and sub-Saharan Africa.
0
20
40
60
80
100
WorldDevelopingregions
Developedregions
Latin Americaand the
Caribbean
AfricaAsiaOceania
83
4
13
4
10
84
8
13
78
36
29
21
16
11
73
28
16
52
76
10
14
27
34
30
29
36
3627
25
36
9
88
28
34
34
21
43
25 26
27
38
One convention All three conventionsTwo conventions
200
5
2015
200
5
2015
200
5
2015
200
5
2015
200
5
2015
200
5
2015
200
5
2015
200
5
2015

The Sustainable Development Goals Report 2016 36
The Paris Agreement sets the stage for ambitious climate action by all for sustainable development
Carbon emissions have been steadily rising over the past decades, leading to increases in global temperatures. The period from 2011 to 2015 was the hottest on record, with sea ice reaching its lowest level in history and coral bleaching—resulting from increased sea surface temperatures—threatening the world’s coral reefs. The landmark Paris Agreement, signed in April 2016 by 175 Member States, attempts to mitigate climate change and accelerate and intensify actions and investments needed for a sustainable, low-carbon future. Central to the agreement is the need to strengthen the global response to keep global temperatures from rising no more than 2 degrees Celsius above pre-industrial levels and to pursue further efforts to limit the rise to 1.5 degrees Celsius. The Paris Agreement requires parties to identify their “intended nationally determined contributions” (INDCs). Progress on the Paris Agreement will be tracked every five years through a global stocktaking exercise.
Climate change presents the single biggest threat to devel-opment, and its widespread, unprecedented effects dispro-portionately burden the poorest and the most vulnerable. Goal 13 calls for urgent action not only to combat climate change and its impacts, but also to build resilience in respond-ing to climate-related hazards and natural disasters.
Goal 13: Take urgent action to combat climate change
and its impacts
Comparison of global greenhouse gas emission levels in 2025 and 2030 resulting from the implementation of the intended nationally determined contributions (INDCs) and under other scenarios (GtCO2 eq/yr)
2000 2005 2015 2020 2025 2030 2035 2040 2045 2050
Note: For a more detailed chart, please see figure 2 of the updated synthesis report of the United Nations Framework Convention on Climate Change on the aggregate effect of the intended nationally determined contributions, 2 May 2016 (http://unfccc.int/focus/indc_portal/ items/9240.php).
7
0
10
20
30
40
50
60
70
2010
Pre-INDC scenarios
Historical emissions
INDCs
Least-cost 2˚C scenarios1.5˚C scenarios

37 GOAL 13 | Climate action
Eighty-three countries around the world have provisions in place to manage disaster risk
With the rise in natural disasters, countries have begun implementing national and local disaster risk reduction strategies. In 2015, 95 countries voluntarily agreed to a self-assessment on the inclusion of legislative and/or regulatory provisions for managing disaster risk. Among them, 83 countries had such provisions in place. With the aim of reducing underlying disaster risk factors, countries have begun considering and implementing a variety of different mechanisms, including climate change adaptation projects and programmes, envi-ronmental impact assessments, integrated planning, payments for ecosystem services and legislation for the protection of environmentally sensitive areas.
As natural disasters have increased in frequency and intensity, more people have been affected by them
Disasters, many of which are exacerbated by climate change and are increasing in frequency and intensity, impede progress towards sustainable development. While the number of people affected varies greatly from year to year, an average of 83,000 people died and 211 million were affected annually as a result of natural disasters occurring from 2000 to 2013.
Over 70 per cent of parties to the UN Framework Convention on Climate Change included an adaptation component in their plans for climate action
As of 4 April 2016, 189 of the 197 parties to the United Nations Framework Convention on Climate Change had submitted 161 INDCs (the European Commission submitted one joint INDC). Of these, 137 included an adaptation component. Some stressed that adaptation was their main priority because they see the potential impacts of climate change as strongly linked to national development, sustainability and security. Parties referred to virtually every sector and area of the economy in the adaptation component of their INDCs. The top three priority areas were water, agriculture and health, which coincide with the top climate hazards that parties identified—floods, drought and higher temperatures. Many parties also referred to vector- or water-borne diseases as a hazard that will require adaptation.
Number of parties that referred to an area or sector as a priority, as communicated in the adaptation component of the INDCs
0 20 40 60 80 100 120
41Fisheries
49Coastal protection
50Food security
51Disaster risk reduction
53Energy
71Forestry
71Infrastructure
72Ecosystems
87Health
107Agriculture
119Water
Total number of deaths and affected persons resulting from natural disasters worldwide, 2000-2013 (thousands)
0
100,000
200,000
300,000
400,000
500,000
600,000
700,000
0
50
100
150
200
250
300
350
2000 2002 2004 2006 2008 2010 2013
Total deaths (left axis) Total affected (right axis)
2012
Number of countries with legislative and/or regulatory provisions for managing disaster risk, 2015
0 20 40 60 80 100
83World
30Africa
18Asia
24Europe
8Latin America and the Caribbean
3Oceania

The Sustainable Development Goals Report 2016 38
The downward trend in sustainable fish stocks has slowed and appears to have stabilized
Fisheries contribute significantly to global food security, livelihoods and the economy. However, if not sustainably managed, fishing can damage fish habitats, reduce biodiversity and impair the functioning of ecosystems with negative repercussions for sustainable social and economic development. To achieve a healthy balance, fish stocks must be maintained within biologically sustainable limits—at or above the abundance level that can produce the maximum sustainable yield. Based on an analysis of assessed stocks, the proportion of world marine fish stocks within biologically sustainable levels declined from 90 per cent in 1974 to 69 per cent in 2013 and appears to have stabilized over the last few years.
Oceans, seas and other marine resources are essential to human well-being and social and economic development worldwide. Their conservation and sustainable use are central to achieving the 2030 Agenda, especially for small island developing States. Marine resources are particularly important for people living in coastal communities, who represented 37 per cent of the world population in 2010. Oceans provide livelihoods, subsistence and benefits from fisheries, tourism and other sectors. They also help regulate the global ecosystem by absorbing heat and carbon dioxide (CO2) from the atmosphere. However, oceans and coastal areas are extremely vulnerable to environmental
degradation, overfishing, climate change and pollution.
Goal 14: Conserve and sustainably use the oceans, seas
and marine resources for sustainable development
Proportion of fish stocks within biologically sustainable limits, 1974-2013 (percentage)
50
55
60
65
70
90
95
85
80
75
1974 1979 1984 1989 1994 1999 2004 2009 2013
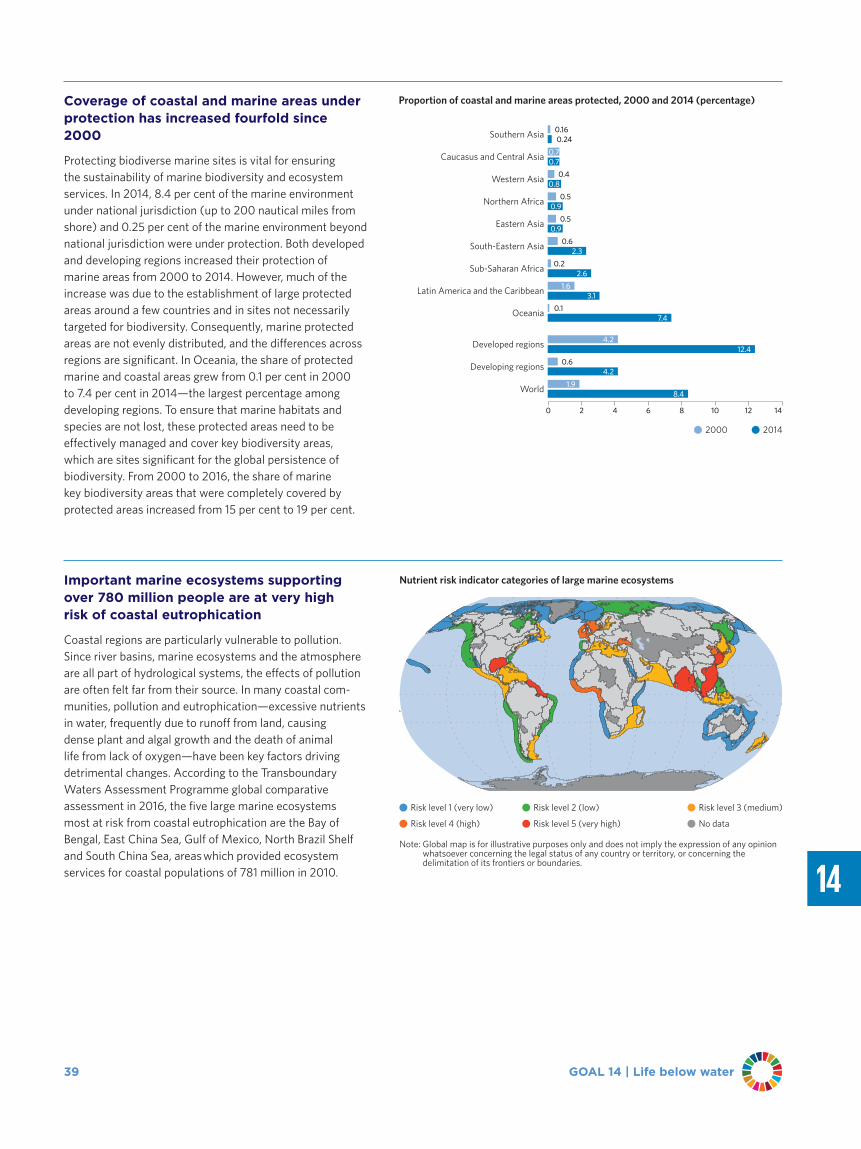
39 GOAL 14 | Life below water
Important marine ecosystems supporting over 780 million people are at very high risk of coastal eutrophication
Coastal regions are particularly vulnerable to pollution. Since river basins, marine ecosystems and the atmosphere are all part of hydrological systems, the effects of pollution are often felt far from their source. In many coastal com-munities, pollution and eutrophication—excessive nutrients in water, frequently due to runoff from land, causing dense plant and algal growth and the death of animal life from lack of oxygen—have been key factors driving detrimental changes. According to the Transboundary Waters Assessment Programme global comparative assessment in 2016, the five large marine ecosystems most at risk from coastal eutrophication are the Bay of Bengal, East China Sea, Gulf of Mexico, North Brazil Shelf and South China Sea, areas which provided ecosystem services for coastal populations of 781 million in 2010.
Coverage of coastal and marine areas under protection has increased fourfold since 2000
Protecting biodiverse marine sites is vital for ensuring the sustainability of marine biodiversity and ecosystem services. In 2014, 8.4 per cent of the marine environment under national jurisdiction (up to 200 nautical miles from shore) and 0.25 per cent of the marine environment beyond national jurisdiction were under protection. Both developed and developing regions increased their protection of marine areas from 2000 to 2014. However, much of the increase was due to the establishment of large protected areas around a few countries and in sites not necessarily targeted for biodiversity. Consequently, marine protected areas are not evenly distributed, and the differences across regions are significant. In Oceania, the share of protected marine and coastal areas grew from 0.1 per cent in 2000 to 7.4 per cent in 2014—the largest percentage among developing regions. To ensure that marine habitats and species are not lost, these protected areas need to be effectively managed and cover key biodiversity areas, which are sites significant for the global persistence of biodiversity. From 2000 to 2016, the share of marine key biodiversity areas that were completely covered by protected areas increased from 15 per cent to 19 per cent.
Proportion of coastal and marine areas protected, 2000 and 2014 (percentage)
2000 2014
0 2 4 6 8 10 12 14
Southern Asia 0.160.24
Caucasus and Central Asia 0.70.7
Western Asia 0.40.8
Northern Africa 0.50.9
Eastern Asia 0.50.9
South-Eastern Asia 0.62.3
Sub-Saharan Africa 0.22.6
Latin America and the Caribbean 1.63.1
Oceania 0.17.4
Developed regions 4.212.4
Developing regions 0.64.2
World 1.98.4
Nutrient risk indicator categories of large marine ecosystems
Note: Global map is for illustrative purposes only and does not imply the expression of any opinion whatsoever concerning the legal status of any country or territory, or concerning the delimitation of its frontiers or boundaries.
Risk level 2 (low) Risk level 3 (medium)Risk level 1 (very low)
No dataRisk level 4 (high) Risk level 5 (very high)

The Sustainable Development Goals Report 2016 40
Net forest loss has decreased by more than half since the 1990s, but the loss of forests continues
Between 1990 and 2015, the world’s forest area diminished from 31.7 per cent of the world’s total land mass to 30.7 per cent. This loss was mainly due to the conversion of forests to other uses, such as agriculture and infrastruc-ture development. Meanwhile, other areas returned to forests through planting, landscape restoration or natural expansion. As a result of these ongoing processes and efforts to slow deforestation, the global net loss in forest area declined from 7.3 million hectares per year in the 1990s to 3.3 million hectares per year during the period 2010-2015. Progress across regions is mixed: Latin America and the Caribbean, sub-Saharan Africa and South-Eastern Asia accounted for the largest losses in forest area, whereas Eastern Asia accounted for the largest gains.
Preserving diverse forms of life on land requires targeted efforts to protect, restore and promote the conservation and sustainable use of terrestrial and other ecosystems. Goal 15 focuses specifically on managing forests sustainably, halting and reversing land and natural habitat degradation, successfully combating desertification and stopping biodiversity loss. All these efforts combined aim to ensure that the benefits of land-based ecosystems, including sustainable livelihoods, will be enjoyed for generations to come.
Goal 15: Protect, restore and promote sustainable use of
terrestrial ecosystems, sustainably manage forests, combat
desertification, and halt and reverse land degradation and
halt biodiversity loss
Annual net change in forest area, 1990-2000 and 2010-2015 (thousands of hectares)
1990-2000 2010-2015
-10,000 -8,000 -6,000 -4,000 -2,000 0 2,000
Developed regions
Eastern Asia
Southern Asia
Western Asia
Northern Africa
Caucasus and Central Asia
Oceania
Sub-Saharan Africa -3,553-2,846
Latin America and the Caribbean -4,455-2,178
South-Eastern Asia -2,107-767
Developing regions -8,205-4,227
World -7,267-3,308
3-4
16
168
10
35136
70104
1,7691,310
938919

41 GOAL 15 | Life on land
Illegal trade in wildlife is a global phenomenon with distinct regional variations
The list of species under international protection con-tinues to grow. At the same time, conservation efforts are being thwarted by the poaching and trafficking of wildlife, crimes that are occurring worldwide. Since 1999, at least 7,000 species of animals and plants have been reported in illegal trade affecting 120 countries. Trafficking in wildlife affects all regions of the world, whether as a source, transit location or destination. Trafficking in birds is most common in Central and South America, mammals in Asia and Africa, reptiles in Europe and North America, and corals in Oceania.
In every region the survival of species is increasingly threatened
As of 2015, over 23,000 species of plants, fungi and animals were known to face a high probability of extinction. According to the International Union for Conservation of Nature’s Red List Index, amphibians are declining most rapidly in Latin America and the Caribbean, primarily owing to the chytrid fungal disease, one of numerous wildlife diseases on the rise worldwide. The greatest increases in extinction risk for birds and mammals have occurred in South-Eastern Asia, mainly driven by the conversion of lowland forests. On average, the extinction risk for coral species is increasing most rapidly, while cycad species (an ancient group of cone-producing plants) are the most severely threatened species group assessed. However, the loss of species is not inevitable: extinction risks for vertebrate species have been reversed in five small island developing States (Cook Islands, Fiji, Mauritius, Seychelles and Tonga) as a result of conservation actions over the last several decades.
Key biodiversity areas are increasingly covered by protected areas
In 2014, 15.2 per cent of the world’s terrestrial and fresh-water environments were covered by protected areas, which are recognized, dedicated and managed to achieve the long-term conservation of nature. A fundamental measure of their efficacy is the extent to which they include places that contribute significantly to the maintenance of global biodiversity, such as key biodiversity areas (KBAs). Globally, the percentage of terrestrial, inland freshwater and mountain KBAs covered by protected areas has increased from 16.5 per cent to 19.3 per cent, 13.8 per cent to 16.6 per cent, and 18.1 per cent to 20.1 per cent, respectively, from 2000 to 2016. Safeguarding KBAs around the globe in all three ecosystems is critically important for maintaining genetic, species, and ecosystem diversity, and in turn the benefits they provide to people.
Proportion of important sites for biodiversity completely covered by protected areas, by ecosystem type (terrestrial, inland freshwater and mountain), 2000-2016 (percentage)
Developing regions WorldDeveloped regions
0
10
20
30
2016
2010
200
5
200
0
2016
2010
200
5
200
0
2016
2010
200
5
200
0
Note: Ecosystem types are not mutually exclusive.
Terrestrial Inland freshwater Mountain
Red List Index* of species survival, 1993-2016
* The Red List Index for each region is based on the aggregate survival probability (the inverse of extinction risk) for all birds, mammals, amphibians, corals and cycads occurring within the region, weighted by the fraction of each species’ distribution within the region. Values range from 1.0, which indicates a minimum contribution to the global index (i.e., all species in the region are classified as Least Concern) to zero, which indicates the maximum possible contribution to the global index (i.e., all species in the region are classified as Extinct).
1993 2016
0.6
0.8
1.0
World
Developing re
gions
Developed re
gions
Caucasu
s and C
entral A
sia
Northern
Afri
ca
Weste
rn A
sia
Oceania
Sub-Sahara
n Afri
ca
Eastern
Asia
Latin
Am
erica and th
e Carib
bean
South-E
astern
Asia
Southern
Asia
0.68
0.720.74 0.75 0.75
0.800.82
0.86
0.91
0.82
0.730.74
Bett
erW
orse
0.77
0.83
0.79
0.83 0.82
0.88 0.88
0.92 0.92
0.88
0.810.82
Note: Share of all seizure incidents in the World Wildlife Seizures database, which contains over 164,000 seizures from 120 countries. Regional groupings are according to the United Nations standard geographical regions for statistical use (M49).
Share of seizure incidents by taxonomic class, 1999-2015 (percentage)
0
20
40
60
80
100
EuropeAsiaNorthernAmerica
AfricaCentraland
South America
Australiaand
New Zealand
Corals Boney fishReptiles Mammals OtherBirds

The Sustainable Development Goals Report 2016 42
Intentional homicide rates vary widely across regions
Worldwide, the number of victims of intentional homicide per 100,000 people was estimated at between 4.6 and 6.8 in 2014. However, the intentional homicide rate in developing regions was twice that of developed regions, and in Latin America and the Caribbean it was four times the world average.
Central to the 2030 Agenda for Sustainable Development is the need to promote peaceful and inclusive societies based on respect for human rights, the rule of law and transparent, effective and account-able institutions. A number of regions have enjoyed increased and sustained levels of peace and security in recent decades. But many countries still face protracted violence and armed conflict, and far too many people are poorly supported by weak institutions and lack access to justice, information and other fundamental freedoms. Efforts are under way to make national and international institutions more effective, inclusive and transparent. Today, more than half the world has internationally recognized human rights institutions. However, significant challenges remain, including lack of data on various forms of violence against children and other vulnerable groups, access to justice and public access to information.
Goal 16: Promote peaceful and inclusive societies for
sustainable development, provide access to justice for all
and build effective, accountable and inclusive institutions
at all levels
Number of victims of intentional homicide per 100,000 population, 2014 or latest year
0 5 10 15 20 25 30
Latin America and the Caribbean Sub-Saharan Africa
Oceania Western Asia
Caucasus and Central Asia Southern Asia
South-Eastern Asia Northern Africa
Eastern Asia
Developing regionsWorld
22.5
9.5
8.2
5.0
3.9
3.7
2.9
2.4
0.9
5.9
5.3
Point estimate Range
Developed regions 2.7

43 GOAL 16 | Peace, justice and strong institutions
Birth registration is the first step in securing recognition before the law, yet one in four children are denied this fundamental right
Registering children at birth is the first step in securing recognition before the law and safeguarding individual rights and access to justice and social services. However, the births of more than one in four children under age 5 worldwide go unrecorded. In sub-Saharan Africa, the share is over half (54 per cent). Globally, children living in urban areas are around 1.5 times more likely to be registered than their rural counterparts. And in most regions, birth registration rates tend to be highest among the richest 20 per cent of the population.
Thirty per cent of prisoners worldwide, two-thirds of them in developing countries, are being held without being sentenced
Worldwide, the proportion of people held in detention without being sentenced for a crime decreased only slightly over the last decade—from 32 per cent of total detainees in 2003-2005 to 30 per cent in 2012-2014. The figure for developing regions has on average been higher than that for developed regions. The highest rate of unsentenced detain-ees was in Southern Asia, where, despite recent progress, about two out of three prisoners remained unsentenced in 2012-2014. In Latin America and the Caribbean, the region with the second highest percentage, the share of persons held in detention without being sentenced remained practically unchanged over the last decade, at 43 per cent.
Children, a majority of them girls, represent almost 30 per cent of victims of human trafficking worldwide
Various forms of violence against children persist, including human trafficking and sexual violence. Globally, the share of girls and boys among victims of human trafficking peaked in 2011, at 21 per cent and 13 per cent, respectively, of cases detected by authorities that year. Girls who are victims of human trafficking are often subjected to sexual exploitation, forced marriage and/or domestic servitude. Underreporting and lack of comparable data remain stubborn obstacles to understanding the full extent of sexual violence against children. Survey data from 31 low- and middle-income countries suggest that the proportion of women aged 18 to 29 years who experienced sexual violence for the first time before age 18 may be as high as 16 per cent.
Unsentenced prisoners as a percentage of total prisoners, 2003-2005 and 2012-2014
0 10 20 30 40 50 60 70 80
World
Developing regions
Developed regions
Caucasus and Central Asia
Western Asia
Eastern Asia
Northern Africa
South-Eastern Asia
Oceania
Sub-Saharan Africa
Latin America and the Caribbean
Southern Asia
2003-2005 2012-2014
7564
4346
43
4035
33
3245
42
31
54
29
16
2318
21
29
1949
4232
30
Proportion of children among detected victims of trafficking in persons worldwide, by sex, 2004-2014 (percentage)
Girls Boys
0
5
10
15
20
25
30
35
2014(preliminary)
2011200920062004
3
10
9
13
10
17
13
21 21
8
Estimated proportion of children under 5 whose births were registered, 2010-2015 (percentage)
0 20 40 60 80 100
World
Developed regions
Northern Africa
Latin America and the Caribbean
Western Asia
South-Eastern Asia
Southern Asia
Sub-Saharan Africa 46
63
79
85
94
99
100
71
Note: Estimates are based on data from 144 countries covering 92 per cent of the global population of children under age 5. Data coverage was insufficient to calculate regional estimates for Eastern Asia, Oceania and the Caucasus and Central Asia.

The Sustainable Development Goals Report 2016 44
Official development assistance has continued to grow, although aid to the poorest countries has stagnated
In 2015, official development assistance (ODA) from mem-ber countries of the Development Assistance Committee (DAC) of the Organisation for Economic Co-operation and Development (OECD) totalled 131.6 billion US dollars. Taking into account inflation and the rise in the value of the dollar in 2015, this was 6.9 per cent higher in real terms than in 2014, and represented the highest level ever reached. Total ODA from DAC countries as a share of their gross national income (GNI) was 0.30 per cent, on par with 2014. Most of the increase was due to higher expenditures for refugee costs. However, even if those costs are excluded, ODA still rose by 1.7 per cent. In 2015, seven countries met the United Nations target for ODA of 0.7 per cent of GNI: Denmark, Luxembourg, the Netherlands, Norway, Sweden, the United Arab Emirates and the United Kingdom.
Achieving the ambitious targets of the 2030 Agenda requires a revitalized and enhanced global partnership that brings together Governments, civil society, the private sector, the United nations system and other actors, mobilizing all available resources. Meeting implementation targets, including the raising of necessary funds, is key to realizing the Agenda, as is the full implementation of the Addis Ababa Action Agenda. Increasing support to developing countries, in particular the least developed countries, landlocked developing countries and small island developing States, is fundamental to equitable progress for all.
Goal 17: Strengthen the means of implementation
and revitalize the Global Partnership for Sustainable
Development
Net official development assistance from OECD-DAC countries (billions of constant 2014 US dollars) and as a proportion of donors’ gross national income (percentage), 2000-2015
0
40
80
120
160
2015(preliminary)
201220092006200320000.00
0.09
0.18
0.26
0.35
Billi
ons
of c
onst
ant 2
014
US
dolla
rs
OD
A/G
NI
ODA/GNI (right axis)
LDCs ODA/GNI (right axis)
Total ODA (left axis)
Total ODA to LDCs (left axis)

45 GOAL 17 | Partnerships for the Goals
High-speed Internet remains out of reach for the vast majority of people living in the least developed countries
Fixed-broadband connections remain largely unaffordable and unavailable across large swathes of the population in developing regions, highlighting the vast digital divide in access to high-speed, high-capacity Internet services. In 2015, fixed-broadband penetration reached 29 per cent of the population in developed regions, but only 7.1 per cent in developing regions and 0.5 per cent in the least developed countries. Furthermore, while speeds of over 10 megabits per second were common in developed regions, connections in most developing regions did not exceed 2 megabits per second. Similarly, while Internet access has grown substantially over the last decade, only one-third of the population in developing countries and 1 in 10 people in LDCs were online in 2015, compared with about 80 per cent of the population in developed countries. There is also an important gender digital divide: globally, the Internet user penetration rate was about 11 per cent lower for women than for men.
Debt service burdens declined substantially from 2000 to 2012
The ratio of external debt service to exports was below 6 per cent for almost all developing regions in 2012, which represents a substantial decline from comparable ratios in 2000. Increased export earnings, enhanced debt management and attractive borrowing conditions in international markets contributed to this improvement. However, for the poorest countries, the most important contributing factor was outright debt relief: 36 of the 39 countries eligible for the Heavily Indebted Poor Country Initiative completed the process and received debt relief of around 136 billion US dollars from official creditors.
Debt service as a proportion of total exports of goods and services, 2000 and 2012 (percentage)
2000 2012
0 5 10 15 20
Small island developing States
Landlocked developing countries
Least developed countries
Developing regions
Eastern Asia
Oceania
Caucasus and Central Asia
South-Eastern Asia
Sub-Saharan Africa
Northern Africa
Southern Asia
Western Asia
Latin America and the Caribbean 19.86.5
18.65.7
15.4
15.04.4
9.24.4
3.86.4
2.38.6
2.16.0
1.54.9
11.72.6
12.85.4
8.53.0
9.47.0
0.4
Fixed-broadband Internet subscriptions per 100 inhabitants, 2010 and 2015
2010 2015
0 5 10 15 20 25 30
World
Developed regions
Developing regions
Least developed countries0.1
0.5
4.1
7.1
23.5
29.0
7.6
10.8

The Sustainable Development Goals Report 2016 46
While tariffs on agricultural products from the least developed countries have declined, those on clothing and textiles remain high
Average tariffs imposed by developed countries on imports from the least developed countries declined steadily for all product groups until 2005. After that year, the average tariff for agricultural products continued to decline, reaching less than 1 per cent in 2014. Tariff rates are still high for clothing and textiles exports from the least developed countries, owing to the exclusion of some large Asian exporters from certain preferential tariffs.
National statistical plans need to be updated in many countries
A national statistical plan is key to strengthening a nation's statistical system. The requirements of the MDG indicators have gone a long way towards fostering stronger national statistical plans and systems. The number of countries with a national statistical plan increased in some regions and country groups between 2010 and 2015, including the least developed countries and landlocked developing countries. However, many are still without a plan. The overall number of small island developing States with a statistical plan actually declined from nine to seven over this period, as the time period for some existing plans expired.
Average tariffs levied by developed countries on key products exported by the least developed countries, 2000, 2005, 2010 and 2014 (percentage)
0
1
2
3
4
5
6
7
8
2014201020052000
3.6
7.8
4.1
3.0
6.4
3.2
1.0
6.7
3.2
0.9
6.5
3.2
Clothing TextilesAgriculture
Number of countries with a national statistical plan, 2010 and 2015
0
10
20
30
40
50
60
21
31
2010
17
31
2015Least developed countries
16
13
20
8
2010 2015Landlocked developing
countries
15
9 7
17
2010 2015Small island
developing States
Countries with an active planCountries without a plan
Developing countries’ share of global exports has increased substantially, but the share of LDC exports remains small
The share of merchandise exports from the least developed countries in global merchandise exports nearly doubled over the period 2000-2014. Still, it represented only a small fraction of global exports in 2014, at 1.1 per cent. For developing regions more generally, merchandise exports grew by nearly 40 per cent and amounted to almost 45 per cent of global exports in 2014. In comparison, service exports from developing regions lagged behind, accounting for about 30 per cent of total exports. The key driver of export growth during this period was a massive rise in the price of fuel, ores and metals, reflecting a high demand in developing countries, notably China.
Share of global merchandise and service exports for developing regions and the least developed countries, 2000-2014 (percentage)
0
10
20
30
40
50
2014201020052000
0.0
0.4
0.8
1.2
2014201020052000
Developing regions
Least developed countries
31.9
36.3
42.144.6
23.1 23.4
27.929.9
0.56
0.45
0.78
0.46
0.62
1.06
0.77
1.08
Merchandise exports Service exports

47 GOAL 17 | Partnerships for the Goals
In 2013, the least developed countries received more than 80 per cent of ODA targeted for capacity-building in statistics
Financial support to build national capacity in statistics amounted to 325 million US dollars in 2013 compared with 379 million US dollars in 2010, a decline of 14 per cent. However, assistance to the least developed countries tripled during this period, reaching 265 million US dollars. This means that 82 per cent of all financial support for statistical capacity-building went to the least developed countries in 2013. South-Eastern Asia, Western Asia and sub-Saharan Africa were the biggest beneficiaries of this shift in funding priorities. Despite a growing awareness of the importance of statistics for evidence-based policy-making and development, the share of ODA dedicated to statistics hovered at around 0.3 per cent between 2010 and 2013.
Death registration, a crucial source of data on health-related sustainable development indicators, remains far from universal
Over the period 2010-2014, death registration data were available for 145 out of 230 countries and territories. Of these, 128 had data that were at least 75 per cent complete. Death registration coverage is lowest in Africa and Asia. Information on deaths, especially when it is complete and disaggregated, is key to producing a number of basic health statistics and indicators.
Population and housing censuses are still not conducted in all countries
Population and housing censuses are an important source of disaggregated data needed to formulate, implement and monitor development policies. During the 10-year period from 2006 to 2015, 96 per cent of countries in developed regions conducted at least one population and housing census. The share in developing regions as a whole was 88 per cent, dropping to 67 per cent and 69 per cent, respectively, in Southern Asia and Western Asia.
Total official development assistance dedicated to statistical capacity-building activities in developing regions, 2010 and 2013 (millions of US dollars)
2010 2013
0 50 100 150 200 250 300
Least developed countries
Sub-Saharan Africa
Southern Asia
South-Eastern Asia
Western Asia
Latin America and the Caribbean
Caucasus and Central Asia
Oceania
Eastern Asia
Northern Africa 2.50.21.3
0.32.9
1.110.4
6.9102.5
31.8
7.97.8
58.814.4
124.780.1
75.1120.6
81.3264.7
Small island developing States 6.64.1
Landlocked developing countries 53.799.8
Proportion of countries that conducted at least one population and housing census over the period 2006-2015 (percentage)
0 20 40 60 80 100
World
Developing regions
Developed regions
Oceania
Eastern Asia
South-Eastern Asia
Latin America and the Caribbean
Caucasus and Central Asia
Sub-Saharan Africa
Northern Africa
Western Asia
Southern Asia 67
69
83
86
88
91
100
100
100
96
88
90
Number of countries with death registration data that are at least 75 per cent complete, 2010-2014
0 10 20 30 40 50 60
Africa 9
Oceania 10
Asia 24
Latin America and the Caribbean 29
Developed regions 56

The Sustainable Development Goals Report 2016 48
Young men face the highest risk of becoming murder victims and suspected perpetrators
Young people are overrepresented among direct and indirect victims of violence. Some 200,000 homicides each year—43 per cent of all homicides globally—involve children and adults aged 10 to 29 years. Young men have the highest risk of becoming homicide victims and the highest rates, by far, of being suspected hom-icide perpetrators. Children are among those most affected by human trafficking, and in several regions they make up the majority of trafficking victims.
Young people also face other big challenges. In 2015, the global youth unemployment rate (among people aged 15 to 24) was 15 per cent—more than three times the rate for adults (4.6 per cent). In Northern Africa and Western Asia, the youth unemployment rate reached 46 per cent and 31 per cent, respectively.
In committing to the realization of the 2030 Agenda for Sustainable Development, Member States recognized that the dignity of the individual is fundamental and that the Agenda’s Goals and targets should be met for all nations and people and for all segments of society. Furthermore, they endeavoured to reach first those who are furthest behind.
Ensuring that these commitments are translated into effective action requires a precise understanding of target populations. However, the disaggregated data needed to address all vulnerable groups— including children, youth, persons with disabilities, people living with HIV, older persons, indigenous peoples, refugees, internally dis-placed persons and migrants—as specified in the 2030 Agenda, are sparse. Few of the current indicators, for example, are able to shed light on the particular situations of migrants, refugees, older persons, persons with disabilities, minorities and indigenous peoples.
Even from the limited data currently available, however, it is clear that the benefits of development are not equally shared. The fol-lowing examples show how data broken down by age, sex, income level and location of residence can highlight significant differences.
Leaving no one behind
Homicide victims and perpetrators per 100,000 people by sex and age, 2014*
Women (66 countries)Men (66 countries)
0-17 30-4418-24 45-5925-29
02468
1012141618
20
Men (36 countries) Women (36 countries)
0-14 45-5915-29 60+30-44
60+
* Data refer to 2014 or latest year available.
Homicide victims per 100,000 people by age
Homicide perpetrators per 100,000 people by age
0.6
11.6 11.3
5.43.7 3.0 2.5 3.30.5 1.2
1.4
18.5
13.0
6.4
2.81.5
0.11.6 1.4
0.10.40.9
02468
1012141618
20
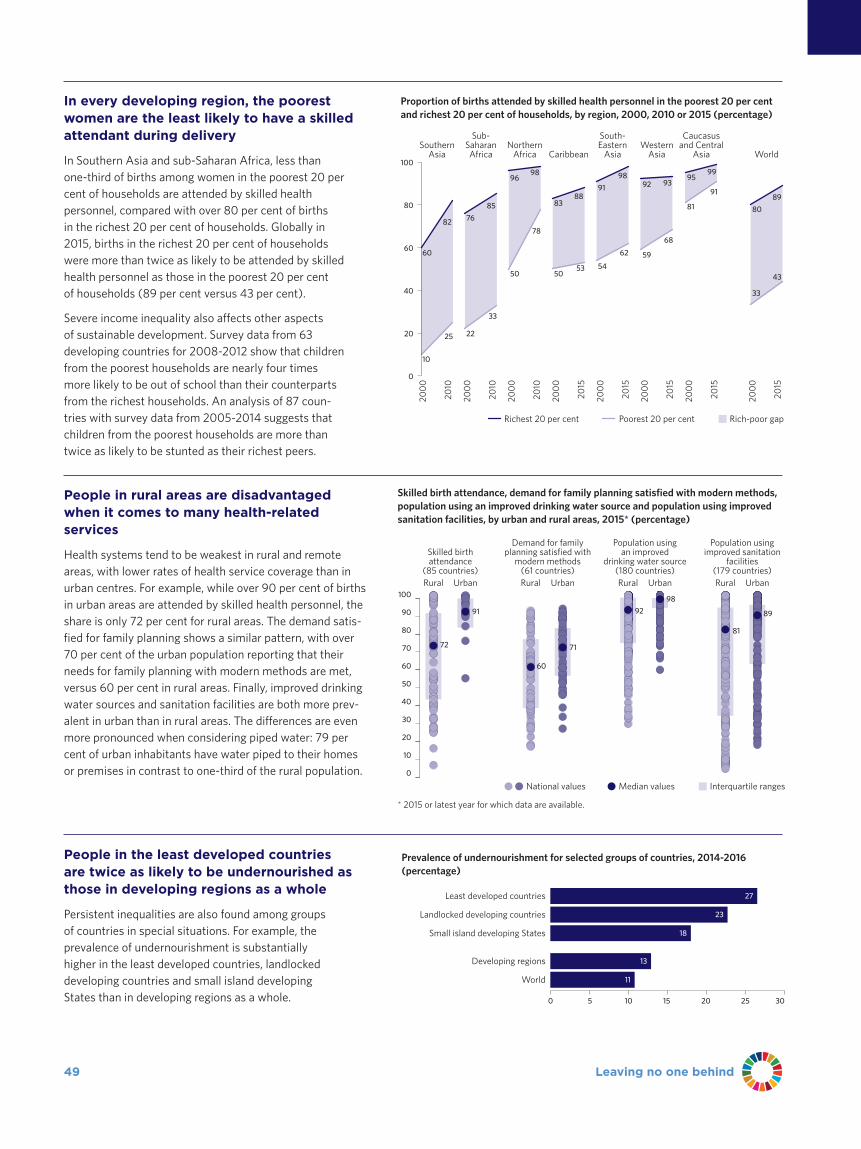
49 Leaving no one behind
People in the least developed countries are twice as likely to be undernourished as those in developing regions as a whole
Persistent inequalities are also found among groups of countries in special situations. For example, the prevalence of undernourishment is substantially higher in the least developed countries, landlocked developing countries and small island developing States than in developing regions as a whole.
People in rural areas are disadvantaged when it comes to many health-related services
Health systems tend to be weakest in rural and remote areas, with lower rates of health service coverage than in urban centres. For example, while over 90 per cent of births in urban areas are attended by skilled health personnel, the share is only 72 per cent for rural areas. The demand satis-fied for family planning shows a similar pattern, with over 70 per cent of the urban population reporting that their needs for family planning with modern methods are met, versus 60 per cent in rural areas. Finally, improved drinking water sources and sanitation facilities are both more prev-alent in urban than in rural areas. The differences are even more pronounced when considering piped water: 79 per cent of urban inhabitants have water piped to their homes or premises in contrast to one-third of the rural population.
In every developing region, the poorest women are the least likely to have a skilled attendant during delivery
In Southern Asia and sub-Saharan Africa, less than one-third of births among women in the poorest 20 per cent of households are attended by skilled health personnel, compared with over 80 per cent of births in the richest 20 per cent of households. Globally in 2015, births in the richest 20 per cent of households were more than twice as likely to be attended by skilled health personnel as those in the poorest 20 per cent of households (89 per cent versus 43 per cent).
Severe income inequality also affects other aspects of sustainable development. Survey data from 63 developing countries for 2008-2012 show that children from the poorest households are nearly four times more likely to be out of school than their counterparts from the richest households. An analysis of 87 coun-tries with survey data from 2005-2014 suggests that children from the poorest households are more than twice as likely to be stunted as their richest peers.
Prevalence of undernourishment for selected groups of countries, 2014-2016 (percentage)
0 5 10 15 20 25 30
World
Developing regions
Small island developing States
Landlocked developing countries
Least developed countries 27
23
18
13
11
Proportion of births attended by skilled health personnel in the poorest 20 per cent and richest 20 per cent of households, by region, 2000, 2010 or 2015 (percentage)
200
0
2015
200
0
2015
200
0
2015
200
0
2010
200
0
2010
200
0
2015
200
0
2010
SouthernAsia
Sub-SaharanAfrica
NorthernAfrica Caribbean
South-Eastern
AsiaWestern
Asia
Caucasusand Central
Asia
60
82
10
25
76
85
22
33
9698
50
78
8388
5053
91
98
54
62
92 93
59
68
9599
81
91
0
20
40
60
80
100
Richest 20 per cent Poorest 20 per cent Rich-poor gap
200
0
2015
World
80
89
33
43
Skilled birth attendance, demand for family planning satisfied with modern methods, population using an improved drinking water source and population using improved sanitation facilities, by urban and rural areas, 2015* (percentage)
0
10
20
30
40
50
60
70
80
90
100Rural Urban
Skilled birthattendance
(85 countries)Rural Urban
Demand for familyplanning satisfied with
modern methods(61 countries)
Rural Urban
Population usingan improved
drinking water source(180 countries)
Rural Urban
Population usingimproved sanitation
facilities(179 countries)
72
91
60
71
92
98
81
89
National values Median values Interquartile ranges
* 2015 or latest year for which data are available.

The Sustainable Development Goals Report 2016 50
A note to the reader
Global indicator framework for the follow-up and review of the SDGs
The information presented in this report is based on the latest available data as of May 2016 on selected indicators of the global SDG framework. The indicators presented are those for which there are sufficient data available to provide an overview at the regional and global levels. The global indicator framework1 was devel-oped by the Inter-Agency and Expert Group on SDG Indicators (IAEG-SDGs), and agreed to as a practical starting point, at the forty-seventh session of the United Nations Statistical Commission in March 2016. This set of indicators is intended for the review of
progress at the global level. The selection of the indicators in this report does not intend to represent a selection of the targets based on their importance, as all Goals and targets are equally important and will need to be addressed by the appropriate indicators.
The composition of regions and subregions in this report is based on United Nations geographical divisions with some modifications necessary to create, to the extent possible, groups of countries for which a meaningful analysis could be carried out.2
Data sources and the basis for this analysis
For most of the indicators presented in this report, values represent regional and/or subregional aggregates. In general, the figures are weighted averages of country data, using the population of refer-ence as a weight. They are calculated from national data collected by international agencies, based on their respective mandates and specialized expertise, from national statistical systems. The national data provided to the international statistical system are often adjusted for international comparability and, where lacking, are estimated. As decided by the Statistical Commission and in accordance with United Nations Economic and Social Council resolution 2006/6, estimates used for the compilation of global indicators are to be produced in full consultation with national
statistical authorities. A database of available global, regional and country data and metadata for the SDG indicators accom-panying this report is being maintained by the United Nations Statistics Division and is available at http://unstats.un.org/sdgs.
Although the aggregate figures presented are a convenient way to track progress, the situation of individual countries within a given region may vary significantly from regional averages. Presenting aggregate figures for all regions also obscures another reality: the lack in many parts of the world of adequate data to assess national trends and to inform and monitor the implementation of development policies.
Improving data quality and availability
Quality data are vital for Governments, international organiza-tions, civil society, the private sector and the general public to make informed decisions and to ensure an accurate review of the implementation of the 2030 Agenda. That said, tracking progress on the SDGs requires the collection, processing, analysis and dissemination of an unprecedented amount of data and statistics at subnational, national, regional and global levels, including those derived from official statistical systems and from new and innovative data sources.
Many national statistical systems across the globe face serious challenges in this regard. As a result, accurate and timely information about certain aspects of people’s lives are unknown, numerous groups and individuals remain “invisible”, and many development challenges are still poorly understood. In resolution 70/1, Member States recognized the crucial role of strengthened data collection and capacity-building and committed to addressing the data gap (paragraph 57).
Where possible, global monitoring should be based on comparable and standardized national data obtained through
well-established reporting mechanisms from countries to the international statistical system. Such mechanisms can be improved by strengthening the coordination function of national statistical offices and/or other national institutions. To fill data gaps and improve international comparability, countries will need to adopt internationally agreed upon standards, while the international statistical community will need to work closely with development partners and other stakeholders to strengthen national statistical capacities and improve reporting mechanisms. International and regional organizations and regional mecha-nisms play a significant role in facilitating these processes.
The success of these global initiatives will require capacity-building efforts and the mobilization of resources. New data sources and technologies for data collection and for the integration of different sources of data will need to be explored, including through partnerships with civil society, the private sector and academia. The integration of geospatial information and statistical data will be particularly important for the production of a number of indicators.
1 The complete list of indicators is presented in Annex IV of the Report of the Inter-agency and Expert Group on Sustainable Development Goal Indicators (E/CN.3/2016/2/Rev.1), http://unstats.un.org/unsd/statcom/47th-session/documents/2016-2-IAEG-SDGs-Rev1-E.pdf.
2 The composition of these subregions is shown in the next section, “Regional groupings”.

51
Regional groupings
Developed regionsNorthern AfricaSub-Saharan AfricaSouth-Eastern AsiaEastern AsiaSouthern AsiaWestern AsiaCaucasus and Central AsiaOceaniaLatin America and the Caribbean
This report presents data for the world as a whole and for various country groupings. These are classified as “developing” regions and “developed” regions.3 The developing regions are further broken down into the subregions shown on the map above. These regional groupings are based on United Nations geographical divisions, with some modifications necessary to create, to the extent possible, groups of countries for which a meaningful analysis can be carried out. A complete list of countries included in each region and subregion is available at http://unstats.un.org/sdgs.
The designations employed and the presentation of the material in this publication do not imply the expression of any opinion whatso-ever on the part of the Secretariat of the United Nations concerning the legal status of any country, territory, city or area of its author-ities, or concerning the delimitation of its frontiers or boundaries.
3 Because there is no established convention for the designation of “developed” and “developing” countries or areas in the United Nations system, this distinction is made for the purposes of statistical analysis only.

The Sustainable Development Goals Report 2016 52
Photo credits:
Cover © UNICEF/Yarim Shamsan
Page 12 © The World Bank/Stanislas Fradelizi
Page 14 © UNICEF/Jiro Ose
Page 16 © UNDP Picture This/Jean-François Mousseau
Page 18 © UNICEF/Giacomo Pirozzi
Page 20 © UNICEF/Susan Markisz
Page 22 © The World Bank/Allison Kwesell
Page 24 © Tomasz Juszczak
Page 26 © The World Bank/Jonathan Ernst
Page 28 © The World Bank/Gerardo Pesantez
Page 30 © UNICEF/Ash Gilbertson
Page 32 © UNICEF/Olivier Asselin
Page 34 © UNMIT/Martine Perret
Page 38 © The World Bank/Curt Carnemark
Page 40 © Tomasz Juszczak
Page 42 © UNICEF/Jan Grarup
Page 44 © UNICEF/Josh Estey
Page 48 © The World Bank/Simone D. McCourtie
Figure credit: Figure on page 36 is from the UNFCCC/IPCC Fifth Assessment Report scenario database.
Map credit: Map on page 39 is from the Transboundary Waters Assessment Programme (GEF/UNEP/IOC-UNESCO).
Infographic icons credit: Infographic icons from page 3 to 11 and on page 19 are from thenounproject.com under a NounPro license.
Design: United Nations Graphic Design Unit/DPIAdditional report design, graphics design, typesetting and copy-editing: Copy Preparation and Proofreading Section/DGACMEditor: Lois Jensen
Copyright © 2016 United Nations All rights reserved worldwide
Requests to reproduce excerpts or to photocopy should be addressed to the Copyright Clearance Center at http://www.copyright.com. All other queries on rights and licenses, including subsidiary rights, should be addressed to: United Nations Publications, 300 East 42nd Street, New York, NY, 10017, United States of America.
Email: [email protected]; website: http://www.un.org/publications
United Nations publication issued by the Department of Economic and Social Affairs (DESA)
ISBN: 978-92-1-101340-5e-ISBN: 978-92-1-058259-9Sales No. E.16.I.10

The report is based on a master set of data prepared by the Department of Economic and Social Affairs of the United Nations Secretariat with inputs from a large number of international and regional organizations in response to General Assembly resolution 70/1 (para. 83) to provide an annual assessment of progress towards the Sustainable Development Goals. The international and regional organizations that contributed to the report are listed below. A number of national statisticians, experts from civil society and academia also contributed.
ALLIANCE OF SMALL ISLAND STATESECONOMIC AND SOCIAL COMMISSION FOR ASIA AND THE PACIFICECONOMIC AND SOCIAL COMMISSION FOR WESTERN ASIAECONOMIC COMMISSION FOR AFRICAECONOMIC COMMISSION FOR EUROPEECONOMIC COMMISSION FOR LATIN AMERICA AND THE CARIBBEANFOOD AND AGRICULTURE ORGANIZATION OF THE UNITED NATIONSINTERNATIONAL CIVIL AVIATION ORGANIZATIONINTERNATIONAL ENERGY AGENCYINTERNATIONAL LABOUR ORGANIZATIONINTERNATIONAL MONETARY FUNDINTERNATIONAL RENEWABLE ENERGY AGENCYINTERNATIONAL TELECOMMUNICATION UNIONINTERNATIONAL TRADE CENTREINTERNATIONAL UNION FOR CONSERVATION OF NATUREINTER-PARLIAMENTARY UNIONJOINT UNITED NATIONS PROGRAMME ON HIV/AIDSOFFICE OF THE UNITED NATIONS HIGH COMMISSIONER FOR HUMAN RIGHTSOFFICE OF THE UNITED NATIONS HIGH COMMISSIONER FOR REFUGEESORGANISATION FOR ECONOMIC CO-OPERATION AND DEVELOPMENTSECRETARIAT OF THE CONVENTION ON BIOLOGICAL DIVERSITYSUSTAINABLE ENERGY FOR ALLUNITED NATIONS CAPITAL DEVELOPMENT FUNDUNITED NATIONS CHILDREN’S FUNDUNITED NATIONS CONFERENCE ON TRADE AND DEVELOPMENTUNITED NATIONS CONVENTION TO COMBAT DESERTIFICATIONUNITED NATIONS DEPARTMENT OF ECONOMIC AND SOCIAL AFFAIRSUNITED NATIONS DEVELOPMENT PROGRAMMEUNITED NATIONS DIVISION FOR OCEAN AFFAIRS AND THE LAW OF THE SEAUNITED NATIONS EDUCATIONAL, SCIENTIFIC AND CULTURAL ORGANIZATIONUNITED NATIONS ENTITY FOR GENDER EQUALITY AND THE EMPOWERMENT OF WOMEN / UN-WOMENUNITED NATIONS ENVIRONMENT PROGRAMMEUNITED NATIONS FRAMEWORK CONVENTION ON CLIMATE CHANGEUNITED NATIONS HUMAN SETTLEMENTS PROGRAMMEUNITED NATIONS INDUSTRIAL DEVELOPMENT ORGANIZATIONUNITED NATIONS INTERNATIONAL STRATEGY FOR DISASTER REDUCTIONUNITED NATIONS MINE ACTION SERVICEUNITED NATIONS OFFICE FOR DISASTER RISK REDUCTIONUNITED NATIONS OFFICE OF RULE OF LAW AND SECURITY INSTITUTIONSUNITED NATIONS OFFICE OF THE HIGH REPRESENTATIVE FOR THE LEAST DEVELOPED COUNTRIES,
LANDLOCKED DEVELOPING COUNTRIES AND SMALL ISLAND DEVELOPING STATESUNITED NATIONS OFFICE OF THE SECRETARY-GENERAL’S ENVOY ON YOUTHUNITED NATIONS OFFICE OF THE SPECIAL REPRESENTATIVE OF THE SECRETARY-GENERAL ON VIOLENCE AGAINST CHILDRENUNITED NATIONS OFFICE ON DRUGS AND CRIMEUNITED NATIONS PEACEBUILDING SUPPORT OFFICEUNITED NATIONS POPULATION FUNDUN-ENERGYUN-OCEANUN-WATERTHE WORLD BANK GROUPWORLD HEALTH ORGANIZATIONWORLD TOURISM ORGANIZATIONWORLD TRADE ORGANIZATION
For more information, visit the UN Statistics Division Sustainable Development Goals website at http://unstats.un.org/sdgs/.
16-0
6736
ISBN 978-92-1-101340-5
The new agenda is a promise by leaders to all people everywhere. It is a universal, integrated and transformative vision for a better world. It is an agenda for people, to end poverty in all its forms. An agenda for the planet, our common home. An agenda for shared prosperity, peace and partnership. It conveys the urgency of climate action. It is rooted in gender equality and respect for the rights of all. Above all, it pledges to leave no one behind.
— UN Secretary-General BAN Ki-moon