the sustainable development of local housing … study investigates the sustainable development of...
TRANSCRIPT

The Sustainable Development of Local Housing Units in UAE
By
Amani Mohammed Al Sammani
Dissertation submitted in partial fulfillment of
MSc Sustainable Design of the Built Environment
Faculty of Engineering & IT
Dissertation Supervisor
Professor Bassam Abu-Hijleh
May-2011

i
Abstract
WWF (2010) ranked United Arab Emirates (UAE) as the country with the
world's largest Ecological Footprint per capita in 2007, by means of that if
the earth's population consumed and emitted carbons as much as UAE
residents do, more than ―4.5 earths‖ would be required to sustain it.
Accordingly, UAE has classed as one of the most energy consumers
globally due to its massive economic development and abnormal population
growth. Despite the fact that the urban development has formed the
cornerstone of the Dubai economic growth; it has failed in creating
sustainable urban environment.
The immediate need for conservation and sufficient control of building
development in UAE has led to initiate several foundations to ensure a
sustainable development future of the country. Abu Dhabi Urban Planning
Council has produced the Pearl Rating System for Estidama while Dubai
Municipality has set up the first edition of Green Buildings Regulations and
Specifications.
This study investigates the sustainable development of local housing units in
Dubai from historical ages until the expected status after applying the Green
Regulations on 2014 and compares the results with that of Estidama System
of Abu Dhabi.
Different computer simulation has been conducted using (IES-VE) to
evaluate the energy consumption and thermal performance. It was found
that the traditional unit has the minimum value of energy consumption
among all other units. With the beginning of using cooling systems in 1970‘s,
the total energy consumption has lifted up about four times than the total

ii
energy of traditional unit. Remarkable reductions below 1970‘s – 1990‘s
levels has recorded in future cases of Dubai (49% - 63%) and Estidama
cases of Abu Dhabi (57% - 71%) due to new policy instruments, energy
efficiency direction and thermal performance development. Simple payback
analyses has been conducted and verified that the future green practices
and sustainable developments have the ability to re-create environmentally
friendly buildings that present green and comfort balance within an
affordable price where the total construction cost of Dubai and Abu Dhabi
green buildings has ranged between 0.46% to 2.04% above the levels of
total construction cost of the year 2000 – 2010 levels. And the payback
period has ranged between 1.3 to 3.6 years for the re-traditional design and
5.4 to 7 years in post-modern design.

iii
Acknowledgments
I am heartily thankful to my supervisor, Prof. Bassam Abu Hijleh, whose
encouragement, supervision and assistance from inception to completion
level has enabled me to conduct this study. Without his support, patience
and guidance, this study would not have been completed.
I owe sincere and earnest thankfulness to my parents. My deepest
appreciation and love for their dedication and support during my
undergraduate studies that provided the foundation for this work.
I also would like to make a special reference to Building Department of
Dubai Municipality. Without their corporation I could not have gotten such
relevant data.
Last, but not least, I would like to express my heartfelt gratitude to my
husband Moana. He formed the backbone and origin of my success. His
love and support without any complaint or regret has enabled me to
complete this research. I owe my every achievement to him.

iv
Table of contents
Abstract ............................................................................................................ i
Acknowledgments ........................................................................................ iii
List of Figures ............................................................................................... ix
List of Tables ............................................................................................... xiv
Chapter 1 - Introduction
1.1 Introduction of Dubai foundation .........................................................2
1.2 Dubai History and Building Development ...........................................2
1.3 Dubai History and Urban Development ...............................................5
1.4 Discovery of Oil and Urban Development ............................................6
1.5 The first commencement of government on buildings ......................7
1.6 The foundation of modern Dubai .........................................................8
1.7 The economic revolution and building regulations ............................9
1.8 Quality of life and Ecological footprint .............................................. 10
1.9 The economic crises and environmental problem recognition ....... 11
1.10 Green building revolution ................................................................ 12
Chapter 2 - Literature Review
2.1 Introduction sustainable development ............................................ 15

v
2.2 Thermal comfort and vernacular architecture .................................. 15
2.2.1 Wind towers .................................................................................. 16
2.2.2 Courtyards .................................................................................... 18
2.3 Lessons to learn from vernacular architecture ................................. 21
2.4 vernacular and modern architecture in comparison ........................ 22
2.5 Sustainability in context of energy and thermal performance ........ 24
2.5.1 Passive techniques and energy consumption ................................ 25
2.5.2 Integration of passive and active techniques ................................. 26
2.6 Sustainable energy development ...................................................... 28
2.6.1 Minimizing energy loads and operation cost .................................. 28
2.6.2 Building design and energy consumption ...................................... 31
2.7 Regulatory and voluntary policy instruments .................................. 34
2.8 Successful sustainable development experience ............................ 36
Chapter 3 – Research Plan
3.1 Introduction to research phases ...................................................... 44
3.2 Motivations ........................................................................................ 44
3.3 Aims ................................................................................................... 54
3.4 Objectives .......................................................................................... 46
3.5 Justification ....................................................................................... 64
3.6 Research plan ................................................................................... 47
vi
Chapter 4 - Methodology
4.6 Method selection and justification ................................................... 49
4.1.1 Field observation and survey method ............................................ 49
4.1.2 Lab experiment method ................................................................. 51
4.1.3 Computer simulation method . ....................................................... 52
4.1.3 Literature review and case studies method . ................................. 54
4.2 Method selection conclusion ........................................................... 56
4.3 Selected method ................................................................................ 56
4.4 Selected computer simulation software ........................................... 57
4.5 Selected software validation ............................................................. 59
4.6 Analysis procedure ............................................................................ 61
Chapter 5 – Housing Units Selection
5.1 Introduction of housing unit selection ............................................ 74
5.2 Sustainable development timeline ................................................... 74
5.3 Selection and evaluation parameters .............................................. 74
5.4 Selected units.................................................................................... 74
5.4.1 Historical unit . .............................................................................. 73
5.4.2 1970‘s-1990‘s unit . ....................................................................... 73
5.4.3 1990‘s-2000‘s unit . ....................................................................... 73
5.4.4 2000‘s-2010 unit . .......................................................................... 73
5.4.5 2010-2014 unit . ............................................................................ 73

vii
Chapter 6 – Simulation Models
6.1 Computer simulation models ........................................................... 74
6.2 Weather data profile.......................................................................... 74
6.3 Local housing units description ...................................................... 74
6.3.1 Historical unit . .............................................................................. 73
6.3.2 1970‘s-1990‘s unit . ....................................................................... 73
6.3.3 1990‘s-2000‘s unit . ....................................................................... 73
6.3.4 2000‘s-2010 unit . .......................................................................... 73
6.3.5 2010-2014 unit . ............................................................................ 73
6.3 Computer simulation procedure ...................................................... 74
Chapter 7 – Results and Discussion
7.1 Total energy consumption ............................................................... 74
7.1.1 Lighting energy consumption ........................................................ 73
7.1.2 Cooling energy consumption . ....................................................... 73
7.2 Thermal performance ....................................................................... 74
7.2.1 Thermal comfort in traditional unit . ............................................... 73
7.2.2 External conduction gain – external walls . ..................................... 73
7.2.3 External conduction gain – exposed roof . ...................................... 73

viii
7.2.4 External conduction gain – glazing . ............................................... 73
7.2.5 Solar heat gain – glazing . .............................................................. 73
7.2.6 Internal gain – lighting . .................................................................. 73
7.3 Total energy cost .............................................................................. 74
7.4 Modified material cost ...................................................................... 74
7.5 Energy and modified materials cost and cost difference............... 74
7.6 Total construction cost .................................................................... 74
7.7 Payback period analysis .................................................................. 74
Chapter 8 – Conclusions and Recommendations
8.1 Conclusions ...................................................................................... 74
8.2 Recommendations for future studies .............................................. 74
References ................................................................................................... 116
Bibliography ................................................................................................ 121
Apendex A: Input Data Details – weather data model, rooms specifications,
constructions material specifications, electrical lighting specifications.
135
Appendix B: Simulation Model Results – 2000-2010 units
Thermal performance and energy consumption
143
ix
List of Figures
Figure
Page
Figure 1.1 Al Arish houses beside coral stone houses. Source:
History of Dubai (2007)
5
Figure 1.2 Al Arish houses made of palm fronds Source: the
architecture of UAE (2006)
6
Figure 1.3 House of Sheikh Saeed Al Maktoum. Source: Dubai
History (2007)
9
Figure 1.4 Ground floor plan of Sheikh Saeed house. Source:
Architecture of UAE (2006)
10
Figure 1.5 Sections through courtyard of Sheikh Saeed house.
Source: Architecture of UAE (2006)
11
Figure 1.6 Map of old Dubai. Source: History of Dubai (2007) 11
Figure 1.7 The first governmental publication in 1961. Source:
History of Dubai (2007)
12
Figure 1.8 The Clock Tower of Dubai. Source: History of Dubai
(2007)
13
Figure 1.9 Al Maktoum Bridge. Source: History of Dubai (2007) 13
Figure 1.10 First establishment of UAE in Al Deyafa palace in Dubai.
Source: History of Dubai (2007)
14
Figure 1.11 The first edition of Thermal Insulation Specifications (left
side) and the second edition of Dubai Rules and
Regulations (right side). Source: Dubai Municipality
14

x
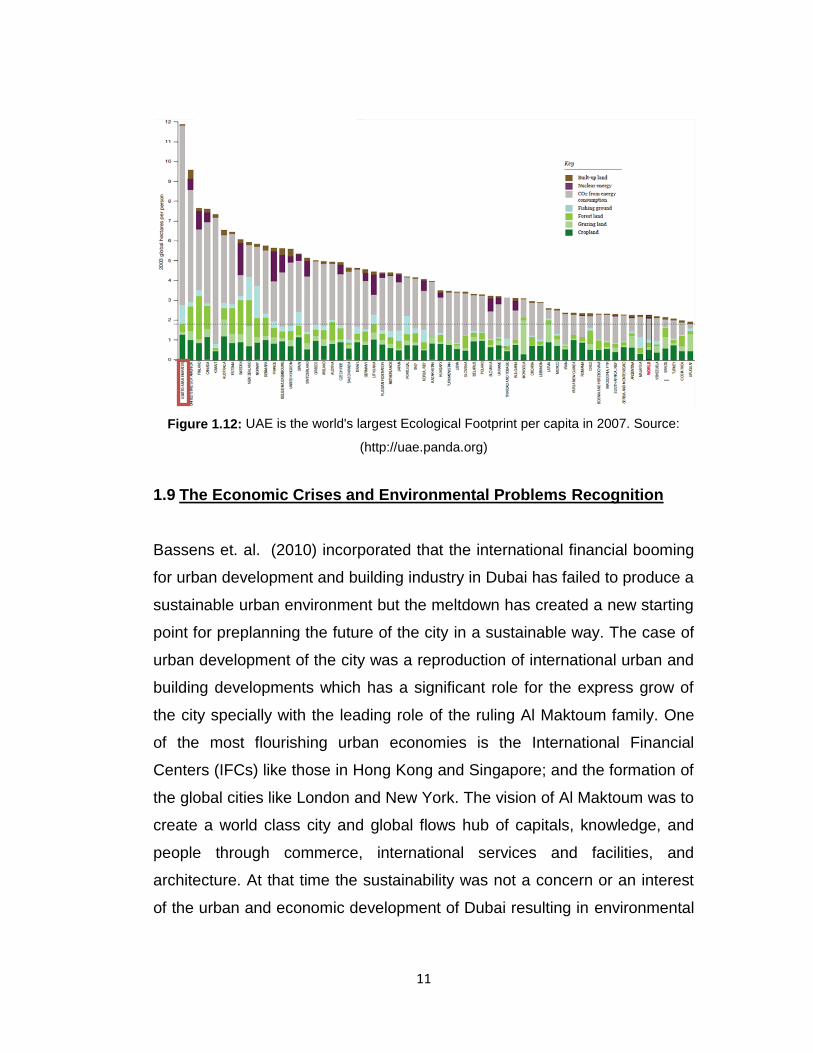
Figure 1.12 UAE is the world's largest Ecological Footprint per capita
in 2007. Source: (http://uae.panda.org)
15
Figure 1.13 The Pearl Rating System for Estidama. Source:
(http://estidama.org/)
16
Figure 1.14 Green Buildings Regulations and Specifications of Dubai.
Source: Dubai Municipality.
16
Figure 2.1 Small cowl ventilators on the top of domes in north east
Iran. Source: (cais-soas.com)
17
Figure 2.2 Gulf Barjeel in Bahrain Source: Raof (1988) 17
Figure 2.3 Huge roof ventilators in Cairo. Source: Raof (1988) 18
Figure 2.4 Axonometric representation on a 67.5m x 67.5 m site of
the traditional Arabic courtyard (left: three floor courtyard)
and of two pavilion structures. (Middle: micro-pavilion,
three floors; right: pavilion, six floors). Source: Ratti et al.
(2003)
18
Figure 2.5 Symbolic vernacular architecture most important climate
zones. Source: Zhai and Previtali (2010)
19
Figure 2.6 Vertical light pipe technology. Source: West (2001) 19
Figure 2.7 The Science Precinct Building at the University of New
South Wales. Source: West (2001)
20
Figure 2.8 Integrating energy saving features and daylighting and
ventilation technologies. Source: West (2001)
20
Figure 2.9 Ecolonia residential district. Source: Melchert (2007) 21
Figure 2.10 Dutch sustainable building experience - the ABN AMRO
international headquarters. Source: Melchert (2007)
22

xi
Figure 4.1 IES-VE model (left side) and simulations (right side) of
Grand Mosque of Abu Dhabi. Source: (www.iesve.com)
20
Figure 4.2 IES-VE model (left side) and constructions (right side) of
Heathrow Airport Terminal 5 Concourse in London.
Source: (www.iesve.com)
21
Figure 4.3 IES-VE simulation (left side) and building (right side)
Royal Bank of Scotland World HQ in Edinburgh. Source:
(www.iesve.com)
22
Figure 4.4 IES-VE model of Royal London Hospital (left side).
Source: (www.iesve.com).
20
Figure 4.5 IES-VE model of Worcester College of Oxford University
in London (right side). Source: (www.iesve.com)
20
Figure 5.1 Ecolonia residential district. Source: Melchert (2007) 21
Figure 5.1 The traditional house of Dar Al Nadwa in Al Bastakiya
historical district.
Source: (www.dubaihistoric.ae)
22
Figure 5.2 Arcade design element for ground floor house of 1970‘s-
1990‘s period.
Source: Dubai Municipality
22
Figure 5.3 Arcade design element for two floors house of 1970‘s-
1990‘s period.
Source: Dubai Municipality
22
Figure 5.4 Different houses shows arcade design element of 1970‘s-
1990‘s period
22

xii
Figure 5.5 Post-modern designed housing units of 2000 – 2010 (left
side). Source: (http://dubaipropertiesgroup.ae)
22
Figure 5.6 Re-traditional designed housing units of 2000 – 2010
(right side). Source: (http://dubaipropertiesgroup.ae)
22
Figure 6.1 Traditional Unit of IES-VE model 22
Figure 6.2 1970‘s – 1990‘s Unit of IES-VE model 22
Figure 6.3 1990‘s – 2000‘s Unit of IES-VE model 22
Figure 6.4 2000‘s – 2010‘s re-traditional unit of IES-VE model 22
Figure 6.5 2000‘s – 2010‘s post-modern unit of IES-VE model 22
Figure 6.6 Pearl Rating System for Estidama. Source:
(www.estidama.com)
22
Figure 6.7 Systematic analysis of total energy consumption of local
housing units in Dubai.
22
Figure 7.1 Total Energy Consumption (KWh/Y) 22
Figure 7.2 Lighting Energy Consumption (KWh/Y) 22
Figure 7.3 Cooling energy consumption (KWh/Y) 22
Figure 7.4 Total heat gains (KWh/Y) 22
Figure 7.5 Internal temperature of traditional unit 22
Figure 7.6 External Conduction Gain - External Walls (KWh/Y) 22
Figure 7.7 External Conduction Gain – Exposed Roof (KWh/Y) 22
Figure 7.8 External Conduction Gain – Glazing (KWh/Y) 22
Figure 7.9 Solar Heat Gain – Glazing (KWh/Y) 22

xiii
Figure 7.10 Internal Gain – Lighting (KWh/Y) 22
Figure 7.11 Total Energy Cost – AED/Y 22
Figure 7.12 Modified Material Cost (AED) – (Thermal Insulation and
Glazing)
22
Figure 7.13 Modified Material Cost (AED) – (Thermal Insulation and
Glazing)
22
Figure 7.14 Energy and Material Cost and Cost Difference (AED) –
(Thermal Insulation and Glazing)
22
Figure 7.15 Total Construction Cost (AED) 22
Figure 7.16 Difference in Total Construction Cost and Total Energy
Cost (AED)
22
Figure 7.17 Payback Period (Years) 22

xiv
List of Tables
Table Page
Table 2.1 vernacular regions per climate zones. Source: Zhai and
Previtali (2010)
5
Table 4.1 Zone loads and general modeling features of major
building simulation softwares. Crawley et al, (2008)
5
Table 4.2 Building envelope, daylighting, solar radiation and
thermal performance estimations. Crawley et al, (2008)
5
Table 5.1 Sustainable Development Timeline of Local Housing
Units in UAE
5
Table 5.2 Selection and evaluation parameters of local housing
units in UAE.
5
Table 5.3 general specifications of each local housing unit based
on selection and evaluation parameters
5
Table 6.1 Weather Data Profile. Source (Dubai International
Airport)
5
Table 6.2 general specifications of construction materials of the
traditional model
5
Table 6.3 general specifications of construction materials of 1970‘s
– 1990‘s model
5
Table 6.4 general specifications of construction materials of 1990‘s
– 2000‘s model
5
Table 6.5 general specifications of construction materials of 2000‘s
– 2010‘s model
5

1
Chapter 1: Introduction

2
1.1 Introduction of Dubai Foundation
Pacione (2005) stated that similar to many other modern cities; Dubai is
running to set up its foundation within the global economy and it is in front of
the challenge of presenting sufficient infrastructure in a perspective of
express urban development where property expansion forms a cornerstone
of Dubai‘s development approach. Since the early 1800s, Dubai played an
important role as a distribution centre of trade. It was the chief port where
goods from India were re-exported to Persia and neighboring countries.
Records of Dubai (2000) documented that Dubai was a transmit spot of
business route from Iraq to Oman, and between India, East Africa and the
Northern Gulf. This ultimately led to setting up the city as an international
point of commerce where many traditions and cultures assorted.
1.2 Dubai History and Building Development
Handal (1983) recorded that the year 1833 represents the establishment
of Dubai and its political appearance in the region by Sheikh Maktoum bin
Buti bin Suhail Al Falasi. Lorimer (1986) stated that in 1841, many residents
moved to Bar Deira as a result of epidemic fever spread in Bur Dubai.
History of Dubai (2007) contained that in 1861 some people started to
move from Bur Dubai to Al Shindagha which formed a nucleus
of new construction and expansion of the city. Michael (2005) recorded that
Dubai's historical architecture exposes a mixture of cultures and nationalities
and at the same time Arabic in style, it is additionally inspired by Asian and
European methods. Kay and Zandi (1991) recorded that the historical
vernacular approach of architecture in Dubai is the outcome of a
combination of three principal factors: the climate (hot and humid), the
religion and traditions of people, and the locally available building materials.

3
Heard (1982) stated that the most of population reside in extended families
in Al Arish houses (made of palm fronds). Residential accommodations
were built in groups for grounds of collective security and privacy. The
domestic divisions of each enclave were linked by narrow walkways planned
for pedestrians and local animals used for goods‘ carrying and drinking
water from four public wells. Kay and Zandi (1991) and History of Dubai
(2007) documented that in 1893 a major fire broke out in Bar Deira and
burned all the houses, which resulted in a new stage of growth. The
wealthier people started building their houses from coral stone and gypsum,
while the other residents still exist in huts Al Arish houses as shown in
Figure 1.1 and Figure 1.2.
Figure 1.1: Al Arish houses beside coral stone houses. Source: History of Dubai (2007)
Figure 1.2: Al Arish houses made of palm fronds Source: the architecture of UAE (2006)
4
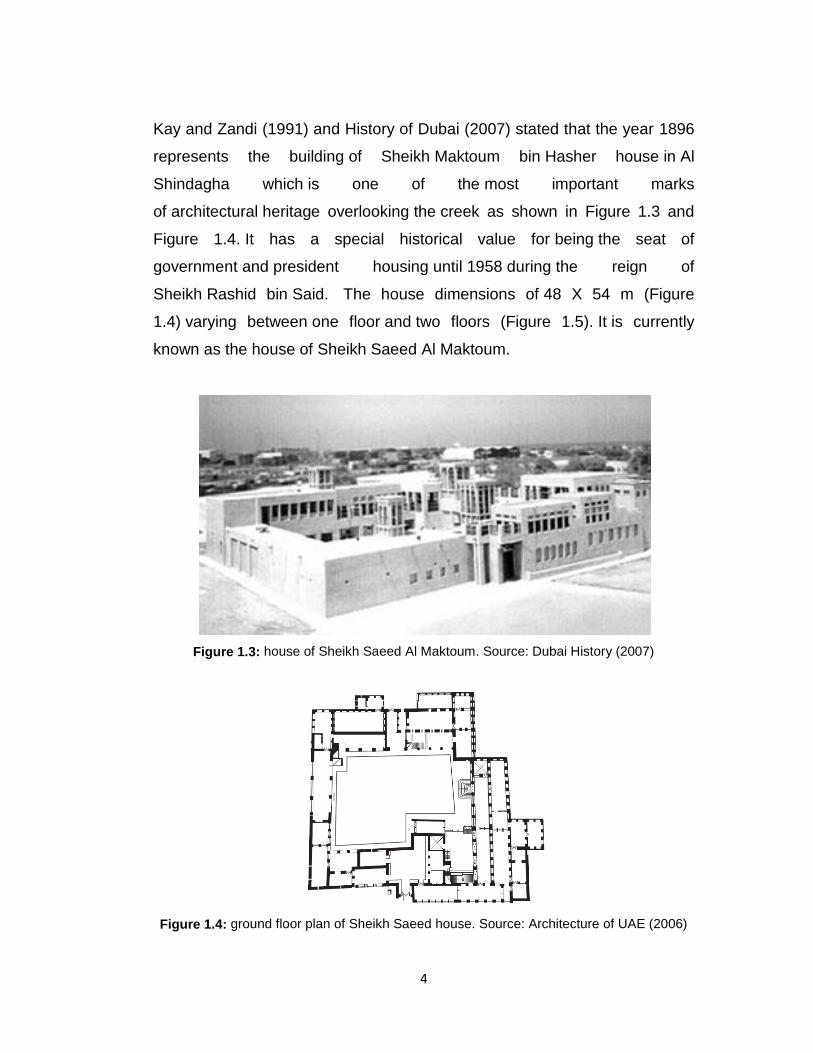
Kay and Zandi (1991) and History of Dubai (2007) stated that the year 1896
represents the building of Sheikh Maktoum bin Hasher house in Al
Shindagha which is one of the most important marks
of architectural heritage overlooking the creek as shown in Figure 1.3 and
Figure 1.4. It has a special historical value for being the seat of
government and president housing until 1958 during the reign of
Sheikh Rashid bin Said. The house dimensions of 48 X 54 m (Figure
1.4) varying between one floor and two floors (Figure 1.5). It is currently
known as the house of Sheikh Saeed Al Maktoum.
Figure 1.3: house of Sheikh Saeed Al Maktoum. Source: Dubai History (2007)
Figure 1.4: ground floor plan of Sheikh Saeed house. Source: Architecture of UAE (2006)

5
Figure 1.5: sections through courtyard of Sheikh Saeed house. Source: Architecture of
UAE (2006)
1.3 Dubai History and Urban Development
Heard (1982) recorded that at the late 1800s and early 1900s, Dubai
population was around 10,000 and concentrated in three residential areas:
Bar Deira, consisting of 1600 dwellings and 350 souqe shops, with Arabs,
Persians and Baluchis creating the greater part of the population. Al
Shindagha, a former habitation of the ruling family, where there was 250
residences but without souqes and just Arab inhabitants. Bar Dubai, the
nominal of the settlement quarters with 200 dwellings and 50 souqe shops,
and occupied by Persian and Indian merchants. Figure 1.6 shows the map
of old Dubai. History of Dubai (2007) contains that Sheikh Rashid bin Saeed
Al Maktoum was born in 1912 and he is the eldest son of Sheikh Saeed Al
Maktoum and the founder of modern Dubai until his death in 1990. Michael
(2005) and Handal (1983) acknowledged that the year 1930 represents the
the economic recession of natural pearls market in the gulf region and
particularly in Dubai caused by Japan pearl manufacturing and exporting.
History of Dubai (2007) recorded that in 1940 a large fire broke
out in Bur Dubai and burned nearly 400 of Al Arish houses which gradually
led to import the cement from India in 1948 to start using it in building

6
construction. Codrai (1990) stated that the year 1950 symbolize the
first attempts for oil exploration in Jebel Ali.
Figure 1.6: Map of old Dubai. Source: History of Dubai (2007)
1.4 Discovery of Oil and Urban Development
With the discovery of oil in 1950, Dubai witnessed an unprecedented
population explosion. History of Dubai (2007) recorded that 1956 signify the
use of reinforced concrete for the first time in Bar Deira. Hamza (1986)
recorded that in 1958 Sheikh Rashid bin Saeed bin Maktoum Al Maktoum
took the reins of government. He was the founder of modern Dubai where
he set up the development of infrastructure and future
plans of economic, urban, and architecture renaissance of the city. In 1959
the first urban planning project of the city has been created by Sir Jon Harris
from UK.
7
1.5 The First commencement of Governmental Commands on Building
Development
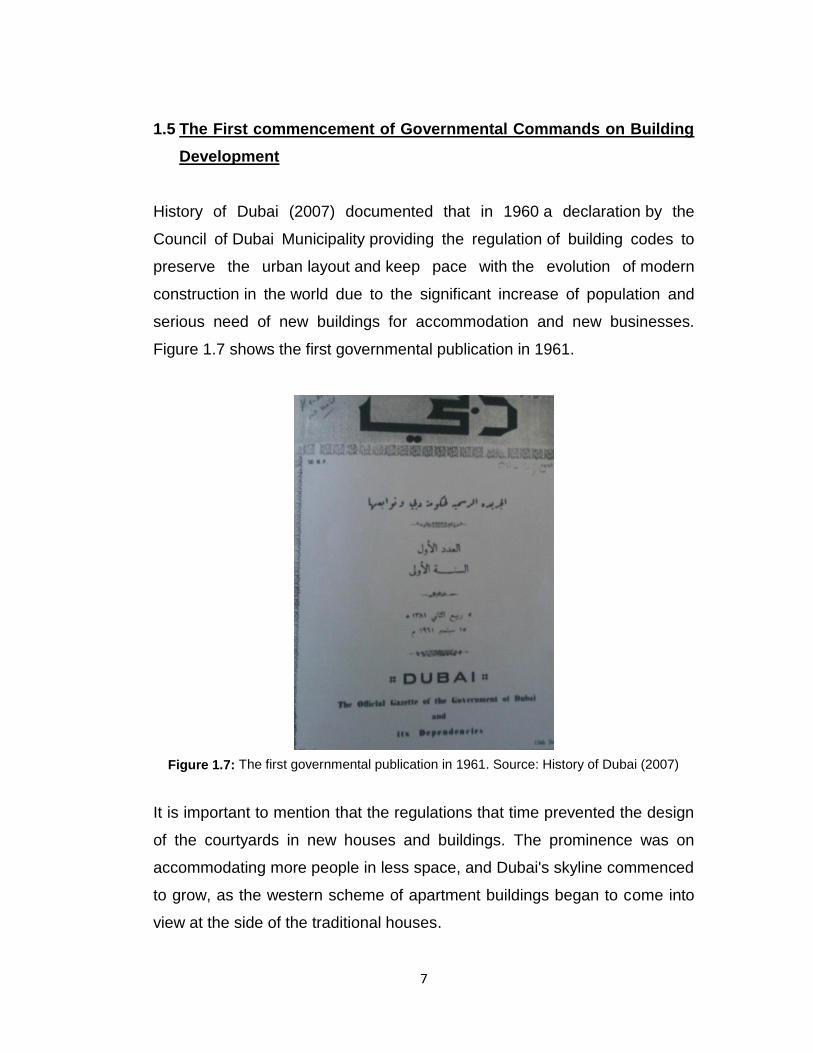
History of Dubai (2007) documented that in 1960 a declaration by the
Council of Dubai Municipality providing the regulation of building codes to
preserve the urban layout and keep pace with the evolution of modern
construction in the world due to the significant increase of population and
serious need of new buildings for accommodation and new businesses.
Figure 1.7 shows the first governmental publication in 1961.
Figure 1.7: The first governmental publication in 1961. Source: History of Dubai (2007)
It is important to mention that the regulations that time prevented the design
of the courtyards in new houses and buildings. The prominence was on
accommodating more people in less space, and Dubai's skyline commenced
to grow, as the western scheme of apartment buildings began to come into
view at the side of the traditional houses.

8
1.6 The Foundation of Modern Dubai
In 1963 the Clock Tower which is the first monument in the city and Al
Maktoum Bridge which is the first link between Bar Diera and Bar Dubai has
been constructed from reinforced concrete as shown in Figure 1.8 and
Figure 1.9.
Figure 1.8: The Clock Tower of Dubai. Source: History of Dubai (2007)
Figure 1.9: Al Maktoum Bridge. Source: History of Dubai (2007)

9
Renovation projects were commenced all over the city, while community
gardens were produced in numerous areas. 1971 represent the first
establishment of UAE where the rulers signed the interim constitution in Al
Deyafa palace in Dubai as shown in Figure 1.10.
Figure 1.10: first establishment of UAE in Al Deyafa palace in Dubai. Source: History of
Dubai (2007)
1.7 The Economic Revolution and Building Regulations
After 1990s the economic revolution had place in Dubai and led to
significant increase on population and construction booming. The new
materials and technologies became more available and facilitated more
adventurous designs. In 2000; the second edition of Dubai rules and
regulations has been updated to be more compatible with the city growth

10
requirements combined with the first edition of thermal insulation
specifications as shown in Figure 1.11 and Figure 1.12.
Figure 1.11: The first edition of Thermal Insulation Specifications (left side) and the second
edition of Dubai Rules and Regulations (right side). Source: Dubai Municipality
1.8 Quality of Life and Ecological Footprint
This rapid development of economic growth in Dubai and UAE in general
has resulted in an increasing rate of consumption of natural resources such
as energy, food, fiber and timber, which in turn has helped improve the
quality of life of the country‘s population. WWF (2010) ranked UAE as the
country with the world's largest Ecological Footprint per capita in 2007,
which is four times higher than the average humanity's Footprint. The report
recorded that each person in the UAE requires an average of 10.68 global
hectares (gha) to sustain current rates of consumption and carbon
emissions. This means that if the earth's population consumed and emitted
carbons as much as UAE residents do, more than ―4.5 earths‖ would be
required to sustain it.
Dubai Buildings rules
and Regulations
Thermal Insulation
Specifications
11
Figure 1.12: UAE is the world's largest Ecological Footprint per capita in 2007. Source:
(http://uae.panda.org)
1.9 The Economic Crises and Environmental Problems Recognition
Bassens et. al. (2010) incorporated that the international financial booming
for urban development and building industry in Dubai has failed to produce a
sustainable urban environment but the meltdown has created a new starting
point for preplanning the future of the city in a sustainable way. The case of
urban development of the city was a reproduction of international urban and
building developments which has a significant role for the express grow of
the city specially with the leading role of the ruling Al Maktoum family. One
of the most flourishing urban economies is the International Financial
Centers (IFCs) like those in Hong Kong and Singapore; and the formation of
the global cities like London and New York. The vision of Al Maktoum was to
create a world class city and global flows hub of capitals, knowledge, and
people through commerce, international services and facilities, and
architecture. At that time the sustainability was not a concern or an interest
of the urban and economic development of Dubai resulting in environmental

12
drop ecologically through artificial islands, socially through employment of
low income workers, and economically in view of the fact that Dubai by
some means failed to drive in the international runs of capital, knowledge,
and people into its rapid developing urbanity. The recent economic crisis, in
spite of all its negatives, guides the city of Dubai to think again about the
future plans of its urban development and consider the sustainability in its
strategies.
1.10 Green Buildings Revolution
With the beginning of economic crises in 2008 UAE has witnessed the
global environmental problem resulted from its rapid development without a
conscious consideration of the natural resources and has taken a serious
and innovative approach towards understanding and managing its
Ecological Footprint through establishing different foundations and Initiatives
like Masdar and Estidama of Abu Dhabi. Abu Dhabi Urban Planning Council
has initiated the Pearl Rating System for Estidama (Figure 1.14) with clear
vision of sustainable development of Abu Dhabi 2030 and ideal relationship
among governance and community development.
Figure 1.13: The Pearl Rating System for Estidama. Source: (http://estidama.org/)

13
Dubai Municipality (2010) recorded that within the implementation of the
decision of the UAE Vice President, Prime Minister and Ruler of Dubai His
Highness Sheikh Mohammed bin Rashid Al Maktoum, and in line with Dubai
Strategic Plan 2015, and the directives for applying green building
specifications on all buildings in Dubai as per the best environmentally
friendly standards to keep Dubai a healthy city that follows the highest
standards of sustainable development. The Green Buildings Regulations
and Specifications have been published and it is expected to be mandatory
for every new building permit in Dubai with the beginning of 2014.
Figure 1.14: Green Buildings Regulations and Specifications of Dubai. Source: Dubai
Municipality.

14
Chapter 2: Literature Review

15
2.1 Introduction of Sustainable Development through Energy
Consumption and Thermal Performance
The following literature review discuses the sustainable development
methods and techniques of effective thermal performance and energy
consumption among historical buildings and vernacular architecture when
the climate was dominating the people behaviors, building forms and
architectural appearance in order to reach adequate level of comfort; and
through building development progression overtime after employing energy
tools and methods. The presented studies show different means of passive
and active techniques that aim to reduce the energy consumption with
maximum thermal comfort possible. The role of governmental policies and
their integration with voluntary instruments has been reviewed and followed
by international cases of successful sustainable developments.
2.2 Thermal Comfort and Vernacular Architecture
Raof (1988) described the daily thermal routine of people exists in desert
climate as Yazd in Iran living in traditional mud houses with wind catchers
and internal courtyards where climate was controlling the people behaviors
from day to night and from summer to winter. People were choosing the
room based on its climate so they were moving from room to room in order
to get the best thermal comfort during the day. This kind of movement
created a behavioral adjustment that has been a basic adaptive approach
formed by the people of such hot desert area. In summer and starting from
sleeping on the roof, people were moves to the internal courtyard looking for
some shade and relative cool in the morning hours. During the hottest hours
of the day, they were migrate to the basement until evening time where they
came out to the courtyard and cool it slightly by throwing water on the hot

16
surfaces which will keep cooling as night draws near. Another kind of
movement occurs in winter where people move horizontally from the shaded
north side to the south side rooms looking to the courtyard to be warmed by
the sun. The effect of this every day transfer is that by recording climate in
one or two spaces, one does not cover the diurnal scale in climate
experienced by the house occupants. It has been needed to follow the
residents throughout the residence, climatically, in order to record and
understand the characteristics of the occupied summer climate in the
houses of Yazd.
2.2.1 Wind Towers
In vernacular buildings in hot desert climate the wind catchers (Barjeel) were
functioning like the present modern air conditioning systems. It doesn‘t have
a standard design or dimensions but they creatively designed to fit the local
climate conditions. In north east Iran wind catchers are small cowl
ventilators on the top of domes (Figure 2.1) while in the tremendously hot
climates as the Gulf region, Barjeels are exceptionally large and attached to
ventilated parapet and wall to increase the air flow through the house and
move as much air as possible across the living areas as shown in Figure
2.2. The traditional heavy mass structure and the wind catchers are the only
practical approach for cooling in Gulf houses.
Figure 2.1: Small cowl ventilators on the top of domes in north east Iran.
Source: (cais-soas.com)

17
Figure 2.2: Gulf Barjeel in Bahrain Source: Raof (1988)
In the awfully hot interiors of Iraq, the wind catchers are connected by thin
ducts to the cellars rooms occupied on hot afternoons in order to supply
small ventilation as the air inflowing the rooms from the roof might be at
temperatures of 40s C. In cooler desert metropolis of Cairo, wind catchers
applied as huge roof ventilators passing air down throughout the high living
halls in combination with cupolas at the apex of domes above the halls
(Figure 2.3).
Figure 2.3: Huge roof ventilators in Cairo. Source: Raof (1988)

18
Traditional wind catchers are used in four ways: To supply fundamental
ventilation as in Baghdad; to allow convective cooling for indoor
temperatures of 25-35°C; to provide evaporative cooling at temperatures
above 35°C; and to cool the building mass down by either coupling the
internal air temperatures to those of the night sky or with the earth in
basements and underground tunnels and streams. By basically looking at
the type of local original wind catchers, with respect to the rooms served, an
impression of what the local climate is in a region could be observed from
the form and size of the wind catchers.
2.2.2 Courtyards
The courtyards also, are essential in hot climate regions when building
forms and environmental performance comes together. Ratti et al. (2003)
declared that no complete answer could be obtained for the question of
‗‗which urban forms make the best use of land?‘‘ stated by Martin and
March‘s approach where there are countless considerations that have an
effect on building form even with a single direction where a significant
amount of variable are closely to be conflicts.
In Ratti et al. (2003) paper - building form and environmental performance-
stated that even though there is no single solution or optimum geometry of
building form to make the best use of land in term of climatic contexts where
there are infinite patterns of diverse climatic perspectives, urban geometries,
climate variables and design objectives; there are principal urban forms that
are related to particular climate types, like the courtyards and the hot
climates where courtyards meets a lot of terms in hot zones like alleviating
solar overload by creating a shaded spaces combined with natural cooling
strategies and protection from dust or sand. Ratti et al. (2003) adding that

19
climate considered as the fundamental determinant of architectural and
urban form where in such harsh desert climate, even streets designed to be
narrow and suitably oriented to prevent the hot winds. Ratti et al. (2003)
have been simulated three types of building forms in term of different
environmental variables. The main analysis principle is that they took the
same built volume of the three types and reshape it in different forms as
shown in Figure 2.4.
Figure 2.4: Axonometric representation on a 67.5m x 67.5 m site of the traditional Arabic
courtyard (left: three floor courtyard) and of two pavilion structures. (Middle: micro-pavilion,
three floors; right: pavilion, six floors). Source: Ratti et al. (2003)
The results of surface to volume ratio propose that a courtyard doesn‘t
operate in proper way thermally because it is exposed to heat gain during
summer and heat loss during winter. Nevertheless, when the possible heat
loss and heat gain throughout cold and warm periods is analyzed,
correspondingly, within the complication of hot arid climate, outcomes begin
to suggest reasonable conclusions. In hot arid climates night, temperatures
are notably lower than day temperatures. Summer diurnal temperature
changes between 15 and 19 C° (for Morocco - Marrakech during summer).
The winter months contain a diurnal swing of around 3 C° and are
reasonably warm and sunny. As a result, the critical months are the hot
months, and extenuating the temperature extremes of this period is a
necessity. The creative resolution of the courtyard house form in hot arid
climate is to make use of great thermal mass to store heat by the extensive

20
surface area throughout the day with the purpose of advantage from it
through the cooler nights. By maximizing the surface to volume ratio, the
courtyard operates as heat sink and consequently, limit severe temperature
stress, and reradiates this heat insides and to the night sky. Therefore, the
bigger surface to volume ratio of courtyards combined with its thermal mass
is an advantage in the thermal performance of the building.
The results of high shadow density and daylight distribution showed that
courtyards has benefited from narrow streets that create shade to people
and to the horizontal surface of the streets from solar radiation. Also, the
white and light colors of external parts of courtyards increase the reflected
light amount in the city. Low values for sky view factor were recorded and it
seems to be an advantage in hot arid climates as comfort is based
extensively on temperature and radiative exchange, and low sky view
factors assure a grow in direct shading and a drop in reflected radiation
particularly during day hours as people are outdoors in courtyards and
streets and comfort is essential.
Ratti et al. (2003) recorded that the case study confirmed that the courtyard
pattern demonstrated better reaction all through the intended environmental
variables (surface to volume ratio, shadow density, daylight distribution, sky
view factor) than the pavilion styles in the particular environment of hot arid
climates. The researchers‘ answer for ‗‗what building forms make the best
use of land?‘‘ is that if ‗best‘ is accounted for environmental context without
giving up floor space for a specified plot, therefore the resolve for hot arid
climates is the courtyard form. The mixture of large surface area and great
thermal mass, daylight by means of the courtyard and shallow plan outline,
and tight areas for shade and enhanced thermal comfort, create a
framework where low energy strategies throughout the restraint of air

21
conditioning loads are achievable. A principal feature of this is that
courtyards are able to create a microclimate in the shape of an in-between
environment that will be extra quite, clean and private.
2.3 Lessons to learn from Vernacular Architecture
Santamouris (2007) described vernacular architecture as an expression that
is used to call local buildings which have grown in the fullness of time in one
locality matching the local climate, culture and economy. There is a lot to
gain knowledge from the vernacular architecture when designing the
passive low energy buildings leading the 21st century design prototypes
which will be gradually more designed. Simultaneously vernacular design
approach cannot be easily applied in modern buildings without taking into
consideration the consequences on design of such local context. What
might confirm the major inspiration on the appearance of the new
vernacular; is the speedily increasing price of oil and gas. Buildings that rely
on central control and regular oil and gas power-driven systems will no
longer be capable to provide sufficient comfort at a reasonable price for the
most of the world‘s population. The improvement of new healthy and
comfortable prototypes of exceptionally sustainable buildings is a crucial
foundation in the development of future buildings.
Zhai and Previtali (2010) recorded that the rising world environment and
energy crisis require an extensive transformation of building design
attitudes, methods, knowledge, and construction and management
procedures. Vernacular architecture is accustomed to express buildings
constructed by people whose design determinations are inspired by
traditional practice in their culture. Vernacular architecture differs broadly
with the world‘s substantial range of climate, topography and culture. It

22
includes essential unrecorded data concerning how to optimize the energy
efficiency of buildings at minimal cost by means of local materials. Over
time, vernacular houses have developed to act in response to confronts of
climate, materials and cultural prospects in a particular location. Vernacular
traditions have been gathered throughout an extensive time of experiments,
miscalculation, and the creativity of local builders who have particular
experience concerning their location. So that, there is importance in
recognizing and using characteristics observed from vernacular architecture
to modern buildings.
2.4 Vernacular and Modern Architecture in comparison
Zhai and Previtali (2010) were mainly concerned in the energy saving
features of vernacular architecture. Their project creates a scheme for
classifying different vernacular zones (Figure 2.5); a method by which
energy performance of vernacular dwellings can be analyzed comparative to
typical houses designed using the International Energy Conservation Code
(IECC), and a way to recognize best constructions by vernacular
architecture methods. The scheme was to look into a number of symbolic
vernacular houses gathered at 22 locations in 11 most important climate
zones, with an attempt to classify vernacular tendencies, technology
efficiency, and shed light ahead vernacular architecture methods at
possibility of being disappeared by the building industry. This project
concentrate on a formation of vernacular architecture derived from climate,
cultural and continent, with a purpose of setting up a controllable number of
vernacular regions that can be investigated over a limited period of time.

23
Figure 2.5: symbolic vernacular architecture most important climate zones.
Source: Zhai and Previtali (2010)
The concept is to apply energy saving vernacular methods to modern
buildings and preserve vernacular architecture patterns. Fifty nine styles of
symbolic vernacular houses were recognized and chosen with a minimum of
two samples in every climate zone (Table 2.1). After classifying and
summarizing the principal features of vernacular architecture, an additional
analysis of energy applications of these characteristics has been conducted
to total building energy consumption.
Table 2.1: vernacular regions per climate zones. Source: Zhai and Previtali (2010)

24
The energy efficiencies of the dwellings with vernacular characteristics were
compared opposed to those build up based on to the International Energy
Conservation Code (IECC). Since this research carried out a significant
investigation and computer energy modeling for a group of symbolic
vernacular architectural methods and characteristics for several climatic
regions; the simulation outcome of computer energy models propose that
building codes (IECC) can offer effective directions for designing an energy
efficient dwelling. These codes are improved on the strength of several
earlier experiences and scientific investigations. For now, making an
allowance for particular building practices observed from vernacular
architecture as a methodology to improve building energy performance is a
valuable attempt. For example, the simulation reveals that using vernacular
materials, such as, earth walls and thatch roofs, will enhance the efficiency
of houses.
In a world that is considering the fast distribution of mass produced houses
and buildings designed by architects sometimes thousands of miles away
from the building site, there is a risk that vernacular practices that assist
describe the culture of people and a place will be forgotten. The challenge to
protect these precious strategies and methods will be to envelope these
technologies a way that vernacular architecture turn out to be generally
acknowledged to modern designers and builders.
2.5 Sustainability in Context of Energy and Thermal Performance
Dili et al. (2011) stated that the major function of a building is to present a
comfortable environment, and ruins neither the health nor performance of its
users. A high-quality indoor environment is essential to the succeed building
not only for the reason that it will make its users comfortable, but also

25
because it will determine its energy consumption and therefore affect its
sustainability in context of energy.
2.5.1 Passive Techniques and Energy Consumption
The task of passive means in minimizing the necessity for excessive energy
solutions has become significant within present energy economic crises.
Passive and natural cooling method for buildings can enhance the quality of
indoor environment, present thermal comfort, and minimize energy spending
in buildings. As a consequence, the investigations of natural and passive
techniques for managing indoor environment have gained progressive
concentration in recently. The energy reductions by means of passive and
traditional means in dwellings for the intention of preserving thermal comfort
in comparison with modern practices are proved in a lot of explorations.
Furthermore, the tendency concerning further effective architectural designs
is recessing confronts to the engineers to offer healthy low energy design
solutions.
This research shows the passive methods of Kerala in India traditional
architecture by evaluating different thermal comfort parameters in
comparison with that of modern building. Dili et al. (2011) have carried out a
research on the passive environment methods of traditional architecture of
Kerala which located in the southwest coast of India, has a warm humid
climate. The high sum of moisture in the atmosphere for most of the year
produces thermal discomfort as there is not as much of evaporation
resulting in sweating. Long exposure to these conditions can generate
unpleasant consequences together with massive loss of effectiveness. A
qualitative analysis about the passive ideas implemented in traditional
dwellings. A quantitative study conducted throughout the year to assess

26
thermal comfort and an investigation derived from questionnaire survey
amongst the inhabitants of traditional and modern dwellings on the particular
answers of thermal comfort have been recorded. Nevertheless, it is
necessary to have a relative analysis of traditional dwelling in comparison
with modern dwelling to prove the efficiency of passive methods. Dili et al.
(2011) stated that a field examine was consequently performed in a chosen
traditional and a modern residential dwelling through the majority of summer
period. It was found that the diurnal difference of indoor air temperature is
lower in traditional dwelling compared to the modern dwelling. Time lag
between indoor and outdoor temperature in traditional dwelling is small while
that in modern dwelling is about three hours. This demonstrates the high
thermal insulation and temperature control of the traditional building. Mean
radiant temperature of traditional dwelling is particularly lower than that of
modern residence. This is because of the attendance of cold air deposition
and attendance of cooler surfaces in the interiors of traditional dwelling.
This, low mean radiant temperature adds a lot to the indoor thermal comfort.
While air flow in traditional dwelling is managed and permanent, that in
modern dwelling is few and occasional. The features of air flow in traditional
dwelling preserve the air temperature at a lower level while supplying
evaporative cooling to the inhabitants. It can be obtained that the traditional
architecture of Kerala has an efficient passive and natural control methods
that is reliable for delivering a comfortable thermal indoors in summer.
2.5.2 Integration of Passive and Active Techniques
Ochoa and Capeluto (2007) have simulated a sample office building in the
city of Haifa in Palestine which have a Mediterranean climate (warm
summers and mild winters). The simulations have been conducted in term of
energy performance and visual comfort within three main approaches. The

27
first approach is the outcome of integrating active systems only, the second
is by passive means only and the third approach is the combination of both
approaches. The first group of alternatives contains active features only
using reflective radiation/glare control blinds working automatically at a fixed
angle, stepped lighting controls, low emissivity glass, and artificial night
ventilation motivated by electric fan.
The second group of alternatives includes passive design strategies only
using fixed shading, stepped lighting controls, low emissivity glass, and
natural night ventilation provided by passive methods. Regardless of the
excessive relative humidity levels of Haifa, there are substantial temperature
swings between day and night. Vernacular architectural buildings are built
with great thermal mass. The design process applied for the second
approach incorporates a significant modifies to south orientation and
additional light shelves to grant an optimized passive module.
The third group of alternatives introduces the active systems together with
implementation of intelligent passive design strategies with taking the benefit
of orientation and the energy code system in Haifa with the intention of
achieving the maximum energy efficiency grades that the code can award to
an office project. Three types of light shelves were used, and the active
systems determined by performance in heating, cooling, electricity for fans
and lighting.
The results of applying active systems only seemed to be not reliable for
constant reduction within all conditions where its range between 8% and
40%. Passive design methods achieved from 20% to 60% energy
reduction, but some of these means may not be appropriate to all situations
(based on south orientations only). Nevertheless, mixing active means and

28
accurate passive design techniques creates consistent reductions between
50 and 55% generally when compared to regular conditions. An efficient
intelligent building, as observed from the outcome, cannot be simply a group
of smart active systems. It requires being a creation of a design procedure
that integrates intelligence in all its phases, counting the early decisions, at
the same time as taking benefit of technological advances.
2.6 Sustainable Energy Development
West (2001) stated that with the current greenhouse emissions and energy
decrease movement and according to ecological and environmental
sustainable development, the importance of integrating sustainable energy
developments is now rewarding a huge concentration of building designers
all over the world. The difficulties related to utilization of energy like costs,
materials, greenhouse gas emissions, and renewable and non renewable
reductions have motivated the consciousness and readiness for
technologies that upgrade the sustainability of building development.
2.6.1 Minimizing energy Loads and Operation Cost
West (2001) project is concerned with developing the design and
functionality of curtain walls in a way that it help reducing the reliance on
artificial lighting and minimizing the heat loads and operation cost for both
lighting and cooling through solar control and by means of forwarding the
reflected sunlight inside the building through the curtain walls. Two methods
of solar hood design (horizontal and vertical light pipe technology) have
been tested and it was found that vertical light pipe technology with north
reflectors reached a 40% enhancement in excess of the vertical light pipe
technology without reflectors and it show that borrowed light does not

29
produce heat load as same as direct incident radiation and it can effectively
reduce the need of artificial lighting and additionally, it is flexible and
manageable to be integrated and distributed throughout the building. Such a
method has gained a significant attention around the world especially in hot
climates where solar gain is tremendously strong and heat gains and loads
affects the human comfort and productivity extensively (Figure 2.6).
Figure 2.6: Vertical light pipe technology. Source: West (2001)
In term of ventilation, West (2001) described the stack effect as one of
thermal laws where building can be rinsed out of hot air by stirring up a
convection cycle and replacing hot internal air with cooler external air if
available. It can be supported by wind ventilators when there is no wind or
air movement and some of new building designs show thermal stacks with
the support of wind driven turbines such as The Science Precinct Building at
the University of New South Wales (Figure 2.7).
With Reflector Without Reflector

30
Figure 2.7: The Science Precinct Building at the University of New South Wales.
Source: West (2001)
West (2001) stated that flourishing integration of daylighting and ventilation
technologies rely on cautious design and logical and scientific evaluation.
According to West (2001) assessment, building integrates improved energy
saving features combining daylighting and ventilation technologies could
contain the following features (Figure 2.8): A north oriented facade can
allows the sunlight to access the refracting panels on every floor without
shading the panel beneath, at the same time as presenting adequate
shading to shelter the recessed openings from direct sunlight in summer.
An arrangement of photovoltaic panels and particular wave length reflecting
or refracting panels that delivers refracted or reflected daylight above an
insulated ceiling and reflects it into the office space. In order to minimize the
heat flow to the office space and operates consistently from the glazing to
the air shafts; the floating ceiling is insulated.
By insulating and opening the floating ceiling to the air shaft, hot air is drawn
off to the core generating a thermal chimney and emptying the heat from
every floor. The thermal chimney is formed by creating air passages at the

31
side of the elevators shafts which run by utilizing the stack effect where
cooler denser air is drawn to the building from the open ground. To support
the stack, wind turbines could be implemented on top of the air stacks.
Figure 2.8: integrating energy saving features and daylighting and ventilation technologies.
Source: West (2001)
The results of daylighting and ventilation design confederations of West
(2001) have created a better understanding of the advantages that could
possibly achieved by making use of enhanced designs and sustainable
development of buildings industry where daylighting and ventilation are
essential climate control modules that must be measured to enhance the
sustainability conditions of the building and reduce energy consumption.
2.6.2 Building Design and Energy Consumption
Perez and Capeluto (2009) recorded that in relation to estimations of the US
Department of Energy, 25% of energy operating expenses in schools can be
avoided by improved design of the building and by means of using energy

32
efficient technologies together with enhancement in operation and
maintenance. The main concept of the project is to present particular design
principles for classrooms that most energy conserving by simulating all
building characteristics to verify their effect on thermal comfort and on total
energy consumption required for heating, cooling, ventilating, and lighting
during the occupied period of the year (1st of September to 30th of June).
The analyzed classroom and its features were derived from an initial
research of general design principles of classrooms in Palestine and
obtainable references, specifications and standards.
The base-case classroom employed in this project is derived from
conventional construction methods, standards, and materials. Before
implementing the proposals, a sensitivity analysis has been done to assess
their implication on the achieved results. The classroom size is 50 m2 (7 m
X 7.14 m), with a height of 2.80 m. The preliminary design variables are:
infiltration 0.75 air changes per hour (ach); heavy thermal mass in walls and
roof; the outside wall is totally exposed to sun and has a medium white color
(0.65); and the roof is clear (0.8) and has 30% of its area shaded by
systems fitted on it. The regular opening area is 6 m2 (6 m length and 1 m
height) with a single 6 mm clear glazing and internal shutters that offers a
shading coefficient (SC) of 0.45. The lighting control system is on/off, with
three control zones.
The simulations were conducted initially for sensitivity analysis to find out
the diverse values on energy consumption of each variable by changing one
and holding all the others constant. The insulation and night ventilation were
evaluated to verify the suitable insulation values of walls and roof. These
values were tested with several fundamental night ventilation rates.

33
In relation to the outcome, it is proposed that external walls should have
thermal conductivity of 0.87 W/m2 _C, and roof should have of 0.52 W/m2
_C, together with 30 ach mechanical night ventilation. The infiltration was
assessed by determining the air tightness of a classroom that relies on the
kind, quality, and materials of openings and doors. It was found that doors
and windows shouldn‘t allow for more than .75 to 1.0 ach within closing time.
Various wall and roof sections were checked in term of the location of the
insulation in the external walls and in the roof from being internal to the
thermal mass or being external to the thermal mass. It was verified that no
need for any limitations in term of locating the insulation layer of the external
wall.
Color and exposure of the roof and walls were evaluated to show the
variation of external wall‘s color and exposure to sun radiation and it was
determined that light color roofs with 70 to 100% exposure to direct radiation
demonstrate considerable decrease in the energy consumption. As the
openings have an important effect on energy consumption and classroom
performance, comprehensive assessment were carried out for various
characteristics. It was proposed that windows in north south directions
should have 12% of classroom floor area while 10% for windows in east
west directions. Extreme shading can unfavorably affect the energy needed
for enlightening the classroom. Results demonstrate that northern windows
do not need shading at all. Different glazing types were assessed to find out
the recommended glazing for windows. It was found that low emissivity
glazing can reduce cooling loads and enhance daylighting. Lighting control
system was evaluated within three types of lighting control features.
Automated feature that turns on and off the lights in each different zone in
the classroom resulted in energy savings. Perez and Capeluto (2009) stated
that great operation design of a school classroom in the hot humid climate

34
might decrease the yearly energy consumption for heating, cooling,
ventilation and lighting from 180 to 80 kWh/m2. This indicates a drop of over
50% of the energy consumption as put side by side to conventional
classroom in Palestine. The cooling scheme is the foremost energy
consumer that has remarkable energy reduction ability. However, even in
the enhanced classroom cooling energy is much higher than the energy
used in all the other systems due to the climate that is hot and humid with
high latent and sensible heat.
A decrease in utilizing the artificial lighting plays a role in lessening the heat
loads and consequently energy lessening for cooling. The use of mechanical
ventilation system in the enhanced classroom does spend some energy but
it trims down the energy utilized for cooling and general reduction in energy
consumption. These results highlight that applying these design
suggestions in schools in the hot and humid climates will not only achieve a
substantial minimization in the energy consumption, but will also provide
more enjoyable and comfortable space for the children.
2.7 Regulatory and Voluntary Policy Instruments
Lee and Yik (2004) stated that in modern cities, Buildings are the major
energy consumers however their expenditure could be reduced by
enhancing the performance to minimize the greenhouse gas emissions and
hold up the diminution of nonrenewable resources. Lee and Yik (2004) have
discussed the regulatory and voluntary policy instruments correlated to
building energy efficiency and they found that the implementation of policy
mix concerning both regulatory and voluntary instruments are more
preferable and effective. They reported that optimistic alterations to the
social, economic and environmental gains in societies can be achieved

35
through employing regulatory instruments. The strongest regulatory
instruments are those that enforce restrictions, such as on energy
consumption or a forbid on import, export, manufacturing and making use of
particular materials such as CFC compounds.
Other regulatory methods is commanding tax over energy consume or fines
for extreme expend, energy tax would assist reducing energy waste and
GHG emissions by raising the cost of energy to consumers where consumer
should pay an amount of tax relative to the amount of energy consumed.
Supporting voluntary methods is also one policy means. Eco-labeling
systems have been used to advance improved environmental efficiency of
products. such systems would encourage building owners and developers to
object buildings with advanced environmental performance if it will expose
improved building performance that attract future buyers and tenants of their
properties. Lee and Yik (2004) proposed particular classifications that allows
for more methodical study of the numerous schemes employed for
improving building energy efficiency:
Building energy codes that are regulatory necessities.
Incentive methods, together with several methods that grant financial
support or allowance that can offset the costs.
Eco-labeling systems, counting those that take on a single threshold
rating of different levels of standards.
Lee and Yik (2004) reported that more determined objectives would require
to be accomplished by means of mixing regulatory and voluntary

36
instruments. The association employs of compulsory building energy codes
and voluntary systems should be a good methodology, as they can reveal
the improvement costs for the assessment method; can decrease the
institutional costs by permitting the regulatory tool to apply a extra willingly
suitable compliance level; and can minimize the costs of completion if
positive voluntary evaluation results can be regarded as verification of
fulfillment with regulations.
2.8 Successful Sustainable Development Experience
Melchert (2007) recorded that since buildings industry indicates consuming
of water, energy, raw material and usage of land; it is thus responsible for a
huge division of environmental degradation in the world where in
organization for economic development and co-operation countries around
half the total carbon dioxide output is produced which can be significantly
affected through designers, engineers, urban planners, and policymakers.
The poor coordination between building and urban planning and the
ineffective management of lands have resulted in building a sick
environment in the developing world. These concerns regarding building
sustainability have crashed the energy domain and sustainable building
policy fields extensively and it is became a necessity to rise up and enhance
the research programs together with new legislation and policy instruments.
Melchert (2007) have described the Dutch sustainable building policy
recording that until the 19th century the Dutch planning regulatory have
eliminated the open sewers and provisioned the clean water with clear
instructions regarding noise and damp reduction, enhanced natural light,
ventilation, and heating in the buildings. Through the 20th century and mainly
in mid 1980s, the Netherlands has spent huge efforts to manage the

37
negative building impacts on the environment and has attained an ideal
approach broadly.
Melchert (2007) reporting that the first development period of the Dutch
sustainable building policy was in the 1970s with disconnectivity from the
existing networks of infrastructure where the first significant matters of
building energy and environmental impacts in the Netherlands took place in
1973 when the Organization of Petroleum Exporting Countries (OPEC)
enforced an oil restriction against Western nations, minimizing oil exports to
a number of countries and forbid it totally to the United States and the
Netherlands. In the early 1980s energy efficiency developed to be basic
matter of the building business where number of new programs was carried
out in residential, offices and other commercial and industrial buildings. In
mid 1980s, a new period started with policies motivated to upgrade the
environmental effectiveness of buildings in perspective of comparatively
deep connections to networks where National Environmental Policy Plan
which was issued in 1989 and the National Environmental Policy Plan Plus
in 1990.
Melchert (2007) acknowledged that an innovative stage in the instituting the
systems of sustainable building in the Netherlands therefore started to come
out as the sustainable expansion moved toward the forefront setting up the
concept of energy efficiency, quality, and closed loops for materials as major
policy outlines.
Melchert (2007) noted down that the most outstanding case that showed
how a sustainable building ought to be like was the Ecolonia residential
district (Figure 2.9), presenting several environmental methods that time like
solar boilers, heat buffers, sandlime brick, cellulose insulation, broken
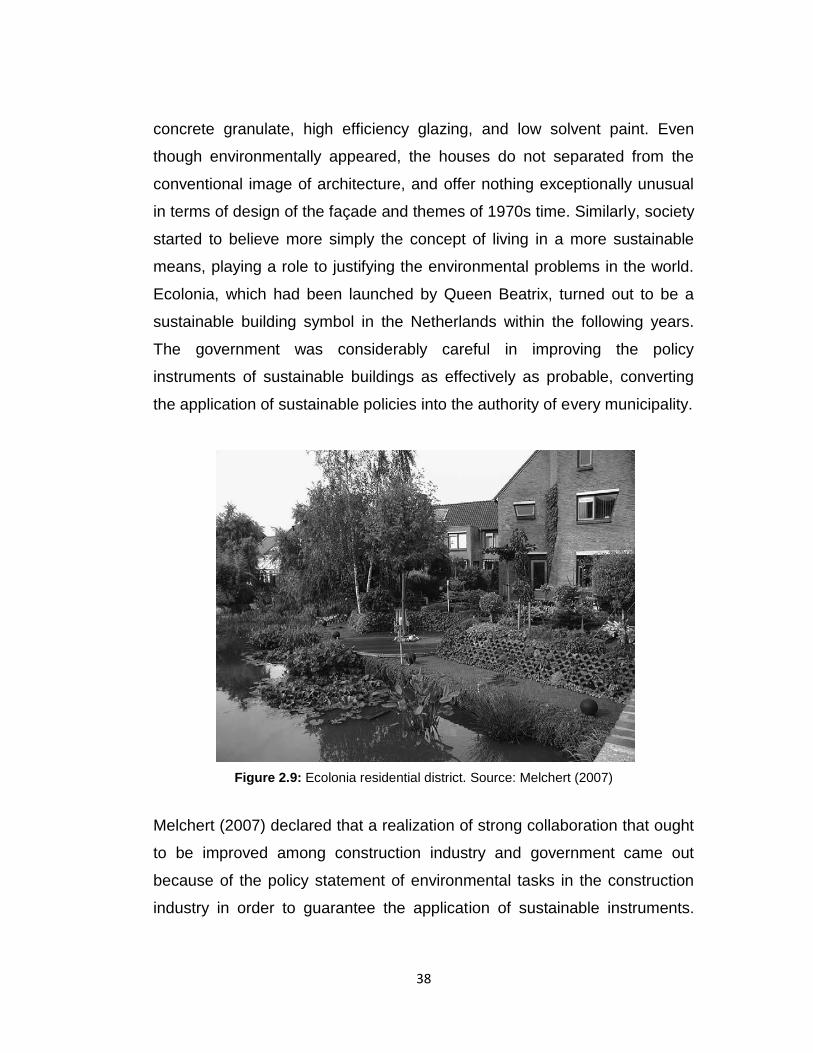
38
concrete granulate, high efficiency glazing, and low solvent paint. Even
though environmentally appeared, the houses do not separated from the
conventional image of architecture, and offer nothing exceptionally unusual
in terms of design of the façade and themes of 1970s time. Similarly, society
started to believe more simply the concept of living in a more sustainable
means, playing a role to justifying the environmental problems in the world.
Ecolonia, which had been launched by Queen Beatrix, turned out to be a
sustainable building symbol in the Netherlands within the following years.
The government was considerably careful in improving the policy
instruments of sustainable buildings as effectively as probable, converting
the application of sustainable policies into the authority of every municipality.
Figure 2.9: Ecolonia residential district. Source: Melchert (2007)
Melchert (2007) declared that a realization of strong collaboration that ought
to be improved among construction industry and government came out
because of the policy statement of environmental tasks in the construction
industry in order to guarantee the application of sustainable instruments.

39
From this point, the sustainable building practices started to grow and cover
all building industries and projects in order to create green resolution in
construction developments. The Dutch government began to work on the
equivalence of a preparation structure, and in 1996 it initiated the national
sustainable building packages representing approaches projected to be
implemented by the Dutch building industry in a voluntary means, and
signing a new statement in the sustainable building policy in the
Netherlands. The Dutch energy and environmental agency set up an energy
performance standard determining the amount of energy that a building is
permitted to utilize. This policy standard symbolizes an innovation in the
Dutch sustainable policy and forcing several types of buildings to meet a
required performance that reduces over the years. In 1995 the energy
performance standard was set at 1000 MJ/m2/year, while in 2001 it was set
at 850MJ/m2/year, and it is expected to be 600MJ/ m2/year in future.
Another policy instituted for existing buildings which long term agreement
program is commanding the existing buildings to minimize their energy
utilization 25% based on 1995 levels for duration of 10 years. An additional
policy instrument produced by the government is an energy performance
advisory which determines the energy spending of existing buildings by
measures of a scan, to which commendations for upgrading might to be
added. At the present time, the energy performance standard is associated
in the building cod and managed in the building permit granting processes.
Melchert (2007) stated that one of the cases that preeminent demonstrates
the present sustainable renovation of the Dutch sustainable building
experience is the ABN AMRO international headquarters in Amsterdam
(Figure 2.10). ABN AMRO international headquarters was graded by the
American Institute of Architects (AIA) as one of the ten best global green

40
developments in 2001. This building forms a foremost channel scheme for
sustainable development. With a total floor area of 90,000 m2 to contain
3000 employees, it‘s not easy to afford a healthy and comfortable internal
environment and at the same time preserve a great amount of energy
saving. An additional confront is to articulate the uniqueness and integrity of
one of the world‘s principal banks, that is to reveal, of an international
powerful, professional, reliable, dynamic and experienced financial
foundation.
Figure 2.10: Dutch sustainable building experience - the ABN AMRO international
headquarters. Source: Melchert (2007)
Melchert (2007) illustrated that at the first phase of the project, the bank and
the department of physical planning in Amsterdam authorized an agreement
determining a number of manners of collaboration. This contract involves a
best possible incorporation of the building with the neighboring environment

41
ensuing in the integration of a public plaza in front of the building. Another
agreement was as well initiated with authorities of public transportation,
providing only 750 car parking for 3000 employees to support the make use
of public transportation. In response, the municipality had dedicated to
develop the public transportation routes.
The bank supports the use of bicycles and affords suitable amenities on the
location of bicycle parking. In terms of environmental technologies, the
building presents a scheme of ventilated glazing that remove the old air
from the offices through a cavity in the middle of the external and internal
glass panels in order to minimize the cooling energy. The suns radiation is
decreased throughout these cavities with sun blinds in-between. In wintry
weather, the condition is upturned and there are no heating mechanisms
needed along the façade since the great thermal insulation avoids from heat
losses. Furthermore, the building has a technique of climate ceiling that
activates the cooling and divisions of the heating methods of the building.
These are perforated aluminum panes with split linking channels for
temperate and cooled water, which are in sequence s delivered to the
offices as needed. The cooling is derived from the coldness of a basement
aquifer and attached to night ventilation in summer. In term of heating, the
compound attempts to employ waste heat to heat the basement parking,
which automatically assists the rest of the building being hot. The building is
associated to the district heating system that in sequence provides the
fundamental requirements. Further demands are produced through a boilers
scheme.
Finally, in terms of environmental management, the building integrates an
energy scheme to meet the terms of the Dutch energy policy. This
comprises a comprehensive observation technique recording rhythms of

42
energy, electricity and gas consumption every 15 min in order to discover
defects immediately. Moreover, the energy management system controls
the consumption of energy through behavioral operations and when the
offices are closed or empty from employees. According to these attempts,
the building saves about 1–2 million Euros for every year owing to the
minimization in energy utilization.
Melchert (2007) demonstrated that integrating the concept that combining
environmental policy methods together with sustainable tools and effective
resource supervision can direct to substantial environmental developments
without being far from modernity and modern schemes or conflicting with the
economic benefits of the building business. With the intention of performing
such a representation effectively, it is essential that a meaning of
association and loyalty relating the investors and government to be formed
to start through conversation encouragement and elevating the grade of
environmental consciousness of every related stakeholder; certifying and
defining clearly the collaboration schemes of sustainable building attempts
by formal documents; lastly, by efficient mixture of limitations and facilitating
policies of legal, economic and voluntary instruments.

43
Chapter 3: Research Plan

44
3.1 Introduction to Research Phases
The intention of the study is to evaluate the sustainable development of local
housing units in UAE within its rapid economic growth from its: Historical
housing before 1970s crossing the discovery of oil, population explosion,
and first appearance of governmental requirements during 1970‘s-1990‘s.,
The economic revolution and first edition of building regulations after 1990s,
the second edition of buildings regulations in 2000 until economic crises.,
The expected results of new practices of Dubai Green Buildings Regulations
and Specifications after 2014; and afterward the effectiveness of Estidama
rating system of Abu Dhabi as a mix policy of regulatory and voluntary
instrument.
3.2 Motivations
Over the last 30 years, the UAE and Dubai specifically has faced an
expeditious expand in infrastructure and urbanization. This rapid
development has come out with huge increase in residences, offices,
factories and overall building businesses.
The rapid development and urbanization has significant effects on
sustainable development of building industry in UAE especially for the local
housing units which has faced sudden change, radical transform and
fundamental renovate of total housing architecture and technologies.
Investigating on the sustainable development of local housing units in UAE
has come out from several motivations. One of the most important reasons
to explore is that the hot and humid climate of UAE which is a primary
ground of changing building form and technology in order to achieve
maximum and stable thermal comfort level without thinking about the

45
impacts of this change. Another motivation is that the waving and unstable
development of building technologies due to rapid increase of urbanization
and economic expansion which led to escalate the energy consumption
extensively and abnormally and as a result rising global environmental
problems that necessitates an immediate interventions and revolutionary
solutions
3.3 Aims
To identify a clear vision of sustainable development of local housing
units in UAE.
To create an expound reference of housing development features of
the country.
To enhance the green buildings industry in UAE and encourage
owners and investors to invest on sustainable projects.
To verify that sustainable practices are capable to provide more
comfortable homes with better thermal performance and lesser
energy consumption which enhances the quality of life and turns
down the Ecological Footprint.
To create a reference guide of sustainable development history,
practices, policies, expenses and experience for architects,
consultants, contractors and investors and other concerned
professionals.

46
3.4 Objectives
Create a timeline of building development that shows the waving of
sustainable progression overtime.
Evaluate the local housing units of the created timeline in term of
sustainable development scope of energy consumption and thermal
performance.
Evaluate the sustainable progression and built environment and find
out the perfect balance of (green and comfort) for future development
of the country.
Set up a cost effective analysis of implementing green buildings
practices in Dubai and Abu Dhabi in comparison with current state
expenses.
3.5 Justification
Since the UAE is in immediate need for radical change to improve its
sustainable future, and since there is no clear layout of its expected results
within its green revolution, and given that the green revolution is totally new
and up to date experience for UAE people, investors, consultants,
contractors and other concerned professionals, and in view of the fact that
UAE lacks of research and studies in this field; it was found that
investigating on sustainable development of local housing units in UAE is
essential and indispensable at present time with the purpose of living
through a successful sustainable development experience worldwide.

47
3.6 Research Plan
The research will comprise theoretical and technical assessment of
sustainable building development in UAE focusing on local housing units
and villas throughout:
Analyze the impacts of different evaluation parameters of sustainable
development on each period specified in the timeline.
Analyze and estimate the energy consumption, and the thermal
performance of each period specified in the timeline.
Compare the buildings of each timeline period to each other and
evaluate the building and sustainable statement of each period.
Predict the future outcome of the planned practices of Green
Buildings Regulations and Specifications on sustainable development
of local housing units in Dubai and afterward compare it to Estidama
Rating System of Abu Dhabi.

48
Chapter 4: Methodology

49
4.1 Method Selection and Justification
Going back to the papers conducted in the literature review, it was found
that the methodologies used are varying from paper to paper and from topic
to another conducting different methods and approach to achieve particular
results such as observation method, computer simulation, qualitative and
quantitative analysis, survey, field observation, lab experiment, qualitative
evaluation and an extensive literature review and case studies with the
consideration of that all papers were concerned with sustainable
development, thermal comfort, and energy conservation matters. The
following discussion about pros and cons of the above mentioned methods
is conducted in order to select the appropriate research method for this
study.
4.1.1 Field Observation and Survey Method
Observation method allows gathering direct, actual and wide range data with
large variety of interaction and operation behaviors between people and
surrounding environment. It describes the behaviors as it happens in the
natural environment. It helps understanding the general context of the
environment and how people deal with it. The observation method is used
so as to record the general behavior of particular building or people using
that building or even the surrounding environment of it within certain
conditions with the purpose of analyzing the recorded data in order to
understand and perceive the motivations and the grounds of such
performance and routines. The observation method can present exact data
regarding actions and reactions of people, buildings and environment. It can
help in understanding the situation and context of the observed object. It

50
could be good method in recognizing unexpected results and it could be
applied in natural environment. It is effective in primary phases of a
research. On the other hand, observation method does not allocate solid
grounds regarding cause and effect. observation method is expensive and
time consuming since it is hard to control or repeat particular situations and
could disturb the results if any actions are missed or passed without
recording thus the observation method require qualified and well trained
observers.
When the descriptive and observational method is not enough or too general
to gather the required information then a survey method could be conducted
in order to collect the exact data needed in the research area to be
analyzed. Survey method is inexpensive, effective in describing features of
large areas of projects or people, results can statistically organized and
analyzed with flexibility of different variables. It is worth to mention that
surveying method is subjected to be strong on reliability and weak on validity
since it is based on accuracy of people‘s answers and responds.
In the paper of Dili et al. (2011) they have used field observation method
combined with qualitative and quantitative analysis and survey method. The
paper introduces the passive environment control of traditional residential
buildings in Kerala in India by investigating different thermal comfort factors
in comparison with that of contemporary architecture. In order to detail the
passive means implemented in vernacular architecture; a qualitative
analysis has been conducted. And with the intention of assessing the
thermal comfort; a quantitative exploration has been performed throughout
the year. A questionnaire survey with the inhabitants of modern and
traditional houses have been carried in order to report the thermal comfort
conditions in each type of building. A field study was consequently

51
performed in a chosen vernacular and contemporary dwellings in the period
of the most unlikable summer season. After that a comparative analysis
between vernacular and contemporary houses carried out in order to
validate the efficiency of passive control systems.
4.1.2 Lab Experiment Method
Lab experiments are known to be easier in controlling and repeating
different environmental variables as needed which enhances its reliability
and flexibility. Lab experiment method allows setting variety of control
variables and testing actual material properties of three dimensional scaled
model within artificial environment that has same as natural settings which
can be repeated, isolated and assembled. However, lab experiments
contribute some disadvantages regarding ecologically validity since it is
conducting in artificial environment as well as it is costly in term of material
cost, physical model cost, and lab preparation, tools and equipments cost. It
is important to state that the validity of lab experiment is derived from the
correctness of the controlled variables while the field experiments have the
benefit that results are performed in natural settings rather than in an
artificial lab atmosphere and it provides real time outcome. On the other
hand, field experiments are exposed to the chance of corruption since its
conditions cannot be repeated or controlled with more concentration and
assurance as that of experiments conducted in the lab. Furthermore, field
experiments are time, efforts, and money consuming compared to lab
experiments.
West (2001) have used lab experiment test method with the support of the
Construction Management program at University of Technology in Sydney
(UTS) which has constructed a light inlet test building to be a symbol of the
52
curtain wall configuration that is similar to that of multi storey buildings. A
variety of techniques have been assessed in order to transport mirrored light
on top of the floating ceiling and afterward circulate this light all over the
building. The Construction Management program and Mechanical
Engineering program at UTS have additionally formed a test rig to evaluate
wind driven ventilators which resulted in calculating the natural ventilation
rates.
4.1.3 Computer Simulation Method
Computer simulation method was found to be a valid method in the area of
energy performance and sustainable built environment since it does not
require a real materials or human resources and it offers an actual results of
the selected design before put it into practice in the real environment which
helps avoiding errors and mistakes without consuming a lot of time and
money for testing out. This methodology provides wide scale testing with
wide range of combinations, computations, variations, and variables in a
shorter period of time and with the minimum possible cost. The
environmental parameters in the computer simulation method are able to be
more controlled and separately operated, modified and repeated. It is
important to clarify that the accuracy and logically results of computer
simulations depends on the level of correctness and the scale of details of
the input data. Another thing to be considered when choosing the computer
simulation method is the reliability and validity of the software and its
flexibility to use.
In Ratti et al.(2003) paper a computer simulation method and comparative
analysis have been conducted to find out which urban form make the best
use of land in hot climates. Ratti et al. (2003) have built three computerized

53
models for different urban forms with the same built up volume. The
computer simulations were performed using Matlab image processing
toolbox which assessed finding out the energy consumption within several
variables, solar radiation and exposure, wind and effect of form on pollutant
movement. After that they applied mathematical method to obtain accurate
expectations concerning their conclusion. Similar to Ratti et al. (2003) paper,
Zhai and Previtali (2010) paper was conducted computer simulation also as
the main method for their investigation. This investigation brought up a
method to classify different vernacular zones and assess energy efficiency
of early historical dwellings in addition to categorizing most favorable
buildings employing vernacular practices. The paper performed a substantial
computer energy modeling using Building energy simulation and
optimization tool (BEopt) for a quantity of symbolic early vernacular
architectural features experimented for diverse climatic zones. The
vernacular assessment themes were evaluated in contradiction of those built
based on the International Energy Conservation Code and those produced
by the optimization software.
Another time in the direction of computer simulation, Ochoa and Capeluto
(2007) investigation has utilized computerized energy modeling methods as
well where a base case model of office space was created with three
different varsities of environmental technologies in order to assess the
energy efficiency and visual comfort. The first division was the outcome of
the integration of active technologies only, the second division was directed
through intelligent passive design strategies, and the third division was the
mixture of both approaches. Ochoa and Capeluto (2007) reported that the
computer simulation using EnergyPlus software has helped in reducing the
time required for such investigation in other evaluating methods as well as
determining the significant points that needs a detailed analysis, and

54
evaluate the simulated technologies in term of electricity used for lights and
fans, heating, and cooling.
Perez and Capeluto (2009) paper had conducted comprehensive computer
simulation methods using three computer softwares: the dynamic simulation
model ENERGY was used for energy efficiency evaluation, SHADING
software was used for hourly geometric insulation coefficient (GIC) of the
windows, and ‗RADIANCE software was used to calculate the daylight
scattering in the classroom for every window size, location, and geometry.
The main concept of the simulation method was to modify the specified
values separately to discover the value that reduces energy spending and at
the same time as maintaining thermal and visual comfort of the space. After
that, a comparative analysis were conducted to find out which variables
have best effect on the energy utilization and thermal comfort and how their
total influence relies on the arrangement of application of every
development.
4.1.4 Literature Review and Case Studies Method
Literature review method can offer great volume of strong and inexpensive
information. It forms a solid foundation of future work that based on better
understanding and empirical basis for efficiency. Literature review and case
studies research methodology can offer well knowledge of complicated
issues or subjects through elder investigations. It could be a good
exploratory and investigative method to generate new findings; and
constructive method to solve some problems; or even confirmatory method
to evaluate particular findings and observed records. However, case studies
cannot be controlled as lab experiments and computer simulations. Case
studies accuracy is based on similar findings and outcomes thus it is usually

55
not enough to relay on one case. Most case studies investigations employ
several cases to prove particular finding.
Roaf (1988) paper has used the case study and observation method to
describe the living routines of people exist in hot climates as those of Yazd
in Iran. She has evaluated their level of thermal comfort based on weather
data characteristics of Yazd together with the recording of the people
movement during day and night, and summer and winter. After that she
conducted a comparative analysis between different design configurations of
wind towers in several types of hot climates to show how building form and
people behavior changes from region to region in order to achieve certain
thermal comfort level.
Lee and Yik (2004) paper illustrates a qualitative evaluation and an
extensive literature review concerning regulatory and voluntary policy
instruments regarding building energy performance and efficiency. And
Melchert (2007) paper investigates the establishment of environmental
policy instruments in the Dutch building division and the ability of the present
example to be applied in developing countries. Primary, it evaluates the
conversion of sustainable customs in the Netherlands from the 1970s until
present time, investigating how these were initially rooted in a discussion of
de modernization which tried to develop the environmental implementation
of buildings by approaches of self sufficient tools, while these days they
implement a structure of ecological modernization with integration schemes
looking to enhance the environmental efficiency of buildings by more
effective tools.
The paper afterward demonstrates how the present Dutch sustainable
building foundation has in that way directed to reach a practical and broadly

56
acknowledged motivation that can work to adjust the ecological reformation
of building industry in developing countries.
4.2 Method Selection Conclusion
Different methods have been used to assess the sustainable development,
energy consumption and thermal performance overtime. Most papers have
relied on more than one method to attain reliable outcomes while other
papers have employed classical methods of literature reviews and
observations in order to explain and clarify particular conditions. It was found
that the advantages and disadvantages of the discussed methods is based
on particular aspects such as time consuming, money spending, instruments
availability, output accuracy, controllable variables and environment,
changeable factors, validity and reliability.
4.3 Selected Method
Based on the above discussion about different research methodologies
used in this research area, it was found that computer simulation method is
the most appropriate method to handle the objectives of the research field
due to its ability of saving time and money, using plenty of materials
properties, presenting annual climate data, providing wide range of
changeable parameters and giving valid dependable and reliable results.
Other supportive methods have been selected beside the main method of
computer simulation which are database survey and field observation
method in order to gather particular specifications since the study is
conducted on different properties and characteristics of building
development over long timeline period and each period has its identifiable
specifications.

57
4.4 Selected Computer Simulation Software
Crawley et al, (2008) have performed a comparative study of most important
building energy programs including: BLAST, BSim, DeST, DOE-2.1E,
ECOTECT, Ener-Win, Energy Express, Energy-10, EnergyPlus, eQUEST,
ESP-r, IDA ICE, IES/VES, HAP, HEED, PowerDomus, SUNREL, Tas,
TRACE and TRNSYS. The paper has compared the above programs in
term of: General Modeling Features, Zone Loads, Building Envelope and
Daylighting, Infiltration, Ventilation and Multizone Airflow, Renewable
Energy Systems, Electrical Systems and Equipment, HVAC Systems, HVAC
Equipment, Environmental Emissions, Economic Evaluation, Climate Data
Availability, Results Reporting, Validation, and User Interface, Links to Other
Programs, and Availability. The following tables illustrate the general
modeling features and thermal performance estimations of each software.
Table 4.1: Zone loads and general modeling features of major building simulation
softwares. Crawley et al, (2008)

58
Table 4.2: Building envelope, daylighting, solar radiation and thermal performance
estimations. Crawley et al, (2008)
From the previous comparisons of Table 3.1 and Table 3.2 it was found that
the software of Integrated Environmental Solutions-Virtual Environment
(IES-VE) is the best software to be selected in the area of the sustainable
development of local housing units in UAE mostly owing to its reliability,
validity and flexibility to use. It can carry out energy performance snaps to
evaluate the results of the conducted design; it can measure different
passive and active technologies; it can estimate the effects of daylight and
solar radiation; it can analyze the building loads and results of conservation
schemes; and it can evaluate the compatibility with a series of international
regulations and voluntary policy instruments. IES offers an extensive series
of diverse analysis choices and potentials intended to provide response
immediately and professionally at the appropriate point with comprehensive
simulations at hourly or less as required. Crawley et al, (2008) reported that
IES-VE contains:
Model IT- geometry creation and editing.
Apache Calc- loads- analysis.
Apache Sim- thermal.

59
Macro flo- natural ventilations.
Apache HVAC- component- based HVAC.
Sun cast- Shading visualization and analysis.
Micro flo- 3D computational fluid dynamics.
Flucs pro/ radiance- lighting design.
DEFT- model optimization.
Life cycle- life- cycle energy and cost analysis.
Simulex- building evacuation.
4.5 Selected Software Validation
The IES-VE software has been validated and certified from several
international institutions such as the Department of Communities and Local
Government (CLG), Energy Balance Evaluation (EBE) and American
Institute of Architecture (AIA). The official website of IES-VE incorporate
more details about its validity (www.iesve.com). Additionally, the
computerized model has been reviewed by IES technical team and other
software professionals throughout different project phases. It is worth to
mention that international case studies have been simulated and evaluated
in term of energy consumption and thermal performance by IES-VE software
such as the Grand Mosque of Abu Dhabi (Figure 3.1) which has been
simulated in term of HVAC design and optimization, thermal comfort
analysis, occupant evacuation and smoke extract performance, dynamic
thermal, solar shading, bulk air flow, CFD and evacuation simulation.

60
Figure 4.1: IES-VE model (left side) and simulations (right side) of Grand Mosque of Abu Dhabi. Source: (www.iesve.com)
Other international cases that have been simulated by IES-VE software like:
Heathrow Airport Terminal 5 Concourse in London (Figure 3.2), Royal Bank
of Scotland World HQ in Edinburgh (Figure 3.3), Royal London Hospital
(Figure 3.4) and Worcester College of Oxford University in London (Figure
3.5).
Figure 4.2: IES-VE model (left side) and constructions (right side) of Heathrow Airport
Terminal 5 Concourse in London. Source: (www.iesve.com)
Figure 4.3: IES-VE simulation (left side) and building (right side) Royal Bank of Scotland
World HQ in Edinburgh. Source: (www.iesve.com)

61
Figure 4.4: IES-VE model of Royal London Hospital (left side). Source: (www.iesve.com).
Figure 4.5: IES-VE model of Worcester College of Oxford University in London (right side).
Source: (www.iesve.com)
4.6 Analysis Procedure
Set up a Building impacts analysis of local housing units within
timeline periods in term of energy consumption and thermal
performance.
Set up an energy cost analysis of sustainable development timeline
based on current market values and compare the cost difference
among the current state, Dubai future after applying green buildings
regulations and Estidama rating system of Abu Dhabi.
Set up a material cost analysis of the changed or modified materials
between current statement, future statement after applying Dubai
green regulations and subsequently the statement of Abu Dhabi
Estidama rating system.
Conduct a simple payback analyses of recent sustainable
development timeline based on energy cost analysis and modified
material cost analysis.
;

62
Chapter 5: Housing Units Selection

63
5.1 Introduction of Housing Units Selection
A detailed historical review has been conducted in order to create the
periods of sustainable development timeline based on historical data and
breaking times that have a significant change in architectural and
sustainable appearance of the city as discussed earlier in the introduction
section. The local housing units have been selected after creating the
sustainable development timeline.
5.2 Sustainable Development Timeline
It was found that the local housing units have faced remarkable changes
from living in traditional houses before 1970‘s to start living in houses with
new forms, materials and technologies since new concrete materials has
arrived and new electricity consuming cooling systems became available.
After 1990‘s the local housing units has faced new architectural appearance
due to increased population and arriving new international styles of
architecture as well as the first edition of rules and regulations that has
organized and controlled the building forms.
After the year 2000 the second edition of rules and regulations has been
established in order to be more compatible with life style requirements. At
the same time the first edition of thermal specifications has been instituted
which has a fundamental effect on overall building industry since that time
until current statement.
In the year 2010 the first edition of Dubai green buildings regulations and
specifications has produced with the intention of make it a mandatory policy
instrument in 2014 while Abu Dhabi has established the new Pearl Rating

64
System for Estidama which is a mix policy of regulatory and voluntary
instrument. Table 4.1 demonstrate the remarkable periods of building
development in Dubai and Abu Dhabi which will be the reference guide of
selecting typical housing unit of each period in the created timeline of
sustainable development.
Table 5.1: Sustainable Development Timeline of Local Housing Units in UAE
Before
1970‘s 1970‘s – 1990‘s 1990‘s - 2000 2000 - 2010
After 2014
Dubai
Green
Regulations
Abu Dhabi
Estidama
Rating
System
Historical
buildings
Oil, population
explosion, and
first appearance
of governmental
commands
(forbidding the
integration of
internal
courtyards)
Economic
revolution and first
edition of building
rules and
regulations
Second edition
of building rules
and regulations
and first edition
of thermal
insulation
specifications
Green
Building
Revolution
Green
Building
Revolution
5.3 Selection and Evaluation Parameters
The selection and evaluation parameters of local housing units have been
determined in term of major impacts on energy consumption and thermal
performance of buildings and sustainable development in UAE (Table 4.2).
The factors were obtained from literature review, Dubai building rules and
regulations, and Estidama Rating System of Abu Dhabi.
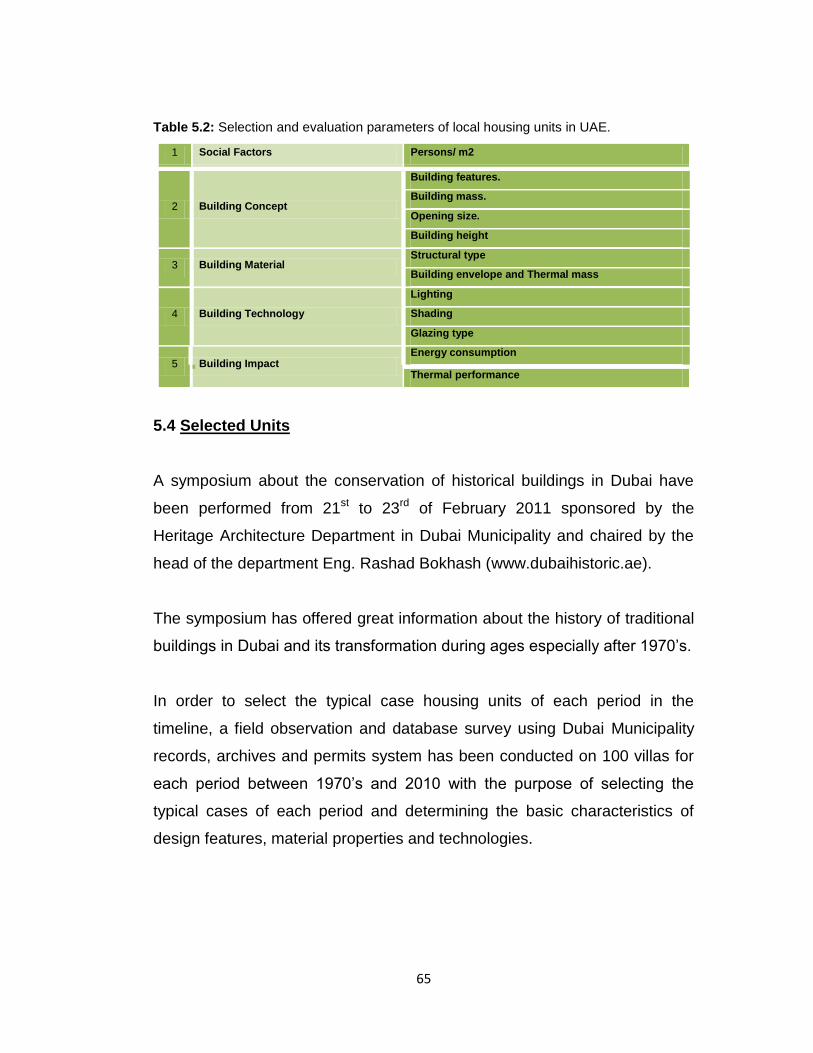
65
Table 5.2: Selection and evaluation parameters of local housing units in UAE.
1 Social Factors Persons/ m2
2 Building Concept
Building features.
Building mass.
Opening size.
Building height
3 Building Material Structural type
Building envelope and Thermal mass
4 Building Technology
Lighting
Shading
Glazing type
5 Building Impact Energy consumption
Thermal performance
5.4 Selected Units
A symposium about the conservation of historical buildings in Dubai have
been performed from 21st to 23rd of February 2011 sponsored by the
Heritage Architecture Department in Dubai Municipality and chaired by the
head of the department Eng. Rashad Bokhash (www.dubaihistoric.ae).
The symposium has offered great information about the history of traditional
buildings in Dubai and its transformation during ages especially after 1970‘s.
In order to select the typical case housing units of each period in the
timeline, a field observation and database survey using Dubai Municipality
records, archives and permits system has been conducted on 100 villas for
each period between 1970‘s and 2010 with the purpose of selecting the
typical cases of each period and determining the basic characteristics of
design features, material properties and technologies.

66
5.4.1 Historical Unit
The traditional house of Dar Al Nadwa in Al Bastakiya historical district as
shown in Figure 4.1 was chosen to be simulated and analyzed since it is
symbolizes the typical traditional house of that era and considered as one of
the most important historical buildings in Dubai.
Figure 5.1: The traditional house of Dar Al Nadwa in Al Bastakiya historical district.
Source: (www.dubaihistoric.ae)
5.4.2 1970‘s – 1990‘s Unit
It was found that the arcade design element was the dominant feature of the
houses built in early 1970‘s until late 1980‘s since 86% of houses at that
time contain this feature. Figure 4.2 and Figure 4.3 illustrate the arcade
feature design that has been obtained from Dubai Municipality archives
system and Figure 4.4 shows the arcade feature design that has been
recorded by field observation method.

67
Figure 5.2: Arcade design element for ground floor house of 1970‘s- 1990‘s period.
Source: Dubai Municipality
Figure 5.3: Arcade design element for two floors house of 1970‘s- 1990‘s period.
Source: Dubai Municipality
Figure 5.4: Different houses shows arcade design element of 1970‘s- 1990‘s period

68
5.4.3 1990‘s – 2000‘s Unit
After the beginning of 1990‘s, a 72% of houses found to have the pitched
roof design combined with outer brickwork finishing.
5.4.4 2000‘s – 2010‘s Units
After the year 2000 the design forms started to expand, thus two cases were
selected to be simulated in this period as it was found that 38% of the
houses are post-modern designed (Figure 4.5), 41% are re-traditional
designed (Figure 4.6), and 19% comprise other forms and designs.
Figure 5.5: post-modern designed housing units of 2000 – 2010 (left side). Source:
(http://dubaipropertiesgroup.ae)
Figure 5.6: re-traditional designed housing units of 2000 – 2010 (right side). Source:
(http://dubaipropertiesgroup.ae)
5.5.5 2010‘s – 2014‘s Units
The future cases are enclose the same design of the current period 2000 –
2010 (Figure 4.5) and (Figure 4.6) but with particular modification on its
construction materials, sustainable technologies and specifications that

69
based on green building regulations and specifications which will be
mandatory policies after 2014.
Table 5.3 demonstrates the general specifications of each local housing unit
based on selection and evaluation parameters.

70
Table 5.3: general specifications of each local housing unit based on selection and evaluation parameters
Be
fore
19
70
tra
ditio
na
l0
.06
1.6
ba
rje
el w
ind
to
we
r &
inte
rna
l co
urt
yard
surr
ound
ed
with s
ha
de
d c
orr
ido
rs.
co
ral s
tone
, m
ud
, str
aw
,
pa
lm tim
be
r .6
m thic
k w
alls
mud
no
or
very
sm
all
win
do
ws to
outs
ide
& la
rge
win
do
ws
ove
rlo
okin
g to
the
inte
rna
l co
urt
yard
1x
2.5
m
no
gla
zing
- o
nlu
wo
od
en s
hutte
rs
tre
e insid
e the
co
urt
yard
- s
ha
de
d
co
rrid
ors
aro
und
the
co
urt
yard
na
tura
l ve
ntila
tio
n
only
na
tura
l lig
ht,
tung
ste
n la
mp
s
and
lante
rn
no
se
t b
ack li
mits -
very
na
rro
w s
ikka
s
re-t
rad
itio
na
l
ba
rje
el (
de
co
rative
only
) w
ith te
rra
ce
in
fro
nt e
leva
tio
n s
ha
de
d b
y w
oo
de
n
pe
rgo
la.
gyp
sum
pla
ste
ring
ext
ern
al w
ind
ow
s
only
- 1
0 %
of ro
om
are
a
wo
od
en p
erg
ola
co
vers
the
te
rra
ce
-
tim
be
r b
lind
s a
nd
louve
rs
po
st-
mo
de
rn
sim
ple
pla
in d
esig
n, fla
t ro
ofs
with
exc
essiv
e u
se
of g
lass a
nd
se
nsib
le u
se
of d
eco
rative
fe
atu
res.
gyp
sum
pla
ste
ring
-
gla
ss
cla
dd
ing
ext
ern
al w
ind
ow
s
only
- flo
or
to c
eili
ng
and
cle
ars
tory
win
do
ws.
so
me
sha
din
g
ele
me
nts
and
sha
de
d te
rra
ce
re-t
rad
itio
na
l
ba
rje
el (
de
co
rative
only
) w
ith te
rra
ce
in
fro
nt e
leva
tio
n s
ha
de
d b
y w
oo
de
n
pe
rgo
la.
gyp
sum
pla
ste
ring
wo
od
en p
erg
ola
co
vers
the
te
rra
ce
-
tim
be
r b
lind
s a
nd
louve
rs in e
ast w
est
sid
es
na
tura
l lig
ht -
flore
sce
nt
lighting
po
st-
mo
de
rn
sim
ple
pla
in d
esig
n, fla
t ro
ofs
with
exc
essiv
e u
se
of g
lass a
nd
se
nsib
le u
se
of d
eco
rative
fe
atu
res.
gyp
sum
pla
ste
ring
-
gla
ss
cla
dd
ing
sha
de
d te
rra
ce
and
vert
ica
l lo
uve
rs in
ea
st w
est sid
es
na
tura
l lig
ht -
flore
sce
nt
lighting
re-t
rad
itio
na
lism
ba
rje
el (
de
co
rative
only
) w
ith te
rra
ce
in
fro
nt e
leva
tio
n s
ha
de
d b
y w
oo
de
n
pe
rgo
la.
gyp
sum
pla
ste
ring
wo
od
en p
erg
ola
co
vers
the
te
rra
ce
-
tim
be
r b
lind
s a
nd
louve
rs in e
ast w
est
sid
es
na
tura
l lig
ht -
flore
sce
nt
lighting
po
st-
mo
de
rn
sim
ple
pla
in d
esig
n, fla
t ro
ofs
with
exc
essiv
e u
se
of g
lass a
nd
se
nsib
le u
se
of d
eco
rative
fe
atu
res.
gyp
sum
pla
ste
ring
-
gla
ss
cla
dd
ing
sha
de
d te
rra
ce
and
vert
ica
l lo
uve
rs in
ea
st w
est sid
es
na
tura
l lig
ht -
flore
sce
nt
lighting
15
% o
f ro
om
are
a
with 2
5%
incre
ase
in o
pe
na
ble
win
do
w
are
as
do
ub
le la
yer
of
Pilk
ing
ton k
gla
ss
with a
ir c
avi
ty in
be
twe
en a
nd
ma
xim
um
U-v
alu
e
of 2
.1 W
/m²·
K
do
ub
le la
yer
of
Pilk
ing
ton k
gla
ss
with a
ir c
avi
ty in
be
twe
en a
nd
ma
xim
um
U-v
alu
e
of 1
.9 W
/m²·
K
3 m
min
imum
se
tba
ck -
wid
e s
ikka
s a
nd
str
ee
ts
3 m
min
imum
se
tba
ck -
wid
e s
ikka
s a
nd
str
ee
ts
na
tura
l ve
ntila
tio
n
- H
VA
C s
plit
unit
na
tura
l ve
ntila
tio
n
- H
VA
C s
plit
unit
no
se
tba
ck li
mits -
na
rro
w s
ikka
s -
na
rro
w
str
ee
ts
1.5
m s
etb
ack -
wid
e
sik
ka
s a
nd
str
ee
ts
3 m
min
imum
se
tba
ck -
wid
e s
ikka
s a
nd
str
ee
ts
1.5
1.1
lightw
eig
ht co
ncre
te b
lock -
gyp
sum
pla
ste
ring
- g
lass-
fib
er
insula
ting
lightw
eig
ht co
ncre
te b
lock -
gyp
sum
pla
ste
ring
- g
lass-
fib
er
insula
ting
.22
thic
k w
alls
with
insula
tio
n la
yer.
Ma
x. U
-va
lue
= 0
.57
W/m
²·K
.3 thic
k w
alls
with
insula
tio
n la
yer.
U-
valu
e=
0.2
9
W/m
²·K
50
% o
f to
tal g
laze
d
are
a o
f th
e b
uild
ing
must ha
ve a
no
rth
ori
enta
tio
n
co
ncre
te
pro
jectio
ns a
bo
ve
ext
ern
al w
ind
ow
s -
co
vere
d a
rca
de
aro
und
the
ho
use
pitche
d r
oo
f
pro
jectio
n
HV
AC
win
do
w
unite
only
na
tura
l ve
ntila
tio
n
- w
ind
ow
unite
only
na
tura
l ve
ntila
tio
n
- H
VA
C s
plit
unit
na
tura
l lig
ht, &
tung
ste
n la
mp
s
na
tura
l lig
ht -
flore
sce
nt
lighting
na
tura
l lig
ht -
flore
sce
nt
lighting
bri
ck w
ork
me
diu
m s
ize
ext
ern
al w
ind
ow
s
only
1
x1 m
ext
ern
al w
ind
ow
s
only
- 1
0 %
of ro
om
are
a
sin
gle
laye
r o
f
Cle
ar
floa
t g
lass
pa
ne
l 6m
m
do
ub
le la
yer
of
cle
ar
floa
t g
lass
pa
ne
ls 6
mm
with
air
ca
vity
12
mm
in b
etw
ee
n
do
ub
le la
yer
of
Pilk
ing
ton k
gla
ssa
nd
cle
ar
floa
t g
lassw
ith a
ir
ca
vity
in b
etw
ee
n
and
ma
xim
um
U-
valu
e o
f 3
.28
W/m
²·K
Co
olin
gL
ighting
Se
t b
ack
he
avy
we
ight co
ncre
te b
lock -
gyp
sum
pla
ste
ring
me
diu
m c
oncre
te b
lock -
bri
ck w
ork
- g
ypsum
pla
ste
ring
lightw
eig
ht co
ncre
te b
lock -
gyp
sum
pla
ste
ring
- g
lass-
fib
er
insula
ting
.23
m thic
k w
alls
witho
ut in
sula
tio
n
laye
r
.31
5 m
thic
k w
alls
witho
ut in
sula
tio
n
laye
r
.22
thic
k w
alls
with
insula
tio
n la
yer.
Ma
x. U
-va
lue
= 0
.57
W/m
²·K
gyp
sum
pla
ste
ring
Str
uctu
ral t
ype
.B
uild
ing
ma
ss
Build
ing
enve
lop
e.
Op
enin
gs s
ize
and
dis
trib
utio
nG
lazi
ng
typ
eS
ha
din
g
0.0
2
0.0
2
0.0
2
U-V
alu
e
(W/m
²·K
)
2.7
1.9
1.7
Build
ing
Fe
atu
res
arc
ad
e fa
ça
de
bri
ckw
ork
fa
ça
de
and
pitche
d r
oo
f
Pe
rso
ns
/ m
2
0.0
3
0.0
2
Build
ing
De
scri
ptio
n
sq
ua
re s
ha
pe
with p
art
ial p
roje
ctio
ns
and
arc
ad
es s
urr
ound
ing
the
oute
r
faça
de
of th
e h
ouse
.
pitche
d r
oo
f d
esig
n w
ith b
rick b
locks
co
veri
ng
the
oute
r fa
ça
de
of th
e h
ouse
Susta
ina
ble
De
velo
pm
ent
Tim
elin
e
19
70
-19
90
19
90
-20
00
(F
irst
Ed
itio
n R
eg
ula
tio
ns)
20
00
-20
10
(S
eco
nd
Ed
itio
n R
eg
ula
tio
ns
with T
he
rma
l
Insula
tio
n
Sp
ecific
atio
ns)
Afte
r 2
01
4 (
Dub
ai
Gre
en R
eg
ula
tio
ns)
Ab
u D
ha
bi E
stid
am
a
(Pe
arl R
ating
Sys
tem
)

71
Chapter 6: Simulation Models

72
6.1 Computer Simulation Models
After selecting the proto type housing units for each timeline period the
computer simulation models will be created in order to conduct the
simulations and analyze them. The creation of simulation models is divided
into the following steps:
Create a climatic model for Dubai based on weather data file.
Create symbolic models for local housing units in each timeline
period.
Create a range of variables and different values based on evaluation
and selection parameters in order to test the created models in term
of different configurations of sustainable development.
Conduct the simulation of the computerized models and analyze the
results.
6.2 Weather Data Profile
The weather data file was conducted from Dubai International Airport and it
includes detailed annual information. The simulation data comprises all
records needed to run the simulations properly including latitude, longitude,
altitude, time zone, ground reflectance, wind exposure, heating and cooling
loads as illustrated in Table 6.1.
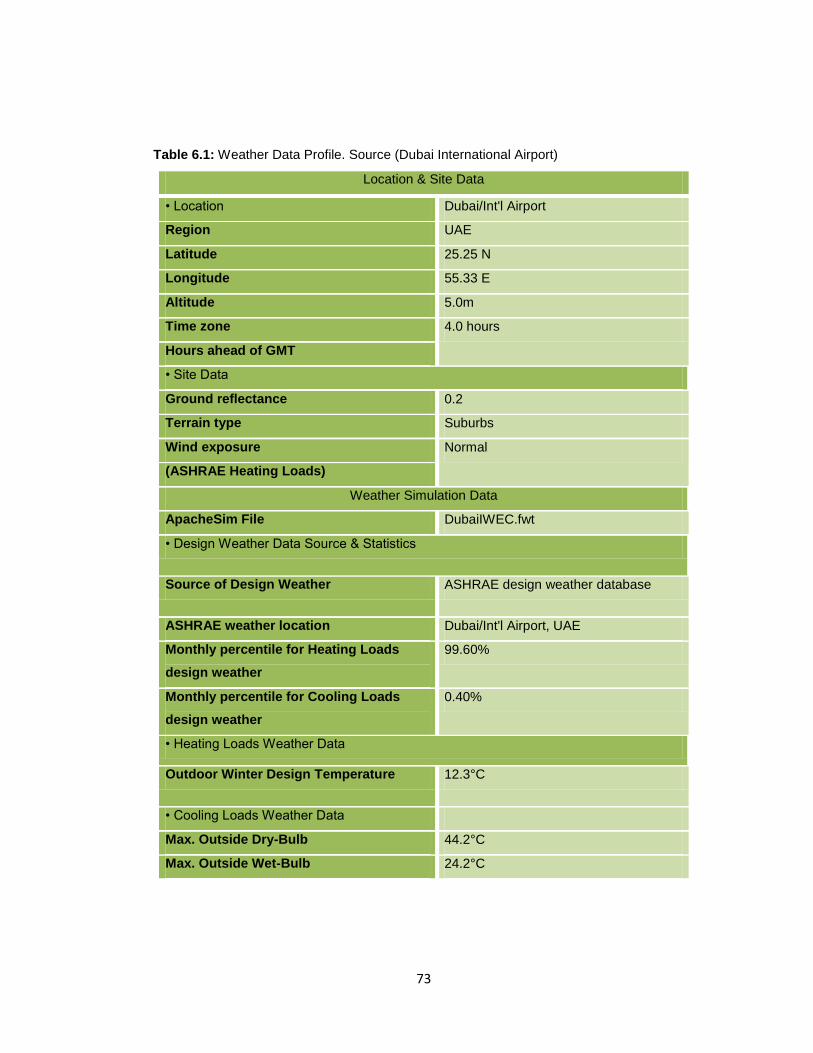
73
Table 6.1: Weather Data Profile. Source (Dubai International Airport)
Location & Site Data
• Location Dubai/Int'l Airport
Region UAE
Latitude 25.25 N
Longitude 55.33 E
Altitude 5.0m
Time zone 4.0 hours
Hours ahead of GMT
• Site Data
Ground reflectance 0.2
Terrain type Suburbs
Wind exposure Normal
(ASHRAE Heating Loads)
Weather Simulation Data
ApacheSim File DubaiIWEC.fwt
• Design Weather Data Source & Statistics
Source of Design Weather ASHRAE design weather database
ASHRAE weather location Dubai/Int'l Airport, UAE
Monthly percentile for Heating Loads
design weather
99.60%
Monthly percentile for Cooling Loads
design weather
0.40%
• Heating Loads Weather Data
Outdoor Winter Design Temperature 12.3°C
• Cooling Loads Weather Data
Max. Outside Dry-Bulb 44.2°C
Max. Outside Wet-Bulb 24.2°C

74
6.3 Local Housing Units Description
It is important to state that the materials used in all cases are obtained from
the records of Dubai Municipality, default material specifications of IES-VE
software, Building Code Requirements for Structural Concrete (ACI 318-05)
and Commentary (ACI 318R-05) and ASHRAE Handbook - Fundamentals
(I-P Edition).
Another thing to be mentioned is that the total built up areas of all cases are
determined on the basis of the total built up area of the traditional house in
order to simulate all cases with the same conditions and conduct a
comparable analysis between each other properly. Furthermore, all cases
are simulated based on north orientation since it is the best orientation that
determined and verified by Dubai green buildings regulations and
specifications.
The following section demonstrates the general description of each case
unit.
6.3.1 Historical Unit
The traditional house of Dar Al Nadwa is 20m x 20m with total built up area
of 500 m² including two floors, each floor is 4m high and above the roof are
two wind towers (Barjeels) one of them located in the main façade of the
house starting after the ground floor directly and reaching around 8 meters
height. The second Barjeel is located in the west side façade starting after
the first floor and reaching 4 meters height. The house is mainly formed of
internal courtyard that includes a central tree used for shading needs and
surrounded by shaded corridors. All rooms are opened to the internal

75
courtyard with very few and small windows directed to the external sides for
privacy and religious reasons except the front rooms which served for
guests use and men gathering area (Majlis). It is worth to mention that there
was no or very small set back between the houses creating narrow and
shaded routs for pedestrian.
Figure 6.1: Traditional Unit of IES-VE model
In Dar Al Nadwa house (Figure 6.1), the ground floor is made of four simple
layers including the sand layer of the ground which covered with mix of
gravels and clay and then enclosed by carpets made of palm leafs (Haseer)
with a total U-value of 0.195 W/m²K. The walls are made mainly of coral
stone, gypsum and mud with a total thickness of 60 cm and a U-value of
0.299 W/m²K. The internal floor and the external roof were made of
traditional timber imported from India called Chandal timber and covered by
palm leaf carpet (Haseer) and then roofed by gypsum and clay with a total
U-value of 0.273 W/m²K. The windows were covered and framed by local
timber only without glass panels and the doors are made of local timber

76
also. Table 6.2 is shows the general specifications of construction materials
of the traditional unit.
Table 6.2: general specifications of construction materials of the traditional model
Material Description
U-value
ASHRAE
(W/m²·K)
Roof Chandal, Palm Leaf Carpet, Gypsum, Clay 0.273
Internal floor Chandal, Palm Leaf Carpet, Gypsum, Clay 0. 268
Wall Mud; Gypsum; Coralston 0.299
Ground Floor Palm Leaf Carpet; Clay; Gravel; Sand 1.564
Door Local Wood 2.296
Glazing Wooden shutters only 5.602
Total U-value 1.62
6.3.2 1970‘s – 1990‘s Unit
The general design features and materials of houses built in early 1970‘s
until late 1980‘s were collected from the building permit archives in Dubai
Municipality together with site visits observation and information recorded
from the conservation of historical buildings symposium.
The design features of this era was totally changed compared to the
features of traditional houses due to the new materials and construction
technologies arrived the city and the government restrictions that prevents
the concept of internal courtyards which led to a new appearance of housing
architecture. It is important to mention that there were no rules and
regulations arranging the building industry and regulating its specifications

77
as well as there was no building permitting procedures or even inspections
until the early 1990‘s. A prototype case of a typical house of that period has
been modeled with a total built up area of 500 m² (Figure 6.2). It is L shape
with partial projections and arcades surrounding the outer façade of the
house.
Figure 6.2: 1970‘s – 1990‘s Unit of IES-VE model
The ground floor is consist of synthetic carpet, cast concrete as the main
structure material and covered by tiles with a total U-value 1.564 W/m²K.
The walls are 20cm thick made of concrete blocks covered by gypsum
plastering from internal and external sides without any insulation material
and with a total U-value of 2.725 W/m²K. The floor consists of dens cast
concrete and covered by synthetic carpet with a total U-value 2.117 W/m²K.
The roof is made of cast concrete covered with bitumen layer and stone
chippings with a total U-value of 2.821 W/m²K. The doors are made of 20%
moist pine timber with a U-value of 2.161 W/m²K. The windows are made of
clear float glass with a total shading coefficient 1.046 and total U-value
5.121 W/m²K. Table 6.3 is shows the general specifications of construction
materials of 1970‘s – 1990‘s Unit.

78
Table 6.3: general specifications of construction materials of 1970‘s – 1990‘s model
Description
U-value
ASHRAE
(W/m²·K)
Total shading
coefficient
(glazed only)
Roof Chipping-Asphalt-Concrete 2.821
Internal floor Carpet-Concrete 2.117
Wall Gypsum-Concrete-Gypsum 2.725
Ground Floor Tiles-Concrete-Carpet 1.564
Door wooden door 2.161
Glazing Clear Float 5.121 1.046
total 2.743
6.3.3 1990‘s – 2000‘s Unit
In the beginning of 1990‘s the design approach of single housing unites
started to change and transform since Dubai started to catch an
international attention together with the economic revolution which attracted
people and businesses to enlarge and expand the building industry all over
the city. The western design of the houses started to appear with new
materials and building technologies together with the first addition of building
rules and regulations in order to control the huge transformation and
economic revolution of the city from being local town to be international city
like New York, London and Hong Kong. In spite of this, the first edition of
building policy does not include any instrument managing the thermal
insulation of the building materials until issuing the thermal insulation
systems for buildings in 2001. The prototype case specifications of early
1990 are until 2000 is collected from the building permit archives in Dubai
Municipality together with site visits observation. The house is and the outer
façade is covered by brick blocks and then the house is enclosed by pitched

79
roof with 25% slope and 1 m projection creating shading for the underneath
floors (Figure 6.3)
Figure 6.3: 1990‘s – 2000‘s Unit of IES-VE model
The ground floor is consist of synthetic carpet, cast concrete as the main
structure material and covered by tiles with a total U-value 1.564 W/m²K.
The external walls are 30cm thick made of medium concrete blocks covered
by brick work in outer leaf and gypsum plastering from inner leaf with total
U-value of 1.381 W/m²K. The internal partitions are 13cm thick made of
medium concrete blocks also and covered by gypsum plastering from both
sides with total U-value 1.993 W/m²K. The floor is made of dens cast
concrete and covered by synthetic carpet with a total U-value 2.117 W/m²K.
The pitched roof is 25% slope with .9m cavity and brick work outer leaf
cover with a total U-value 0.146 W/m²K. The doors are made of 20% moist
pine timber with a U-value of 2.161 W/m²K. the windows are consist of
double layers of clear float glass panels with 6mm thick including air cavity
of 12mm in between with a total shading coefficient 0.825 and total U-value
4.686 W/m²K. Table 6.4 shows the general specifications of the house
materials together with its U-values and total shading coefficient.

80
Table 6.4: general specifications of construction materials of 1990‘s – 2000‘s model
Description
U-value
ASHRAE
(W/m²·K)
Total shading
coefficient
(glazed only)
Roof Pitched roof Brick-Cavity 0.146
Internal floor Carpet-Concrete 2.117
External Wall Brick-Concrete-Gypsum 1.381
Internal Partition Gypsum-Concrete-Gypsum 1.993
Ground Floor Tiles-Concrete-Carpet 1.564
Door wooden door 2.161
Glazing double glazing 3.679 0.825
1.863
6.3.4 2000‘s – 2010‘s Units
In 2000; the second edition of Dubai rules and regulations has been updated
and followed by the thermal insulation systems for buildings in 2001. These
policy instruments have been modernized in order to be more compatible
with the city growth provisions since new designs, material, technologies
and owners and investors requirements has enlarged with the city growth.
Different type of local housing unites started to arise beside the arcade and
the pitched roof designs varies between post modern concepts with
clearstory themes and full glass façades (Figure 6.5) and between re-
traditionalism modern that employs the traditional design features like wind
towers as decorative figures only (Figure 6.4).

81
Two types of modern approach houses have been modeled with properties
and specifications that follow the building rules and regulations of Dubai
Municipality in section of private villas and local housing units. The policies
that have affected the design and the building construction technologies of
the houses are includes 3 m setback from the edges of the plot, maximum of
15m of the total house height counting G+1 with roof service only, providing
natural light and ventilation with a minimum of 10% of total room area for
glazing with a maximum U-value of 3.28 W/m²K. The external walls
shouldn‘t exceed a U-value of 0.57 W/m²K and the roof maximum U-value is
0.44 W/m²K. Moreover, all construction materials should follow ASHRAE
guide and approved from Dubai Central Laboratory (DCL).
Figure 6.4: 2000‘s – 2010‘s re-traditional unit of IES-VE model
Figure 6.4 shows the IES-VE model of traditional design house which is 500
m² total built up area with two stories height each floor is 3 meters high and
a Barjeel (decorative only) above the roof and terrace in front elevation
shaded by wooden pergola.

82
Figure 6.5: 2000‘s – 2010‘s post-modern unit of IES-VE model
Figure 6.5 shows the IES-VE model of modern type which is simple plain
design with flat roofs including excessive use of glass and minimal use of
decorative features. It is 500 m² total built up areas with two stories height
each floor is 3 meters high with stair room in the roof.
In both cases (the modern and the traditional) new houses have used the
same material properties where the ground floor is consist of synthetic
carpet, cast concrete as the main structure material and covered by finishing
tiles with a total U-value 1.564 W/m²K. The external walls are 22cm thick
made of light weight concrete blocks with an insulation layer of glass-fiber
(ASHRAE) and covered by gypsum plastering from both sides with a total U-
value of 0.572 W/m²K. The internal partitions are 13cm thick made of
brickwork and covered by lightweight plaster from both sides with total U-
value 1.767 W/m²K. The floor is made of dens cast concrete and covered by
synthetic carpet with a total U-value 2.117 W/m²K. The roof is consist of two
layers of aerated concrete slab with insulating material in between and
covered by gypsum plastering from the inner side and by gravels and
concrete tiles from the outer side with a total U-value of 0.441 W/m²K. The
doors are made of 20% moist pine timber with a U-value of 2.161 W/m²K.
the windows are consist of double layers of Pilkington k glass which is low

83
emissivity coated glass with 6 mm thick and clear float glass 6mm thick
including an air cavity of 12 mm in between with a total shading coefficient
0.402 and total U-value 3.28 W/m²K. The following table shows the general
specifications of the house materials together with its U-values and total
shading coefficient. The following table shows the general specifications of
the house materials together with its U-values and total shading coefficient.
Table 6.5: general specifications of construction materials of 2000‘s – 2010‘s model
Description
U-value
ASHRAE
(W/m²·K)
Total shading
coefficient
(glazed only)
Roof Tiles-Sand-Concrete-Insulation-Concrete-
Gypsum 0.441
Internal floor Carpeted reinforced-concrete ceiling 2.117
External Wall Gypsum-Insulation-Concrete-Gypsum 0.572
Internal Partition Plaster-Brick-Plaster 1.767
Ground Floor Tiles-Concrete 1.564
Door wooden door 2.161
External Glazing low-e double glazing (6mm+6mm) 3.28 0.402
1.700
6.3.5 2010‘s – 2014‘s Units
It is expected to experience a new revolution of sustainable development in
2014 since the green regulations and specifications established by Dubai
Municipality will be mandatory for all types of buildings in Dubai.

84
Furthermore, the Pearl rating system (Figure 6.6) for Estidama initiated by
Abu Dhabi Urban Planning Council has recorded further improvements
owing to the combination of regulatory and voluntary policy instruments,
recommendations and incentives.
Figure 6.6: Pearl Rating System for Estidama. Source: (www.estidama.com)
The above modern cases were modified to meet the future expectations of
private villas and local housing units in Dubai and then customized to meet
Abu Dhabi Estidama recommendations that are related to the research area
in order to evaluate the level of sustainable development of local housing
units.

85
In Dubai Green Regulations and specifications the roof U-value has been
changed from 0.44 W/m²K to maximum of 0.30 W/m²K while in Estidama it is
recommended to be 0.12 W/m²K. In term of external walls, the U-value in
Dubai future regulations has not changed 0.57 W/m²K while in Abu Dhabi
Estidama rating system it is recommended to be 0.29 W/m²K. The glazing
U-value in Dubai regulations has changed from 3.28 W/m²K to 2.1 W/m²K in
green specifications while in Abu Dhabi Estidama the U-value of glazing is
1.9 W/m²K. The shading coefficient (SC) has not changed in Dubai
regulations 0.4 while in Abu Dhabi Estidama is 0.3. Additional issue
regarding glazing orientation has established by Dubai green regulations
and specifications which imposing at least 50% of total glazed area of the
building must have a north orientation. South and west glazed areas must
be treated environmentally with shading elements and methods since it is
not possible to re-orient the buildings due to the general planning directives.
The following table demonstrates the general building specifications of each
timeline period.
6.4 Computer Simulation Procedure
Various computer simulation will be conducted since the investigation is
applied on eleven computerized models and will be measured in term of
energy consumption and thermal performance which will be inspected by
heat gain assessment due to its major impacts on cooling loads and internal
temperature with the intention of investigating the compatibility of building
materials and new building construction methods with UAE climate and
environment, and compare the results with the compatibility of the traditional
house and future houses with its sustainable properties and harmony with
nature.
86
The thermal performance simulation will be conducted in order to examine
the building passivity and sustainability in UAE environment as a hot climate
region and assess its thermal performance in comparison with the
sustainable practices of traditional houses. Each unit will be simulated twice
based on principle features of each period in order to check if these features
were added for general architectural appearance only or it have an
environmental benefits that helps minimizing the energy consumption and
enhancing the thermal performance of the building at each period of time.
The energy consumption analysis will be obtained from three simulation
runs including total lights energy, cooling load energy, and fans and pumps
energy. A thermal performance analysis will be conducted in order to
investigate the grounds of energy consumption levels in local housing units
in UAE, each housing unit will be analyzed in term of thermal performance
conducting heat gain analysis for both lighting and cooling loads as shown in
Figure 6.7 since heat gain assessment illustrates the amount of heat
introduced into the housing unit from different heat sources which creates
temperature difference between exterior and interior spaces and has
substantial impacts on cooling loads.

87
Figure 6.7: Systematic analysis of total energy consumption of local housing units in Dubai.
Heat gain assessment will be obtained from four main simulation runs as
shown in Figure 6.7 witch demonstrates the systematic analysis of total
energy consumption of local housing units in Dubai. The heat gain
assessment counts:
External conduction gains through external walls, external glazing,
external doors, ground floor and exposed roof.
Internal conduction gains through internal partitions, internal doors,
internal floor and ceiling.
Internal gains through people, lighting and other equipments.
Solar gains through glass.
Total Energy
Consumption
Cooling
Loads
Heat Gain
External
Conduction
Gain
External
Walls
Exposed
RoofGlazing
Solar Gain
Through
Glass
Glazing
Internal
Gains
Lighting
Fextures
Gain
Lighting
Heat Gain
Internal
Gains
Lighting
Fextures
Gain

88
Chapter 7: Results and Discussion

89
7.1 Total Energy Consumption
The energy consumption analysis has obtained from three simulation runs
including total lights energy, cooling load energy, and fans and pumps
energy.
Figure 7.1: Total Energy Consumption (KWh/Y)
41.5
34
151.7
48
167.3
92
120.4
62
131.3
55
66.8
93 76.8
96
44.9
78
65.8
22
41.9
88
58.1
59
0
20
40
60
80
100
120
140
160
traditio
nal fe
atu
res
with a
rcade
without arc
ade
With b
rick a
nd p
itch r
oof
without brick a
nd p
itch r
oof
re-t
raditio
nalis
m
post-
modern
ism
re-t
raditio
nalis
m
post-
modern
ism
re-t
raditio
nal
post-
modern
Before 1970
1970-1990 1990-2000 2000-2010 After 2014 (Dubai Green Regulations)
Abu Dhabi Estidama
To
tal en
erg
y (
KW
h/Y
)
Th
ou
san
ds
Sustainable Development Timeline
Total Energy (KWh/Y)

90
Figure 7.1 illustrates the total energy consumption among all types of local
housing units in Dubai. It was found that the lighting and cooling loads have
the largest influence on energy consumption from traditional unites (lighting
only) headed for future units; thus the lighting and cooling outcomes will be
analyzed in detail as shown in Figure 7.2 and Figure 7.3.
7.1.1 Lighting Energy Consumption
Figure 7.2: Lighting Energy Consumption (KWh/Y)
41.5
34208
35.7
7284
35.7
7284
35.7
7284
35.7
7284
11.6
30376
9.8
33616
10.5
21435
6.0
02208
8.6
40893
5.0
81673
0
5
10
15
20
25
30
35
40
traditio
nal fe
atu
res
with a
rcade
without arc
ade
With b
rick a
nd p
itch r
oof
without brick a
nd p
itch r
oof
re-t
raditio
nalis
m
post-
modern
ism
re-t
raditio
nalis
m
post-
modern
ism
re-t
raditio
nal
po
st-
mo
de
rn
Before 1970
1970-1990 1990-2000 2000-2010 After 2014 (Dubai Green Regulations)
Abu Dhabi Estidama
To
tal li
gh
tin
g e
ne
rgy (
KW
/Y)
Th
ou
san
ds
Sustainable Development Timeline
Lighting Energy (Kw/Y)

91
From the previous results of energy consumption, it is clear that the
traditional house has the minimum value of energy consumption among all
other units. The only energy consumer of this type of buildings was the
lighting units of tungsten lamps which consume (41,534 KWh per Year) and
dominate the highest rate of lighting energy consumption in comparison with
all types of housing units as shown in Figure 7.1 and Figure 7.2.
Another reason makes the traditional unite utmost lighting consumption is
that the running time of lighting fixtures since most windows are opened to
the internal courtyard that surrounded by shaded corridors from all sides and
enclosing big tree in the middle for shading proposes; accordingly small
windows together with shaded corridors and shaded courtyard enhance the
natural shading and passive cooling levels and elevate the demand for
lighting inside the house spaces which make it the highest consumer in term
of lighting energy.
In spite of this, the traditional house is found to enclose the minimum rate of
total energy consumption compared to other timeline cases since no energy
is used for cooling or any other electrical activities as shown in Figure 7.1
and Figure 7.3.

92
7.1.2 Cooling Energy Consumption
Figure 7.3: Cooling energy consumption (KWh/Y)
With the beginning of using air conditioning window units in 1970‘s, the total
energy consumption has lifted up extremely about four times than the total
energy of traditional unit as shown in Figure 7.1 and was found to consume
60% of total energy demands of the building (85,907 KWh/Y).
0
85.9
07865
97.4
95914
62.7
33033
70.8
01998
40.9
35645
49.6
76013
32.5
7741
44.3
11371
24.7
02024
37
.56
911
0
10
20
30
40
50
60
70
80
90
100
traditio
nal fe
atu
res
with a
rcade
without arc
ade
With b
rick a
nd p
itch r
oof
without brick a
nd p
itch r
oof
re-t
raditio
nalis
m
post-
modern
ism
re-t
raditio
nalis
m
post-
modern
ism
re-t
raditio
nal
post-
modern
Before 1970
1970-1990 1990-2000 2000-2010 After 2014 (Dubai Green Regulations)
Abu Dhabi Estidama
Co
oli
ng
Lo
ad
en
erg
y (
KW
h/Y
) Th
ou
san
ds
Sustainable Development Timeline
Cooling Load Energy (KWh/Y)

93
The arcade integration has helped a little in reducing the energy
consumption but comparing to other cases in timeline, the 1970‘s case
showed the most energy consumer among all cases. The case of 1990‘s –
2000 showed a 22% decrease in cooling consumption compared to 1970‘s
case and that‘s mostly due to thermal characteristics of building materials
used since the air conditioning system (window unit) wasn‘t changed at that
period of time until the beginning of 2000 when the new rules and
regulations has controlled the cooling systems and its efficiency together
with complete building processes and construction management which led
to decrease the cooling energy between 43% and 53% below 1970‘s levels
according to building design (re-traditional or post-modern).
A further reduction has obtained in future cases of Dubai (49% - 63%) and
Estidama cases of Abu Dhabi (57% - 71%) below 1970‘s – 1990‘s levels
due to new policy instruments, energy efficiency direction and thermal
performance development.
7.2 Thermal Performance
Beside the development of lighting and cooling technologies that contributed
in minimizing the total energy consumption overtime, a thermal performance
analysis has been conducted in order to investigate the grounds of energy
consumption levels in local housing units in Dubai, each housing unit has
analyzed in term of thermal performance conducting heat gain analysis for
both lighting and cooling loads as shown in Figure 6.7 since heat gain
assessment illustrates the amount of heat introduced into the housing unit
from different heat sources which creates temperature difference between
exterior and interior spaces and has substantial impacts on cooling loads.

94
Figure 7.4: Total heat gains (KWh/Y)
Due to passive methods used in the traditional house with the aim of
providing maximum thermal comfort possible since no active means or any
cooling systems were available; a passive solutions such as wind towers,
internal courtyard with shaded corridors and tree in the middle for shading
purposes, massive thick internal and external walls that made of light and
cold materials of mud and coral stone were the major grounds of preventing
the heat gain flows into the internal parts of the house and place it within the
76.7
37
217.6
89
263.2
39
159.4
89
191.1
65
109.1
05
134.1
25
66
.69
7
119.6
4
59.7
33
110.2
17
0
50
100
150
200
250
traditio
nal fe
atu
res (
Baselin
e 1
)
with a
rcade (
Baselin
e 2
)
without arc
ade
With b
rick a
nd p
itch r
oof
without brick a
nd p
itch r
oof
re-t
raditio
nal
post-
modern
re-t
raditio
nal
post-
modern
re-t
raditio
nal
post-
modern
Before 1970
1970-1990 1990-2000 2000-2010 After 2014 (Dubai Green Regulations)
Abu Dhabi Estidama
To
tal h
eat
gain
s (
KW
h/Y
) Th
ou
san
ds
Sustainable Development Timeline
Total Heat Gains (KWh/Y)

95
most effective thermal performance as shown in Figure 7.4 except that of
internal gain through lighting which will be discussed later in this chapter.
Figure 7.4 illustrates that in 1970‘s, the total gain has bound 182% above
total heat gain level in traditional building due to new construction materials
and new active technologies utilized at that period of time. After 1990‘s a
26% reduction from the level of 1970‘s has achieved but still it is about
double value above the total heat gain level of the traditional unit.
After the beginning of using thermal insulation materials in 2001 a 50%
reduction has achieved compared to 1970‘s levels and it is expected to be
reduced to 69% after 2014 with an extra reduction of 14% compared to total
heat gain level in traditional unit. Abu Dhabi Estidama unites have reached
22.5% reduction from the level of traditional unit and 73% from the level of
1970‘s unit.
From heat gain simulation, it was found that three main breakdowns have
affected the energy consumption of the tested units. These breakdowns are:
External conduction gain through external walls, exposed roof and
glazing.
Solar gain through glass.
Internal gain through lights.
Figure 6.7 shows the systematic analysis of total energy consumption of
local housing units in Dubai.

96
7.2.1 Thermal Comfort in Traditional Unit
The traditional house showed interesting results related to passive
techniques used to fulfill the thermal comfort needs since no cooling
systems were employed except that of innovative passive control of natural
ventilation through wind towers, internal courtyard, shaded corridors and
small openings and windows distributed throughout the house spaces.
A double simulation runs for single room that integrates a wind tower has
been conducted in the hottest month of the year (July) with the purpose of
testing the internal temperature and wind tower efficiency.
The first run was performed with closed and ineffective wind tower while the
second run was performed with open effective wind tower. The first run
showed 10 C° degrees difference between dry bulb temperature and indoor
temperature and that‘s most probably due to cold and light materials used
together with great thickness of the walls which is 60cm.
A further reduction of 5 C° degrees in internal temperature has achieved
when the wind tower has activated which present a total of 15 C° degrees
difference as shown in Figure 7.5 which proves the efficiency of wind tower
in such hot climate of Dubai.
Even though wind tower has showed a substantial passive cooling control in
hottest months; the thermal comfort cannot achieved easily at certain point
when dry bulb temperature reaches extreme levels beyond 40 C° degrees.

97
Figure 7.5: Internal temperature of traditional unit
7.2.2 External Conduction Gain – External Walls
Starting with heat gain assessment, firstly; external conduction gains were
analyzed through external walls, exposed roof and glazing. Figure 7.6
presents the external conduction gain through external walls among timeline
houses.
0
5
10
15
20
25
30
35
40
45
50
1 2 3 4 5 6 7 8 9 10 11 12 13 14 15 16 17 18 19 20 21 22 23 24 25 26 27 28 29 30 31
Tem
pe
ratu
re C
July
Internal Temperature - Traditional Unit
internal temp. with wind tower internal temp. without wind tower dry buld temp

98
Figure 7.6: External Conduction Gain - External Walls (KWh/Y)
From the previous results, it was found that the conduction gain of external
walls of the traditional unit (7,838 KWh/Y) is producing the minimum values
compared to the other tested units in Dubai since re-traditional unit
generates (10,697 KWh/Y) and post-modern unit generates (12,721 KWh/Y)
while Abu Dhabi Estidama units have showed further reductions in external
conduction gain through walls since it imposed a minimum U-value of
7.8
38
70.9
39
78
.60
7
37.2
38
51.0
32
10.6
97
12.7
21
10.6
97
12.7
21
7.0
69
8.9
73
0
10
20
30
40
50
60
70
80
traditio
nal fe
atu
res (
Baselin
e 1
)
with a
rcade (
Baselin
e 2
)
without arc
ade
With b
rick a
nd p
itch r
oof
with
ou
t b
rick a
nd
pitch
ro
of
re-t
raditio
nal
po
st-
mo
de
rn
re-t
raditio
nal
po
st-
mo
de
rn
re-t
raditio
nal
post-
modern
Before 1970
1970-1990 1990-2000 2000-2010 After 2014 (Dubai Green Regulations)
Abu Dhabi Estidama
Exte
rnal co
nd
ucti
on
gain
-exte
rnal w
all
s (
KW
h/Y
)
Th
ou
san
ds
Sustainable Development Timeline
External Conduction Gain - External Walls (KWh/Y)

99
external walls that does not exceed 0.290 W/m²K while Dubai green
regulations did not impose any modification on external walls U-value which
is 0.57 W/m²K.
The traditional unit has reached such performance mostly because of
external walls‘ light cold materials with its great thickness of 60cm which
significantly helped in preventing the heat gain passes through external
walls with a total U-value of 0.299 W/m²K. The slight amount of openings in
external walls sides has played an important role in minimizing the external
conduction gain also.
Abu Dhabi Estidama units have reached this performance mostly owing to
new directions of sustainable technologies combined with new green
buildings policies and new thermal insulation materials.
A remarkable finding regarding the recommended U-value for external walls
in Estidama units was found to be similar to that of traditional units which
prove the compatibility of traditional materials with the surrounding
environment.
It is clear that the conduction gain of external walls in post-modern unit is
larger than that of re-traditional unit. That‘s mostly owing to the percentage
of glass area integrated to post-modern design.
A breaking out results of 1970‘s-1990‘s unit has achieved where the
conduction gain of external walls is around ten times more than that of
external walls of traditional unit (70,939 KWh/Y). The arcade element has
helped to reduce the external conduction gain of the walls but due to the
vast change of utilizing new concrete materials with slight thicknesses and

100
without any insulation material has most probably led to the obtained
outcome.
The unit of 1990‘s-2000 presents a better performance than that of arcade
element and that is also because of new medium weight blocks used in
building construction combined with outer finishing brickwork which created
a total external walls thickness of 30cm and enhance the ability of
preventing heat gain passes through external walls (37,238 KWh/Y). The
outer brickwork has played a role in minimizing the total conduction gain of
external walls compared to 1970‘s-1990‘s unit but still the value is extreme
compared to the traditional unit.
In 2000-2010 units the conduction gain of external walls started to come
close to the traditional unit value mostly due to the beginning of using
thermal insulation materials in building construction after it became a
mandatory policy instrument in 2001.
A slight difference of external walls‘ conduction gain between re-traditional
unit and post-modern unit is mostly owing to the use of some decorative and
shading elements in re-traditional design and the total solid area of the
external façade.

101
7.2.3 External Conduction Gain – Exposed Roof
Figure 7.7: External Conduction Gain – Exposed Roof (KWh/Y)
Figure 7.7 illustrate a significant outcomes regarding the roof of 1990‘s –
2000 unit which has discovered after conducting two simulations one of
4.3
73
45.2
16
48.0
3
22.2
31
42.1
24
5.5
47
6.0
37
4.1
45
4.2
87
3.9
86
4.0
22
0
5
10
15
20
25
30
35
40
45
traditio
nal fe
atu
res (
Baselin
e 1
)
with a
rcade (
Baselin
e 2
)
without arc
ade
With b
rick a
nd p
itch r
oof
without brick a
nd p
itch r
oof
re-t
raditio
nal
po
st-
mo
de
rn
re-t
raditio
nal
po
st-
mo
de
rn
re-t
raditio
nal
po
st-
mo
de
rn
Before 1970
1970-1990 1990-2000 2000-2010 After 2014 (Dubai Green Regulations)
Abu Dhabi Estidama
Ex
tern
al c
on
du
cti
on
ga
in-
ex
po
se
d r
oo
f (K
W/Y
) Th
ou
san
ds
Sustainable Development Timeline
External Conduction Gain - Exposed Roof (KW/Y)

102
them including the pitched roof element and the other one without the
pitched roof integration in order to check if this element is thermally efficient
or it is for architectural appearance of that period only.
The pitched roof element has helped extensively to prevent a significant
amount of heat gain passes through it (22,231 KWh/Y) compared to that
case without pitched roof element (42,124 KWh/Y) and that‘s most likely due
to double roof idea since the pitched roof performed as outer roof layer
followed by 90 cm cavity which is the main reason of the achieved
performance and then enclosed by inner ceiling layer which turned out to be
as internal floor.
The 1970‘s – 1990‘s unit illustrate a substantial value of conduction gain
passes through its exposed roof (45,216 KWh/Y) since no thermal concerns
were applied in building construction at that time.
After 2000 a significant drop in conduction gain through exposed roof has
realized due to new rules and regulations regarding thermal insulation
integration in all types of buildings in Dubai which led to new phase of
sustainable development of the building industry in the city. A slight
difference in conduction gain of exposed roof occurred between re-
traditional unit (5,547 KWh/Y) and post-modern unit (6,037 KWh/Y) most
likely occurred as a consequence of parapet height since it is higher in re-
traditional unit than post-modern unit which provides more shading for roof
area.
In future expectations of Dubai green regulations and specifications the roof
conduction gain is minimized a little more but does not elevated to a level
that could make it a substantial improvement like that of 2001 since the U-

103
value of exposed roof has changed from 0.44 W/m²K to 0.3 W/m²K while in
Abu Dhabi Estidama a further reduction has achieved since the U-value of
exposed roof became 0.12 W/m²K.
7.2.4 External Conduction Gain – Glazing
Figure 7.8: External Conduction Gain – Glazing (KWh/Y)
18.4
52
23.2
83
27.7
53
12.0
26
13.2
83
11.6
16
18.0
45
10.9
81
15.5
14
8.9
21
13.7
11
0
5
10
15
20
25
tra
ditio
na
l fe
atu
res (
Ba
se
line
1)
with a
rcade (
Baselin
e 2
)
without arc
ade
With b
rick a
nd p
itch r
oof
without brick a
nd p
itch r
oof
re-t
raditio
nal
post-
modern
re-t
raditio
nal
post-
modern
re-t
raditio
nal
post-
modern
Before 1970
1970-1990 1990-2000 2000-2010 After 2014 (Dubai Green Regulations)
Abu Dhabi Estidama
Exte
rnal co
nd
ucti
on
ga
in-
Gla
zin
g(K
Wh
/Y)
Th
ou
san
ds
Sustainable Development Timeline
External Conduction Gain - Glazing (KWh/Y)

104
The heat gain through glazing has two divisions; conduction gain and solar
gain. The conduction gain of a glazed area depends on the material used
combined with its emittancety, thickness and ability to passes the heat gain
through it.
In the traditional unit there was no glazing used in windows but instead,
wooden frame and shutters were built-in for opening and closing as required
since no glazing materials were available that time thus the conduction gain
presented in Figure 7.8 illustrates the external conduction gain of wooden
frame and shutters that enclosing high rate of external conduction gains and
that‘s due to un-partitioned windows that prevent external heat inflowing the
indoor spaces.
As shown in Figure 7.8, With the beginning of using glass windows in
1970‘s, the external conduction gain of glazing was in utmost level among
all tested units (23,283 KWh/Y) and these results are accordingly due to the
employment of single glazing of clear float glass with 6mm thickness and U-
value of 5.69 W/m²K.
In 1990‘s double glazing windows started to be employed in building
construction methods since new building technologies and materials began
flowing. Double layers of clear float glass panels are consequently the
grounds of that minimization in external conduction gain of glazing in 1990‘s
– 2000 unit (12,026 KWh/Y).
A sizeable decrease has achieved after 2000 since low-emittence glazing
with a maximum U-value of 3.28 became a mandatory specification after
initiating the thermal insulation regulations. A slight difference between re-
traditional unit (9,616 KWh/Y) and post-modern unit (11,045 KWh/Y)
occurred due to area of glazing in each design since re-traditional unit
comprise less glazing areas than the post-modern unit.

105
Future units‘ shows further reductions in external conduction gain of glazing
since U-value has regulated to be decreased from 3.28 W/m²K to 2.1
W/m²K. Abu Dhabi Estidama units illustrates a little more reduction since the
glazing U-value shouldn‘t exceed 1.9 W/m²K.
7.2.5 Solar Heat Gain – Glazing
Figure 7.9: Solar Heat Gain – Glazing (KWh/Y)
0
30.2
07
69.2
74
34.5
82
48
.31
5
28.5
07
44.1
74
22.5
02
39.1
27
21.9
89
37.9
62
0
10
20
30
40
50
60
70
traditio
nal fe
atu
res (
Baselin
e 1
)
with a
rcade (
Baselin
e 2
)
without arc
ade
With b
rick a
nd p
itch r
oof
without brick a
nd p
itch r
oof
re-t
raditio
na
l
post-
modern
re-t
raditio
na
l
post-
modern
re-t
raditio
na
l
post-
modern
Before 1970
1970-1990 1990-2000 2000-2010 After 2014 (Dubai Green Regulations)
Abu Dhabi Estidama
So
lar
he
at
ga
in-
Gla
zin
g(K
Wh
/Y)
Th
ou
san
ds
Sustainable Development Timeline
Solar Heat Gain - Glazing (KWh/Y)

106
The second division of heat gain through glazing is the solar heat gain which
occurs when solar radiation flows into internal spaces through glazing areas.
The traditional unit does not include this kind of gain since there is no
glazing used in this type of buildings.
In 1970‘s - 1990‘s unit a remarkable outcome of solar gain through glass
has recorded (Figure 7.9) since the unit with arcade façade has played a
significant role in minimizing the solar radiation flows into the internal parts
of the house (30,207 KWh/Y) while without arcade integration the solar gain
through glass reached (69,274 KWh/Y).
The solar gain through glass started to minimize with the beginning of
double glazing use in 1990‘s, but the thermal performance of 1970‘s unit
have reached higher level due to arcade integration which acted as double
skin façade and provided shading for windows in comparison with 1970‘s
unit.
After 2000, the ability of glazing to transmit solar heat has minimized and
controlled by the establishment of Dubai rules and regulations which
specified a maximum solar heat gain coefficient (SHGC) of 0.4.
In future unites a slight reduction has achieved due to the light transmittance
control with minimum value of 0.25. An extra reduction in Abu Dhabi
Estidama unites has achieved since the solar heat gain coefficient (SHGC)
is set to be 0.3.
7.2.6 Internal Gains – Lighting
Figure 7.10 illustrate remarkable findings of internal gains through lighting
units since lighting gains have substantial impacts on total energy
consumption (for both lighting and cooling loads).

107
Inversely to the conducted simulations, the traditional house has recorded
the highest value of internal gains through lightings among all timeline cases
and that‘s due to inefficient type of lightings used at that time since tungsten
lamps were generating heat gains up to (41,534 KWh/Y) which presents the
total energy consumption of traditional house before 1970‘s.
Another reason makes the traditional house in the top of light gain producers
is the operating time of tungsten lamps due to high overall shading level of
the internal spaces of house which extends the working time of lighting units
and thus extend the heat gain through them.
Figure 7.10: Internal Gain – Lighting (KWh/Y)
41.5
34
35.7
72
34.8
46
34.8
46
34.8
46
9.8
33
11.6
3
6.6
32
8.5
42
6.6
32
8.5
42
0
5
10
15
20
25
30
35
40
traditio
nal fe
atu
res (
Baselin
e 1
)
with a
rcade (
Baselin
e 2
)
without arc
ade
With b
rick a
nd p
itch r
oof
without brick a
nd p
itch r
oof
re-t
raditio
nal
post-
modern
re-t
raditio
nal
post-
modern
re-t
raditio
nal
post-
modern
Before 1970
1970-1990 1990-2000 2000-2010 After 2014 (Dubai Green Regulations)
Abu Dhabi Estidama
Inte
rnal g
ain
-L
igh
tin
g (
KW
h/Y
)
Th
ou
san
ds
Sustainable Development Timeline
Internal Gain - Lighting (KWh/Y)

108
In 1970‘s – 1990‘s unit the heat gain through tungsten lamps has minimized
14% compared to traditional house levels due to less operation time of the
lighting fixtures.
In 1990‘s – 2000 unit, a 16.2% reduction has recorded also due to the same
reason of minimizing the working time of tungsten lamps since the demand
of lighting in 1970‘s house was higher due to the outer façade of arcade
integration which maximize the shading level in indoor spaces.
After 2000, a massive drop in heat gain through lights has occurred due to
the utilizing of new florescent lightings in this era. This drop has reached a
reduction between 72% and 76% of historical gain level in relation to the
house design (re-traditional or post-modern).
Further reductions have recorded in future units in Dubai and in Abu Dhabi
Estidama units (79% - 84%) from the level of light gain in historical house.
The following section shows how these reductions affected the total cost of
energy bill in Dubai.
7.3 Total Energy Cost
The energy cost analysis has derived from the current price of electricity
according to Dubai Electricity and Water Authority (DEWA) as the actual
price of electricity that cost the government is equal to AED 0.25/KW.
From the conducted results of total energy cost per year of local housing
units in Dubai (Figure 7.11), it is clear that the rate of minimization of total

109
energy cost is compatible with the improvement of sustainable conditions of
the buildings.
Figure 7.11: Total Energy Cost – AED/Y
10.3
83
37.9
37
41.8
48
30.1
15
32
.83
8
16.7
23 19.2
24
11
.24
4
16.4
55
10.4
97
14.5
39
0
5
10
15
20
25
30
35
40tr
aditio
nal fe
atu
res
with a
rcade
without arc
ade
With b
rick a
nd p
itch r
oof
without brick a
nd p
itch r
oof
re-t
raditio
na
l
post-
modern
re-t
raditio
na
l
post-
modern
re-t
raditio
na
l
post-
modern
Before 1970
1970-1990 1990-2000 2000-2010 After 2014 (Dubai Green Regulations)
Abu Dhabi Estidama
To
tal en
erg
y c
ost
AE
D/y
ear
Th
ou
san
ds
Sustainable Development Timeline
Total Energy Cost AED/ Year

110
A reduction of 57% to 70% of total energy cost in Dubai green buildings has
achieved comparing the energy cost in 1970‘s. And further reduction has
achieved of 62% to 73% by Estidama units of Abu Dhabi also in comparison
with 1970‘s level.
Another significant result has recorded is that the total energy cost of re-
traditional design of Abu Dhabi Estidama unit which enclosing lighting and
cooling energy is almost equal to the total energy cost of traditional building
that involve lighting energy only which verify that the ability of future green
practices and sustainable developments to re-create environmentally
friendly buildings that present green and comfort balance within affordable
price of energy.
7.4 Modified Material Cost
A material cost analysis that contains the price of materials which has been
changed or modified for green provisions proposes has been performed
between current statement, future statement after applying Dubai green
regulations and subsequently the statement of Abu Dhabi Estidama rating
system in order to evaluate the effectiveness of energy cost in relation to
construction material cost of local housing units and its sustainable
development. Figure 7.12 demonstrates the total changing cost of modified
materials of thermal insulations and glazing.
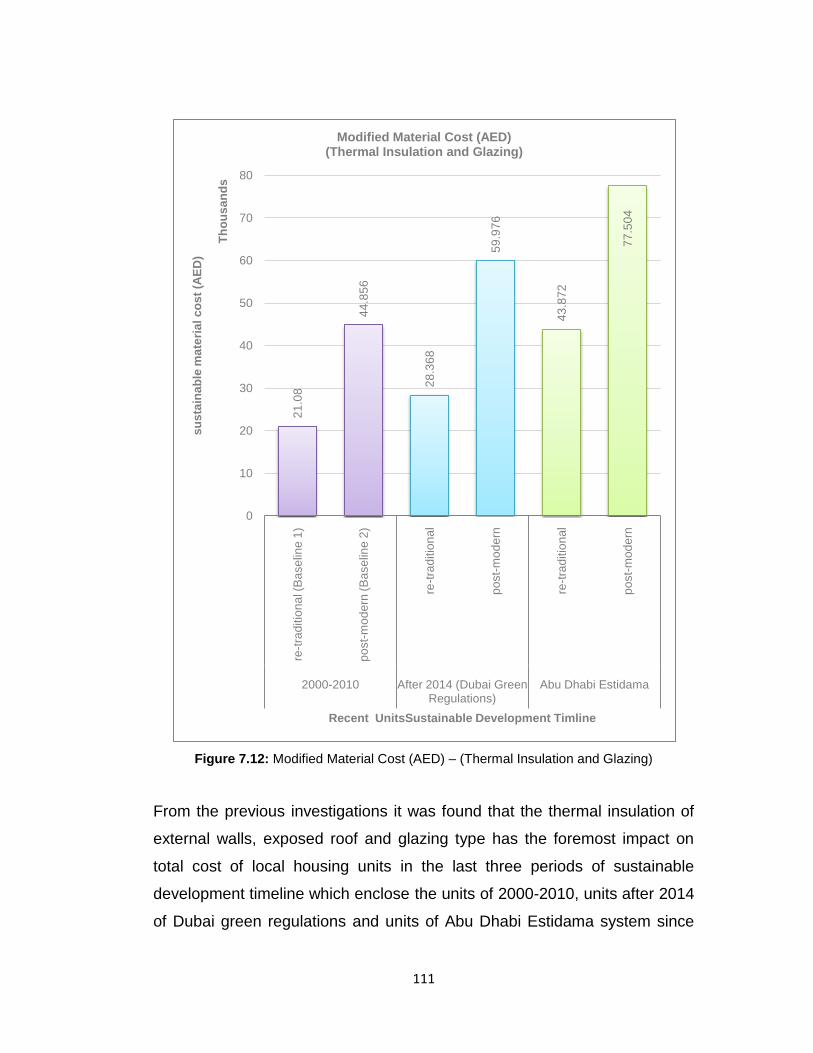
111
Figure 7.12: Modified Material Cost (AED) – (Thermal Insulation and Glazing)
From the previous investigations it was found that the thermal insulation of
external walls, exposed roof and glazing type has the foremost impact on
total cost of local housing units in the last three periods of sustainable
development timeline which enclose the units of 2000-2010, units after 2014
of Dubai green regulations and units of Abu Dhabi Estidama system since
21
.08
44
.85
6
28
.36
8
59
.97
6
43
.87
2
77
.50
4
0
10
20
30
40
50
60
70
80
re-t
rad
itio
na
l (B
ase
line
1)
po
st-
mo
de
rn (
Ba
se
line
2)
re-t
rad
itio
na
l
po
st-
mo
de
rn
re-t
rad
itio
na
l
po
st-
mo
de
rn
2000-2010 After 2014 (Dubai Green Regulations)
Abu Dhabi Estidama
su
sta
ina
ble
ma
teri
al c
os
t (A
ED
)
Th
ou
sa
nd
s
Recent UnitsSustainable Development Timline
Modified Material Cost (AED)(Thermal Insulation and Glazing)

112
the other building construction materials of these recent periods hasn‘t
changed in local housing industry and accordingly only the materials that
has been changed or modified are calculated with the intention of
conducting a sensible analysis regarding the additional cost of sustainable
local housing units.
According to the previous information and as shown if Figure 7.12 the total
cost of double glazing and thermal insulation material of exposed roof and
external walls is increasing with the improvement of sustainable
development timeline.
Based on recent market prices and certified suppliers and manufacturers of
double glazing and thermal insulation materials in Dubai, it was found that
the cost of double glazing with a U-value of 3.28 is in the range of AED
300/m², double glazing with a U-value of 2.1 is in the range of AED 400/m²,
double glazing with a U-value of 1.9 is in the range of AED 440/m². And the
cost of thermal insulation is in the range of AED 1.40/ m² with a thickness of
1cm. Figure 7.13 shows the details of thermal insulation cost and glazing
cost in different timeline periods.
The total exposed roof area together with the solid and glazed areas of
external façade has been calculated for each unit in order to set up the total
cost of the modified materials of every housing unit in recent sustainable
development timeline.
It is important to mention that the extra cost ratio is conducted for the
material cost only without distribute it on total building construction cost
which will be discussed later in this chapter.

113
Figure 7.13: Modified Material Cost (AED) – (Thermal Insulation and Glazing)
It is clear that the cost of materials is increasing with improved material
specifications but a significant finding of that even though the cost of thermal
insulation is increasing but its increasement is not parallel with glazing cost
increasing which is considered to be notably expansive in comparison with
thermal insulation cost as shown in Figure 7.13.
Based on U-Value calculator of Abu Dhabi Estidama (Figure:6.6) and the
software of integrated environmental solutions (IES-VE), it was found that
the thickness of thermal insulation needs to be increased in order to reduce
its U-value as per Dubai green regulations and Estidama rating system
which leads to extend its cost as shown in Figure 7.13.
3.0
8
2.8
56
4.3
68
3.9
76
17.4
72
15.9
04
18
42
24
56
26.4
61
.6
0
10
20
30
40
50
60
re-traditional (Baseline 1)
post-modern (Baseline 2)
re-traditional post-modern re-traditional post-modern
2000-2010 After 2014 (Dubai Green Regulations)
Abu Dhabi Estidama
Th
erm
al In
su
lati
on
an
d G
lazin
g C
ost
(AE
D)
Th
ou
san
ds
Recent Sustainable Development Timeline
Thermal Insulation and Glazing Cost (AED)
Thermal Insulation Cost Double Glazing Cost

114
In re-traditional unit of Dubai Green Regulations an increase of 33% of total
material cost was recorded in comparison with the same type in the period
of 2000 - 2010 while it is almost the double price in Estidama unit in
comparison with the same type of 2000 – 2010.
In post-modern unit of Dubai Green Regulations it was found that an
increase of 33% also was recorded in comparison with 2000 – 2010 levels
while in Abu Dhabi Estidama an increase of 71% was found in comparison
with the post-modern type of 2000 – 2010.
7.5 Energy and Modified Material Cost and Cost Difference
The difference in modified material cost and total energy cost of green
buildings of Dubai and Abu Dhabi in relation with the current state period of
2000 - 2010 has been conducted with the purpose of applying a payback
period analysis. Figure 7.14 presents the cost and cost difference between
total energy consumption and modified material properties within recent
units of timeline periods.
It was found that the total energy cost in re-traditional type of Dubai Green
regulations is decreased AED 5,497 per year in comparison with the same
type in 2000-2010 levels while in re-traditional type of Abu Dhabi Estidama
the total energy cost is decreased AED 6,226 per year in comparison with
the same type of 2000 - 2010.

115
Figure 7.14: Energy and Material Cost and Cost Difference (AED) – (Thermal Insulation
and Glazing)
Figure 7.14 shows a decrease of AED 2,769 per year that has achieved in
post-modern type of Dubai Green regulations while a reduction of AED
4,684 per year has recorded in post-modern type of Abu Dhabi Estidama in
comparison with the same type of 2000 - 2010.
In the subject of modified materials cost, it was found that an increase of
AED 7,288 in re-traditional type of Dubai green regulations while an
increase of AED 22,792 was recorded in the same type of Abu Dhabi
Estidama in comparison with that of 2000 – 2010.
And an increase of AED 15,121 was recorded of post-modern type of Dubai
Green regulations while an increase of AED 32,648 in the post-modern type
16.7
23
19.2
24
11.2
44
16.4
55
10.4
97
14.5
421.0
81
44
.85
6
28.3
68
59.9
76
43.8
72
77.5
04
5.4
79
2.7
69
6.2
26
4.6
84
7.2
88
15.1
21 22.7
92
32.6
48
0
10
20
30
40
50
60
70
re-traditional (Baseline 1)
post-modern (Baseline 2)
re-traditional post-modern re-traditional post-modern
2000-2010 After 2014 (Dubai Green Regulations)
Abu Dhabi Estidama
En
erg
y a
nd
Mate
rial C
ost
an
d C
ost
Dif
fere
nce (
AE
D)
Th
ou
san
ds
Recent Sustainable Development Timeline
Energy and Modified Material Cost and Cost Difference (AED)
Energy Cost Material Cost Difference in energy Cost Difference in material Cost

116
of Abu Dhabi Estidama with comparison with the same type in current state
of 2000 – 2010.
7.6 Total Construction Cost
Based on recent market prices and licensed consultants and contractors in
Dubai Municipality it was found that the total construction cost for local
housing units that comprise re-traditional design (less glazed areas) is in the
range of AED 3100/m², and the total construction cost of local housing units
that comprise post-modern design (wide glazed areas) is in the range of
AED 3200/m².,
The total construction cost of local housing units of recent sustainable
development timeline has been created based on the obtained informations
of total construction cost of local housing units in the recent market and
based on the obtained data of difference in modified material cost of green
buildings of Dubai and Abu Dhabi as illustrated in Figure 7.14.
Figure 7.15 shows that the total construction cost of re-traditional unit of
Dubai future has increased 0.46% compared to the level of the same design
of current statement and the total construction cost of post-modern unit of
Dubai future has increased 0.94% compared to the same type of current
statement.
Abu Dhabi Estidama units has shown a little more increasement than Dubai
future units where the total construction cost of re-traditional unit has
increased 1.46% compared to the same type of 2000‘s-2010‘s levels while
the post-modern design has increased 2.04% compared to the same design
of 2000‘s-2010‘s levels.

117
Figure 7.15: Total Construction Cost (AED)
7.7 Payback Period Analysis
Based on the previous discussion and obtained information, the difference
of total construction cost then is divided on the difference of total energy
cost of each type in the recent sustainable development timeline in order to
get the payback period results and analyze them as shown in Figure 7.16.
1.5
6
1.6
1.5
67
28
8
1.6
15
12
1
1.5
82
79
2
1.6
32
64
8
1.52
1.54
1.56
1.58
1.6
1.62
1.64
re-traditional (Baseline 1)
post-modern (Baseline 2)
re-traditional post-modern re-traditional post-modern
2000-2010 After 2014 (Dubai Green Regulations)
Abu Dhabi Estidama
Tota
l Co
nst
ruct
ion
Co
st (
AED
)
Mill
ion
s
Recent Sustainable Development Timeline
Total Construction Cost (AED)

118
Figure 7.16: Difference in Total Construction Cost and Total Energy Cost (AED)
It was found that the payback period of each unit in the recent sustainable
development timeline is based on two reasons; the first reason is the design
of the local housing unit (re-traditional or post-modern), the second reason is
the level of sustainable instruments used in each type.
Figure 7.17 shows that in re-traditional unit of Dubai green regulations 1.3
years are required to recover the total additional cost of total construction
based on the minimized energy cost per year while a payback period of the
same type in Abu Dhabi Estidama was found to be 3.6 years to recover the
additional cost paid for modified materials.
7.288
15.121
22.792
32.648
5.479
2.769
6.226
4.684
0
5
10
15
20
25
30
re-traditional (Baseline 1)
post-modern (Baseline 2)
re-traditional post-modern re-traditional post-modern
2000-2010 After 2014 (Dubai Green Regulations)
Abu Dhabi EstidamaDif
fere
nce in
To
tal
Co
nstr
ucti
on
Co
st
an
d T
ota
l E
nerg
y C
ost
(AE
D)
Th
ou
san
ds
Recent Sustainable Development Timeline
Difference in Total Construction Cost and Total Energy Cost (AED)
Difference in Total Construction Cost Difference in energy Cost

119
Figure 7.17: Payback Period (Years)
Figure 7.17 shows that in post-modern design of Dubai Green regulations
the payback period was be 5.4 years while in the same type of Abu Dhabi
Estidama the payback period was recorded to be 7 years in order to recover
the additional cost of total construction.
From the previous discussion about the payback period it was found that the
re-traditional design in all periods of sustainable development timeline is
more cost effective than that of post-modern design and that‘s mostly due to
the excessive use of glass façades which is more costly and expensive than
that of re-traditional design which requires less glass and more solids.
1.3
5.4
3.6
7
0
1
2
3
4
5
6
7
re-traditional (Baseline 1)
post-modern (Baseline 2)
re-traditional post-modern re-traditional post-modern
2000-2010 After 2014 (Dubai Green Regulations)
Abu Dhabi Estidama
Payb
ack p
eri
od
(years
)
Recent Sustainable Development Timeline
Payback Period (Years)

120
Chapter 8: Conclusions and Recommendation

121
8.1 Conclusions
Based on literature review, the computer simulation has found to be the
most appropriate method to achieve the objectives of the research of
sustainable development of local housing units in Dubai. The software of
Integrated Environmental Solutions (IES-VE) was found the best software to
be used in this research area due to its reliability, validity and flexibility to
use.
Before conducting the computer simulation, a database survey using Dubai
Municipality archives and permit system has been conducted in order to
collect the required information for local housing units‘ specifications and
building material properties.
After conducting the computer simulations, it was found that the traditional
house has the minimum value of energy consumption among all other units.
The only energy consumer of this type of buildings was the lighting units of
tungsten lamps.
With the beginning of using air conditioning window units in 1970‘s, the total
energy consumption has lifted up extremely about four times than the total
energy of traditional unit.
Remarkable reductions has obtained in future cases of Dubai (49% - 63%)
and Estidama cases of Abu Dhabi (57% - 71%) below 1970‘s – 1990‘s
levels due to new policy instruments, energy efficiency direction and thermal
performance development.
Another significant result has recorded is that the total energy cost of re-
traditional design of Abu Dhabi Estidama unit which enclosing lighting and

122
cooling energy is almost equal to the total energy cost of traditional building
that involve lighting energy only which verify that the ability of future green
practices and sustainable developments to re-create environmentally
friendly buildings that present green and comfort balance within affordable
price of energy.
Finally, it was found that the payback period of each unit in the recent
sustainable development timeline is based on two reasons; the first reason
is the design of the local housing unit (re-traditional or post-modern), the
second reason is the level of sustainable instruments used in each type
(Dubai Green Regulations or Abu Dhabi Estidama System). For example the
payback period of re-traditional design of Dubai green regulations was 1.3
years with an extra construction cost of 0.46% above current levels while in
Abu Dhabi Estidama unit of the same design the payback period reached
3.6 years with an additional construction cost of 1.46% but it is worth to
mention that the unit that follows Estidama system is more sufficient and
sustainable in term of energy consumption, thermal performance and
sustainable development.
Based on that the re-traditional design was found to be more cost effective
than post-modern design but in both cases the payback period range in all
cases was found to be compatible with the city growth and improvement in
term of sustainable development since it enhances the overall thermal
performance of the houses which makes it more comfortable and reduces its
total energy consumption which will lead to reduce the CO2 emissions,
operating costs, cooling loads and consequently ensure more sustainable
future with minimized ecological footprint .

123
8.2 Recommendations for future studies
Throughout the conducted study of sustainable development of local
housing units in UAE it was found that some investigations and studies
needed to be conducted in future in the following areas:
The effect of setbacks and surrounding neighbors on heat gain and
thermal performance.
The natural daylight and direct sunlight estimations on visual comfort
and energy consumption.
The mix use of HVAC systems and natural ventilation through
operable windows and their impacts on energy performance and
Indoor Air Quality.
The impacts of integrating green roof strategies on thermal
performance, energy consumption, water consumption and total cost.
The integration of intelligent buildings systems, modern technologies,
and new construction materials and their impacts on overall building
performance, cost and conservations.

124
References

125
Books
Burdett, A., 2000. Records of Dubai. 1st ed. Dubai: Archive Editions Ltd
Codrai, Ronald, 1990. Dubai Mid-Century. Dubai an Arabian Album, 2, 102.
Government of Abu Dhabi, 2010. The Pearl Rating System for Estidama. 1st
ed. Abu Dhabi: Abu Dhabi Urban Planning Council.
Government of Dubai, 2010. Green Buildings Regulations and
Specifications. 1st ed. Dubai: Dubai Municipality.
Handal, Faleh, 1983. The Detailed History of UAE. 1st ed. Abu Dhabi:
Alfeker library for printing and publishing.
Hamza, Kamal, 1968. Dubai the Pearl of the Arabian Coast. 1st ed. Dubai:
Dubai Police
Harris, John R., 1994. Dubai Development Plan May 1971. 1st ed. London:
Archive Editions
Heard-Bey, Frauke, 1982. From Trucial States to United Arab Emirates. 1st
ed. London and New York: Longman.
Hiratage Department, 2007. History of Dubai. 1st ed. Dubai: Dubai
Municipality.
Lorimer , John Gordon, 1986. Gazetteer of the Persian Gulf, Oman and
Central Arabia. 1st ed. Qatar: Garnet Publishing Ltd.
Santamouris, Matheos, 2007. Advances in Passive Cooling. 1st ed. UK and
USA: Earthscan

126
Shirley Kay, Dariush Zandi, 1991. Architectural Heritage of the Gulf. 1st ed.
Dubai: Motivate Pubishing.
Conference Papers
Bukhash, Rashad, (2011). Historical Buildings of Dubai. In conservation of
historical buildings in Dubai . Dubai, 21st to 23rd of February 2011 .
Heritage Architecture Department : Dubai Municipality.
(www.dubaihistoric.ae)
Roaf, Susan, (2005). Air-conditioning avoidance: lessons from the
windcatchers of Iran. In Passive and Low Energy Cooling 1053 for the Built
Environment. Santorini, May 2005. Greece: palenc. 1053-1057
(http://www.inive.org)
Electronic Journal Articles
Carlo Ratti, Dana Raydan, Koen Steemers, 2003. Building form and
environmental performance: archetypes, analysis and an arid
climate. Energy and Buildings, [Online]. 35, 49–59. Available
at:http://www.sciencedirect.com [Accessed 05 February 2011].
Crawley. Drury B. , Jon W. Hand, Michae¨ l Kummert, Brent T. Griffith, 2008.
Contrasting the capabilities of building energy performance simulation
programs. Building and Environment, [Online]. 43, 661–673. Available
at: http://www.sciencedirect.com [Accessed 27 March 2011]

127
David Bassens, Frank Witlox, Ben Derudder, 2010. The making and
breaking of Dubai: The end of a city–state?. elsevier, [Online]. 29, 299–301.
Available at: http://www.sciencedirect.com [Accessed 05 February 2011].
Dili A.S., Naseer M.A., T. Zacharia Varghese, 2011. Passive control
methods for a comfortable indoor environment: Comparative investigation of
traditional and modern architecture of Kerala in summer. Energy and
Buildings, [Online]. 43, 653–664. Available
at: http://www.sciencedirect.com [Accessed 09 February 2011].
Lee W.L., Yik. F.W.H. , 2004. Regulatory and voluntary approaches for
enhancing building energy efficiency.Progress in Energy and Combustion
Science, [Online]. 30, 477–499. Available
at:http://www.sciencedirect.com [Accessed 11 February 2011].
Melchert, Luciana, 2007. The Dutch sustainable building policy: A model for
developing countries?. Building and Environment, [Online]. 42, 893–901.
Available at: http://www.sciencedirect.com [Accessed 11 March 2011].
Ochoa Carlos Ernesto , Capeluto Isaac Guedi Capeluto, 2008. Strategic
decision-making for intelligent buildings: Comparative impact of passive
design strategies and active features in a hot climate. Building and
Environment, [Online]. 43, 1829–1839. Available
at: http://www.sciencedirect.com [Accessed 08 February 2011].

128
Pacione, Michael, 2005. City profile Dubai. elsevier, [Online]. 22/3, 255–265.
Available at:http://www.sciencedirect.com [Accessed 03 February 2011].
Perez. Yael Valerie , Capeluto. Isaac Guedi , 2009. Climatic considerations
in school building design in the hot–humid climate for reducing energy
consumption. Applied Energy, [Online]. 86, 340–348. Available
at:http://www.sciencedirect.com [Accessed 10 February 2011].
ROAF, Susan, 1988. The Wind Catchers of Yazd. advances in passive
cooling, [Online]. 38, 204. Available at: http: //www.sciencedirect.com
[Accessed 05 February 2011].
West, Shane, 2001. Improving the sustainable development of building
stock by the implementation of energy e•cient, climate control
technologies. Building and Environment, [Online]. 36, 281-289. Available
at:http://www.sciencedirect.com [Accessed 07 February 2011].
WWF, 2010. SUMMARY REPORT 2007-2010. THE UAE ECOLOGICAL
FOOTPRINT INITIATIVE, [Online]. 1, 6 - 14. Available
at: http://wwf.panda.org/ [Accessed 03 February 2011].
Zhiqiang (John) Zhai, Jonathan M. Previtali, 2010. Ancient vernacular
architecture: characteristics categorization and energy performance
evaluation. Energy and Buildings, [Online]. 42, 357–365. Available
at:http://www.sciencedirect.com [Accessed 07 February 2011]

129
Websites
ASHRAE. 2011. Handbook. [ONLINE] Available at: http://www.ashrae.org.
[Accessed 04 March 11].
Dubai Buildings. 2010. Dubai Buildings Permits. [ONLINE] Available
at: http://www.dubaibuildings.dm.ae. [Accessed 04 March 11].
Dubai Historic. 2010. the conservation of historical buildings in Dubai .
[ONLINE] Available at:http://www.dubaihistoric.ae. [Accessed 05 March 11].
Estidama. 2010. Pearl Villa Rating System. [ONLINE] Available
at: http://www.estidama.org. [Accessed 04 March 11].
Integrated Environmental Solutions. 2011. IES Case Studies. [ONLINE]
Available at: http://www.iesve.com. [Accessed 11 March 11].
Thermal Insulation of Dubai Buildings. 2009. Thermal Insulation
Specifications. [ONLINE] Available at:http://www.thermal.dm.ae. [Accessed
11 March 11].

130
Bibliography

131
Bibliography
Aboulnaga, Mohsen M. , 2006. Towards green buildings: Glass as a building
element—the use and misuse in the gulf region. Renewable Energy,
[Online]. 31, 631–653. Available at: http://www.sciencedirect.com[Accessed
11 February 2011].
Cardinalea, N. , Ruggierob, F. , 2002. Acase study on the environmental
measures techniques for the conservation in the vernacular settlements in
Southern Italy. Building and Environment, [Online]. 37, 405 – 414. Available
at: http://www.sciencedirect.com [Accessed 11 February 2011].
Charikleia Karakosta, Dimitris Askounis, 2010. Developing countries' energy
needs and priorities under a sustainable development perspective: A
linguistic decision support approach. Energy for Sustainable Development,
[Online]. 14, 330–338. Available at: http://www.sciencedirect.com [Accessed
11 February 2011].
Charikleia Karakosta, Haris Doukas, John Psarras, 2009. Directing clean
development mechanism towards developing countries' sustainable
development priorities. Energy for Sustainable Development, [Online]. 13,
77–84. Available at: http://www.sciencedirect.com [Accessed 11 February
2011].

132
Eben Saleh, Mohammed Abdullah , 2000. The architectural form and
landscape as a harmonic entity in the vernacular settlements of
Southwestern Saudi Arabia. Habitat International, [Online]. 24, 455-473.
Available at: http://www.sciencedirect.com [Accessed 12 March 2011].
Karen Holm Olsen, Jørgen Fenhann, 2008. Sustainable development
benefits of clean development mechanism projects A new methodology for
sustainability assessment based on text analysis of the project design
documents submitted for validation. Energy Policy, [Online]. 36, 2819–
2830. Available at:http://www.sciencedirect.com [Accessed 12 February
2011].
McNeill, Judith M. , Williams, Jeremy B. , 2007. The employment effects of
sustainable development policies.ECOLOGCAL ECONOMICS, [Online]. 64,
216 – 223. Available at:http://www.sciencedirect.com [Accessed 10
February 2011].
Mirjana Golusin, Olja Munitlak Ivanovic, Natasa Teodorovic , 2011. The
review of the achieved degree of sustainable development in South Eastern
Europe—The use of linear regression method. Renewable and Sustainable
Energy Reviews, [Online]. 15, 766–772. Available
at: http://www.sciencedirect.com [Accessed 10 February 2011].
Olja D. Munitlak Ivanovic, Mirjana T. Golusin, Sinisa. Dodic, Jelena M.
Dodic, 2009. Perspectives of sustainable development in countries of

133
Southeastern Europe. Renewable and Sustainable Energy Reviews,
[Online]. 13, 2079–2087. Available
at: http://www.sciencedirect.com [Accessed 11 February 2011].
Omer, Abdeen Mustafa , 2008. Energy, environment and sustainable
development. Renewable and Sustainable Energy Reviews, [Online]. 12,
2265–2300. Available at: http://www.sciencedirect.com [Accessed 11
February 2011].
Ozyurt, O., 2010. Energy issues and renewables for sustainable
development in Turkey. Renewable and Sustainable Energy Reviews,
[Online]. 14, 2976–2985. Available
at: http://www.sciencedirect.com [Accessed 10 February 2011].
Radhi, Hassan, 2009. Evaluating the potential impact of global warming on
the UAE residential buildings – A contribution to reduce the CO2
emissions. Building and Environment, [Online]. 44, 2451–2462. Available
at:http://www.sciencedirect.com [Accessed 10 February 2011].
Robinson, John, 2004. Squaring the circle? Some thoughts on the idea of
sustainable development.Ecological Economics, [Online]. 369– 384, 48.
Available at: http://www.sciencedirect.com [Accessed 11 February 2011].
Sittha Sukkasi, Nuwong Chollacoop, Wyn Ellis, Simon Grimley, Samai Jai-
In, 2010. Challenges and considerations for planning toward sustainable

134
biodiesel development in developing countries: Lessons fromthe Greater
Mekong Subregion. Renewable and Sustainable Energy Reviews, [Online].
14, 3100–3107. Available at: http://www.sciencedirect.com [Accessed 12
February 2011].
Xiaoli Hao, Guoqiang Zhang, Youming Chen, 2007. Role of BCHP in energy
and environmental sustainable development and its prospects in
China. Renewable and Sustainable Energy Reviews, [Online]. 11, 1827–
1842. Available at: http://www.sciencedirect.com [Accessed 12 February
2011].

135
Apendex A: Input Data Details – weather data model, rooms specifications,
constructions material specifications, electrical lighting specifications.
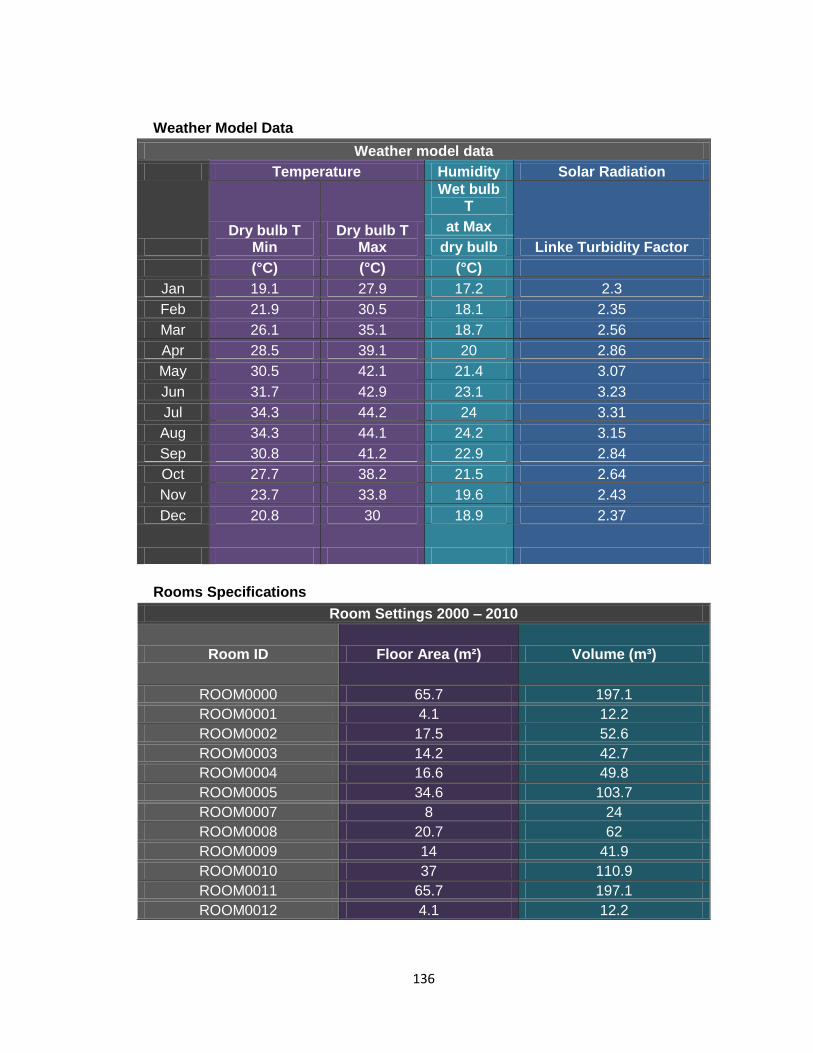
136
Weather Model Data
Weather model data
Temperature Humidity Solar Radiation
Dry bulb T
Min Dry bulb T
Max
Wet bulb T
Linke Turbidity Factor
at Max
dry bulb
(°C) (°C) (°C)
Jan 19.1 27.9 17.2 2.3
Feb 21.9 30.5 18.1 2.35
Mar 26.1 35.1 18.7 2.56
Apr 28.5 39.1 20 2.86
May 30.5 42.1 21.4 3.07
Jun 31.7 42.9 23.1 3.23
Jul 34.3 44.2 24 3.31
Aug 34.3 44.1 24.2 3.15
Sep 30.8 41.2 22.9 2.84
Oct 27.7 38.2 21.5 2.64
Nov 23.7 33.8 19.6 2.43
Dec 20.8 30 18.9 2.37
Rooms Specifications
Room Settings 2000 – 2010
Room ID Floor Area (m²) Volume (m³)
ROOM0000 65.7 197.1
ROOM0001 4.1 12.2
ROOM0002 17.5 52.6
ROOM0003 14.2 42.7
ROOM0004 16.6 49.8
ROOM0005 34.6 103.7
ROOM0007 8 24
ROOM0008 20.7 62
ROOM0009 14 41.9
ROOM0010 37 110.9
ROOM0011 65.7 197.1
ROOM0012 4.1 12.2

137
ROOM0013 17.5 52.6
ROOM0014 14.2 42.7
ROOM0015 16.6 49.8
ROOM0016 34.6 103.7
ROOM0017 8 24
ROOM0018 20.7 62
ROOM0020 37 110.9
ROOM0032 14 41.9
464.8 1393.8
Associated Construction Material
Electric Lighting Templates 2000 - 2010
Luminance Level 500 cd/m²
Luminaire:
DULCET: CROMPTON DULCET WITH OPAL DIFFUSER (source: unknown file )
Limiting Glare Index 19 Lamp: 1203: 1200mm Polylux T8 lamp
Working Surface Height 0.850 m
Lamp Colour:
WW: 3450.0 lm, lmf=3
Mounting Height 2.7 m
Luminaire Maintenance Factor (LMF) 0.9
Room Surface Maintenance Factor (RSMF)
0.9
Lamp-Lumen Maintenance Factor (LLMF) 5000 Replacement period
Lamp Survival Factor (LSF) 1

138
Construction Materials Details
2000 - 2010
Floor
Material ID (outside to inside)
Category Thickness
(m) Conductivity
W/(m·K) Density (kg/m³)
Specific heat
capacity (
J/(kg·K))
Resistance (m²K/W)
Vapour resistance
SLATE TILES Tiles 0.1 2 2700 753 0 0
Sand Sands,
Stones, & Soils
0.015 0.35 2080 840
CAST CONCRETE
Concretes 0.2 1.13 2000 1000 0 0
Total construction thickness (m)
0.315
R-value (m²K/W) 0.2698
U-Value ( W/m²K)
2.084
Building Regulations - thermal bridging coefficient ( W/m²K)
0.208
Outside surface
Emissivity 0.9
Resistance (m2K/W)
0.04
Solar absorptance
0.7
Inside surface
Emissivity 0.9
Resistance (m2K/W)
0.17
Solar absorptance
0.55
Roof
Material ID (outside to inside)
Category Thickness
(m) Conductivity
W/(m·K) Density (kg/m³)
Specific heat
capacity (
J/(kg·K))
Resistance (m²K/W)
Vapour resistance
CONCRETE TILES
Tiles 0.015 1.1 2100 837 0 0
SAND Sands,
Stones, & Soils
0.015 0.35 2080 840 0 0
AERATED-CONCRETE SLAB
Concretes 0.07 0.16 500 840

139
GLASS-FIBRE SLAB
Insulating material
0.075 0.035 25 1000
AERATED-CONCRETE SLAB
Concretes 0.07 0.16 500 840
GYPSUM PLASTERING
Plaster 0.01 0.16 801 837 0 0
Total construction thickness (m)
0.335
R-value (m²K/W) 3.6369
U-Value ( W/m²K)
0.2648
Building Regulations - thermal bridging coefficient ( W/m²K)
0.026
Outside surface
Emissivity 0.9
Resistance (m2K/W)
0.04
Solar absorptance
0.5
Inside surface
Emissivity 0.9
Resistance (m2K/W)
0.1
Solar absorptance
0.55
External walls
Material ID (outside to inside)
Category Thickness
(m) Conductivity
W/(m·K) Density (kg/m³)
Specific heat
capacity (
J/(kg·K))
Resistance (m²K/W)
Vapour resistance
GYPSUM PLASTERING
Plaster 0.015 0.42 1200 837 0 0
GLASS-FIBER - ORGANIC BONDED (ASHRAE)
Insulating material
0.05 0.036 100 1000
CONCRETE BLOCK (LIGHTWEIGHT)
Concretes 0.2 0.19 600 1000 0 0
GYPSUM PLASTERING
Plaster 0.015 0.42 1200 837 0 0
Total construction thickness (m)
0.28
R-value (m²K/W) 2.5129
U-Value ( W/m²K)
0.3727
Building Regulations - thermal bridging coefficient
0.037

140
(W/m2 K)
Outside surface
Emissivity 0.9
Resistance (m2K/W)
0.04
Solar absorptance
0.7
Inside surface
Emissivity 0.9
Resistance (m2K/W)
0.13
Solar absorptance
0.55
Internal partitions
Material ID (outside to inside)
Category Thickness
(m) Conductivity
W/(m·K) Density (kg/m³)
Specific heat
capacity (
J/(kg·K))
Resistance (m²K/W)
Vapour resistance
PLASTER (LIGHTWEIGHT)
Plaster 0.013 0.16 600 1000 0 0
BRICKWORK (INNER LEAF)
Brick & Block work
0.105 0.62 1700 800 0 0
PLASTER (LIGHTWEIGHT)
Plaster 0.013 0.16 600 1000 0 0
Total construction thickness (m)
0.131
R-value (m²K/W) 0.3319
U-Value ( W/m²K)
1.6896
Building Regulations - thermal bridging coefficient (W/m2 K)
0.169
Outside surface
Emissivity 0.9
Resistance (m2K/W)
0.13
Solar absorptance
0.55
Inside surface
Emissivity 0.9
Resistance (m2K/W)
0.13
Solar absorptance
0.55
Doors

141
Material ID (outside to inside)
Category Thickness
(m) Conductivity
W/(m·K) Density (kg/m³)
Specific heat
capacity (
J/(kg·K))
Resistance (m²K/W)
Vapour resistance
PINE (20% MOIST)
Timber 0.04 0.14 419 2720 0 0
Total construction thickness (m)
0.04
R-value (m²K/W) 0.2857
U-Value ( W/m²K)
2.1944
Building Regulations - thermal bridging coefficient (W/m2 K)
0.219
Outside surface
Emissivity 0.9
Resistance (m2K/W)
0.04
Solar absorptance
0.7
Inside surface
Emissivity 0.9
Resistance (m2K/W)
0.13
Solar absorptance
0.55
External glazing
Material ID (outside to inside)
Thickness (m)
Conductivity W/(m·K)
Outside reflectance
Inside reflectance
Transmittance Refractive
indesx
Convection coeffecient ( W/m²K)
Resistance (m²K/W)
PILKINGTON K 6MM
0.006 1.06 0.09 0.09 0.69 1.526
Cavity (Air) 0.012 2.08 0.3247
CLEAR FLOAT 6MM
0.006 1.06 0.07 0.07 0.78 1.526
Total construction thickness (m)
0.024
Frame material
Percentage Absorbtance Resistance (m²K/W) U-value ( W/m²K)
Metal 10% 0.7 0.3332 1.9873
U-value (glass only) ( W/m²K)
1.9762
U-value (with frame) ( W/m²K)
1.9773
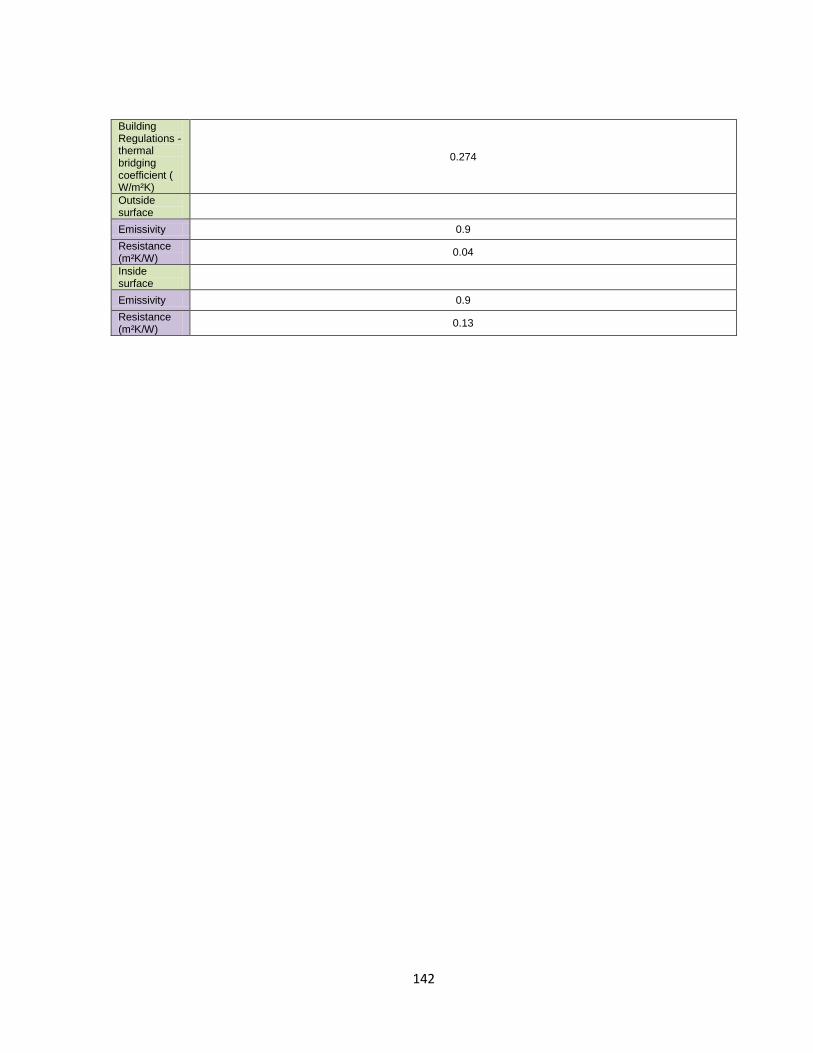
142
Building Regulations - thermal bridging coefficient ( W/m²K)
0.274
Outside surface
Emissivity 0.9
Resistance (m²K/W)
0.04
Inside surface
Emissivity 0.9
Resistance (m²K/W)
0.13

143
Appendix B: Simulation Model Results – 2000-2010 units
Thermal performance and energy consumption

144
2000’s 2010 Re-traditional Unit Simulations – Thermal performance
External conduction Gain
Conduction gain -
external walls (kW)
Conduction gain - external glazing (kW)
Conduction gain - external doors (kW)
Conduction gain - ground floor (kW)
Conduction gain - roof (kW)
External conduction gain (kW)
20 rooms 20 rooms 20 rooms 20 rooms 20 rooms 20 rooms
Date Time 2000-2010.clg
2000-2010.clg
2000-2010.clg
2000-2010.clg
2000-2010.clg
2000-2010.clg
January 0:30 0.6662 -0.7281 -0.0881 0.6879 0.3289 0.8667
1:30 0.5894 -0.7928 -0.1021 0.6487 0.2637 0.607
2:30 0.5356 -0.8511 -0.1136 0.5801 0.2141 0.365
3:30 0.4832 -0.8957 -0.1233 0.487 0.1657 0.1169
4:30 0.4294 -0.9195 -0.1308 0.3734 0.1175 -0.13
5:30 0.373 -0.909 -0.1351 0.243 0.0693 -0.3587
6:30 0.4705 -0.8397 -0.1299 0.2537 0.1114 -0.134
7:30 0.2175 -0.6767 -0.1246 -0.008 -0.0697 -0.6615
8:30 -0.2662 -0.3212 -0.0892 -0.7113 -0.3483 -1.7361
9:30 -0.5047 0.096 -0.0006 -1.8026 -0.411 -2.6229
10:30 -0.4565 0.484 0.1176 -1.99 -0.3869 -2.2318
11:30 -0.3475 0.8188 0.216 -1.9954 -0.3458 -1.6539
12:30 -0.3468 1.0456 0.2532 -2.3075 -0.3375 -1.693
13:30 -0.448 1.1608 0.2662 -2.4087 -0.3472 -1.7768
14:30 -0.5672 1.1326 0.3051 -2.5717 -0.3359 -2.0371
15:30 -0.3212 0.9497 0.3452 -2.125 -0.2365 -1.3878
16:30 -0.2363 0.5957 0.3494 -1.1028 -0.1598 -0.5538
17:30 0.4973 0.2525 0.274 -0.1351 0.1913 1.0801
18:30 0.5466 0.0353 0.1348 0.0861 0.2477 1.0505
19:30 0.5369 -0.143 0.0496 0.2013 0.2737 0.9185
20:30 0.5517 -0.3083 0.0028 0.322 0.2966 0.8648
21:30 0.5619 -0.4526 -0.0295 0.4271 0.3046 0.8115
22:30 0.5605 -0.5756 -0.055 0.5034 0.2971 0.7303
23:30 0.5465 -0.6706 -0.0758 0.5436 0.2763 0.6199
February 0:30 1.0209 -0.3193 -0.0229 1.9971 0.5666 3.2423
1:30 0.9413 -0.3826 -0.0366 1.9599 0.4941 2.976

145
2:30 0.8844 -0.4398 -0.0479 1.894 0.4372 2.7278
3:30 0.8289 -0.4835 -0.0575 1.8041 0.3819 2.4739
4:30 0.7721 -0.5068 -0.0649 1.694 0.3273 2.2218
5:30 0.7129 -0.4963 -0.0691 1.5674 0.2733 1.9882
6:30 0.8077 -0.4277 -0.0639 1.5821 0.3102 2.2084
7:30 0.3999 -0.2424 -0.0615 1.2965 0.0724 1.465
8:30 0.0182 0.1576 -0.0203 0.4964 -0.2018 0.4501
9:30 -0.1256 0.5862 0.0931 -0.4907 -0.226 -0.1631
10:30 -0.1197 0.9876 0.217 -0.5266 -0.1996 0.3586
11:30 -0.0031 1.3359 0.3117 -0.4621 -0.156 1.0263
12:30 0.0114 1.5697 0.3396 -0.7226 -0.1373 1.0608
13:30 -0.0652 1.6869 0.3438 -0.8065 -0.1486 1.0104
14:30 -0.1714 1.6558 0.3865 -0.976 -0.1465 0.7483
15:30 0.0125 1.4664 0.4344 -0.6645 -0.0625 1.1862
16:30 -0.0257 1.1109 0.4309 0.0103 -0.0189 1.5077
17:30 0.7821 0.6934 0.3733 1.0527 0.4105 3.312
18:30 0.9151 0.4302 0.2257 1.3958 0.5056 3.4723
19:30 0.8959 0.255 0.1223 1.5106 0.5281 3.3119
20:30 0.9097 0.0928 0.0695 1.6301 0.5517 3.2537
21:30 0.9203 -0.049 0.0356 1.7344 0.5586 3.1999
22:30 0.9186 -0.1699 0.0098 1.8106 0.5473 3.1165
23:30 0.9032 -0.2631 -0.0108 1.8514 0.5209 3.0016
March 0:30 1.5608 0.2998 0.0777 4.1789 0.9016 7.0187
1:30 1.4785 0.2328 0.0632 4.1418 0.8208 6.7371
2:30 1.4183 0.1725 0.0513 4.0744 0.7552 6.4717
3:30 1.359 0.1264 0.0413 3.9816 0.6914 6.1997
4:30 1.2981 0.1018 0.0334 3.8676 0.6286 5.9296
5:30 1.2345 0.113 0.029 3.7361 0.5669 5.6795
6:30 1.2372 0.2101 0.034 3.7016 0.5597 5.7425
7:30 0.7692 0.4745 0.0488 3.2569 0.2465 4.7959
8:30 0.4656 0.9211 0.1198 2.1963 0.0419 3.7447
9:30 0.3671 1.3659 0.2415 1.5177 0.0469 3.539
10:30 0.442 1.7856 0.3676 1.6462 0.0876 4.3291
11:30 0.5423 2.1489 0.4502 1.8708 0.144 5.1562
12:30 0.5632 2.392 0.4722 1.7466 0.1616 5.3356
13:30 0.4875 2.5111 0.4824 1.5947 0.1425 5.2182
14:30 0.4125 2.471 0.529 1.2994 0.1446 4.8565
15:30 0.5419 2.2646 0.5656 1.5459 0.2305 5.1485
16:30 0.5024 1.8889 0.5354 2.0593 0.2577 5.2437
17:30 1.1919 1.4394 0.471 3.055 0.6951 6.8524

146
18:30 1.4347 1.1113 0.3436 3.5037 0.8508 7.2441
19:30 1.4407 0.907 0.2368 3.6653 0.8829 7.1327
20:30 1.4516 0.7357 0.1774 3.793 0.905 7.0626
21:30 1.4627 0.586 0.1403 3.9047 0.9106 7.0043
22:30 1.4613 0.4584 0.1127 3.9867 0.8957 6.9148
23:30 1.4451 0.36 0.0907 4.0313 0.8634 6.7904
April 0:30 1.96 0.6925 0.1437 5.8017 1.1731 9.7709
1:30 1.8772 0.6124 0.1266 5.7626 1.0852 9.464
2:30 1.8151 0.5402 0.1125 5.6871 1.0115 9.1665
3:30 1.7527 0.4852 0.1006 5.5813 0.939 8.8587
4:30 1.6875 0.4556 0.0913 5.4501 0.8673 8.5518
5:30 1.6184 0.4685 0.086 5.298 0.7965 8.2674
6:30 1.453 0.6347 0.0902 5.1559 0.7002 8.034
7:30 1.0303 1.0069 0.1331 4.5062 0.3539 7.0304
8:30 0.8155 1.471 0.2321 3.2568 0.2678 6.0433
9:30 0.7802 1.9451 0.3619 2.8876 0.2833 6.2581
10:30 0.8703 2.4 0.4767 3.2694 0.328 7.3444
11:30 0.9705 2.7983 0.5448 3.5841 0.3851 8.2827
12:30 0.9786 3.0717 0.5673 3.5506 0.3915 8.5597
13:30 0.9023 3.2092 0.5931 3.291 0.3669 8.3626
14:30 0.8407 3.171 0.6441 2.8997 0.376 7.9314
15:30 0.9425 2.9519 0.6564 3.018 0.4694 8.0382
16:30 0.937 2.5521 0.5962 3.5358 0.4875 8.1086
17:30 1.4924 2.0833 0.5301 4.4799 0.8975 9.4832
18:30 1.7473 1.684 0.4214 4.9589 1.1074 9.919
19:30 1.8241 1.419 0.3253 5.191 1.163 9.9223
20:30 1.8366 1.2148 0.2604 5.3508 1.1855 9.8482
21:30 1.8531 1.0365 0.2181 5.4897 1.1923 9.7897
22:30 1.8564 0.8845 0.1858 5.592 1.1765 9.6952
23:30 1.8432 0.7673 0.1599 5.6492 1.1406 9.5602
May 0:30 2.2878 1.0235 0.1981 7.0544 1.3712 11.9351
1:30 2.2039 0.9349 0.1795 7.0149 1.28 11.6132
2:30 2.1397 0.8552 0.164 6.9352 1.2023 11.2963
3:30 2.0744 0.7944 0.1508 6.8218 1.1253 10.9666
4:30 2.0056 0.7616 0.1405 6.6804 1.0488 10.6369
5:30 1.9006 0.7881 0.1345 6.4935 0.9584 10.2751
6:30 1.6396 1.0053 0.1469 6.2994 0.8148 9.906
7:30 1.1956 1.4175 0.212 5.5607 0.5028 8.8885
8:30 1.168 1.8849 0.3263 4.4702 0.4535 8.3028
9:30 1.1337 2.3695 0.4506 4.1168 0.4687 8.5394

147
10:30 1.2207 2.8436 0.5497 4.524 0.5134 9.6514
11:30 1.3187 3.2634 0.6095 4.8966 0.5666 10.6549
12:30 1.3148 3.5579 0.6351 4.8645 0.5664 10.9387
13:30 1.2313 3.7125 0.6685 4.5371 0.5422 10.6916
14:30 1.1693 3.6825 0.718 4.1225 0.5547 10.247
15:30 1.2512 3.469 0.7169 4.1854 0.6463 10.2688
16:30 1.1943 3.0747 0.6422 4.7879 0.635 10.3341
17:30 1.6546 2.6003 0.5617 5.5814 1.007 11.405
18:30 2.0578 2.1372 0.4797 6.0855 1.2968 12.057
19:30 2.1565 1.8266 0.3932 6.376 1.3674 12.1197
20:30 2.1615 1.6015 0.3256 6.558 1.3868 12.0335
21:30 2.1784 1.4048 0.2801 6.7154 1.3939 11.9727
22:30 2.1834 1.2371 0.2449 6.8318 1.3781 11.8753
23:30 2.1712 1.1078 0.2164 6.8979 1.3411 11.7344
June 0:30 2.4434 1.2233 0.228 7.5303 1.4662 12.8913
1:30 2.3582 1.1375 0.2099 7.4919 1.3746 12.5721
2:30 2.2928 1.0603 0.1949 7.4146 1.2965 12.2591
3:30 2.2263 1.0014 0.1821 7.305 1.2191 11.9339
4:30 2.1566 0.9697 0.1721 7.1684 1.1424 11.6091
5:30 2.0373 1.0024 0.1663 6.9763 1.0451 11.2273
6:30 1.7548 1.2275 0.1814 6.7639 0.8962 10.8238
7:30 1.3207 1.6292 0.2511 6.0147 0.5992 9.8149
8:30 1.315 2.0851 0.3658 5.0468 0.5529 9.3656
9:30 1.3031 2.5582 0.4852 4.6635 0.5692 9.5792
10:30 1.3862 3.0155 0.5775 5.0571 0.6119 10.6482
11:30 1.4835 3.426 0.6346 5.4388 0.6647 11.6477
12:30 1.4878 3.7155 0.6618 5.4352 0.6685 11.9688
13:30 1.4148 3.8695 0.6912 5.141 0.6491 11.7656
14:30 1.3483 3.8503 0.7352 4.7309 0.6576 11.3222
15:30 1.3996 3.6556 0.7314 4.6902 0.739 11.2157
16:30 1.3013 3.2737 0.6591 5.2139 0.7126 11.1607
17:30 1.7126 2.8145 0.5767 6.0385 1.0441 12.1864
18:30 2.2299 2.3248 0.5135 6.5705 1.3907 13.0294
19:30 2.3262 2.0011 0.4237 6.8744 1.4668 13.0922
20:30 2.3234 1.7831 0.3537 7.0481 1.4825 12.9907
21:30 2.3377 1.5924 0.308 7.1991 1.4891 12.9264
22:30 2.3414 1.4299 0.2734 7.3109 1.4734 12.829
23:30 2.328 1.3045 0.2456 7.3745 1.4364 12.689
July 0:30 2.6527 1.6053 0.2859 8.4441 1.58 14.568
1:30 2.5677 1.5294 0.2697 8.4083 1.4893 14.2643

148
2:30 2.5032 1.461 0.2563 8.3386 1.4127 13.9717
3:30 2.4384 1.4088 0.2449 8.2405 1.3374 13.67
4:30 2.3711 1.3809 0.2361 8.1186 1.2631 13.3698
5:30 2.2855 1.4002 0.231 7.9645 1.1831 13.0644
6:30 2.0662 1.5964 0.2401 7.8064 1.0598 12.769
7:30 1.6134 1.9905 0.3016 7.1605 0.739 11.805
8:30 1.5249 2.4351 0.4124 6.1489 0.6767 11.198
9:30 1.5084 2.8898 0.5325 5.6729 0.6936 11.2971
10:30 1.5929 3.325 0.6283 6.0532 0.7369 12.3362
11:30 1.7026 3.7107 0.6868 6.4756 0.7958 13.3715
12:30 1.7223 3.9748 0.7111 6.5218 0.8068 13.7368
13:30 1.6585 4.1137 0.7332 6.2617 0.7895 13.5566
14:30 1.5887 4.0827 0.7741 5.8434 0.7927 13.0816
15:30 1.6331 3.8878 0.7743 5.7511 0.8693 12.9157
16:30 1.5484 3.5152 0.7035 6.2529 0.8385 12.8586
17:30 1.9398 3.0708 0.6216 7.0524 1.1684 13.853
18:30 2.4505 2.5962 0.5549 7.5761 1.5088 14.6864
19:30 2.5471 2.2937 0.4665 7.8607 1.5842 14.7521
20:30 2.5404 2.1003 0.3993 8.0095 1.598 14.6475
21:30 2.5515 1.9311 0.3572 8.1399 1.6034 14.5831
22:30 2.5528 1.7868 0.3259 8.2366 1.587 14.4889
23:30 2.5379 1.6755 0.3011 8.2911 1.5497 14.3554
August 0:30 2.6113 1.608 0.2859 8.425 1.5511 14.4812
1:30 2.5276 1.5328 0.2698 8.3885 1.4625 14.1813
2:30 2.4649 1.465 0.2566 8.3185 1.3884 13.8933
3:30 2.4022 1.4134 0.2453 8.2204 1.3155 13.5968
4:30 2.337 1.3857 0.2366 8.099 1.2437 13.302
5:30 2.2684 1.3979 0.2316 7.9583 1.173 13.0292
6:30 2.1414 1.5653 0.2381 7.837 1.0858 12.8676
7:30 1.656 1.9465 0.2866 7.203 0.741 11.8331
8:30 1.4875 2.4016 0.3862 6.0612 0.6534 10.9898
9:30 1.4443 2.868 0.5104 5.623 0.6673 11.113
10:30 1.5334 3.3126 0.6194 5.997 0.7123 12.1747
11:30 1.6418 3.6994 0.6856 6.3869 0.7722 13.1858
12:30 1.6599 3.9617 0.709 6.4043 0.7829 13.5177
13:30 1.591 4.0939 0.7311 6.1506 0.7617 13.3283
14:30 1.5273 4.0535 0.7767 5.7472 0.7668 12.8716
15:30 1.6019 3.8377 0.7846 5.7443 0.852 12.8205
16:30 1.5601 3.4467 0.7201 6.2384 0.8406 12.8059
17:30 2.0141 2.9904 0.6426 7.0859 1.2208 13.9539
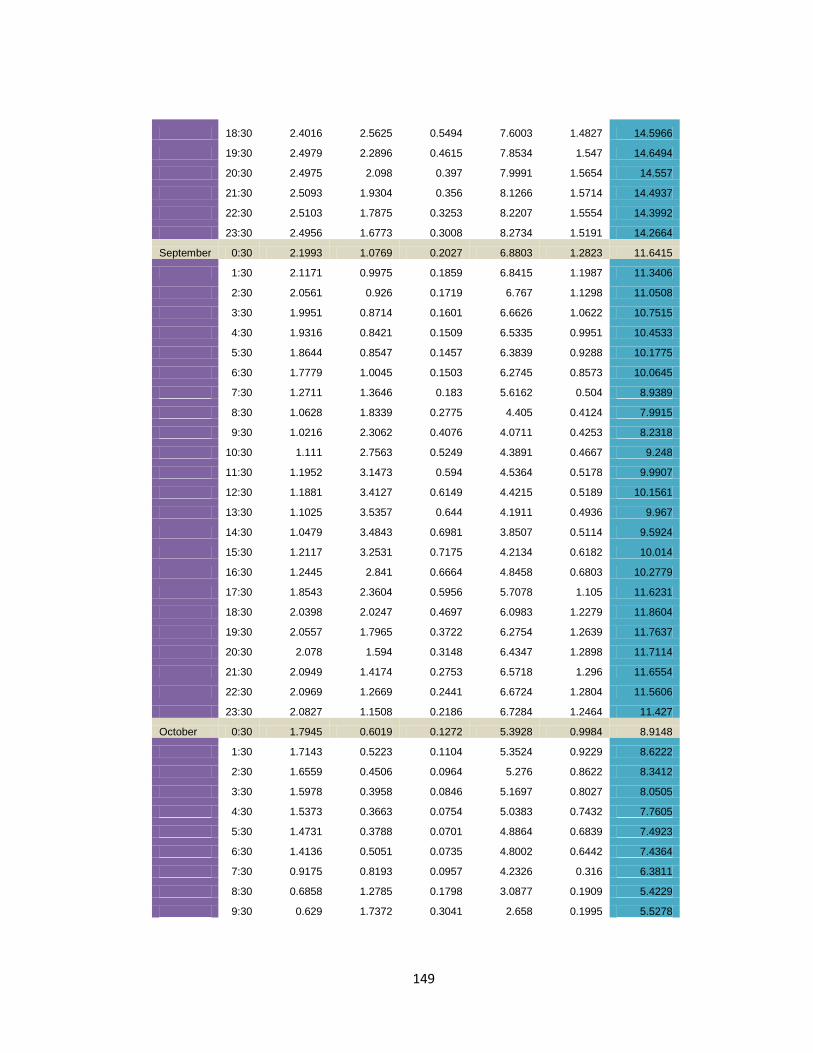
149
18:30 2.4016 2.5625 0.5494 7.6003 1.4827 14.5966
19:30 2.4979 2.2896 0.4615 7.8534 1.547 14.6494
20:30 2.4975 2.098 0.397 7.9991 1.5654 14.557
21:30 2.5093 1.9304 0.356 8.1266 1.5714 14.4937
22:30 2.5103 1.7875 0.3253 8.2207 1.5554 14.3992
23:30 2.4956 1.6773 0.3008 8.2734 1.5191 14.2664
September 0:30 2.1993 1.0769 0.2027 6.8803 1.2823 11.6415
1:30 2.1171 0.9975 0.1859 6.8415 1.1987 11.3406
2:30 2.0561 0.926 0.1719 6.767 1.1298 11.0508
3:30 1.9951 0.8714 0.1601 6.6626 1.0622 10.7515
4:30 1.9316 0.8421 0.1509 6.5335 0.9951 10.4533
5:30 1.8644 0.8547 0.1457 6.3839 0.9288 10.1775
6:30 1.7779 1.0045 0.1503 6.2745 0.8573 10.0645
7:30 1.2711 1.3646 0.183 5.6162 0.504 8.9389
8:30 1.0628 1.8339 0.2775 4.405 0.4124 7.9915
9:30 1.0216 2.3062 0.4076 4.0711 0.4253 8.2318
10:30 1.111 2.7563 0.5249 4.3891 0.4667 9.248
11:30 1.1952 3.1473 0.594 4.5364 0.5178 9.9907
12:30 1.1881 3.4127 0.6149 4.4215 0.5189 10.1561
13:30 1.1025 3.5357 0.644 4.1911 0.4936 9.967
14:30 1.0479 3.4843 0.6981 3.8507 0.5114 9.5924
15:30 1.2117 3.2531 0.7175 4.2134 0.6182 10.014
16:30 1.2445 2.841 0.6664 4.8458 0.6803 10.2779
17:30 1.8543 2.3604 0.5956 5.7078 1.105 11.6231
18:30 2.0398 2.0247 0.4697 6.0983 1.2279 11.8604
19:30 2.0557 1.7965 0.3722 6.2754 1.2639 11.7637
20:30 2.078 1.594 0.3148 6.4347 1.2898 11.7114
21:30 2.0949 1.4174 0.2753 6.5718 1.296 11.6554
22:30 2.0969 1.2669 0.2441 6.6724 1.2804 11.5606
23:30 2.0827 1.1508 0.2186 6.7284 1.2464 11.427
October 0:30 1.7945 0.6019 0.1272 5.3928 0.9984 8.9148
1:30 1.7143 0.5223 0.1104 5.3524 0.9229 8.6222
2:30 1.6559 0.4506 0.0964 5.276 0.8622 8.3412
3:30 1.5978 0.3958 0.0846 5.1697 0.8027 8.0505
4:30 1.5373 0.3663 0.0754 5.0383 0.7432 7.7605
5:30 1.4731 0.3788 0.0701 4.8864 0.6839 7.4923
6:30 1.4136 0.5051 0.0735 4.8002 0.6442 7.4364
7:30 0.9175 0.8193 0.0957 4.2326 0.316 6.3811
8:30 0.6858 1.2785 0.1798 3.0877 0.1909 5.4229
9:30 0.629 1.7372 0.3041 2.658 0.1995 5.5278

150
10:30 0.7213 2.1745 0.4276 2.7899 0.231 6.3444
11:30 0.7757 2.5491 0.495 2.678 0.2663 6.764
12:30 0.7437 2.8036 0.5107 2.5185 0.2588 6.8354
13:30 0.6217 2.9127 0.5454 2.3106 0.2349 6.6252
14:30 0.614 2.8512 0.6041 2.2314 0.2714 6.5721
15:30 0.8546 2.617 0.6366 2.7673 0.4003 7.2758
16:30 0.949 2.202 0.6016 3.5554 0.5228 7.8307
17:30 1.5915 1.8051 0.5058 4.3669 0.8708 9.14
18:30 1.6442 1.5426 0.3723 4.6275 0.9342 9.1209
19:30 1.6519 1.3231 0.2875 4.7888 0.9668 9.018
20:30 1.6754 1.1202 0.2365 4.9492 0.9914 8.9727
21:30 1.6904 0.9432 0.199 5.0865 0.9971 8.9163
22:30 1.691 0.7924 0.1684 5.1868 0.9841 8.8227
23:30 1.6767 0.6761 0.1431 5.242 0.9554 8.6934
November 0:30 1.2527 -0.0125 0.0285 3.3036 0.6504 5.2226
1:30 1.1758 -0.0884 0.0124 3.2639 0.5834 4.9471
2:30 1.1212 -0.1567 -0.0009 3.1897 0.5315 4.6848
3:30 1.0673 -0.2089 -0.0122 3.0867 0.4805 4.4134
4:30 1.0112 -0.237 -0.021 2.9599 0.4293 4.1423
5:30 0.9516 -0.2252 -0.026 2.8133 0.3777 3.8914
6:30 1.0069 -0.1368 -0.0209 2.7854 0.3951 4.0296
7:30 0.58 0.1032 -0.011 2.4098 0.1189 3.2008
8:30 0.1928 0.5393 0.0469 1.4513 -0.0848 2.1454
9:30 0.1271 0.9738 0.1611 0.6677 -0.091 1.8387
10:30 0.1977 1.3849 0.284 0.6906 -0.0593 2.4979
11:30 0.2395 1.7369 0.3596 0.46 -0.0354 2.7607
12:30 0.2033 1.9772 0.384 0.2448 -0.0425 2.7669
13:30 0.0686 2.0825 0.4165 0.0771 -0.0585 2.5863
14:30 0.0777 2.0271 0.4672 0.102 -0.0201 2.6539
15:30 0.3514 1.8069 0.5082 0.7783 0.1297 3.5744
16:30 0.6083 1.4066 0.486 1.7522 0.281 4.5341
17:30 1.0739 1.0986 0.3667 2.3827 0.5192 5.4411
18:30 1.0883 0.8829 0.2448 2.5655 0.5633 5.3448
19:30 1.1047 0.6736 0.1753 2.7207 0.5985 5.2729
20:30 1.1292 0.4804 0.1306 2.8743 0.6228 5.2373
21:30 1.1439 0.3119 0.0961 3.0057 0.6302 5.1878
22:30 1.145 0.1683 0.0673 3.1014 0.6215 5.1035
23:30 1.1324 0.0574 0.0434 3.1538 0.5994 4.9864
December 0:30 0.8575 -0.4548 -0.0444 1.6343 0.4225 2.4151
1:30 0.7818 -0.523 -0.059 1.5947 0.3596 2.1541

151
2:30 0.7291 -0.5846 -0.0711 1.5242 0.312 1.9096
3:30 0.6777 -0.6317 -0.0813 1.4278 0.2655 1.6581
4:30 0.6246 -0.657 -0.0892 1.31 0.2189 1.4073
5:30 0.5686 -0.6461 -0.0937 1.1744 0.172 1.1752
6:30 0.6662 -0.5744 -0.0885 1.1793 0.2151 1.3977
7:30 0.3922 -0.3945 -0.0835 0.8943 0.0228 0.8313
8:30 -0.1043 -0.0138 -0.0455 0.1038 -0.2493 -0.3092
9:30 -0.2904 0.4029 0.0543 -0.8914 -0.2946 -1.0191
10:30 -0.2237 0.7905 0.1725 -1.0272 -0.2644 -0.5522
11:30 -0.151 1.1232 0.2609 -1.2411 -0.2347 -0.2426
12:30 -0.1752 1.3477 0.2942 -1.5269 -0.2364 -0.2967
13:30 -0.3009 1.4545 0.3165 -1.6248 -0.2458 -0.4004
14:30 -0.3497 1.4125 0.358 -1.6508 -0.2198 -0.4499
15:30 -0.0506 1.2136 0.3956 -0.9749 -0.087 0.4967
16:30 0.1766 0.8409 0.3893 0.1246 0.0363 1.5678
17:30 0.6956 0.5489 0.2814 0.8231 0.2895 2.6385
18:30 0.712 0.3514 0.1591 0.9875 0.3316 2.5416
19:30 0.7186 0.1629 0.0906 1.1171 0.3629 2.452
20:30 0.7381 -0.0114 0.0483 1.2487 0.386 2.4097
21:30 0.75 -0.1635 0.0165 1.3622 0.394 2.3592
22:30 0.7496 -0.2932 -0.0096 1.4446 0.3872 2.2786
23:30 0.7366 -0.3932 -0.0313 1.4885 0.368 2.1685
total gains 10697.7 11616 2421.34 33679 5547.7 63962.259
Internal conduction Gain Conduction
gain - internal walls (kW)
Conduction gain - internal glazing (kW)
Conduction gain - internal doors (kW)
Conduction gain - floor (kW)
Conduction gain - ceiling (kW)
Internal conduction gain (kW)
20 rooms 20 rooms 20 rooms 20 rooms 20 rooms 20 rooms
Date Time 2000-2010.clg
2000-2010.clg
2000-2010.clg
2000-2010.clg
2000-2010.clg
2000-2010.clg
January 0:30 0.4206 0 0.0114 0.1874 0.3071 0.9266
1:30 0.3778 0 0.0066 0.1699 0.2768 0.831
2:30 0.3533 0 0.0045 0.1565 0.2521 0.7664
3:30 0.3333 0 0.0036 0.1442 0.2335 0.7146
4:30 0.3161 0 0.0033 0.1325 0.2194 0.6714
5:30 0.2996 0 0.0031 0.1207 0.2077 0.6311
6:30 0.5459 0 0.0141 0.1966 0.3435 1.1
7:30 0.1684 0 -0.0095 0.0105 0.2562 0.4256
8:30 -0.4445 0 -0.0264 -0.6001 0.0148 -1.0562
9:30 -0.5228 0 -0.0121 -0.8873 -0.2388 -1.661

152
10:30 -0.5884 0 -0.0068 -0.7673 -0.2446 -1.6071
11:30 -0.4974 0 -0.0009 -0.566 -0.1106 -1.1748
12:30 -0.4193 0 -0.0019 -0.4931 -0.047 -0.9613
13:30 -0.4213 0 -0.0036 -0.571 -0.0981 -1.094
14:30 -0.4732 0 -0.0053 -0.6969 -0.1966 -1.372
15:30 -0.4799 0 -0.0003 -0.6149 -0.0717 -1.1668
16:30 -0.7264 0 -0.015 -0.3003 -0.0166 -1.0583
17:30 0.2366 0 0.0148 0.1593 0.3768 0.7875
18:30 0.3428 0 0.0111 0.2113 0.4328 0.998
19:30 0.3004 0 0.0047 0.1848 0.3757 0.8655
20:30 0.2608 0 0.002 0.1609 0.3176 0.7413
21:30 0.2282 0 0.001 0.1415 0.267 0.6377
22:30 0.2041 0 0.0008 0.1265 0.2262 0.5577
23:30 0.1874 0 0.0009 0.1148 0.1947 0.4978
February 0:30 0.4233 0 0.0115 0.2529 0.2639 0.9516
1:30 0.381 0 0.0067 0.2349 0.2309 0.8535
2:30 0.357 0 0.0046 0.2213 0.2038 0.7866
3:30 0.3372 0 0.0037 0.2089 0.1831 0.7329
4:30 0.3201 0 0.0034 0.1972 0.1672 0.6878
5:30 0.3036 0 0.0032 0.1853 0.1538 0.6458
6:30 0.5499 0 0.0141 0.2613 0.288 1.1133
7:30 0.135 0 -0.0072 -0.0289 0.1852 0.2841
8:30 -0.5156 0 -0.0261 -0.6986 -0.0801 -1.3203
9:30 -0.5551 0 -0.014 -0.8821 -0.2773 -1.7285
10:30 -0.5686 0 -0.0091 -0.7238 -0.2426 -1.544
11:30 -0.478 0 -0.0012 -0.4828 -0.1137 -1.0757
12:30 -0.3884 0 -0.001 -0.3762 -0.0523 -0.8179
13:30 -0.3696 0 -0.0027 -0.4683 -0.101 -0.9416
14:30 -0.3899 0 -0.004 -0.6537 -0.2043 -1.252
15:30 -0.3788 0 0.0001 -0.675 -0.0989 -1.1526
16:30 -0.7827 0 -0.0179 -0.4571 -0.0874 -1.3451
17:30 0.0912 0 0.0119 0.168 0.3019 0.5729
18:30 0.3424 0 0.013 0.286 0.4126 1.054
19:30 0.3014 0 0.0056 0.258 0.3531 0.9181
20:30 0.262 0 0.0024 0.2317 0.2899 0.786
21:30 0.2295 0 0.0012 0.2102 0.2345 0.6755
22:30 0.2057 0 0.0009 0.1937 0.1896 0.5899
23:30 0.1895 0 0.001 0.181 0.1545 0.526
March 0:30 0.4384 0 0.0117 0.3638 0.1789 0.9928
1:30 0.3957 0 0.0069 0.3456 0.1439 0.8921

153
2:30 0.3717 0 0.0047 0.3318 0.1153 0.8235
3:30 0.3519 0 0.0039 0.3192 0.0934 0.7685
4:30 0.3349 0 0.0036 0.3074 0.0765 0.7224
5:30 0.3183 0 0.0034 0.2955 0.0622 0.6793
6:30 0.4823 0 0.0099 0.3251 0.1725 0.9897
7:30 -0.1101 0 -0.0214 -0.1867 0.0102 -0.308
8:30 -0.6395 0 -0.0207 -0.7799 -0.2938 -1.7339
9:30 -0.6702 0 -0.0078 -0.7714 -0.4015 -1.8509
10:30 -0.5106 0 -0.0058 -0.5611 -0.2902 -1.3677
11:30 -0.3557 0 0.0007 -0.2643 -0.133 -0.7523
12:30 -0.2727 0 0.0008 -0.1639 -0.0809 -0.5167
13:30 -0.2755 0 -0.0022 -0.2992 -0.1495 -0.7264
14:30 -0.328 0 -0.0045 -0.5268 -0.2598 -1.1192
15:30 -0.2876 0 -0.0012 -0.616 -0.1748 -1.0796
16:30 -0.7794 0 -0.0156 -0.5338 -0.2028 -1.5316
17:30 -0.0827 0 0.0085 0.1783 0.1657 0.2698
18:30 0.3312 0 0.0122 0.3851 0.325 1.0536
19:30 0.3279 0 0.0065 0.3753 0.2866 0.9964
20:30 0.2845 0 0.0028 0.3472 0.219 0.8535
21:30 0.249 0 0.0014 0.324 0.1591 0.7335
22:30 0.223 0 0.0011 0.3061 0.1103 0.6405
23:30 0.2054 0 0.0011 0.2925 0.072 0.571
April 0:30 0.428 0 0.0118 0.4348 0.1009 0.9755
1:30 0.3899 0 0.007 0.4183 0.068 0.8831
2:30 0.3706 0 0.005 0.406 0.0419 0.8235
3:30 0.3554 0 0.0042 0.3949 0.0228 0.7773
4:30 0.3425 0 0.0039 0.3841 0.0085 0.739
5:30 0.3291 0 0.0037 0.3727 -0.0034 0.7022
6:30 0.2826 0 -0.0058 0.2673 0.0551 0.5993
7:30 -0.2888 0 -0.0143 -0.4626 -0.1319 -0.8976
8:30 -0.5596 0 -0.0103 -0.7916 -0.4173 -1.7789
9:30 -0.6231 0 -0.0095 -0.6178 -0.4498 -1.7002
10:30 -0.4387 0 -0.003 -0.3205 -0.2768 -1.039
11:30 -0.2326 0 0.002 -0.0162 -0.1139 -0.3607
12:30 -0.1642 0 0.0015 0.0358 -0.0789 -0.2058
13:30 -0.2032 0 -0.0024 -0.1479 -0.1681 -0.5215
14:30 -0.2759 0 -0.0053 -0.4056 -0.2831 -0.9699
15:30 -0.2295 0 -0.0027 -0.5369 -0.2295 -0.9986
16:30 -0.615 0 -0.0161 -0.5967 -0.2417 -1.4695
17:30 -0.2559 0 0.0047 0.1286 0.085 -0.0376

154
18:30 0.2122 0 0.0102 0.4173 0.2235 0.8632
19:30 0.2982 0 0.0081 0.4368 0.2084 0.9514
20:30 0.2585 0 0.0035 0.4108 0.1398 0.8126
21:30 0.2266 0 0.0016 0.3895 0.0792 0.697
22:30 0.2044 0 0.0011 0.3735 0.0303 0.6094
23:30 0.1907 0 0.0012 0.3617 -0.0072 0.5464
May 0:30 0.4308 0 0.0119 0.4918 0.0426 0.9772
1:30 0.3939 0 0.0071 0.4762 0.0107 0.888
2:30 0.3761 0 0.0051 0.4649 -0.014 0.8322
3:30 0.3627 0 0.0044 0.4545 -0.0316 0.7899
4:30 0.3514 0 0.0041 0.4442 -0.0444 0.7554
5:30 0.3023 0 0.0014 0.4144 -0.0667 0.6513
6:30 0.2081 0 -0.0039 0.1942 -0.0271 0.3713
7:30 -0.3297 0 -0.0153 -0.5127 -0.2559 -1.1135
8:30 -0.5405 0 -0.0099 -0.6699 -0.446 -1.6663
9:30 -0.5684 0 -0.0081 -0.4748 -0.4639 -1.5152
10:30 -0.3668 0 -0.0014 -0.163 -0.2883 -0.8194
11:30 -0.1501 0 0.0033 0.1241 -0.128 -0.1506
12:30 -0.1017 0 0.002 0.1497 -0.1042 -0.0542
13:30 -0.1666 0 -0.0025 -0.0462 -0.2018 -0.417
14:30 -0.2504 0 -0.0057 -0.3105 -0.3201 -0.8868
15:30 -0.2309 0 -0.0038 -0.457 -0.2914 -0.9831
16:30 -0.6172 0 -0.0193 -0.6032 -0.3074 -1.5472
17:30 -0.4438 0 -0.001 0.0185 -0.0303 -0.4566
18:30 0.1462 0 0.0117 0.4316 0.1394 0.7288
19:30 0.304 0 0.0106 0.4871 0.1511 0.9528
20:30 0.2628 0 0.0046 0.4633 0.0822 0.8128
21:30 0.2298 0 0.0021 0.4434 0.0208 0.6961
22:30 0.2069 0 0.0013 0.4286 -0.0285 0.6083
23:30 0.1931 0 0.0013 0.4178 -0.066 0.5461
June 0:30 0.4388 0 0.012 0.5169 0.0285 0.9962
1:30 0.4005 0 0.0072 0.5007 -0.0048 0.9035
2:30 0.3814 0 0.0052 0.4888 -0.0309 0.8445
3:30 0.3667 0 0.0044 0.4779 -0.0498 0.7992
4:30 0.3542 0 0.0041 0.4674 -0.0637 0.762
5:30 0.2835 0 0 0.4287 -0.0929 0.6194
6:30 0.1459 0 -0.0087 0.1942 -0.0678 0.2636
7:30 -0.3668 0 -0.0165 -0.4801 -0.3015 -1.1649
8:30 -0.5249 0 -0.0069 -0.6239 -0.4585 -1.6143
9:30 -0.5424 0 -0.0059 -0.4334 -0.4779 -1.4595

155
10:30 -0.3445 0 -0.0001 -0.131 -0.3068 -0.7824
11:30 -0.1313 0 0.0039 0.1517 -0.1494 -0.1251
12:30 -0.0779 0 0.0025 0.1898 -0.1184 -0.0041
13:30 -0.1389 0 -0.0019 0.0168 -0.2066 -0.3306
14:30 -0.2305 0 -0.0056 -0.2453 -0.3269 -0.8084
15:30 -0.2482 0 -0.0054 -0.4111 -0.3332 -0.9979
16:30 -0.6568 0 -0.0221 -0.5889 -0.3809 -1.6487
17:30 -0.5083 0 -0.005 -0.112 -0.0984 -0.7237
18:30 0.1439 0 0.0147 0.4313 0.1107 0.7006
19:30 0.3185 0 0.0129 0.5174 0.1428 0.9915
20:30 0.2767 0 0.0056 0.4925 0.0735 0.8484
21:30 0.2423 0 0.0026 0.4715 0.0108 0.7272
22:30 0.2178 0 0.0016 0.4555 -0.0399 0.6349
23:30 0.2024 0 0.0014 0.4437 -0.0788 0.5688
July 0:30 0.4389 0 0.0119 0.5625 -0.0159 0.9974
1:30 0.3988 0 0.0071 0.5455 -0.0505 0.9009
2:30 0.3776 0 0.0051 0.533 -0.0784 0.8372
3:30 0.3607 0 0.0043 0.5217 -0.0994 0.7872
4:30 0.3461 0 0.0039 0.5109 -0.1154 0.7455
5:30 0.3134 0 0.0026 0.4902 -0.1356 0.6706
6:30 0.2266 0 -0.0046 0.3261 -0.092 0.4562
7:30 -0.3251 0 -0.0177 -0.3689 -0.3045 -1.0162
8:30 -0.5174 0 -0.0088 -0.5975 -0.5041 -1.6278
9:30 -0.5797 0 -0.008 -0.4229 -0.557 -1.5676
10:30 -0.3966 0 -0.0018 -0.1284 -0.3947 -0.9214
11:30 -0.1721 0 0.0031 0.1734 -0.2279 -0.2234
12:30 -0.097 0 0.0025 0.2373 -0.1805 -0.0376
13:30 -0.1454 0 -0.0015 0.083 -0.2574 -0.3213
14:30 -0.2329 0 -0.0053 -0.181 -0.3775 -0.7967
15:30 -0.2474 0 -0.005 -0.3512 -0.3935 -0.997
16:30 -0.6464 0 -0.0213 -0.5376 -0.4387 -1.644
17:30 -0.5061 0 -0.0043 -0.064 -0.158 -0.7325
18:30 0.137 0 0.0141 0.481 0.0578 0.69
19:30 0.3209 0 0.0126 0.5676 0.0963 0.9975
20:30 0.2794 0 0.0055 0.5417 0.0288 0.8554
21:30 0.245 0 0.0026 0.5196 -0.033 0.7342
22:30 0.22 0 0.0016 0.5027 -0.0833 0.6409
23:30 0.2038 0 0.0014 0.49 -0.1224 0.5729
August 0:30 0.4315 0 0.0118 0.5605 -0.0222 0.9816
1:30 0.392 0 0.007 0.5436 -0.0561 0.8866

156
2:30 0.3711 0 0.0049 0.5312 -0.0833 0.8239
3:30 0.3544 0 0.0041 0.5199 -0.1039 0.7746
4:30 0.34 0 0.0038 0.5091 -0.1195 0.7334
5:30 0.3255 0 0.0036 0.4978 -0.1327 0.6942
6:30 0.3283 0 0.0027 0.4012 -0.0646 0.6676
7:30 -0.2764 0 -0.0176 -0.2964 -0.2684 -0.8588
8:30 -0.5399 0 -0.0123 -0.6281 -0.5298 -1.71
9:30 -0.6146 0 -0.0108 -0.4689 -0.5822 -1.6765
10:30 -0.4409 0 -0.0035 -0.1741 -0.419 -1.0375
11:30 -0.2216 0 0.002 0.1348 -0.2498 -0.3345
12:30 -0.144 0 0.0018 0.2008 -0.203 -0.1443
13:30 -0.1835 0 -0.002 0.0357 -0.2831 -0.4328
14:30 -0.2581 0 -0.0053 -0.2263 -0.3979 -0.8876
15:30 -0.2351 0 -0.0035 -0.3747 -0.3789 -0.9922
16:30 -0.6013 0 -0.0178 -0.5205 -0.4061 -1.5457
17:30 -0.3961 0 0.0015 0.1413 -0.1135 -0.3669
18:30 0.1569 0 0.0106 0.519 0.0655 0.7519
19:30 0.3069 0 0.01 0.5637 0.083 0.9637
20:30 0.2667 0 0.0043 0.5381 0.0166 0.8257
21:30 0.234 0 0.002 0.5165 -0.0432 0.7093
22:30 0.2106 0 0.0013 0.5 -0.0919 0.62
23:30 0.1956 0 0.0013 0.4878 -0.1297 0.5549
September 0:30 0.4161 0 0.0116 0.4837 0.0356 0.947
1:30 0.3786 0 0.0069 0.4675 0.0042 0.8572
2:30 0.3596 0 0.0048 0.4556 -0.0206 0.7994
3:30 0.3447 0 0.0041 0.4445 -0.0388 0.7545
4:30 0.3319 0 0.0038 0.4339 -0.0523 0.7173
5:30 0.3188 0 0.0036 0.4226 -0.0635 0.6815
6:30 0.3473 0 0.0024 0.346 0.0191 0.7148
7:30 -0.2899 0 -0.0188 -0.3655 -0.185 -0.8593
8:30 -0.606 0 -0.0117 -0.6974 -0.4726 -1.7876
9:30 -0.6396 0 -0.0111 -0.5617 -0.5027 -1.7151
10:30 -0.4327 0 -0.0043 -0.3013 -0.3327 -1.071
11:30 -0.2747 0 0.0011 -0.0229 -0.1943 -0.4908
12:30 -0.222 0 0.0005 0.007 -0.1786 -0.3932
13:30 -0.2451 0 -0.0029 -0.1891 -0.271 -0.7082
14:30 -0.3131 0 -0.0049 -0.4099 -0.3738 -1.1017
15:30 -0.2282 0 -0.0007 -0.4791 -0.2515 -0.9595
16:30 -0.6426 0 -0.0133 -0.3245 -0.2343 -1.2147
17:30 0.0045 0 0.0087 0.3514 0.0809 0.4455

157
18:30 0.2969 0 0.0103 0.4983 0.1835 0.989
19:30 0.2786 0 0.005 0.4806 0.1296 0.8939
20:30 0.2405 0 0.0021 0.4555 0.0635 0.7615
21:30 0.2105 0 0.001 0.4356 0.0062 0.6534
22:30 0.1902 0 0.0008 0.4209 -0.0395 0.5723
23:30 0.1779 0 0.001 0.41 -0.0746 0.5143
October 0:30 0.4155 0 0.0115 0.4098 0.088 0.9249
1:30 0.3769 0 0.0068 0.3941 0.0589 0.8367
2:30 0.357 0 0.0047 0.3824 0.036 0.7801
3:30 0.3413 0 0.004 0.3715 0.0196 0.7363
4:30 0.328 0 0.0037 0.3608 0.0077 0.7002
5:30 0.3145 0 0.0035 0.3495 -0.0021 0.6653
6:30 0.3966 0 0.0049 0.3277 0.0954 0.8247
7:30 -0.2697 0 -0.0214 -0.2537 -0.0959 -0.6406
8:30 -0.5854 0 -0.0144 -0.6856 -0.3846 -1.67
9:30 -0.5351 0 -0.0102 -0.6335 -0.4277 -1.6065
10:30 -0.4485 0 -0.0032 -0.4131 -0.3039 -1.1687
11:30 -0.3588 0 0.0004 -0.1944 -0.1909 -0.7437
12:30 -0.3191 0 -0.001 -0.198 -0.1853 -0.7034
13:30 -0.3442 0 -0.0039 -0.3858 -0.2829 -1.0168
14:30 -0.3738 0 -0.0046 -0.5352 -0.3322 -1.2458
15:30 -0.3532 0 0.0017 -0.4525 -0.1489 -0.9529
16:30 -0.5924 0 -0.0111 -0.0458 -0.1009 -0.7503
17:30 0.2186 0 0.0121 0.384 0.2002 0.8149
18:30 0.3259 0 0.0089 0.4244 0.2291 0.9882
19:30 0.282 0 0.0037 0.3984 0.1647 0.8488
20:30 0.2432 0 0.0015 0.3758 0.1025 0.723
21:30 0.2128 0 0.0008 0.3582 0.0494 0.6211
22:30 0.1917 0 0.0007 0.3451 0.0073 0.5448
23:30 0.1784 0 0.0009 0.3354 -0.0247 0.49
November 0:30 0.3992 0 0.0113 0.3035 0.1611 0.8752
1:30 0.361 0 0.0066 0.2884 0.1348 0.7907
2:30 0.3411 0 0.0045 0.277 0.1141 0.7367
3:30 0.3254 0 0.0037 0.2664 0.0994 0.695
4:30 0.3121 0 0.0034 0.256 0.089 0.6606
5:30 0.2987 0 0.0033 0.245 0.0805 0.6275
6:30 0.4946 0 0.0117 0.2971 0.2083 1.0117
7:30 -0.1039 0 -0.0213 -0.0984 0.068 -0.1555
8:30 -0.5663 0 -0.0274 -0.6734 -0.2356 -1.5026
9:30 -0.4905 0 -0.0049 -0.7311 -0.3353 -1.5619

158
10:30 -0.5006 0 -0.0006 -0.5383 -0.2584 -1.2979
11:30 -0.4211 0 -0.0001 -0.3713 -0.1595 -0.9521
12:30 -0.3785 0 -0.0017 -0.3731 -0.15 -0.9034
13:30 -0.3976 0 -0.0042 -0.5134 -0.2428 -1.158
14:30 -0.4247 0 -0.0023 -0.5992 -0.2629 -1.2891
15:30 -0.462 0 0.0009 -0.3667 -0.0694 -0.8972
16:30 -0.3667 0 -0.0066 0.0441 0.0267 -0.3025
17:30 0.2798 0 0.0117 0.3034 0.2809 0.8758
18:30 0.2971 0 0.0067 0.3069 0.2708 0.8815
19:30 0.2564 0 0.0026 0.2833 0.2121 0.7545
20:30 0.2207 0 0.001 0.2634 0.1566 0.6417
21:30 0.1929 0 0.0005 0.2481 0.1096 0.551
22:30 0.1736 0 0.0005 0.2367 0.0726 0.4834
23:30 0.1615 0 0.0007 0.2283 0.0449 0.4354
December 0:30 0.407 0 0.0113 0.2263 0.2425 0.8871
1:30 0.366 0 0.0065 0.21 0.2151 0.7976
2:30 0.3433 0 0.0044 0.1977 0.1931 0.7385
3:30 0.325 0 0.0036 0.1862 0.177 0.6918
4:30 0.3094 0 0.0033 0.1752 0.1651 0.6529
5:30 0.2941 0 0.0031 0.1639 0.1553 0.6164
6:30 0.5415 0 0.0141 0.24 0.2927 1.0882
7:30 0.1354 0 -0.0087 0.025 0.1967 0.3484
8:30 -0.5072 0 -0.0288 -0.5835 -0.0801 -1.1995
9:30 -0.5198 0 -0.0108 -0.804 -0.2895 -1.624
10:30 -0.5639 0 -0.0044 -0.6587 -0.2699 -1.4969
11:30 -0.4736 0 -0.0015 -0.4946 -0.1539 -1.1237
12:30 -0.4294 0 -0.0028 -0.4663 -0.1243 -1.0228
13:30 -0.4347 0 -0.0044 -0.5608 -0.1973 -1.1972
14:30 -0.4998 0 -0.0049 -0.6415 -0.2451 -1.3914
15:30 -0.5106 0 -0.0015 -0.4503 -0.0657 -1.0282
16:30 -0.4609 0 -0.0068 -0.0695 0.041 -0.4962
17:30 0.2849 0 0.0138 0.227 0.3427 0.8683
18:30 0.3166 0 0.0081 0.2366 0.3481 0.9095
19:30 0.2751 0 0.0033 0.2122 0.2922 0.7829
20:30 0.2378 0 0.0014 0.1912 0.2381 0.6685
21:30 0.2079 0 0.0007 0.1745 0.1918 0.5749
22:30 0.1863 0 0.0006 0.1619 0.155 0.5038
23:30 0.1718 0 0.0007 0.1521 0.127 0.4517
0.768 0 0.015 364.25 -364.89 0.159 Internal gain solar gain through glass

159
People gain (kW)
Lighting gain (kW)
Internal gain (kW)
Solar gain (kW)
20 rooms 20 rooms 20 rooms
20 rooms
Date Time 2000-2010.clg
2000-2010.clg
2000-2010.clg Date Time
2000-2010.clg
January 0:30 0.5794 1.4419 2.0213 January 0:30 0
1:30 0.5794 1.4419 2.0213 1:30 0
2:30 0.5794 1.4419 2.0213 2:30 0
3:30 0.5794 1.4419 2.0213 3:30 0
4:30 0.5794 1.4419 2.0213 4:30 0
5:30 0.5794 1.4419 2.0213 5:30 0
6:30 0.5794 0.5632 1.1426 6:30 0
7:30 0.5794 0.5632 1.1426 7:30 1.2552
8:30 0.5794 0.5632 1.1426 8:30 5.4721
9:30 0.5794 0.5632 1.1426 9:30 8.5339
10:30 0.5794 0.5632 1.1426 10:30 8.9477
11:30 0.5794 0.5632 1.1426 11:30 8.1955
12:30 0.5794 0.5632 1.1426 12:30 8.2961
13:30 0.5794 0.5632 1.1426 13:30 9.1119
14:30 0.5794 0.5632 1.1426 14:30 10.5016
15:30 0.5794 0.5632 1.1426 15:30 10.0039
16:30 0.5794 2.2529 2.8323 16:30 6.3806
17:30 0.5794 2.2529 2.8323 17:30 1.1107
18:30 0.5794 2.2529 2.8323 18:30 0
19:30 0.5794 2.2529 2.8323 19:30 0
20:30 0.5794 2.2529 2.8323 20:30 0
21:30 0.5794 2.2529 2.8323 21:30 0
22:30 0.5794 2.2529 2.8323 22:30 0
23:30 0.5794 2.2529 2.8323 23:30 0
February 0:30 0.5794 1.4419 2.0213 February 0:30 0
1:30 0.5794 1.4419 2.0213 1:30 0
2:30 0.5794 1.4419 2.0213 2:30 0
3:30 0.5794 1.4419 2.0213 3:30 0
4:30 0.5794 1.4419 2.0213 4:30 0
5:30 0.5794 1.4419 2.0213 5:30 0
6:30 0.5794 0.5632 1.1426 6:30 0
7:30 0.5794 0.5632 1.1426 7:30 1.8438
8:30 0.5794 0.5632 1.1426 8:30 6.3718
9:30 0.5794 0.5632 1.1426 9:30 8.8035
10:30 0.5794 0.5632 1.1426 10:30 8.812
11:30 0.5794 0.5632 1.1426 11:30 7.88
12:30 0.5794 0.5632 1.1426 12:30 7.7353
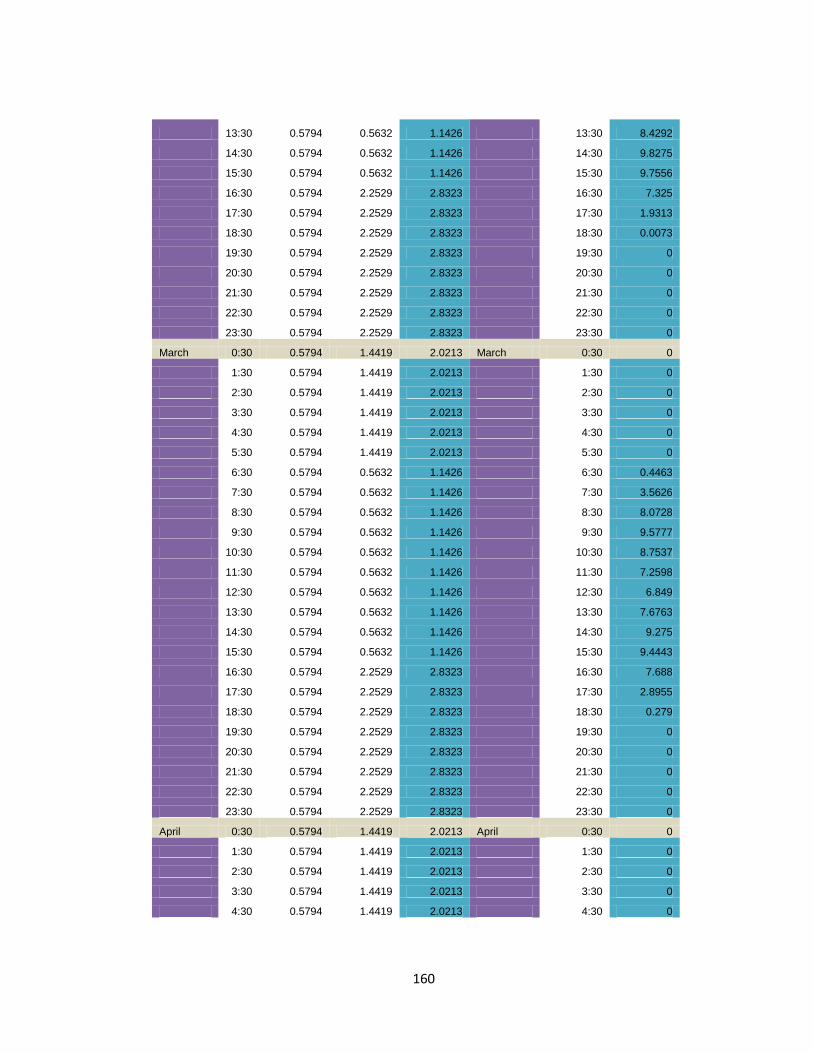
160
13:30 0.5794 0.5632 1.1426 13:30 8.4292
14:30 0.5794 0.5632 1.1426 14:30 9.8275
15:30 0.5794 0.5632 1.1426 15:30 9.7556
16:30 0.5794 2.2529 2.8323 16:30 7.325
17:30 0.5794 2.2529 2.8323 17:30 1.9313
18:30 0.5794 2.2529 2.8323 18:30 0.0073
19:30 0.5794 2.2529 2.8323 19:30 0
20:30 0.5794 2.2529 2.8323 20:30 0
21:30 0.5794 2.2529 2.8323 21:30 0
22:30 0.5794 2.2529 2.8323 22:30 0
23:30 0.5794 2.2529 2.8323 23:30 0
March 0:30 0.5794 1.4419 2.0213 March 0:30 0
1:30 0.5794 1.4419 2.0213 1:30 0
2:30 0.5794 1.4419 2.0213 2:30 0
3:30 0.5794 1.4419 2.0213 3:30 0
4:30 0.5794 1.4419 2.0213 4:30 0
5:30 0.5794 1.4419 2.0213 5:30 0
6:30 0.5794 0.5632 1.1426 6:30 0.4463
7:30 0.5794 0.5632 1.1426 7:30 3.5626
8:30 0.5794 0.5632 1.1426 8:30 8.0728
9:30 0.5794 0.5632 1.1426 9:30 9.5777
10:30 0.5794 0.5632 1.1426 10:30 8.7537
11:30 0.5794 0.5632 1.1426 11:30 7.2598
12:30 0.5794 0.5632 1.1426 12:30 6.849
13:30 0.5794 0.5632 1.1426 13:30 7.6763
14:30 0.5794 0.5632 1.1426 14:30 9.275
15:30 0.5794 0.5632 1.1426 15:30 9.4443
16:30 0.5794 2.2529 2.8323 16:30 7.688
17:30 0.5794 2.2529 2.8323 17:30 2.8955
18:30 0.5794 2.2529 2.8323 18:30 0.279
19:30 0.5794 2.2529 2.8323 19:30 0
20:30 0.5794 2.2529 2.8323 20:30 0
21:30 0.5794 2.2529 2.8323 21:30 0
22:30 0.5794 2.2529 2.8323 22:30 0
23:30 0.5794 2.2529 2.8323 23:30 0
April 0:30 0.5794 1.4419 2.0213 April 0:30 0
1:30 0.5794 1.4419 2.0213 1:30 0
2:30 0.5794 1.4419 2.0213 2:30 0
3:30 0.5794 1.4419 2.0213 3:30 0
4:30 0.5794 1.4419 2.0213 4:30 0

161
5:30 0.5794 1.4419 2.0213 5:30 0
6:30 0.5794 0.5632 1.1426 6:30 1.5098
7:30 0.5794 0.5632 1.1426 7:30 5.5334
8:30 0.5794 0.5632 1.1426 8:30 9.0476
9:30 0.5794 0.5632 1.1426 9:30 9.6453
10:30 0.5794 0.5632 1.1426 10:30 8.0283
11:30 0.5794 0.5632 1.1426 11:30 6.1325
12:30 0.5794 0.5632 1.1426 12:30 5.6351
13:30 0.5794 0.5632 1.1426 13:30 6.6751
14:30 0.5794 0.5632 1.1426 14:30 8.4008
15:30 0.5794 0.5632 1.1426 15:30 8.8367
16:30 0.5794 2.2529 2.8323 16:30 7.1951
17:30 0.5794 2.2529 2.8323 17:30 3.3307
18:30 0.5794 2.2529 2.8323 18:30 0.6844
19:30 0.5794 2.2529 2.8323 19:30 0
20:30 0.5794 2.2529 2.8323 20:30 0
21:30 0.5794 2.2529 2.8323 21:30 0
22:30 0.5794 2.2529 2.8323 22:30 0
23:30 0.5794 2.2529 2.8323 23:30 0
May 0:30 0.5794 1.4419 2.0213 May 0:30 0
1:30 0.5794 1.4419 2.0213 1:30 0
2:30 0.5794 1.4419 2.0213 2:30 0
3:30 0.5794 1.4419 2.0213 3:30 0
4:30 0.5794 1.4419 2.0213 4:30 0
5:30 0.5794 1.4419 2.0213 5:30 0.1958
6:30 0.5794 0.5632 1.1426 6:30 2.2834
7:30 0.5794 0.5632 1.1426 7:30 6.5234
8:30 0.5794 0.5632 1.1426 8:30 8.9492
9:30 0.5794 0.5632 1.1426 9:30 9.2597
10:30 0.5794 0.5632 1.1426 10:30 7.4371
11:30 0.5794 0.5632 1.1426 11:30 5.378
12:30 0.5794 0.5632 1.1426 12:30 4.9278
13:30 0.5794 0.5632 1.1426 13:30 6.0835
14:30 0.5794 0.5632 1.1426 14:30 7.8516
15:30 0.5794 0.5632 1.1426 15:30 8.5019
16:30 0.5794 2.2529 2.8323 16:30 7.1283
17:30 0.5794 2.2529 2.8323 17:30 4.3039
18:30 0.5794 2.2529 2.8323 18:30 1.0831
19:30 0.5794 2.2529 2.8323 19:30 0
20:30 0.5794 2.2529 2.8323 20:30 0

162
21:30 0.5794 2.2529 2.8323 21:30 0
22:30 0.5794 2.2529 2.8323 22:30 0
23:30 0.5794 2.2529 2.8323 23:30 0
June 0:30 0.5794 1.4419 2.0213 June 0:30 0
1:30 0.5794 1.4419 2.0213 1:30 0
2:30 0.5794 1.4419 2.0213 2:30 0
3:30 0.5794 1.4419 2.0213 3:30 0
4:30 0.5794 1.4419 2.0213 4:30 0
5:30 0.5794 1.4419 2.0213 5:30 0.2879
6:30 0.5794 0.5632 1.1426 6:30 2.5965
7:30 0.5794 0.5632 1.1426 7:30 6.78
8:30 0.5794 0.5632 1.1426 8:30 8.8898
9:30 0.5794 0.5632 1.1426 9:30 9.1534
10:30 0.5794 0.5632 1.1426 10:30 7.366
11:30 0.5794 0.5632 1.1426 11:30 5.3151
12:30 0.5794 0.5632 1.1426 12:30 4.7613
13:30 0.5794 0.5632 1.1426 13:30 5.7743
14:30 0.5794 0.5632 1.1426 14:30 7.5295
15:30 0.5794 0.5632 1.1426 15:30 8.4835
16:30 0.5794 2.2529 2.8323 16:30 7.461
17:30 0.5794 2.2529 2.8323 17:30 5.0573
18:30 0.5794 2.2529 2.8323 18:30 1.2983
19:30 0.5794 2.2529 2.8323 19:30 0
20:30 0.5794 2.2529 2.8323 20:30 0
21:30 0.5794 2.2529 2.8323 21:30 0
22:30 0.5794 2.2529 2.8323 22:30 0
23:30 0.5794 2.2529 2.8323 23:30 0
July 0:30 0.5794 1.4419 2.0213 July 0:30 0
1:30 0.5794 1.4419 2.0213 1:30 0
2:30 0.5794 1.4419 2.0213 2:30 0
3:30 0.5794 1.4419 2.0213 3:30 0
4:30 0.5794 1.4419 2.0213 4:30 0
5:30 0.5794 1.4419 2.0213 5:30 0.0971
6:30 0.5794 0.5632 1.1426 6:30 1.9471
7:30 0.5794 0.5632 1.1426 7:30 6.0699
8:30 0.5794 0.5632 1.1426 8:30 8.6484
9:30 0.5794 0.5632 1.1426 9:30 9.2499
10:30 0.5794 0.5632 1.1426 10:30 7.6152
11:30 0.5794 0.5632 1.1426 11:30 5.5116
12:30 0.5794 0.5632 1.1426 12:30 4.7907

163
13:30 0.5794 0.5632 1.1426 13:30 5.6766
14:30 0.5794 0.5632 1.1426 14:30 7.4361
15:30 0.5794 0.5632 1.1426 15:30 8.4584
16:30 0.5794 2.2529 2.8323 16:30 7.4274
17:30 0.5794 2.2529 2.8323 17:30 5.066
18:30 0.5794 2.2529 2.8323 18:30 1.3295
19:30 0.5794 2.2529 2.8323 19:30 0.0006
20:30 0.5794 2.2529 2.8323 20:30 0
21:30 0.5794 2.2529 2.8323 21:30 0
22:30 0.5794 2.2529 2.8323 22:30 0
23:30 0.5794 2.2529 2.8323 23:30 0
August 0:30 0.5794 1.4419 2.0213 August 0:30 0
1:30 0.5794 1.4419 2.0213 1:30 0
2:30 0.5794 1.4419 2.0213 2:30 0
3:30 0.5794 1.4419 2.0213 3:30 0
4:30 0.5794 1.4419 2.0213 4:30 0
5:30 0.5794 1.4419 2.0213 5:30 0
6:30 0.5794 0.5632 1.1426 6:30 1.3023
7:30 0.5794 0.5632 1.1426 7:30 5.4086
8:30 0.5794 0.5632 1.1426 8:30 8.694
9:30 0.5794 0.5632 1.1426 9:30 9.4371
10:30 0.5794 0.5632 1.1426 10:30 7.8774
11:30 0.5794 0.5632 1.1426 11:30 5.8564
12:30 0.5794 0.5632 1.1426 12:30 5.2027
13:30 0.5794 0.5632 1.1426 13:30 6.1468
14:30 0.5794 0.5632 1.1426 14:30 7.8677
15:30 0.5794 0.5632 1.1426 15:30 8.5839
16:30 0.5794 2.2529 2.8323 16:30 7.2545
17:30 0.5794 2.2529 2.8323 17:30 4.1637
18:30 0.5794 2.2529 2.8323 18:30 1.036
19:30 0.5794 2.2529 2.8323 19:30 0
20:30 0.5794 2.2529 2.8323 20:30 0
21:30 0.5794 2.2529 2.8323 21:30 0
22:30 0.5794 2.2529 2.8323 22:30 0
23:30 0.5794 2.2529 2.8323 23:30 0
September 0:30 0.5794 1.4419 2.0213 September 0:30 0
1:30 0.5794 1.4419 2.0213 1:30 0
2:30 0.5794 1.4419 2.0213 2:30 0
3:30 0.5794 1.4419 2.0213 3:30 0
4:30 0.5794 1.4419 2.0213 4:30 0

164
5:30 0.5794 1.4419 2.0213 5:30 0
6:30 0.5794 0.5632 1.1426 6:30 1.1127
7:30 0.5794 0.5632 1.1426 7:30 5.3345
8:30 0.5794 0.5632 1.1426 8:30 8.9075
9:30 0.5794 0.5632 1.1426 9:30 9.5159
10:30 0.5794 0.5632 1.1426 10:30 8.0357
11:30 0.5794 0.5632 1.1426 11:30 6.5517
12:30 0.5794 0.5632 1.1426 12:30 6.3691
13:30 0.5794 0.5632 1.1426 13:30 7.473
14:30 0.5794 0.5632 1.1426 14:30 9.0855
15:30 0.5794 0.5632 1.1426 15:30 8.9019
16:30 0.5794 2.2529 2.8323 16:30 6.5266
17:30 0.5794 2.2529 2.8323 17:30 2.0957
18:30 0.5794 2.2529 2.8323 18:30 0.1436
19:30 0.5794 2.2529 2.8323 19:30 0
20:30 0.5794 2.2529 2.8323 20:30 0
21:30 0.5794 2.2529 2.8323 21:30 0
22:30 0.5794 2.2529 2.8323 22:30 0
23:30 0.5794 2.2529 2.8323 23:30 0
October 0:30 0.5794 1.4419 2.0213 October 0:30 0
1:30 0.5794 1.4419 2.0213 1:30 0
2:30 0.5794 1.4419 2.0213 2:30 0
3:30 0.5794 1.4419 2.0213 3:30 0
4:30 0.5794 1.4419 2.0213 4:30 0
5:30 0.5794 1.4419 2.0213 5:30 0
6:30 0.5794 0.5632 1.1426 6:30 0.8353
7:30 0.5794 0.5632 1.1426 7:30 4.5983
8:30 0.5794 0.5632 1.1426 8:30 8.3687
9:30 0.5794 0.5632 1.1426 9:30 9.1306
10:30 0.5794 0.5632 1.1426 10:30 8.2135
11:30 0.5794 0.5632 1.1426 11:30 7.4206
12:30 0.5794 0.5632 1.1426 12:30 7.5986
13:30 0.5794 0.5632 1.1426 13:30 8.8467
14:30 0.5794 0.5632 1.1426 14:30 9.9139
15:30 0.5794 0.5632 1.1426 15:30 9.0851
16:30 0.5794 2.2529 2.8323 16:30 5.51
17:30 0.5794 2.2529 2.8323 17:30 0.9773
18:30 0.5794 2.2529 2.8323 18:30 0
19:30 0.5794 2.2529 2.8323 19:30 0
20:30 0.5794 2.2529 2.8323 20:30 0

165
21:30 0.5794 2.2529 2.8323 21:30 0
22:30 0.5794 2.2529 2.8323 22:30 0
23:30 0.5794 2.2529 2.8323 23:30 0
November 0:30 0.5794 1.4419 2.0213 November 0:30 0
1:30 0.5794 1.4419 2.0213 1:30 0
2:30 0.5794 1.4419 2.0213 2:30 0
3:30 0.5794 1.4419 2.0213 3:30 0
4:30 0.5794 1.4419 2.0213 4:30 0
5:30 0.5794 1.4419 2.0213 5:30 0
6:30 0.5794 0.5632 1.1426 6:30 0.2361
7:30 0.5794 0.5632 1.1426 7:30 2.863
8:30 0.5794 0.5632 1.1426 8:30 7.1985
9:30 0.5794 0.5632 1.1426 9:30 8.6704
10:30 0.5794 0.5632 1.1426 10:30 8.2412
11:30 0.5794 0.5632 1.1426 11:30 7.8361
12:30 0.5794 0.5632 1.1426 12:30 8.1833
13:30 0.5794 0.5632 1.1426 13:30 9.3543
14:30 0.5794 0.5632 1.1426 14:30 10.1584
15:30 0.5794 0.5632 1.1426 15:30 8.8565
16:30 0.5794 2.2529 2.8323 16:30 4.04
17:30 0.5794 2.2529 2.8323 17:30 0.4317
18:30 0.5794 2.2529 2.8323 18:30 0
19:30 0.5794 2.2529 2.8323 19:30 0
20:30 0.5794 2.2529 2.8323 20:30 0
21:30 0.5794 2.2529 2.8323 21:30 0
22:30 0.5794 2.2529 2.8323 22:30 0
23:30 0.5794 2.2529 2.8323 23:30 0
December 0:30 0.5794 1.4419 2.0213 December 0:30 0
1:30 0.5794 1.4419 2.0213 1:30 0
2:30 0.5794 1.4419 2.0213 2:30 0
3:30 0.5794 1.4419 2.0213 3:30 0
4:30 0.5794 1.4419 2.0213 4:30 0
5:30 0.5794 1.4419 2.0213 5:30 0
6:30 0.5794 0.5632 1.1426 6:30 0
7:30 0.5794 0.5632 1.1426 7:30 1.4182
8:30 0.5794 0.5632 1.1426 8:30 5.8903
9:30 0.5794 0.5632 1.1426 9:30 8.4784
10:30 0.5794 0.5632 1.1426 10:30 8.6183
11:30 0.5794 0.5632 1.1426 11:30 8.2189
12:30 0.5794 0.5632 1.1426 12:30 8.5789

166
13:30 0.5794 0.5632 1.1426 13:30 9.5403
14:30 0.5794 0.5632 1.1426 14:30 10.5778
15:30 0.5794 0.5632 1.1426 15:30 9.3702
16:30 0.5794 2.2529 2.8323 16:30 4.5924
17:30 0.5794 2.2529 2.8323 17:30 0.5495
18:30 0.5794 2.2529 2.8323 18:30 0
19:30 0.5794 2.2529 2.8323 19:30 0
20:30 0.5794 2.2529 2.8323 20:30 0
21:30 0.5794 2.2529 2.8323 21:30 0
22:30 0.5794 2.2529 2.8323 22:30 0
23:30 0.5794 2.2529 2.8323 23:30 0
5006.02 11630 16636.4 28507.116
Energy Consumption
energy consumption
external weather data
Total lights energy (kW)
Ap Sys heat rej fans/pumps energy (kW)
Chillers energy (kW)
Total energy (kW)
Dry-bulb temperature (°C)
Global radiation (W/m²)
2000-2010.clg
2000-2010.clg
2000-2010.clg
2000-2010.clg
1970-1990 house no shading.clg
1970-1990 house no shading.clg
Date Time total consumption
actual coast AED
supported coast AED Date Time
January 0:30 1.4419 0.4858 1.3879 3.3156 January 1:00 20.24 0
1:30 1.4419 0.4496 1.2846 3.1761
2:00 19.8 0
2:30 1.4419 0.4139 1.1826 3.0383
3:00 19.45 0
3:30 1.4419 0.3779 1.0796 2.8993
4:00 19.19 0
4:30 1.4419 0.3424 0.9783 2.7626
5:00 19.1 0
5:30 1.4419 0.3093 0.8837 2.6349
6:00 19.28 0
6:30 0.5632 0.1983 0.5667 1.3282
7:00 19.72 0
7:30 0.5632 0.2213 0.6324 1.417
8:00 20.51 148.9
8:30 0.5632 0.4458 1.2737 2.2827
9:00 21.65 381.36
9:30 0.5632 0.6569 1.8767 3.0968
10:00 22.97 569.1
10:30 0.5632 0.7744 2.2125 3.5501
11:00 24.47 700.46
11:30 0.5632 0.8128 2.3224 3.6984
12:00 25.88 767.12
12:30 0.5632 0.8533 2.4381 3.8546
13:00 26.93 764.76
13:30 0.5632 0.9352 2.6719 4.1702
14:00 27.64 693.53
14:30 0.5632 1.049 2.9971 4.6094
15:00 27.9 558.05

167
15:30 0.5632 1.0982 3.1378 4.7992
16:00 27.64 366.87
16:30 2.2529 1.1417 3.2619 6.6565
17:00 27.02 132.02
17:30 2.2529 0.8836 2.5246 5.6611
18:00 26.05 0
18:30 2.2529 0.7492 2.1407 5.1428
19:00 24.91 0
19:30 2.2529 0.7042 2.012 4.9691
20:00 23.76 0
20:30 2.2529 0.6723 1.9209 4.8461
21:00 22.8 0
21:30 2.2529 0.6446 1.8417 4.7392
22:00 21.92 0
22:30 2.2529 0.6173 1.7638 4.634
23:00 21.21 0
23:30 2.2529 0.5898 1.6851 4.5278 2754.3 688.58 192.8 ##### 20.68 0
February 0:30 1.4419 0.797 2.2772 4.516 February 1:00 23.02 0
1:30 1.4419 0.7597 2.1705 4.372
2:00 22.59 0
2:30 1.4419 0.7228 2.0653 4.23
3:00 22.24 0
3:30 1.4419 0.6858 1.9594 4.087
4:00 21.99 0
4:30 1.4419 0.6494 1.8555 3.9468
5:00 21.9 0
5:30 1.4419 0.6155 1.7585 3.8158
6:00 22.07 0
6:30 0.5632 0.5037 1.4392 2.5061
7:00 22.5 0
7:30 0.5632 0.5549 1.5854 2.7035
8:00 23.28 210.42
8:30 0.5632 0.8116 2.3188 3.6936
9:00 24.39 452.95
9:30 0.5632 1.002 2.8628 4.428
10:00 25.68 650.65
10:30 0.5632 1.1008 3.1452 4.8092
11:00 27.15 791.41
11:30 0.5632 1.1323 3.2353 4.9309
12:00 28.52 866.18
12:30 0.5632 1.1562 3.3035 5.023
13:00 29.55 870.08
13:30 0.5632 1.2278 3.508 5.299
14:00 30.24 802.83
14:30 0.5632 1.3383 3.8238 5.7253
15:00 30.5 668.86
15:30 0.5632 1.4017 4.0048 5.9696
16:00 30.24 476.79
16:30 2.2529 1.4946 4.2703 8.0178
17:00 29.64 238.45
17:30 2.2529 1.2519 3.577 7.0818
18:00 28.69 1.22
18:30 2.2529 1.0714 3.0612 6.3855
19:00 27.58 0
19:30 2.2529 1.0213 2.9179 6.1921
20:00 26.46 0
20:30 2.2529 0.9878 2.8223 6.063
21:00 25.51 0
21:30 2.2529 0.9591 2.7402 5.9522
22:00 24.65 0
22:30 2.2529 0.9308 2.6596 5.8433
23:00 23.96 0
23:30 2.2529 0.9022 2.5777 5.7327 3639.7 909.93 254.78 ##### 23.45 0
March 0:30 1.4419 1.2919 3.6911 6.4248 March 1:00 27.27 0
1:30 1.4419 1.2522 3.5778 6.2719
2:00 26.82 0
2:30 1.4419 1.213 3.4656 6.1204
3:00 26.46 0
3:30 1.4419 1.1734 3.3525 5.9678
4:00 26.19 0
4:30 1.4419 1.1346 3.2416 5.8181
5:00 26.1 0
5:30 1.4419 1.0983 3.1381 5.6782
6:00 26.28 0
6:30 0.5632 1.0036 2.8674 4.4342
7:00 26.73 58.519
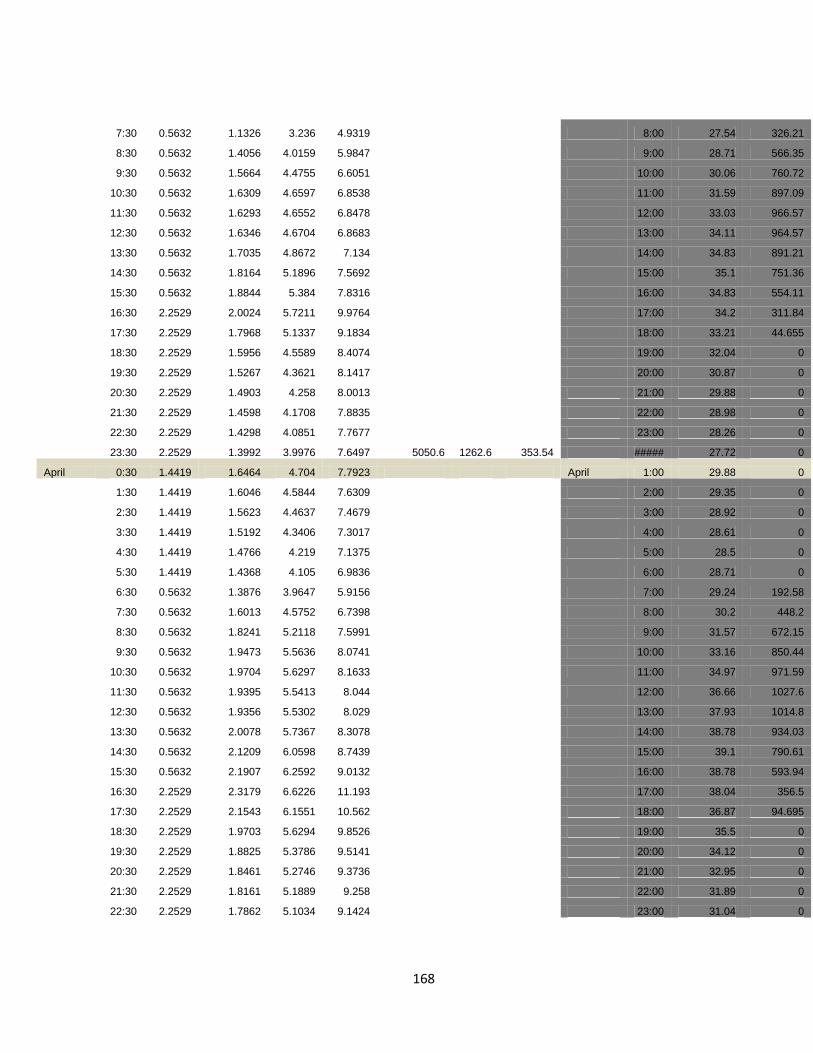
168
7:30 0.5632 1.1326 3.236 4.9319
8:00 27.54 326.21
8:30 0.5632 1.4056 4.0159 5.9847
9:00 28.71 566.35
9:30 0.5632 1.5664 4.4755 6.6051
10:00 30.06 760.72
10:30 0.5632 1.6309 4.6597 6.8538
11:00 31.59 897.09
11:30 0.5632 1.6293 4.6552 6.8478
12:00 33.03 966.57
12:30 0.5632 1.6346 4.6704 6.8683
13:00 34.11 964.57
13:30 0.5632 1.7035 4.8672 7.134
14:00 34.83 891.21
14:30 0.5632 1.8164 5.1896 7.5692
15:00 35.1 751.36
15:30 0.5632 1.8844 5.384 7.8316
16:00 34.83 554.11
16:30 2.2529 2.0024 5.7211 9.9764
17:00 34.2 311.84
17:30 2.2529 1.7968 5.1337 9.1834
18:00 33.21 44.655
18:30 2.2529 1.5956 4.5589 8.4074
19:00 32.04 0
19:30 2.2529 1.5267 4.3621 8.1417
20:00 30.87 0
20:30 2.2529 1.4903 4.258 8.0013
21:00 29.88 0
21:30 2.2529 1.4598 4.1708 7.8835
22:00 28.98 0
22:30 2.2529 1.4298 4.0851 7.7677
23:00 28.26 0
23:30 2.2529 1.3992 3.9976 7.6497 5050.6 1262.6 353.54 ##### 27.72 0
April 0:30 1.4419 1.6464 4.704 7.7923 April 1:00 29.88 0
1:30 1.4419 1.6046 4.5844 7.6309
2:00 29.35 0
2:30 1.4419 1.5623 4.4637 7.4679
3:00 28.92 0
3:30 1.4419 1.5192 4.3406 7.3017
4:00 28.61 0
4:30 1.4419 1.4766 4.219 7.1375
5:00 28.5 0
5:30 1.4419 1.4368 4.105 6.9836
6:00 28.71 0
6:30 0.5632 1.3876 3.9647 5.9156
7:00 29.24 192.58
7:30 0.5632 1.6013 4.5752 6.7398
8:00 30.2 448.2
8:30 0.5632 1.8241 5.2118 7.5991
9:00 31.57 672.15
9:30 0.5632 1.9473 5.5636 8.0741
10:00 33.16 850.44
10:30 0.5632 1.9704 5.6297 8.1633
11:00 34.97 971.59
11:30 0.5632 1.9395 5.5413 8.044
12:00 36.66 1027.6
12:30 0.5632 1.9356 5.5302 8.029
13:00 37.93 1014.8
13:30 0.5632 2.0078 5.7367 8.3078
14:00 38.78 934.03
14:30 0.5632 2.1209 6.0598 8.7439
15:00 39.1 790.61
15:30 0.5632 2.1907 6.2592 9.0132
16:00 38.78 593.94
16:30 2.2529 2.3179 6.6226 11.193
17:00 38.04 356.5
17:30 2.2529 2.1543 6.1551 10.562
18:00 36.87 94.695
18:30 2.2529 1.9703 5.6294 9.8526
19:00 35.5 0
19:30 2.2529 1.8825 5.3786 9.5141
20:00 34.12 0
20:30 2.2529 1.8461 5.2746 9.3736
21:00 32.95 0
21:30 2.2529 1.8161 5.1889 9.258
22:00 31.89 0
22:30 2.2529 1.7862 5.1034 9.1424
23:00 31.04 0

169
23:30 2.2529 1.755 5.0143 9.0223 6025.9 1506.5 421.81 ##### 30.41 0
May 0:30 1.4419 1.9272 5.5063 8.8753 May 1:00 32.01 0
1:30 1.4419 1.8838 5.3822 8.7079
2:00 31.43 0
2:30 1.4419 1.8395 5.2557 8.5371
3:00 30.96 0
3:30 1.4419 1.7941 5.126 8.362
4:00 30.62 0
4:30 1.4419 1.7491 4.9973 8.1883
5:00 30.5 0
5:30 1.4419 1.7158 4.9022 8.0598
6:00 30.73 26.805
6:30 0.5632 1.701 4.8599 7.1241
7:00 31.31 268.96
7:30 0.5632 1.9426 5.5503 8.0561
8:00 32.36 507.41
8:30 0.5632 2.1189 6.0541 8.7363
9:00 33.86 715.31
9:30 0.5632 2.217 6.3343 9.1145
10:00 35.6 879.57
10:30 0.5632 2.2214 6.3467 9.1313
11:00 37.58 989.54
11:30 0.5632 2.1765 6.2186 8.9583
12:00 39.43 1038
12:30 0.5632 2.1719 6.2054 8.9405
13:00 40.82 1021.6
13:30 0.5632 2.2465 6.4187 9.2284
14:00 41.75 941.61
14:30 0.5632 2.3606 6.7447 9.6686
15:00 42.1 803.22
15:30 0.5632 2.4384 6.967 9.9687
16:00 41.75 615.52
16:30 2.2529 2.5877 7.3933 12.234
17:00 40.94 390.51
17:30 2.2529 2.4751 7.0716 11.8
18:00 39.66 142.91
18:30 2.2529 2.2818 6.5194 11.054
19:00 38.16 0
19:30 2.2529 2.1676 6.193 10.614
20:00 36.65 0
20:30 2.2529 2.1294 6.084 10.466
21:00 35.37 0
21:30 2.2529 2.099 5.9971 10.349
22:00 34.21 0
22:30 2.2529 2.0686 5.9104 10.232
23:00 33.28 0
23:30 2.2529 2.0368 5.8195 10.109 6795.4 1698.9 475.68 ##### 32.59 0
June 0:30 1.4419 2.0536 5.8674 9.3628 June 1:00 33.16 0
1:30 1.4419 2.0101 5.7431 9.1951
2:00 32.6 0
2:30 1.4419 1.9659 5.6168 9.0246
3:00 32.15 0
3:30 1.4419 1.9207 5.4877 8.8503
4:00 31.81 0
4:30 1.4419 1.8759 5.3599 8.6777
5:00 31.7 0
5:30 1.4419 1.847 5.2771 8.5659
6:00 31.92 40.999
6:30 0.5632 1.8466 5.2759 7.6857
7:00 32.48 276.48
7:30 0.5632 2.0893 5.9694 8.6219
8:00 33.49 506.43
8:30 0.5632 2.2558 6.445 9.264
9:00 34.95 708.04
9:30 0.5632 2.3452 6.7007 9.6092
10:00 36.63 868.59
10:30 0.5632 2.3462 6.7034 9.6128
11:00 38.53 977.7
11:30 0.5632 2.3004 6.5725 9.4362
12:00 40.32 1028.2
12:30 0.5632 2.2904 6.5439 9.3974
13:00 41.67 1016.7
13:30 0.5632 2.3569 6.7339 9.654
14:00 42.56 943.93
14:30 0.5632 2.4684 7.0526 10.084
15:00 42.9 814.8

170
15:30 0.5632 2.5569 7.3053 10.425
16:00 42.56 637.73
16:30 2.2529 2.7248 7.785 12.763
17:00 41.78 424.07
17:30 2.2529 2.6393 7.5408 12.433
18:00 40.55 187.46
18:30 2.2529 2.4322 6.9491 11.634
19:00 39.09 0.023
19:30 2.2529 2.2986 6.5675 11.119
20:00 37.64 0
20:30 2.2529 2.2581 6.4517 10.963
21:00 36.4 0
21:30 2.2529 2.2266 6.3618 10.841
22:00 35.28 0
22:30 2.2529 2.1957 6.2734 10.722
23:00 34.39 0
23:30 2.2529 2.1635 6.1814 10.598 7156.2 1789 500.93 ##### 33.72 0
July 0:30 1.4419 2.2711 6.4888 10.202 July 1:00 35.59 0
1:30 1.4419 2.2291 6.3689 10.04
2:00 35.09 0
2:30 1.4419 2.187 6.2485 9.8773
3:00 34.7 0
3:30 1.4419 2.1442 6.1262 9.7123
4:00 34.4 0
4:30 1.4419 2.102 6.0058 9.5497
5:00 34.3 0
5:30 1.4419 2.067 5.9058 9.4147
6:00 34.5 14.239
6:30 0.5632 2.0395 5.8272 8.43
7:00 34.99 242.99
7:30 0.5632 2.2745 6.4986 9.3363
8:00 35.88 478.17
8:30 0.5632 2.4602 7.0292 10.053
9:00 37.17 685.8
9:30 0.5632 2.5664 7.3326 10.462
10:00 38.66 852.83
10:30 0.5632 2.5793 7.3693 10.512
11:00 40.34 968.49
11:30 0.5632 2.5366 7.2474 10.347
12:00 41.92 1025.2
12:30 0.5632 2.519 7.1972 10.28
13:00 43.11 1019.2
13:30 0.5632 2.5776 7.3645 10.505
14:00 43.9 950.86
14:30 0.5632 2.6859 7.674 10.923
15:00 44.2 824.73
15:30 0.5632 2.7741 7.9259 11.263
16:00 43.9 649.07
16:30 2.2529 2.9411 8.4032 13.597
17:00 43.21 435.14
17:30 2.2529 2.8553 8.158 13.266
18:00 42.12 196.49
18:30 2.2529 2.6496 7.5704 12.473
19:00 40.83 0.137
19:30 2.2529 2.5146 7.1847 11.952
20:00 39.55 0
20:30 2.2529 2.4738 7.0679 11.795
21:00 38.46 0
21:30 2.2529 2.4423 6.9779 11.673
22:00 37.47 0
22:30 2.2529 2.4116 6.8904 11.555
23:00 36.68 0
23:30 2.2529 2.38 6.8001 11.433 7759.5 1939.9 543.17 ##### 36.08 0
August 0:30 1.4419 2.2578 6.4508 10.151 August 1:00 35.57 0
1:30 1.4419 2.2165 6.3328 9.9912
2:00 35.08 0
2:30 1.4419 2.1751 6.2145 9.8314
3:00 34.69 0
3:30 1.4419 2.1331 6.0944 9.6694
4:00 34.4 0
4:30 1.4419 2.0917 5.9762 9.5097
5:00 34.3 0
5:30 1.4419 2.053 5.8656 9.3605
6:00 34.5 0.001
6:30 0.5632 1.9962 5.7034 8.2629
7:00 34.99 198.13

171
7:30 0.5632 2.2128 6.3222 9.0982
8:00 35.87 446.31
8:30 0.5632 2.4285 6.9384 9.9301
9:00 37.14 664.99
9:30 0.5632 2.5527 7.2934 10.409
10:00 38.61 840.34
10:30 0.5632 2.5772 7.3635 10.504
11:00 40.28 961.12
11:30 0.5632 2.5427 7.2649 10.371
12:00 41.85 1019.4
12:30 0.5632 2.5302 7.2292 10.323
13:00 43.02 1011.4
13:30 0.5632 2.5945 7.4129 10.571
14:00 43.81 937.51
14:30 0.5632 2.7029 7.7226 10.989
15:00 44.1 802.72
15:30 0.5632 2.7787 7.9391 11.281
16:00 43.81 615.81
16:30 2.2529 2.9246 8.356 13.534
17:00 43.12 388.66
17:30 2.2529 2.7989 7.997 13.049
18:00 42.04 136.28
18:30 2.2529 2.6078 7.451 12.312
19:00 40.77 0
19:30 2.2529 2.4969 7.1339 11.884
20:00 39.49 0
20:30 2.2529 2.4582 7.0234 11.734
21:00 38.42 0
21:30 2.2529 2.4275 6.9356 11.616
22:00 37.44 0
22:30 2.2529 2.3973 6.8494 11.5
23:00 36.65 0
23:30 2.2529 2.3662 6.7604 11.38 7717.7 1929.4 540.24 ##### 36.06 0
September 0:30 1.4419 1.8852 5.3863 8.7133 September 1:00 32.15 0
1:30 1.4419 1.8445 5.2699 8.5562
2:00 31.63 0
2:30 1.4419 1.8034 5.1526 8.3979
3:00 31.22 0
3:30 1.4419 1.7616 5.0332 8.2367
4:00 30.9 0
4:30 1.4419 1.7203 4.9152 8.0774
5:00 30.8 0
5:30 1.4419 1.6817 4.8048 7.9283
6:00 31.01 0
6:30 0.5632 1.6144 4.6126 6.7903
7:00 31.53 160.46
7:30 0.5632 1.8279 5.2226 7.6138
8:00 32.46 418.73
8:30 0.5632 2.0574 5.8783 8.4989
9:00 33.82 643.17
9:30 0.5632 2.1844 6.2412 8.9888
10:00 35.38 819.62
10:30 0.5632 2.2139 6.3255 9.1026
11:00 37.14 936.82
11:30 0.5632 2.1982 6.2806 9.0421
12:00 38.81 987.1
12:30 0.5632 2.2134 6.324 9.1006
13:00 40.06 967.14
13:30 0.5632 2.2951 6.5575 9.4158
14:00 40.89 878.24
14:30 0.5632 2.4079 6.8798 9.851
15:00 41.2 726.28
15:30 0.5632 2.4604 7.0298 10.053
16:00 40.89 521.07
16:30 2.2529 2.5456 7.273 12.072
17:00 40.16 275.44
17:30 2.2529 2.3342 6.6692 11.256
18:00 39.02 18.8
18:30 2.2529 2.168 6.1943 10.615
19:00 37.66 0
19:30 2.2529 2.1137 6.0392 10.406
20:00 36.31 0
20:30 2.2529 2.081 5.9456 10.28
21:00 35.17 0
21:30 2.2529 2.0523 5.8637 10.169
22:00 34.13 0
22:30 2.2529 2.0232 5.7804 10.057
23:00 33.3 0

172
23:30 2.2529 1.9928 5.6938 9.9395 6694.8 1673.7 468.64 ##### 32.67 0
October 0:30 1.4419 1.5289 4.3682 7.3389 October 1:00 29.07 0
1:30 1.4419 1.4894 4.2555 7.1867
2:00 28.54 0
2:30 1.4419 1.4497 4.1419 7.0334
3:00 28.12 0
3:30 1.4419 1.4091 4.0261 6.8771
4:00 27.81 0
4:30 1.4419 1.369 3.9115 6.7224
5:00 27.7 0
5:30 1.4419 1.3315 3.8043 6.5776
6:00 27.91 0
6:30 0.5632 1.2521 3.5774 5.3927
7:00 28.44 105.47
7:30 0.5632 1.4293 4.0836 6.0761
8:00 29.38 362.67
8:30 0.5632 1.6698 4.7709 7.004
9:00 30.75 583.67
9:30 0.5632 1.798 5.1371 7.4983
10:00 32.32 753.88
10:30 0.5632 1.8477 5.2792 7.6902
11:00 34.1 862.53
11:30 0.5632 1.8597 5.3133 7.7362
12:00 35.78 902.55
12:30 0.5632 1.9021 5.4345 7.8998
13:00 37.05 871.3
13:30 0.5632 2 5.7143 8.2775
14:00 37.89 770.85
14:30 0.5632 2.1052 6.0149 8.6834
15:00 38.2 607.74
15:30 0.5632 2.1301 6.0859 8.7792
16:00 37.89 392.36
16:30 2.2529 2.1566 6.1617 10.571
17:00 37.15 138.3
17:30 2.2529 1.915 5.4715 9.6395
18:00 35.99 0
18:30 2.2529 1.7941 5.1261 9.1731
19:00 34.63 0
19:30 2.2529 1.752 5.0056 9.0105
20:00 33.26 0
20:30 2.2529 1.721 4.9171 8.891
21:00 32.11 0
21:30 2.2529 1.693 4.8373 8.7832
22:00 31.06 0
22:30 2.2529 1.6647 4.7562 8.6738
23:00 30.22 0
23:30 2.2529 1.6353 4.6724 8.5606 5702.3 1425.6 399.16 ##### 29.59 0
November 0:30 1.4419 1.0438 2.9823 5.468 November 1:00 25.01 0
1:30 1.4419 1.007 2.8772 5.3261
2:00 24.51 0
2:30 1.4419 0.9701 2.7716 5.1835
3:00 24.1 0
3:30 1.4419 0.9323 2.6637 5.0378
4:00 23.8 0
4:30 1.4419 0.8949 2.5567 4.8935
5:00 23.7 0
5:30 1.4419 0.8598 2.4566 4.7583
6:00 23.9 0
6:30 0.5632 0.7572 2.1634 3.4838
7:00 24.41 24.022
7:30 0.5632 0.855 2.4428 3.8609
8:00 25.32 268.01
8:30 0.5632 1.1149 3.1855 4.8637
9:00 26.63 485.03
9:30 0.5632 1.2659 3.6167 5.4458
10:00 28.14 652
10:30 0.5632 1.3359 3.8169 5.716
11:00 29.86 758.62
11:30 0.5632 1.3674 3.9069 5.8376
12:00 31.48 798.06
12:30 0.5632 1.4246 4.0702 6.058
13:00 32.69 767.73
13:30 0.5632 1.5239 4.3541 6.4412
14:00 33.5 669.63
14:30 0.5632 1.6234 4.6383 6.825
15:00 33.8 510.06

173
15:30 0.5632 1.6269 4.6482 6.8384
16:00 33.5 298.92
16:30 2.2529 1.5958 4.5594 8.408
17:00 32.79 52.966
17:30 2.2529 1.3725 3.9213 7.5467
18:00 31.68 0
18:30 2.2529 1.2908 3.688 7.2317
19:00 30.37 0
19:30 2.2529 1.2542 3.5836 7.0907
20:00 29.05 0
20:30 2.2529 1.2262 3.5035 6.9826
21:00 27.94 0
21:30 2.2529 1.2006 3.4304 6.8839
22:00 26.93 0
22:30 2.2529 1.1746 3.356 6.7835
23:00 26.12 0
23:30 2.2529 1.1477 3.2792 6.6798 4309.3 1077.3 301.65 ##### 25.52 0
December 0:30 1.4419 0.6814 1.9468 4.0701 December 1:00 22 0
1:30 1.4419 0.6459 1.8453 3.933
2:00 21.54 0
2:30 1.4419 0.6105 1.7444 3.7968
3:00 21.17 0
3:30 1.4419 0.5747 1.642 3.6586
4:00 20.89 0
4:30 1.4419 0.5393 1.5409 3.5221
5:00 20.8 0
5:30 1.4419 0.5063 1.4464 3.3945
6:00 20.98 0
6:30 0.5632 0.3954 1.1296 2.0882
7:00 21.44 0
7:30 0.5632 0.426 1.217 2.2062
8:00 22.27 178.86
8:30 0.5632 0.6664 1.904 3.1337
9:00 23.47 400.09
9:30 0.5632 0.8624 2.464 3.8896
10:00 24.85 574.22
10:30 0.5632 0.9636 2.7533 4.2802
11:00 26.41 690.54
11:30 0.5632 1.0054 2.8725 4.4411
12:00 27.88 741.66
12:30 0.5632 1.0631 3.0376 4.6639
13:00 28.99 724.28
13:30 0.5632 1.1557 3.3021 5.0211
14:00 29.72 639.53
14:30 0.5632 1.2621 3.6061 5.4314
15:00 30 492.85
15:30 0.5632 1.2778 3.651 5.492
16:00 29.72 293.36
16:30 2.2529 1.2578 3.5938 7.1046
17:00 29.08 56.767
17:30 2.2529 1.0233 2.9238 6.2
18:00 28.07 0
18:30 2.2529 0.931 2.6601 5.844
19:00 26.87 0
19:30 2.2529 0.8923 2.5493 5.6945
20:00 25.68 0
20:30 2.2529 0.8631 2.4661 5.5822
21:00 24.66 0
21:30 2.2529 0.8371 2.3916 5.4816
22:00 23.74 0
22:30 2.2529 0.811 2.3173 5.3812
23:00 23.01 0
23:30 2.2529 0.7845 2.2415 5.2789 3287.7 821.92 230.14 ##### 22.46 0
total consumption 11630.4 14327 40936 66894 66894 16723 4682.5

174
Internal Temperature without AC
Date
Time 2000-2010 no AC.clg
outside tempreture
Date
Time 2000-2010 no AC.clg
outside tempreture
January 0:30 24.54 20.24 July 0:30 39.21 35.59
1:30 24.5 19.8 1:30 39.2 35.09
2:30 24.49 19.45 2:30 39.2 34.7
3:30 24.47 19.19 3:30 39.2 34.4
4:30 24.45 19.1 4:30 39.19 34.3
5:30 24.42 19.28 5:30 39.18 34.5
6:30 24.3 19.72 6:30 39.08 34.99
7:30 24.23 20.51 7:30 39.05 35.88
8:30 24.21 21.65 8:30 39.07 37.17
9:30 24.22 22.97 9:30 39.11 38.66
10:30 24.24 24.47 10:30 39.17 40.34
11:30 24.27 25.88 11:30 39.23 41.92
12:30 24.31 26.93 12:30 39.3 43.11
13:30 24.33 27.64 13:30 39.36 43.9
14:30 24.35 27.9 14:30 39.41 44.2
15:30 24.36 27.64 15:30 39.44 43.9
16:30 24.54 27.02 16:30 39.65 43.21
17:30 24.63 26.05 17:30 39.76 42.12
18:30 24.67 24.91 18:30 39.79 40.83
19:30 24.7 23.76 19:30 39.83 39.55
20:30 24.74 22.8 20:30 39.88 38.46
21:30 24.77 21.92 21:30 39.92 37.47
22:30 24.8 21.21 22:30 39.96 36.68
23:30 24.82 20.68 23:30 40 36.08
February 0:30 27.06 23.02 August 0:30 39.16 35.57
1:30 27.03 22.59 1:30 39.14 35.08
2:30 27.02 22.24 2:30 39.14 34.69
3:30 27.01 21.99 3:30 39.14 34.4
4:30 26.99 21.9 4:30 39.13 34.3
5:30 26.96 22.07 5:30 39.12 34.5
6:30 26.85 22.5 6:30 39.02 34.99
7:30 26.78 23.28 7:30 38.99 35.87
8:30 26.77 24.39 8:30 39.01 37.14
9:30 26.79 25.68 9:30 39.06 38.61
10:30 26.82 27.15 10:30 39.11 40.28

175
11:30 26.86 28.52 11:30 39.18 41.85
12:30 26.9 29.55 12:30 39.24 43.02
13:30 26.93 30.24 13:30 39.3 43.81
14:30 26.96 30.5 14:30 39.35 44.1
15:30 26.97 30.24 15:30 39.38 43.81
16:30 27.16 29.64 16:30 39.59 43.12
17:30 27.24 28.69 17:30 39.69 42.04
18:30 27.27 27.58 18:30 39.73 40.77
19:30 27.31 26.46 19:30 39.77 39.49
20:30 27.35 25.51 20:30 39.81 38.42
21:30 27.38 24.65 21:30 39.86 37.44
22:30 27.41 23.96 22:30 39.9 36.65
23:30 27.43 23.45 23:30 39.94 36.06
March 0:30 31.08 27.27 September 0:30 36.09 32.15
1:30 31.05 26.82 1:30 36.07 31.63
2:30 31.04 26.46 2:30 36.07 31.22
3:30 31.03 26.19 3:30 36.06 30.9
4:30 31.02 26.1 4:30 36.05 30.8
5:30 31 26.28 5:30 36.03 31.01
6:30 30.89 26.73 6:30 35.92 31.53
7:30 30.83 27.54 7:30 35.89 32.46
8:30 30.84 28.71 8:30 35.9 33.82
9:30 30.86 30.06 9:30 35.94 35.38
10:30 30.9 31.59 10:30 35.99 37.14
11:30 30.95 33.03 11:30 36.05 38.81
12:30 31 34.11 12:30 36.11 40.06
13:30 31.05 34.83 13:30 36.16 40.89
14:30 31.08 35.1 14:30 36.2 41.2
15:30 31.1 34.83 15:30 36.23 40.89
16:30 31.29 34.2 16:30 36.43 40.16
17:30 31.38 33.21 17:30 36.52 39.02
18:30 31.41 32.04 18:30 36.56 37.66
19:30 31.45 30.87 19:30 36.61 36.31
20:30 31.49 29.88 20:30 36.65 35.17
21:30 31.52 28.98 21:30 36.7 34.13
22:30 31.56 28.26 22:30 36.74 33.3
23:30 31.59 27.72 23:30 36.77 32.67
April 0:30 33.99 29.88 October 0:30 33.18 29.07
1:30 33.97 29.35 1:30 33.15 28.54
2:30 33.96 28.92 2:30 33.15 28.12

176
3:30 33.95 28.61 3:30 33.14 27.81
4:30 33.93 28.5 4:30 33.12 27.7
5:30 33.91 28.71 5:30 33.1 27.91
6:30 33.8 29.24 6:30 32.99 28.44
7:30 33.76 30.2 7:30 32.94 29.38
8:30 33.77 31.57 8:30 32.95 30.75
9:30 33.8 33.16 9:30 32.98 32.32
10:30 33.85 34.97 10:30 33.02 34.1
11:30 33.9 36.66 11:30 33.07 35.78
12:30 33.96 37.93 12:30 33.12 37.05
13:30 34.01 38.78 13:30 33.16 37.89
14:30 34.05 39.1 14:30 33.2 38.2
15:30 34.08 38.78 15:30 33.22 37.89
16:30 34.28 38.04 16:30 33.41 37.15
17:30 34.38 36.87 17:30 33.5 35.99
18:30 34.41 35.5 18:30 33.55 34.63
19:30 34.45 34.12 19:30 33.6 33.26
20:30 34.49 32.95 20:30 33.64 32.11
21:30 34.53 31.89 21:30 33.69 31.06
22:30 34.57 31.04 22:30 33.72 30.22
23:30 34.6 30.41 23:30 33.75 29.59
May 0:30 36.29 32.01 November 0:30 29.25 25.01
1:30 36.27 31.43 1:30 29.23 24.51
2:30 36.27 30.96 2:30 29.22 24.1
3:30 36.26 30.62 3:30 29.2 23.8
4:30 36.24 30.5 4:30 29.18 23.7
5:30 36.22 30.73 5:30 29.16 23.9
6:30 36.11 31.31 6:30 29.04 24.41
7:30 36.08 32.36 7:30 28.98 25.32
8:30 36.09 33.86 8:30 28.98 26.63
9:30 36.13 35.6 9:30 29 28.14
10:30 36.18 37.58 10:30 29.03 29.86
11:30 36.24 39.43 11:30 29.07 31.48
12:30 36.3 40.82 12:30 29.11 32.69
13:30 36.36 41.75 13:30 29.15 33.5
14:30 36.4 42.1 14:30 29.17 33.8
15:30 36.44 41.75 15:30 29.18 33.5
16:30 36.64 40.94 16:30 29.37 32.79
17:30 36.74 39.66 17:30 29.46 31.68
18:30 36.78 38.16 18:30 29.51 30.37

177
19:30 36.82 36.65 19:30 29.56 29.05
20:30 36.87 35.37 20:30 29.6 27.94
21:30 36.91 34.21 21:30 29.64 26.93
22:30 36.95 33.28 22:30 29.67 26.12
23:30 36.98 32.59 23:30 29.7 25.52
June 0:30 37.33 33.16 December 0:30 26.25 22
1:30 37.31 32.6 1:30 26.22 21.54
2:30 37.31 32.15 2:30 26.21 21.17
3:30 37.3 31.81 3:30 26.19 20.89
4:30 37.28 31.7 4:30 26.17 20.8
5:30 37.27 31.92 5:30 26.15 20.98
6:30 37.16 32.48 6:30 26.03 21.44
7:30 37.13 33.49 7:30 25.96 22.27
8:30 37.15 34.95 8:30 25.95 23.47
9:30 37.18 36.63 9:30 25.96 24.85
10:30 37.23 38.53 10:30 25.98 26.41
11:30 37.29 40.32 11:30 26.02 27.88
12:30 37.36 41.67 12:30 26.05 28.99
13:30 37.42 42.56 13:30 26.08 29.72
14:30 37.47 42.9 14:30 26.1 30
15:30 37.5 42.56 15:30 26.11 29.72
16:30 37.71 41.78 16:30 26.29 29.08
17:30 37.82 40.55 17:30 26.38 28.07
18:30 37.85 39.09 18:30 26.43 26.87
19:30 37.89 37.64 19:30 26.47 25.68
20:30 37.93 36.4 20:30 26.5 24.66
21:30 37.98 35.28 21:30 26.54 23.74
22:30 38.02 34.39 22:30 26.57 23.01
23:30 38.05 33.72 23:30 26.59 22.46
31.784236 30.655972 1.1282639

178
Ex
tern
al
co
nd
uc
ti
on
Ga
in
KW
/Y
Inte
rna
l
co
nd
uc
ti
on
Ga
in
kW
/Y
Inte
rna
l
ga
in
kW
/Y
so
lar
ga
in
thro
ug
h
gla
ss
kW
/Y
tota
l
ga
ins
kW
/Y
To
tal
lig
hts
en
erg
y
kW
/Y
Ap
Sy
s
he
at
rej
fan
s/p
um
ps
en
erg
y
kW
/Y
Ap
Sy
s
ch
ille
rs
en
erg
y
kW
/Y
To
tal
en
erg
y
kW
/Y
AC
TU
AL
EN
ER
GE
Y C
OA
ST
AE
D/Y
EA
R
SU
PP
OR
TE
D
EN
ER
GY
CO
AS
T
AE
D/Y
EA
R
ins
ide
av
ara
ge
E
Air
tem
pe
rat
ure
(°C
)
ou
tsid
e
av
ara
ge
Dry
-bu
lb
tem
pe
rat
ure
(°C
)
dif
fre
nc
e
s in
tem
pre
tu
re
(ou
tsid
e/i
ns
ide
)T
rad
itio
na
l
Ho
use
Be
fore
19
70
's
with te
ng
uste
n
ligth
s
S-T
Ta
ble
13
92
24
.73
-31
7.1
75
17
03
.49
07
67
37
.27
41
53
4.2
15
20
0.5
27
14
85
8.6
16
15
93
.28
15
39
8.3
24
31
1.5
32
4.9
78
09
31
.80
98
6-6
.83
17
7
with a
rca
de
S-S
1T
ab
le 2
14
47
65
.4-6
5.4
06
42
78
1.6
13
02
07
.78
21
76
89
.43
57
72
.84
30
06
7.7
48
59
07
.87
15
17
48
.33
79
37
.06
10
62
2.3
83
6.3
18
68
31
.80
98
64
.50
88
19
witho
ut a
rca
de
S-S
1T
ab
le3
15
12
48
.5-6
5.4
69
42
78
1.6
16
92
74
.82
63
23
9.4
35
77
2.8
43
41
23
.57
97
49
5.9
11
67
39
2.2
41
84
8.0
41
17
17
.45
With b
rick a
nd
pitch r
oo
fS
-N1
Ta
ble
48
21
25
.71
0.7
54
27
80
.74
34
58
2.7
11
59
48
9.9
35
77
2.8
42
19
56
.53
62
73
3.0
31
20
46
2.3
30
11
5.5
78
43
2.3
58
34
.17
85
13
1.8
09
86
2.3
68
64
6
witho
ut b
rick a
nd
pitch r
oo
f S
-N2
Ta
ble
51
00
06
8.3
0.7
59
42
78
0.7
44
83
15
.81
19
11
65
.63
57
72
.84
24
78
0.6
87
08
02
13
13
55
.43
28
38
.84
91
94
.87
5
re-t
rad
itio
na
lism
S
-T1
Ta
ble
66
39
62
.26
0.1
59
16
63
6.3
92
85
07
.12
10
91
05
.91
16
30
.38
14
32
7.4
84
09
35
.65
66
89
3.5
21
67
23
.38
46
82
.54
63
2.8
73
72
31
.80
98
61
.06
38
54
po
st-
mo
de
rnis
mS
-T2
Ta
ble
77
49
55
.01
0.1
92
14
99
5.1
54
41
74
.72
13
41
25
.19
83
3.6
16
17
38
6.6
14
96
76
.01
76
89
6.3
91
92
24
.15
38
2.7
48
33
.12
69
13
1.8
09
86
1.3
17
04
9
re-t
rad
itio
na
lism
S-F
1T
ab
le 8
28
56
6.0
5-3
1.7
64
96
60
.38
42
85
02
.92
66
69
7.5
91
16
30
.38
86
45
.69
72
47
02
.02
44
97
8.1
21
12
44
.53
31
48
.46
92
7.5
64
38
31
.80
98
6-4
.24
54
9
po
st-
mo
de
rnis
mS
-F2
Ta
ble
96
92
60
.61
0.1
59
11
25
2.7
43
91
27
.31
19
64
0.8
60
02
.20
81
55
08
.98
44
31
1.3
76
58
22
.78
16
45
5.7
46
07
.59
53
2.1
55
63
31
.80
98
60
.34
57
64
He
at
Ga
in
19
70
's-1
99
0's
Futu
re H
ouse
Afte
r 2
01
4
Inte
rna
l te
mp
retu
re (
if n
o A
C)
En
erg
y C
on
su
mti
on
19
90
's-2
00
0
20
00
-20
10
ma
teri
al
tab
leS
imu
lati
on
co
de
Build
ing
Fe
atu
res
Pe
rio
d