the system of lime, silica, and water at 180° c
TRANSCRIPT
Journol of Research of the National Bureau of Standards Vol. 54, No.4, April 1955 Research Paper 2582
The System of Lime, Silica, and Water at 1800 C Richard B. Peppler
Solid-liqu id equilibria in t he system CaO-Si02-H20 were investigated at 1800 C. On Iv fo~r cOmpOUll?S were ~ound to be stable in equilibrium with the liquid: Xonotl ite (5CaO· 5S102·H20 , .inllcbraudIte (2CaO·Sl02·H 20 ) , a-quartz , and Ca (OHh. The me tastable equilibrium curves of gyroli te (2CaO·3SiOz·2HzO) and a particular silica gel were determin ed. The r esults also su ?ges ted. several other r~letastable compounds. Supplementary experimen ts of SIX mon t hs duration wIth oXIde mIxtures co nfirmed the stability at 1800 C of only t wo ternary compounds, xonotli te a nd hillebrandite.
1. Introduction The system CaO-Si02-H20 has been the subj ect of
many investigations. Under hydrothermal conditions, this ystem yields a number of crystalline compounds [1]. However, only tentative and qualitative compatibility diagrams have been published to date. Most investiaators have concerned themselves primarily with tile identities of the product obtained. The goal of the pre ent investigation has been not only to identify the products formed, but also to determine the quantitative equilibrium relationship as accurately a possible.
The importance of studies of this system to an understanding of the setting of portland cement, the pozzolanic reaction, and the formation of sand-lime bricks is apparent. The 180° C isotherm of this ystem was chosen for investigation because of its
direct applicability to steam-cured portland-cement products.
2 . Apparatus and Procedure
Stainless-steel autoclaves of ~- to I-liter capacity were used. These h ave becn described in detail elsewhere [2]. Briefly, each consisted of two similar vessels separated by a filter disk. In each experiment, one vessel was filled with solid and liquid phases in the proportion of 2 g of solid per liter of liquid , and the autoclave was assembled. It was heated in an electric oven maintained at 180° ± 2° C for the desired period of time. 'When the autoclave was removed, filtration was accomplished by inverting it in cold water and condensing the vapors in the "emp ty" vessel.
The solid reaction products were washed with alcohol and ether , and dried at 45° C. Afterward they were examined petrographically and X-ray powder patterns were obtained. In some cases, differential thermal-analysis (DTA) curves and absorp tion lests with meth.Ylene blue were made.
The fil Lra Le was anal I-zed for lime and silica . The lime was determined gravimetrically by precipitation as the oxalate and igni tion to the oxide. Silica wa determined gravimetrically excep t where its concentration was less than 0.01 g/liter. In such ca es, it was determined colorimetrically as the silicomolybdate, using a standard sodium chromate solution as a color reference.
205
The solutions of CaO were prepared by ignitinO' reagent quali ty CaC03 overnight at 950° 0 and dis~ solving the re ul ting CaO in ordinary distilled water. . ~ commercial silica gel wa used as a source of
SIlica. It was found to contain 0.05 percent of .Na20 and 0.01 percent of K20 and to have an HF residue of 0.35 percent and an ignition loss at 1 100° C of 6.50 percent. An air alutriation stack ,,:as used to frac~ionate some of the gel into two part , one of partIcle SIze above 10 }J- and the other below 10 JJ. . It was found that the reactivities of the two fractions were not significan~ly different at 180 0 C; consequently, the unfractwnated gel was used throughout this investigation.
In some case~, .C!Tstal)ine calci um h:rcll'Osilicate were u.sed as the Imtlal solId pha es. The compounds for thIS purpose. were .synthes~zed by hydrothermal treatment of o.xlde mLXture~ m a Morey bomb as follows: <!yroh te (2CaO·3SIOz· 2H20 ) from a 2: 3 molar ratIO of CaO to Si02 at 350° C, 6 days, 163-atm pressure; xonotlI te (5QaO·5Si02·H 20 ) from a 1: 1 molar ratIO of CaO to Sl02 at 380° C 17 days ~35-atm pressure; anc~ hillebrandi te (2CaO.Si02.H;0 ) Jrom a 2: 1 molar ratIO of CaO to Si02 at 242 ° C, 7 days,.,- 34-atJ? pre.ssure. P etrogra12hIC examination and X-ray dIffraction J?at ~el'lls IdenLrfied the products as t~l~ compounds mdICated. The experimen tal conchtwns for these syn theses were sugo'ested by the work of Flint, McMurdie, and Wells [2].
M etastable solutions were prepared by heatinO' silica gel wi th a solution of Ca(OH)2 at 90° C for 3 weeks, filtering , and mixing the clear fil trate with Ca(OH)2 solutions.
Contamination of Lhe liquid phases by attack on the autoclaves occurred in most experimen ts. The soluble iron introduced into solution was however less than 1 ppm. Chromium was a wors~ offender: As much as 30 ppm as calcium chromate would sometimes b.e found in the liquid phase. In such cases, ch.romll~m ,,,:as remove~l as the hydroxide prior to the detern:matIOn of calcmm oxide, and its color after converSIOn to chromate, was matched wi th the standard chromate color reference prior to the determination of silica colorimetrically.
The effect of carbon dioxide, as judo'ed bv the observed quantity of calcite in the solid phases was negligible. '
3 . Phase Equilibria a t 1800 C
3 .1. Approach From Undersaturation
gui ty in published patterns of them made identification difficult. In general, th e patterns published by • Flint and McMurdie [3] and Taylor and Bessey [1 ] were used as references. However, to decide upon the identity of the principal phases in the reaction products, the patterns of the compounds synthesized at higher temperatures were arbitrarily taken as standard.
Data pertaining to this phase of the investigation are presented in table 1, (A). Silica gel was mixed with saturated solutions of lime water in such proportions as to give initial molar ratios of CaO to Si02 from 0.00 to 3.00 . These mixtures were heated at 1800 C from 4 to 15 days. The crystalline products were so fine-grained that only an average or a range of indi.ces of refraction could be obtained, as indicated in column 6. Because of the small differences among the published refractive indices ' of the calcium hydrosilicates, and the uncertainty that exists in several cases, th e data obtained did not
In no case was a single pure phase obtained , as judged by the X-ray patterns. One or two principal phases would be indicated, but there would always be a minority of ambiguous lines. The principal compounds are indicated in column 8 (table 1). the minor compounds are not indicated. In general , they were compounds having the CaO to Si02 ratio that was present in the initial mixture. Thus in experiments 2, 3, and 4 (CaOjSi02= 0.26 to 0.63), okenite (CaO·2Si02·2H20 ) was indicated ; in experiment 5 (CaOjSi02= 0.80), the compound 4CaO· 5Si02·5H20; in experiment 6 (CaOjSi02= 1.05),
uffice to identify the products . An X-ray powder pattern was obtained for each
solid reaction product. The strong family resemblance of the calcium hydro silicates and the ambi-
TABLE 1. Solubility Telationships in the system CaO-Si02-H20 at 1800 C
2 4 7 -·----1·-------------1---------1-------1-----------1------
Experiment
1. .......... .. 2 .............
3 . . ........... 4 • . •...•.•....
5_ •• _
6 ............. 7 ...••••••...•
8 .............
9 .•........... 10 .............
Initial molar ratio
CaO/SiO,
0. 00 . 26
. 26
. 63
. 80
1. 05 1.50
1. 73
2.00 3.00
2
'l'imc
D o.ys 6 4
12
13 15
II 14
Final CaO
g/liter 0. 00 . 05
. 03
. 02
. 02
. 02
. 09
. 07
. 05
. 17
4
Final SiO,
Refracti ve index of solid phascs
Relative amount solid dycd Identity of solid pbases Identity of prod·
uct after DT A
A. Silica gcl+Ca(OH), solutions ([ro m undersaturation)
g/liter 0. 75 . 53
. 32
. 20
.08
. 09
. 008
. OOS
. 007
. 002
1.45 . . ........ _... . ... ... .... .... . .... ... .... Silica geL .. . . ......... . ... ... ... a - CaO·SiO,+ Range 1.42 to 1.54 .•..... Large . . ........... Xonotlite+gyrolite+silica geL .. /1-CaO·8 iO,+
a-quartz. Range 1.46 to 1.54. . . ......... do ..•.. . ........... do .. _......... .. ............ Do .
m~I~115i1J~.~g~: :::::: .. :::d~ ... ~::: : :::: .... :::~~ ... ~::::::::::: : ::::::::::.. . .. ~~: ........ . Average 1.57._.......... SmalL ........ _... Gryolite+xonotlite ...... .. ...... a-CaO·SiO,+
/1- CaO·8i02 (no a-quartz).
R ange 1. 57 to 1.59 ....... Medium ........... Xonotlite. . . .................... Do. Average 1.61. _ .......... SmalL .......... ,. Hillebrandite ............. . .... . /1-20aO·SiO,+
/1-CaO.Si02. R ange 1.58 to 1.61. . ..... Very small or ..... do .. _ .. . ............. . ...... /1-20aO.Si02.
none. Average 1.60. _ .......... None .................. do ........... _. . ..... ....... Do. Average 1.60. _ ... . . . ... . .... . do .. _ .. .. ..... Hillebrandite+Ca(O H), ._ . ..... /1-20aO·8i O,+
OaO.
B. Metastable solutions ([rom supersaturation)
8 ---------1---------------------]---------------]-----------]-------------------------------
l L . .. . ..... . 12 .... ... .... . 13 ..... . ..... . H ........... . 15 . .......... . 16 ........... . 17 ........... . IS ........... . 19 ........... .
0.32 . 50 .67 • SO
1.00 1.50 1. 67 1. 97 2.S2
7 10
9 8 S 8 8
13 13
0. 02 . 03 . 08 . 06 . 02 . 02 . 02 . 09 . 06
0.13 . 003 . 002 .01 . 01 .01 . 01 . 001 . 002
Experiment I Initial phases
Average 1.54. _ .......... Large ............ . R ange 1.58 to 1.60 . •.... . .... do ........... .
{~ili::sgtk51o i59~:::::: :::::~~ :: =::::::::: Granules 1.59 to 1.60 ......... do . . _ ........ .
..... do . _ •. . . . ........... Medium . ........ . Average 1.60 ._ .......... None . ... . Average 1.55._ ............... do .. _ ........ . Average 1.59 to 1.60_ ......... do .. _ ....... . .
... .. do ..•.................... do .. _ ........ .
C . Oom poun ds as initial solid phases
Time Final OaO
CaO·Si O,·H20 +xonotli te+4CaO·58iO,·5H20. Xonotli te. Hillebrandite+?
Iiilleb~and;ic+? ···································
Do. Xonotlite+ hillebrandite.
Do. Hillebrandite. Hillebrandite+Oa(OH), .
Final SiO, Product
20 . ........... 1 Hillebrandite+ sat. Oa(O H), . . . . ..................................... . Days g/titer g/liter
21............ Hillebrandite+ xonotlite+ H 20 .. . ...... . . _ .................. _ ........ . 22............ Xonotlite+gyrolite+ H,O . _ ..... . ....... . .... ... ........ . ............ .
19 0. 15 0.002 HUlebrandite+Oa(OH ),. 7 . 08 . 005 Hillebrandite+xonotlitc .
10 . 03 . 02 X onotlite . 23............ Silica ge!+gyrolite+ H,O ........ . ..........•.. . ....................... 24 ........ _... Flint+xonotlite water ................ _ ... _ ... ... ...... . .............. . 25. . ....... .. . Flint+ H 20 _ •• _ ........................ . ............ .. ...... . ........ .
3 . 03 . 13 Gyrolite+silica gel. 8 . 02 .096 a-quartz+xonotlite . 8 .00 . 04 a-quartz.
206

crestmoreite (2CaO·2Si02·H 20 ) and "CSH In ; in experiment 7 (CaOjSi02 = 1.50), afwillite (3CaO· 2Si02·3H 20 ); 8 (CaO/Si02= 1.73), foshagite (5CaO. 3Si02·3H20 ); 9 (CaO/Si02= 2.00), "CSH II"; and 10 (CaO/Si02 = 3), 3CaO·Si02·3H20. The lines indicating these compounds were generally weak and constituted less than 10 percent of the number of lines in the pattern.
The solid reaction products were treated with a aturated alcoholic solution of methylene blue hydro
chloride for 24 hr. washed free of excess dye, and examined microscopically. The relative proportion of dyed particles, indicating unreacted silica gel, is given in column 7 of table 1. In general, the amount of unreacted silica decreased as the molar ratio of CaO to Si02 increased. This is to be expected. The low value in experiment 5 appears to be unusual. It confirms the X-ray and microscopic data, however. Experiment 5 was the fu'st experiment in which no silica gel was observed microscopically in the reaction product.
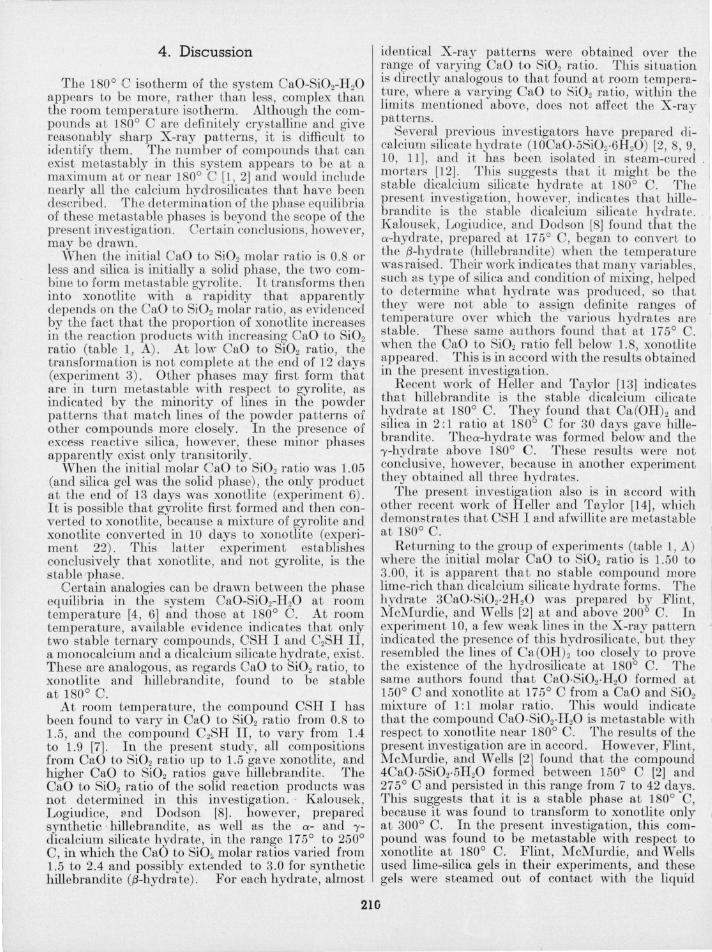
Differential thermal-analysis (DTA) curves were obtained of the solid reaction products in each case. These are presented in figure 1. The identities of the products after the DTA heat treatment were detel'mined by X-ray powder patterns, and are given in table 1, (A), column 9.
It is known that the ultimate decomposition products of gyrolite when heated to 1,0000 Care pseudowollastonite (a- CaO·Si02) and a-quartz, and that those of xonotlite are a mixture of pseudowollastonite and wolla tonite (.B - CaO·Si02) [4J. The uncombined silica gel in the reaction products evidently transforms to a-quartz.
As the molar CaO to Si02 ratio increased (experiments 1 to 5), the proportion of wollastonite in the products of DTA heat treatment increased. This indicates that the proportion of xonotlite in the original reaction product had increased. It also confirms the refractive index data (column 6), which indicate that the average index of refraction had increased from that of the unaltered silica gel (1.42) through that of gyrolite (1.54) to that of xonotlite (J.59). The microscopic examinations also showed that gyrolite predominated in experiments 2, 3, and 4, and xonotlite in experiments 5 and 6. .
The DTA curves, figure 1, show a family resemblance among the products of experiments 2 to 6 (CaO to Si02 molar ratios of 0.26 to 1.05). This agrees with the fact that these products are all mixtures of unaltered silica gel, gyrolite, and xonotlite, as indicated by the optical and X-ray data. The endothermic break from 1000 to 3000 C is evidently the dehydration of the unreacted silica gel. The characteristic exothermic break at 800 0
to 8500 C is evidently associated with the crystallization of wollastonite. The increased size of this break for experiment 3' over that of experiment 2 indicates that the reaction in the autoclave had proceeded further in 12 days than in 4, which agrees with the observation that there was less uncombined silica in the former case. The diminishing size of this break thereafter may possibly be related to the increasing proportion of wollastonite.
IL may be ob erved that the DTA curves of the products of experiments 7 to 10 also constitute a group, being similar to each other but differin& from the first group. The endothermic break for tn.e dehydration of silica gel is absent, correlating with the observation that the amount of silica gcl, as determined by dye absorption, was negligible in the corresponding reaction products. The characteristic endothermic break between 500 0 and 600 0 C is evidently associated with the dehydration of hille-
Co 0 1 5i Cl.! ' t, 4 DAYS
NO.2
CoO 1 5iOz' t , 12 DAYS
NO.3
Co O / Si02 " f NO.4
COO/SiOz' fI; NO.5
NO.6
NO.7 CoO 15i02 ' t
C o O / Si~ ' t NO,8
CoO I SiOz ' f NO.9
COO/5iOz' f NO.I O
o 100 200 300 4 00 500 600 700 800 900 1000 1100
Tempe ra ture ,oc
FIGURE 1. Differential thermal analysis curves of solid 1'eaction products obtained by an approach to equilibrium from undersaturation.
207
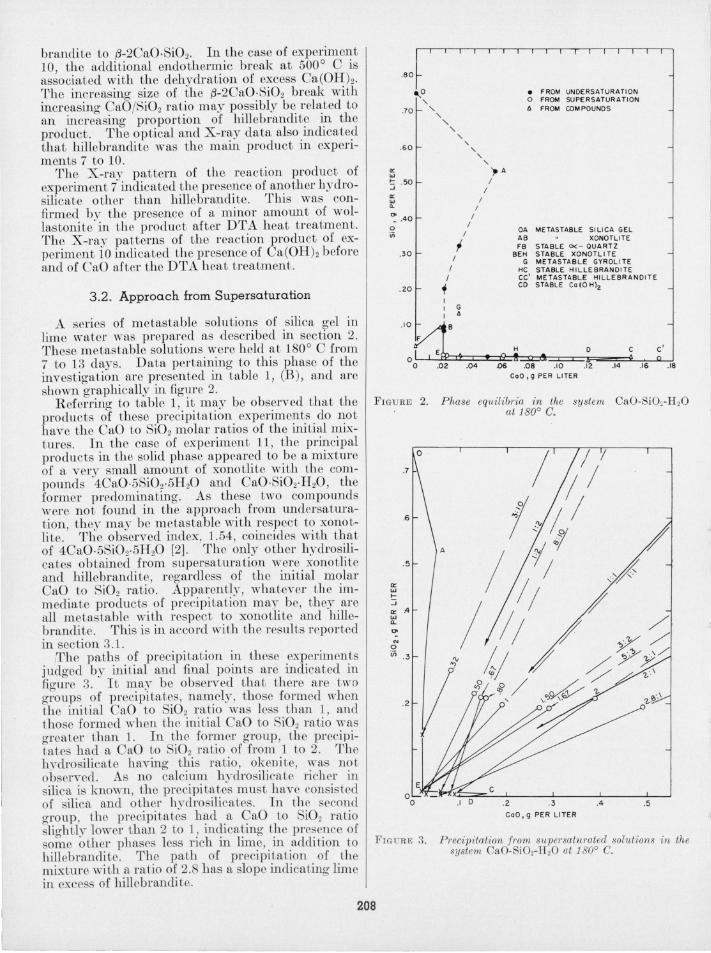
brandite to !3-2CaO·Si02• In the case of experiment 10, the additional endothermic break at 500 0 C is associated with the dehydration of excess Ca(OHh The increasing size of the {3-2CaO·Si02 break with increasing CaOjSi02 ratio may possibly be related to an increasing proportion of hillebranditc in the product. The optical and X-ray data also indicated that hillebrandite was the main product in experiments 7 to 10.
The X-ray pattern of the reaction product of experiment 7 indicated the presence of another hydrosilicate other than hillebrandite. This was confirmed by the presence of a minor amount of wollastonite in the product after DTA heat treatment. The X-ray patterns of the reaction product of experiment 10 indicated the presence of Ca(OH)2 before and of CaO after the DT A heat treatment.
3.2. Approach from Supersaturation
A series of metastable solutions of silica gel in lime water was prepared as described in section 2. These metastable solutions were held at 180 0 C from 7 to 13 days. Data pertaining to this phase of the investigation are presented in table 1, (B), and are shown graphically in figure 2.
Referring to table 1, it may be observed that the products of these precipitation experiments do not have the CaO to Si02 molar ratios of the initial mixtures. In the case of experiment 11 , the principal products in the solid phase appeared to be a mLxture of a very small amount of xonotlite with the compounds 4CaO·5Si0 2·5H20 and CaO·Si02·H20, the former predominating. As these two compounds were not found in the approach from undcrsaturation, they may be metastable with respect to xonotlite. The observed index, 1.54, coincides with that of 4CaO.5Si02·5H20 [2] . The only other hydrosilicates obtained from supersaturation were xonotli te and hillebrandite, regardless of the initial molar CaO to Si02 ratio. Apparently, whatever the immediate products of precipitation may be, they are all metastable with respect to xonotlite and hillebrandite. This is in accord with the results reported in section 3.1.
IThe paths of precipitation in these experiments judged by initial and final points are indicated in figure 3. It ma:y be observed that there are two groups of precipitates, namely, those formed when the initial CaO to SiOz ratio was less than 1, and those formed when the initial CaO to SiOz ratio was greater than 1. In the former group, the precipitates h ad a CaO to Si02 ratio of from 1 to 2. The hydro silicate having this ratio, okenite, was not observed. As no calcium hydrosilicate richer in silica is known, the precipitates must have consisted of silica and other hydro silicates. In the second group, the precipitates had a CaO to SiOz ratio slightly lower than 2 to 1, indicating the presence of orne other phases less rich in lime, in addition to
hillebrandite. The path of precipitation of the mixture with a ratio of 2.8 has a slope indicating lime in excess of hillobrandite.
.8+ .,.0 "
.70 ""
• fROM UNDERSATURATION o fROM SUPERSATURATION A FROM COM POUNDS
.60
II: UJ S .50
II: UJ Q.
~ .40 o ;;;
.30
.20
.10
F
"-" " ,
/ I
I I
I I
+ I G I A
B
" ,
I I
,
I
) A /
OA METASTA8LE SI LlCA GEL AB XONOTLITE FB STABLE 0<- QUARTZ
BEH STABLE XO NOTLITE G METASTAB L E GYROLITE
HC STA8LE HI L LE8RAND ITE CC' METASTABL E HILLEBRANDITE CO STABLE Co (0 HI2
HOC C'
o~~~~~~~~~~~==~~J o .02 .04 D6 .08 .10 .1 2 .14 .16 .18
FIGURE 2.
.6
.5
a: w ... ::; a: .4 w "-~
'" 0 iii .3
.2
FIGURE 3.
CoO ,9 PER LITER
Phase equilibria in the system CaO-SiO,-H20 at 1800 c.
A
CoO> 9 PER LITER
Precipitation from supersaturated solutions in the system CaO-Si02-HzO at 1800 C.
208

Figure 2 indicates that the da.ta obt~ined fr?m upersaturation, when plotted, gIve pomts fallmg
reasonably well on the solubility curves determined by an approach from undersaturation. The composition of .the liquid phase in experiments 15, .16, and 17 (pomt E) appeared to define the xo~othtehillebrandite invariant point, which the expenments in the preceding ection did not; but subsequent expcriments indicated this point to represent metastable equilibrium.
The results of dye-absorption tests on the solid reaction products, similar to those described in section 3. 1 are shown in column 7. A similar trend of decrease in the uncombined silica is indicated, but the transition to complete combination after 1 to 1 CaO to Si02 ratio is sharper.
The compositions of the liquid phases are indicated in columns 4 and 5 of table 1. The plot of these data in figure 2 indicates that a metastable gyrolitesilica-gel invariant point exists abo'.'~ a:nd to the rio-ht of A· that the metastable eqUlhbrmm curve fo~ gyrolit~ lies to the righ t of AB, which approximates the xonotlite equilibrium curve ; and that a stable hillebrandite-Ca(OH)2 invariant point exists at Cf. Point D is the solubility of Ca(OH)2 as CaO in water alone at 1800 C, as taken from a graph of Peppler and Wells [5]. Evidently ~ xonotlitehillebrandite invariant point must eXIst between points A and Cf on the curve AEC~
3.3. Experiments With Compounds
For this phase of the investigation, hillebrandite, xonotlite, and gyrolite and a-quartz were used . A washed flint was used as the a-quartz. It was found to have 0.004 percent of Fe20 a and an HF residue of less than 0.02 percent. The X-ray powder pattern showed only a-quartz .
The data are presented in table 1, (C) , and are shown graphically in fi!Sure 2. Exp~rimeJ?-t 20 est.ablished the hillebrandIte-Ca(OH)2 mvanant pomt, point C, figure 2 , at 0.15 gjIiter of CaO, whereas experimen t 10 (table 1, A) ga v!'l 0.17. The agre~ment is reasonable under the Clrcumstances and IS further confirmation that hillebrandite is a stable phase in this system at 1800 C.
Experiment 21 was an attempt to establish the hillebrandite-xonotliLe iJ:wariant point directly. The composition of the liquid phase, p'oi (; H , figUl'e 2, does not agree with the point E, esta.blished by precipitation from supersaturated solu lOns. ~0ll1~ H may be considered as the probable xonothte-hillebrandite invariant point, because it was defincd directly from the two compounds. Point E may be a metastable invariant point.
In experiment 22, a mixture of .xonotlite a:nd gyrolite after 10 days. gave only xon?th~e, confirmmg the previous concluslO~ that g~'l:ohte IS m~tastable with re pect to xonothte and silIca at 180 C. In experiment 23 , the gyrolite did n~t.have time to. CO~lvert to xonotlite . The composltlOn of the hqUld phase of this experiment is indicated in figure 2 as
point G. It seems probable that an. area to the right of AB represents metastable gyrohte.
E periment 24 was designed to establish the stable xonotlite-a-quartz invariant point.
The solubility of a-quartz alone (experiment 6) was found to be 0.04 gjIiter, and a traight line joining point F, r epresenting this composition with the point B, is tahn as the stable equilibrium curve of a-quartz.
3.4. Experiments With Oxide Mixtures
Certain experiments of 6 months' duration were undertaken in an attempt to determine beyond any reasonable doubt what compounds are stable in the system CaO-Si02-H20 at 180 0 C. A series of 10 mixtures of CaO and silica gel, whose molar CaO to Si02 ratio varied from 0.10 to 4.00, was placed in platinum thimbles, and the thimbles were placed in an autoclave with an excess of water in such a manner that the solid and liquid phases were not in contact. The autoclave was held at 1800 C for 6 months.
When the products were removed from the autoclave, they were dried for 1 hr at 110 0 C al~d examiJ?ed microscopically. The sizes of the crysta1lll1~ re~ctlOn products were so minute that only average mdlCes of refraction could be obtained. It was necessary to resort to X-ray powder patterns to establish their identities. The patterns so obtained were compared with the standard patterns mentioned earlier. The results are pre ented in table 2.
Table 2 shows that only two calcium hydro silicates were obtained, namely, xonotlite and hillebrandite. The unreacted silica gel, indicated as another product in experiments 1,2, and 3, was not physically distinct from xonotlite. The xonotlite, rather, was uniformly dispersed in the silica gel, so that the whole mass appeared to be homogeneous and to have a very light grey color between crossed nicols. The X-ray patterns corresponding to these preparations indicated that the gel had partially transformed to a-quartz.
In the case of experiments 9 and 10 (table 2), the Ca(OH)2 was physically distinct from the hydrosilicate and of relatively large particle size. Thus, the app~arance of the product obtained after 6 month of hydrothermal treatment was very close to that of the products obtained in a few days when the solid and liquid phases were in contact.
TABLE 2. Pastes heated at 1800 C f or 6 months
Experim ent
1. ................ . 2 ................. . 3 ................. . 4 ................. . 5 ................. . 6 ................. . 7 ................. . 8 ................. . 9 ................. . 10 ..... . .......... .
Ca O to SiO. ratio
M 0. 100 . 500 . 6(i7 • SOO
1.000 1.500 1. 667 2. 000 3.000 4.000
Identity by X·ray patterns
Xonotlite+silica gel. Do . D o .
Xonolitc . Do.
Hillebranclite+xonotlite. IIillebranclite.
Do. Hillebraudite+ Ca (OH}o.
Do.
332243-55-3 209
4 . Discussion
The 1800 C isotherm of the system CaO-Si02-H20 appears to be more, rather than less, complex than thc room temperature isoLherm. Although the compounds at 1800 C are definitely crystalline and give reasonably sharp X-ray patterns, it is difficult to identify them. The number of compounds that can exist metastably in this system appears to be at a ' maximum at or near 1800 C [1, 2] and would include nearly all the calcium hydrosilicates that have been described. The determination of the phase equilibria of these metastable phases is beyond the scope of the present investigation. Certain conclusions, however, may be drawn.
When the initial CaO to Si02 molar ratio is 0.8 or less and silica is initially a solid phase, the two combine to form metastable gyrolite. It transforms then into xonotlite with a rapidity that apparently depends on the CaO to Si0 2 molar ratio, as evidenced by the fact that the proportion of xonotlite increases in the reaction products with increasing CaO to Si02
ratio (table 1, A). At low CaO to Si02 ratio , the transf<?rmation is not complete at the end of 12 days (expenment 3). Othcr phases may first form that are in turn metastable with respect to gyrolite, as indicated by the minority of lines in the powder patterns t hat match lines of the powder pat terns of other compounds more closely. In the presence of excess reactive silica, however, these minor phases apparently exist only transitorily.
When the initial molar QaO to SiO? ratio was 1.05 (and silica gel was the solid phase), the only product at the end of 13 days was xonotlite (experiment 6). It is possible that gyrolite first formed and then converted to xonotli te, because a mixture of gyrolite and xonotlite conver ted in 10 days to xonotlite (experiment 22). This latter experiment establish es conclusively that xonotlite, and not gyrolite, is the stable phase.
Certain analogies can be drawn between the phase equilibria in the system CaO-Si02-H20 at room temperature [4, 6] and those at 1800 C. At room temperature, available evidence indieates that only two stable ternary compounds, CSH I and C2SH II, a mono calcium and a dicalcium silicate hydrate, exist. These are analogous, as regards CaO to Si02 ratio, to xonotlite and hillebrandite, found to be stable at 1800 C.
At room temperature, the compound CSH I has been found to vary in CaO to Si02 ratio from 0.8 to 1.5, and the compound C2SH II, to vary from 1.4 to l.9 [7] . In the present study, all compositions from CaO to Si02 ratio up to 1.5 gave xonotlite, and higher CaO to Si0 2 ratios gave hillebrandite. The CaO to Si0 2 ratio of the solid reaction products was not determined in this investigation. · Kalousek, Logiudice, lJ.l1d Dodson [8] . however, prepared synthetic ' hillebrandite, as well as the a- and "1-dicalcium silicate hydrate, in the range 1750 to 2500
C, in which the CaO to SiO~ molar ratios varied from 1.5 to 2.4 and possibly extended to 3.0 for synthetic hillebrandite (i1-hydrate). For each hydrate, almost
210
identical X-ray pattern.s were obtained over the range of varying CaO to Si02 ratio. This situation is directly analogous to that found at room temperature, where a varying CaO to Si02 ratio, within the limits mentioned above, does not affect the X -ray patterns.
S~veral. previous investigators have prepared dicalCIUm slhcat~ hydrate (10CaO·5Si02·6H20 ) [2, 8, 9, 10, 11], and It has been isolated in steam-cured . . mortars [12]. This suggests that it might be the I stable dicalcium silicate hydrate at 1800 C. The present investigation, however, indicates tha t hillebrandite is the stable dicalcium sili cate hydrate. Kalousek, Logiudice, and Dodson [8] found that the a-hydrate, prepared at 1750 C, began. to convert to the i1-hydra te (hillebrandite) when the temperature was raised. Their work indicates that many variables, such as type of silica and condition of mixing helped to determine what hydrate was produced, 'so that they were not able to assign definite ranges of temperature over which the various hydrates are stable. These same authors found that at 1750 C. when the CaO to Si02 ratio fell below 1.8, xonotli te appeared. This is in accord with the results obtained in the present investigat ion.
Recent work of Heller and Taylor [13] indicates that hillebrandite is the stable dicalcium cilicate ~y:dra~e at 1800 . C. They found that Ca(OH)2 and SIlIca III 2 ·: 1 ratlO at 1800 C for 30 days gave hillebrandite. Thea-hydrate was formed below and the 'Y-hydrate above 1800 C . These results were no t conclusive, however , because in another experiment they obtained all three hydrates.
The present investigation also is in accord with other recent work of H eller and T aylor [14], whi ch demonstrates that CSH I and afwillite are metastable at 1800 C.
Returning to the group of experiments (table 1 A) where the initial molar CaO to Si02 ratio is 1.56 to 3.00, it is apparent that no stable compound more lime-rich than dicalcium silicate hydrate forms . The hydrate 3CaO·Si02·2H20 was prepared by Flint M cMurdie, and Wells [2] at and above 200" C. I~ experiment 10, a few weak lines in the X-ray pattern ' indica ted the pl:esence of this hydro silica te, bu t th ey resembled the hnes of Ca(OH) 2 too closely to prove the existence of the hy drosilicate at 1800 C. The same authors found that CaO·Si02·H20 formed at 1500 C and xonotlite at 175 0 C from a CaO and Si02
mixture of 1: 1 molar ratio. This would indicate that the compound CaO·Si02·H20 is metastable with respect to xonotlite near 1800 C. The results of the present investigation are in accord. However Flint McMurdie, and Wells [2] found that the co~pounJ 4CaO·5Si02·5H 20 formed between 1500 C [2] and 275 0 C and persisted in this range from 7 to 42 days. This suggests that it is a stable phase at 1800 C because it was found to transform to xonotlite only at 3000 C. In the present investigation, this compound was found to be metastable with respect to xonotlite at 1800 C. Flint, McMurdie, and Wells used lime-silica gels in their experiments, and these gels were steamed out of contact with the liquid

phase. Apparently, the rates of reaction of these materials are different, depending on whether they are in contact with the liquid or vapor phase. In the presen t investigation, for example, the products after hydrothermal treatment of oxide mixtures for 6 months exhibited about the same degree of crystal growth and reaction as had corresponding liquidcontact experiments in 1 to 2 weeks. In the experiments from supersaturation, (table 1, B) the products of experiment 1 were the two compounds mentioned above (4CaO·5Si02·5HzO and CaO·SiOz·HzO) and xonotli te, with respect to which the first two are evidently metasta,ble.
The results of the present investigation are in accord with those of Flint, McMurdie, and Wells [2] as regards the silica-rich compounds. These authors found gyrolite at 1500 to 400 0 C and xonotli te from 175 0 to 3900 C, and were unable to prepare okenite in this temperature range.
Several properties of the solid phases of this sys tem used qualitatively in this investigation might, in principle, be used to estimate quantitatively the rate of reaction. These include refractive index, dye absorption. DTA curves, and X-ray patterns of the products before and after DTA heat treatment.
5. Summary
Phase equilibria in the system CaO-SiOz-HzO were investigated at 1800 C. Only two stable ternary compounds were found, namely, xonotlite and hillebrandite. Two other stable binary compounds found were a -quartz and Ca(OHh. The metastable equilibrium curves of gyrolite and of a silica gel was determined approximately. The results suggested several other metastable compounds. Treating oxide mixtures with CaO to Si0 2 ratios of 0.1 to 4.0 with steam for 6 months at 1800 C yielded xonotlite and hillebrandite as the only hydrosilicates.
211
6 . References
[1] H . F . W. Taylor and G. E. Be sey, A review of hydrothermal reactions in the system CaO-S i0 2-II20, Mag. of Concrete Research 2, 15 (July 1950).
[2] E. P . F lin t, H . F. McMurdie, and L. S. Weils, Formation of hydrated calcium silicates at elevated temperatures and pressures, J . R esearch NBS 21, 617 (1938) RP 114 7.
[3] H . F. McMurdie and E. P. Flint, X-Ray patterns of hydrated calcium silicates, J. Research NBS 31, 225 (1943) RP1560.
[4] J . D . Bern al and L. Heller, Third International Symposium on the Chemistry of Cement (Cement and Concrete Assoc., London , England, Sept. 1952) .
[5] R. B. Peppler and L. S. Weils, The system of lime, alumina, and watE'r from 500 to 250 0 C, J. Research NBS 52,75 (1954) RP2476. I
[6] H. H. Steinour, The system CaO-Si02-H20 and the . hydration of the calcium silicates (Bul. 18, Portland Cement Assoc.) Chern. Rev. <10, 391 (1947).
[7] H. F. W. T aylor, Hydrated calcium silicates, Pt. I, Compound formation at ordinary temperatures, J . Chern. Soc., 3682 (Dec. 1950).
[8] G. L. K alousek, J . S. Logiudice, and V. H . Dodson, Studies on the lime-rich crystalline solid phases in the system lime-silica water, J. Am. Ceram. Soc. 37, 7 (Jan. 1954) .
[9] V. A. Vigfusson, G. . Bates, and T. Thorvaldson, Hydrothermal syntheses of calcium hydrosilicates, Can. J . Research 2, 520 (1934).
[10] G. E. Bessey, The calcium aluminate and silicate hydrates, Proc. Symposium on Chern. of Cements, p. 178 (Stockholm, Sweden, 1938).
[11] S. Nagai, Hydrothermale synthesen von calciumsilikaten, Z. anorg. u. allgem. Chern. 206, 177 (1932); 207, 321 (1932).
[12] T . Thorvaldson and G. R. Shelton, Steam curing of portland cement mortars, a new crystalline substance, Can . J . Research 1,148 (1929).
[13] L . H eller and H . F . W. Taylor, Hydrated calcium silicates, Pt. IV, Hydrothermal reactions- lime: silica ratio 2:1 and 3:1, J . Chern. Soc., 2535 (1952).
[14] L . H eller and H . F . W. Taylor, Hydrated calcium silicates, Pt. II , Hydrothermal reactions- lime: silica ratio 1:1, J . Chern. Soc., 2397 (Sept. 1951) .
WASHINGTON, December 15, 1954.]