the systems analysis and design course - jisejise.org/volume22/n4/jisev22n4p331.pdf · business...
TRANSCRIPT

The Systems Analysis and Design Course:
An Educators’ Assessment of the Importance and
Coverage of Topics
Brandi N. Guidry
David P. Stevens
Michael W. Totaro Department of Business Systems, Analysis, and Technology
B. I. Moody III College of Business Administration
University of Louisiana at Lafayette
Post Office Box 43930
Lafayette, LA 70504-3930
[email protected], [email protected], [email protected]
ABSTRACT
This study examines instructors‟ perceptions regarding the skills and topics that are most important in the teaching of a
Systems Analysis and Design (“SAD”) course and the class time devoted to each. A large number of Information Systems
(“IS”) educators at AACSB accredited schools across the United States were surveyed. Shannon‟s entropy is used to analyze
the opinions and measure the agreement or disagreement among survey respondents. Findings suggest that object-oriented
analysis and structured analysis are topics on which instructors spend the most time, and are also the topics for which there is
the greatest disagreement regarding importance. Conversely, the greatest agreement among survey respondents occurs with
topics that, on the whole, were perceived as less important and to which less class time is devoted. This analysis provides a
basis for comparison to practitioner perceptions.
Keywords: Systems analysis and design, System development tools & methods, Structured analysis & design, Object-
oriented SDLC.
1. INTRODUCTION
A Management Information Systems (MIS) curriculum
should reflect the needs and expectations of industry, as this
helps to ensure that students are adequately prepared for their
employment. It is often quite difficult, however, to achieve
this (Anandarajan and Lippert, 2006; Tang, Lee, and Koh,
2000). The “IS 2010 Curriculum Guidelines for
Undergraduate Programs in Information Systems,”
established by the Association for Computing Machinery
(ACM) and the Association for Information Systems (AIS),
are designed to help with this alignment (Topi et al., 2010).
The IS 2010 guidelines represent numerous perspectives of
faculty and practitioners alike. Furthermore, they are
developed with careful consideration of industry
requirements and an understanding of organizational needs
and expectations. Importantly, the IS 2010 Curriculum
Guidelines identify the Systems Analysis and Design (SAD)
course as a core in an MIS undergraduate curriculum Topi et
al, 2010). Indeed, the suggested catalog description provided
within the IS 2010 guidelines (Topi et al, 2010), shown
below, amplifies the significance of the SAD course:
This course discusses the processes, methods,
techniques and tools that organizations use to
determine how they should conduct their business,
with a particular focus on how computer-based
technologies can most effectively contribute to the
way business is organized. The course covers a
systematic methodology for analyzing a business
problem or opportunity, determining what role, if
any, computer-based technologies can play in
addressing the business need, articulating business
requirements for the technology solution,
specifying alternative approaches to acquiring the
technology capabilities needed to address the
business requirements, and specifying the
requirements for the information systems solution
in particular, in-house development, development
from third-party providers, or purchased
commercial-off-the-shelf (COTS) packages (p. 48)
.
Journal of Information Systems Education, Vol. 22(4)
331

In addition, employment projections are seemingly
reflective of the importance of systems analysis and design.
According to the Bureau of Labor Statistics (2011),
employment of systems analysts is projected to grow
significantly between 2008 and 2018 as compared to the
average growth of all other occupations. In fact, employment
of systems analysts is projected to increase by 20% during
this time frame. As more advanced technologies continue to
emerge and as increasing numbers of organizations seek to
embrace these new innovations, the demand for these
workers is expected to continue rising (Bureau of Labor
Statistics, 2011). It is necessary for IS professionals, and
those training to become practitioners, to understand the
complexities and uncertainties that exist in the utilization of
these new technologies and applications for systems
development. Thus, it is important for MIS students to have
a good understanding of the systems development process,
with sufficient knowledge of various methodologies,
strategies, and techniques pertaining thereto.
What topics should be the focus in the SAD course?
Presumably this question is important to those who teach the
SAD course, as well as those who ultimately hire MIS
graduates. This study examines instructors‟ perceptions
regarding the skills and topics that are most important in the
teaching of a Systems Analysis and Design course and the
amount of class time devoted to each of the more traditional
areas. This is an important step in determining if
educational objectives related to SAD are in line with current
industry needs. This paper begins with describing the
motivation for the study, reviewing the literature on this
topic, and presenting the research questions. The analysis,
discussion, conclusions, and recommendations for future
research follow.
2. MOTIVATION FOR STUDY
Anecdotal evidence suggests that Information Systems
professionals seem to express more of an interest in using
object-oriented modeling and analysis in the workplace.
Many Systems Analysis and Design textbooks, however,
appear to focus more on structured approaches. After
reviewing a sample of available SAD textbooks (Shelly and
Rosenblatt, 2012; Valacich, George, and Hoffer, 2009;
Whitten and Bentley, 2008), we found that one or two
chapters are devoted exclusively to the teaching of object-
oriented analysis and design (e.g., analysis of use-case
models, system sequence diagrams, class diagrams), with
approximately four to five chapters focusing on traditional
structured analysis and design methodologies and techniques
(e.g., entity-relationship diagrams, data flow diagrams,
decomposition diagrams, activity-dependency diagrams,
fact-finding techniques). Recognizing that not all instructors
of the SAD course will select these more traditional
textbooks, one should understand the possibility of their
selecting a book that exclusively focuses on the teaching of
object-oriented and/or more agile approaches to systems
analysis and design. Also, there is the possibility that IS
educators will use some of their own material, either in
addition to a more traditional SAD textbook or in lieu of one.
The IS 2010 Curriculum Guidelines do not explicitly
suggest the use of specific methodologies or approaches in
the SAD course; rather, the importance of introducing
students to the structured Systems Development Life Cycle
(SDLC), object-oriented approaches, and agile
methodologies is encouraged (Topi et al., 2010). Given the
time constraints in any given semester, however, it is often
difficult to give proper attention to both structured- and
object-oriented approaches to analysis and design,
particularly if the instructor chooses to employ an
experiential learning approach. Hence, the authors felt
compelled to survey SAD instructors across the United
States to learn more about what is actually being taught in
this course. Is there some uniformity or do substantial
perceptual differences exist?
The results of this study should be of interest to
instructors of Systems Analysis and Design courses and IS
practitioners. Many emails and requests were received from
survey participants interested in obtaining a copy of the
survey results. Thus, there seems to be a keen interest
among IS faculty members, especially those teaching the
SAD course, in what topic areas are of predominant interest
and how much class time is devoted to each.
3. REVIEW OF LITERATURE
There is a lack of consensus in the literature regarding which
topic areas should be covered in the SAD course. A study
that is a forerunner to this research (Tastle and Russell,
2003) concluded that although instructors have little
agreement regarding overall topic coverage in this course,
some structured methods (i.e., data-flow diagramming and
data modeling) were consistently perceived as being
important. Further, the survey revealed that IS instructors
have not yet embraced object-oriented analysis and design
methodologies. And while theoretical evidence also exists to
support the continued use of more structured modeling and
design techniques (Chen, 1976; Chen 1977; Ng, 1981), some
recent studies reveal the importance of teaching object-
oriented systems development involving the use of Unified
Modeling Language (UML) (Batra and Satzinger, 2006;
Golden and Matos, 2006; Suleiman and Garfield, 2006;
Wang, 2006). Some authors argue that object-oriented
methods are more reliable and re-usable than structured
approaches (see, for example, Bateveljic, Eastwood, and
Seefried, 2006). Still, studies show that systems analysts
view UML as particularly complex, as there are an extensive
number of diagramming tools associated with its use (Siau,
Erikson, and Lee, 2005; Dobing and Parsons, 2006). Others
believe it is important to incorporate some sort of hybrid
approach that emphasizes elements of both the structured
and object-oriented paradigms when teaching SAD
(Bateveljic, Eastwood, and Seefried, 2006; Carte, Jasperson,
and Cornelius, 2006). For example, Bataveljic, Eastwood,
and Seefried (2006) present an SAD course syllabus that
combines elements of the object-oriented paradigm with
some structurally-oriented modeling techniques (i.e., data-
flow diagrams and entity-relationship diagrams). And
although their results are promising, the authors point out
that the object-oriented approach fails to provide a clear
distinction between the analysis and design phases of the
development process. This is potentially problematic, as it
may result in an insufficient analysis and a less than
Journal of Information Systems Education, Vol. 22(4)
332

adequate system design. As there are advantages and
disadvantages to the coverage of any of these topics,
separately or together, it is most important to take steps to
ensure that topic coverage in this course is reflective of
industry standards and preferences.
Historically, researchers have described the curriculum
gaps between IS topics/skills taught in the classroom and
those that are required by industry (Anandarajan and Lippert,
2006; Tang, Lee, and Koh, 2000; Todd, McKeen, and
Gallupe, 1995). Additionally, research shows there is much
diversity in SAD methods used by IS practitioners. With
this, it may be quite challenging to gain a sufficient
understanding of common practices, skills, and techniques
that are currently being used in industry (Batra and
Satzinger, 2006). This challenge, however, does not lessen
the importance of continuing efforts to achieve a knowledge
alignment.
Understanding the perceptions of IS faculty members
regarding topic areas of most importance in the SAD course
is an important first step in determining whether curriculum
gaps continue to exist in this area. The current study
involves the use of a survey for the analysis of opinions by a
large number of educators at AACSB accredited schools
across the United States. Because each survey question has
its own empirical probability distribution defined by the
number of respondents who select each of the answer
choices for each survey question, application of Shannon‟s
entropy (Shannon, 1948) is employed as a more intuitive
way to visualize disagreement betweenn various probability
distributions (Tastle and Russell, 2003).
4. RESEARCH QUESTIONS
From the preceding literature review and discussion, the
following research questions are posed:
1. In general, what topic areas are given the most
attention in the instruction of the SAD course?
2. Do IS instructors teach more structured- or
object-oriented approaches to SAD?
3. What elements of structured approaches are
given the most focus in the SAD course?
4. What elements of object-oriented approaches
are given the most focus in the SAD course?
5. METHODOLOGY
All AACSB accredited schools of business in the United
States were identified. The faculty survey was sent to all
Information Systems faculty members at AACSB accredited
business schools throughout the United States regardless of
whether they were known to teach the SAD course or not.
The authors felt it was important to include all IS faculty in
the survey distribution list, as it was not possible to
determine who is teaching (or has ever taught) the SAD class
in all cases. Some school websites provide this level of
detail and others do not. This methodology allowed for a
greater likelihood of reaching all instructors of SAD courses.
A slight variation of an existing survey instrument was
used for this study (Tastle and Russell, 2003). This variation
involved additional and more general demographic questions
pertaining to academic rank, AACSB faculty qualification
status, and gender. Next, mirroring the original instrument,
three sets of questions were posed to participants. In the first
set, questions regarding the percentage of time spent on more
traditional and general SAD topics were included. For these
questions, an eight-point scale was employed with options
ranging from “none” to “>= 50%,” as participants were
asked to select the approximate percentage of time spent on
each of the listed topics in any given semester. In the second
set of questions, participants were asked to be more specific
about their perceptions regarding the importance of certain
elements of a structured approach (only if they indicated they
taught structured concepts). In the third set of questions,
participants were asked to indicate their perceptions about
the importance of object-oriented concepts (only if they
indicated they taught object-oriented concepts). A Likert
scale ranging from “definitely important” to “definitely
unimportant” was used for the second and third sets of
questions. Finally, survey participants were asked to list any
CASE tools or other model-based software they use in the
class and to provide any additional information they felt was
important to share. The survey instructions assured strict
confidentiality and anonymity. The Appendix contains the
survey questions, as well as the number of responses in each
answer category with which the entropy calculations are
completed.
A pilot survey was sent to eighty IS faculty members at
AACSB accredited business schools in the state of Louisiana
using Survey Monkey, an online survey tool. After several
mechanical refinements, emails were sent to 2,643 IS faculty
members. Of these, more than twenty emails were returned
as “undeliverable” due to invalid, and probably expired or
outdated, addresses. A total of two hundred fourteen (214)
completed surveys were collected. A widely cited source on
survey research indicates that “surveys with response rates
over 30 percent are rare, and response rates are often 5 to 10
percent” (Alreck & Settle, 2004, p. 36). Ninety (90)
respondents indicated they either never taught, or were
uncertain if they ever taught, the SAD course, and others
failed to complete the survey in its entirety. Those surveys
were excluded from the analysis, leaving a total of 124
completed responses from at least 64 different schools. This
total includes the usable responses from the pilot survey.
Note that 52 respondents did not specify the name of their
college or university, and so the exact number of schools and
their locations cannot be determined.
The survey respondents represent a broad cross-section
of SAD educators. The faculty rank of respondents includes
37.9% at rank of Professor, 29% at Associate Professor, and
21% at Assistant Professor for a total of 87.9% of
respondents in a tenured or tenure-track position. For
AACSB accreditation purposes, 82.3% are academically
qualified with 10.5% professionally qualified and 7.2%
unsure. In terms of experience teaching the course, 41.9%
have taught the course 5 years or less, 45.2% have between 6
and 20 years of SAD teaching experience, and 12.9% have
been teaching the course for 21 years or longer. The SAD
course is taught at the undergraduate level (by 54.8% of
respondents), at the graduate level (by 6.5% of the
respondents), and at both levels (by 38.7% of the
respondents). Among these educators, 21% are female, 75%
are male, and 4% declined to answer.
Journal of Information Systems Education, Vol. 22(4)
333
Cronbach‟s alpha was calculated for each of the three
(traditional topics, structured analysis topics, and object-
oriented topics) sets of questions. The generally agreed upon
lower limit for Cronbach‟s alpha is .7 (Hair, Black, Babin,
and Anderson, 2010). The values of Cronbach‟s alpha for
the questions regarding traditional topics was .925, for
structured analysis topics was .864, and for object-oriented
analysis was .830. The internal reliability of the survey
questions in the present study is therefore very strong.
6. ANALYSIS
6.1 Measuring Agreement Using Entropy
A common way to summarize and describe survey
responses in MIS research is to calculate sample means and
sample standard deviations and compare those across survey
questions using t-tests (Downey, McMurtrey, and Zeltmann,
2008; Stevens, Totaro, and Zhu, 2011). As noted by Tastle
and Russell (2003), an entropy measure such as Shannon‟s
entropy (Shannon, 1948) is a more intuitive way to visualize
disagreement between various probability distributions. In
this context, each survey question has its own empirical
probability distribution defined by the number of
respondents who select each of the answer choices for that
question. Tastle and Russell (2003) demonstrate the
advantage of the entropy approach using a series of
probability distributions with varying means and standard
deviations, but the same amount of entropy. Since this
research is a continuation and extension of theirs, it is logical
to make comparisons using the same mathematical
techniques.
Entropy measures the extent to which survey
respondents agree or disagree. If all respondents answer a
question in the same way, then they are in complete
agreement, and the entropy measure for this question is zero.
On the other hand, if the responses are equally distributed
across all possible answers for a given question, then the
entropy is at a maximum. The objective in this research is to
determine those topics for which there is the greatest
agreement. Not surprisingly given the large sample size in
this research, perfect agreement among faculty did not occur
with any of the survey questions.
This research has three categories of questions
regarding content of the SAD course: traditional topics
taught (which include structured analysis and object-oriented
analysis), the importance of various structured analysis
topics, and the importance of the object-oriented analysis
topics. Entropy, H(p), is calculated for each of these 3
question sets using the natural logarithm function, ln(x),
according to equation 6.1:
H(p) = - ∑ pi ln(pi),
(6.1)
Where p1 + … + pn = 1, 0 < pi < 1, and i = 1, 2, 3, …, n. In
this case n = the number of possible answers in each question
set. As noted above, the minimum value of entropy is
always 0, and the maximum entropy is based on the number
of answer choices for the question, rather than on the number
of respondents answering the question. For example, the
maximum entropy for a question with 8 choices is 2.079,
regardless of number of survey respondents. The use of
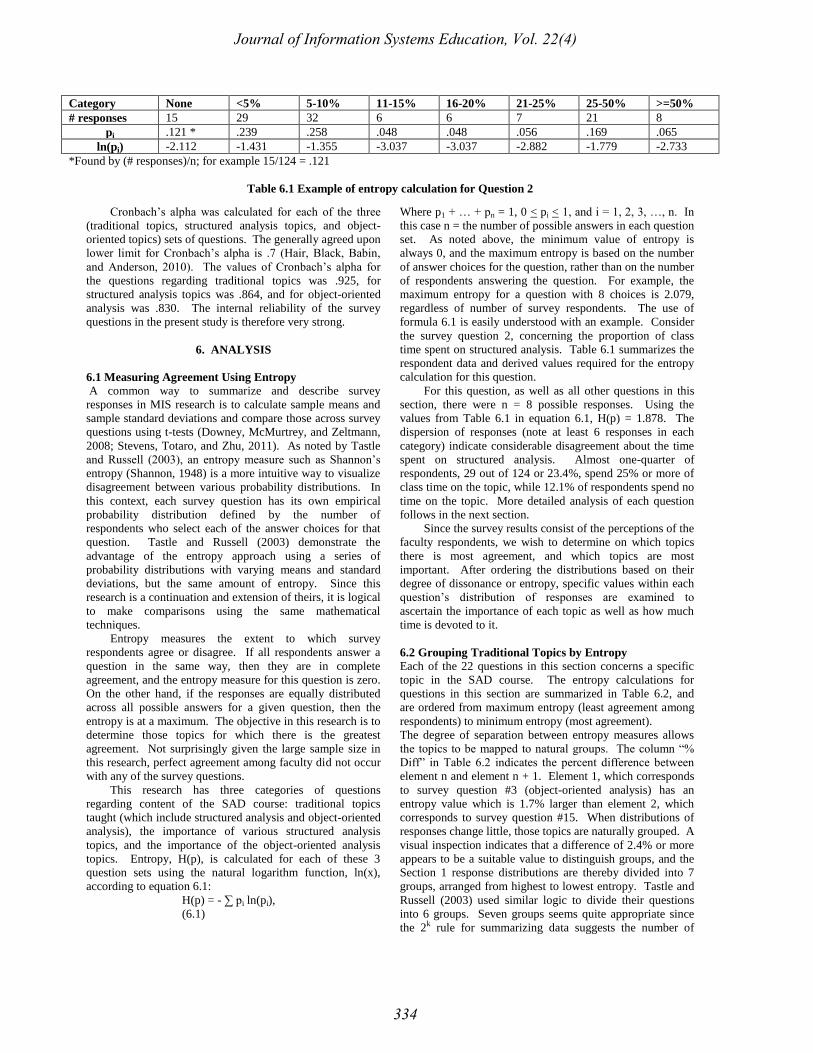
formula 6.1 is easily understood with an example. Consider
the survey question 2, concerning the proportion of class
time spent on structured analysis. Table 6.1 summarizes the
respondent data and derived values required for the entropy
calculation for this question.
For this question, as well as all other questions in this
section, there were n = 8 possible responses. Using the
values from Table 6.1 in equation 6.1, H(p) = 1.878. The
dispersion of responses (note at least 6 responses in each
category) indicate considerable disagreement about the time
spent on structured analysis. Almost one-quarter of
respondents, 29 out of 124 or 23.4%, spend 25% or more of
class time on the topic, while 12.1% of respondents spend no
time on the topic. More detailed analysis of each question
follows in the next section.
Since the survey results consist of the perceptions of the
faculty respondents, we wish to determine on which topics
there is most agreement, and which topics are most
important. After ordering the distributions based on their
degree of dissonance or entropy, specific values within each
question‟s distribution of responses are examined to
ascertain the importance of each topic as well as how much
time is devoted to it.
6.2 Grouping Traditional Topics by Entropy
Each of the 22 questions in this section concerns a specific
topic in the SAD course. The entropy calculations for
questions in this section are summarized in Table 6.2, and
are ordered from maximum entropy (least agreement among
respondents) to minimum entropy (most agreement).
The degree of separation between entropy measures allows
the topics to be mapped to natural groups. The column “%
Diff” in Table 6.2 indicates the percent difference between
element n and element n + 1. Element 1, which corresponds
to survey question #3 (object-oriented analysis) has an
entropy value which is 1.7% larger than element 2, which
corresponds to survey question #15. When distributions of
responses change little, those topics are naturally grouped. A
visual inspection indicates that a difference of 2.4% or more
appears to be a suitable value to distinguish groups, and the
Section 1 response distributions are thereby divided into 7
groups, arranged from highest to lowest entropy. Tastle and
Russell (2003) used similar logic to divide their questions
into 6 groups. Seven groups seems quite appropriate since
the 2k rule for summarizing data suggests the number of
Category None <5% 5-10% 11-15% 16-20% 21-25% 25-50% >=50%
# responses 15 29 32 6 6 7 21 8
pi .121 * .239 .258 .048 .048 .056 .169 .065
ln(pi) -2.112 -1.431 -1.355 -3.037 -3.037 -2.882 -1.779 -2.733
*Found by (# responses)/n; for example 15/124 = .121
Table 6.1 Example of entropy calculation for Question 2
Journal of Information Systems Education, Vol. 22(4)
334

groups = k, where k is the smallest integer such that 2k > N,
where N = total number of data values (Lind, Marchal,
Wathen, 2010). For Section 1 responses there were N = 124
respondents, and 27 = 128 > 124.
Table 6.3 summarizes the entropy groupings and their
associated ranges (difference between highest and lowest
entropy values within the group). Group 1 represents the
items with the greatest entropy (least agreement) and Group
7 represents the item with the least entropy and the most
agreement. In addition, SPSS v17 calculates skewness
which indicates the extent to which the distribution of a
question‟s responses are positively skewed (i.e., pushed to
the left: topics given less emphasis in class) or negatively
skewed (i.e., pushed to the right: topics given greater
emphasis). The possible range of skewness values is -3 to
+3. Note that no questions exhibit negative skewness, which
would indicate very strong agreement about the topic
receiving a large proportion of class time. On the other
hand, questions in groups 6 and 7 exhibit strong positive
skewness, indicating agreement about the topics receiving
little or no class time.
The column “Included ?” in Table 6.3 will be discussed
later, and indicates the authors‟ recommendation regarding
whether the topic should be included in a one semester SAD
course.
6.3 Analysis of Traditional Topics
Separate description is provided for each group:
Group 1
There is least agreement among time spent on
object-oriented analysis, UML, and structured
analysis. Instructors cover the entire range of
possibilities, from spending no class time to
spending considerable class time:
o Structured analysis - 12.1% of
respondents spend no time on it (i.e.
“none”), 23.4% of respondents spend
25+% of class time, and 30.6% of
instructors spend between 5-15% of class
time
Element
Survey
Ques # Topic Entropy % Diff
1 3 Object-oriented analysis 1.927 1.7%
2 15 UML 1.895 0.9%
3 2 Structured analysis 1.878 3.0%
4 11 Process modeling 1.823 1.7%
5 14 Use case 1.792 0.5%
6 12 Data flow diagramming 1.784 0.5%
7 16 Class diagramming 1.775 0.8%
8 20 Systems design concepts 1.762 2.4%
9 8 Data modeling 1.720 2.1%
10 9 Entity relat. diagram 1.684 3.4%
11 17 Sequence diagramming 1.629 1.1%
12 21 Interface design 1.611 1.2%
13 6 Project management concepts 1.592 2.8%
14 5 Project initiation, data 1.549 0.5%
15 4 Overview of SA 1.542 2.9%
16 19 Cost-benefit and payback 1.498 0.6%
17 22 File and DB design 1.489 0.8%
18 13 Decomposition diagramming 1.477 0.9%
19 7 Overview of methodologies 1.463 1.0%
20 23 Program design 1.449 0.2%
21 10 Normalization 1.447 4.9%
22 18 State-transition diagramming 1.379
Table 6.2 Ranking of Traditional Topics
Journal of Information Systems Education, Vol. 22(4)
335

o UML - 16.1% spend none, 14.5% spend
25+% of class time, and 22.6% spend
between 5-15% of class time
o Object-oriented analysis - 10.5% spend
none, 8.1% spend 25-50% of class time,
and another 12.1% spend more than 50%
of class time
These 3 topics are also covered most as reflected
b
y
t
h
e
p
e
r
c
e
n
t
a
g
e
s
o
f
i
n
s
t
r
u
c
t
o
r
s
t
h
a
t
s
p
spend 25+% of class time. No other topic has as
much as 10% of respondents devoting 25+% of
class time.
Group 2
Process modeling – 9.7% spend none, 32.3%
spend none or less than 5% (i.e. “very little” time
devoted)
Data flow diagramming – 21% spend none, 39.5%
spend very little
Use case – 9.7% spend none, 38.7% spend very
little
Class diagramming – 25% spend none, 54% spend
very little
Systems design concepts – 4.8% spend none, 7.2%
spend 25+% of time
Group 3
Data modeling – 12.9% spend none, 34.7% spend
5-10%, 6.4% spend 25+%
Entity relationship diagramming – 19.4% spend
none, 51.7% spend very little
Group 4
Sequence diagramming - 27.4% spend none,
57.2% spend very little
Interface design - 11.3% spend none, 48.4% spend
very little
Project management concepts – 8.9% spend none,
39.5% spend 5-10%
Group Element
Survey
Ques # Entropy % Diff Range Skewness Included? *
1 1-3 3 1.927 1.7% 0.049 0.673 I
15 1.895 0.9% 0.788 I
2 1.878 3.0% 0.553 I
2 4-8 11 1.823 1.7% 0.062 0.806 I
14 1.792 0.5% 0.898 I
12 1.784 0.5% 0.818 I
16 1.775 0.8% 1.105 U
20 1.762 2.4% 1.065 I
3 9-10 8 1.720 2.1% 0.035 1.187 U
9 1.684 3.4% 1.215 U
4 11-13 17 1.629 1.1% 0.037 1.515 N
21 1.611 1.2% 1.161 U
6 1.592 2.8% 1.346 I
5 14-15 5 1.549 0.5% 0.007 1.329 I
4 1.542 2.9% 1.575 I
6 16-21 19 1.498 0.6% 0.051 1.604 U
22 1.489 0.8% 1.886 N
13 1.477 0.9% 1.82 N
7 1.463 1.0% 1.856 I
23 1.449 0.2% 1.848 N
10 1.447 4.9% 1.902 N
7 22 18 1.379 0.000 2.194 N
* Indicates suggested coverage of topic: (I)nclude, (N)ot include, (U)nable to determine
Table 6.3 Groupings of Section 1
(Questions by Entropy Value)
Journal of Information Systems Education, Vol. 22(4)
336

Group 5
Project initiation and data collection - 5.6% spend
none, 46% spend 5-10%
Overview of systems analysis - 3.2% spend none,
39.5% spend 5-10%
Group 6
Cost-benefit and payback - 11.3% spend none,
52.4% spend very little
File and database design - 26.6% spend none,
66.1% spend very little
Decomposition diagramming - - 37.9% spend
none, 70.2% spend very little
Overview of various systems methodologies -
4.8% spend none, 37.9% spend 5-10%
Program design – 33.9% spend none, 73.4% spend
very little
Normalization concepts – 35.5% spend none,
73.4% spend very little
Group 7
State-transition diagramming – 40.3% spend none,
77.4% spend very little
For these questions, skewness increases as entropy increases.
This indicates that there is more agreement among
instructors for those topics on which there is less class time
spent. When instructors spend 25-50% or 50+% of class
time on a topic, there is greatest disagreement about those
topics (all topics on which 10% or more respondents spend
25% or more class time are in Group #1). Conversely, when
more than 30% of respondents spend no time on a topic,
those topics have the greatest agreement, and are
predominantly found in group #6 and #7. Implications of
these findings are discussed in section 7.
6.4 Structured Analysis Topics by Entropy
Each of the 12 questions in this section concerns the
importance of a specific structured analysis topic. For these
questions, respondents had 5 answer choices (n = 5 in
equation 6.1): “Definitely Important”, “Somewhat
Important”, “Undecided”, “Somewhat Unimportant”, and
“Definitely Unimportant”. The maximum entropy value for
a question with 5 choices is 1.609, regardless of the number
of responses to the question. Table 6.4 lists the number of
responses for each answer to each question, together with the
skewness measure and entropy value. As before, the
questions are ordered from maximum to minimum
entropy.The interpretation of the values in Table 6.4 is
exactly analogous to the interpretations from the earlier table
of entropy values of the traditional topics. The total number
of respondents for this group of questions was 88 (since all
respondents had not taught the SAD course.) These
questions asked the respondent to indicate the importance of
each topic, rather than the amount of time spent on each
topic, as with the first section questions on traditional SAD
topics. Note again that no questions exhibit negative
skewness, which would indicate strong agreement about the
topic being very unimportant. Conversely, larger positive
skewness here indicates most respondents believed the topic
to be either definitely important or somewhat important.
Table 6.4 Ranking of Structured Analysis Topics by Entropy
Journal of Information Systems Education, Vol. 22(4)
337

6.5 Importance of Object-Oriented Topics
This section consists of 6 questions concerning the
importance of various object-oriented concepts, and
consisted of responses from 77 instructors who had taught
OO concepts. As with the second set of questions,
respondents were asked to rank the importance of each topic
on the 5-point scale ranging from definitely important to
definitely unimportant.
The entropy calculations for questions in this section are
summarized in Table 6.5, and are ordered from maximum to
minimum entropy.
The “% Diff” values for elements 1 through 5 (not shown in
the table due to space limitations) are 6.1%, 6.0%, 6.0%,
3.0%, and 15.0%, respectively. Using 6.0% as a group
cutoff, 5 groups are obtained with each question in its own
group, with the exception of questions 38 and 41 being
combined into group 4. Very clear distinctions between each
of these elements are obvious because of the percentage
changes in entropy values for successive elements. Note that
increasing positive skewness also indicates this same basic
order of topics (with only the first 2 items switching places
in the ordering). Creating a single “important” column by
adding the “definitely” and “somewhat” values together, and
creating a single “unimportant” category by adding the
“somewhat” and “definitely” columns together also produces
the same basic order of topics (again, with only the first 2
topics switching places in the ordering).
7. DISCUSSION
Discussion is provided for each of the 3 sets of questions
separately, and then overall.
7.1 Discussion of Traditional Topics
Each topic is classified in one of three ways, depending on
whether it should be included in the SAD course: (I)ncluded,
(N)ot included, (U)nable to determine. The following
guidelines, together with the ratings for other topics within
the same entropy grouping were used to categorize each
topic:
7.1a) If less than 10% of respondents devote no
time to the topic, then the topic is included,
7.1b) If more than 25% of respondents devote no
time to the topic, then the topic is not included,
7.1c) If 50% or more of respondents devote no
time or <5% of class time, then the topic is
undecided (i.e. unable to determine whether it
should be included),
7.1d) If 10% or more of respondents devote 25+%
of class time, then the topic is included.
From group 1, Object-oriented analysis and structured
analysis were also the topics with the most disagreement in
the earlier study by Tastle and Russell (2003). This indicates
that there has been little change in faculty perceptions of
these two topics over the past 8 years, and that those faculty
perceptions are quite diverse. The 3 topics in this group
have the greatest entropy but also the highest percentage of
respondents devoting considerable time, and so each receives
the rating of “I” (to be included in the SAD course) based on
criteria 7.1d. Note that these ratings are in the last column of
Table 6.3.
From group 2, Process modeling, Use case, and Data
flow all have less than 10% of respondents spending no class
time, so each is rated “I”. At this point, there is a logical
division of topics in Table 6.3. The first 6 topics all have
skewness values less than .818, the next 10 topics all have
skewness values between 1.105 and 1.604, and the final 6
topics each have skewness values of 1.886 or larger. Using
this gap in skewness together with condition 7.1c above, no
determination can be made for Class diagramming. The
final topic in this group, Systems design concepts, is rated “I”
using criteria 7.1a. All topics in this group are design-
related, and 4 of the 5 are specifically concerned with
modeling.
Both topics in group 3 are modeling-related. Data
modeling is a more general topic and an Entity relationship
diagram is a type of data model. Entity relationship diagram
receives a rating of “U” based on criteria 7.1c. Since Data
modeling has a larger entropy rating and smaller skewness, it
also receives a rating of “U”.
Group 4 consists of 2 design topics: Sequence
diagramming which is rated “N” based on criteria 7.1b, and
Table 6.5 Ranking of Object-Oriented Topics by Entropy
Journal of Information Systems Education, Vol. 22(4)
338

Interface design rated “U” because none of the other criteria
apply. The last topic in this group, Project management
concepts has the smallest entropy in the group and is rated
“I” by criteria 7.1a.
Group 5 consists of 2 topics outside the design domain,
and both are included based on very small proportions of
instructors indicating they spend no time, criteria 7.1a.
These 2 topics are Project initiation and data collection
analysis and Overview of the systems analysis process.
Groups 6 and 7 consist of the topics with which there is
the greatest agreement among instructors. Interestingly, this
agreement is primarily that these topics are not important at
all. Other than Cost-benefit and payback analysis which
receives the “U” rating because of criteria 7.1c, and
Overview of the various methodologies which receives the
“I” rating because of criteria 7.1a, every other topic receives
“N” because 66.1 – 77.4% of instructors spend very little
time: either no time at all or less than 5% of class time. And,
for these 5 topics, the percentages spending no time and the
percentages spending less than 5% of class time are
approximately equal.
There is no clear consensus on which topics are most
important: at least 2.4% of respondents rate each topic as
deserving of 25+% of class time. Each of the topics
providing an “overview” or with a project management focus
is included. (One exception here is the “U” rating for Cost-
benefit analysis). In summary, eleven topics should
definitely be included, 6 topics are not included, and 5 other
topics are borderline or undecided. These conclusions
provide a rationale for instructors to spend additional time on
the 11 most important topics.
7.2 Discussion of Structured Analysis Concepts
Since these are the common structured analysis topics found
in SAD texts, it was expected that the distributions would be
positively skewed, with most respondents indicating either
definitely or somewhat important. However, there are a
surprising number of responses in the “undecided” category,
ranging from 2 to 27. At least 2 instructors were undecided
about the importance of each topic, and question #30
regarding the activity-dependency diagram was the topic
with most undecided at 27 out of 88, or 30.7%. The final 8
topics in Table 6.4, the ones with the lowest entropy values,
are believed to be important (either “definitely or
somewhat”) by at least 76% of respondents. These are
teaching students to draw entity relationship diagram,
teaching students to balance a data flow diagram, requiring
students to learn data collection, teaching data modeling
concepts, requiring students to complete a project requiring
project management skills, teaching students to draw a
complete data flow diagram, teaching students to complete a
project that requires the use of both data and process
modeling skills, and requiring students to complete a project
as a team. Furthermore, of the final 8 topics, the last 3
questions were believed important by at least 89.7% of
respondents These 8 topics also have the smallest numbers
of instructors who believe them to be unimportant (either
“somewhat or definitely”). The consensus is that these 8
topics are the most important structured analysis topics. The
single most important topic with the highest overall
agreement is question #34: requiring students to complete a
project as a team.
On the other end of the entropy list are the first 4 topics:
requiring students to use a CASE tool, teaching students to
normalize a data model to 3rd normal form, teaching students
to draw an activity dependency diagram, and requiring
students to actually exercise interviewing techniques. These
topics have the largest unimportant scores (either “somewhat
or definitely”), have the least agreement concerning their
importance, and are skewed less positively (towards the
unimportant end of the spectrum). However, at least 46.6%
of respondents (41 or more out of 88) believed each of these
4 topics to be important (either “definitely or somewhat”).
In summary, for those teaching structured analysis concepts,
each of the 12 topics is considered important. The entropy
and skewness ratings provide a rationale for spending more
time on the topics at the bottom of the list.
7.3 Discussion of OO Concepts
For those who teach OO Concepts, the first 2 elements in
Table 6.5 (with largest entropy) also have the largest
proportion of instructors undecided about their importance,
with 22.1% undecided about teaching students to use a
model-based software tool to implement a design, and 29.9%
undecided about teaching students to use state-transaction
diagramming. These proportions of undecided instructors
are approximately double those of the other 4 topics.
Although these topics also receive the largest proportions of
“unimportant” responses, they each have at least 53% of
respondents describing them as “important” (either
“definitely” or “somewhat”).
A majority of instructors believe each of the 6 topics in
Table 6.5 are important, but among them the most important
topics are the last 4, for which 74% of the respondents, or
more, list the topic as being “important”. These topics
include question 40: requiring students to complete an entire
object model using project management skills, question 38:
teaching students to use sequence diagramming, question 41:
teaching students to perform cost-benefit analysis, and
question 37: teaching students to use class diagramming.
There is greatest agreement among question 37 with 68 of
the 77 instructors or 88.3% listing it as important. This is the
same result obtained by Tastle and Russell (2003) in their
analysis of OO topics. However, the actual and relative
rankings of the other 5 topics are different between the two
studies. Their study included responses from 14 instructors
who had taught OO concepts, while the present study
includes 77 such responses.
8. CONCLUSIONS AND FUTURE RESEARCH
Every question had at least 1 respondent select every
possible choice, with one exception: question 18, State-
transition diagramming, had 0 responses for the 25-50%
category. These results are quite different than those
obtained in the earlier study, and are not surprising since the
sample sizes in this research were 3 to 5 times larger for each
section, and responses were obtained from faculty at 64
different accredited schools across the United States. OO
analysis and Structured analysis are topics on which
instructors spend the most time, and are also the topics for
Journal of Information Systems Education, Vol. 22(4)
339

which there is the greatest disagreement regarding
importance. For those who teach structured analysis
concepts, a majority of instructors believe each topic to be
important. Similarly, for those who teach object oriented
analysis concepts, a majority of educators believe each topic
to be important. In the last 8 years since the Tastle and
Russell (2003) study, UML has joined the list of most
covered topics, but OO analysis and Structured analysis are
still most controversial in terms of time devoted to each, and
still have the most time devoted to their coverage.
Unified Modeling Language (UML) has become the
industry standard language for software blueprints (Castro, J.
F. B., Silva, C. T. L. L., and Mylopoulos, J., 2003; Dobing
and Parsons, 2006; Topi et al, 2010), which suggests that
future research should involve greater inclusion of UML.
Similarly, as Agile continues to increase in popularity (Cao,
Ramesh, and Abdel-Hamid, 2010), there should be a
concomitant increase in empirical studies that focus on
developing a better understanding about the degree to which
academics and practitioners make use of such methods.
Conversely, the greatest agreement among survey
respondents was associated with topics that, on the whole,
were perceived as less important and to which less class time
is devoted. These topics, which represent both structured
and OO topics, include the following: cost-benefit and
payback; file and database design; decomposition
diagramming; overview of various systems methodologies;
program design; normalization concepts; state-transition
diagramming.
Future research could provide an in depth analysis of
demographic differences as they pertain to each survey
question. Such differences could be investigated using the t-
test approach. Further research is necessary to determine
which SAD methodologies and techniques are most widely
used by IS practitioners, and further, the results of this study
should be compared with these industry requirements and
expectations. Although this study alone does not provide all
of the information necessary to make curriculum decisions or
modifications, such future and extended research will help to
provide a basis for sound decisions regarding IS curricula.
Importantly, systems development methodologies and tools
change and improve over time, creating an ever-increasing
need to look at the alignment of IS educational objectives
and IS industry requirements and specifications. The
question of whether curriculum gaps exist deserves attention
by researchers, as both academicians and practitioners will
benefit from these investigations. Further, such research is
necessary to support a sufficient knowledge alignment.
9. REFERENCES
Alreck, P. L. and Settle, R. B. (2004). “The Survey
Research Handbook (3rd ed.). New York: McGraw-
Hill/Irwin.
Anandarajan, M. and Lippert, S. K. (2006) “Competing
Mistresses? Academic vs. Practitioner Perceptions of
Systems Analysis,” Journal of Computer Information
Systems, Vol. 46, No. 5, pp. 114-126.
Bataveljic, P., Eastwood, M., and Seefried, H. (2006) “An
Approach to Teaching Object-Oriented Analysis and
Design,” Journal of Information Systems Education,
Vol. 17, No. 3, pp.267-271.
Batra, D. and Satzinger, J. W. (2006) “Contemporary
Approaches and Techniques for the Systems Analyst,”
Journal of Information Systems Education, Vol. 17, No.
3, pp.257-265.
Bureau of Labor Statistics. Occupational Outlook
Handbook. (2011), Retrieved May 1, 2011, from
http://www.bls.gov/oco/ocos287.htm.
Cao, L., Ramesh, B., and Abdel-Hamid, T. (2010)
“Modeling Dynamics in Agile Software Development,”
ACM Transactions on Management Information
Systems, Vol. 1, No. 1, Article 5, pp. 1-26.
Carte, T.A., Jasperson, J., and Cornelius, M.E. (2006)
“Integrating ERD and UML Concepts When Teaching
Data Modeling,” Journal of Information Systems
Education, Vol. 17, No. 1, pp. 55-63.
Castro, J. F. B., Silva, C. T. L. L., and Mylopoulos, J.
(2003) “Modeling Organizational Architectural Styles
in UML,” Advanced Information Systems Engineering
Book Series Title: Lecture Notes in Computer Science,
Vol. 2681, pp. 111-126.
Chen, P. (1976). “The Entity-Relationship Model –
Towards a Unified View of Data,” ACM Transactions
on Database Systems, Vol. 1. No. 1, pp. 9-36.
Chen, P. (1977) The Entity-Relationship Approach to
Logical Database Design. Wellesley, MA: Q.E.D.
Information Sciences.
Dobing, B. and Parsons, J. (2006) “How UML is used,”
Communications of the ACM, Vol. 45, No. 5, pp. 109-
113.
Downey, J. P., McMurtrey, M. E., and Zeltmann, S. M.
(2008) “Mapping the MIS Curriculum Based on
Critical Skills of New Graduates: An Empirical
Examination of IT Professionals,” Journal of
Information Systems Education, Vol. 19, No. 3, pp. 351-
363.
Golden, D. Matos, V. (2006) “Introducing the Unified
Modeling Language into the Information Systems
Curriculum,” Journal of Information Systems Education,
Vol 17, No. 1, pp. 83-92.
Hair, J., Black, W., Babin, B., and Anderson, R. (2010)
Multivariate Data Analysis, 7th Edition, Pearson
Education: Upper Saddle River, NJ.
Lind, D. A., Marchal, W. C., and Wathen, S.A., (2010)
Statistical Techniques in Business & Economics, 14th
Edition, Mc-Graw-Hill: New York, pp. 28.
Ng, P.A. (1981) “Further Analysis of the Entity-
Relationship Approach to Database Design,” IEEE
Transactions on Software Engineering, Vol. 7, No. 1,
pp. 85-99.
Shannon, C.E. (1948) “A Mathematical Theory of
Communication,” Bell System Technical Journal, Vol.
27, pp. 379–423, 623–656, July, October, 1948.
Shelly, G.B. and Rosenblatt, H. J. (2012) Systems
Analysis and Design, 9th edition, Course Technology:
Boston MA.
Siau, K. Erikson, J., and Lee, I. Y. (2005) “Theoretical vs.
Practical Complexity: The Case of UML,” Journal of
Database Management, Vol. 16, No. 3, pp.40-57.
Journal of Information Systems Education, Vol. 22(4)
340

Stevens, D., Totaro, M., and Zhu, Z. (2011, Spring)
“Assessing IT Critical Skills and Revising the MIS
Curriculum,” Journal of Computer Information
Systems, Vol. 51, No. 3 , pp. 85-95.
Suleiman, J. and Garfield, M.J. (2006) “Conceptual Data
Modeling in the Introductory Database Course: Is it
Time for UML?,” Journal of Information Systems
Education, Vol. 17, No. 1, pp. 93-99.
Tang, H., Lee, S. and Koh, S. (2000) “Educational Gaps
as Perceived by IS Educators: A Survey of Knowledge
and Skill Requirements,” Journal of Computer
Information Systems, Vol. 41, No. 2, pp. 76-84.
Tastle, W.J. and Russel, J. (2003). “Analysis and Design:
Assessing Actual and Desired Course Content,” Journal
of Information Systems Education, Vol. 4, No. 1, pp.
77-90.
Todd, P.A., McKeen, J.D., and Gallupe, R.B. (1995) “The
Evolution of IS Job Skills: A Content Analysis of IS
Job Advertisements from 1970 to 1990,” MIS Quarterly,
Vol. 19, No. 1, pp. 1-27
Topi, H., Valacich, J. S., Wright, R. T., Kaiser, K. M.,
Nunamaker, Jr., J.F., Sipior, J. C., and de Vreede, G. J.
(2010) “IS 2010 Curriculum Guidelines for
Undergraduate Programs in Information Systems,”
Association for Computing Machinery and Association
for Information Systems.
Wang, M. (2006) “Teaching ORDB with UML class
diagram in an Advanced Database Course,” Journal of
Information Systems Education, Vol.17, No. 1, pp.73-
82.
Valacich, J.S., George, J.F., Hoffer, J.A. (2009)
Essentials of Systems Analysis and Design, 4th Edition,
Pearson Prentice Hall: Upper Saddle River, NJ.
Whitten, J. L., and Bentley, L. D. (2008) Introduction to
Systems Analysis & Design, 1st Edition, McGraw-Hill
Irwin: New York, NY.
AUTHOR BIOGRAPHIES
Dr. Brandi N. Guidry is an Assistant Professor in the
Department of Business
Systems, Analysis, and
Technology at the University of
Louisiana at Lafayette. Her
primary research interests
include telecommunications
technologies, organizational
assessment initiatives, and
systems analysis and design
methodologies. She teaches
courses in systems analysis and
design, information systems and quantitative methods. Dr.
Guidry has published in such journals as Academy of
Management Journal, Small Business Institute Journal,
Public Personnel Management, Marketing Education
Review, Journal of Business Inquiry: Research, Education,
and Application, and Review of Business Research.
Dr. David Stevens is an Associate Professor in the
Department of Business
Systems, Analysis, and
Technology at the University of
Louisiana at Lafayette. His
primary research interests are in
mathematical optimization,
innovative teaching methods for
quantitative methods, and in
development of business
information systems. He has
worked as an information
technology consultant in aerospace, accounting,
pharmaceuticals, mortgage banking, and computer software
and hardware development for 25 years. His research has
appeared in Decision Sciences, Journal of Computer
Information Systems, Quality Engineering, Mortgage
Banking, Journal of Applied Radiology, and others.
Dr. Michael W. Totaro is an Assistant Professor in the
Department of Business Systems,
Analysis, and Technology at the
University of Louisiana at
Lafayette. He teaches courses in
database systems, business
intelligence, computer networks,
and management of information
technology. Dr. Totaro has
published in such journals as
Journal of Information Systems
Education, Journal of Computer
Information Systems, Journal of Informatics Education
Research, Journal of Applied Business Research,
International Business & Economics Research Journal,
Review of Business Information Systems, Review of
Accounting Information Systems, Human Systems
Management, and Educational Research Quarterly.
Journal of Information Systems Education, Vol. 22(4)
341

APPENDIX
Survey of Skills Perceived as Important in Systems Analysis and Design
1. Name of college/university (optional):
2. Which of the following most closely represents your current academic rank?:
(Professor, Associate Professor, Assistant Professor, Lecturer, Instructor, Adjunct Instructor, None of these)
3. For AACSB accreditation purposes, are you considered:
(Academically qualified (AQ), Professionally qualified (PQ), Unsure)
4. Have you ever taught the Systems Analysis & Design course? (Yes, No, Unsure)
5. The Systems Analysis & Design course is taught:
(Within the College (or School) of Business, Outside of the College of Business)
6. Level of Systems Analysis & Design course (or other similar course taught):
(Undergraduate, Graduate, Both Undergraduate and Graduate)
7. How long have you been teaching (to the nearest year) the Systems Analysis & Design course?
8. Gender (Female, Male, Prefer not to answer)
Note: In Sections I, II, and III, the number of survey responses for each answer category is also provided for those researchers
who are interested in entropy calculations.
Section I: Pick one course that most closely approximates the Systems Analysis & Design course. If you teach both
undergraduate and graduate, limit answers to the undergraduate course.
1. Have you ever taught the Systems Analysis and Design course? (If response is „yes‟, respondent sees remaining questions in
this section, otherwise survey is ended.)
In a given semester/term, what is the approximate percentage of time spent on each of these traditional Systems Analysis and
Design topics?
2. Structured analysis
none <5% 5-10% 11-15% 16-20% 21-25% 25-50% >= 50%
15 29 32 6 6 7 21 8
3. Object-oriented analysis
none <5% 5-10% 11-15% 16-20% 21-25% 25-50% >= 50%
13 30 31 10 8 7 10 15
4. Overview of the Systems Analysis process
none <5% 5-10% 11-15% 16-20% 21-25% 25-50% >= 50%
4 34 49 23 5 3 2 4
5. Project initiation and data collection analysis
none <5% 5-10% 11-15% 16-20% 21-25% 25-50% >= 50%
7 28 57 14 10 2 4 2
6. Project management concepts
none <5% 5-10% 11-15% 16-20% 21-25% 25-50% >= 50%
11 34 49 14 9 3 1 3
7. Overview of the various systems methodologies
none <5% 5-10% 11-15% 16-20% 21-25% 25-50% >= 50%
6 47 47 10 7 1 2 4
8. Data modeling (in general)
none <5% 5-10% 11-15% 16-20% 21-25% 25-50% >= 50%
16 32 43 14 7 4 5 3
9. Entity relationship diagramming
none <5% 5-10% 11-15% 16-20% 21-25% 25-50% >= 50%
24 40 28 18 7 2 3 2
Journal of Information Systems Education, Vol. 22(4)
342

10. Normalization concepts
none <5% 5-10% 11-15% 16-20% 21-25% 25-50% >= 50%
44 47 17 8 2 2 3 1
11. Process modeling (in general)
none <5% 5-10% 11-15% 16-20% 21-25% 25-50% >= 50%
12 28 31 27 12 3 8 3
12. Data flow diagramming
none <5% 5-10% 11-15% 16-20% 21-25% 25-50% >= 50%
26 23 29 27 8 2 7 2
13. Decomposition diagramming
none <5% 5-10% 11-15% 16-20% 21-25% 25-50% >= 50%
47 40 21 6 1 3 5 1
14. Use case
none <5% 5-10% 11-15% 16-20% 21-25% 25-50% >= 50%
12 36 32 20 9 8 5 2
15. UML
none <5% 5-10% 11-15% 16-20% 21-25% 25-50% >= 50%
20 41 16 12 9 8 11 7
16. Class diagramming
none <5% 5-10% 11-15% 16-20% 21-25% 25-50% >= 50%
31 36 22 15 5 8 4 3
17. Sequence diagramming
none <5% 5-10% 11-15% 16-20% 21-25% 25-50% >= 50%
34 37 31 9 2 5 3 3
18. State-transition diagramming
none <5% 5-10% 11-15% 16-20% 21-25% 25-50% >= 50%
50 46 13 7 3 2 0 3
19. Cost-benefit and payback analysis
none <5% 5-10% 11-15% 16-20% 21-25% 25-50% >= 50%
14 51 35 15 5 1 1 2
20. Systems design concepts
none <5% 5-10% 11-15% 16-20% 21-25% 25-50% >= 50%
6 39 32 18 15 5 3 6
21. Interface design
none <5% 5-10% 11-15% 16-20% 21-25% 25-50% >= 50%
14 46 33 17 8 3 2 1
22. File and database design
none <5% 5-10% 11-15% 16-20% 21-25% 25-50% >= 50%
33 49 27 4 4 1 4 2
23. Program design
none <5% 5-10% 11-15% 16-20% 21-25% 25-50% >= 50%
42 49 18 5 4 3 2 1
Journal of Information Systems Education, Vol. 22(4)
343

Section II: Those instructors who answer that they do teach structured analysis topics complete this section. All other instructors
skip to Section III.
24. Teaching data modeling concepts is:
Definitely Important Somewhat Important Undecided Somewhat
Unimportant
Definitely
Unimportant
49 24 4 8 3
25. Teaching students to draw entity relation diagrams is:
Def Important Somewhat Imp Undecided Somewhat Unimp Definitely Unimp
37 30 6 9 6
26. Teaching students to normalize a data model at least to 3rd normal form is:
Def Important Somewhat Imp Undecided Somewhat Unimp Definitely Unimp
31 27 7 14 9
27. Teaching students to draw a complete data flow diagram is:
Def Important Somewhat Imp Undecided Somewhat Unimp Definitely Unimp
49 32 2 3 2
28. Teaching students to balance a data flow diagram is:
Def Important Somewhat Imp Undecided Somewhat Unimp Definitely Unimp
37 31 10 8 2
29. Teaching students to draw a process hierarchy diagram is: (This question from the original survey was omitted based on
feedback from the pilot study which indicated this skill was more appropriate for an advanced course in systems analysis
and design.)
30. Teaching students to draw an activity dependency diagram is:
Def Important Somewhat Imp Undecided Somewhat Unimp Definitely Unimp
11 30 27 16 4
31. Teaching students to complete a project that requires the use of both data and process modeling skills is:
Def Important Somewhat Imp Undecided Somewhat Unimp Definitely Unimp
58 21 3 4 2
32. Requiring students to complete a project that requires project management skills is:
Def Important Somewhat Imp Undecided Somewhat Unimp Definitely Unimp
47 27 7 5 2
33. Requiring students to learn data collection, survey, and interviewing skills is:
Def Important Somewhat Imp Undecided Somewhat Unimp Definitely Unimp
38 34 5 8 3
34. Requiring students to complete a project as a team is:
Def Important Somewhat Imp Undecided Somewhat Unimp Definitely Unimp
60 20 4 2 2
35. Requiring students to actually exercise interviewing techniques is:
Def Important Somewhat Imp Undecided Somewhat Unimp Definitely Unimp
22 36 15 12 3
36. Requiring students to use a CASE tool to implement a business model is:
Def Important Somewhat Imp Undecided Somewhat Unimp Definitely Unimp
21 28 13 21 5
Journal of Information Systems Education, Vol. 22(4)
344

Section III: Those instructors who answer that they do teach object-oriented analysis complete this section. All other instructors
skip to Section IV.
37. Teaching students to use class diagramming is:
Def Important Somewhat Imp Undecided Somewhat Unimp Definitely Unimp
44 24 3 2 4
38. Teaching students to use sequence diagramming is:
Def Important Somewhat Imp Undecided Somewhat Unimp Definitely Unimp
32 30 7 5 3
39. Teaching students to use state-transaction diagramming is:
Def Important Somewhat Imp Undecided Somewhat Unimp Definitely Unimp
12 29 23 10 3
40. Requiring students to complete an entire object model using project management skills is:
Def Important Somewhat Imp Undecided Somewhat Unimp Definitely Unimp
27 30 10 8 2
41. Teaching students to perform cost-benefit analysis is:
Def Important Somewhat Imp Undecided Somewhat Unimp Definitely Unimp
23 39 6 7 2
42. Teaching students to use a model-based software tool to implement a design is:
Def Important Somewhat Imp Undecided Somewhat Unimp Definitely Unimp
26 18 17 11 5
Section IV: These questions deal with the use of CASE or model-based tools.
1. What CASE tool (e.g. MS Visio) or other model-based software do you use in
conjunction with your systems class?
2. Optional: Please provide any additional comments/feedback regarding this survey or
your teaching of the Systems Analysis & Design course here.
3. If you wish to receive a copy of the survey results, please provide your preferred
email address here.
Journal of Information Systems Education, Vol. 22(4)
345

Information Systems & Computing
Academic Professionals
STATEMENT OF PEER REVIEW INTEGRITY
All papers published in the Journal of Information Systems Education have undergone rigorous peer review. This includes an initial editor screening and double-blind refereeing by three or more expert referees.
Copyright ©2011 by the Information Systems & Computing Academic Professionals, Inc. (ISCAP). Permission to make digital or hard copies of all or part of this journal for personal or classroom use is granted without fee provided that copies are not made or distributed for profit or commercial use. All copies must bear this notice and full citation. Permission from the Editor is required to post to servers, redistribute to lists, or utilize in a for-profit or commercial use. Permission requests should be sent to the Editor-in-Chief, Journal of Information Systems Education, [email protected]. ISSN 1055-3096