the tamilnadu dr. m.g.r. medical university guindy,...
TRANSCRIPT
BIO-CHEMICAL STUDIES ON THE
HEPATOPROTECTIVE EFFECT OF ECLIPTA ALBA
AND PIPER LONGUM
Thesis Submitted To
THE TAMILNADU DR. M.G.R. MEDICAL UNIVERSITY
GUINDY, CHENNAI
As a partial fulfillment of the requirement for the award of the degree of
DOCTOR OF PHILOSOPHY
Submitted by
R. VASUKI, M.Sc.,
Under the supervision of
Prof. Dr. P. SAMUDRAM, M.Sc., M.Phil., Ph.D.
INSTITUTE OF BIOCHEMISTRY
MADRAS MEDICAL COLLEGE
CHENNAI – 600 003
INDIA
JANUARY - 2008

ACKNOWLEDGEMENT
My Ph.D. thesis is in the process of being bound. While I have not yet faced the
examiners, just completing such an ambitious project is a joy unto itself.
“The joy, satisfaction and euphoria that comes along with the successful
completion of any work would be incomplete unless we mention the names of the people
who made it possible, whose constant guidance and encouragement served as a beam of
light and crowned our efforts.”
First and foremost I would like to thank THE DIVINE for his grace which
fetched the strength and understanding to surmount the difficulties during the tenure of
my project work and enabled me to complete this herculean task during this journey.
I owe to my father Mr.A.M.Rajashekaran, my mother Mrs. R.Jayalakshmi, who
have stood as pillars of support in all my endeavors, whose love and care is always there
with me during all my difficult times. They are the source of my inspiration always
wishing the best for me from the core of their heart.
It is a great privilege for me to have worked under the guidance of
Dr. P. Samudram, M.Sc., M.Phil., Ph.D., for his constant encouragement, suggestions
and unflinching guidance. His knowledge and wide experience has been a motivating
force in moulding this research work.
My sincere thanks to Dr. T. P. Kalanithi, M.D., Dean, Madras Medical College
for giving me an Opportunity to carry out this research work.
My deepest and sincere thanks to Dr. A. Geetha, M.Sc., M.Phil., Ph.D., Co-
guide, Asst. Prof. Department of Biochemistry, Bharathi Women’s College, for her
continous support and invaluable guidance.
My heartfelt thanks to Dr. Pregna Dolia, M.D., Ph.D., Director, Institute of
Biochemistry for her great support and encouragement.
I wish to express my respect and gratitude to Prof. Dr. V. Ravichandiran, M.
Pharm., Ph.D., Principal, Vel’s college of pharmacy, for his valuable support and
encouragement. and for lending me all the facilities required to proceed my research work.
“Friendship is neither a formality nor a mode; it is rather a life”.
At this juncture, I would like to express my deep sense of gratitude to my beloved
friend Mrs. Rajeshwari Hari for her unforgettable help and encouragement.
I am very much thankful to my friend Mrs.Chanrapraba Rajesh for givn me
immense support throughout my research work
I am indebted to all my friends in Vel’s college of Pharmacy for their help.
I am thankful for the support rendered by Mr.gunasekaran, Mr.Hari and
Mr.Roosevelt,Department of Pharmaceutical analysis
I would like to Give special thanks to my friends Mrs.Vijey aanandhi M,
Dr.Shanmugasundaram P and Mr. Haribaskar, Department of pharmaceutical chemistry
for their moral support and guidance
It’s a pleasure in thanking Mr.Baskar K, Mrs.Umadevi SK, Department of
Pharmaceutics for their timely suggestions and encouragement.
I express my deep gratitude to Dr. V. Suba, Mr. J.Anbu, Dr.Nazir, Department
of Pharmacology, for their invaluable support.
I thank Mrs. Jeyakumari J,Mrs.Malarkodi V,Department of Pharmacognosy for
their support.
I express my hearty thanks to my better half Mr.P.Ramesh kumar for his
invaluable help and inspiration.
I owe my loving thanks to my cute little darlings , R.Yashika and R.Karan
kumar. Without their encouragement and understanding it would have been impossible
for me to finish this work.
Early in the process of completing this project, it became quite clear to me that a
researcher cannot complete a Ph.D. thesis alone. Although the list of individuals I wish
to thank extends beyond the limits of this format, I would like to thank all my friends for
their dedication, prayers, and support.
CONTENTS
INTRODUCTION - 1
AIMS AND OBJECTIVES - 26
REVIEW OF LITERATURE - 28
SCOPE AND PLAN OF WORK - 36
CHAPTER 1 - 40
CHAPTER 2 - 93
SUMMARY - 198
CONCLUSION - 204
REFERENCES -
DECLARATION
I hereby declare that the thesis, entitled “BIO-CHEMICAL
STUDIES ON THE HEPATOPROTECTIVE EFFECT OF ECLIPTA
ALBA AND PIPER LONGUM” is submitted to The Tamilnadu
Dr. M.G.R. Medical University in partial fulfillment of the requirements for
the award of degree of doctor of philosophy is the record of original research
work done by me under the supervision and guidance of
Prof. Dr. P. Samudram, Professor and Head, Department of Biochemistry,
Tagore Dental College & Hospital (Formerly Institute of Biochemistry
Madras Medical college) and the thesis has not formed the basis for the
award of any Degree, Diploma, Associateship, Fellowship or other similar
title.
Mrs. R. VASUKI
Date:
CERTIFICATE This is to certify that the thesis, entitled “BIO-CHEMICAL
STUDIES ON THE HEPATOPROTECTIVE EFFECT OF ECLIPTA
ALBA AND PIPER LONGUM” is submitted to The Tamilnadu
Dr. M.G.R. Medical University in partial fulfillment of the requirements
for the award of degree of doctor of philosophy is the record of
original research work done by Mrs. R. VASUKI, under my supervision
and guidance and the thesis has not formed the basis for the award of any
Degree, Diploma, Associateship, Fellowship or other similar title.
Prof. Dr. P. SAMUDRAM, M.Sc., M.Phil., Ph.D. Supervisor and Guide, Professor and Head
Department of Biochemistry Tagore Dental College & Hospital
Ratinamangalam, Chennai Tamil Nadu, India.
Date:

CERTIFICATE This is to certify that the thesis, entitled “BIO-CHEMICAL
STUDIES ON THE HEPATOPROTECTIVE EFFECT OF ECLIPTA
ALBA AND PIPER LONGUM” is submitted to The Tamilnadu Dr. M.G.R.
Medical University in partial fulfillment of the requirements for the award of
degree of doctor of philosophy is the record of original research
work done by Mrs. R. VASUKI, under my supervision and co- guidance
and the thesis has not formed the basis for the award of any Degree, Diploma,
Associateship, Fellowship or other similar title.
DR. A. GEETHA, M.SC., M.PHIL., PH.D., Co-guide, Asst. Prof. Department of biochemistry, Bharathi women’s college, Chennai
Date:
ABBREVIATIONS
ACE - Acetyl choline esterase
ACP - Acid phosphatase
ATP - Adenosine triphosphate
ALP - Alkaline phosphatase
ALT - Alanine amino transferase
ANSA - Aminonaphthol salicylic acid
AST - Alanine amino transferase
α - Alpha
β - Beta
BHT - Butylated hydroxyl toluene
CAT - Catalase
CCl4 - Carbon tetra choloride
CD - Conjucated diene
CDNB - 1-chloro, 2,4 dinitrobenzene
CHO - Cholesterol
dl - Decilitre
DNA - Deoxy ribonucleic acid oC - Degree celsius
DPPH - 2,4 dinitro Diphenyl hydrazine
DTNB - 5,5’ –Di thiobis (2nitro benzene)
EDTA - Ethylene diamine tetraacetic acid
g - Gram
GPX - Glutothione peroxidase
GR - Glutathione reductase
GSH - Reduced glutathione
GSSG - Oxidized glutathine
GST - Glutathione –s- transferase
HPLC - High performance liquid chromatography
hr - Hour
ICD - Iso citrate dehydrogenase
KG - Kilogram
L - Litre
LD50 - Lethal dose to kill 50% of animal
LDH - low density lipoprotein
LDL - Low- density lipoprotein
LOOH - Lipid hydro peroxide
LPO - Lipid peroxidation
M - Molarity
MDA - Malondialdehyde
µ - Microgram
µg - Microgram
µl - Microlitre mg - Milligram
min - Minute
ml - Milliliter
Mm - Millimole
N - Normality
NADP - Nicotineamide adenine dinucleotide phosphate
nm - nano moles
No - Nitric oxide
NOS - Nitric oxide species
OECD - Organization of Economic Co-operation and
Development
p.o - per oral
K+ - Potassium
ROS - Reactive oxygen species
SDS - Sodium Dodecyl sulphate
Se - Selenium
SEM - Standard Error Mean
SOD - Superoxide dismutase
TBA - Thiobarbituric acid
TBARS - Thiobarbituric acid reactive substances
TCA - Trichloro acetic acid
TG - Triglyceride
V/V - Volume / Volume
VLDL - Very low density lipoprotein
W/V - Weight / Volume
W/W - Weight / Weight
1
INTRODUCTION
The liver is the second largest and one of the most essential organs
which is located within the lower part of the rib-cage on the right hand side of
the body. It has a huge variety of functions in the body and is the only organ
that can repair and re-grow itself after damage. It is a seat of metabolism
which is responsible for performing many functions in the body. Bile juice
produced by liver gets secreted in the intestines which is required for the fat
digestion body. It also works as a guard by keeping check on the cholesterol
levels in the blood stream. It also produces certain proteins that are very much
required for performing ware and tear function in the body. It also works as
an energy store of the body thus providing energy when required in
emergency conditions
ANATOMY AND PHYSIOLOGY OF LIVER
The liver is a fairly large organ that consistently lies in the right upper
part of the abdomen. From front it has a roughly triangular shape. It stretches
from the right upper abdomen across the mid line to halfway across the left
upper abdomen (left lobe) and from the right upper abdomen to halfway down
the flank on the right (right lobe). Above the liver sits the right diaphragm and
the right lung, and below the liver is the intestines. The gall bladder nestles
directly below the liver and is attached to it. The gall bladder stores bile from
the liver to be squirted into the first part of the small bowel (duodenum) when
fat enters the intestine, to help emulsify the fat for absorption.
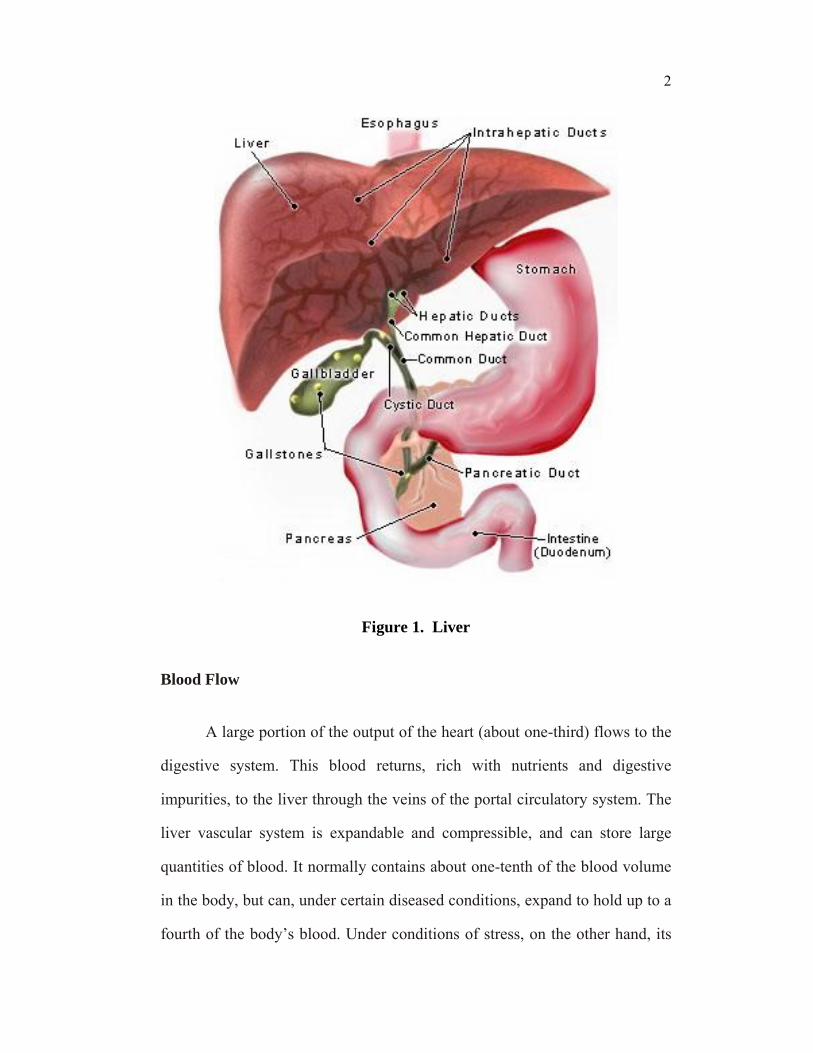
2
Figure 1. Liver
Blood Flow
A large portion of the output of the heart (about one-third) flows to the
digestive system. This blood returns, rich with nutrients and digestive
impurities, to the liver through the veins of the portal circulatory system. The
liver vascular system is expandable and compressible, and can store large
quantities of blood. It normally contains about one-tenth of the blood volume
in the body, but can, under certain diseased conditions, expand to hold up to a
fourth of the body’s blood. Under conditions of stress, on the other hand, its
3
veins can contract so it holds only a thirtieth of the body’s’ blood. Thus the
liver blood volume can potentially vary by a factor of more than seven. About
three-fourths of the blood coming into the liver comes from venous
circulation; only about a fourth comes directly from the heart through the
arteries. Arterial blood is moved under force, being pumped by the heart,
normally under pressure ten to fifteen times that of the blood in the portal
veins. Thus most of the blood in the liver is not moved through it by arterial
pressure and has a natural tendency to stagnate.
The liver is also extremely permeable to fluids, such that they flow
freely into its lymphatic system; the lymph derived from the liver accounts for
from one-half to two-thirds of the total lymph in the body. Finally, the liver
secretes bile into the small intestine, after storage in the gall bladder. Bile
helps to digest fat and is a key player in the symphonic action of the enzymes
and hormones that coordinate digestion. Thus the liver is an expandable and
contractible reservoir of blood, lymph, and bile. Because it has only weak
arterial circulation, these fluids have a tendency to become stagnant and the
liver to become congested.
FUNCTIONS OF LIVER
The liver has multiple functions. The liver processes all the blood
leaving the stomach and intestines. It breaks down the nutrients and drugs in
the blood into forms that are easier for the rest of the body to use or excrete.
Amongst other important functions, the liver is responsible for eliminating
and detoxifying the poisons that enter our blood stream.
4
The liver is also very important in the digestion of food and produces
bile which is essential in the breakdown of fats, thereby preventing obesity -
one of the biggest contributors to bad health. It also regulates blood sugar and
stores any excess sugar in a useful ‘quick-release’ form for when it is needed.
The liver clears the blood of old red blood cells, bacteria and other infectious
organisms as well as ingested toxins including alcohol. It is responsible for
producing a large number of different proteins including hormones and blood
clotting factors and is the organ which stores Vitamin A,D, E and K.
The functioning of liver does not really decrease with age so, in the
absence of disease, the liver should work optimally right into very old age -
helping to keep all body systems functioning normally and supporting overall
vitality and protection from illness. The maintenance of optimal liver
functioning is therefore of vital importance in the quest for holistic health In
traditional Chinese medicine, for example, a healthy liver is seen as the most
critical element in the body's ability to fight disease and function optimally.
LIVER DISEASES
Environmental pollution, fast foods, drugs, alcohol and sedentary
lifestyles all contribute to sluggish and diseased livers. The result of a
diseased liver are depressed immune systems, constant fatigue, obesity,
sluggish digestive systems, allergies, respiratory ailments, and unhealthy skin
among many other health problems. Alcohol and many pharmaceutical drugs
can affect the metabolism of the liver, and if this continues for long periods of
5
time, health will be endangered. A common sign of a damaged liver is
jaundice, a yellowness of the eyes and skin.
There are many diseases that may affect the liver and they include:
• Liver cancer
• Fatty liver
• Wilson’s disease
• Hepatitis
• Hemochromatosis
• Cirrhosis
Like other parts of our body, cancer can affect the liver. Cancer of the
liver (primary hepatocellular carcinoma or cholangiocarcinoma and metastatic
cancers, usually from other parts of the gastrointestinal tract.
Fatty liver is termed if lipids account for more than 5 percent of its
weight. The mechanisms for the development of fatty liver are varied. A
reduction in the hepatic oxidation of fatty acids as a result of mitochondrial
dysfunction can lead to micro vesicular steatosis. Another mechanism is
related to an imbalance between fat uptake and secretion, with high insulin-to-
glucagon ratio status leading to macro vesicular steatosis.
Wilson's disease, a hereditary disease which causes the body to retain
copper.
6
Hepatitis, inflammation of the liver, caused mainly by various viruses
like hepatitis A, hepatitis B and hepatitis C but also by some poisons,
autoimmunity or hereditary conditions.
Hepatitis A or infectious jaundice is caused by a picornavirus
transmitted by the fecal-oral route.It causes an acute form of hepatitis and
does not have a chronic stage. Worldwide, hepatitis B is another major cause
of cirrhosis and hepatocellular carcinoma. Many patients with hepatitis B
virus infection fail standard therapy. Hepatitis C virus infection is the leading
cause of chronic liver disease and the reason for 30 to 35 percent of liver
transplantations (Knolle et al., 1998; Zein et al., 1996).
Haemochromatosis, a hereditary disease causing the accumulation of
iron in the body, eventually leading to liver damage.
Cirrhosis is the formation of fibrous tissue in the liver, replacing dead
liver cells. The death of the liver cells can for example be caused by viral
hepatitis, alcoholism or contact with other liver-toxic chemicals.
In some liver diseases, such as primary biliary cirrhosis, treatment can
slow but not stop the progression of liver injury (Poupon et al., 1991).
Although each form of liver disease has a distinct natural history, most forms
progress slowly from hepatitis to cirrhosis, often over 20 to 40 years (Propst
et al., 1995).
7
Symptoms of a diseased liver
The external signs include a coated tongue, bad breath, skin rashes,
itchy skin, excessive sweating, offensive body odour, dark circles under the
eyes, red swollen and itchy eyes, acne rosacea, brownish spots and blemishes
on the skin, flushed facial appearance or excessive facial blood vessels. Other
symptoms include jaundice, dark urine, pale stool, bone loss, easy bleeding,
itching, small, spider-like blood vessels visible in the skin, enlarged spleen,
and fluid in the abdominal cavity, chills, pain from the biliary tract or
pancreas, and an enlarged gallbladder. The symptoms related to liver
dysfunction include both physical signs and a variety of symptoms related to
digestive problems, blood sugar problems, immune disorders, abnormal
absorption of fats, and metabolism problems.
EVALUATION OF DRUG TOXICITY
Most ingested substances are metabolized and chemically altered as
they pass through the liver. The liver is vulnerable to injury from some
medications, vitamins and herbal remedies (Speeg and Bay, 1995).
Prescription and over-the-counter arthritis and pain medications are widely
used. Nonsteroidal anti-inflammatory drugs (NSAIDs), which are taken to
alleviate headache and a variety of pain symptoms, can cause idiosyncratic
liver toxicity. Fatalities associated with NSAID use have been reported
(Carson and Willett, 1993). In one study, the use of ibuprofen was associated
with a more than 20-fold increase in liver function values in three patients
with hepatitis C virus infection (Riley and Smith, 1998). Acetaminophen has
8
predictable hepatotoxicity and affects the liver in a dose dependent manner.
However, acetaminophen hepatotoxicity has been reported with dosages of
less than 4 g per day, usually in association with starvation or alcohol
ingestion (Zimmerman and Maddrey, 1995).
HERBAL MEDICINES
Herbal drugs have become increasingly popular and their use is
widespread.
Ayurveda is accepted to be the oldest treatise on medical system,
which came into existence in about 900 BC. The word Ayurveda derived
from ‘Ayur’ meaning life and ‘veda’ meaning science.
Herbal medicines are prepared from a variety of plant materials-
leaves, stems, roots, bark and so on. They usually contain many biologically
active ingredients and are used primarily for treating mild or chronic ailments.
Naturopathic medicine, traditional Chinese medicine and Ayurvedic medicine
all differ in how diseases are diagnosed and which herbal remedies are
prescribed. Out of these, the Chinese herbal medicine or the Traditional
Chinese Medicine (TCM) has a potential usage similar to the Indian system of
medicine.
‘Ethanopharmacology’ have been recently defined as “the
interdisciplinary scientific exploration of biologically active agents
traditionally employed or observed by man”. The objectives of
ehanopharmacology are to rescue and document an important cultural heritage
9
before it is lost, and to investigate and evaluate the agents employed. Thus, it
plays an immense role in evaluation of natural products and more particularly
the herbal drugs from traditional and folklore resources. The random
screening of plants for food and medicine by our prehistoric ancestors is
probably the basis of the botanical pharmacopoeia that exists in virtually all
cultures. What of the future for plant based agents? There are many
possibilities for research, but priority should be given to tropical infectious
and chronic diseases for which current mediations have severe drawbacks,
and to the scientific appraisal of plant-based remedies that might be safer,
cheaper, and less toxic for self- medication than existing prescription
medicines. Man and perhaps some of his closer relatives, has always made
use of plants to treat illness, and many of these remedies have real beneficial
effects. Licensing regulations and pharmacovigilance regarding herbal
products are still incomplete and clear cut proof of their efficacy in liver
diseases is sparse.
There is clearly a need for greater education of patients and doctors
about herbal therapy, for legislation to control the quality of herbal
preparations, and in particular for further randomized controlled trials to
establish the value and safety of such preparations in Hepatic disorders.
EXPERIMENTAL HEPATOTOXICITY IN RATS
Carbon tetrachloride- induced hepatotoxicity
Animal studies have revealed that carbon tetra chloride is metabolized
in the liver by cytochrome P-450 (Sipes et al., 1977). One of the resulting
10
products of the metabolic activity is believed to be a trichloromethyl radical
that leads to the formation of chloroform, hexachloroethane, carbon
monoxide, trichloromethanol, phosgene and carbon dioxide. The radical is
thought to induce lipid peroxidation resulting in membrane destruction and
the loss of organelle and cell function (Rao and Recknagel, 1968).
Free radicals and hepatotoxocity
The cytochrome p-450 system is encased in phospholipids membrane
rich in polyenoic fatty acid. Hence these polyenoic fatty acids are the most
likely immediate target for the initial lipid per oxidative attack to occur. The
organic fatty acid radical rearranges, yielding organic peroxy and hydroxyl
peroxy radicals. The radical destroy the cytochrome p-450 hemoprotein, thus
compromising the mixed - function oxygenase activity. The rapid
decomposition of the endoplasmic reticulum and its function is a direct result
of this lipid peroxidative process (Zangar et al., 2000).
Trichloromethyl free radicals can react with sulfhydryl groups, such as
glutathione (GSH) and protein thiols, and the covalent binding of the
trichloromethyl free radicals to the cell proteins is considered to be the initial
step in a chain of events that eventually lead to membrane lipid peroxidation
and finally to cell necrosis (Recknagel et al., 1991). Several mechanisms have
been proposed for CCl4 induced fatty liver and necrosis. Important
mechanisms include damage to endoplasmic reticulum, mitochondria
lysosomes, disturbances in hepatocellular calcium homeostasis, and lipid
peroxidation. All are mediated by free radicals. Lipid peroxidation may be
11
looked upon as occurring in two steps. Some toxic event initiates lipid
peroxidation and organic free radical generated by the initiation process serve
to propagate the reaction.
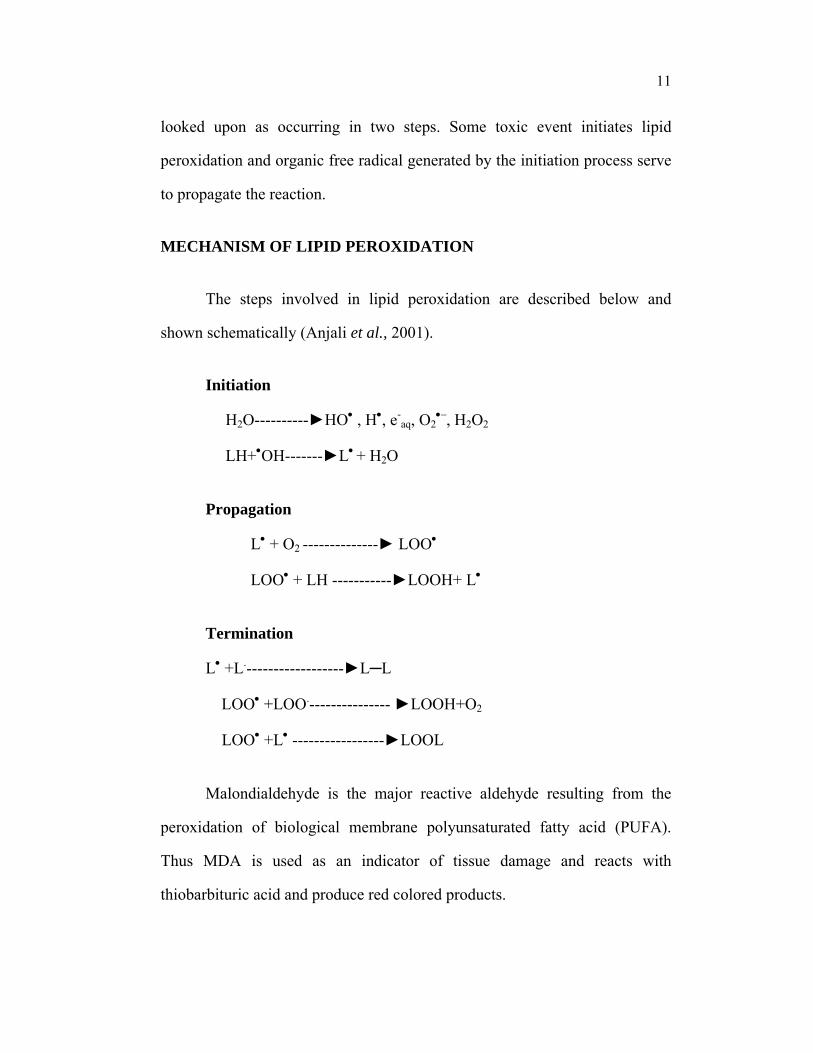
MECHANISM OF LIPID PEROXIDATION
The steps involved in lipid peroxidation are described below and
shown schematically (Anjali et al., 2001).
Initiation
H2O----------►HO• , H•, e-aq, O2
•–, H2O2
LH+•OH-------►L• + H2O
Propagation
L• + O2 --------------► LOO•
LOO• + LH -----------►LOOH+ L•
Termination
L• +L.------------------►L─L
LOO• +LOO.--------------- ►LOOH+O2
LOO• +L• -----------------►LOOL
Malondialdehyde is the major reactive aldehyde resulting from the
peroxidation of biological membrane polyunsaturated fatty acid (PUFA).
Thus MDA is used as an indicator of tissue damage and reacts with
thiobarbituric acid and produce red colored products.
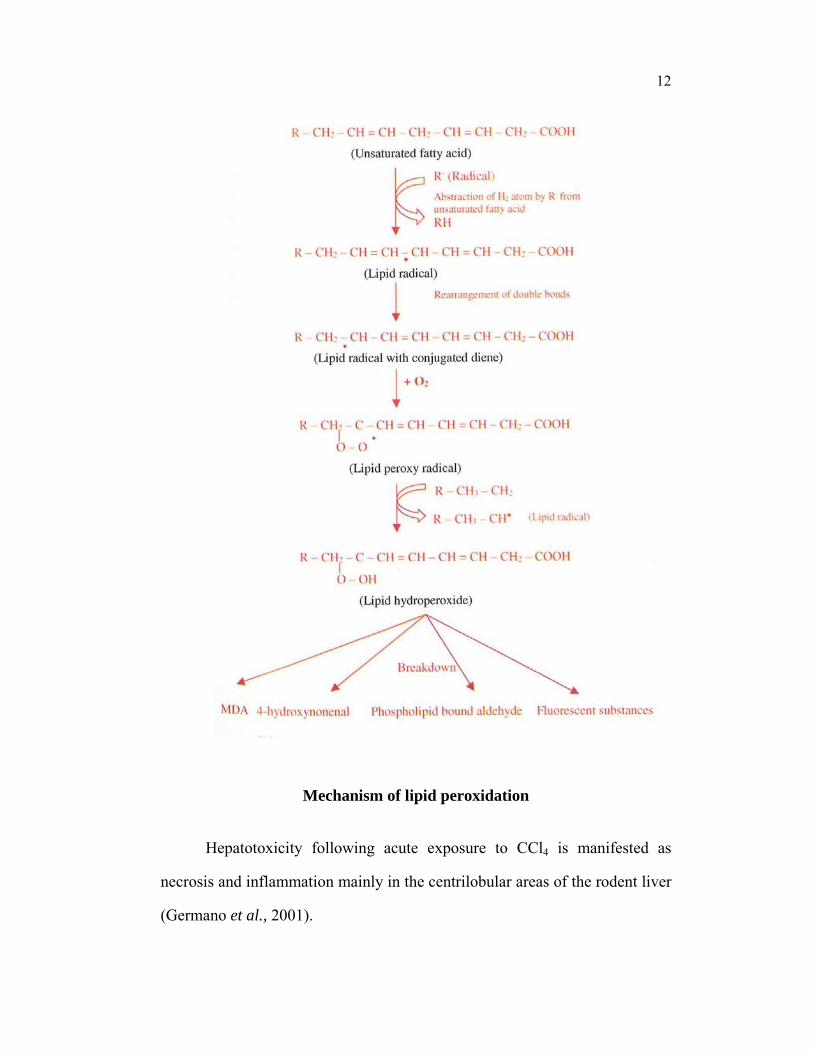
12
Mechanism of lipid peroxidation
Hepatotoxicity following acute exposure to CCl4 is manifested as
necrosis and inflammation mainly in the centrilobular areas of the rodent liver
(Germano et al., 2001).
13
The covalent binding of the radical to cell components initiates the
inhibition of lipoprotein secretion and thus steatosis, whereas reaction with
oxygen, to form •CCl3 initiates lipid peroxidation. The latter process results in
loss of calcium homeostasis and, ultimately, apoptosis and cell death. The
massive production of reactive species may lead to depletion of protective
physiological moieties (glutathione and α-tocopherol, etc.), ensuing
widespread propagation of the alkylation as well as peroxidation, causing
damage to the macromolecules in vital biomembranes (Aldridge, 1981). The
reactive species mediated hepatotoxicity can be effectively managed upon
administration of such agents possessing anti-oxidants (Attri et al., 2000), free
radical scavengers (Sadanobu et al., 1999) and anti-lipid peroxidation (Lim
et al., 2000).
Based on a pharmacokinetic model developed by (Paustenbach
et al., 1988) about 4% of the carbon tetrachloride that is metabolized is
converted to and excreted as carbon dioxide. The remaining metabolic
products may bind to proteins, lipids and DNA. The liver and kidney are
target organs for carbon tetrachloride toxicity. The severity of the effects on
the liver depends on a number of factors such as species susceptibility, route
and mode of exposure, diet or co-exposure to other compounds, in particular
ethanol. Furthermore, it appears that pretreatment with various compounds,
such as phenobarbital and vitamin A, enhances hepatotoxicity, while other
compounds, such as vitamin E, reduce the hepatotoxic action of carbon
tetrachloride.
14
REFERENCE DRUG
Silimarin
Silimarin is widely used as a standard hepatoprotective drug in many
liver disorders. The main effects of silymarin are the membrane stabilising
and antioxidant effects, it is able to help the liver cell regeneration, it can
decrease the inflammatory reaction, inhibit the fibro genesis in the liver and
the long administration of silymarin significantly increased the survival time
of patients with alcohol-induced liver cirrhosis (Fehér and Lengyel, 2008;)
Müzes et al., 1990) reported the antioxidant, antiperoxidative effects might be
important factors in the mechanism of hepatoprotective action of silymarin.
Silymarin prevents to a considerable degree the increase of the serum
enzymes (GOT, GPT, MDH, SDH, ICDH, AP) activity caused by a
D-galactosamine injury, enhances the metabolic conversion of the UDP-
hexosamine into UDP-acetylhexosamine in the liver and hastens the
normalizing of the UDP-glucuronic acid content in the liver of rats
(Tyutyulkova et al., 1981). Silymarin corrected the altered immunoreactions
and the decreased superoxide-dismutase (SOD) activity of erythrocytes and
lymphocytes in patients with alcoholic liver cirrhoses. The scavenger effect of
silymarin was demonstrated in the sub cellular fractions of liver cells in
animal experiments (Feher et al., 1989).
ECLIPTA ALBA
Eclipta alba Hassk. (Bhringaraja and Fam: Compositae) is a perennial
shrub, has a short, flat or round stem, deep brown in color which grows
15
widely in moist tropical countries. Different uses have been reported for this
shrub. It is used as alterative, anthelmintic, expectorant, antipyretic,
antiasthmatic, tonic, deobstruent in hepatic and spleen enlargement, in skin
diseases and as a substitute for Taraxacum (a popular liver tonic). It is good
for the diseases of spleen, stomatitis, toothache, hemicrania, fever, pain in
liver and cures vertigo (Yunani). Its juice in combination with honey is
administered for Catarrh and Jaundice (Chopra et al., 1996). Eclipta alba is
an indigenous medicinal plant, has a folk (Siddha and Ayurvedha) reputation
popularly used for the inflammation, anthelmintic, astringent, deobstruent and
hepatoprotective effect (Bhattachary et al., 1997).
Synonyms
• Eclipta erecta
• Eclipta prostrata
• Verbesina alba
• Verbesina prostrata
16
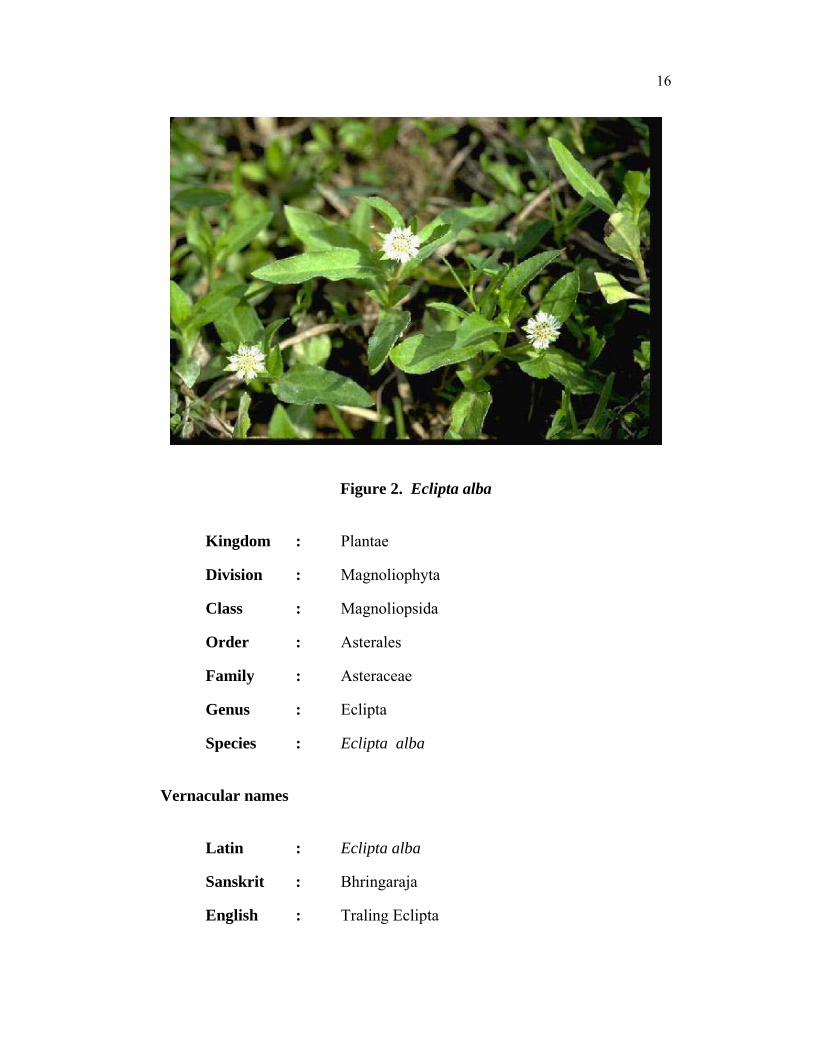
Figure 2. Eclipta alba
Kingdom : Plantae
Division : Magnoliophyta
Class : Magnoliopsida
Order : Asterales
Family : Asteraceae
Genus : Eclipta
Species : Eclipta alba
Vernacular names
Latin : Eclipta alba
Sanskrit : Bhringaraja
English : Traling Eclipta
17
Hindi : Balari,Bhangra,Bhringraj,Bhengra,Mochkand.
Gujarati : Bhangro,Dadhal,Kalobhangro
Canarase : Ajagara,Garagadasoppu,Kadigga-garaga
Marathi : Bhangra, Maka
Pharmacognostic characteristics
Trailing Eclipta is a small, erect or prostate many branched and a
coarsely haired annual herb. It grows upto 20cm in height. It has a round,
feeble stem, simple ecliptis hairy leaves, variable in shape, bright green in
color with very small flowers, called florets. The leaf epidermis is composed
of single layer of parenchymal cells with characteristic non-glandular
trichomes, on both surfaces. In transaction, the stem is circular in out line with
a ring of collateral endarch vascular bundles of varying sizes and central
parenchymatous pith. The root has a diarch structure with normal and
secondary growth.
The plant grows all over India, especially, in moist places, upto an
elevation of about 800 meters. An erect annual grows 10-15 cm in height,
with flat or round, blackish-chocolaty, much branched, pubescent stems. The
leaves are opposite, serrate, 3-5 cm long and blackish-green in color. The
flowers are small penny-sized, white, on a long stalk. The fruits are many
seeded and the seeds are black, resemble cumin seeds. The plant flowers in
September and fruits in November. Ayurvedic texts describe three varieties of
bhringaraja according to colors of flowers viz. white, yellow and blue. The
white variety is commonly used.
18
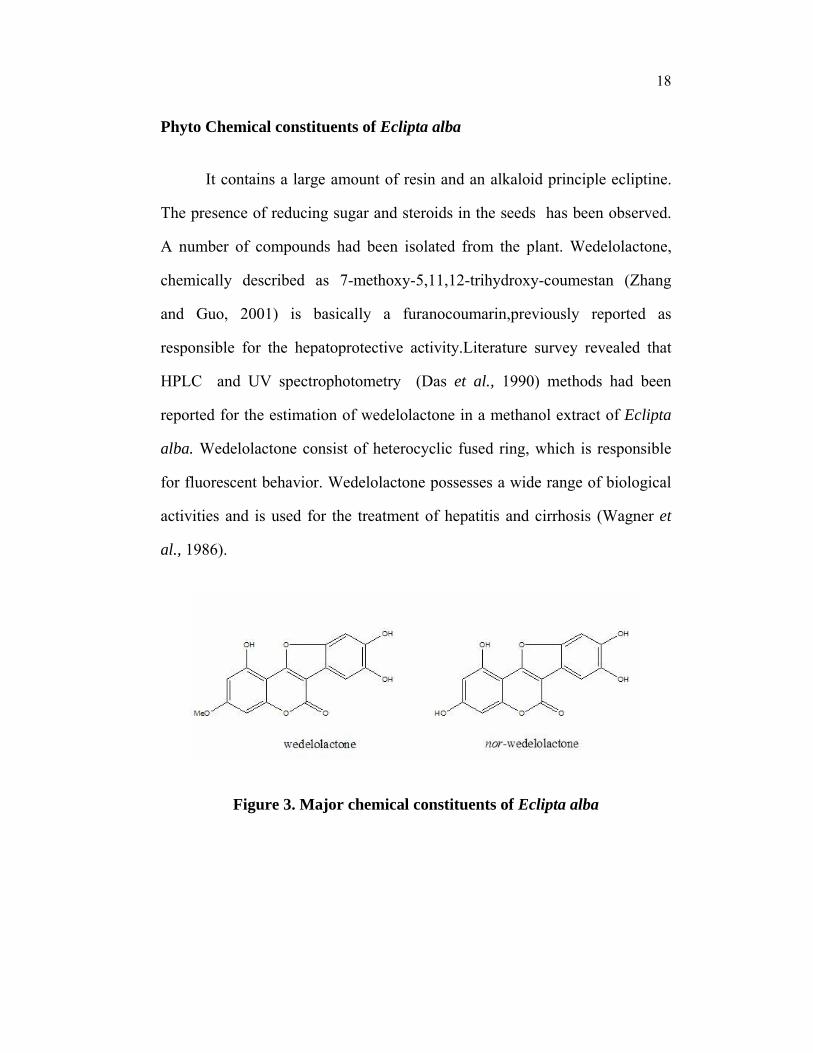
Phyto Chemical constituents of Eclipta alba
It contains a large amount of resin and an alkaloid principle ecliptine.
The presence of reducing sugar and steroids in the seeds has been observed.
A number of compounds had been isolated from the plant. Wedelolactone,
chemically described as 7-methoxy-5,11,12-trihydroxy-coumestan (Zhang
and Guo, 2001) is basically a furanocoumarin,previously reported as
responsible for the hepatoprotective activity.Literature survey revealed that
HPLC and UV spectrophotometry (Das et al., 1990) methods had been
reported for the estimation of wedelolactone in a methanol extract of Eclipta
alba. Wedelolactone consist of heterocyclic fused ring, which is responsible
for fluorescent behavior. Wedelolactone possesses a wide range of biological
activities and is used for the treatment of hepatitis and cirrhosis (Wagner et
al., 1986).
Figure 3. Major chemical constituents of Eclipta alba
19
Medicinal properties and uses
Juice of the leaves is a hepato tonic and deobstruent. Root is a tonic.
The herb is used in hepatic and spleen enlargements and in skin diseases.
Fresh juice obtained from leaves is given in fever, liver disorders and
rheumatism. A paste of the herb mixed with sesame oil is used over glandular
swellings, elephantiasis and skin diseases. In Gujarat district and Punjab, it is
used externally for ulcers and as an antiseptic for wounds in cattle. Recently
Chandra et al. (1987 have observed a significant anti-inflammatory activity of
the powder in rats. It has been reported to be useful in liver ailments (Handa
et al., 1986) and has been shown to possess hepatoprotective activity against
carbon-tetrachloride induced liver cell damage in animals. The plant is an
active ingredient of many herbal formulations prescribed for liver ailments
and shows effect on liver cell generation. There are also reports of clinical
improvement in the treatment of infective hepatitis (Dixit and Achar, 1979).
Eclipta alba leaves showed antihyperglycemic activity (Ananthi et al., 2003).
The roots of Eclipta alba were found effective in wound healing (Patil et al.,
2004). In vivo hepatoprotective activity of alcoholic extract (Saxena et al.,
1993; Singh et al., 2001) and analgesic study of total alkaloids of Eclipta alba
were also reported (Sawant et al., 2004).
Ayurvedic Properties
Bhringaraja is bitter in taste, pungent in the post digestive effect and
has hot potency (virya). It alleviates kapha and vata dosas. It possesses light
(laghu) and dry (roksa) attributes. It is a rejuvenator, tonic and beneficial to
eyes, hair and the skin (Kaiyadeva Nighantu)
20
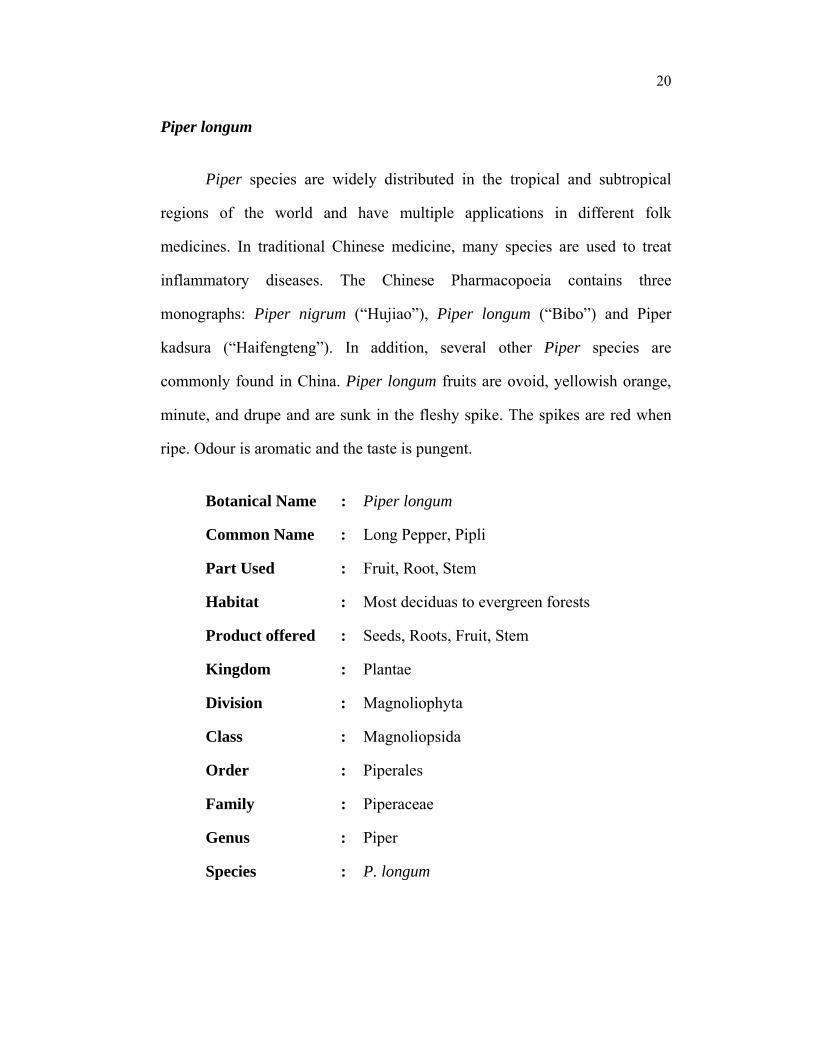
Piper longum
Piper species are widely distributed in the tropical and subtropical
regions of the world and have multiple applications in different folk
medicines. In traditional Chinese medicine, many species are used to treat
inflammatory diseases. The Chinese Pharmacopoeia contains three
monographs: Piper nigrum (“Hujiao”), Piper longum (“Bibo”) and Piper
kadsura (“Haifengteng”). In addition, several other Piper species are
commonly found in China. Piper longum fruits are ovoid, yellowish orange,
minute, and drupe and are sunk in the fleshy spike. The spikes are red when
ripe. Odour is aromatic and the taste is pungent.
Botanical Name : Piper longum
Common Name : Long Pepper, Pipli
Part Used : Fruit, Root, Stem
Habitat : Most deciduas to evergreen forests
Product offered : Seeds, Roots, Fruit, Stem
Kingdom : Plantae
Division : Magnoliophyta
Class : Magnoliopsida
Order : Piperales
Family : Piperaceae
Genus : Piper
Species : P. longum
21
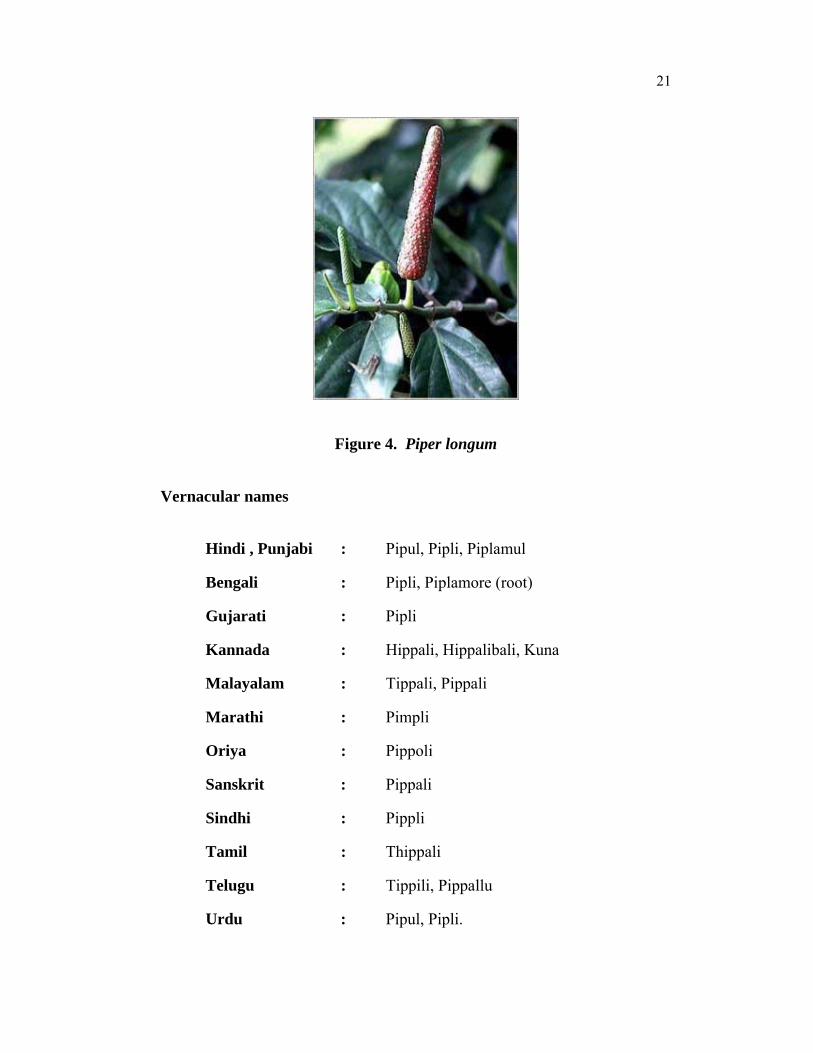
Figure 4. Piper longum
Vernacular names
Hindi , Punjabi : Pipul, Pipli, Piplamul
Bengali : Pipli, Piplamore (root)
Gujarati : Pipli
Kannada : Hippali, Hippalibali, Kuna
Malayalam : Tippali, Pippali
Marathi : Pimpli
Oriya : Pippoli
Sanskrit : Pippali
Sindhi : Pippli
Tamil : Thippali
Telugu : Tippili, Pippallu
Urdu : Pipul, Pipli.
22
Pharmacognostic characteristics
Pepper long is the dried fruit of Piper longum, which is a slender,
aromatic plant with creeping jointed stems and perennial woody roots. Leaves
numerous, lower one broadly ovate, very cordate with broad rounded lobes at
base, upper one oblong–oval, cordate at the base, all sub acute, entire glabours
thin, bullate with reticulate venation.
Phytochemical constituents
The fruits contain 1% volatile oil, resin, alkaloids piperine and
piperlonguminine, isobutyldeca-trans-2-trans-4-dienamide and a terpenoid
substance. Roots contain piperine, piperiongumine. Dihydrostigmasterol has
been isolated. It contains aromatic oil an alkaloid and pipalartine. Besides
this it contains sesamin and piplasterol. The root contains pipperin,
pippalartin, pipperleguminin, sterols and glycosides.
Medicinal properties and uses
Aromatic, stimulant, carminative, good for constipation, for gonorrhea,
paralysis of the tongue, advised in diarrhea, cholera, scarlatina, Chronic
Malaria and Viral hepatitis. Piper Longum is most commonly used to treat
respiratory infections such as stomach ache, bronchitis, diseases of the spleen,
cough, tumors, and asthma. When applied topically, it soothes and relieves
muscular pains and inflammation. In Ayurvedic medicine, it is said to be a
good rejuvenator. Piper longum helps to stimulate the appetite and it dispels
gas from the intestines. An infusion of Piper longum root is used after birth to
23
induce the expulsion of the placenta. It is used as sedative in insomnia and
epilepsy. Also as cholagogue in obstruction of bile duct and gall bladder.
Activity-guided fractionation of a methylene chloride soluble extract
led to the isolation of three known piperine-related compounds,
methylpiperate (1), guineensine (2), and piperlonguminine (3) of these,
methylpiperate (1) and guineensine (2) showed significant MAO inhibitory
activities (Lee et al., 2008).
Examination on the effects of several extracts of Piper longum L. on
rabbit platelet function showed Thromboxane A(2) receptor agonist U46619
caused rabbit platelet aggregation, which was potently inhibited by the
ethanol or butanol extract of Piper longum L. These results suggest that
Piper longum L. contains a constituent(s) that inhibits platelet aggregation as
a non-competitive thromboxane A(2) receptor antagonist (Iwashita et al.,
2007). Amides of known structures that contain four subtypes of amides were
rapidly determined, and novel amides were also identified for Piper longum.
Forty-two amides were rapidly identified, of which 22 were found in this
plant for the first time and 9 were new compounds (Sun et al., 2007).
Pullela et al. (2006) employed a systematic bioassay guided
fractionation method and isolated pipataline, pellitorine, sesamin,
brachystamide B and guineensine as active principles. A reversed-phase high-
performance liquid chromatography method was developed to quantify these
active principles in the plant material, which can serve as an effective quality
control tool. The extract of P. longum at non-toxic concentrations

24
(10 microg/ml, 5 microg/ml, 1 microg/ml) inhibited the VEGF-induced vessel
sprouting in rat aortic ring assay. Moreover, P. longum was able to inhibit the
VEGF-induced proliferation, cell migration and capillary-like tube formation
of primary cultured human endothelial cells. Hence, the observed
antiangiogenic activity of the plant P. longum is related to the regulation of
these cytokines and growth factors in angiogenesis-induced animals
(Sunila and Kuttan, 2006).
Piperine has been shown to enhance the bio-availability of structurally
and therapeutically diverse drugs, possibly by modulating membrane
dynamics, due to its easy partitioning and increasing permeability. Piperine
was evaluated and found to exert significant protection against tertiary butyl
hydroperoxide and carbon tetrachloride induced hepatotoxicity, by reducing
both in vitro and in vivo lipid peroxidation. Methyl piperine significantly
inhibited the elevation of total serum cholesterol, and the total cholesterol to
HDL-cholesterol ratio, in rats fed with a high cholesterol diet. Piper longum
Linn, an important medicinal plant belonging to the family piperaceae has
been used in traditional medicine by people in Asia and Pacific islands
especially in Indian medicine (Guido and David, 1998).
Piper longum is a component of medicines reported as good remedy
for treating gonorrhea, menstrual pain, tuberculosis, sleeping problems,
respiratory tract infections, chronic gut related pain and arthritic conditions
(Singh et al., 1992).
25
Piper longum possessed a demonstrable immunostimulatory activity,
both specific and nonspecific, as evident from the standard test parameters
such as haemagglutination titre (HA), plaque forming cell (PFC) counts,
macrophage migration index (MMI) and phagocytic index (Tripathi
et al., 1999). Three isolates of black pepper were active against Gram-positive
bacteria and moderately active against Gram-negative bacteria. Each isolate
was highly active against at least one particular species of bacteria; Piper
longuminine (1) against Bacillus subtilis, piperine (2) against Staphylococcus
aureus and pellitorine (3) against Bacillus sphaericus (Srinivasa Reddy et al.,
2001).

26
AIMS AND OBJECTIVES
Aim
The present investigation was aimed to determine the hepatoprotective
effect of the Biherbal extract (BHE), made up of equal proportions of
Melia azedarach leaves and Piper longum seeds in experimental animals with
CCl4 as hepatotoxic model. The hepatoprotective effect of the Biherbal extract
(BHE) was also compared with biological efficacy of individual plant
preparations.
Objective
The study was carried out in the following stages:
1. Preparation of the bi herbal ethanolic extract (BHE) of the leaves
of Melia azedarach and seeds of Piper longum and their
individual ethanolic extracts.
2. To assess the acute and chronic toxicity of BHE.
3. To determine the effective dose of the test drug which gives
optimum therapeutic effect.
4. To compare the hepatoprotective effect of BHE with the standard
drug silymarin.
5. To evaluate a tentative mechanism of action of the drug.

27
The objective also includes the
1. The determination of the major phytochemicals in the test extract
and HPTLC finger printing.
2. Quantitative analysis of macronutrients and minerals including
protein pattern by SDS-PAGE.
3. In vitro antioxidant studies of plant extracts.
4. In vitro DNA fragmentation study.
28
REVIEW OF LITERATURE
Research programs in India and china are active in the investigation of
their local medicinal plants, but little ethanopharmacological research has
been carried out for the ethnic groups who live in areas of maximum
biodiversity, where many plants of interest are likely to occur. Medicinal
herbs are significant source of pharmaceutical drugs. Latest trends have
shown increasing demand of phytodrugs and some medicinal herbs. The most
important classes of herbs for functional liver disease are cholagogues
(increase bile flow), choleretics (increasing bile production) and carminatives
(expelling gas and antispasmodic). Cholagogue plants usually have a bitter
flavor, and all bitter plants are cholagogic to some degree. Some important
traditional cholagogues are dandelion (Taraxacum officinalis), greater
celandine (Chelidonium majus), and wormwood (Artemesia absinthum). The
most commonly used herbs for liver problems include Phyllanthus, Milk
Thistle, Sho-saiko-to, Dandelion Root, Licorice Root, and Chicory root.
Phyllantus amarus in chronic hepatitis B, glycyrrhizin to treat chronic viral
hepatitis, and a number of herbal combinations from China and Japan that
deserve testing in appropriate studies.
Liver is often abused by environmental toxins, poor eating habits,
alcohol and over-the-counter drug use, that damage and weaken the liver
leading to important public health problems like hepatitis, cirrhosis and
alcoholic liver diseases (Treadway, 1998). These toxins generally lead to
pathologically distinct liver diseases in clinical practice, any or all of the three
29
conditions can occur together at the same time, in the same patient. These
three conditions are fatty liver, hepatitis, and Cirrhosis.Paracetamol and CCl4-
induced hepatic injuries are commonly used models for hepatoprotective drug
screening (Plaa Hewitt, 1982).
Abstinence from Alcohol
Alcohol consumption has been associated with alcoholic hepatitis, fatty
infiltration of the liver, accelerated progression of liver disease, a higher
frequency of cirrhosis, a higher incidence of hepatocellular carcinoma, and
death. The daily consumption of more than four drinks of alcohol increases
the risk of cirrhosis, as well as death from other causes (Thun et al., 1997;
Scheig, 1970). Investigators in one study (Corrao and Arico, 1998) found that
the effect of alcohol in patients with hepatitis C virus infection is not merely
additive but synergistic. The mechanism for the synergistic effect of alcohol
and hepatitis C virus is not fully understood, but it has been attributed to the
effects of alcohol on viral replication and the immune system, hepatic iron
content and hepatic regeneration.
Influence of Iron
As many as 30 percent of patients with liver disease have high serum
iron levels, and 10 percent have excessive amounts of iron in their liver tissue
(Riggio et al., 1997; Di Bisceglie et al., 1992). The most likely mechanisms
of liver injury from excess iron are increased generation of free radicals and
increased peroxidation of lipids, which, in turn, lead to mitochondrial
dysfunction, lysosomal fragility and cell death. Iron has recently been shown
30
to influence the natural history of hepatitis C virus infection and the response
of chronic hepatitis C to treatment (Olynyk et al., 1995; Van Thiel et al.,
1994). To date, no evidence suggest that dietary iron is harmful.
Diet and Exercise
One controlled study (Ueno et al., 199) demonstrated that a weight
reduction program (combined diet and exercise) can improve liver function
test results and liver histology in patients with nonalcoholic steatohepatitis.
With a weight loss of 4.5 to 6.8 kg (10 to 15 lb), liver transaminase levels
often return to normal. Investigators in another study (Deems et al., 199)
found a correlation between high fat and oil consumption and elevated liver
transaminase levels. The findings of these studies suggest that a low-fat diet
and exercise could minimize hepatic steatosis.
Liver protecting Herbs
Ayurveda remains one of the most ancient and yet living traditions
practiced widely in India, Sri Lanka and other countries and has a sound
philosophical and traditional basis (Chopra and Doiphode, 2002).
Atharvaveda (around 1200 BC), Charak Samhita and Sushrut Samhita.
(1000–500 BC) are the main classics that give detailed descriptions of over
700 herbs. Polyherbal formulations reputed to have hepatoprotective activity
that are available on the Indian market comprise about one hundred Indian
medicinal plants (Handa and Sharma, 1986).
31
Andrographis paniculata
For centuries Andrographis has been an important herb in the Asian
healing systems of Ayurveda, Unani and Traditional Chinese Medicine.
Traditionally this herb has been used to potentiate immune system response to
inflammation and infections, and as an anti-inflammatory, antipyretic (lowers
fevers) and a hepatoprotective (liver protector Andrographolide, the active
constituent isolated from the plant Andrographis paniculata showed a
significant dose dependent protective activity against paracetamol-induced
toxicity on ex vivo preparation of isolated rat hepatocytes (Visen et al., 1993).
Boerhavia diffusa (Punarnava)
An alcoholic extract of whole plant Boerhavia diffusa given orally
exhibited hepatoprotective activity against experimentally induced carbon
tetrachloride hepatotoxicity in rats and mice (Ansari et al., 1991).
Terminalia belerica (Baheda)
Compound I isolated from fraction TB5 of Terminalia belerica and
finally identified as 3,4,5-trihydroxy benzoic acid (gallic acid) was evaluated
for its hepatoprotective activity against carbon tetrachloride (CCl4) - induced
physiological and biochemical alterations in the liver. Administration of
compound I led to significant reversal of majority of the altered parameters
confirming the presence of hepatoprotective activity in Compound I
(Anand et al., 1997).

32
Picrorhiza kuroa (Katuki)
Picrorrhiza kurroa is one of the herbs they recommend to support the
liver not only in everyday situations, but in cases where severe viral infections
attack. Pre-treatment with picroliv prevented the hepatotoxic effects of
paracetamol and galactosamine as evidenced by various biochemical and
histopathological observations. Maximum hepatoprotective effect was
observed with daily oral doses of 6 and 12 mg/kg for 7 or 8 days. The
antihepatotoxic action of picroliv seems likely due to an alteration in the
biotransformation of the toxic substances resulting in decreased formation of
reactive metabolites (Ansari et al., 1991).
Taraxacum officinale
Traditionally Taraxacum officinale has been used as a remedy for
jaundice and other disorders of the liver and gallbladder, and as a remedy for
counteracting water retention. Generally, the roots of the plant have the most
activity regarding the liver and gallbladder. Oral administration of extracts
from the roots of Taraxacum officinale has been shown to act as a
cholagogue, increasing the flow of bile (Vogel, 1977). Bitter constituents like
taraxecerin and taraxcin are active constituents of the medicinal herb
(Cordatos, 1992).
Solanum nigrum
In Ayurveda, the drug is known as kakamachi. Aromatic water
extracted from the drug is widely prescribed by herbal vendors for liver

33
disorders. Although clinical documentation is scare as far as hepatoprotective
activity is concerned, but some traditional practitioners have reported
favorable results with powdered extract of the plant.
Wilkstroemia indica
W. indica is a Chinese herb and has been evaluated in patients
suffering from hepatitis B. A dicoumarin, daphnoretin is the active constituent
of the herb. The drug has shown to suppress HbsAG in Hep3B cells. It is said
to activator of protein kinase C (Chen et al., 1996).
Curcuma longa
Like silymarin, turmeric has been found to protect animal livers from a
variety of hepatotoxic substances, including carbon tetrachloride (Srinivas
and Shalini, 1991), galactosamine, pentobarbitol, 1-chloro-2, 4-
dinitrobenzene, 7 4-hydroxy-nonenal (Selvam et al., 1995) and paracetamol.
Diarylhepatonoids including Curcumin is the active constituent of the plant.
Milk Thistle (Silybum marianum)
The best studied herb for hepatitis and has been shown to help protect
and regenerate liver cells. There is no evidence of toxicity related to the pure
form of milk thistle, and there is weak evidence of a hepatocyte plasma cell
membrane protective effect. For these reasons, it is reasonable not to
discourage the use of milk thistle (Flora et al., 1998).
34
Piper longum
The isolated constituents and n- hexane extracts of Piper longum were
found to show varying degree of antibacterial activity against all the tested
bacteria (Lokhande et al., 2007). Administration of alcoholic extract of Piper
longum (10 mg/dose/animal) as well as piperine (1.14 mg/dose/animal) could
inhibit the solid tumor development in mice induced with DLA cells and
increase the life span of mice bearing Ehrlich ascites carcinoma tumor to 37.3
and 58.8%, respectively. Administration of Piper longum extract and piperine
increased the total WBC count to 142.8 and 138.9%, respectively, in Balb/c
mice (Sunila and Kuttan, 2004). Ethanol extract of Piper longum fruits and
five crude fractions, petroleum ether (40-60), solvent ether, ethyl acetate,
butanol and butanone were subjected to preliminary qualitative chemical
investigations. The ethanolic extract and all other fractions were screened
orally for hepatoprotective activity in adult Wistar rats. The ethanolic extract
and butanol fraction have shown significant activity, lowering the serum
enzymes glutamic oxaloacetic transaminase and glutamic pyruvic
transaminase in rats treated with carbon tetrachloride when compared to
control and Liv-52-treated rats (Jalalpure et al., 2003)
Eclipta alba
The drug is traditionally used against Jaundice (Mehra and Handa,
1968). As a reputed herbal medicine in the Ayurvedic and Unani system of
medicine, it is incorporated as a major ingredient in a number of Indian
antihepatotoxic phytopharmaceutical formulations. The herb of E. alba
35
contains coumestans, i.e. wedelolactone (W) and demethylwedelolactone
(DMW) possessing potent antihepatotoxic activity and is recommended for
the treatment of hepatitis and cirrhosis. It cure insomnia (Kulkarni, 1990). The
drug also showed antiviral activity in mice experimentally infected with
Semliki forest encephalitis virus (Singh, 1983). The drug also has been found
to be quite beneficial for treatment of jaundice when tested clinically in
children (Dixit and Achar, 1981).
36
SCOPE OF THE PRESENT INVESTIGATION
One of the vital organs of the human body, the liver performs essential
functions including detoxification and maintenance of normal immunity by
generating protective antibodies. Liver is susceptible to be encountered with
abnormal metabolites and toxins which are of endogenous and exogenous in
origin. Environmental pollution, drugs, chronic alcohol consumption,
pathogens and hereditary factors can be accounted for susceptibility of liver to
various diseases and results in functional deficiency.
Many liver protecting agents are consumed by people either to prevent
or to cure liver associated disorders. Allopathic medicines are being used to
save those patients by relieving them from the hazardous symptoms. But the
contraindication and limitations for their use also keep increasing due to age
and sex related side effects.
Since the time of its invention various medicinal plants have been
traditionally practised to cure liver diseases or to strengthen the vitality of the
organ. Many plants such as Silybum marianum (milk thistle), Picrorhiza
kurroa (kutkin), Curcuma longa (turmeric), Camellia sinensis (green tea) and
Glycyrrhiza glabra (licorice) have been clinically proved and patented.
India is one of the holistic countries, which believes in traditional
system of folklore medicines made up of medicinal plants. Both single plant
and formulation consisting of more than one plant are used in ayurvedic
system of medicine. Though many medicinal plants are widely used for liver
37
complaints the ever increasing problem of pollution and alcohol consumption
and thereby liver toxicity demands the screening and identification of new
plants which can be superior to allopathic medicines due to their less toxic
and cost effective nature.
Eclipta alba commonly known as False Daisy and bhringraj, is a plant
belonging to the family Asteraceae. Bhrngaraja is equally useful in many
diseases both, internally as well as externally. It is one of the best blood
purifiers, stimulates the liver and alleviates the general oedema all over the
body. Eclipta alba also has traditional external uses, like athlete foot, eczema
and dermatitis, on the scalp to address hair loss and the leaves have been used
in the treatment of scorpion stings. It is used as anti-venom against snakebite
in China and Brazil.
Piper longum an important medicinal plant belonging to the family of
Piperaceae also known as “Thippali” and used in traditional medicine by
many people in Asia and Pacific islands especially in Indian system of
medicine. Piper longum is a component of medicines reported as good
remedy for treating gonorrhea, menstrual pain, tuberculosis, sleeping
problems, respiratory tract infections, chronic gut related pain, and arthritic
conditions.
Traditional system of medicine, which is the only accessible health
care system for most of the population in rural areas, should be scientifically
evaluated so as to improve the clinical efficacy and safety.
38
Both E. alba and P. longum have immense therapeutic properties
especially for the treatment of liver related disorders. But the practice is only
at the traditional level because of the lack of experimental proof to standardise
the optimum dosage, efficacy and toxic effects.
The aim of the present study is to provide experimental proof for the
hepatoprotective efficacy of the ethanolic extracts of E. alba, P. longum and
the combined biherbal formulation made up of equal concentrations of E.alba
and P. longum. Polyherbal formulations are considered more effective than
the single drug and hence the biherbal formulation has been used in the study
and compared with the individual plants E. alba and P. longum.
The present investigation has been divided into two parts
The plants have been processed and screened for the
phytochemicals and tested for free radical scavenging
activities by using standard models in vitro.
The evaluation of non toxic dosage of test drugs by acute and
chronic toxicity in albino Wistar strain rat models according to
OECD guidelines. After assessing the dosage by acute and
chronic toxicity studies efficacy of the single and the biherbal
drugs have been ascertained by using CCl4 induced
hepatotoxicity model in rats. The hepatoprotective nature of
the drugs has been assessed by various biochemical
estimations and histological observations. Rats treated with
39
standard drug silymarin have also been utilised in this study to
compare the hepatoprotective efficacy of the test drugs.
The results of this study will throw more light on the mechanism of
action of the test drugs, which is hidden so far due to the lack of experimental
proof. It is sure that the out come of this study will result in the identification
of a new biherbal formulation, which can be used to treat liver disorders in
future.
REFERENCES
Aldridge WN. Mechanism of toxicity: new concepts are required in toxicology. Trends. Pharmacol Sci 1981; 2:228–23.
Anand KK, Singh B, Saxena AK, Chandan BK, Gupta VN, Bhardwaj V. 3,4,5-Trihydroxy bezoic acid (gallic acid), the hepatoprotective principle in the fruits of Terminalia belerica-bioassay guided activity. Pharmacol Res 1997 Oct; 36(4):315-321.
Ananthi A, Prakasam A, Pugalendi KV. Antihyperglycemic activity of Eclipta alba leaf on alloxan-induced diabetic rats. Yale J Biol Med 2003;76(3):97-102.
Anjali k, Kale RK. Radiation induced peroxidative damage: mechanism and significance. Ind Jn Exp Biol 2001;39:291-309.
Ansari RA, Tripathi SC, Patnaik GK, Dhawan BN. Antihepatotoxic properties of picroliv: an active fraction from rhizomes of Picrorhiza kurrooa. J Ethnopharmacol 1991 Aug; 34(1): 61-8.
Attri S, Rana SV, Vaiphei K, Sodhi CP, Katyal R, Nain RC, Goel CK, Singh K. Isoniazid- and rifampicin-induced oxidative hepatic injury-protection by N-acetylcysteine. Hum Exp Toxicol 2000;19:517–522.
Bhattachary SK, Chakrabarti A. Effect of trasina, an Ayurvedic herbal formulation,on pancreatic islet superoxide dismutase activity in hyperglycemic rats. Indian J Expl Biol 1997;35:297-9.
Carson JL, Willett LR. Toxicity of nonsteroidal anti-inflammatory drugs. An overview of the epidemiological evidence. Drugs 1993;46:243-8.
Chandra T,Sadique J, Soma Sundram S. Effect of Eclipta alba on inflammation and liver injury. Fitoterapia 1987;58(1):23-32.
Chen HC, Chou CK, Kuo YH, Yeh SF. Identification of a protein kinase C (PKC) activator, dephnoretin, that suppresses hepatitis B virus gene expression in human hepatoma cells. Biochem Pharmacol 1996; 52:1025-1032.

Chopra A, Doiphode V. Ayurvedic medicine: Core concept, therapeutic principles, and current relevance. Med Clin North Am 2002;86:75-89.
Chopra RN, Nayar SL, Chopra IC. Glossary of medicinal plants. New Delhi: CSIR Publication; 1966.p104.
Cordatos E. Taraxacum officinale. In: Murray M, Pizzorno J, eds. A Textbook of Natural Medicine. Seattle: Bastyr University press; 1992.
Corrao G, Arico S. Independent and combined action of hepatitis C virus infection and alcohol consumption on the risk of symptomatic liver cirrhosis. Hepatology 1998;27:914-9.
Das N, Bhavsar GC, Chauhan MG. Spectrophotometric estimation of wedelolactone in Eclipta alba. Indian Drugs 1990; 28(2): 100.
Deems RO, Friedman LS, Friedman MI, Munoz SJ, Deems DA, Maddrey WC. Relationship between liver biochemical tests and dietary intake in patients with liver disease. J Clin Gastroenterol 1994;18:304-8.
Di Bisceglie AM, Axiotis CA, Hoofnagle JH, Bacon BR. Measurements of iron status in patients with chronic hepatitis. Gastroenterology 1992;102: 2108-13.
Dixit SP, Achar MP. Study of Bhringaraja (Eclipta alba) therapy in jaundice in children. J Sci Res Plants Med 1981;2:96-101.
Dixit SP,Achar MP. Bhringaraj in the treatment of infective hepatitis. Cur Med Pract 1979; 23(6): 237-242.
Fehér J, Cornides A, Pál J, Láng I, Csomós G. Liver cell protection in toxic liver lesion. Acta Physiol Hung 1989;73(2-3):285-91
Fehér J, Lengyel G. Silymarin in the treatment of chronic liver diseases: past and future. Orv Hetil 2008 Dec 21;149(51):2419-24.
Flora K, Hahn M, Rosen H, Benner K. Milk thistle (Silybum marianum) for the therapy of liver disease. Am J Gastroenterol 1998;93:139-43.
Germano MP, D’angelo V, Sanogo R, Morabito S, Pergolizzi S, De-Pasqule R. Hepatoprotective activity of Trichilia roka on carbon tetrachloride induced liver damage in rats. J Pharm Pharmacol 2001;53:1569–74.

Guido S, David J. Influence of piperine on the pharmacokinetics of curcumin in animals and human volunteers. Planta Med 1998;64:353-356.
Handa SS, Sharma A, Chakarborty KK. Natural Products and plants as liver protecting drugs. Fitoterapia 1986;57(5):307-51
Handa SS, Sharma A.Hepatoprotective activity of andrographolide from Andrographis paniculata against carbon tetrachloride. Indian J Med Res 1986;92:276-283.
Iwashita M, Saito M, Yamaguchi Y, Takagaki R, Nakahata N.Inhibitory effect of ethanol extract of Piper longum L. on rabbit platelet aggregation through antagonizing thromboxane A2 receptor. Biol Pharm Bull 2007 Jul;30(7):1221-5.
Jalalpure SS, Patil MB, Prakash NS, Hemalata K, Manvi FV.Hepatoprotective activity of the fruits of piper longum linn, Indian Journal of Pharmaceutical Sciences 2003; 65(4): 363-366.
Knolle PA, Kremp S, Hohler T, Krummenauer F, Schirmacher P, Gerken G. Viral and host factors in the prediction of response to interferon-alpha therapy in chronic hepatitis C after long-term follow-up. J Viral Hepat 1998; 5:399-406.
Kulkarni PH. Ayurvedic therapy: Insomnia. Deerghayu Int 1990;6:21.
Lee SA, Hwang JS, Han XH, Lee C, Lee MH, Choe SG, Hong SS, Lee D, Lee MK, Hwang BY.Methylpiperate derivatives from Piper longum and their inhibition of monoamine oxidase Arch Pharm Res 2008 Jun;31(6):679-83.
Lim HK, Kim HS, Choi HS, Oh S, Jang CG, Choi J, Kim SH, Chang MJ. Effects of acetylbergenin against d-galactosamine-induced hepatotoxicity in rats. Pharmacol Res 2000;42:471–474.
Lokhande PD, Gawai KR, Kodam KM, Kuchekar BS, Chabukswar AR, Jagdale SC. Antibacterial activity of extracts of Piper longum. J Pharmacol Toxicol Methods 2007;2(6):574-579.
Mehra PN, Handa SS. Pharmacognosy of Bhringraja - antihepato-toxic drug of Indian origin. Ind J Pharm 1968;30:284.
Müzes G, Deák G, Láng I, Nékám K, Niederland V, Fehér J. Effect of silimarin (Legalon) therapy on the antioxidant defense mechanism and lipid peroxidation in alcoholic liver disease (double blind protocol). Orv Hetil 1990 Apr 22;131(16):863-6.
Olynyk JK, Reddy KR, Di Bisceglie AM, Jeffers LJ, Parker TI, Radick JL, et al. Hepatic iron concentration as a predictor of response to interferon alfa therapy in chronic hepatitis C. Gastroenterology 1995;108:1104-9.
Patil MP, Jalalpure SS, Nagoor VS. Woundhealing activity of the roots of Eclipta alba Linn. Indian drugs 2004; 41 (1): 40-45.
Paustenbach DJ, Clewell HJ, Gargas ML, Andersen ME. A physiologically based pharmacokinetic model for inhaled carbon tetrachloride. Toxicol Appl Pharmacol 1988; 96:191-211.
Plaa GL, Hewitt HR. Quantitative evaluation of indices of hepatotoxicity. In: Toxicology of the Liver. New York: Raven Press ;1992.p.103–12.
Poupon RE, Balkau B, Eschwege E, Poupon R. A multicenter controlled trial of ursodiol for the treatment of primary biliary cirrhosis. UDCA-PBC Study Group. N Engl J Med 1991;324:1548-54.
Propst A, Propst T, Zangerl G, Ofner D, Judmaier G, Vogel W. Prognosis and life expectancy in chronic liver disease. Dig Dis Sci 1995;40:1805-15.
Pullela SV, Tiwari AK, Vanka US, Vummenthula A, Tatipaka HB, Dasari KR, Khan IA, Janaswamy MR.HPLC assisted chemobiological standardization of alpha-glucosidase-I enzyme inhibitory constituents from Piper longum Linn-An Indian medicinal plant. J Ethnopharmacol 2006 Dec 6;108(3):445-9.
Rao KS, Recknagel RO. Early onset of lipoperoxidation in rat liver after carbon tetrachloride administration. Exp Mol Path 1968;9: 271-278.
Recknagel RO, Glende Jr. EA, Britton RS. Free radical damage and lipid peroxidation. In: Meeks, R.G. (Ed.), Hepatotoxicology: Florida: CRC Press; 1991.p 401–436.
Riggio O, Montagnese F, Fiore P, Folino S, Giambartolomei S, Gandin C, et al. Iron overload in patients with chronic viral hepatitis: how common is it? Am J Gastroenterol 1997;92:1298-1301.
Riley TR, Smith JP. Ibuprofen-induced hepatotoxicity in patients with chronic hepatitis C: a case series. Am J Gastroenterol 1998;93:1563-5.
Sadanobu S, Watanabe M, Nakamura C, Tezuka M. In vitro tests of 1,3-dithia-2thioxo-cyclopent-4-ene to evaluate the mechanisms of its hepatoprotective action. J Toxicol Sci 1999; 24:375–81.
Sawant M, Issac JC, Narayanan S. Analgesic studies on total alkaloids and alcohol extracts of Eclipta alba (Linn.) Hassk. Phytother Res 2004;18 (2):111-113.
Saxena AK, Singh B, Anand KK.Hepatoprotective effects of Eclipta alba on subcellular levels in rats. J Ethnopharmacol 1993; 40(3):155-6.
Scheig R. Effects of ethanol on the liver. Am J Clin Nutr 1970;23:467-73.
Selvam R, Subramanian L, Gayathri R, Angayarkanni N. The anti-oxidant activity of turmeric (Curcuma longa). J Ethnopharmacol 1995; 47:59-67.
Singh B, Saxena AK, Chandran BK, Agrawal SG, Anand KK. In vivo hepatoprotective activity of active fraction from ethanolic extract of Eclipta alba leaves. Indian J Physiol Pharmacol 2001; 45(4): 435-41.
Singh VK, George CX, Gupta KP, Gupta BM. Antiviral activity of plant extract Liv. 52 in mice experimentally infected with semliki forest eccephalitis virus. Sci Culture; 1983;49:354.
Singh Y N. Kava an overview. J Ethanopharmacol 1992;37:18-45.
Sipes IG, Krishna G, Gillette JR. Bioactivation of carbon tetrachloride, chloroform and bromotrichloromethane: Role of cytochrome p-450. Life Sci 1977;20:1541-1548.
Speeg KV, Bay MK. Prevention and treatment of drug-induced liver disease. Gastroenterol Clin North Am 1995;24:1047-64.
Srinivas L, Shalini VK. DNA damage by smoke: Protection by turmeric and other inhibitors of ROS. Free Radical Biol Med 1991; 11:277-283.

Srinivasa Reddy P, Jamil K, Madhusudhan P, Anjani G, Das B. Antibacterial Activity of Isolates from Piper longum and Taxus baccata. Pharma Biol 2001 Jun;39(3):236-238.
Sun C, Pei S, Pan Y, Shen Z.Rapid structural determination of amides in Piper longum by high-performance liquid chromatography combined with ion trap mass spectrometry. Rapid Commun Mass Spectrom 2007;21(9):1497-503.
Sunila ES, Kuttan G.Immunomodulatory and antitumor activity of Piper longum Linn. and piperine. J Ethnopharmacol 2004 Feb;90(2-3):339-46.
Sunila ES, Kuttan G.Piper longum inhibits VEGF and proinflammatory cytokines and tumor-induced angiogenesis in C57BL/6 mice. Int Immunopharmacol 2006 May;6(5):733-41.
Thun MJ, Peto R, Lopez AD, Monaco JH, Henley SJ, Heath CW, et al. Alcohol consumption and mortality among middle-aged and elderly U.S. adults. N Engl J Med 1997;337:1705-14.
Treadway S. An Ayurvedhic approach to a healthy liver. Clin. Nutrition Insights 1998; 16:1-4.
Tripathi DM, Gupta N, Lakshmi V, Saxena KC, Agrawal AK. Antigiardial and immunostimulatory effect of Piper longum on giardiasis due to Giardia lamblia. Phytother Res 1999 Nov;13( 7):561-565.
Tyutyulkova N, Tuneva S, Gorantcheva U, Tanev G, Zhivkov V, Chelibonova-Lorer H. Hepatoprotective effect of silymarin (carsil) on liver of D-galactosamine treated rats. Biochemical and morphological investigation. Exp Clin Pharmacol 1981 Mar-Apr;3(2):71-7
Ueno T, Sugawara H, Sujaku K, Hashimoto O, Tsuji R, Tamaki S, et al. Therapeutic effects of restricted diet and exercise in obese patients with fatty liver. J Hepatol 1997;27:103-7.
Van Thiel DH, Friedlander L, Fagiuoli S, Wright HI, Irish W, Gavaler JS. Response to interferon alpha therapy is influenced by the iron content of the liver. J Hepatol 1994;20:410-5.
Visen PK, Shukla B, Patnaik GK, Dhawan BN. Andrographolide protects rat hepatocytes against paracetamol-induced damage. J Ethnopharmacol 1993 Oct;40(2):131-136.
Vogel G. Natural substances with effects on the liver. In: Wagner H, Wolff P, eds. New Natural Products and Plant Drugs with Pharmacological, Biological or Therapeutic Activity. Heidelberg: Springer-Verlag; 1977.
Wagner H, Geyer B, Kiso Y, Hikino H, Rao GS.Coumestans as the Main Active Principles of the Liver Drugs Eclipta alba and Wedelia calendulacea1. Planta Med 1986 Oct;52(5):370-374.
Zangar RC, Benson JM, Burnett VL, Springer DL. Cytochrome P450 2E1 is the primary enzyme responsible for low-dose carbon tetrachloride metabolism in human liver microsomes. Chem Biol Interact 2000; 125: 233–243.
Zein NN, Rakela J, Krawitt EL, Reddy KR, Tominaga T, Persing DH. Hepatitis C virus genotypes in the United States: epidemiology, pathogenicity, and response to interferon therapy. Collaborative Study Group. Ann Intern Med 1996;125:634-9.
Zhang JS, Guo QM. Studies on the chemical constituents of Eclipta prostrata (L). Yao Xue Xue Bao 2001;36(1):34-37.
Zimmerman HJ, Maddrey WC. Acetaminophen (paracetamol) hepatotoxicity with regular intake of alcohol: analysis of instances of therapeutic misadventure. Hepatology 1995;22:767-73.
40
PHYTOCHEMICAL STUDIES ON ECLIPTA ALBA AND
PIPER LONGUM
INTRODUCTION
Plants are considered to be medicinal if they possess pharmacological
activities of possible therapeutic use. These activities are often known as a
result of millennia of trial and error, but they have to be carefully investigated
if we wish to develop new drugs that meet the criteria of modern treatment.
Compared with the experience of most modern drugs, the human use and
approval of most herbal remedies is awesome.
The requirement by the medical and scientific establishment for
research to prove that herbs are effective is not found among the population at
large. It is apparent that most ordinary people are content to rely on their
impressions of the world to get by it. Judging by the substantial markets for
herbal products in the developed world, let alone the vast use in traditional
cultures, a great many people have already found herbal medicines useful.
The relationship between man and plants has been very close throughout the
development of human cultures. It can be recalled that herbal therapy aims to
support vital functions of human body.
The role of compounds such as flavonoids and others with activities
such as antioxidation and free radical scavenging is largely unknown but
could be important in the prevention of chronic inflammatory diseases and
cancer (Kinghorn, 1993).

41
The need to document plant usage and to attempt to confirm their
efficacy remains urgent and must be undertaken with same rigour, as would
any other scientific study.
Considering the above facts, the present research work has been carried
out to evaluate the hepatoprotecive action of the combined ethanolic extract of
leaves of Eclipta alba and the seed of Piper longum (BHE)
In Ayurveda the plant Eclipta alba is considered a rasayana for
longevity and rejuvenation. Recent studies have shown that it has a profound
antihepatotoxic activity
Piper longum Linn, an important medicinal plant belonging to the
family piperaceae has been used in traditional medicine by people in Asia and
Pacific islands especially in Indian medicine
Plant Collection and Authentication
The leaves of Eclipta alba and seeds of Piper longum were collected
from the IMPCOPS (Indian Medical practioners co-operative society),
Thiruvanmiyur Chennai, India and were authenticated by
Dr.P.T.Kalaichelvan, Professor, Advanced Studies in Botany, University of
Madras, Chennai, India. The voucher specimen is available in the herbarium
file of the Indian Medical practitioners co-operative society, Thiruvanmiyur,
Chennai, India.
42
EXTRACTION
Preparation of Eclipta alba extract (EAE)
The leaves of Eclipta alba (1 kg) were shade-dried and pulverized to a
coarse powder. The powder was passed through 40-mesh sieve and
exhaustively extracted with ethyl acetate in soxhlet apparatus at 60oC. The
residue left after ethanol extraction was dried and extracted successively with
chloroform and ethanol. The extracts were evaporated under reduced pressure
using rota flash evaporator till all the solvent had been removed and extract
was stored in refrigerator for further use. All these extracts were subjected to
HPTLC finger printing analysis. The ethanolic extract alone was used for
phytochemical and pharmacological studies. The ethanolic extract was
administered to the animals by dissolving each time with 2% v/v aqueous
Tween 80.
Preparation of Piper longum extracts (PLE)
The seeds of Piper longum (1 kg)) were shade-dried and pulverized to
a coarse powder. The powder was passed through 40-mesh sieve and
exhaustively extracted with 90% (v/v) ethanol in soxhlet apparatus at 60oC.
The residue left after ethanol extraction was dried and extracted successively
with ethyl acetate and chloroform (90 %v/v). The extracts were evaporated
under reduced pressure using rota flash evaporator till all the solvent had been
removed and extract was stored in refrigerator for further use. All these
extracts were subjected to HPTLC finger printing analysis. The ethanolic
extract alone was used for phytochemical and pharmacological studies. The
43
ethanolic extract was administered to the animals by dissolving each time
with 2% v/v aqueous Tween 80.
Preparation of Biherbal extract (BHE)
The leaves of Eclipta alba (1Kg) and seeds of Piper longum (1Kg)
were shade-dried and pulverized to a coarse powder. Equal quantities of the
powder were passed through 40-mesh sieve and exhaustively extracted with
90% (v/v) ethanol in soxhlet apparatus at 60oC. The extract was were
evaporated under reduced pressure using rota flash evaporator till all the
solvent had been removed, the extract was lyophilised and stored in
refrigerator for phytochemical and pharmacological studies. The lyophilised
material was administered to the animals by dissolving each time with 2% v/v
aqueous Tween 80.
Drugs and Chemicals
Sodium dodecyl sulphate (SDS), Ethylene diamine tetra acetic acid
(EDTA), Trichloro acetic acid (TCA), Thiobarbituric acid (TBA), Sodium
nitroprusside, Sulphanilamide, Phosphoric acid, Naphtyl ethylene diamine
dihydrochloride were obtained from Sd Fine Chemicals Ltd.). 1,1-Diphenyl,
2-picryl hydrazyl DPPH), Butylated hydroxytoluene (BHT), Bovine Serum
Albumin (BSA), Folin-Ciocalteu reagent, 5,5-dithio bis(2-nitrobenzoic acid)
(DTNB), 2,2′-bipyridyl were obtained from Sigma Chemicals Company
St. Louis, USA. All other chemicals and reagent used were of analytical
grade.
44
Preliminary Phytochemical Screening
The ethanolic extracts of the EAE, PLE, and BHE were subjected to
preliminary phytochemical screening for identification of its active
constituents by the method of Kokate et al. (1997).
Test for Alkaloids
A small portion of the solvent free extracts were stirred separately with
a few drops of dil. Hydrochloric acid and filtered. The filtrate may be
carefully tested with various alkaloidal reagents.
(a) Mayer’s reagent - Cream precipitate
(b) Dragondroff reagent - Orange brown precipitate
(c) Hager’s reagent - Yellow precipitate
(d) Wagner’s reagent - Reddish brown precipitate
Test for Carbohydrates
(a) Molisch’s Test
The extracts were treated with 2-3 drops of 1% alcoholic alpha napthol
and 2 ml of conc. Sulphuric acid was added along the sides of the test tube
carefully. Formation of violet color ring at the junction of two liquids
indicates the presence of carbohydrates.
45
(b) Fehling’s Test
The extracts were treated with Fehling’s solution A and B and heated.
Appearance of reddish brown color precipitate indicates the presence of
reducing sugars.
(c) Benedict’s Test
The extracts were treated with Benedict’s reagent and heated.
Appearance of reddish orange colour precipitate indicates the presence of
reducing sugars.
Test for Proteins
(a) Biuret Test
The extracts were treated with copper sulphate solution, followed by
the addition of sodium hydroxide solution appearance of violet colour
indicates the presence of proteins.
(b) Millon’s Test
When the extracts were treated with Millon’s reagent, appearance of
pink colour indicates the presence of proteins
Test for Phytosteroids
(a) Libermann Bucharad Test
46
When the extracts were treated with con. Sulphuric acid, few drops of
glacial acetic acid, followed by the acetic anhydride, there is a formation of
violet ring between the two layers, and the appearance of green colour in the
aqueous upper layer indicates the presence of steroids.
Test for Phenols
(a) The different extracts were treated with neutral ferric chloride
solution. The appearance of violet color indicates the presence
of phenols.
(b) The different extracts were treated with 10% sodium chloride
solution. The appearance of cream color indicates the presence
of phenols.
Test for Tannins
(a) When the extracts were treated with 10% lead acetate solution,
appearance of white precipitate indicates the presence of tannins
(b) When the extracts were treated with aqueous bromine solution,
appearance of white precipitate indicates the presence of tannins
47
Test for Flavonoids
(a) 5ml of the each extract solution was hydrolyzed with 10% v/v
sulphuric acid and cooled. Then it was extracted with diethyl
ether and divided into three portions in three separate test tubes.
1ml of diluted sodium carbonate, 1ml of 0.1N sodium hydroxide
and 1ml of strong ammonia solution were added to the first,
second and third test tubes respectively. In each test tube,
development of yellow color demonstrated the presence of
flavonoids
(b) Shinoda’s Test The extracts were dissolved in alcohol, to that
one piece of magnesium followed by conc. Hydrochloric acid
were added drop wise and heated. Appearance of magenta color
shows the presence of flavonoids.
Tests for Gums and Mucilage
(a) About 10ml of various extracts were added separately to 25ml
of absolute alcohol with constant stirring and filtered. The
precipitate was dried in air and examined for its swelling
properties.
48
Test for Saponins
(a) Foam Test
1ml of the different extracts were diluted with distilled water and
shaken well in the test tube. The formation of foam in the upper part of the
test tube indicates the presence of saponins.
Test for Glycosides
A pinch of the extracts were dissolved in the glacial acetic acid and a
few drops of ferric chloride solution was added, followed by the addition of
con. Sulphuric acid, formation of red ring at the junction of two liquids
indicates the presence of glycosides.
Tests for fixed oils and fats
(a) Small quantity of the various extracts were separately pressed between
two filter papers. Appearance of oil stain on the paper indicates the
presence of fixed oil.
(b) Few drops of 0.5N alcoholic potassium hydroxide were added to small
quantity of various extracts along with a drop of phenolphthalein. The
mixture was heated on a water bath for 1-2 hours. Formation of soap or
partial neutralization of alkali indicates the presence of fixed oils and
fats.
49
Test for Terpenes
When the extracts were treated with tin and thionyl chloride,
appearance of pink colour indicates the presence of terpenes.
Test for Lignin
When the extracts were treated with alcoholic solution of
phloroglucinol and con. Hydrochloric acid appearance of red colour shows
presence of lignin.
High Performance Thin Layer Liquid Chromatography (HPTLC) finger
printing
HPTLC finger printing was performed on CAMAG TLC scanner – 3
instrument, equipped with Linomat IV applicator and CATS 3. 2 software.
Precoated aluminium silica gel 60 F254 (E. Merck) plates, layer thickness of
0.2 mm were used. Fingerprints were obtained by development in CAMAG
twin chamber and were scanned at 254 nm.
ESTIMATION OF MACRONUTRIENTS
Estimation of Total soluble sugars
The estimation of total soluble sugars present in the leaves of
Eclipta alba and seeds of Piper longum were estimated by using anthrone
method.
50
Extraction of sugars
For extracting the sugars 1gm of finely powdered sample was
suspended in 40 ml of distilled water and heated in the boiling water bath for
30 min. It was centrifuged for 20 min at 3000rpm. The supernatant was
collected and the pellet was suspended in 20 ml of water. The extraction steps
were repeated 6 –8 times till the supernatant was free of sugars.
Reagents
1. Anthrone reagent: Dissolved 2 gms of anthrone in 1 litre of
con. Sulphuric acid. The reagent was prepared freshly.
2. Stock standard glucose solution: 100mgs of glucose was
dissolved in 100ml of distilled water.
3. Working standard glucose solution: Stock solution was
diluted 1 in 10 times.
Procedure
From the supernatant 1ml of the solution was taken. To that 4 ml of
anthrone reagent was added. Placed the tubes in the boiling water bath for
10 min. Aliquots of standard glucose was also treated in the same way. A
blank was set up with 1ml of water. The test tubes were taken out, cooled and
the absorbance of the solution was measured at 625 nm using the colorimeter.
From the standard graph the amount of carbohydrate present in the sample
51
was calculated. The sugar contents of the plant were expressed as
mgs/100gms of powder.
Estimation of Total Proteins
The estimation of total proteins present in the leaves of Eclipta alba
and seeds of Piper longum were estimated by using Lowry et al., (1951)
method.
Extraction of the protein sample
Reagents
1. Ethanol - (80%)
2. Ethanol : Ether mixture (3: 1)
3. Trichloro acetic acid (TCA) -5%
Procedure
The fresh leaves of the Eclipta alba and seeds of piper longum were
extracted in hot 80% ethanol by macerating in a motor and pestle. The
homogenate was transferred in a centrifuge tube and centrifuged at 2000rpm
for 20 min. The supernatant was discarded. The pellet was suspended in a
suitable volume of 5% TCA in an ice bath for 15 min. It was centrifuged and
the supernatant was discarded. This process was repeated for twice. The pellet
was reextracted once with hot absolute ethanol and twice with ethanol: ether
mixture, every time discarding the supernatants after centrifugation. This
pellet contains the proteins and nucleic acids.
52
Estimation of the protein sample (Lowry’s method)
Reagents
1. Alkaline copper reagent:50ml of reagent A( 2% Sodium carbonate in
0.1N Sodium hydroxide) was mixed with 1.0ml of reagent B (0.5%
copper sulphate in 1% sodium potassium tartarate).
2. Folin’s phenol reagent: This was prepared according to the method of
Folin and Ciocalteu’s. The following were mixed together and refluxed
for 10hrs.
Sodium tungstate - 100mg
Sodium molybdate - 25g
Water - 700ml
Phosphoric acid 85% - 15ml
Con HCl - 100ml
After refluxing, 150g of Lithium sulphate and 50ml of water were
added along with a few drops of bromine. The mixture was boiled for 15min
to remove excess of bromine. The contents were cooled, diluted to 1 litre and
filtered. This reagent was diluted 1:2 with water before use.
3. Standard protein solution: 10mg of bovine serum albumin dissolved in
100ml of distilled water.
53
Procedure
Aliquots of the extract were made up to a final volume of 1.0ml with
water. A set of standards and blank containing only water were also set up
5.0ml of alkaline copper reagent was added to all the test tubes, mixed and
allowed to stand at room temperature for 10mts. Then 0.5ml of Folin’s phenol
reagent was added and shaken well. The blue color developed was read at
640nm after 20mts, in the photoelectric colorimeter. The protein contents of
the tissues were expressed as mgs/100gms of powder.
Estimation of Total lipid
The estimation of Total lipids present in the leaves of Eclipta alba and
seeds of Piper longum were estimated by using chloroform methanol mixture
by the method of Folsch et al. (1957).
Reagents
1. Anhydrous sodium sulphate
2. chloroform : Methanol mixture ( 2:1)
3. sodium chloride - 1%
Procedure
To 1gm of each of the leaves Eclipta alba and seeds of Piper longum,
5gms of anhydrous sodium sulphate was added and macerated in the motor
and pestle. A small amount of acid washed sand was added as an abrasive
since the seed material is tough. To this 20ml of chloroform : methanol
54
mixture was added and transferred to a tight glass stoppered iodometric flask.
The contents of the flask were shaken in a mechanical shaker and filtered
through the sintered glass funnel. The extraction was repeated twice and the
filtrates were pooled. The solvent present in the residue was removed under
vacuum. Since the residue left after drying contain crude lipids it was
extracted once again with 10ml of chloroform: methanol mixture containing
1ml of 1% sodium chloride. The pooled sample was transferred to a
separating funnel which were shaken thoroughly and allowed to stand for 5
min. The lipids were recovered from the lower layer. The lower layer was
drained out and the process was repeated with chloroform: methanol mixture
again 3-4 times to extract any residual lipid from it. The lipid containing
fractions were collected in a pre weighed beaker. The solvent was evaporated
by keeping it in a warm water bath at 50° C. The weight of the beaker with
the extract was recorded, and the amount of the crude lipids in the sample was
determined by subtracting the weight of the empty beaker. The lipid contents
of the tissues were expressed as gms/100gms of fresh tissue
Estimation of Minerals
Preparation of sample for mineral analysis by ashing method
Reagents
1. Desiccator containing fused calcium chloride at the bottom
2. Dilute HCl: Prepared diluting 1ml of HCl with 4ml of water
55
Procedure
About 5 – 10gms of oven-dried samples were taken in a silica crucible
and heated first in the bunsen burner on a low flame till it gets charred. The
silica crucible was transferred to a muffle furnace and heated at dull red heat
(500-550°C) till it was completely converted into white ash. The ash was kept
in the desiccator containing fused calcium chloride at the bottom, till it gets
cooled down. The ash was moistened with small amount of distilled water and
5ml of dilute HCl was added to it. The solution was evaporated to dryness on
a boiling water bath and this process was repeated twice. To the extract 4ml
of dil .HCl was added and warmed in the boiling water bath. The extract was
filtered through whatmann filter paper and made up to 100ml in the
volumetric flask. It was transferred to preacid washed bottles and stored for
mineral analysis.
Estimation of Minerals by Atomic Absorption
The minerals present in the dried powdered plants were analysed
quantitatively using atomic absorption spectrophotometer. (AAS400-HGA
900-Perkin Elmer) and expressed as ppm of plant powder.
SDS-PAGE ANALYSIS OF PROTEINS
A SDS-PAGE analysis of proteins was performed with the aqueous
extracts of the seeds of Piper longum and with the leaves of Eclipta alba and
the molecular weight of the different proteins present in the plants were
identified by comparing with the marker proteins.
56
Reagents
Stock solutions
1. Acrylamide stock solution: 30% Acryl amide and 0.8% N, N’,
methylene bis acrylamide was dissolved in 50ml of distilled
water.
2. Sodium dodecyl sulphate (SDS)- 10%
3. Ammonium per sulphate (APS)- 10%
4. Tetra ethyl methylene ethylene diamine (TEMED)
5. Tris – HCl buffer: Two bufferts
(a) for separating gel- 0.375 M pH 8.8
(b) for stalking gel -0.125 M pH 6.8
1. Preparation of separating gel (6ml)
2. Tris – HCl buffer pH 8.8 - 1.5ml
3. Acrylamide - 2.0 ml
4. Sodium dodecyl sulphate 10% - 0.06 ml
5. Ammonium per sulphate (APS) 10% - 0.02 ml
6. TEMED - 0.01 ml
7. Water - 2.41 ml
Preparation of stalking gel (3ml)
1. Tris – HCl buffer pH 6.8 - 0.75ml
2. Acrylamide - 0.5 ml
3. Sodium dodecyl sulphate10% - 0.03 ml
4. Ammonium per sulphate (APS) 10% 0.015 ml
57
5. TEMED - 0.005 ml
6. Water - 1.7 ml
Preparation of sample buffer
1. 0.025M Tris PH 6.8 - 0.25
2. 2 mercaptoethanol - 0.1ml
3. SDS - 0.04ml
4. Glycerol - 0.2ml
5. Bromophenol Blue - 0.001%
6. Water - to make up to 1ml
Preparation of tank buffer PH 8.3
1. Tris 0.025M - 1.5g
2. Glycine 0.192M - 7.2g
3. SDS 0.1% - 0.5g
4. Water - 500ml
Protein sample preparation
The protein isolated from the plants as above mentioned procedure was
taken and mixed with equal volume of sample buffer in sterilized microfuge
tubes and boiled for 3 min in a boiling water bath. It was cooled at room
temperature and then used for loading.
58
Protein Staining Solutions
0.1 gms of coomassie brilliant blue (CBB R 250) was weighed,
dissolved completely in 40 ml of methanol, 10 ml of acetic acid was added
and made-up to 50 ml using water.
Procedure
1. The polyacrylamide slab was prepared between the two glass
plates, a notched upper plate and a lower plate that were separated
by the spacers. The sides of the gel plates were sealed using 5%
agar solution. The plates were checked for leaks before pouring
the separating gel solution.
2. The separating gel was poured in between the plates without any
air bubble. 100µl of water was laid over the separating gel to get a
uniform layer. The separating gel was allowed to get solidify.
After the gel gets solidifies the water layer was removed.
3. The stalking gel was added on the top of the separating gel. The
comb was introduced on the top without air bubble, and allowed
to get solidify.
4. After solidification of the stalking gel the comb was removed ,
the spacers kept in between the plates were also removed.
5. The plates with the gel were clamped in the electrophoretic
apparatus. The top electrolyte compartment was filled with the
59
running buffer and checked for leaks. If it was perfect the bottom
compartment was also filled with the same.
6. About 25µl of the processed protein sample was applied on the
wells by using the micropipette.
7. Known molecular weight protein markers were also loaded onto
the wells.
8. After loading the samples and the markers on to the wells the
power pack was “switched on” and a voltage of 15 mA was
applied which gives good resolution and avoid heating effects.
9. Once the tracking dye reaches the bottom of the gel the current
was “switched off” and the plates were removed and the gel
present in between the plates were taken out for staining
purposes.
10. The gel was stained for an hour in the freshly prepared staining
solution and destained in the destaining solutions till the bands of
required intensity was obtained.
11. The proteins present in the sample were studied using the marker
proteins.
Molecular weight determination
SDS-PAGE is frequently used to determine the molecular weight of a
protein. Since the protein migration is generally proportional to the mass of
the protein, a standard curve is generated with proteins of known molecular
60
weight and the molecular weight of unknown protein can be calculated by
extrapolating the graph.
IN- VITRO ANTIOXIDANT STUDIES
1,1-Diphenyl-2 picrylhydrazyl (DPPH) radical scavenging activity
DPPH radical scavenging activity was assessed according to the
method of Shimada et al. (1992).
Reagents
1. Acetate buffer , pH 5.5 - 0.1 M
2. DPPH in ethanol - 0.5 mM
3. L- Ascorbic acid - 10mg/100ml water
Procedure
One ml of crude extracts of EAE, PLE, and BHE at variable
concentrations ranging from 100 to 1000 µg in ethanol were mixed in 1 ml of
freshly prepared DPPH solution and 2 ml of 0.1 M acetate buffer at pH 5.5.
The resulting solutions were then incubated at 37 ºC for 30 min and measured
spectophotometrically at 517nm. Standard antioxidants like L-Ascorbic acid
was used as positive control under the same assay conditions. Negative
control was without any inhibitor or extract. Lower absorbance at 517 nm
represents higher DPPH scavenging activity. DPPH radical scavenging
activity of the extracts was calculated accordingly from the decrease in
absorbance at 517 nm in comparison with the negative control.
61
Super oxide scavenging activity
Super oxide anion scavenging activity was measured based on the
described method by Robak and Gryglewski (1988).
Reagents
1. Sodium phosphate buffer, pH 7.4 - 100 mM
2. Nitro blue tetrazolium (NBT) - 150 mM
3. NADH - 468mM
4. Phenazine methosulphate (PMS) - 60 mM
5. L-Ascorbic acid - 10mg/100ml water
Procedure
Superoxide radicals were generated in nicotinenamide adenine
dinucleotide, phenazine methosulphate (PMS–NADH) system by the
oxidation of NADH and assayed by the reduction of nitro blue tetrazolium
(NBT). In this experiment, the super oxide radical was generated in 3 ml of
sodium phosphate buffer containing 1ml of NBT solution, 1 ml of NADH
solution, and different concentrations of the EAE, PLE, and BHE (100 to
1000µg) in water. The reaction was started by adding 1 ml of PMS solution to
the mixture. The reaction mixture was incubated at 25 ºC for 5 min and the
absorbance was measured against the corresponding blank solution.
L-Ascorbic acid was used as the positive control. The decrease of NBT
reduction measured by the absorbance of the reaction mixture correlates with
62
the super oxide radical scavenging activity of the BHE. The superoxide
radical scavenging activity was calculated using the following formula:
Superoxide radical scavenging activity (%) = [(A0 –A1/A0) x100],
where A0 is the absorbance of the control and A1 is the absorbance of plant
extract or the standard sample.
Hydroxyl radical scavenging activity
The hydroxyl radical scavenging activity was determined according to
the method of Halliwell et al. (1987).
Reagents
1. Phosphate buffer pH 7.4 - 20 mM
2. Deoxyribose - 8 mM
3. Ferric chloride - 0.1 mM
4. Ascorbic Acid - 0.1mM
5. EDTA - 0.1 mM
6. H2O2 - 1 mM
7. Thiobarbituric acid - 1%
8. Trichloroacetic acid - 2%
9. Standard Mannitol - 10mg/100ml water
63
Procedure
Briefly for the non site-specific hydroxyl radical system, the reaction
mixture containing 0.1 ml deoxyribose, 0.1 ml FeCl3, 0.1 ml ascorbic acid,
0.1 ml EDTA, and 0.1 ml H2O2 were mixed with or without various
concentrations of the three extracts in 1ml of final volume made with
KH2PO4–KOH buffer pH 7.4 and was incubated in a water bath at 37 ºC for
1 hr. The extent of deoxyribose degradation was measured by thiobarbituric
acid (TBA) method. 1ml of TBA and 1 ml trichloroacetic acid were added to
the mixture and heated at 100 ºC for 20 min. After cooling to room
temperature the absorbance was measured at 532 nm. Mannitol, a classical
hydroxyl radical scavenger was used as positive control. The hydroxyl radical
scavenging activity was calculated using the following formula:
Hydroxyl radical scavenging activity (%) = [(A0 –A1/A0) x100],
where A0 is the absorbance of the control and A1 is the absorbance of plant
extract or the standard sample.
Nitric oxide scavenging activity
Nitric oxide generated from sodium nitro prusside was measured by
the Griess reagent by the method of Marcocci et al. (1994).
Reagents
1. Sodium nitroprusside - 5 mM
2. Phosphate buffered saline
64
3. Griess reagent: 1% sulpha-nilamide, 2% o-phosphoric acid, and
0.1% naphthylethylenediamine dihydrochloride were mixed
together.
4. Rutin -10mg/100 ml
Procedure
Various concentrations of the three different extracts were mixed with
sodiumnitroprusside in PBS and a final volume of 3 ml was incubated at
25 ºC for 150min. After incubation, 0.5ml of sample was removed and diluted
with 0.5 ml of Griess reagent. The absorbance of the chromophore formed
was read at 546 nm. The inhibition of nitric oxide generation was estimated
by comparing the absorbance value of control. Rutin was used as positive
control under the same assay conditions.
Nitric oxide scavenging activity (%) = [(A0 –A1/A0) x100],
where A0 is the absorbance of the control and A1 is the absorbance of plant
extract or the standard sample.
Reducing power assay
The reducing power of the prepared EAE, PLE and BHE was
determined according to method of Oyaizu (1986).
Reagents
1. Phosphate buffer pH 6.6 - 0.2 M
65
2. Potassium ferricyanide solution - 1%
3. TCA - 10%
4. Ferric chloride solution - 0.1%
5. Butylated hydroxyl toluene (BHT)-10mg/100ml water
Briefly, various concentrations of the extracts and the standard
compound (BHT) in 1 ml of distilled water were mixed with 2.5 ml of
phosphate buffer and 2.5 ml of a potassium ferricyanide solution. The mixture
was incubated in a water bath at 50 ºC for 20 min. Then 2.5 ml of a 10% TCA
solution was added and the mixture was then centrifuged at 3000g for10 min.
2.5 ml aliquot of the upper layer was mixed with 2.5 ml of distilled water and
0.5 ml of a ferric chloride solution, the absorbance was measured at 700 nm.
Increased absorbance of the reaction mixture correlates with greater reducing
power.
Hydrogen peroxide scavenging activity
The ability of samples to quench H2O2 was determined by Ruch et al.
(1989).
Reagents
1. Phosphate buffered saline pH 7.4 - 0.1 M
2. H2O2 - 2 mM
3. Vitamin E - 10mg/100ml
66
Procedure
The samples were dissolved in 3.4 ml of phosphate buffered saline
(PBS) and mixed with 0.6 ml of 2 mM solution of H2O2. Absorbance of H2O2
at 230 nm was determined 10 min later in a spectrophotometer. For each
concentration, a separated blank sample was used for background subtraction.
Vitamin E was used as the standard conditions. The inhibition of H2O2
production was calculated as follows: Hydrogen peroxide radical scavenging
activity (%) = [(A0 –A1/A0) x100],
where A0 is the absorbance of the control, and A1 is the absorbance of BHE or
the standard sample.
Test for Ferric ion reducing capacity (Fe3+ to Fe2+)
The Ferric ion reducing capacity was determined according to the
method of Wang et al. (2003) with minor modifications.
Reagents
1. Phosphate buffer, pH 6.5 - 20mM
2. Ferric chloride - 2mM
3. Potassium thiocyanate - 4mM
4. EDTA - 100µg/ml
67
Procedure
Here different concentrations of the three extracts (20 µl to 100µl) was
mixed with 200µl of 20mM phosphate buffer pH 6.5 and100µl of ferric
chloride (2mM). The mixture was incubated for 30 min. At the end of the
incubation 1ml of potassium thiocyanate (4mM) was added and absorbance of
ferric-thiocynate complex (reddish brown complex) was measured at 460nm
using spectrophotometer. The results were compared with standard EDTA
which were treated similarly.
Test for ferrous ion chelating activity (binds Fe2+)
Metal chelating property for ferrous ion (Fe2+) was estimated according
to the method of Tripathi et al. (2001).
Reagents
1. Ferrous sulphate - 10µg.
2. 2,2′–bipyridyl - 1mM
5. EDTA - 100µg/ml
Procedure
Different concentrations of the EAE, PLE, and BHE (10 µl to 100µl)
were mixed with a fixed concentration of ferrous sulphate (10µg). The
mixture was incubated for 30 min. At the end of the incubation, 2ml of 2,2′–
bipyridyl (1mM) was added and absorbance of ferrous–bipyridyl complex
68
(pink colored complex) was measured at 525nm. The results were compared
with EDTA which were treated similarly.
Total antioxidant activity
The total antioxidant activity of the extracts were measured by use of a
linoleic acid system by the method of Mitsuda et al. (1996).
Reagents
1. Linoleic acid - 0.2804 g
2. Tween - 20
3. phosphate buffer, pH 7.0 - 0.2 M
4. Ethanol
5. Ammonium thiocyanate - 30%
6. Ferrous chloride. - 20 mM in 3.5% HCl
7. Butylated hydroxytoluene - 10mg/100ml
Procedure
The linoleic acid emulsion was prepared by mixing 0.2804 g of linoleic
acid in Tween 20 and 50 ml of phosphate buffer (pH 7.0). The mixture was
then homogenized. A 0.5 ml of different concentration of the extract and
standard sample (in ethanol) was mixed with 2.5 ml of linoleic acid emulsion
and 2 ml phosphate buffer. The reaction mixture was incubated at 370C in the
dark to accelerate the peroxidation process. The levels of peroxidation were
determined according to the thiocyanate method by sequentially adding 5ml
69
of 75% ethanol, 0.1 ml of ammonium thiocyanate, 0.1 ml sample solution and
0.1 ml ferrous chloride. Butylated hydroxytoluene (BHT) was used as positive
control which was treated similarly. After mixing for 3 min, the peroxide
values were determined by reading the absorbance at 500 nm.
Determination of Total Phenolic Content
Total phenolic content in the lyophilized extract was determined with
the Folin–Ciocalteu’s reagent (FCR) according to a published method of
Slinkard and Singleton (1977).
Reagents
1. Folin–Ciocalteu’s reagent: Prepared as previously mentioned.
2. Sodium carbonate solution -7.5%,
3. Gallic acid - 100mg dissolved in 100ml of water.
Procedure
100mg of the sample was dissolved in 0.5ml 0f water, mixed with
2.5 ml Folin–Ciocalteu’s reagent (diluted 1:10, v/v) followed by 2 ml of
sodium carbonate solution. The absorbance was then measured at 765 nm
after incubation at 30oC for 90 min. Results were expressed as gallic acid
equivalents (mg gallic acid/g dried extract).
70
Determination of Total Flavonoid Content
The total flavonoid content of the extracts were determined by a
colorimetric method as described in the literature of Zhishen et al. (1999).
Reagents
1. Sodium nitrite - 15%
2. Aluminium chloride - 10%
3. Sodium hydroxide - 4%
4. Catechin - 100mg dissolved in 100ml of water.
Procedure
An aliquots of sample containing 100mg of test drugs (0.5 ml) was
mixed with 2 ml of distilled water and subsequently with 0.15 ml of sodium
nitrite solution was added. After 6 min, 0.15 ml of aluminium chloride
solution was added and allowed to stand for 6 min, then 2 ml of NaOH
solution (4%) was added to the mixture. Immediately, water was added to
bring the final volume to 5 ml and the mixture was thoroughly mixed and
allowed to stand for another 15 min. Absorbance of the mixture was then
determined at 510 nm versus prepared water blank. . Results were expressed
as catechin equivalents (mg catechin/g dried extract).
Assay of Protein Oxidation
The effects of the plant extracts on protein oxidation were carried out
according to the slightly modified method of Wang et al. (2006).

71
Reagents
1. Potassium phosphate buffer , pH 7.4- 20 mM
2. Bovine serum albumin (BSA) - 4 mg/ml
3. Ferric chloride - 50mM
4. Hydrogen peroxide - 1 mM
5. Ascorbic acid. - 100 mM
6. 2,4-dinitrophenylhydrazine (DNPH)- 10 mM in 2 M HCl
7. TCA - 10%,
8. Ethanol
9. Ethyl acetate
10. Guanidine Hydrocholoride, pH 2.3 - 6 M
Procedure
Bovine serum albumin (BSA) was oxidized by a Fenton-type reaction.
The reaction mixture (1.2 ml), containing sample extract (100–1000 µg/ml),
potassium phosphate buffer, BSA, Ferric chloride hydrogen peroxide and
ascorbic acid was incubated for 30 min at 370C. For determination of protein
carbonyl content in the samples, 1 ml of 2,4-dinitrophenylhydrazine (DNPH)
was added to the reaction mixture. Samples were incubated for 30 min at
room temperature. Then, 1 ml of ice cold TCA was added to the mixture and
centrifuged at 3000g for 10 min. The protein pellet was washed three times
with 2 ml of ethanol/ethyl acetate (1:1 v/v) and dissolved in 1 ml of guanidine
hydrochloride. The absorbance of the sample was read at 370 nm. The data
were expressed in terms of percentage inhibition, calculated from a control
72
measurement of the reaction mixture without the test sample. Vitamin E under
same assay condition was used us standard.
In vitro assay of DNA fragmentation study
The DNA was subjected to oxidation by the Fenton’s reactants and
subjected to fragmentation. The protection offered by the plant extract against
the DNA fragmentation was studied according to the method of Sultan et al.
(1995), with minor modifications
Isolation of DNA from Hepatocytes
Reagents
1. Isotonic buffer
(a) 0.15mM sodium chloride - 3.0ml
(b) 0.1 M Tris–HCl pH 7.5 - 1.0ml
(c) 1.5mM Magnesium chloride - 0.15ml
Made up to 100ml with water.
2. Cell lysis buffer
(a) 320mM sucrose - 109.6g
(b) 1% Triton X-100 - 20ml f 50% Triton X-100
(c) 5mM MgCl2 - 5ml of 1M Mgcl2
(d) 10mM Tris–HCl pH 7.5 - 10ml of 1M Tris- HCl
(e) Distilled water - to a final volume of 1 liter
3. EDTA-NaCl ( 100ml)
(a) 25mM EDTA PH 8.0 - 5ml of 0.5M EDTA
(b) 75mM NaCl - 1.5ml 0.5M NaCl
73
(c) Distilled water - 93.5ml
4. Proteinase K (10mg/ml)
(a) Proteinase K - 10 mg
(b) Distilled water - 1ml
Stored in -20°C
5. 5M sodium acetate (100ml)
About 68.5 g of sodium acetate was dissolved in 70 ml of water,
pH was adjusted to 5.2 by adding acetic acid. Volume was made
up to 100ml with distilled water.
6. Phenol- chloroform – Isoamyl alcohol ( 50 ml)
(a) phenol - 25 ml
(b) chloroform - 24ml
(c) isoamyl alcohol - 1ml
7. Tris EDTA Buffer
(a) 10 mM Tris HCl pH 8.0 - 1ml from 1M Tris HCl
pH 8.0
(b) 1mM EDTA pH 8.0 - 0.5ml from 0.5 ml
EDTA pH 8.0
(c) Distilled water - 98.5ml
8. 20 mM potassium phosphate buffer, pH 7.4
9. 150mM sodium chloride
10. Fenton reaction mixture
(a) 100mM ascorbate
(b) 100mM FeCl2
(c) 1mM H2O2
74
(d) 104 mM EDTA
The above contents were mixed in 20 mM potassium
phosphate buffer, pH 7.4
10. Tris acetate EDTA buffer pH 8
(a) 40 mM Tris
(b) 20mM sodium acetate,
(c) 2mM EDTA,
(d) 18 mM NaCl, pH 8
Procedure
1. About 0.2 gm of liver tissue was homogenised in 2ml of isotonic
buffer.
2. The animal cells were collected by centrifugation at 2000rpm for
10 min at 4°C.
3. The cell pellet was resuspended in cold cell lysis buffer.
4. The cells were homogenised in a glass homogeniser with a loose
fitting pestle.
5. The above treated homogenate was centrifuged at 4000rpm for 20
min at 4°C to pellet the nuclei.
6. Resuspended the pellet in 8ml of EDTA-NaCl and added 0.8 ml
of 10% cell lysis buffer. It was mixed using the vortex mixture.
7. To this mixture 50µl of the proteinase K was added and incubated
at 37°C for 3- 5 hrs.
75
8. Then 0.5ml of sodium acetate buffer and 8 ml of Phenol-
chloroform – Isoamyl alcohol were added. The contents were
mixed by inverting the tube for one hr.
9. The above treated solution was centrifuged at 12000 rpm for 10
min at 4°C.
10. The upper aqueous layer was collected. Equal volume of Phenol-
chloroform – Isoamyl alcohol was added . It was mixed gently by
inverting the tube for 1 min.
11. Once again the solution was centrifuged at 12000 rpm for 10 min
at 4°C.The upper aqueous layer was collected.
12. About 2 volumes of 100% ethanol was added to the above
collected solution to precipitate the DNA.
13. Centrifuged at 5000rpm for 5 min at 4°C.The DNA pellet was
washed in 70 % ethanol.
14. The precipitated DNA was dissolved in 20µl of TE buffer.
Assay of DNA fragmentation
1. 1 mg of the extracted DNA was mixed well with in 20 mM
potassium phosphate buffer, pH 7.4. To this 1 ml of 150mM
sodium chloride was added and left at 4°C for 24 hrs for complete
solubilisation
76
2. 100 µg of the above DNA was treated with 1ml of potassium
phosphate buffer, the reaction mixture containing FeCl3
(100 µM), EDTA (104 µM), H2O2 (1 mM).
3. To the above mixture two concentrations of BHE (20 and 40 µg)
were added. A standard antioxidant BHT was also treated in the
same way. A negative control without the fenton reactants were
also used in the assay. A positive control without the extract or
standard was also taken.
4. All these reaction mixtures were incubated for 37°C for 30 min,
and placed on the ice bath for 10 min to stop the reaction.
5. These were then mixed with the loading buffer (0.5%
bromophenol blue and 50% glycerol)
6. Agarose gel electrophoresis was carried out by mixing 1%
agarose with ethidium bromide (1 µg/ml)
7. About 10 µl of the treated samples were placed in the wells in the
following order. Control, positive control, BHE treated sample
(20 and 40µg), standard BHT.
8. The electrophoresis was conducted in TAE buffer, pH 8 at
60 V for 6hr
9. DNA was visualized under a UV transilluminator (Bio-Rad,
Sydney, Australia).
77
RESULTS
Table I shows the preliminary phytochemical analysis of the various
extracts. In the present investigation preliminary phytochemical screening of
the EAE, PLE and BHE shows the presence of constituents like alkaloid,
carbohydrates, phytosterol, tannins , phenol, flavonoids, glycosides, terpenes,
saponins and lignin. In all these extracts proteins, gums and muciliage were
found to be absent
Figure I to III shows the present chromatographic pattern of ethyl
acetate, chloroform and ethanolic extract of Eclipta alba. Ethyl Acetate
extract showed 14 peaks at Rf values 0.07, 0.14, 0.18, 0.30, 0.41, 0.49, 0.58,
0.63, 0.72, 0.80 and 0.95. Chloroform extract of Eclipta alba showed
11peaks at Rf values 0.07, 0.14, 0.18, 0.30, 0.41, 0.49, 0.58, 0.63, 0.72, 0.80
and 0.95. The ethanolic extract of Eclipta alba showed 12 peaks at Rf values
0.12, 0.19, 0.31, 0.43, 0.51, 0.60, 0.65, 0.73, 0.81, 0.86 and 0.90 at 254nm.
Figure IV toVI shows the HPTLC finger printing of the different
extracts of Piper longum. The ethyl acetate extract of Piper longum showed
11 peaks at Rf values 0.03,0.08,0.13, 0.23,0.30,0.40,0.51,0.61, 0.76,0.88 and
0.94 where as the Chloroform extract showed 10 peaks at Rf values 0.09,
0.16,0.24,0.32,0.53,0.63,0.77,0.86 and 0.94. The ethanolic extract of the same
plant showed 12 peaks at Rf values 0.03,0.06,0.11,0.19,0.27, 0.37,0.47,0.59,
0.69,0.80,0.86 and 0.92 at 254nm.
Figure VII shows the SDS-PAGE electrophoresis results of
aqueous extract of Eclipta alba. The presence of protein bands with
78
molecular weight of ranging 7.50 – 123 kDa were seen. The Piper longum
seeds showed only two protein bands in the molecular weight of 30 kDa and
60 kDa.
The values of the macronutrients like carbohydrates, proteins and
lipids present in the leaves of Eclipta alba and seeds of the Piper longum
were shown in the Table II. The carbohydrate content present in the seeds of
the Piper longum was 15.56mgs / 100gms, where as the leaves of Eclipta
alba contains 27.78mgs/ 100 gms. The protein content was also found to be
high in case of leaves of Eclipta alba when compared with the seeds of Piper
longum. The same was applicable to the lipid content also, in which the leaves
of Eclipta alba contained 24.94mgs/ 100 gms and Piper longum contained
3.89mgs/ 100gms respectively.
Table III shows the concentration of different minerals like Ca,
K, Na, Mg, Zn, Si, Fe, Al, Va, Mb, Cu, Ni, Hg, Pb, Ba, Mn, Cr, Co, and Se
expressed in ppm. The concentration of these minerals in Eclipta alba leaves
was found to be in the following order, Ca> Na > K > Mg > Al > Si > Zn >
Fe > Va>Cu >Ni >Ba>Mg > Cr > Mb> Co>Hg >Pb > and Se.From the
values it was clear that the leaves of Eclipta alba has got a high calcium
content and has a low content of selenium. At the same time the concentration
of these minerals in the seeds of Piper longum was found to be in the
following order, Ca > Na > K> Mg > Zn > Fe > Al > Va > Si > Mb > Cu >
Ba > Hg> Ni > Cr > Mn > Co > Pb > Se showing that the Piper longum
seeds also contained highest content of calcium and lowest content of
selenium.

79
The hydrogen donating activity was measured by using DPPH
test.The DPPH radical scavenging activity of EAE, PLE, BHE and the
positive control ascorbic acid were shown in the Figure VIII . These extracts
quenched the DPPH radicals in a concentration dependent manner. The BHE
has got a maximum DPPH scavenging activity when compared with its
individual preparations, EAE and PLE. The BHE contained 252mg ascorbic
acid equivalents/g extract of activity, with EC50 value 139µg/ml. The EC50
value of the standard ascorbic acid was found to be 188µg/ml.
Table IV depicts Super oxide scavenging activity of different plant
extracts. The extracts like EAE, PLE, BHE and the positive control ascorbic
acid demonstrated a concentration-dependent scavenging activity of super
oxide radicals. The inhibitory activity was minimum in low concentration of
plant extract and increases with increase in the concentration. The BHE
demonstrated a maximum scavenging activity by neutralizing superoxide
radicals with EC50 value of 165µg/ml. The EC50 value of the standard ascorbic
acid was found to be 182µg/ml.
The plant extracts reduced the hydroxyl radical induced deoxyribose
cleavage in a concentration dependent manner. The hydroxyl radical
scavenging activity of EAE, BHE, PLE and standard mannitol were shown in
the Table V. The hydroxyl radical scavenging activity was more for the BHE
when comparable with EAE and PLE. The EC50 value of BHE was found to
be 288µg/ml. With this assay, the BHE was found to contain 696 mg
mannitol equivalent/g extract in non site-specific model of hydroxyl radical
80
scavenging The EC50 value of the standard mannitol was found to be
460µg/ml.
Incubation of solution of sodium nitroprusside in phosphate buffered
saline at 25.8 ºC for 150 min resulted in generation of nitric oxide. Figure IX
shows the Nitric oxide radical scavenging activity of EAE, BHE, PLE and the
positive control Rutin. The BHE effectively reduced the generation of nitric
oxide radicals, when compared to its individual preparations EAE and PLE.
The scavenging of Nitric oxide by BHE was concentration dependent and the
EC50 value was found to be 431µg /ml .The BHE was found to contain 415.22
mg/gm equivalent of Rutin. The EC50 value of the standard Rutin was found
to be 616 µg/ml.
Table VI depicts the reducing capability of BHE (measured at 700
nm) relative to BHT, a well-known antioxidant. The reducing potential of the
extracts increased in a dose-dependent manner. The absorbance values of the
extract at different concentrations were found to be less than that of the
reference compound.
In the present investigation the BHE effectively scavenged the
H2O2 radicals by 78 .00 % and 82.03% in the concentration of 100 and 200
micrograms where as the vitamin E inhibited only 65.89±0.89 % and
75.96±0.56% at the same concentration which was shown in the Table VII.
The scavenging potential of EAE was 55.56% and 58.90% at the
concentration of 100 and 200 micrograms per ml where as PLE exhibited
63.00% and 64.00 % respectively.
81
Table VIII shows the chelating ability of the BHE for metal
transition ions (Fe2+, Fe3+) that increases in a dose dependent manner when
compared with control. The metal chelating activities of BHE on Fe2+, Fe 3+
was 56.08% and 55.19% respectively at 100µg concentration respectively
EDTA exhibited 78.64% chelation for Fe2+ and 85.42% for Fe3+ respectively.
The phenolic compound may contribute directly to antioxidative action.
Based on these results, it might be concluded that BHE is an electron donor
capable of neutralizing free radicals.
Table IX shows the changes in the absorbance under the influence of
different concentrations of the extract (100-1000µgm/ml) at 37 °C compared
to BHT as a positive control. The total antioxidant activities of the plant
extract were measured using ferric thiocyanate test, which determines the
amount of peroxide produced at the initial stage of lipid peroxidation
According to this the extent of inhibition of lipid oxidation is moderate at low
(100 µg/ml) doses of BHE.However, at higher concentrations (800 and 1000
µg/ml), BHE suppressed lipid oxidation to a considerable extent when
comparable with its individual preparation EAE and PLE. Lower absorbance
indicates a higher level of antioxidant activity
The protein oxidation was determined in terms of inhibition protein
carbonyl formation (PCO). As shown in Table X, BHE dose-dependently
exhibited inhibitory effects of PCO formation. At the same time the individual
preparation EAE and PLE exhibited lower inhibitory effects of PCO
formation at the same concentration. The oxidative protein damages,
provoked by free radicals, have been demonstrated to play a significant role in
aging and several pathological events. Radical mediated damages to proteins
82
might be initiated by electron leakage, Major molecular mechanisms, leading
to structural changes in proteins are free-radical mediated protein oxidation
characterized by carbonyl formation (PCO).
The antioxidant activity of BHE is probably due to its phenolic
contents. Flavonoids are a class of secondary plant phenolics with powerful
antioxidant properties. Therefore, it would be valuable to determine the total
phenolic and flavonoid content of the plant extracts. The extracts were
investigated regarding their composition by different colorimetric techniques,
such as the content of total phenolic compounds by the Folin– Ciocalteu’s
assay and flavonoids by AlCl3 reagent. The total phenolic and flavonoid
contents of the plant extracts, were expressed in terms of gallic acid and
catechin equivalents. Total phenolic and Flavonoid contents of each gram of
dried BHE were estimated to be equivalent to 73.4 mg gallic acid and 55.4 mg
catechin which was shown in Table XI. The antioxidant activity of BHE is
probably due to its phenolic content and the secondary plant phenolics the
flavonoids.
The inhibitory action of the BHE on DNA fragmentation of the
isolated hepatocytes were shown in the Figure X. In the CCl4 intoxicated
group II animals the extent of DNA damage was detected by the increased
mobility of the DNA molecule due to the decrease in the molecular weight
which was shown in the lane 2. On the other hand in the BHE at the
concentration of 20µg/ml and40µg/ml protected the DNA from damage which
was shown in the lane 3 and 4. This was evidenced by the decreased mobility
of the DNA molecule in the agarose gel electrophoresis. The protective effect
of BHT the standard antioxidant was shown in lane 5.
83
DISCUSSION
Reactive oxygen species (ROS) and free transition metal ions cause
extensive oxidative damage to cellular biomolecules such as DNA, proteins
and lipids. Consequently, they contribute to the pathogenesis of oxidative
stress-related diseases (Droge 2002; Hippeli and Elstner, 1999). Although
synthetic antioxidants seem to be promising, their toxicity and unwanted side
effects rules out their extensive prescription. Hence, there is great interest in
the use of naturally occurring antioxidants for treatment or prophylaxis of
various oxidative stress-related diseases (Maxwell, 1995). The administration
of an antioxidant source comprising of multiple components could offer
protection against cancer (Black et al., 1995) and combat oxidative stress-
induced physiological malfunctions.
ROS include free radicals such as superoxide •O, hydroxyl radical
(•OH) as well as non radical species such as hydrogen peroxide (H2O2)
(Cerutti, 1991). In vivo, some of these ROS play a positive role as energy
production, phagocytosis, regulation of cell growth and intracellular signaling
(Halliwell and Gutteridge, 1999). On the other hand, ROS are also capable of
damaging a wide range of essential biomolecules such as proteins, DNA and
lipids (Farber, 1994). ROS are not only strongly associated with lipid
peroxidation resulting in deterioration of food materials, but also are involved
in development of a variety of diseases including aging, carcinogenesis,
coronary heart disease, diabetes and neuro degeneration (Harman, 1980;
Moskovitz et al., 2002) Cells have several antioxidant defense mechanisms
that help to prevent the destructive effects of ROS. These defense

84
mechanisms include antioxidative enzymes, such as superoxide dismutase,
catalase, and glutathione peroxidase and of small molecules such as
glutathione, vitamins C and E (Fridovich, 1999). The efficiency of the
antioxidant defense system is altered under pathological conditions and,
therefore, the ineffective scavenging and/or overproduction of free radicals
may play a crucial role in determining tissue damages (Aruoma, 1994).
Substances termed antioxidants can influence the oxidation process
through simple or complex mechanisms including prevention of chain
initiation, binding of transitional metal ion catalysts, decomposition of
peroxides, prevention of continued hydrogen abstraction, and radical
scavenging (Shahidi and Wanasundara, 1992). Antioxidants are believed to
play an important role in preventing or alleviating chronic diseases by
reducing the oxidative damage to cellular components caused by ROS
(Ceriello, 2003). There is growing interest in natural phenolic antioxidants,
present in medicinal and dietary plants, that might help attenuate oxidative
damage (Silva et al., 2005). These natural antioxidants not only protect food
lipids from oxidation, but may also provide health benefits associated with
preventing damages due to biological degeneration.
High consumption of fruits and vegetables is associated with low
risk for these diseases, which is attributed to the antioxidant vitamins and
other phytochemicals. Polyphenols are especially important antioxidants,
because of their high redox potentials, which allow them to act as reducing
agents, hydrogen donors and singlet oxygen quenchers (Kahkonen et al.,
1999). In addition, they have metal chelating potentials (Rice et al., 1995).
85
The antioxidant activity of the dietary polyphenolics is considered to be much
greater than that of the essential vitamins, therefore contributing significantly
to the health benefits of fruits and vegetables. The phytochemical screening
of these plant extracts were carried out because compounds in their natural
formulations are more active than their isolated preparations.
The phytochemical screening showed, that the leaves of Eclipta
alba and seeds of P. longum were rich in alkaloids, flavonoids, tannins,
steroids, terpenoids, glycosides and lignins. The medicinal value of these
plants lies in some chemical substances that produce a definite physiological
action on the human body. The most important of these bioactive constituents
of plants are alkaloids, tannins, flavonoids, and phenolic compounds They
were known to show medicinal activity as well as exhibiting physiological
activity (Sofowara, 1993). The in vivo hepatoprotective activity was mainly
due to the presence of these phytochemicals. The medicinal values of plants
and vegetables are indictated by their phytochemical and other chemical
constituents (Fallah et al., 2005)
Micronutrients consist of vitamins and minerals required by the
body in small quantities. They function as essential cofactors in the numerous
enzyme catalyzed reactions and their absence can result in impairment of
metabolic functions which can lead to serious diseased conditions. Sodium
together with potassium assists in the maintenance of the body's electrolyte
and water balance. In addition, potassium and sodium plays an important role
in nerve conduction, muscle contraction, and the transport of substances
across membranes. Supplementation of BHE to CCl4 rats significantly
86
maintained acid-base balance by increasing the absorption of electrolytes and
minerals from intestine and inhibited electrolytes elimination through urine
(Damodara Reddy et al ., 2007).
The presence of selenium an important mineral in the BHE is
responsible for its antioxidant activity. The main function of selenium is as an
antioxidant in the enzyme selenium-glutatlione peroxidase. The antioxidant
properties of selenoproteins help prevent cellular damage from free radicals,
regulate thyroid function and play a role in immune system (Mckenzie et al.,
1998; Levander, 1997). Selenium and vitamin E work together synergistically
in that they carry out antioxidant and immuno stimulating function better
together than individually (Haas, 2001).
Zinc is widely recognized as an essential micronutrient with a
catalytic role in over 100 specific metabolic enzymes in human metabolism
which plays multiple roles in the perpetuation of genetic materials including
transcription of DNA, translation of RNA, and ultimately in cellular division.
So supplementation of zinc in the form of plant drug would be helpful in
maintaining the normal metabolism of the cells.
Ca salts provide rigidity to the skeleton and calcium ion plays an
important role in many metabolic processes. Many neuromuscular and other
cellular functions depend on the maintenance of the ionized calcium
concentration in the extracellular fluid. Calcium fluxes are important
mediators of hormonal effects on target organs through several intracellular
signaling pathways (FAO/WHO, 1998) Phosphorous is also important in bone
87
formation and many essential metabolic activities in the body such as
phosphorylation reactions. Mg plays an important role in the metabolism of
calcium (Al-Ghamdi et al., 1994). Soft tissue magnesium functions as a
cofactor of many enzymes involved in energy metabolism, protein synthesis,
RNA and DNA synthesis, and maintenance of the electrical potential of
nervous tissue and cell membranes. The presence of these minerals in the
plant extract might be responsible for the overall free radical scavenging
properties. The important minerals and vitamins found in the plant might also
be major contributors to the medicinal value of the plant. Mineral elements
may have more roles to play, than presently acknowledged, in the synergy of
phytochemicals for the health benefit of man.
In future any one of the protein present in the plants under
investigation may be targeted for the production of vaccine against liver
diseases, since the leaves of Eclipta alba and seeds of P. longum showed the
presence of many proteins Plants have been actively targeted for the
production of medically important proteins, including vaccine antigens and
monoclonal antibodies especially against Hepatitis viruses
(Mason et al., 1998 ).
In traditional medicine these two plants are regularly used for the
treatment of liver diseases. To clarify the mechanism of action of particularly
with respect to its anti-hepatotoxic effects, the antioxidative and free radical
scavenging capabilities of the extract were evaluated.
88
The DPPH radical is a stable organic free radical with absorption of
maximum band around 515–528 nm and thus it is a useful reagent for
evaluating antioxidant activity of compounds (Sanchez-Moreno, 2002). The
BHE demonstrated a concentration dependent scavenging activity by
quenching DPPH radicals It has been documented that cysteine, glutathione,
ascorbic acid, tocopherol, polyhydroxy aromatic compounds (e.g.,
hydroquinone, pyrogallol, gallic acid), reduce and decolorize 1,1-diphenyl-2-
picrylhydrazine by their hydrogen donating capabilities (Blois, 1958). The
plant is reported to contain the phytoconstituents eclalbatin, alpha-amyrin,
ursolic acid,oleanolic acid (Upadhyay et al., 2001) might be responsible for
DPPH scavenging activity of the BHE.
Super oxide anions are the most common free radicals in vivo and
are generated in a variety of biological systems and the concentration of super
oxide anions increases under conditions of oxidative stress (Lee et al., 2002).
In the NBT the BHE demonstrated a concentration-dependent
scavenging activity by neutralizing super oxide radicals. More over BHE was
found to contain 252mg ascorbic acid equivalents/g extract The earlier
photochemical studies indicate the presence of various long-chain esters and
amides, alkaloids, lignans, neolignans, amides, terpenes, steroids, chalcones,
flavones and flavanones in P. longum extract (Parmar et al., 1999; Stohr
et al., 2001) could account for the quenching of super oxide radicals.
BHE neutralized hydroxyl radical induced deoxyribose cleavage in
a concentration dependent manner. Hydroxyl radicals are extremely reactive
89
oxygen species capable of modifying almost every molecule in the living cells
and also has the capacity to cause strand damages in DNA leading to
carcinogenesis, mutagenesis, and cytotoxicity. These are capable of quickly
initiating the lipid peroxidation process as by abstracting hydrogen atoms
from unsaturated fatty acids (Aruoma, 1998). These results clearly
demonstrated the capacity of BHE to quench hydroxyl radicals and also to
chelate the iron metal ions. Several unsaturated amides, aristolactams,
lignans,long and short chain esters, terpenes,steroids and alkaloids were
already been reported in the plants which were used for the preparation of
BHE may be responsible for the hydroxyl radical scavenging activity.
In addition to reactive oxygen species, nitric oxide is also implicated
in inflammation, cancer and other pathological conditions (Moncada et al.,
1991). A potential mechanism of oxidative damage is the nitration of tyrosine
residues of proteins, peroxidation of lipids, degradation of DNA and
oligonucleosomal fragments (Hemnani and Parihar, 1998). Nitric oxide or
reactive nitrogen species, formed during its reaction with oxygen or with
super oxide, such as NO2, N2O4, N3O4, nitrate and nitrite are very reactive.
These compounds alter the structure and function of many cellular
components. The BHE was effective in reducing the generation of nitric oxide
radicals in our study. Any compound, natural or synthetic, with antioxidant
properties might contribute towards the partial or total alleviation of this
damage (Lin et al., 1995).
The reducing potential of BHE increased in a dose-dependent
manner. The reducing capacity of compound may serve as a significant
90
indicator of its potential antioxidant activity (Meir et al., 1995). The
absorbance values of the extract at different concentrations were found to be
less than that of the reference compound. The phenolic compounds may
contribute directly to antioxidative action. Based on these results, it might be
concluded that BHE is an electron donor capable of neutralizing free radicals.
This would have the effect of converting free radicals to more stable products
and thus terminating free radical initiated chain reactions. Yahara et al.,1997
reported the presence of phytoconstituents such as triterpene glycoside,
saponins like eclalbasaponin, 3β, 2Oβ, 16β -trihydroxytaraxastane; 3 β,20
β,28-trihydroxytaraxastane and sulphated saponins in the leaves of E.alba.
These phytochemicals might be account for the reduction reactions exhibited
by BHE.
Hydrogen peroxide is formed by two-electron reduction of O3 which
is not a free radical, but an oxidizing agent. In the present investigation the
BHE effectively scavenged the H2O2 radicals. Inhibition of free radical
induced damage by supplementation of antioxidants has become an attractive
therapeutic strategy for reducing the risk of diseases (Brash and Harve, 2002).
H2O2 can easily cross the cell membrane and exerts an injurious effect on
tissues through a number of different mechanisms such as, perturbing
intracellular Ca2+ homeostasis, increasing intracellular ATP, inducing DNA
damage, and cell apoptosis (Mallakckakron et al., 2004). The compounds
piperlonguminine, piperine, apigenin, dimethyl ether and β sitosterol were
reported by Parmar et al., in the P. longum species which was used in the
preparation of BHE could be responsible for its H2O2 scavenging activity.
91
A significant result were obtained from BHE on the metal chelating
activities of Fe2+ and Fe3+. The phenolic compound may contribute directly
to antioxidative action. Based on these results, it might be concluded that
BHE is an electron donor capable of neutralizing free radicals. The extracts of
spices and herbs may well act as electron donors and they can react with free
radicals to convert them into more stable products and terminate radical chain
reactions. Phenolic compounds in plants act as antioxidants by chelating
metal ions, preventing radical formation, and improving the antioxidant
endogenous system (Tanaka et al., 1998). The antioxidant activity of BHE is
probably due to its phenolic contents. Polyphenolics is a highly inclusive term
that covers many different subgroups of phenolic acids and flavonoids. More
than 5000 polyphenolics, including over 2000 flavonoids have been
identified, and the number is still growing (Harborne, 1996). BHE contained
considerable amount of the flavonoid and phenolic compounds. The phenolic
compounds exhibit considerable free radical scavenging activities, through
their reactivity as hydrogen- or electron-donating agents, and metal ion
chelating properties (Rice et al., 1996). According to Pietta, 2000 flavonoids
are a class of secondary plant phenolics with powerful antioxidant properties.
So the presence of considerable amount of these compounds could be
accounted for the free radical scavenging activities.
The total antioxidant activity of BHE was measured using ferric
thiocyanate test which determines the amount of peroxide produced at the
initial stage of lipid peroxidation. Lower absorbance indicates a higher level
of antioxidant activity. Flavonoids exert a protective effect against lipid per
92
oxidation in vitro as free radical scavengers and metal-chelating agents
(Afanasev et al., 1989). They generally occur as O-glycosides in which one or
more of the hydroxyl groups are bound to sugars. This glycosylation renders
flavonoids more water soluble, making them store readily in the cell vacuole
where they are commonly found (Robards and Antolovvich, 1997). The
above-mentioned effects might be expected for the BHE in reducing the lipid
peroxidation.
The oxidative protein damages, provoked by free radicals, have
been demonstrated to play a significant role in ageing and several
pathological events (Stadtman and Levin, 2000). Major molecular
mechanisms, leading to structural changes in proteins are free-radical
mediated protein oxidation characterized by carbonyl formation (PCO). The
test drug BHE was effective in reducing the PCO formation. This might be
due to the cumulative effect of the phytochemicals present in it.
Oxidative DNA damage has been implicated to be involved in
various degenerative diseases (Jenner, 1991) including Alzheimer's disease,
Parkinson's disease, Hodgkin's disease and Bloom's syndrome (Imlay and
Linn, 1988). The decrease in the Fenton's reaction-mediated degradation of
DNA by the presence of BHE suggested that these extracts have compounds
which may combat against free radical-mediated degradation to the
deoxyribose sugar moiety of DNA.
REFERENCES
Afanas’ev IB, Dorozhko AI, Brodskii AV, Koostyuk VA, Potapovitch AI, Chelating and free radical scavenging mechanisms of inhibitory action of rutin and quercetin in lipid peroxidation. Biochemical Pharmacology 1989;38:1763-1769.
Al-Ghamdi SM, Cameron EC, Sutton RA. Magnesium deficiency: pathophysiological and clinical overview. Am J Kid Dis 1994;24: 737-754.
Aruoma OI. (1994). Nutrition and health aspect of free radicals and antioxidants. Food Chem Toxicol 1994;32:671-683.
Aruoma OI. Free radicals, oxidative stress, and antioxidants in human health and disease. Journal of American Oil Chemists Society 1998;75:199-212.
Black HS, Herd JA, Goldberg LH, Wolf JE, Thornby JH,Rosen T, et al., Evidence that a low fat diet reduces the occurrence of non-melanoma skin cancer. Int J Cancer 1995;62:165-169.
Blois MS. Antioxidant determination by the use of a stable free radical Nature 1958;181:1199-1200.
Ceriello A. New insights on oxidative stress and diabetic complication may lead to a ‘‘causal” antioxidant therapy. Diabetes Care 2003;26: 1589-1596.
Cerutti PA. Oxidant stress and carcinogenesis. Eur J Clin Invest 1991;21:1-11.
Damodara Reddy V, Saayi Krushna G, Padmavathi P, Varadacharyulu NC. Afr J Biochem Res2007 Nov ;1(6):101-105.
Droge W. Free radicals in the physiological control of cell function. Physiol Rev 2002;282:47-95.
Fallah HSM, Alavian HR, Heydari MR, Abolmaali K The efficacy of Liv-52 on liver cirrhotic patients: a randomized, double blind, placebo-controlled first approach. Phytomedicine 2005;12(9): 619-624.
FAO/WHO). Vitamin and mineral requirements in human nutrition, a report of a joint FAO/WHO expert consultation, Bangkok, Thailand: 1998. p.21-30.
Farber JL. Mechanisms of cell injury by activated oxygen species. Environ Health Perspect 1994;102:17-24.
Folch,J, Lee M and Stanley, G.S.H (1957) A sample method for the isolation and purification of total lipids from animal tissues, J Biol Chem 1957; 26:497-501.
Fridovich I. Fundamental aspects of reactive oxygen species, or what’s the matter with oxygen? Annals of the New York Academy of Sciences 1999;893:13-18.
Halliwell B, Gutteridge JMC, Aruoma OI. The deoxyribose method: a simple assay for determination of rate constants for reaction of hydroxyl radicals. Anal Biochem 1987;165: 215–219.
Halliwell B, Gutteridge JMC. Free radicals in biology and medicine 3rd ed. London: Oxford University Press; 1999.
Harborne JB. The Flavonoids: Advances in Research Since1986, Ed. London UK: Chapman and Hall; 1996.
Harman D. Free radical theory of aging: origin of life, evolution, and aging. Age 1980;3:100-102.
Hemnani T, Parihar MS. 1998. Reactive oxygen species and oxidative DNA damage. Indian Journal of Physiology and Pharmacology 1998;42:440.
Hippeli S, Elstner EF. Transition metal ion-catalyzed oxygen activation during pathogenic processes. FEBS Letters 1999;443:1-7.
Imlay JA, Linn S. DNA damage and oxygen radical toxicity. Science 1988;240:1302-1309.
Jenner P. Oxidative stress as a cause of Parkinson's disease, Acta Neurologia Scandia 1991;84:6-15.
Kahkonen MP, Hopia AI, Vuorela HJ, Rauha JP, Pihlaja K, Kujala TS, Heinonen M. Antioxidant activity of plant extracts containing phenolic compounds. J Agric Food Chem 1999;47: 3954-62.
Kinghorn AD, Balandrin MF.Human medicinal agents from plants.Am Chem Soc Symp Ser 1993;534:2-12.
Kokate CK, Purohit AP, Gokhale SB. Analytical Pharmacognosy: photochemical investigations in: Prakashan N. (Ed.), Pharmacognosy, 5th ed. India: Nirali Prakashan;1997. p.119-137.
Lee JC, Kim HR, Kim J, Jang YS. Antioxidant activity of ethanol extract of the stem of Opuntia ficus-indica var. saboten. Journal of Agricultural and Food Chemistry 2002;50:6490-6496.
Levander OA (1997). Nutrition and newly emerging viral diseases. An overview. D Nutr 1997;127: 9485-9490.
Lin JM, Lin CC, Chen MF, Ujiie T, Takata A. Radical scavenging and antihepatotoxic activity of Ganoderma formosanum, G. lucidum and G. neo -japonicum . Journal of Ethanopharmacology 1995;47:33-41.
Lowry OH, Rosebrough NJ, Farr AL, Randall RJ. Protein measurement with folin – phenol reagent. J Biol Chem 1951;193:265-275.
Mallakckakorn P, Tollda M, Mcrakami Y, Matsumoto K, Watanabe H.Antioxidant and free radical-scavenging activity of Choto-san and its related constituents. Biological Pharmaceutical Bulletin 2004;27:38-46.
Marcocci L, Maguire JJ, Droy-Lefaix MT, Packer L. The nitric oxide scavenging Properties of Ginkgo biloba extract EGb761. Biochem Biophys Res Commun 1994;201:748-755.
Mason HS, Haq TA, Clements JD, Arntzen CJ. Edible vaccine protects mice against Escherichia coli heat-labile enterotoxin (LT): potatoes expressing a synthetic LT-B gene. Vaccine 1998;16:1336-1343.
Maxwell SRJ. Prospects for the use of antioxidant therapies.Drugs 1995;49:345-361.
Mckenzie RC, Rafferly TS, Beckett CJ. Selenium: an essential element for immune function. Immunol Today 1998;19:342-345.
Meir S, Kanner J, Akiri B, Hadas SP. Determination and involvement of aqueous reducing compounds in oxidative defense systems of various senescing leaves. Agric Food Chem 1995;43:1813-1817.
Mitsuda H, Yasumodo K, Iwami F. Antioxidant action of indole compounds during the autoxidation of linoleic acid. Eiyo to Shokuryo 1996;19:210–214.
Moncada A, Palmer RMJ, Higgs EA. Nitric oxide: Physiology, Pathophysiology and Pharmacology. Pharmaco Reviews 1991;43:109-142.
Moskovitz J, Yim KA, Choke PB. Free radicals and disease. Arch Biochem Biophys 2002;397:354-359.
Oyaizu M. Studies on products of browning reaction prepared from glucoseamine. Jap J Nutr 1986; 44: 307–315.
Parmar VS, Kumar A, Prasad AK, Singh SK, Kumar N, Mukherjee S, Raj HG, Goel S, Errington W, Puar MS. Synthesis of E- and Z-pyrazolylacrylonitriles and their evaluation as novel antioxidants. Bioorg Med Chem 1999;7:1425-1436.
Pietta PG. Flavonoids as antioxidants. Journal of Natural Products 2000;63:1035–1042.
Rice-Evans CA, Miller NJ, Bolwell PG, Bramley PM, Pridham JB. The relative antioxidant activities of plant-derived polyphenolic flavonoids. Free Radic Res 1995;22:375-383.
Rice-Evans CA, Miller NJ, Paganga G. Structure-antioxidant activity relationship of flavonoids and phenolic acids. Free Radical Biology and Medicine 1996;20:933-956.
Robak J, Gryglewski RJ. Flavonoids are scavengers of superoxides anions. Biochem Pharmacol 1988;37:837–841.
Robards K, Antolovvich M. Analytical chemistry of fruit bio-Xavonoids. A review Analyst 1997; 122: 11–34.
Ruch kJ, cheng SJ, klauning JE. Prevention of cytotoxicity and inhibition of intercellular communication by antioxidant catechin isolated from Chinese green tea. Carcinogenesis 1989; 10:1003–1008.
Sanchez-Moreno C. Methods used to evaluate the free radical scavenging activity in foods and biological systems. Food Science and Technology International 2002;8:121-137.
Shahidi F, Wanasundara PKJPD. Phenolic antioxidants. Critical Review in Food Science and Nutrition 1994;32:67-103.
Shimada K, Fujikawa K, Yahara K, Nakamura T. Antioxidative properties of Xanthan on the autoxidation of soybean oil in cyclodextrin emulsion. J Agric Food Chem 1992;40:945–948.
Silva BA, Ferreres F, Malva JO, Dias ACP.Phytochemical and antioxidant characterization of Hypericum perforatum alcoholic extracts. Food Chem 2005;90:157-167.
Slinkard J, Singleton VL. Total phenol analysis: automation and comparison with manual methods. Am J Enol Vitic 1977;28:49–55.
Sofowara A. Medicinal plants and Traditional medicine in Africa. Ibadan Nigeria: Spectrum Books Ltd; 1993.p.289
Stadtman ER, Levin RL. Protein oxidation. Annals of the New York Academy of Sciences 2000;899:191-208.
Stohr JR, Xiaso PG, Bauer R. Constituents of Chinese Piper species and their inhibitory activity on prostaglandin and leukotriene biosynthesis in vitro. J Ethnopharmacol 2001;75:133-139.
Sultan S, Perwaiz S, Iqbal M, Athar M. Crude extracts of hepatoprotective plants, Solanum nigrum and Cichrium intybus inhibit free radical mediated DNA damage. J Ethanopharmacol 1995;45:189–192.
Tanaka M, Kuie CW, Nagashima Y, Taguchi T. Application of antioxidative Maillard reaction products from histidine and glucose to sadine products. Nippon Suisan Gakkaishi 1988; 54:1409–1414.
Tripathi YB, Singh AV, Dubey GP. Antioxidant property of the bulb of Scilla indica. Science 2001;80:1267-1269.
Upadhyay RK, Pandey MB, Jha RN, Pandey VB. Eclalbatin, a triterpine saponins from Eclipta alba. J Asian Nat Prod Res 2001;3:213-217.
Wang BS, Lin SS, Hsiao WC, Fan JJ, Fuh LF, Duh PD. Protective effects of an aqueous extract of Welsh onion green leaves on oxidative damage of reactive oxygen and nitrogen species. Food Chem 2006;98:149–157.
Wang L, Yen JH, Ling HL,Wu MJ. Antioxidant effect of methanol extracts from lotus plumule and blossom (Nelumbo nucifera Gertn). J Food DrugAnal 2003;11:60–66.
Yahara S, Ding N, Nohara T, Masuda K, Ageta H. Taraxastane glycosides from Eclipta alba. Oxford : Elsevier Science Ltd. Phytochemistry 1997 jan; 44 (1): 131-135.
Zhishen J, Mengcheng T, Jianming W. The determination of flavonoid contents in mulberry and their scavenging effects on superoxide radicals. Food Chem 1999;64:555–559.
93
HEPATOPROTECTIVE STUDIES
Early tests for pharmacological activity were done with animal models,
but numerous methods have not been introduced for testing of biological
activity. A related area of interest is the scientific study of “Nutraceuticals”
i.e.., plants used for food but also taken regularly as a preventive measure
against disease.
Worldwide several people are suffering from hepatic damage induced
by alcohol and drug abuse. The liver plays a major role in the digestion,
metabolism and storage of nutrients. Today an increasing impact of liver
disease and liver injury is being recognized. Especially liver injury due to
pharmacological treatment plays a significant role. (Gerbes et al., 2006)
reported that during recent years new insights have been brought into the
pathomechanisms of liver injury. In certain cases this provides the basis for
novel therapeutic strategies.
Carbon tetrachloride (CCl4) is a toxic substance that is used to induce
liver damage in rats, and according to (Ohta et al., 1998). CCl4 by itself does
not have cytotoxic effects on the liver but its metabolic products are
responsible for the toxicity. CCl4 can damage a number of tissues particularly
the liver and kidney of many species (Drill, 1952). Administration of CCl4
can cause cirrhosis (Cameron and Karunaratne, 1936) and ultimately lead to
hepatic carcinoma (Reuber and Glover, 1970).
94
It has been reported that CCl4 intoxication results in the peroxidation of
lipids and lipid membranes of rats. Ohta et al. (1997) observed an increase in
lipid peroxidation (LPO) as a result of CCl4 treatment. Therefore CCl4, a
hepatotoxin for evaluating hepatoprotective agents, is commonly used to
induce liver damage by producing free radical intermediates.
Studies on hepatotoxicity induced by CCl4 indicated that hepatic
damage can probably be prevented by some herbal extracts. Herbs are also
known to play a vital role in the management of various hepatic disorders
Venkateswaran et al., 1998).
Hepatoprotective studies by Mitra et al. (1998) showed that plants have
active ingredients that are capable of free radical scavenging in living
systems. The dependence of humankind on plants is as ancient as
evolutionary history. Plants play a significant role in maintaining human
health and improving the quality of human life. Many synthetic antioxidants,
such as Butylated hydroxyanisole, butylated hydroxytoluene,
t-butylhydroquinone and propyl gallate, are used to retard lipid peroxidation
(Wanita and Lorenz, 1996). However, the use of synthetic antioxidants is
under strict regulation due to the potential health hazards caused by such
compound (Park et al., 2001).
It was therefore decided to investigate the in vivo, hepatoprotective
efficacy of the ethanolic extracts of E. alba and P. longum and the combined
biherbal formulation made up of equal concentrations of E. alba and
P. longum a traditional Indian medicinal plant, on CCl4-induced
95
hepatotoxicity and to elucidate the mechanism underlying these protective
effects in rats.
It was also found important to determine the acute toxicity value
(LD50) of the Biherbal extract in mice and to determine histologically the
chronic toxicity effects of Biherbal extract on the internal organs of rats.
Animals
Adult albino male rats of Wister strain (150-175g) and mice (27-35g)
obtained from animal house in Madras Medical College, Chennai, India were
used in the pharmacological and toxicological studies. The animals were
maintained in well - ventilated room temperature with natural 12±1 hr day-
night cycle in the propylene cages. They were fed with balanced rodent pellet
diet from Poultry Research Station, Nandanam, Chennai, India and tap water
ad libitum was provided throughout the experimental period. The animals
were sheltered for one week prior to the experiment for getting acclimatized
to laboratory temperature. The protocol has got the ethical committee
clearance from IAEC (Institute Animal Ethical Committee) of CPCSEA
(Committee for the Purpose of Control and Supervision of Experiments on
Animals).
Chemicals
Ammonium thiocyanate, Ferric chloride, Ferrous sulphate (FeSO4),
Potassium ferricyanide [K3 Fe(CN)6], Potassium thiocyanate, Sodium
carbonate, Sodium dodecyl sulphate (SDS), Ethylene diamine tetra acetic acid
96
(EDTA), Trichloro acetic acid (TCA), Thiobarbituric acid (TAB), Sodium
nitroprusside, Sulphanilamide, Phosphoric acid, Naphtyl ethylene diamine
dihydrochloride, Reduced Glutathione (GSH), 1-chloro-2,4-dinitrobenzene
(CDNB), Glutathione oxidised (GSSG), Epinephrine, Nicotinamide Adenine
Dinucleotide Phosphate (NADPH) were obtained from Sd Fine Chemicals
Ltd., India. Bovine Serum Albumin (BSA), Folin-Ciocalteu reagent, 5,5-
dithio bis(2-nitrobenzoic acid) (DTNB), 2,2′-bipyridyl] were obtained from
Sigma Chemical Company, St. Louis, USA. All other chemicals and reagent
used were of analytical grade.
Acute toxicity
Biherbal extract (100mg/ml), will be used as a stock solution in the
entire study. A stock solution will be prepared by dissolving 100mg in 10 ml
of 2% Tween 80 as a vehicle (Adjuvant). Either sex of albino mice, weighing
27 – 35 g will be used in both acute toxicity experiments.
An initial test will be carried out to determine the approximate lethal and non-lethal
doses of the Biherbal extract according to R. A. Turner (1965)
1. Acute toxicity test was performed according to the World
Health Organization (WHO) guideline (WHO, 2000) and the Organization of
Economic Co-operation and Development (OECD) guideline for testing of
chemicals (OECD, 2001). An initial test will be carried out to determine the
approximate lethal and non-lethal doses of the Biherbal extract according to
Turner, 1965.
97
2. Eight groups of eight mice each will be used in the experiments.
The Biherbal extract, in doses of 0.05, 0.1, 0.25, 0.5, 1.0, 2.0, 4.0 and 5.0g/kg
body weight respectively will be administered orally, using intragastric tubes,
to the animals as a single dose. The control group will be given an equal
volume of 2% Tween 80. All the animals will be observed at the first, second,
fourth and sixth hours and thereafter once daily over 14 days for (Rhodes,
1999), clinical signs of toxicity such as respiratory pattern, colour of body
surfaces, frequency and nature of movement, marked involuntary contraction
or seizures of contraction of voluntary muscle, and loss of reflex etc, and the
number of dead mice will be recorded and used in the calculation of the acute
toxicity value (LD50). The mice will also be observed for other signs of
toxicity, such as, excitation, tremors, twitches, motor coordination, righting
reflex and respiratory changes. Twenty-four hours after the oral dosing the
animals were lightly anaesthetized with ether and blood was withdrawn from
the orbital plexus. They were then killed by cervical dislocation and vital
organs were dissected out. Organ to body weight ratio, various
haematological and biochemical variables were studied. Tissues of vital
organs viz., lung, liver, kidney, spleen, heart and testis or ovaries were fixed
in 10% buffered formalin for microscopic examination. Standard procedures
were used for the analysis of haematological, biochemical and histological
parameters.
Chronic toxicity study
Male and female Wistar rats were kept in polypropylene cages with
maximum of four animals per cage at constant conditions. Temperature was
98
set to 23 ± 2º C, relative humidity to 60 [+ or -] 10%. The animals were kept
under artificial illumination with a photoperiod of 12 h. Water was available
ad libitum. Each cage was labelled with the allocation of the animals to the
respective trial group, and the diet to be used. Whenever more than one
animal was kept in a cage, the animals obtained colour markings for
differentiation. The cages were tended at regular intervals. The care and
treatment of the rats were in accordance with the institutional ethical
committee guidelines. All the animal experimentation was carried out with
the prior approval from CPCSEA. Basic diet was dry pellet feed (Sai Meera
Foods, Bangalore).
Thirty six weanling rats (18 female, 18 male) with an average initial
body weight of 100 (female rats) and 110g (male rats) were allocated to three
groups. Each group consisted of six male and female randomly allocated
animals. The first group served as control and obtained standard diet. The
second group obtained diet with Biherbal extract 25mg/kg, the third group
obtained diet with Biherbal extract 50mg/kg. After 3 months, four male and
four female animals of each group were sacrificed for toxicity testing. The
remaining two male and female animals were set to standard diet and
observed for additional 4 weeks in order to detect deviations in spontaneous
behaviour or growth parameters prior to sacrificing and submission to the
same toxicological examination.
Twenty-four hours before the animals were sacrificed, blood samples
were taken for the examination of haematological and biochemical
parameters. Laboratory parameters such as blood glucose, total blood protein,

99
ALT, AST and total cholesterol, red and white blood cell count and
differential leucocyte count were carried out according to standard
procedures. The animals were killed by cervical decapitation under ether
anaesthesia. The major organs (liver, lungs, kidneys, heart, testis and ovaries)
were removed and macroscopically examined for physiological abnormalities.
The organs were then submitted to histological examination.
HEPATOPROTECTIVE EFFICACY STUDIES
Experimental protocol
The rats were divided into seven groups of six animals each and were
given dose schedule as given below:
Group 1 : Animals were given a single administration of 0.5 ml
vehicle 2% v/v aqueous Tween-80 p.o daily for
14 days. This group served as normal control.
Group 2 : Animals were given a single dose of 2ml/kg, p.o CCl4
in 2% v/v aqueous Tween-80 daily for 7 days.
Group 3 : Animals were pre-treated with 50 mg/kg, p.o of BHE
in 2% v/v aqueous Tween-80 for 14 days intoxicated
with CCl4 on days 7 to 14.
Group 4 : Animals were pre-treated with 50 mg/kg, p.o of MAE
in 2% v/v aqueous Tween-80 for 14 days intoxicated
with CCl4 on days 7 to 14.
100
Group 5 : Animals were pre-treated with 50 mg/kg, p.o of PLE
in 2% v/v aqueous Tween-80 for 14 days intoxicated
with CCl4 on days 7 to 14.
Group 6 : Animals received 50 mg/kg, p.o Silymarin in 2% v/v
aqueous Tween-80 daily for 14 days and administered
with CCl4 on days 7 to 14. This group served as
positive control.
Group 7 : Animals received only 50 mg/kg, p.o of BHE in 2%
v/v aqueous Tween-80 daily for 14 days.
On the 15th day after the experimental period the body weight of the
animals were recorded. The animals were sacrificed after 12 hrs fasting under
mild pentobarbitone anaesthesia. Blood was collected and the serum was
separated by centrifuging at 3,000 rpm for 10 min. The serum was used for
analysing various biochemical parameters. A portion of blood was used for
certain biochemical estimation. Liver was excised from the animals, washed
in ice-cold saline, and dried gently on the filter paper. The weight of the liver
was taken. A 10% liver homogenate was prepared in Tris HCl buffer [0.1M
pH 7.4]. The homogenate was centrifuged and the supernatant was used for
the assay of various parameters.
Biochemical analysis - Blood and Serum
Estimation of Glucose
The blood glucose was estimated by Orthotoluidine method by
Hyvarimen and Nikkila (1962).
101
Reagents
1. 10% TCA
2. Orthotoluidine reagent: 12.5gms of thiourea and 12.0 gms of
boric acid were dissolved in 50ml of distilled water by heating.
75ml of Orthotoluidine (redistilled) and 375 ml of glacial acetic
acid were mixed separately. These two solutions were mixed
and the total volume was made up to 500ml with distilled water.
The reagent was left overnight in the refrigerator and filtered.
3. Glucose standard: 100mg of pure glucose was dissolved in
100ml-distilled water containing 0.01% benzoic acid.
Procedure
To 0.1ml whole blood 1.0 ml of 10% TCA was added. The above
mixture was centrifuged to precipitate the proteins. To 1ml of the above
supernatant 4.0 ml of orthotoluidine reagent was added. Aliquots of standard
containing different concentrations of glucose were made up to 1.0ml with
water and 4.0 ml of orthotoluidine reagent was also added. Mixed well and
kept in boiling water bath for 8mts. Cooled and read at 610nm against the
blank which contained 1ml of water and 4.0 ml of orthotoluidine reagent. The
values were expressed as mg/dl blood.
Estimation of Urea
Blood urea was determined by the method of Bousquet et al. (1971).

102
Reagents
1. 10% Sodium tungstate
2. 2/3 N Sulphuric acid
3. DAM-TSC (Diacetyl monoxime –Thiosemicarbazide) reagent:
36mM Diacetyl monoxime and 61.7mM thiosemicarbazide
were dissolved in100 ml of 2% glacial acetic acid.
4. Acid ferric reagent: 3.6ml sulphuric acid, 0.12mg of ferric
chloride and 38.6ml Orthophosphoric acid were mixed and
made upto 100ml with distilled water.
5. Standard Urea: 10mg of urea was dissolved in 100ml of distilled
water.
Procedure
In a test tube 0.1ml of blood was taken. To that 3.3 ml of water, 0.3ml
of 10% sodium tungstate and 0.3ml of 2/3N sulphuric acid were added to
precipitate the proteins. The mixture was centrifuged and to 1ml of the
supernatant fluid 1 ml of water, 0.4 ml of DAM reagent and 1.6ml of acid
ferric reagent were added and placed in a boiling water bath for 30 minutes.
Aliquots of the standard urea and blank containing 2.0ml of water were also
treated in the similar manner. After cooling the colour developed was read at
520nm using spectrophotometer.
The values were expressed as mg/dl.
103
Estimation of Bilirubin
Serum bilirubin was estimated by the method of Malloy and Evelyn
(1937).
Reagents
1. Absolute methanol
2. 1.5% HCl
3. Diazo reagent
Solution A: Dissolve 1gm of sulphanilic acid in 15ml conc. HCl
and made up to 1 litre with distilled water.
Solution B: 0.5gm of sodium nitrite dissolved in 100ml distilled
water.
Solution C: Mixed 10ml of solution A and 0.3ml of solution B.
4. Stock Standard: 10 mg of bilirubin was dissolved in 100ml of
chloroform.
5. Working standard: Stock solution was diluted 1 in 5 times.
Procedure
In a test tube 0.2 ml of serum was taken, and 1.8ml of distilled water
was added. A blank was set up by adding 0.2ml of 1.5% hydrochloric acid. To
all the test tubes 1.0 ml of diazo reagent was added. Finally to all the test
tubes 2.5 ml of methanol, was added and allowed to stand at room
temperature for 30 mts in dark and read at 540nm. For the standard curve,
pipetted out various concentrations of bilirubin in to a series of test tubes,
made up the volume in all the tubes with 2.5ml of methanol and added 1ml of
diazo reagent was added and read colorimetrically.
104
Estimation of Total Protein
Estimation of total protein was carried out by the method of Gornall
(1949).
Reagents
1. Biuret reagent. Weighed 1.50 gm of cupric sulphate and 6.0 gm
of sodium potassium tartrate transferred to a dry 1 litre
volumetric flask, and dissolved it in about 500 ml of water with
constant swirling. Added 300 ml of 10 per cent sodium
hydroxide. Finally the volume was made up to 1 litre with
water, mixed, and stored in a cool dry place.
2. 22.6% sodium sulphate.
3. Std Protein solution: 400mgs of BSA was dissolved in 100 ml
of distilled water.
Procedure
In to the test tube marked as “B” pipetted 2.0 ml of sodium sulphate
solution. In to the “t” test tube, 0.5 ml. of serum and 9.5 ml of sodium
sulphate were taken. Stoppered the tube and mixed thoroughly by inversion.
From that mixture 2 ml was transferred to another test tube. Standard protein
solution was also treated in the same way. Now into each of the three test
tubes pipetted 8.0 ml of biuret reagent and mix thoroughly. Allowed these to
stand for 30 minutes at room temperature. Using a photoelectric colorimeter,
or spectrophotometer, the colour intensity was measured at 540 nm.
The amount of serum protein was expressed as g / dl.
105
Estimation of Albumin
The albumin present in the serum was estimated by the method of
Reinhold (1953).
Reagents
1. Biuret reagent – Prepared as mentioned earlier
2. Ether
3. Sulphate – Sulphite Reagent: About 20.8g of sodium sulphate
and 7.0g of sodium sulphite were dissolved in about 90ml
water, with constant stirring. Then 0.02ml of conc. H2SO4 was
added and made up to 100ml with distilled water.
Procedure
To 0.4ml of serum, 5.6ml of sodium sulphate-sulphite reagent and
3ml ether was added, the test tubes were stoppered and shaken well. Care
should be taken not to shake more vigorously, otherwise the albumin may
denature. The tubes were capped and centrifuged for 5mts. The pipette was
inserted into the clear solution carefully below the globulin layer, and 3ml of
solution was taken, 5ml of biuret reagent was added and incubated for 30 min
at room temperature. The violet color was read at 540nm.
The amount of serum albumin was expressed as g/dl.
106
Estimation of Globulin
Albumin was subtracted from the total protein to obtain the amount of
globulin. The amount of serum globulin was expressed as g/dl.
Estimation of Cholesterol
Estimation of serum cholesterol was carried out by the method of
Wybenga et al. (1970).
Reagents
1. Cholesterol reagent. Dissolved 520 mg of Ferric per chlorate in
600 ml ethyl acetate, contained in a 1-liter Erlenmeyer flask.
Placed the flask in an ice bath and cooled the contents to 4°C
added gradually 400 ml of cold concentrated sulphuric acid. in
small portions, mixed after each portion is added, and not
allowed the temperature to exceed 45°C.
2. Cholesterol standard: 200 mgs of cholesterol per 100 ml of
glacial acetic acid.
Procedure
Added 50 µl of cholesterol standard and 50µl of serum was taken to
the vials marked “Standard” and “Test,” respectively, and added 5 ml of
cholesterol reagent mixed the contents of each vial thoroughly for at least
10 seconds. Cooled and the absorbance is read in the spectrophotometer at
107
560 nm against the blank, which contained 50 µl of glacial acetic acid and
5 ml of cholesterol reagent.
Cholesterol concentration was expressed as mg/ dl of serum.
Estimation of Triglycerides (TGL)
The triglycerides were estimated by the method of based on the
method of Rice and Vanhandle (1970).
Reagents
1. Chloroform: methanol mixture 2:1 (v/v)
2. Saturated sodium chloride
3. Activated silicic acid: Silicic acid was washed with 4N HCl and
then distilled water until the pH was neutral. After drying, ether
was added in sufficient amount, stirred well and the supernatant
was decanted. Silicic acid was then dried at 60ºC and activated
at 100ºC over night prior to use.
4. 0.4% potassium hydroxide in ethanol.
5. Sodium meta periodate 0.1 M: 2.149 g of sodium meta
periodate was dissolved in 100 ml of water.
6. Sodium meta arsenate 0.5M: 6.496 g sodium meta arsenate was
dissolved in 100 ml of water.
108
7. Chromotropic acid : 1.14 g of chromotropic acid was dissolved
in 100 ml of dissolved in 100 ml of distilled water and stored as
a stock solution in a brown bottle. Before use this solution was
mixed with 45ml of sulphuric acid – water mixture in the ratio
of 2:1.
8. 0.2N sulphuric acid
9. Tripalmitin standard : 100 mg of Tripalmitin was dissolved in
100 ml of chloroform in a standard flask. The stock solution
was diluted to 1 in 10 times with chloroform.
Procedure
About 0.2ml of serum was mixed with 9.8 ml of Chloroform:
methanol mixture and left for 30 min. It was centrifuged and 4ml of the lipid
extract was added to the tubes containing 8ml of saturated sodium chloride
and shaken vigorously. The contents were allowed to settle for an hour and
centrifuged. The supernatant containing saline – methanol phase was
discarded. The washed chloroform phase was filtered in to a dry tube. 200mg
of silicic acid was added to chloroform phase shaken vigorously and allowed
to stand for 30 min. It was centrifuged. 0.5 ml of supernatant was taken, to
which 0.5 ml of potassium hydroxide solution was added and the mixture was
saponified in a water bath at 60ºC for 20 min, to the above mixture, 0.5ml of
0.2 N sulphuric acid was added and kept in a boiling water bath for 10 min.
After cooling the tubes 0.1ml of sodium meta periodate was added and
allowed to stand for 10 min. The excess sodium meta periodate was reduced
109
by the addition of 0.1ml sodium meta arsenate, finally 0.5 ml of
Chromotropic acid reagent was added, mixed thoroughly and kept in a boiling
water bath for 30 min. The colour developed was estimated at 540nm.
Triglycerides concentration was expressed as mg/ dl of serum.
Estimation of Phospholipids (PL)
The phospholipids content in serum was determined by the method of
Zilversmith and Davis (1950).
Reagents
1. Ethanol- ether 3:1(V/V mixture)
2. 3% Ammonium molybdate
3. 3% Ascorbic acid
4. 70% Perchloric acid
5. Standard Phosphate: 35.1 mg of potassium dihydrogen
phosphate was dissolved in 100ml of water to give a
concentration of 80 µg/ml.
6. Working Standard solution: A concentration of 8 µg/ml was
prepared by diluting the stock solution in the ratio of 1: 10 with
distilled water.
110
Procedure
To 1.0 ml of serum, 3.0 ml of the ethanol- ether mixture was added
and mixed well. The protein precipitate was separated by centrifugation and
the supernatant solvent was transferred to another tube.0.1ml of the lipid
extract was dissolved in 1ml of perchloric acid and digested on a sand bath till
the solution becomes colourless. After cooling the solution was made up to
5.0ml with double distilled water. In the standard 1ml of working standard
solution was taken. Blank contained 1ml of water. To all the tubes 0.5ml of
ammonium molybdate and ascorbic acid were added and the mixture was kept
in a boiling water bath for 6 mts. The blue color developed was read at
710 nm using a spectrophotometer. The values were expressed as mg/dl of
serum after multiplication by factor 25.
Serum Lipoproteins
Fractional precipitation of lipoproteins
Lipoproteins were fractionated by a dual precipitation technique of
Wilson and Spiger (1973).
High-density lipoprotein (HDL)
Reagents
1. Heparin –manganese chloride reagent: 3.167 g of manganese
chloride was added to 1ml solution of heparin containing 20,000
units. This mixture was made up to 8ml with distilled water.
111
Procedure
About 2ml serum was added to 0.18ml heparin- manganese chloride
reagent and mixed well. The solution was allowed to stand at 4ºC for
30minutes and then centrifuged at 2000 rpm and maintained at 10ºC for
30 minutes. The supernatant contained the HDL fraction. 1ml of this was used
for the estimation of cholesterol by the method of Wybenga as described
previously.
HDL- Cholesterol concentration was expressed as mg/ dl of serum.
Low- density lipoprotein (LDL)
Reagents
1. Sodium- dodecyl sulphate (SDS): 10% solution of SDS was
prepared in 0.15 M sodium chloride and the pH was adjusted to
9 with sodium hydroxide.
Procedure
To 2ml of serum was added to 0.15ml of sodium-dodecyl sulphate.
The contents were mixed well and incubated at 37oC for 2 hrs. The contents
were centrifuged in a refrigerated centrifuge at 10,000 rpm for
15 mts. The VLDL aggregated as pelleted. The supernatant contained the
HDL and LDL fractions. 1ml of this was used for the estimation of
cholesterol by the method of Wybenga as described previously.
LDL-Cholesterol concentration was expressed as mg/ dl of serum.
112
Very low-density lipoprotein (VLDL)
The pelleted portion contains the VLDL cholesterol. 1ml of this was
used for the estimation of cholesterol by the method of Wybenga as described
previously.
VLDL- cholesterol was expressed as mg/ dl.
Assay of serum Aspartate amino transferase (AST) (Glutamate
oxaloacetate transaminase, E.C.2.6.1.1)
Assay of serum aspartate amino transferase was carried out by the
method of Reitman and Frankel (1957).
Reagents
a. Phosphate buffer - 0.1M, pH 7.4.
b. Substrate: 2.66 gms of DL aspartate and 38 mg of α-keto
glutartate were dissolved in 20.5ml of 0.1N NaOH with gentle
heating. This was made up to 100 ml with buffer.
c. 2,4-Dinitrophenyl hydrazine reagent (DNPH): 1.0mM DNPH in
2.0 N HCl.
d. 0.4 N NaOH
e. Standard Pyruvate: 11 mg of sodium pyruvate was dissolved in
100ml of phosphate buffer. This contained 1 µmole
pyruvate/ml.
113
Procedure
In different tubes 1.0 ml of the buffered substrate was added. To one
tube 0.1ml of serum was added and incubated at 37° C for 1 hr. Then 1ml of
DNPH reagent was added to arrest the reaction. To the ‘Blank ‘tube 0.1ml of
serum was added only after the addition of DNPH reagent. The tubes were
kept aside for 15 minutes, and then 0.4 N NaOH was added and read at
520 using the spectrophotometer. Aliquots of standard were also treated in the
same manner.
Enzyme activity was expressed as U / Litre.
Assay of serum Alanine amino transferase (ALT) (Glutamate pyruvate
transaminase, E.C.2.6.1.2)
The reagents and method used were same as those used for the assay
of aspartate amino transferase except for the substrate solution and incubation
time was reduced for 30 minutes.
Reagents
1. Substrate: 1.78 gms of DL alanine, 38 mg of α-ketoglutarate
were dissolved in phosphate buffer, and 0.5ml of 0.1 N NaOH
was added and the volume was made up to 100ml with buffer.
Enzyme activity was expressed as U / Liter.
114
Estimation of Alkaline Phosphatase (ALP) (ortho-phosphoric monoester
phosphohydrolase, E.C. 3.1.3.1)
The serum alkaline phosphatase was assayed by the method of Kind
and King (1954).
Reagents
1. Carbonate – bicarbonate buffer 0.1M, pH 10.0: 6.36gm of
sodium carbonate and 3.36gm of sodium bicarbonate were
dissolved in 1000 ml of distilled water.
2. Substrate 0.01M: 254mg of disodium phenyl phosphate was
dissolved in 100 ml of water.
3. 0.5 N Sodium bicarbonate
4. 0.5N NaOH
5. 4-Amino-antipyrine (0.6%): 0.6 g was dissolved in water and
made to 100 ml.
6. Potassium Ferricyanide (2.4%): 2.4 g was dissolved in water
and made to 100 ml.
7. Stock Phenol Standard (1 mg/ ml): Pure crystalline phenol, 1 g
was dissolved in and made to 1 liter with 0.1 N HCl.
8. Working Phenol Standards (0.01 mg/ml) 1 ml, stock standard
was diluted to 100 ml with 0.1 N HCl.
115
Procedure
For the enzyme estimation four test tubes were taken and they were
marked as “B” (Blank), “T” (Test), “C” (Control) and “S” (Standard). In the
“T” test tube, 1 ml. buffer were added to 1 ml of substrate and warmed at
37°C for three min. Then 0.1 ml of serum were added and mixed. The
solution was incubated at 37° C for 15 min. To the incubated solution 0.8 ml
of Sodium hydroxide and 1.2 ml of sodium bicarbonate were added. Then
1 ml 0.6% 4-Amino-antipyrine was added and mixed. Finally 1 ml Potassium
Ferricyanide was added and mixed. The Control was treated same as test,
except that serum was added after the NaOH addition. Aliquots of standard
was also treated in the similar manner. Blank was set up same as standard, but
water is substituted for phenol. The colour developed was measured at
620 nm using the colorimeter.
The enzyme activity was expressed as IU/litre.
Estimation of Acid Phosphatase (ACP) (ortho-phosphoric monoester
hydrolase, E.C.3.1.3.2)
The serum acid phosphatase was assayed by the method of Kind and
King (1954).
Reagents
1. Citrate Buffer 0.1M, pH 4.8.

116
2. Substrate 0.01M: 254mg of disodium phenyl phosphate was
dissolved in 100 ml of water.
3. 0.5 N Sodium bicarbonate
4. 0.5N NaOH
5. 4-Amino-antipyrine (0.6%): 0.6 g was dissolved in water and
made to 100 ml.
6. Potassium Ferricyanide (2.4%): 2.4 g was dissolved in water
and made to 100 ml.
7. Stock Phenol Standard (1 mg/ ml): Pure crystalline phenol, 1 g
was dissolved in and made to 1 liter with 0.1 N HCl
8. Working Phenol Standards (0.01 mg/ml): 1 ml, stock standard,
diluted to 100 ml with 0.1 N HCl.
Procedure
Four test tubes were taken and they were marked as “B” (Blank), “T”
(test), “C” (Control) and “S” (Standard). In the “T” test tube, 1 ml of buffer
was added to 1 ml of substrate warmed at 37° C for three min. Then 0.1 ml of
serum was added and mixed. The solution was incubated at 37°C for one
hour. To the incubated solution 1.0 ml of Sodium hydroxide and 1.0 ml of
sodium bicarbonate, 1 ml 0.6% 4-Amino-antipyrine was added and mixed.
Finally 1 ml Potassium Ferricyanide was added and mixed. The Control was
treated same as test, except that serum was added after the NaOH. Aliquots of
standard were made up of 1.1 ml in alkaline buffer and treated similarly.
117
Blank was set up same as standard, but water was substituted for phenol. The
colour developed was measured at 620 nm using the colorimeter.
The enzyme activity was expressed as K.A units.
Estimation of Lactate dehydrogenase (LDH) (L-lactate:NAD oxido-
reductase, E.C.1.1.1.27)
The Lactate dehydrogenase present in the serum was assayed by the
method of King (1965).
Reagents
1. Glycine buffer 0.1M, pH 8.5: 750.5mg of glycine and 585mg of
NaCl were dissolved in 100ml of distilled water.
2. Buffered Substrate: 125ml of glycine buffer, 75ml of 0.1N
NaOH and 4.0g of lithium lactate were added, mixed well and
kept in cold room.
3. Nicotinamide adenine dinucleotide (NAD+): 10mg of NAD+
was dissolved in 2.0ml of water.
4. 2, 4- Dinitrophenyl hydrazine (DNPH) 0.02%: 20mg of DNPH
was dissolved in 100ml of 1N HCl.
5. 0.4N NaOH
6. Standard: 11mg of sodium pyruvate was dissolved in 100ml of
buffer. This contained 1 µ mole of pyruvate/ ml.
118
Procedure
Pipetted out 1.0ml of the buffered substrate and 0.1ml of serum into
two tubes and 0.2ml of distilled water was added to the blank, to the test,
0.2ml of NAD+ solution was added and shaken well. The tubes were
incubated at 37ºC for 15mts. Exactly after that time the reaction was stopped
by adding 1.0ml of DNPH solution. NAD+ was added to the control tubes. It
was left at 37ºC for another 15mts. About 5.0ml of 0.4N NaOH was added
and the color developed was read at 420nm within 5mts. A set of standards
were also treated in a similar manner.
The enzyme activity was expressed as U/L.
Estimation of Acetyl cholineesterase (ACE) (Acetylcholine
acetylhydrolase, E.C.3.1.1.7)
Determination of Acetylcholine esterase was carried out by the
method of Biggs et al. (1958).
Reagents
1. Stock buffer; Dissolved 12.37 gms of Sodium barbitone,
1.361 gms of Potassium dihydrogen phosphate and 175.35 gms
of sodium chloride in water and made to a litre
2. Stock–buffer indicator solution: Dissolve 100mg of
bromothymol blue in 2 ml of 2 N NaOH and washed in to the
1 litre flask with 150 ml of stock buffer and diluted to 950 ml
119
with water. Adjust the p H to 8.0 by adding 16 ml of HCl and
then diluted to 1 litre with water.
3. Working–buffer indicator solution: Diluted 476.2ml of the
Stock–buffer indicator solution to 1 litre with water.
4. Standard acetyl choline bromide solution: (15 %) 15 gms acetyl
choline bromide dissolved in 100ml of water.
5. Acetic acid, 0.15 N: Diluted 1 in 10 for use.
Procedure
Measured 4.2 ml of Working –buffer indicator solution in to a
suitable tube and added 0.1 ml of serum and 0.2 ml of substrate. Mixed
thoroughly and read the absorbance at 620 nm. Incubated at 37° C for
30 minutes and read again. Units of enzyme activity were expressed as
micromoles of acetic acid liberated from acetylcholine by 1 ml of serum in
30 minutes. To obtain the calibration curve a series of dilutions of acetic acid
to water was prepared which corresponds to 0 –150 units of enzyme activity
in steps of 10 units. A series of these tubes containing 2ml of stock –buffer
indicator solution, 1.4ml of water, 0.1ml of normal serum and 1ml of above
series of diluted acetic acid was added and treated as the same way as test.
A standard curve was plotted from which units of activity was calculated.
Enzyme activity expressed as U/l.
120
Estimation of Gamma glutamyl transferase (γ GT) (5 Glutamyl peptide
amino acid 5 glutamyl transferase, E.C. 2.3.2.2)
The assay of γ-Glutamyl transferase was carried out by the method of
Szasz (1969).
Reagents
1. Substrate; 30.4 mg of L-γ glutamyl-p-nitro anilide was added to
10 ml of water, heated to dissolve at 50- 60° C.
2. Tris-HCl buffer : 0.1M , pH 8.5.
3. Glycyl-glycine; 13.2 mg was dissolved in 10 ml of water
4. Standard: 13. 8 mg of p-nitro anilide was dissolved in 100ml of
distilled water.
5. 10 % acetic acid
Procedure
Into three test tubes marked as “B”, “C” and “T” 1.0 ml of buffer and
2.2 ml of glycyl glycine was added. 0.5ml of substrate solution was added in
the “B” and “T” test tubes. About 0.2ml of enzyme was added to “C” and “T”
test tubes. Incubated at 37°C for 30 minutes and 1.0 ml of 10% acetic acid
was added to all the test tubes. 0.5ml of substrate solution was added in to the
“C” tube and the absorbance was measured at 410 nm.
Enzyme activity was expressed as U/Liter.
121
Estimation of 5′-Nucleotidase (5′-NT) (5′-Ribonucleotide
phosphohydrolase, E.C. 1.1.1.42)
The 5′-Nucleotidase was assayed by the method of Luly et al. (1972),
with slight modification.
Reagents
1. Tris HCl buffer: 184 mM pH 7.5
2. Magnesium sulphate : 50mM
3. Potassium chloride: 650mM
4. EDTA :1mM
5. 2.5% Ammonium molybdate
6. 5’ Adenosine monophosphate (5’AMP) 40mM
7. ANSA - 500mg of Amino napthol Sulphonic acid was dissolved
in 195ml of 15% sodium meta bisulphate and 5ml of 20%
sodium sulphite was added to it. The solution was stored in the
brown bottle.
8. Stock Standard Phosphorous: 35.1 mg potassium dihydrogen
phosphate in 100ml of water.
9. Working Standard Phosphorous: Dilute the stock standard 1 in
10 times which contain 8mcg/1ml.
122
Procedure
The assay medium contained 1.0ml Tris HCl buffer, 0.1ml of
Magnesium sulphate, 0.1ml potassium chloride, 0.1ml of EDTA and 0.1ml of
5′AMP. The reaction was initiated by addition of 0.2ml of enzyme
preparation and incubated at 37.C for 15mts. The reaction was terminated by
the addition of 2.0 ml of 10% TCA. After centrifugation the phosphorus in the
supernatant was estimated as discussed earlier in the phospholipids.
Enzyme activity was expressed in U/ litre.
Assay of Isocitrate Dehydrogenase (ICD) (Isocitrate NADP+
oxidoreductase, E.C. 1.1.1.42)
Assay of Iso citrate dehydrogenase was carried out by the method of
Belljoice and Baron (1960).
Reagents
1. 0.15 M Sodium chloride
2. Tris-HCl buffer 0.1 M in 0.15 M Sodium chloride pH 7.5.
3. Buffered substrate: Dissolved 1.845 g of trisodium isocitrate in
100 ml of Tris buffer.
4. NADP - 10 mg /ml in 0.15 M Sodium chloride
5. Reduced NADP - 10 mg /ml in 0.15 M Sodium chloride
6. Manganous chloride - 0.03 M in 0.15 M Sodium chloride
123
7. Standard α-oxoglutaric acid - Stock containing 70 mg/ 100ml
water. Diluted this 1 in 10 for use.
8. EDTA-Dissolved 5.6 gms in 100ml of water by adjusting the
pH 8.0 using NaOH pellets.
9. 2,4-Dinitrophenyl hydrazine - Dissolved 19.8 mg 2,4-
Dinitrophenyl hydrazine in 1 N HCl and made upto 100ml with
water.
10. 0.4 N NaOH.
Procedure
The assay medium contained 0.5ml α-oxoglutaric acid, 0.1ml of
MnCl2 solution and 0.1ml of NADP to all the three test tubes marked as “B”,
“C” and “ T”. To the control tube 0.033ml of NADPH2 was added. About
0.3ml of 0.15 M NaCl2 was added to all the tubes. The reaction was initiated
by addition of 0.2ml of enzyme preparation and incubated at 37oC for 1hr. At
the end of incubation period added 1.0 ml of EDTA to the blank and standard
test tubes and 1ml of DNPH to all the test tubes immediately. Allowed to
stand for 20 minutes, and then added 10 ml of 0.4n sodium hydroxide. Stood
for 15 minutes and read against the reagent blank at 390nm.
Enzyme activity was expressed as IU / L.
124
Biochemical analysis - Liver tissues
Estimation of Total lipid
Total lipids were extracted from the liver tissue according to the
method of Folch et al. (1957).
Procedure
The tissues were washed with saline and dried with a filter paper. A
weighed amount of tissue (500mg) was homogenized with 7.0 ml of
chloroform: methanol (1:2) mixture in a potter Elvehjem homogeniser and
filtered through a whatman No 1 filter paper into a conical flask. The residue
after filtration was scrapped and homogenized with 10ml chloroform-
methanol mixture 2:1 v/v and the resulting filtrate was evaporated to dryness.
The weight of the flask with and without the dried lipid was recorded and the
differences in weight gave the total lipid content of the tissues.
The total lipids were expressed as mg/ gm of wet tissue.
“Folch” wash
Reagents
1. 0.1N potassium chloride
2. Folch’s reagent: 0.1N HCl: Methanol: Chloroform (10:10:1)
The lipid extract from above procedure was redissolved in 2ml of
Folch’s reagent and 1.0ml of 0.1N potassium chloride was added and the
125
contents were shaken well. The upper aqueous phase containing ganglioside
and other water soluble compounds were separated. The lower phase
containing neutral and phospholipids in chloroform was again washed
3 times with 2.0ml of Folch’s reagent and the upper aqueous phase was
aspirated. The lower chloroform phase was made up to known volume.
Aliquots were taken for analysis of cholesterol, triglycerides and
phospholipids.
Estimation of Cholesterol
The total cholesterol present in the tissue homogenate after Folch’s
wash was estimated by the method of Wybenga et al. (1970), as mentioned
earlier.
The total cholesterol was expressed as mg/ gm of wet tissue.
Estimation of Triglycerides (TGL)
The triglycerides present in the tissue homogenate after Folch’s wash
was estimated by the method of Rice and Vanhandle (1970) as mentioned
earlier.
The triglycerides was expressed as mg/ gm of wet tissue.
Estimation of Phospholipids
The tissue phospholipids were estimated by the method of Rouser
et al. (1970).
126
Reagents
1. 3% Ammonium molybdate
2. 3% Ascorbic acid
3. 70% Perchloric acid
4. Standard Phosphate: 35.1 mg of potassium dihydrogen
phosphate was dissolved in 100ml of water to give a
concentration of 80 µg/ml
5. Working Standard solution: A concentration of 8 µg/ml was
prepared by diluting the stock solution from 1 to 10ml-distilled
water.
Procedure
0.1ml of the lipid extract was dissolved in 1ml of perchloric acid and
digested on a sand bath till the solution becomes colorless. After cooling the
solution was made up to 5.0ml with double distilled water. In the standard
1ml of working standard solution was taken. Blank contained 1ml of water.
To all the tubes 0.5ml of ammonium molybdate and ascorbic acid were added
and the mixture was kept in a boiling water bath for 6 mts. The blue color
developed was read at 710 using a photochem colorimeter. Expressed as
mg/gm of wet tissue after multiplication by factor 25.
127
Estimation of Glycogen
The liver tissue glycogen was extracted and estimated by the method
of Morales et al. (1973).
Reagents
1. 30% potassium hydroxide solution
2. Absolute alcohol
3. Anthrone reagent: 0.2% anthrone in con. Sulphuric acid was
prepared just before use.
4. 1.0M Ammonium acetate solution
5. Saturated ammonium chloride
6. Glucose standard: 100mg of pure glucose was dissolved in
100ml-distilled water containing 0.01% benzoic acid.
Procedure
The alkali extract of the tissue was prepared by digesting 50mg of
fresh tissue with 3.0 ml of 30% potassium hydroxide solution in boiling water
bath for 15 min. The tubes were cooled and mixed with 5.0ml of absolute
alcohol and a drop of 1.0M ammonium acetate to precipitate glycogen and
left in the freezer overnight for complete precipitation. Glycogen was
collected by centrifugation at 2000g for 20 mts. The precipitate was dissolved
in water with the aid of heating in a boiling water bath for 5 mts. Aliquots of
glycogen solution were taken up after suitable dilution and 4.0ml of anthrone
128
reagent was added heated in the boiling water bath cooled the tubes in an ice
bath. The tubes were shaken well, covered with marble caps and heated in a
boiling water bath for 20mts. After cooling the absorbance was read at 640nm
in spectrophotometer against a water blank treated in a similar manner.
Standard glucose solutions were also treated similarly.
The glycogen content was calculated from the amount of glucose
present in the sample and was expressed as mg/g fresh tissue.
Estimation of Protein
The liver tissue protein was estimated by the method Lowry et al.
(1951) as mentioned earlier in Chapter I.
The protein contents of the tissues were expressed as mg/g of fresh
tissue.
Estimation of Aspartate Aminotransferase (AST) Glutamate oxaloacetate
transaminase, E.C.2.6.1.1)
The Aspartate Aminotransferase in the tissue homogenate was
estimated by the method of Reitman and Frankel (1957) as mentioned earlier.
The enzyme activity is expressed as µ moles of pyruvate
liberated/min/mg protein.
129
Estimation of Alanine Aminotransferase (ALT) Glutamate pyruvate
transaminase, E.C.2.6.1.2)
The alanine aminotransferase in the tissue homogenate was estimated
was estimated by the method of Reitman and Frankel (1957) as mentioned
earlier.
The enzyme activity is expressed as µ moles pyruvate
liberated/min/mg protein.
Estimation of Alkaline Phosphatase (ALP) ortho-phosphoric monoester
phosphohydrolase, E.C. 3.1.3.1)
The Alkaline Phosphatase present in the tissue homogenate was
estimated by the method of Kind and King (1954) as mentioned earlier.
The results were expressed as µ- moles of phenol liberated /min/ mg
protein.
Estimation of Acid Phosphatase (ACP) (ortho-phosphoric monoester
hydrolase, E.C.3.1.3.2)
The Acid Phosphatase present in the tissue homogenate was
estimated by the method of Kind and King (1954) as mentioned earlier.
The results were expressed as µ- moles of phenol liberated /min/ mg
protein.
130
Estimation of Lactate Dehydrogenase (L-lactate: NAD oxido-reductase
E.C.1.1.1.27)
The liver tissue Lactate dehydrogenase was estimated by the method
of King (1965) as mentioned earlier.
The enzyme activity is expressed as µ moles of pyruvate liberated
/min/ mg protein.
Estimation of Gamma Glutamyl Transferase(5 Glutamyl peptide
aminoacid 5 glutamyl transferase, E.C. 2.3.2.2)
The Gamma Glutamyl transferase in the liver tissue was assayed by
the method of Szaz (1969) as mentioned earlier.
One unit of enzyme activity was defined as the amount of enzyme
required to release 1 micro* mole of p- nitroanilide/minute under incubation
conditions.
Estimation of 5′-Nucleotidase (5′-Ribonucleotide phosphohydrolase,
E.C. 1.1.1.42)
The 5′-Nucleotidase present in the tissue homogenate was estimated
by the method of Luly et al. (1972) as mentioned earlier.
The results were expressed as µ moles of phosphorous
liberated/minute mg of protein.
131
Estimation of Xanthine Oxidase (xanthine:NAD+ oxidoreductase,
E.C. 1.17.32)
Estimation of Xanthine oxidase was carried out by the method of
Fried and Fried (1957).
Reagents
1. Phosphate buffer- 0.1 M, pH 8.2
2. EDTA - 10 mM
3. Gelatin -1 %
4. Phenazine metho sulphate ( PMS): The solution of PMS in the
phosphate buffer at the concentration of 0.2 mg / ml was
prepared at the time of the assay and was protected from light
5. Nitroblue tetrazolium salt (NBT):NBT solution containing
5 mg/ ml was prepared in phosphate buffer just before use and
was protected from light
6. 1mM Xanthine solution: prepared in phosphate buffer just
before use.
Procedure
To 0.6ml of buffer , 0.4ml of EDTA , 0.4 ml of gelatin , 0.1ml of
PMS and 0.3ml of NBT were added in a test tube . To this 0.2ml of enzyme
was added and incubated at room temperature for 5 minutes. Then 0.5ml of
132
buffer and 0.5ml of substrate were added and the increase in the optical
density was measured in 532 nm at 2 minutes interval for 10 minutes.
The activity of enzyme was expressed as Unit / mg of protein. One
unit corresponds to the amount of the enzyme required to bring about change
in optical density 0.01/ min.
Estimation of Lipid peroxidation
Basal
Lipid peroxidation in the liver homogenate was assayed by the
method of Ohkawa and Yagi (1979).
Reagents
1. 8.1% Sodium dodecyl sulphate (SDS)
2. 0.8% Thiobarbituric acid (TBA)
3. 20% Acetic acid
4. 15:1 v/v n- Butanol: Pyridine mixture
Procedure
The reaction mixture contained 0.2 ml of liver homogenate, 1.5 ml of
TBA, 0.2ml SDS, 1.5ml of acetic acid and 0.8ml of distilled water. The above
solution was kept in the boiling water bath at 90°C for 1 hr and cooled in tap
water. After cooling 1ml of distilled water and 5ml of mixture of n-butanol:
pyridine (15:1 v/v) were added and shaken vigorously. After centrifugation at
133
4000 rpm for 10 min, the organic layer was taken and its absorbance was read
at 532 nm.
The lipid peroxide concentration was expressed as nano moles of
MDA liberated / min / mg of liver homogenate.
Hydrogen Peroxide induced Lipid peroxidation
Hydrogen Peroxide induced Lipid peroxidation was assayed by the
method of Devasagayam and Tarachand (1987).
Reagents
1. 0.15M Tris–HCl buffer , pH 7.4
2. 10mM KH2 PO4
3. 10% Trichloroacetic acid (TCA)
4. 10mM Hydrogen peroxide
5. 1% Thiobarbituric acid (TBA)
Procedure
The peroxidation system consists of 1.4 ml of Tris buffer, 0.2ml of
H2O2, 0.2ml of KH2 PO4 and 0.2ml of homogenate. The tubes were incubated
at 37°C with constant shaking for 20 minutes. The reaction was stopped by
the addition of 1.0 ml of 10 % TCA. Then 1.5ml of TBA reagent was added
and heated in the boiling water bath for 20 minutes. The tubes were
centrifuged and the colour developed in the supernatant was read at 532 nm
using spectrophotometer.
134
The MDA content of the sample after peroxide stress was expressed
as nano moles of MDA liberated / min / mg of liver homogenate.
Ascorbate induced Lipid peroxidation
Ascorbate induced Lipid peroxidation was assayed by the method of
Devasagayam and Tarachand (1987).
Reagents
1. 0. 15M Tris-HCl Buffer, pH 7.4
2. 10 mM KH2 PO4
3. 10% Trichloroacetic acid (TCA)
4. 1mM Ascorbic acid
5. 1% Thiobarbituric acid (TBA)
Procedure
The peroxidation system consisted of 1.4 ml of Tris buffer, 0.2ml of
ascorbate 0.2ml of KH2 PO4 and 0.2ml of homogenate. The tubes were
incubated at 37 ° C with constant shaking for 20 minutes. The reaction was
arrested by the addition of 1.0 ml of 10 % TCA. Then 1.5ml of TBA reagent
was added and heated in the boiling water bath for 20 minutes. The tubes
were centrifuged and the colour developed in the supernatant was read at
532 nm using spectrophotometer.
The MDA content of the sample after peroxide stress was expressed
as nano moles of MDA liberated / min / mg of liver homogenate.
135
FeSO4 induced Lipid peroxidation
FeSO4 induced Lipid peroxidation was assayed by the method of
Devasagayam and Tarachand (1987).
Reagents
1. 0. 15M Tris-HCl Buffer, pH 7.4
2. 10 mM KH2 PO4
3. 10% Trichloroacetic acid (TCA)
4. 10mM ferrous sulphate
5. 1% Thiobarbituric acid (TBA)
Procedure
The peroxidation system consists of 1.4 ml of Tris buffer, 0.2ml of
FeSO4 0.2ml of KH2 PO4 and 0.2ml of homogenate. The tubes were incubated
at 37°C with constant shaking for 20 minutes. The reaction was arrested by
the addition of 1.0 ml of 10 % TCA. Then 1.5ml of TBA reagent was added
and heated in the boiling water bath for 20 minutes. The tubes were
centrifuged and the colour developed in the supernatant was read at 532 nm
using spectrophotometer.
The MDA content of the sample after peroxide stress was expressed
as nano moles of MDA liberated / min / mg of liver homogenate.
136
Lipid peroxidation products
Estimation of Conjucated dienes (CD)
Dienes conjugates were estimated by the method of Klein and Klein
(1983).
Extraction of Lipids
Lipids were extracted from the liver homogenate with
chloroform/methanol (2:1) according to the method described by Folch et al.
(1957) with the modification.
Procedure
The lipid in chloroform was isolated and driedAliquots of lipid
extracts were evaporated to dryness. The lipid residue was suspended in
methanol and the absorbance at 213 nm and 233nm were measured against
the blank. The extent of peroxidation is determined by the measurement of
conjugated diene content which is arrived by computing the ratio of
absorbance at wave lengths 233 nm and 213mn.
Units expressed as ∆233/mg of protein.
Estimation of Lipid hydro peroxide (LOOH)
Lipid hydro peroxide (LOOH) assay was performed essentially as
described by Nourooz-Zadeh et al. (1996) with minor modifications.
137
Reagents
1. Triphenylphosphine (10mMol/L)
2. 90% Methanol
3. FOX2-reagent: FOX2-reagent was prepared by dissolving
38 mg Xylenol Orange 440 mg of Butylated hydroxy toluene in
450 ml HPLC-grade methanol with stirring. 49 mg Ammonium
ferrous sulphate dissolved in 50 ml of 250-mmol/l of sulphuric
acid was added to the methanol solution.
Procedure
Aliquots of sample were incubated for 30 minutes, at 20-25°C in
10 µL of triphenylphosphine to remove hydroperoxides and to generate a
blank, and 90 µL of tissue samples were incubated in 10 µl methanol to
generate a test sample. Both the blank and the test sample were mixed with
900 µL FOX2 reagent and incubated for 30 minutes, at 20-25°C. After
centrifugation at 12000 rpm for 10 min, the absorbance of the supernatants
was monitored at 560 nm The hydroperoxide concentration of each sample
was calculated from the difference between the absorbance of the blank and
test samples.
The LOOH content of the sample was expressed as µ moles of LOOH
liberated / min / mg of Protein.
138
Assay of Nitric oxide end products (NO)
Nitric oxide end products like Nitrite and Nitrate determination was
carried out by the method of Miranda et al. (2001).
Reagents
1. 10 % TCA
2. Griess reagent: 1% sulfanilamide in 1N HCl, 15% N-1-
naphtylethylenediamine dichloride
3. 50 mM Potassium phosphate buffer
4. Vanadium (III) chloride (8 mg/ml)
Procedure
Approximately 4.0 ml of tissue homogenate was treated with 2.5 ml
of 10% TCA solution, and centrifuged at 3000 rpm for 30 min. After
centrifugation at room temperature, 100µl of supernatant was applied to a
clean tube, 100 µL vanadium (III) chloride was added to each tube (for
reduction of nitrate to nitrite) and this was followed by addition of 450µl of
Griess reagent. After mixing well, all tubes were left in a dark place for
30 minutes at room temperature. At the end of the reaction time, the
absorbance was measured on a spectrophotometer at a wavelength of 550nm.
A blank was prepared in the same way but 150µl potassium phosphate buffer
(50mM) was used instead of supernatant. Aliquots of sodium nitrite were also
treated in a similarly for standard calibration.
Nitric oxides of the sample were expressed as nmol/mg of protein.
139
Determination of Enzymic antioxidant systems
Assay of Catalase (CAT) (H2O2 Oxidoreductase, E.C. 1.11.16)
The antioxidant enzyme Catalase was assayed by the method of Sinha
(1972).
Reagents
1. 0.01M Phosphate buffer, pH 7.00
2. Dichromate acetic acid reagent: This reagent was prepared by
mixing 5% solution of potassium dichromate with glacial acetic
acid in the ratio of 1:3.
3. 0.2M Hydrogen peroxide
Procedure
To 0.1ml of the homogenate was added to 1.0ml of phosphate buffer.
To this 0.5ml of hydrogen peroxide was added. The reaction was
stopped at “0”, “30” and “60” seconds by the addition of 2.0 ml of the
dichromate acetic acid reagent. The tubes were boiled for 10 minutes,
cooled and read at 620nm . For standards different amounts of
hydrogen peroxide, ranging from 20-100 µmoles were taken and
processed as above.
Enzyme activity were expressed as n moles of H2O2 decomposed/
min/mg protein.
140
Estimation of Superoxide dismutase (SOD) (Superoxidase dismutase;
Copper-zinc superoxide dismutase, E.C. No. 1.15.1.1)
The Super oxide dismutase was estimated according to the method of
Misra and Fridovich (1972).
Reagents
1. 0.1 M Carbonate – bicarbonate buffer, pH 10.2 containing
5.7 mg EDTA / 100ml
2. 3mM Epinephrine
3. Absolute ethanol
4. Chloroform
Procedure
In the test tube labelled as “Test” 0.5ml of liver homogenate was
taken and to this 0.25 ml of cold ethanol and 0.15 ml of chloroform
was added and kept for 15 minutes in a shaker and centrifuged. To
0.5ml of the supernatant 2.0 ml, of the buffer was added. The reaction
was initiated by the addition of 0.4ml of epinephrine and change in the
optical density per min was measured at 480 nm. 100% auto oxidation
of epinephrine to adrenochrome was performed in a control tube
without the enzyme.
The enzyme unit was defined as the enzyme required to give 50 %
inhibition of epinephrine auto oxidation.
141
Assay of Glutathione-S-Transferase (GST) (RX: Glutathione
R-transferase, E.C.2.5.1.18)
The enzyme Glutathione-S-Transferase was estimated by Habig et al.
(1974).
Reagents
1. 0.5 M Phosphate buffer pH 6.5
2. 25 mM 1-Chloro 2,4 dinitrobenzene ( CDNB)
3. 30 mM Reduced Glutathione
Procedure
To 1.0 ml of phosphate buffer, 0.1ml of 1-Chloro 2,4 dinitrobenzene,
1.7 ml of water and 0.1ml of liver homogenate were added. After 5 minutes of
incubation at 37°C, 0.1 ml of reduced glutathione was added and the change
in the optical density was measured for 3 minutes for 30 secs interval.
Complete assay mixture without enzyme was used as control. Optical density
was measured at 340nm.
Enzyme activity was expressed as n moles of CDNB conjugate
formed/ min/ mg of protein.
Assay of Glutathione Reductase (GR) (Glutathione: NADP+
oxidoreductase, E.C.1.8.1.7.)
The enzyme Glutathione reductase activity was carried out by the
method of Dobler (1981).
142
Reagents
1. 0.3 M Phosphate buffer, pH 6.8
2. 25 mM EDTA
3. 12.5mM Glutathione oxidised (GSSG)
4. 3mM Nicotineamide adenine dinucleotide phosphate (NADPH)
Procedure
The reaction mixture containing 1.5 ml of buffer, 0.5ml of EDTA,
and 0.2 ml of GSSG was incubated at 37°C for 10 minutes. To the incubated
mixture 0.1ml of the homogenate and 0.1 ml of NADPH solution was added.
The change in the optical density was monitored at 340 nm at 37°C for
3 minutes at 30 secs interval.
The enzyme activity was expressed as n moles of GSSG utilized /
min/ mg protein of liver homogenate.
Assay of Glutathione Peroxidase (GPx) (Glutathione: hydrogen-peroxide
oxidoreductase, E.C.1.11.1.9.)
Glutathione Peroxidase was estimated by the method of Necheles
et al. (1968).
Reagents
1. 0.4 M Phosphate buffer, pH 7.0
2. 10.mM Sodium azide
143
3. 4 .0 mM Reduced glutathione
4. 2.5 mM Hydrogen peroxide
5. 10% TCA
6. 0.3 M Phosphate solution
7. 0.4 mM EDTA
8. 1.0 mM 5,5′-Dithio-bis-2 Nitro benzoic acid
Procedure
The incubation mixture consisted of 0.2ml of liver homogenate,
0.4 ml of buffer, 0.1ml of sodium azide, 0.2ml of reduced glutathione, and
0.2ml of EDTA, mixed well. To this mixture 0.1ml of hydrogen peroxide was
added and incubated at “0”, “1.5” and “3.0” minutes. Then 1.0 ml of TCA
was added to arrest the reaction. It was centrifuged and to 1.0 ml of the
supernatant 4.0ml of phosphate solution and 0.5ml of DTNB were added and
the residual glutathione was measured at 412 nm .Non enzymic oxidation of
glutathione was measured in the blank containing all the reagents with buffer
substituted for the enzyme source.
The activity of glutathione peroxidase was expressed as n moles of
GSH oxidised / min/ mg protein liver homogenate.
Determination of non Enzymic antioxidant systems
Estimation of liver ascorbic acid
Estimation of liver ascorbic acid was carried out according to the
method of Omaye et al. (1971).
144
Reagents
1. 10% TCA
2. Dinitrophenyl- Thiourea- copper sulphate reagent: 3 gms of
2,4-Dinitrophenyl hydrazine, 0.4gms of thiourea and 0.05 gms
of copper sulphate were dissolved in 100ml of 9N H2SO4
3. 3. 65% H2 SO4
Procedure
To 0.5ml of the homogenate, 0.5 ml of water , 1ml of TCA, are
added, mixed and centrifuged. To 1ml of the supernatant, 0.2ml of DTC
reagent was added and incubated at 37° C for 3hrs. Then 1.5 ml of ice cold
H2SO4, was added, mixed well and the solution was allowed to stand at room
temperature for another 30 minutes. The colour developed was read at
520 nm. Standards of ascorbic acid were treated similarly.
The level of ascorbic acid was expressed as mg/g wet tissue.
Estimation of Vitamin E
Estimation of Vitamin E was carried out according to the method of
Desai (1984).
Reagents
1. Ethanol
2. Petroleum ether
145
3. Batho phenanthroline reagent: 0.2% 4.6 diphenyl 1,10-
phenanthroline in ethanol.
4. 0.001 M ferric chloride in ethanol
5. 0.001M O-Phosphoric acid in ethanol.
Procedure
To 1ml of the tissue homogenate, 1ml of ethanol was added and
thoroughly mixed. Then 3ml of petroleum ether was added, shaken rapidly
and centrifuged. 2ml of the supernatant was taken and evaporated to dryness.
To this 0.2 ml of diphenyl 1,10-phenanthroline was added. The assay mixture
was protected from light and 0.2ml of ferric chloride was added followed by
0.2ml of O- phosphoric acid. Total volume was made upto 3ml with ethanol.
The colour developed was read at 530 nm. Standards were treated similarly.
The level of Vitamin E was expressed as mg/g wet tissue.
Estimation of Vitamin A
Estimation of Vitamin A was carried out by the method of Kaser and
Stekol (1943).
Reagents
1. Absolute ethanol
2. Light petroleum ether
3. Chloroform
4. Acetic anhydride
146
5. Carr-price reagent: This contains 25% solution of antimony
trichloride in chloroform. Kept it in the room temperature in a
tightly stoppered brown bottle.
Procedure
To 3ml of homogenate in a stoppered flask added 3ml of ethanol,
slowly drop by drop with shaking, to precipitate the protein. Added 6ml of
light petroleum and shake vigorously for ten minutes. Poured the emulsion
into a centrifuge tube, cork and spin at low speed for about one minute. The
petroleum layer gets separated. To 4ml of the petroleum layer taken in the
colorimeter tube evaporate off the solvent by placing in a water bath at 40-
60°C. Dissolve the residue in 0.5ml of chloroform and added a drop of acetic
anhydride to remove the water present. With colorimeter adjusted with the
chloroform blank added quickly 3ml of Carr-price reagent and read the colour
developed at 620 nm.
The level of serum Vitamin A was expressed as mg/g of wet tissue.
Determination of Ceruloplasmin activity
Ceruloplasmin activity was determined according to the method of
Raven (1961).
Reagents
1. p-Phenylene diamine hydrochloride: 0.5% for purification of
Phenylene diamine hydr0chloride was dissolved in minimum
volume of hot distilled water, decolourised with charcoal ,
147
filtered hot and allowed to crystallize. The crystals were stored
over calcium chloride.
2. 0.04M Acetate buffer: pH 5.3
3. 0.5% Sodium azide
Procedure
0.1ml of fresh serum was taken into 15ml test tube. 1.0 ml of 0.5%
sodium azide was added to the control. Then 8.0 ml of acetate buffer was
added to each tube, followed by 1.0ml of the p-phenylene diamine
hydrochloride. The solution was mixed and placed in the water bath at 37°C
for one hour. After incubation, the tubes were removed and added 1.0 ml of
sodium azide to each of the tubes. The contents were mixed and cooled at
4-10°C for 30 minutes. The colour intensity was measured at 530 nm against
reagent blank.
The level of serum Ceruloplasmin was expressed as mg / dl.
Determination of serum Uric acid
Determination of serum uric acid was carried out according to the
method of Caraway (1963).
Reagents
1. Colouring reagent: 50 gms of sodium tungstate was dissolved in
400 ml of distilled water, to that 40 ml of phosphoric acid was
added and refluxed for 2hrs. A drop of bromine was added,
cooled and diluted to 500ml with water.
148
2. 20% sodium carbonate
3. Standard Uric acid: 100mgms of uric acid was dissolved in
150 ml of water containing 60 mg of lithium carbonate by
heating at 60 ° C, the solution was cooled at room temperature
and added 2ml of formaldehyde diluted to about 500ml.
4. Working standard: 1.0 ml of the stock standard and 2.0 ml of
300 mg/ 1ml BSA were diluted to 10 ml with water. The
working standard was prepared fresh. Albumin was added to
account for the positive error induced by co precipitation of uric
acid and proteins.
Procedure
To 0.6ml of serum 5.4 ml of diluted tungstic acid was added and
centrifuged. Into three test tubes 3ml of each supernatant, standard, and water
were taken and labelled as “T”, “S” and “B”. 0.6ml of sodium carbonate and
0.6ml of phospho tungstic acid reagent were added, mixed and placed in a
water bath at 25°C for 10 minutes. The blue colour developed was read at
700 nm.
The level of serum Uric acid was expressed as mg / dl.
Assay of liver Glutathione
Assay of liver Glutathione was carried out by the method of Ellman
(1959).
149
Reagents
1. 0.3M Disodium hydrogen phosphate
2. 5,5′-Dithiobis-2-nitrobenzoic acid reagent (DTNB): 40 mg of
DTNB was dissolved in100ml of 1% sodium citrate.
Procedure
To the test tube marked as “T” 1.0 ml of the homogenate was
taken and 1 ml of water is added. To that 1ml of 10 % TCA was added. The
blank test tube contained 1ml of TCA. Both the test tubes were centrifuged.
To 1ml of the supernatant 4.0ml of phosphate reagent and 0.5ml of DTNB
solution was added and the color developed was read at 412 nm.
Liver glutathione was expressed as micromole GSH/ mg of protein.
Assay of Total thiols
Assay of total thiols was carried out by the modified method of
Sedlak and Lindsay (1968).
Reagents
1. 0.2M Tris-HCl buffer in EDTA, pH 8.2
2. 0.01M 5,5′-dithiobis-2-nitrobenzoic acid, reagent (DTNB)
3. Methanol
4. 0.02 M EDTA
150
Procedure
100 mg of tissue was homogenized in 4ml of 0.02M EDTA. To 1ml
of the homogenate 1.5 ml of 0.2 M Tris buffer and 0.1 of 0.01 M DTNB (5,5′-
dithiobis- 2-nitrobenzoic acid) were added the mixture was brought to 6.5 ml
with methanol. The test tubes were capped and left to stand for 20 min, then
centrifuged at 3000 rpm/min at room temperature for 10 min. The absorbance
of the clear supernatant was read at 412 nm.
Liver total thiols were expressed as µmoles of GSH mg/g of protein.
Estimation of Iron in liver tissue
Estimation of Iron in the liver tissue was carried out by the method of
Ramsay (1957).
Reagents
1. Stock ferric chloride solution : 145 mg of ferric chloride in
100ml of 0.5N HCl
2. Working ferric chloride solution : Dilute 1 in 100 of the stock
ferric chloride solution
3. Sodium sulphite: 2.25 gms of anhydrous sodium sulphite in
100 ml of water.
4. 0.2% 2-2 Dipyridyl in 3% glacial acetic acid
151
5. Stock standard 100µgm/ ml: Dissolve 0.48 gms of ferrous
sulphate in water and 1ml of conc H2SO4 and made up to 1 litre
in water.
6. Working standard 5µgm/ ml: 5 ml of the stock diluted to 100ml
with distilled water.
7. Chloroform
Procedure
About 1.0 ml of the tissue homogenate was taken and 0.5ml of
bipyridyl solution and 0.5ml of sodium sulphite were added blank contained
1.0 ml of distilled water. Mixed well and kept in boiling water bath for
5 minutes cooled and then added chloroform. Mixed well and centrifuge and
read supernatant at 520 nm in spectrophotometer against blank. Aliquots of
standard were also treated in the similar manner.
Iron in the liver tissue was expressed as mg/ g wet tissue.
Determination of membrane bound enzymes
Liver membrane was prepared by the method of Song et al. (1969).
Frozen rat liver samples of about 2 g were homogenized in 2 volumes
each of ice-cold 1 mM sodium carbonate, pH 7.50, using 20 strokes of a
loose-fitting homogeniser. The homogenates were diluted and filtered through
3 layers of surgical gauze. After centrifugation at 1500 g for 10 min, the
pellets were resuspended in buffer and 5.5 volumes of 70.7% sucrose were
152
added, mixed, and then distributed into centrifuge tubes. 8 ml of 48.2% and
4 ml of 42.5% sucrose were layered over this suspension. After centrifuging
for 60 min at 12,000 rpm, the material which accumulated around the
interface of 42.5% and 48.2% sucrose was collected, diluted, and washed. The
final pellet was resuspended in 0.25 M sucrose, 30 mM histidine, 1 mM
EDTA (pH 6.8), and stored at –80◦C.
Estimation of Total Adenosine tri phosphatase (ATP Phosphohydrolase
E.C. No. 3.6.1.4)
Total adenosine tri phosphatase activity was estimated by the method
of Evan (1969).
Reagents
1. 0.1M Tris-HCl buffer pH 7.0
2. 0.1M Magnesium chloride
3. 0.1M Potassium chloride
4. 0.1M Sodium chloride
5. 0.1M calcium chloride ATP
6. 0.01M ATP
7. 10% TCA
8. Ammonium molybdate - 2.5 gm of ammonium molybdate was
dissolved in 100ml of 5 N Sulphuric acid
9. ANSA - 500mg of Amino napthol Sulphonic acid was dissolved
in 195ml of 15% sodium meta bisulphate and 5ml of 20%
sodium sulphite was added to it. The solution was stored in the
brown bottle.
153
Procedure
The incubation mixture contained 1ml of Tris-HCl buffer, 0.2ml each
of magnesium chloride, calcium chloride, potassium chloride, sodium
chloride, ATP and homogenate. The mixture was incubated at 37oC for
15 minutes the reaction was arrested by the addition of 1ml of 10% TCA,
mixed well and centrifuged. The phosphorous content of the supernatant was
estimated.
The enzyme activity is expressed as µ moles of phosphorous
liberated/ min/ mg of protein.
Estimation of Na+/ K+ ATPase (Adenosine tri phosphatase EC 3.6.1.37)
Estimation of Na+, K+ ATPase was estimated by the method of
Bonting (1970).
Reagents
1. 0.09M Tris-HCl buffer - pH 7.5
2. Sodium chloride - 0.60M
3. EDTA - 0.001M
4. ATP - 0.04M
5. 10% TCA
6. Ammonium molybdate - 2.5 gm of ammonium molybdate was
dissolved in 100ml of 3 N Sulphuric acid.
154
7. ANSA - 500mg of amino napthol Sulphonic acid was dissolved
in 195ml of 15% sodium bisulphate and 5ml of 20% sodium
sulphite was added to it. The solution was stored in the brown
bottle.
Procedure
The incubation mixture contained 1ml of Tris-HCl buffer, 0.2ml each
of potassium chloride, sodium chloride, EDTA, ATP and homogenate. The
mixture was incubated at 37oC for 15 minutes. The reaction was arrested by
the addition of 1ml of 10% TCA, mixed well and centrifuged. The
phosphorous content of the supernatant was estimated.
The enzyme activity is expressed as µ moles of phosphorous
liberated/ min/ mg of protein.
Estimation of Ca+-ATPase (ATP phosphohydrolase EC 3.1.3.1)
The activity of Ca+ - ATP ase was assayed according to the method of
Hjerten and Pan (1983).
Reagents
1. Tris-HCl buffer – 125mM, pH 8.0
2. Calcium chloride - 50mM
3. ATP - 10mM
4. 10% TCA
155
5. Ammonium molybdate – 2.5 gm of ammonium molybdate was
dissolved in 100ml of 3 N Sulphuric acid
6. ANSA - 500mg of amino napthol Sulphonic acid was dissolved
in 195ml of 15% sodium bisulphate and 5ml of 20% sodium
sulphite was added to it. The solution was stored in the brown
bottle.
Procedure
The incubation mixture contained 0.1ml 0f each of Tris- HCl buffer,
calcium chloride, ATP and enzyme preparation. After incubation at 37◦C for
15 minutes the reaction was arrested by the addition of 1ml of 10% TCA,
mixed well and centrifuged. The phosphorous content of the supernatant was
estimated.
The enzyme activity is expressed as µ moles of phosphorous
liberated/ min/ mg of protein.
4.2.9.4 Estimation of Mg2+-ATPase (ATP phosphohydrolase EC 3.6.1.3)
The activity of Mg2+-ATPase was assayed by the method of Ohnishi
et al. (1982).
Reagents
1. Tris-HCl buffer – 375mM, pH 7.6
2. Magnesium chloride- 25mM
3. ATP - 10mM
156
4. 10% TCA
5. Ammonium molybdate – 2.5 gm of ammonium molybdate was
dissolved in 100ml of 3 N Sulphuric acid
6. ANSA - 500mg of amino napthol Sulphonic acid was dissolved
in 195ml of 15% sodium bisulphate and 5ml of 20% sodium
sulphite was added to it. The solution was stored in the brown
bottle.
Procedure
The incubation mixture contained 0.1ml each of Tris-HCl buffer,
Magnesiu chloride, ATP and enzyme preparation. After incubation at 37◦C for
15 minutes the reaction was arrested by the addition of 1ml of 10% TCA,
mixed well and centrifuged. The phosphorous content of the supernatant was
estimated
The enzyme activity is expressed as µ moles of phosphorous
liberated/ min/ mg of protein.
Estimation of Glycolytic enzymes
Estimation of Hexokinase (ATP: D-Hexose-6-Phosphotransferase
E.C.2.7.1.1)
Hexokinase was analysed by the method of Branstrup (1957).

157
Reagents
1. 0.01M Tris-HCl buffer, pH 8.0
2. Substrate 0.005M Glucose
3. ATP – 0.072M
4. 0.05M Magnesium chloride
5. 0.01M Potassium Chloride
6. 0.5M sodium fluoride
7. 0.0125M Potassium hydrogen phosphate
8. 10% TCA
9. Ortho toludine reagent - 940 ml of acetic acid was dissolved in
60 ml of Ortho toludine, to this added 3g of thiourea
10. Glucose standard: 100mg of pure glucose was dissolved in
100ml-distilled water containing 0.01% benzoic acid.
Procedure
The incubation mixture was taken in two tubes marked as “0” minute
and “30” minute which contained 2.5ml buffer, 1ml substrate, 0.5ml ATP,
0.1ml magnesium chloride, 0.1ml sodium fluoride, 0.4ml potassium hydrogen
phosphate and 0.4ml of potassium chloride were pre incubated at 37◦C for
5 minutes. 0.5ml of enzyme was added in both. To the” 0” minute tube added
1ml of the 10 % TCA immediately to stop the reaction. To the “30” minute
tube 10 % TCA was added after 30 minutes. The two tubes were incubated at
37◦C for 30 minutes. Both the tubes were centrifuged. Taken 1ml of the two
supernatant separately and 1ml of water as blank, 4ml of ortho toluidine
158
reagent was added in all three tubes kept in boiling water bath for 8 minutes,
cooled and read at 620nm. Standard containing varying concentrations of
glucose and reagents were also similarly treated.
The enzyme activity is expressed as nmoles of Glucose utilized /min
/mg of protein.
Estimation of Phospho gluco isomerase (n-glucose-g-phosphate ketol-
isomerase, EC 5.3.1.9)
The enzyme was assayed by the method of Horrocks et al. (1963).
The assay is based on the estimation of fructose using fructose thiourea
reagent.
Reagents
1. 0.1M Borate buffer pH 7.8.
2. Buffered substrate- 3mg disodium glucose-6-phosphate was
dissolved in 1ml buffer. This was prepared fresh before use.
3. 30% HCl
4. Resorcinol – thiourea reagent: 100mg of resorcinol and 250mg
of thiourea were dissolved in 100ml of glacial acetic acid. This
was stored in brown bottle.
5. Colour reagent: 30% HCl, resorcinol- thiourea reagent, and H2O
were mixed in the proportion 7:1:1. The solution was used on
the same day as prepared.
159
6. Standard solution of fructose: 54 mg of fructose was dissolved
in 100 ml of 0.25% benzoic acid.
Procedure
In to each of the tubes labelled “test” and “blank”, 1ml of buffered
substrate was added. A suitable amount of the enzyme extract was added in to
the test and the tubes were incubated at 37◦C for 30 minutes. After the period
of incubation enzyme was added to the blank tube, and 9ml of colouring
reagent was immediately added to all tubes. The tubes were heated in the
boiling water bath maintained at 70◦C for 15 minutes. Standards containing
varying concentrations of fructose and a reagent blank were similarly treated.
The tubes were cooled in running water and the colour was read at 410 nm.
The enzyme activity is expressed as n moles of fructose utilized /min
/mg of protein.
Estimation of Aldolase (Ketose-1-phosphate aldehyde lyase E.C.4.1.2.7)
Aldolase activity was estimated by the method of King (1965).
Reagents
1. 0.1M Tris-HCl buffer: pH 8.6
2. Fructose 1,6 diphosphate: 8.33 mg dissolved in 5ml of 0.05M in
buffer, prepared just before use.
3. Hydrazine sulphate ; 0.56 N, pH 8.6
4. 0.1% DNPH in 2N HCl
160
5. 0.75N Sodium hydroxide
6. 10 % TCA
7. Standard DL glyceraldehyde: 123 mg was dissolved in 1.0 litre
of water. This was left at room temperature for 2-4 days to
permit polymerization.
Procedure
To 2.0 ml of fructose-1,6 diphosphate, 0.25 ml of hydrazine sulphate
and 1.0 ml of the buffer was added to 1ml of enzyme extract and incubated at
37°C for 15 minutes and the reaction was stopped by addition of 1.0 ml of
10% TCA. 0.1ml of enzyme was added to the blank tubes and were
centrifuged. 1.0 ml of the supernatant was transferred to the tubes containing
1.0 ml of the 0.75 N sodium hydroxide and left in the room temperature for
10 minutes . 1ml of the colour reagent was added in the test and the blank
tube and incubated at 37°C for 1 hr. The colour developed by the addition of
0.75 N sodium hydroxide was read at 540 nm in UV spectrophotometer.
The enzyme activity was expressed as n moles of glyceraldehyde
formed /min/ mg protein
Determination of Glyconeogenic enzymes
Estimation of Glucose–6-phosphatase (D-glucose-6-phosphate: NADP+ 1-
oxidoreductase, E.C. 3.1.3.9)
Estimation of Glucose-6-phosphatase was carried out by the method
of King (1965).
161
Reagents
1. Citrate buffer- 0.1M, pH 6.5
2. Glucose–6 Phosphate : 0.01M
3. Ammonium molybdate – 2.5 gm of ammonium molybdate was
dissolved in 100ml of 3 N Sulphuric acid
4. ANSA - 500mg of amino napthol Sulphonic acid was dissolved
in 195ml of 15% sodium bisulphate and 5ml of 20% sodium
sulphite was added to it. The solution was stored in the brown
bottle.
5. 10 % TCA.
Procedure
The incubation mixture in a total volume of 1.0 ml contained 0.5ml of
substrate and 0.2ml of the enzyme. Incubation was carried out at 37° C for
60 minutes. The reaction was arrested by the addition of 1.0 ml of TCA and
centrifuged. The phosphorous content of the supernatant was estimated.
Enzyme activity was expressed as n moles of phosphorous liberated /
mg of protein / min.
Estimation of Fructose 1,6-diphosphate (D-fructose-1,6-bisphosphate
D-glyceraldehyde-3-phosphate-lyase, E.C. No. I. I. I .37)
Estimation of Fructose 1,6-diphosphate was carried out by the
method of Gancedo and Gancedo (1971).

162
Reagents
1. Tris-HCl Buffer : 1 M, pH 7.0
2. Fructose 1, 6 diphosphate 0.05 M
3. Magnesium chloride: 0.1 M
4. Potassium chloride: 0.1 M
5. EDTA : 0.001 M
6. TCA 10 %
7. Ammonium molybdate – 2.5 gm of ammonium molybdate was
dissolved in 100ml of 3 N Sulphuric acid
8. ANSA - 500mg of amino napthol Sulphonic acid was dissolved
in 195ml of 15% sodium bisulphate and 5ml of 20% sodium
sulphite was added to it. The solution was stored in the brown
bottle.
Procedure
The assay medium in the final volume of 2.0 ml contained 1.2 ml of
buffer, 0.1ml of substrate solution, 0.25 ml of magnesium chloride, 0.1ml of
potassium chloride, 0.25 ml of EDTA and 1ml of enzyme source. The
incubation was carried out at 37°C for 15 minutes. The reaction was
terminated by the addition of 1.0 ml of TCA. The suspension was centrifuged
and phosphorus content was estimated.
The enzyme activity was expressed as n moles of phosphorous
liberated / mg of protein / min.
163
Protein bound carbohydrate complexes
Isolation of Glycoprotein from liver tissues
About 500mg of the liver tissue was homogenised in 7.0 ml of
methanol, filtered and scarped from the filter paper. To that material 10ml of
the chloroform was added and it was filtered. To the residue 4.0 ml of the
chloroform was added and once again it was filtered. To the residue 7.0 ml of
Chloroform: Methanol (2:1) mixture was added, homogenised and filtered.
The defatted tissue was taken for the estimation of glycoprotein.
Estimation of Hexose
Hexose was estimated by the method of Niebes (1972).
Reagents
1. Orcinol – Sulphuric acid reagent:
Solution A: 60ml of concentrated sulphuric acid was mixed with
40ml of distilled water.
Solution B: 1.6g of orcinol (recrystallized from benzene) was
dissolved in 100ml of distilled water. 7.4ml of solution A was
mixed with 1ml of solution B just before use.
2. Standard: 50mg of each of galactose and mannose were
dissolved in 100ml of distilled water. This solution is diluted to
a proportion of 1:10 to give concentration of hexose
100micrograms/ ml.
164
Procedure
For hydrolysis 25 mg of the defatted tissue was mixed with 2ml of 3N
HCl and hydrolysed at 100ºC for 4 hrs. The hydrolysate was neutralized with
sodium hydroxide. From the hydrolysed sample 0.5ml of the neutralized
solution was made up to1.0 ml with distilled water and 8.5ml of ice-cold
orcinol reagent was added very slowly. The mixture was heated at 80.C for
15mts, cooled and left in the dark for 25mts for color development. Standard
solutions containing 25-100µgms were treated in the similarly. Then the
absorbance was read at 540nm.
The hexose content is expressed as mg/100mg of defatted tissue.
Estimation of Hexosamine
Hexosamine was estimated by the method of Wagner (1979).
Reagents
1. Acetyl acetone reagent:
Solution A - Trisodium phosphate 0.1M: 4.1g of trisodium
phosphate was dissolved in 25ml of distilled water.
Solution B - Potassium tetraborate 0.5N: 305.5 mg of potassium
tetraborate was dissolved in 2ml of distilled water.
3.5ml of acetyl acetone was added to the mixture of solution A
and solution B in the ratio of 98:2 (v/v).
165
2. Ehrlich’s reagent: 320mg of p-dimethyl amino benzaldehyde
was dissolved in 21ml of isopropanol and 3ml of concentrated
HCl was added to it.
3. Standard: 100 mgs galactosamine was prepared in 100ml of
water. This solution was diluted to a proportion of 1:10 to give
concentration of hexosamine 100micrograms/ ml in distilled
water.
Procedure
For hydrolysis 25 mg of the defatted tissue was mixed with 2ml of 3N
HCl and hydrolysed at 100ºC for 4 hrs. The hydrolysate was neutralized with
sodium hydroxide.
0.5ml of the neutralized sample was made up to 1ml with distilled
water.0.6ml of acetyl acetone reagent was added to all the tubes and heated in
a boiling water bath for 30mts. After cooling, 2ml of Ehrlich’s reagent was
added and the contents were shaken well. The pink color developed was
measured at 540nm against the reagent blank. Standard solution containing
10-40 µg of galactosamine were also treated in the similar manner.
The content of hexosamine in tissues is expressed as mg/100ml of
defatted tissue.
Estimation of Sialic acid
Sialic acid was determined by the method of Warren (1959).
166
Reagents
1. Periodic acid 0.25 M: 14g of sodium periodate was dissolved in
100ml of 0.1N sulphuric acid.
2. Sodium meta arsenite 4%: 4gm of sodium meta arsenite was
dissolved in 100ml of 0.5N hydrochloric acid.
3. Thiobarbituric acid: 144mg of thiobarbituric acid was dissolved
in 20ml of distilled water. The pH of the solution was adjusted
to 9 with 6 N Sodium hydroxide. This reagent was prepared just
before use.
4. Acidified butanol: 5ml of concentrated hydrochloric acid was
added to 95ml of n- butanol.
5. Standard: 10mg of N-acetyl neuraminic acid was dissolved in
100ml of distilled water.
Procedure
About 25 mg of defatted tissue was mixed with 0.5ml of 0.1N
Sulphuric acid and hydrolysed at 80ºC for 1hr. 0.5ml of the neutralized
samples were taken along with standards (in the range of 10-50µg). Blank
contained 0.5 ml of 0.1N sulphuric acid, 0.25ml of periodate was added to all
tubes and incubated at 37oC. After 30mts, 0.25ml of arsenite solution was
added to inhibit the reaction. Contents were mixed and 2ml of thiobarbituric
acid was added and the tubes were heated in a boiling water bath for 6mts.
After cooling, pink color developed was extracted into 5ml of acidified
butanol phase, and was measured at 540nm against a reagent blank.
167
The sialic acid content is expressed in tissues as mg/100mg of
defatted tissue.
Histopathological Investigations
The rats were sacrificed liver, kidney, intestine, and heart were
dissected out and cleaned well with cold physiological saline to remove blood
and adhering tissues. The samples were then fixed in10% formalin- saline and
embedded in paraffin. Serial sections were cut at 5mcm and stained with
haemotoxylin and eosin. The sections were examined under light microscope
and photographs were taken.
Statistical Analysis
Results will be expressed as mean ± standard error of mean (S.E.M.).
Statistical significance is determined by one-way analysis of variance
(ANOVA). The data obtained from toxicity studies will be analyzed using
Dunnet’s ‘t” test P values less than 0.05 will be considered significant.
168
RESULTS
Acute toxicity
Death was recorded during the treatment period in treated groups given
500mg/kg of Biherbal extract orally. Table I depicts the changes of animals in
general behaviour, other physiological activities like giddiness, sniffing,
aggressiveness, tachypnoea, and convulsion finally at the dose level of
500mg/kg. From Tables II and III, it was observed that there was a significant
difference in the organs like lung, liver (**P<0.01) and heamatological
parameters like Hb (*P<0.05) and W.B.C. (**P<0.01). Table IV shows that
there was a remarkable alterations in biochemical parameters like Glucose,
Sodium, AST and ALP (**P<0.01). Pathological examinations of the tissues
on a gross and macroscopic basis indicated that there were no detectable
abnormalities. Hence, it can be concluded that the BHE is practically toxic or
lethal after an acute exposure at the dose range of 500mg/kg. Thus the test
limit (ED50) from this acute oral toxicity studies was fixed as 50 mg/kg body
weight.
Chronic toxicity
There were no significant differences in food consumption and
variation in the body weight was negligible. In the 3 month experiment, no
mortality was observed in any of the treatment group. From Tables V,VI
andVII it was evident that there was no relevant difference in body weight
development, hematological or biochemical parameters and organ weights
for all groups.
169
For the rats of the Biherbal extract treated group, values of AST, ALT
and cholesterol were slightly elevated as compared to control but not
statistically significant as observed from TableVII. They were, however, still
in the normal range. No macroscopical abnormalities were detected in the
examined organs. Histologically, there were only minor pathological findings
of inflammatory or degenerative origin which is evident from Figures I to X.
Inflammatory processes, especially in the respiratory system, showed the
same frequency and extent in the Biherbal extract treated groups as in control
groups. A harmful effect of the Biherbal extract to the organs could be ruled
out. In particular, no histological changes were found for all groups in hearts,
testis or ovaries. Slight inflammatory infiltrates or signs of bronchopneumonia
with diffuse foci were found in the lungs of single animals of both, control
and treatment groups.
Similarly, slight inflammatory infiltrates in the connective tissue or the
glomeruli of the kidneys were observed in single animals, as well as mild
turbid swellings in the liver lobules. In all cases, the degree of inflammatory
or degenerative processes was only minor, and the phenomena occurred in all
treatment groups with the same frequency. It can therefore be assumed that
the observations were unrelated to the ingestion of Biherbal extract. The
withdrawal of the Biherbal extract ingestion after 3 months did not induce any
detectable change in behavioural patterns, nor were there any differences to
controls for the hematological, biochemical, anatomical or histological
parameters.
170
Table VIII depicts the effect of BHE on body weight, liver weight,
blood glucose, urea and serum bilirubin in various experimental rats. A
significant (p > 0.01) reduction in the liver weight was observed in group III
BHE pre-treated animals when compared to that of group II rats intoxicated
with CCl4. BHE supplementation reverted the decreased level of blood
glucose in CCl4 intoxicated rats. A significant increase in the Serum urea (p >
0.01) and bilirubin (p >0.001) levels in CCl4 group II rats were found to be
restored to normal levels on BHE pretreated group III animals.
Figure XI shows the effect of the plant extract on serum total proteins,
albumin and globulin levels. The serum levels of total proteins, albumin and
globulin were significantly decreased (p>0.001) in CCl4 intoxicated group II
animals. There was a prominent increase in the total protein levels of BHE
pretreated CCl4 intoxicated group III animals showing the regeneration of
hepatic cells, when compared with the group IV and V, which received EAE
and PLE respectively.
Table IX depicts the change in serum levels of the liver marker
enzymes like AST, ALT, ALP, ACP, ICD and LDH. The significant increase
in the serum transaminases AST and ALT levels was seen in the group II
CCl4 intoxicated animals. These enzymes were brought back to near normal
levels in BHE pretreated group III animals (P<0.001). Similarly the elevated
ALP, ACP and LDH enzyme levels in group II CCl4 intoxicated animals were
also significantly decreased in the group III BHE pretreated CCl4 intoxicated
animals (p<0.01, P<0.001). Comparison of Group I control rats with that of
group VII which received only BHE showed no significant variation in the
171
marker enzyme levels suggests that there was no adverse side effects due to
the administration of Tween –80 and BHE alone.
From Figure XII, it was evident that BHE plays a protective role on
the serum enzyme levels of ACE, γGT and 5'-Nucleotidase. The enzymes like
γ-GT (p�0.001) and 5′-Nucleotidase (p<0.05) were significantly increased in
group II CCl4 intoxicated animals. These increased levels were brought back
to near normal levels in BHE treated group III animals. The probable
mechanism by which the BHE extract exerts its protective action against CCl4
induced hepatocellular metabolic alterations could be by the stimulation of
hepatic regeneration. Serum acetyl choline esterase levels in the present study
decreased in CCl4 treated group II animals. BHE treatment reverted
the decreased levels to near normalcy (p<0.001) which was comparable to
that of standard silymarin drug. The BHE was effective in correcting these
marker enzyme levels when compared with its individual preparations like
EAE and PLE extracts. Comparison of group I and VII shows no significant
variation in these enzyme levels indicates no appreciable adverse side effects
due to the administration of Tween–80 and BHE only.
Table X shows the changes in liver tissue levels of ALT, AST, LDH,
ALP and ACP in different groups of experimental animals. All the marker
enzyme levels were significantly (p<0.001) increased in CCl4 intoxicated rats.
Being cytoplasmic in location the marker enzymes AST, ALT, ALP and LDH
are increased when hepatocytes get damaged as in the case of CCl4 damage.
The stabilization of AST, ALT, LDH, and ALP levels by BHE is a clear
indication of the improvement of the functional status of the liver cells.
172
Comparison of group I and VII shows no significant variation in these
enzyme levels indicates no appreciable adverse side effects due to the
administration of Tween–80 and BHE only.
Table XI shows the changes in liver tissue levels of γGT, 5’
Nucleotidase and Xanthine oxidase in different groups of experimental
animals. All these enzymatic parameters were significantly (p< 0.001)
increased in the group II CCl4 intoxicated animals. In the present study, the
elevated levels of XO, γGT , 5’Nucleotidase activity in the CCl4 administered
group was shown to be effectively counteracted by the administration of
BHE.
Moreover, the hepatoprotective activity of BHE was much stronger
than that of the reference drug silymarin, administered at the same
concentrations.
The BHE was effective in correcting these marker enzyme levels
when compared with its individual preparations like EAE and PLE extracts.
Comparison group I and VII shows no significant variation in these enzyme
levels indicates no appreciable adverse side effects due to the administration
of Tween –80 and BHE only.
Figure XIII shows the serum lipid profile of the control and the various
experimental animals. There was a significant increase (p � 0.001) in the
levels of triglycerides and cholesterol in CCl4 intoxicated Group II animals.
This showed that a block in the secretion of hepatic triglycerides and
cholesterol into the plasma, a major mechanism underlying the fatty liver
173
induced by CCl4 and other toxins in the rats. The concentration of
phospholipids was significantly (p�0.001) increased in CCl4 intoxicated
Group II animals. The decreased levels of cholesterol, triglycerides and
increased level of phospholipids were brought back to near normal by the
treatment of BHE. This observed restoration of the CCl4 evoked changes in
the serum lipid profile explains the protective nature of BHE.
Table XII depicts the serum lipoprotein profile of the control and the
experimental animals. Increased levels of LDL and VLDL cholesterol
(p<0.01) and decreased level of HDL in CCl4 intoxicated rats were restored
to near normal levels on BHE treatment. The recovery towards normalization
of serum lipoproteins caused by BHE is almost similar to that caused by
silymarin, in the present study which was used as a positive control.
The BHE was effective in correcting these serum lipid and lipoprotein
profile when compared with its individual preparations like EAE and PLE
extracts. Comparison of group I and VII shows no significant variation in
these parameters indicating that no appreciable adverse side effects due to the
administration of Tween –80 and BHE alone.
Table XIII depicts the concentration of total lipids, cholesterol,
phospholipids and triglycerides in liver tissue. Significant enhancement in the
concentrations of total lipids, cholesterol, triglycerides and phospholipids
were observed in the tissues of group II rats which received CCl4 alone. The
increased lipid profile parameters in the liver tissue were significantly
brought towards normalization on treatment with BHE.Moreover it was
174
observed that the combined preparation of BHE was found to be more
effective, when compared with its individual preparation that was given to the
group IV and group V animals respectively.
Figure XIV shows the values of liver glycogen and protein in different
experimental rats. In the present study a significant (p<0.001) decrease in the
liver protein and glycogen (p<0.001) were observed in CCl4 intoxicated
group II rats. It has been observed that there was a significant hypoglycemia
with a drop in hepatic glycogen content. Acute liver failure due to CCl4
intoxication was characterized by a disturbed protein synthesis. These protein
and glycogen levels were returned to near normal in the BHE treated groups,
which shows the protective nature of the drug against the CCl4 damage.
Comparison of group I and VII shows no significant variation in these
parameters which indicates no appreciable adverse side effects due to the
administration of Tween –80 and BHE only.
From Table XIV was evident that the levels of lipid peroxidation LPO
products malanoldehyde, conjugated dienes, nitric oxide and hydro peroxides
were significantly increased [p<0.01] in the liver tissues of CCl4 intoxicated
group II rats. Increased production of Reactive Oxygen Species [ROS] due to
oxidative stress plays an important role in liver diseases. CCl4 has been
reported to induce lipid peroxidation and alter the antioxidant defence system
through formation of free radicals, which in turn causes damage, and
degeneration of hepatic tissues. These values were returned to normal levels
175
in BHE treated group III animals showing the protective nature of the drug by
scavenging the free radicals.
Figure XV shows the changes in the in- vitro lipid peroxidation in liver
cells in the presence of ascorbate, FeSo4 and H2O2 induced in different groups
of experimental animals. The hepatic tissue of untreated CCl4 induced rats
showed a 2-fold rise in basal lipid per oxidation levels as well as a 1.3-fold ,
1.8-fold and 1.54 fold increase in MDA in the presence of inducers such as
ascorbate, ferrous sulphate and hydrogen peroxide respectively.
Table XV shows the level of various antioxidant enzymes of liver in
various experimental group of rats. The enzyme activities like SOD, CAT,
GPX, GST, and GR were significantly decreased [p<0.01] in CCl4 intoxicated
group II rats when compared to those of normal control rats. These
antioxidant enzyme levels were brought back to near normal levels on
treatment with BHE group III animals.
Table XVI and Figure XVI shows the levels of non-enzymic
parameters in normal, CCl4 intoxicated and plant drug treated groups of
different experimental animals. The decreased levels of vitamin E, Vitamin A,
total thiols, glutathione, uric acid, and cereloplasmin were observed in CCl4
treated group II rats. These values were restored to near normal levels
significantly (p<0.01) in group III CCl4 intoxicated BHE pretreated group III
animals
Thus the free radical scavenging property of BHE could have
maintained the near normal levels of non –enzymic antioxidants in-group III
176
animals. Decreased activities of non-enzymic antioxidants in CCl4 treated
group II rats may increase their susceptibility to oxidative injury. Elevated
levels of these non-enzymic antioxidants in BHE treated group III animals
offer protection against the oxidative injury caused by the free radicals.
Table XVII shows the activities of membrane bound ATP ases in the
liver of various experimental animals. The levels of membrane bound
enzymes were significantly decreased in the liver tissues of CCl4 intoxicated
group II rats. The Na+/K+-ATPase, Mg2+- ATP ase and Ca2+- ATP ase are
the membrane bound enzymes which are responsible for the transport of
these ions respectively across the cell membrane at the expense of ATP. The
decreased level of these enzymes in CCl4 intoxicated rats may be due to the
alteration of membrane lipid composition due to the release of free radicals.
The rats which received BHE, EAE, and PLE restored the enzyme levels to
near normal levels which could be due to the ability of plant extracts to
protect the membranes from oxidative damage through inhibition of lipid per
oxidation.
Table XVIII depicts the effect of BHE on the glycolytic enzymes in the
various experimental group animals. A significant decrease in the activities of
glycolytic enzymes, in the liver of CCl4 intoxicated rats were restored to near
normal levels in BHE pretreated group III rats.
Table XIX shows the effect of BHE in the gluconeogenic enzymes in
the various experimental group animals. The activities of gluconeogenic
enzymes like, glucose-6-phosphatase and fructose-1, 6-diphosphatase in liver
177
were found to be significantly decreased in CCl4 intoxicated rats. The BHE
restored the normal levels of these enzymes, which shows the protective
nature of the drug on the mitochondria from damage, there by normalizing
these gluconeogenic enzymes and keeping the blood glucose in normal levels.
Figure XVII shows the average values of liver glycoprotein in different
experimental rats. Glycoprotein are linear polymers of amino acids with
branching chain of carbohydrates that may include hexose, hexoseamine and
sialic acid. There was a significant decrease in the levels of Glycoprotein
(p<0.001) was observed in the group II CCl4 treated animals due to the
increased load of the toxic metabolites. The increase in glycoprotein content
of BHE treated group II animals suggested the cytoprotective nature of the
formulation.
The Figures XVIII to XXI depicts the histopathological changes in
the liver, kidney, heart and intestinal tissues. CCl4 selectively damages the
liver which is shown in Figure XIX(b) by the formation of centrilobular
necrosis. The BHE treated liver cells showed near normal architecture. The
histopathological changes were negligible as far as kidney heart and intestinal
tissues are concerned.
178
DISCUSSION
Liver plays a major role in detoxification and excretion of many
endogenous and exogenous compounds, any injury to it or impairment of its
functions may lead to many implications on one’s health. Management of
liver diseases is still a challenge to the modern medicine (Reddy et al., 1993;
Handa, 1991) The modern medicine have little to offer for alleviation of
hepatic ailments, where as most important representatives are of
phytoconstituents (Handa and Kapoor, 1999). Liver is the most important
organ concerned with metabolic activities of the human body. It has
tremendous capacity to detoxify toxic principles and synthesize useful
principles. Therefore damage to the liver inflicted by hepato-toxic agents is of
grave consequences. There is an over increasing need for an agent which
could protect it from such damage. A great deal of research has been carried
out to evaluate scientific basis for the claimed hepatoprotective activity of
herbal agents as a single agent or in formulation.
Liver detoxifies and excretes destructive agents in many toxication
cases. The toxins are converted into the intermediate reactive radicals, prior
to their hepatotoxic effects, followed by degenerative necrotic and atrophic
liver parenchyma cells with interstitial connective tissue (Robins and Kumar,
1987). CCl4-induced hepatotoxicity in rats represents an adequate
experimental model of cirrhosis in man and it is used for the screening of
hepatoprotective drugs (Al-Shabanah et al., 2000) It is well established that
CCl4 induces hepatotoxicity by metabolic activation, therefore it selectively
causes toxicity in liver cells maintaining semi-normal metabolic function.
179
CCl4 is bio-transformed by the cytochrome P450 system in the endoplasmic
reticulum to produce trichloromethyl free radical (•CCl3). Trichloromethyl
free radical then combines with cellular lipids and proteins in the presence of
oxygen to form a trichloromethyl peroxyl radical, which may attack lipids on
the membrane of endoplasmic reticulum faster than trichloromethyl free
radical. Thus, trichloromethylperoxyl free radical leads to elicit lipid
peroxidation, the destruction of Ca2+ homeostasis, and finally, results in cell
death. A number of investigators have utilized this chemical to produce liver
cirrhosis in experimental animals (Parola et al., 1992).
The ancient traditional medicine - Ayurveda: The origin of Ayurveda
has been lost in prehistoric antiquity, but their characteristic concepts appear
to have been nurtured between 2500 and 500 BC in India (Mukherjee, 2001)
Herbal drugs constitute a major part in all traditional systems of medicine.
Herbal medicine is a triumph of popular therapeutic diversity. Plants above all
other agents have been used for medicine from time immemorial because they
have fitted the immediate personal need, are easily accessible and
inexpensive. There are approximately 1250 Indian medicinal plants, which
are used in formulating therapeutic preparation according to ayurveda and
other traditional system of medicine (Mills and Kerry, 2000).
Therefore we have undertaken this study to evaluate the efficacy of
BHE which was made up of equal quantities of E. alba and P. longum in CCl4
induced hepatotoxic rats. The BHE showed significant protection as assessed
by biochemical, pharmacological and histological parameters. Probably
hepato- protective effect is a combined action of all ingredients.
180
The hepatoprotective nature of any formulation was evaluated after
fixing the LD50 value by acute toxicity studies. In addition to acute toxicity
studies chronic toxicity effects of the BHE was evaluated according to OECD
(2001) guidelines. In acute toxicity about 50% animal death was recorded
during the treatment period in treated groups given in 500 mg/kg of BHE
orally. Hence it can be concluded that BHE is practically toxic or lethal after
an acute exposure at the dose range of 500 mg/kg. This test limit for acute
oral toxicity is generally considered to be 5.0 g/kg body weight. The LD50
value of BHE was 500 mg/kg body weight, one tenth of the LD50 value was
considered as ED50 value for any pharmacological studies. So for
hepatoprotective efficacy studies 50 mg/kg body weight BHE was used which
was considered as its ED50 value.
Significant difference in the organ weight of lung and liver was
observed in the test animals which received the lethal dose drugs. The
histological parameters such as Hb, WBC and biochemical parameters like
glucose, Na, AST and ALP also showed significant difference. The similar
results were shown by Caisey and King (1980).
There were no significant differences in food consumption and
variation in the body weight was negligible. In the 3 month experiment, no
mortality was observed in any of the treatment group. There was no relevant
difference in body weight development, hematological or biochemical
parameters as mentioned by Carol, 1995 and organ weights for all groups.
181
For the male rats of the Biherbal extract treated group, values of AST,
ALT and cholesterol were slightly elevated as compared to control but not
statistically significant (Barry, 1995).
The 3 month daily oral application of Biherbal extract to rats yielded
no signs of toxicity. In addition, no behavioural or physiological changes
were observed on discontinuation of Biherbal extract feeding after 3 months
treatment. In rats, the extract tested was proven non-toxic under the
experimental conditions. The dosage range and study duration applied in this
study are relevant for long-term human use, and represent dosage schemes by
far exceeding the normal human application. The results of this study do not
allow the conclusion of any toxicity of Biherbal extract, particularly to the
liver.
In the present investigation a significant (p < 0.01) increase in the liver
weight was shown in Group II CCl4 intoxicated animals, when compared to
that of group III BHE pretreated animals . According to Saxena (1979) this is
due to the accumulation of lipids largely the triglycerides in the CCl4 rats.
This was reduced in the BHE treated rats leading to the decreased weight of
the liver. The decrease in glucose level was significant in CCl4 treated
groups. This might be due to the glucose 6 phosphatase deficiency in the
CCl4 administered rats. CCl4 elevated the serum levels of urea and bilirubin
due to its enzymatic activation of •CCl3 free radical, which in turn alters the
structure and function of liver cells. According to Rao (1973) there is a
defective excretion of bile by the liver due to hepatotoxin injury which is
reflected in their increased levels in the serum. Hyperbilirubinaemia is a very
182
sensitive test to substantiate the functional integrity of the liver and severity of
necrosis, of hepatocytes (Singh et al., 1998). In BHE pretreated group III
amimals these biochemical parameters were decreased (p<0.001),when
compared with the CCl4 intoxicated group II animals. The combinational
preparation (BHE) was found to be effective, when compared with the drugs
given individually to the group IV and group V animals.
Similar to our results Dubey et al. (1994) reported a depression in total
protein level of serum due to the defect in protein biosynthesis. The serum
levels of total proteins, albumin and globulin were significantly decreased in
CCl4 intoxicated rats when compared to control animals. This is due to the
disruption and disassociation of polyribosomes from endoplasmic reticulum
following CCl4 administration according to Clawson (1989). The decrease in
serum albumin might be due to a reduction in hepatic albumin biosynthesis
(Kheir et al.,1992). The total protein levels were increased in BHE pretreated,
CCl4 intoxicated group III animals showing the regeneration of hepatic cells.
This may be due to the promotion of the assembly of ribosome on
endoplasmic reticulum to facilitate uninterrupted protein biosynthesis.
Stabilization of serum bilirubin and urea levels through the administration of
the plant extract is further a clear indication of the improvement of the
functional status of the liver (Anupam Bishayee et al., 1995). The reason for
this improvement might be that P. longum Linn. contains flavonoids, which
might have scavenged the free radical offering hepatoprotection. This increase
in the protein levels are more pronounced in BHE treated group III animals,
when compared with the group IV and V, which received these drugs
183
individually. Comparison between Group I and VII shows no
significant variation in protein levels indicates no appreciable adverse side
effects due to the administration of Tween - 80 and BHE only. Group
comparison between group III and group VI shows no significant variation in
these parameters indicating that the BHE has got the same effect as that of
silymarin which was considered as the positive control.
The plasma levels of the liver marker enzymes like AST, ALT, ALP,
ACP, γGT, 5'-nucleotidase, ICD and LDH were significantly
(p< 0.001) increased in CCl4 intoxicated group II animals. According to Brent
and Rumack (1993); Fehèr and Prònai (1993) hepatotoxic compounds such as
CCl4 are known to cause remarkable increase in serum transaminases and
induce liver injury through lipid peroxidation by free radical derivatives of the
compound indicating the cellular leakage and loss of the functional integrity
of cell membranes in liver as observed in our results. Acid phosphatases are
frequently employed as the marker enzymes to assess the lysosomal changes
as reported by Tanaka and Iizuka (1968). The rise in serum levels of γGT, 5'-
nucleotidase and ICD has been attributed to the damaged structural integrity
of the liver. Moreover according to Rao (1973) in liver injury due to
hepatotoxin, there is a defective excretion of bile by the liver which is
reflected in their increased levels in serum Oral administration of BHE at a
dose of 50 mg/kg body weight to rats caused a decrease in the activity of the
above enzymes, which may be a consequence of the stabilization of plasma
membrane as well as repair of hepatic tissue damage caused by CCl4. This is
supported by the view by Thabrewet et al. (1987) that serum levels of
184
transaminases return to normal with the healing of hepatic parenchyma and
regeneration of hepatocytes. The preliminary phytochemical screening
showed the presence of many compounds which could account for the
regeneration of hepacytocytes. According to Khopde et al. (2001) compounds
in their natural formulations are more active than their isolated form. Anupam
Bishayee (1995) reported similar studies using carrot extracts.
Serum acetyl Choline esterase levels in the present study decreased
abruptly in CCl4 treated group II animals. Zakut et al. (1988) reported that
Pseudocholinesterase is low also in some instances of liver disease, including
decompensated cirrhosis, hepatitis, metastatic carcinoma, chemical toxicity,
and in malnutrition. BHE treatment reverted the decreased levels to near
normalcy (p<0.001) Lipid peroxidation, is accepted to be one of the principal
causes of CCl4 induced liver injury, and is mediated by the production of free
radical derivatives of CCl4. Antioxidant principles from herbal resources are
multifaceted in their effects and provide enormous scope in correcting the
imbalance through regular intake of a proper diet. According to Vitaglione
et al. (2004) natural antioxidants have been proposed and utilized as
therapeutic agents to counteract liver damage. Similar hepatoprotective
activity could be expected by our BHE also.
Hepatic cells participate in a variety of metabolic activities and contain
a host of enzymes. As reported by Wells (1988) liver tissues, contain higher
concentrations of AST and ALT in cytoplasm and AST in particular also
exists in mitochondria. In liver injury, the transport function of the
hepatocytes is disturbed, resulting in the leakage of plasma membrane
185
(Zimmerman and Seef, 1970). Being cytoplasmic in location the marker
enzymes AST, ALT and LDH are increased when hepatocytes get damaged as
in the case of CCl4 damage. Apart from that, γ GT, 5′Nucleotidase and
xanthine oxidase were also elevated in the CCl4 intoxicated group II animals.
It is well documented by Krauskopf et al. (2005) that XO is an important
prerequisite factor in the process of O2 generation in CCl4 toxicity and this
observation concurred with our finding where a significant rise in XO was
noticed in CCl4 administrated rats followed by a significant increase in O2
generation leading to oxidative stress. According to Kiso et al. (1984)
oxidative stress is considered to play a prominent causative role in many
diseases including liver damage.Cellular γGT has a central role in glutathione
homeostasis by initiating the breakdown of extracellular glutathione (GSH),
the critical antioxidant defence for the cell as reported by Kugelman et al.
(1994). So an increase in the γGT enzyme level indicates the increased
breakdown of glutathione in the CCl4 intoxicated rats and due to the
increased deprivation of glutathione which cannot counter act with the
synthesis of the same altering antioxidant defense mechanism leading to
hepatotoxicity. In this study, the elevated level of XO, γGT, 5′Nucleotidase
activity in the CCl4 administered group was shown to be effectively
counteracted by the administration of BHE. The stabilization of AST, ALT,
ACP, and ALP levels by BHE is a clear indication of the improvement of the
functional status of the liver cells. It has been shown by Yasuda et al. (1980)
that protective agents exert their action against CCl4 induced liver injury by
impairment of CCl4 mediated lipid peroxidation, either through decreased
production of free radical derivatives or due to the antioxidant activity of the
186
protective agent itself. The preliminary phytochemical screening of these
extracts showed the presence of phenolic compounds and flavonoids which
may be effective in protecting the rats from CCl4 injury. The compounds
Pipernonaline, Pellitorine, Piperine, Piperanine and Piperlonguminine are
isolated from Piper longum may be responsible for the protective activity
(Stohr et al., 2001).
The plasma and liver tissue lipid profile of the control and the
experimental animals were discussed below. In the present investigation there
was a accumulation of triglycerides and cholesterol in the hepatic cells which
was paralled by a decrease in the concentration of plasma lipids and
lipoproteins as mentioned in the report of Littleton and John (1979). Several
investigators showed that a block in the secretion of hepatic triglycerides into
the plasma is the major mechanism underlying the fatty liver induced by CCl4
and other toxins in the rats. Torres-Durán et al., 1998; Devarshi et al., 1986
reported that fat from the peripheral adipose tissue is translocated to the liver
and kidney leading to its accumulation during toxicity. Moreover the hepatic
triglycerides is not released as such, but it is combined with lipoprotein . Due
to the interference with the synthesis of protein moiety by CCl4 the synthesis
of lipoprotein also, gets affected leading to the decreased levels of cholesterol
in the serum. Remarkable increase in the concentration of phospholipids was
noticed both in the serum and the liver of group II rats.According to
Weissberger (1940) hepatotoxic treatment produces an increase in the level of
phospholipids in serum which may be due to the decrease in mitochondrial fat
oxidation. The altered biochemical parameters in the liver tissue were
187
significantly brought towards normalization by co-administration of BHE.The
recovery towards normalization of these lipid profile caused by BHE is
almost similar to that caused by silymarin, in the present study. Similar results
have been reported by Morazzoni and Bombardelli (1995). The presence of
phytoconstituents such as triterpene glycoside, saponins like eclalbasaponin,
3β, 20β, 16β-trihydroxytaraxastane; 3β, 20β, 28-trihydroxytaraxastane and
sulphated saponinsin in the leaves of E.alba might be account for the
hepatoprotective activity exhibited by BHE
In accordance to the present study, it has been observed that there was
a significant hypoglycemia with a drop in hepatic glycogen content. This
might be due to the peripheral uptake and utilization of glucose that is
consequently increased. Acute liver failure due to CCl4 intoxication was
characterized by a disturbed protein synthesis. In the present study also there
is significant p<0.001decrease in the liver protein was observed in CCl4
intoxicated group II rats. This may be due to the ROS generated as a result of
•CCl3 radical which in turn affect the amino acids histidine, methionine and
tyrosine.Oxidation of protein sulphahydryl groups have been significantly
contributed to the damage, depending on the protein affected. These protein
and glycogen level were returned to near normal levels in the BHE treated
groups, which shows the protective nature of the drug against the CCl4
damage. The compounds piperlonguminine, piperine, apigenin, dimethyl
ether and β sitosterol were reported by Parmar et al 1993 in P. longum might
have been accounted for the hepatoprotective activity.
188
The levels of Lipid peroxidation products, Malanoaldehyde,
Conjugated dienes, Iron, Nitric oxides and Hydroperoxides were significantly
increased in the liver tissues of CCl4 intoxicated group II rats. Serious
attention is now paid to the cytotoxicity of active oxygen: free radicals as the
cause of various pathological conditions. Lipid peroxidation, is accepted to be
one of the principal causes of carbon tetrachloride-induced liver injury, and is
mediated by the production of free radical derivatives of carbon tetrachloride.
According to Niki (1995) lipid peroxides produced from unsaturated fatty
acids via radicals, cause histotoxicity and promote the formation of additional
free radicals in a chain reaction-type manner. According to Floyd et al.,
(1984) if the in vivo activity of enzymes or scavengers is not high enough to
inhibit these radicals, various diseases such as arteriosclerosis, liver disease,
diabetes, inflammation, renal failure or accelerated aging may result.
The measurement of lipid peroxidation (LPO) is one of the most
commonly used assays for radical induced damage (Svingen et al., 1979;
Sevanian and Hochstein, 1985). LPO is a chain reaction which can occur by
enzymatic or non-enzymatic reactions, in most cases catalyzed by transition
metals, where active oxidants cause th e breakdown of polyunsaturated fatty
acids in membrane phospholipids.
There are several assays for the determination of LPO, but two of the
more frequent techniques to measure this process are to quantify the presence
of Conjugated dienes (CD) and to determine thiobarbituric acid-reactive
substances (TBARS). Conjugated dienes are formed by the rearrangement of
double bonds of the PUFAs during the peroxidative process, and they are
189
considered an estimation of “in vivo” LPO, whereas the TBARS assay relies
on the adducts formed between thiobarbituric acid and the carbonyl end
products of lipid peroxidation progression, mainly malondialdehyde.
Non-enzymatic in vitro lipid peroxidation and formation of
lipidperoxides can be initiated by adding ascorbate in the presence of oxygen
and Fe3+ or Fe2+ ions to various tissue preparations. It was reported by Rosa
and Catala, 1998 that Fe2+ and ascorbic acid stimulated lipid peroxidation in
rat liver microsomes and mitochondria. Ascorbic acid is a critical antioxidant
that acts as a free radical scavenger and may regenerate other antioxidants,
including vitamin E (Chan, 1993). However, the reducing capacity of ascorbic
acid can potentially lead to redox cycling of transition metals, which in turn
can generate hydroxyl radicals in the presence of hydrogen peroxide. The
addition of ascorbic acid to iron in the form of FeSO4 greatly increases
oxidative damage in vitro. Markers of lipid peroxidation, protein modification
and DNA damage are all enhanced by ascorbic acid. In addition, ascorbic acid
has been suggested to directly produce genotoxic lipid hydroperoxides in the
absence of metals. Thus, metal coordination by polyphenolics may be most
effective in antioxidant action In order to clarify the mechanism of action of
these drugs, in vitro experiments were undertaken. The hepatic tissue of
untreated CCl4 induced rats showed a 2 fold rise in basal lipid peroxidation
levels as well as 1.3, 1.8 and 1.5-fold increase in LPO in the presence of
inducers such as ferrous sulphate, ascorbate and H2O2 respectively. According
to the results obtained, BHE inhibited lipid peroxidation in liver homogenate,
which is shown by the decreased levels of MDA, produced. Recent studies by
190
Miller et al., (1996) showed that iron-chelating activity of some flavonoids is
closely related to their antioxidant action.
The in vivo oxidants such as CD, LOOH, iron and nitric oxide
metabolites were also found to be increased in CCl4 treated rats (Geller et al.,
1993) suggested that increased NO production and plasma nitrite/nitrate
levels are also found during chronichepatic inflammation, suggesting a role
for NO in the hepatic response to inflammatory stimuli, It has been
demonstrated by Beckman et al., 1990 that nitric oxide (NO) reacts with O2
in pathological states to produce peroxynitrite, a potent oxidizing agent.
Peroxynitrite can initiate intracellular LPO formation and NP-SH oxidation,
resulting in producing an extreme cellular membrane damage. The increase in
the LPO substances in the liver of CCl4 intoxicated rats indicates enhanced
lipid peroxidation leading to tissue injury and failure of defence mechanisms
to prevent the formation of excess free radicals. In the present study, BHE
extract was effective in reducing the production of TBARS indicating the
formation of decreased MDA. Amalaraj and Ignacimuthu (2001) reported that
the hepatoprotective effect is associated with antioxidant rich plant extracts.
The possible action of the BHE in decreasing the LPO reaction may be
correlated with its antioxidant chemicals that affects oxygen radical-
dependent damage in vivo by blocking radical formation, that is, by removing
its precursors, superoxide, hydrogen peroxide and then transition metals.
Quantitative analysis of the BHE showed the presece of considerable amount
of Polyphenols in the form of flavonoids, could account for the prevention of
LPO both in in vivo and in vitro experiments.
191
The levels of various antioxidant enzymes like SOD, CAT, GPx, GST,
and GR activities were significantly decreased [p<0.01] in CCl4 intoxicated
group II rats when compared to BHE treated rats .This indicates the antilipid
peroxidative nature of the system against CCl4 treatment is enhanced by BHE.
Glutathione [GSH] constitutes the first line of defence against the free radical.
In states of excessive oxidative stress, GSH is converted into GSSG and
depleted leading to lipid peroxidation. According to Reckengel et al., 1991 it
is very important to maintain the level of GSH to prevent lipid peroxidation.
GSSG is reduced to GSH by GR, which is NADPH dependent enzyme. It
plays a role in maintaining adequate amounts of GSH. So, the reduction of
GR results in decreased level of GSH. Reduction in GR and GSH was
observed in CCl4 treated group II rats indicates damage to the liver cells. The
decreased levels of GSH in Group II animals may be due to the increased
utilization or lower expression of GSH.GST is a soluble protein which is
located in cytosol, plays an important role in the detoxification and excretion
of xenobiotics GST catalyzes the conjugation of the thiol functional groups of
glutathione to electrophylic xenobiotics and results in increasing solubility.
Since GST increases solubility of hydrophobic substances, it plays an
important role in excretion of xenobiotics. GPX a selenium-containing enzyme
which is believed to reduce hydrogen peroxide and various hydroperoxides
using glutathione as a reducing agent to form water and corresponding
alcohols, respectively. Cellular hydroperoxides can otherwise serve as
substrates for the metal mediated Fenton reaction to generate the highly
reactive hydroxyl radical. According to Halliwell and Gutteridge (2000) the
unavailability of GSH reduces the activities of GR, GPx and GST.
192
Reconstitution of the levels of GSH, GPX and GST activity in the rats treated
with BHE confirms the protective and antioxidant efficiency of the BHE.
The enzymes like SOD and CAT plays an important role in the
elimination of ROS derived from the peroxidative process in liver tissues.
SOD removes superoxide by converting it to H2O2, which can be rapidly
converted to water by CAT. As stated by Halliwell et al., (1992) the
antioxidant or free radical generation inhibition is important in protection
against CCl4 induced liver lesions. Potential antioxidant therapy should
therefore include either natural free radical scavenging antioxidant enzymes
or agent, which are capable of augmenting the activity of these enzymes,
which include SOD, CAT and GPx (Bhattacharya et al., 1997). The
components in BHE contain active principles like piperine,and piperidine
which are known for hepato protective and antioxidant activity. It is reported
that piperine and piperidine could reduce the tert-butyl hydroperoxide and
CC14 induced lipid peroxidation both in vitro and in vivo resulting in
significant hepatoprotection in rats (Koul and Kapil, 1993; Khajuria et al.,
1998; Surh, 1999).
The free radical scavenging property of BHE could have maintained
the near normal levels of non - enzymic antioxidants in-group III animals
Several experimental studies investigated the role of antioxidative vitamins,
minerals, drugs and plant-derived compounds in the prevention and therapy of
liver fibrosis. Decreased activities of non-enzymic antioxidants like vitamin
C, vitamin E Vitamin A, thiols, uric acid, and cereloplasmin levels in CCl4
treated group II rats may increase their susceptibility to oxidative injury.
193
Elevated levels of these non-enzymic antioxidants in BHE treated group III
animals offer protection against the oxidative injury caused by the free
radicals. Parola, 1993 stated that Vitamin E inhibited m-RNA expression of
tumour growth factor-b and α2 procollagen in CCl4-induced animal fibrosis.
Beta-carotene treatment also decreased liver hydroxyproline level during CCl4
administration and reduced liver fibrosis by inhibition of lipid peroxidation in
animal studies as stated by Seifert et al., 1995.
Recently it has been shown by Abul et al., (2002) that uric acid can be
used as a scavenger of peroxynitrate (ONOO), a toxic product of the free
radicals nitric oxide and superoxide. The production of (ONOO) has been
implicated in the pathogenesis of central nervous system inflammatory
diseases, including multiple sclerosis and its animal correlate experimental
autoimmune encephalomyelitis. The mechanism of uric acid action as an
antioxidant may relate to the formation of a urate-free radical after oxidant
exposure. This urate-free radical is being scavenged by ascorbate. Thus it is
suggested that urate and ascorbate interact as plasma antioxidants. According
to Denkop (1979). Cereloplasmin is produced in the liver in response to
tissue injury and released into the circulation. Ceruloplasmin is considered a
preventive plasma antioxidant because it sequesters transition metals, thereby
preventing them from participating in free radical reactions as reported by
Frei et al., 1988.
Plasma total sulfhdryl groups have also been suggested by Sedlak and
Lindsa (1968) to contribute significantly to the antioxidant capacity of
plasma. The Phytoconstituents as reported by Upadhyay et al., (2001) such as
194
eclalbatin, alpha-amyrin, ursolic acid, oleanolic acid, ecliptasaponin,
daucosterol, stigmasterol-3-O-glucoside and coumestans were also present in
BHE as main active principles for its hepatoprotective activity.
The levels of membrane bound enzymes were significantly decreased
in the liver tissues of CCl4 intoxicated group II rats The Na+, K+ ATPase.,
Mg2+ ATPase and Ca2+ ATP ase are the membrane bound enzymes which
are responsible for the transport of these ions respectively across the cell
membrane at the expense of ATP According to (Stehoven and Bonting
(1981) activated oxygen species which induce lipid peroxidation and damage
various cell functions is known to inactivate many enzymes, both cytosolic
and membrane-bound. Marin et al. (1992) reported that during lipid
peroxidation process the activity of different membrane-bound enzymes are
changed. This ultimately leads to changes in membrane permeability or to the
destruction of cells or whole cell systems. According to Frank and Massaro
(1980); Tirmenstein and Nelson (1990); Vermeulen et al., (1992) have Stated
that the decreased level of these enzymes in CCl4 rats may be due to alteration
in membrane lipid composition and/or content,lipid peroxidation, disturbance
in calcium homeostasis and oxidation and alkylation of thiol groups of
glutathione and proteins. The rats which received BHE, EAE, and PLE
retained the levels of TBA reactive substances and the activities of these
enzymes were also restored to the near normal levels which could be due to
the ability of plant extracts to protect the SH group from oxidative damage
through inhibition of lipid peroxidation, In this work, the effect of CCl4 on
drug oxidizing system may be a significant factor in the alteration of
195
phospholipid and cholesterol were observed experimentally. The
mitochondrial ATPase requires tyrosine and glutamate residues respectively
for its hydrolytic and proton channel activity. Therefore the possible
hepatoprotective effect of BHE on the chemical-induced liver injuries may be
due to: (1) inhibiting Cytochrome P-450 activity, (2) preventing the process of
lipid peroxidation, (3) stabilizing the hepatocellular membrane and
(4) enhancing protein and glycoprotein biosynthesis.
Liver is the candidate organ involved in glucose homeostasis. It is the
main site for glycolysis, a process where glucose is degraded and
gluconeogenesis, where glucose is synthesized from lactate, amino acids and
glycerol. According to Bhavapriya and Govidasamy (2000) these are the two
important complementary events that balance the glucose load in our body
The acitivity of gluconeogenic enzymes like glucose-6-phosphatase and
fructose-1,6-diphosphatase were found to be significantly decreased in CCl4
intoxicated rats. This might be due to the glucose 6 po4 defciency in CCl4
administered rats. The BHE restored the normal levels of these enzymes
which protects the mitochondria from damage thereby protecting these
gluconeogenic enzymes .
Activity of hexokinase and phosphofructokinase enzymes which are
are ATP dependent are reported to be under regulation by citrate (Goyal
et al., 1990) which is a TCA cycle intermediate.Since in CCl4 damage ATP
depletion of the same was also considered as an important factor in the
decreased activity of these enzymes. According to Arathi and Sachdanandam
(2003) decrease in activity of phosphoglucoisomerase might be expected to
196
inhibit the proportion of glucose 6-phosphate metabolized via the glycolytic
pathway. Aldolase, another key enzyme in the glycolytic path way, decreases
in liver diseases and this may be due to cell impairment and necrosis.Our
results revealed the decrease in the activities of these microsomal marker
enzyme due to the increased formation of malondialdehyde following CCl4
treatment BHE treatment restored these enzyme levels to near normal
showing the regerating ability of the plant extracts.
Glycoproteins are linear polymers of aminoacids with branching chain
of carbohydrates that may include hexose, hexoseamine and sialic acid.
Elevated glycoprotein may be due to the tissue necrosis, rapidly metabolizing
tumur cell destruction from normal connetive tissue and non specific stimulus
in the process similar to that observed in many infectious diseases. According
to Kishore (1983) the main change observed during the necrotic stage of CCl4
poisoning was a highly significant reduction in the sialyl transferase activity
followed by a considerable decrease in the sialic acid content. The similar
effect was observed in our study also. According to Robinson et al., (1964)
the microsomal portion only is responsible for the glycoprotein synthesis and
the increased load of the toxic metabolites in the system might affect the
microsomes which may further be responsible for the decreased glycoprotein
components in the CCl4 treated rats. The increase in glycoprotein content of
BHE treated group II animals suggested the cytoprotective nature of the
formulation.
Histopatological examination of the livers provided supportive
evidence for this study. Liver of rats administered with CCl4 showed
197
centrilobular necrosis with mononuclear infiltration in the portal area, fatty
deposition and loss of cell boundaries. In animals treated with the BHE, there
was much lesser hepatocellular necrosis, mononuclear infiltration and loss of
cell architecture in comparison to livers from control animals.
Histopathological observations showed faster regeneration of the
hepatic cells in rats treated with BHE seems to suggest the possibility of BHE
being able to condition the hepatic cells towards accelerated regeneration.
Similar histopathological observations observed with silymarin seem to
suggest that the ability to cause accelerated regeneration may be a feature
common to certain medicinal plants to protect against liver dysfunction.
The mechanism by which BHE exerts its more protective action
against CCl4 induced alterations might be due to the synergistic activity of the
plants. However, the fact is that BHE when given prior to CCl4 administration
can produce more rapid recovery of the liver when compared with those
exposed to CCl4 only,which indicates that the protective action may be due to
the antioxidant property as in the case of other agents known to oppose the
hepatotoxic effects of CCl4.
REFERENCES Abul H, Mathew TC, Dashti HM, Al-badar A. Level of Superoxide Dismutase, Glutathione Peroxidase and Uric Acid in Thioacetamide-Induced Cirrhotic Rats. Anat Histol Embryol 2002; 31: 66–71.
Al-Shabanah OA, Alam K, Nagi MN, Al-Rikabi AC, Al-Bekairi AM. Protective effect of aminoguanidine, a nitric oxide synthase inhibitor against CCl4-induced hepatotoxicity in mice. Life Sci 2000;66:265-270.
Amalaraj, Ignacimuthu. Hepatoprotective effect of coumestans isolated from the leaves of Wedelia calandulaceae in paracetamol induced liver damage. Ind J Exp Biol 2001;39:1305–1307.
Anupam Bishayee, Alok Sarkar, Malay Chatterjee. Hepatoprotective activity of carrot (Daucus carota L.) againstcarbon tetrachloride intoxication in mouse liver. J Ethnopharmacol 1995;47:69-74.
Arathi G, Sachdanandam. Therapeutic effectof Semecarpus and Cardium Linn, nut milk extract on carbohydrate metabolizing and mitochondrial TCA cycleand respiratory chain enzymes in mammary carcinomarats. J Pharm Pharmol 2003; 55;1283-1290.
Barry SL. Animal Clinical Pathology. In: Michael JD, Mannfred AH, eds. CRC Handbook of Toxicology. U.S.A.: CRC Press, Inc., 1995, p.517.
Beckman JS, Chen TW, Marshall JPA, Freeman BA. Apparent hydroxyl radical productionby peroxynitrite: Implications for endothelial injuryfrom nitric oxide and superoxide. Proc Nat. Acad Sci 1990; 7: 1620–1624.
Belljoice L, Baron DN. Assay of Isocitrate Dehydrogenase.Clin chim acta 1960;5:740-747.
Bhattacharya SK, Bhattacharya A, Gosal S. Antioxidant activity of glycowithanolides from withania somanifera. Ind J Exp Bio 1997;35:236-241.
Bhavapriya V, Govidasamy S. Biochemicalstudies on the hypoglycemic effect Aegle marmelos (Linn). Correa Ex. RoxB. In streptozotocin induced diabetic rats. Ind Drugs 2000;37(10):474-477.
Biggs HG, Carey, Shirley, Morrison DB. Determination of Acetyl choline esterase. Ame J clin Path 1958;30:181-185.
Bonting SL.Sodium– potassium activated adenosine triphosphatase and cation transport. In membranes and ion transport. Bitter EE (ed.), London: Wiely inter science; 1970. p. 257.
Bousquet BF, Et J, Julien R, Bon R, Dreux C. Estimation of blood urea. Ann Biol Clin 1971;29:415-421.
Branstrup N, Krik JE. Bruni C.The hexokinase and phospho glucoisomerase activities of aorta and pulmonary artery tissue in individuals of various ages. J. Gerontol 1957;12:166-171.
Brent JA, Rumack BH. 1993. Role of free radicals in toxic hepaticinjury II. Clin Toxicol 1993;31:173-196.
Caisey JD, King DJ. Clinical chemical values for some common laboratory animals.Clin chem 1980;26:1877.
Cameron GR, Karunaratne WAE.Carbon tetrachloride cirrhosis in relation to liver regeneration. J Path BactA 1936;42:1-21.
Caraway WT. Standard Methods of Clinical chemistry, seligson, D, (ed.), New York and London: Academic press;1963,4:p.239.
Carol SA. Acute, Subchronic and Chronic Toxicology.In: Michael JD, Mannfred AH, eds. CRC Handbook of Toxicology. U.S.A.: CRC Press, Inc.,1995,p.51.
Chan AC. Partners in defense, vitamin E and vitamin C. Can J PhysiolPharmacol 1993;71:725– 31..
Chang W S, Chang YH, Lu FJ, Chiang HC.Inhibitory effect of phenolics on xanthine oxidase. Anticancer Res 1994;14:501-506.
Clawson GA.Mechanism of carbon tetrachloride hepatotoxicity.Path Immunopatho Res 1989;8: 104-112.
Denkop.Protective role of Cereloplasmin in inflammation. Agents and actions 1979; 914:333-336. Desai JD. Methods in Enzymology (Parker, Ed.), Vol 105. New York: Academic Press:1984.p.138.
Devarshi P, Kanase A, Kanase R, Mane S, Patil S, Varuthe, AT. Effect of mandur bhasma on lipolytic activities of liver, kidney and adipose tissue of albino rat during CCl4-induced hepatic injury. Journal of Biosci 1986;10:227–234.
Devasagagayam TPA, Tarachand O. Decreased lipid peroxidation in the rat kidney during gestation. Biochem Biophys Res Commun 1987;145:134-138.
Dobler RE, Anderson BM. Simultaneous inactivation of the catalytic activities of yeast glutathione reductase by N–alkyl melimides. Biochem Biophys Acta1981;659:70-74.
Drill VA, Hepatotoxic agents. Mechanism of action and dietary interrelationship. Pharmacol Rev1952;4:1-42.
Dubey GP, Agrawal A, Dixit SP. Effect of Liv-52 on different biochemical parameters in alcoholic cirrhosis. The Antiseptic 1994;91:205-208.
Ellman GL. Tissue sulphydryl groups. Arch Biochem Biophy 1959;82:70-77.
Evans DJ. Estimation of Total Adenosine tri phosphatase. Jbacterial 1969; 100:914-919.
Fehèr J, Prònai L. The role of free radical scavengers in gastrointestinaldiseases. Orvosi Hetilap1993;134:693-696.
Floyd RA, Watson JJ, Wong PK. Sensitive assay of hydroxyl free radical formation utilising high pressure liquid chromatography with electrochemical detection of phenol and salicylate products. J Biochem Biophys Methods 1984;10:221–235.
Folch J, Lee M, Stanley GSH. A sample method for the isolation and purification of total lipids from animal tissues, J Biol Chem 1957; 26:497-501.
Frank L, Massaro D. Oxygen toxicity. Am J Med 1980;69: 117-126.
Frei B, Stocker R, Ames BN. Antioxidant defenses and lipidperoxidation in human blood plasma. Proc Natl Acad Sci USA 1988; 85: 9748-9752.
Fried R, Fried LW. Methods of enzymatic analysis xanthine oxidase in berger (ed.), New york: London:Academic press;1974. p.644.
Gancedo JM, Gancedo C. Fructose-1, 6-diphosphatase, phosphofructokinase and glucose-6-phosphate dehydrogenase, from fermenting and non fermenting yeasts. Exp Biol Med1971; 106:607-609.
Geller DA, DiSilvio M, Nussler AK, Wang SC, Shapiro RA, Simmons RL, et al. Nitric oxide synthase expression isinduced in hepatocytes in vivo duringhepatic inflammation. J Surg Res 1993;55:427-32.
Gerbes AL, Avila, MA, Caselmann WH. Liver injury and liver protection: mechanisms and novel treatment strategies. Liver Int2006;26:902-903.
Gornall AJ, Bardawil, David MM.Determination of Protein by Biuret modified method. Biol Chem 1949;177:751-756.
Goyal RK, Bhullar SS, Singh R. Comparative sensitivity to inorganic phosphate of sucrose to starch conversion in sorghum and wheat gains raised through liquid culture. Plant physiol Biochem 1990;28:755-760.
Habig WH, Pabst MJ, Jakoby WB. Glutathione-S-transferases. The first enzymatic step in mercapturic acid formation. J Biolog Chemis 1974; 249:7130-7139.
Halliwell B, Gutteridge JM, Cross CE. Free radicals, antioxidants and human disease: where are we now? J Lab Clin Med 1992;119:598–620.
Halliwell B, Gutteridge JMC. Free Radicals in Biology and medicine. Nee york: Oxford University Press; 2000 p.148–149.
Handa SS, Kapoor VK. Text book of Pharmacognosy 2ndedn. New Delhi: Vallabh Prakashan; 1989.
Handa SS. Management of hepatic ailments. Pharma Times 1991; 23(4):13.
Hjerten S, pan H. Purification and characterization of two forms of a low affinity calcium ion ATP ase from erythrocytes membranes. Biochim. Biophys acta 1983;728:281-288.
Horrocks JE, Ward J, Kind J. A routine method for the determination of phosphoglucoisomeraseactivity in body fluid, J. Clin Pathol 1963;16:248-251
Hyvarimen A, Nikkila EA.Specific determination of blood glucose with o- toluidine. Clin Chim Acta1962;7:140-143.
Kaser M, Stekol JA. Determination of Vitamin A and Carotenes in Serum using the Carrprice reaction. J Lab clin Med1943;28: 904-909.
Khajuria A, Thusu N, Zutshi U, Bedi KL.Piperine modulation of carcinogen induced oxidative stress in intestinal mucosa. Mol cell Biochem 1998;189:113–118.
Kheir- Eldin AA, Hamdy MA, Motawi Tk, Shaheen AA, Abd EI, Gaead HM. Biochemical changes in arthritic rats under the influence of Vit E Agents and action 1992;36:300-304.
Khopde SM, Priyadarsini KI, Mohan H, Gawandi VB, Satav JG, Yakhmi JV, Banavaliker MM, Biyani MK, Mittal JP. Characterizing the antioxidant activity of amla (Phyllanthus emblica) extract. Curr Sci 2001;81(2):185-19.
Kind PRN, King EJ. Determination of Serum Alkaline and acid Phosphatase. J Clin Path 1954;7:132-136.
King J Estimation of lactate dehydrogenase. In “Practical Clinical Enzymology London: “D Von Nostrand Co. Ltd: 1965:p182
King J. The hydrolases-acid and alkaline phosphatase In: Practical Clinical Enzymology, Van, D.Eds., Norstand company Ltd:1965.p-284.
King Kind, P.R.N., and E.J King, 1954. Determination of Serum acid Phosphatase. J Clin Path 7:132-136.
Kishore GS, Nordquist RE, Carubelli R. Sialic acid metabolism in rats liver, effect of carbon tetrachloride.Life Sci 1983;33:2129-2137.
Kiso Y, Tohkin M, Hikino H, Hattori M, Sakamoto T, Namba T. Mechanism of antihepatotoxic activity of glycerrhizin. I. Effect of free radical generation and lipid peroxidation. Planta Medica 1984;50:298-302.
Klein M, Klein RA. The detection of oxidation in liposome preparations. Biochim Biophys Acta 1983; 210: 486- 491.
Klein RA. The detection of oxidation in liposome preparations. Biochim Biophys Acta 1983;210:486.
Koul IB, Kapil A. Evaluation of the liver protective potential of piperine an active principle of black and long peppers. Planta Medica 1993;59:413–417.
Krauskopf A, Lhote P, Petermann O, Ruegg UT, Buetler TM.Cyclosporin A generates superoxide in smooth muscle cells. Free Radic Res 2005;39:913-9.
Kugelman A, Choy H, Liu R, Shi M, Gozal E, Forman HJ, Gamma-glutamyl transpeptidase increases by oxidative stress in rat alveolar L2 epithelial cells. Am J Resp Cell Mol Biol 1994;11:586-592.
Littleton JM, John G. Synaptosomal membrane lipids of mice during continuous exposure to ethanol. J Pharm Pharmacol 1977 Sep;29(9):579–580.
Lowry OH. Rosebrough NJ, Farr AL, Randall RJ.Protein measurement with folin – phenol reagent. J Biol Chem 1951;193:265-275.
Luly P, Branahel O, Tria E. Determination of 5' Nucleotidase by kinetic method. Biochem Biophys Acta 1972; 283:447-451.
Malloy HT, Evelyn KA. The determination of bilirubin Biol Chem 1937;119:481-485.
Marin R, Rodriguez AJ, Proverbio T. Partial characterization of the inhibitory effect of lipidperoxidation on the ouabain-insensitive Na-ATPase ofrat kidney cortex plasma membranes. J Bioenerg Biomembr 1992;24:329-335.
Miller NJ, Castelluccio C, Tijburg L, Rice-Evans C. The antioxidant properties of theaflavins and their gallate esters–radical scavengers or metal chelators FEBS Lett 1996;392:40–4..
Mills S, Kerry B. Principles and Practice of Phytotherapy ed.New York: Churchill Livingstone; 2000.p22-25.
Miranda KM, Espey MG, Wink DA. A rapid, simple spectrophotometric method for simultaneous detection of nitrate and nitrite. Nitric Oxide 2001;5:62-71.
Misra H, Fridovich I.The role of superoxide anion in the autoxidation of epinephrine and a simple assay for superoxide dismutase. J. Biolol Chemis 1972;247:3170-3175.
Mitra SK, Venkataranganna MV, Sundaram R, Gopumadhavan S. Effect of HD-03, a herbal formulation, on the antioxidant defense system in rats. Phy the Res 1998;12:114-117.
Morazzoni P, Bombardelli E. Silybium marianum (Carduus marianus). Fitoterapia 1995;66:3–42.
Morsales MA, Jabbagy AJ Branzi HP. Neurospora news letters, 1973;20: 24-28.
Mukherjee Pulok K. Evaluation of Indian Traditional Medicine. J Drug inform USA 2001;35:631-640.
Necheles TF, Boles TA, Allen DM. Erythrocyte Glutathione – Peroxidase deficiency and haemolytic disease of newborn. J. Pediatric 1968;72:319-322.
Niebes. Determination of enzyme and degradation products of GAG metabolism in the serum of healthy and varicose subjects.ClinChimActa 1972;42:399-408.
Niki E. Antioxidants. Free radicals and hiological defence. In: Niki E, Shimasaki H, Mino M. Eds. Tokyo: Japan Scientific Societies Press; 1995. p. 3.
Nourooz-Zadeh J, Tajaddini-Sarmadi J, Eddie Ling, KL, Wolff SP.Low-density lipoprotein is the major carrier of lipid hydroperoxide in plasma.J Biochem1996;313:781-786.
Ohnishi T, Suzuki T, ozawa K. A comparative study of plasma membrane magnesium ion ATP ase activities in normal, regenerating and malignant cells. Biochim. Biophys acta 1982; 684:67-74.
Ohta Y, Nishida K, Sasaki E, Kongo M, Ishiguro L. Attenuation of disrupted hepatic active oxygen metabolism with the recovery of acute liver injury in rats intoxicated with carbon tetrachloride. Res Comm Mol Path Pharmacol 1997;95:191-207.
Ohta Y, Sasaki E, Nishida K, Kongo M, Hayashi T, Nagata M, Ishiguro L. Contribution of the antilipid peroxidative action of Dai-saiko-to extract to its preventive effect on carbon tetrachloride-induced acute liver injury in rats.Phythe Res 1998;12:5-8.
Okhawa H, Oshini N, Yagi K. Assay of lipid peroxides in animal tissues bythiobarbituric reaction. Anal biochem 1979;95:351-356.
Omaye ST, Turnbull JD, Sauberlich HE. Selected methods for the determination of ascorbic acid in animal cells, tissues and fluids. Methods Enzymol 1971;62:1-11
Park PJ, Jung WK, Nam KS, Shahidi F, Kim SK. Purification and characterization of antioxidative peptides from protein hydrolysate of lecithin-free egg yolk. J Am Oil Chem Soc 2001;78:651-656.
Parola M, Leonarduzzi G, Biasi F, Albano E, Biocca ME, Poli G, Dianzani MU. Vitamin E dietary supplementation protects against CCl4-induced chronic liver damage and cirrhosis. Hepatology 1992;16:1014-1021.
Parola M, Pinzani M, Casini A, Albano E, Poli G, Gentilini A, Gentilini P. Stimulation of lipid peroxidation or 4-hydroxynonenal treatement increases procollagen l1 (1) gene expression in human fat-storing cells. Biochem Biophys Res Comm 1993;194:1044–1050.
Ramsay, WNM. The determination of iron in blood plasma or serum. Clinica Chimica Acta 1957; 2: 214–220.
Ramsay, WNM. The determination of iron in blood plasma or serum.Clinica Chimica Acta 1957;2:214-220.
Rao RR. Mechanism of drug induced hepatotoxicity. Ind J Pharmacol 1973;5:313-318.
Raven HA.Improved colorimetric enzymatic assay of ceruloplasmin.J Lab Clin Med 1961;58:167-168.
Reckengel R, Glende Jr EA, Britton RS. Free radical damageand lipid peroxidation. In: meeks, R.G., Harrison, S.D., Bull, R.J. (Eds.), Hepatotoxicology. Florida: CRC Press; 1990. p.401–436.
Reddy PB, Reddy CK, Rambhau D, Venkateshvaralu V, Murthy VN. Antihepatotoxic activity of some Ayurvedic preparations. Ind J Pharm Sci 1993;55(4):137-140.
Reinhold JG. Total Proteins, Albumin, and Globulin. In: Standard Methods of Clinical Chemistry. M. Reiner (ed.). Vol. 1. New york Academic Press, 1953:p88.
Reitman S, Frankel S. A colorimetric method for the determination of Serum Glutamate Pyruvate Transaminase and Serum Glutamate Oxaloacetate transaminase. Am J Clin Path 1957;28:56-62.
Reuber MD, Glover EL. Cirrhosis and carcinoma of the liver in male rats given subcutaneous carbon tetrachloride. J Natl Cancer Ins 1970;44:419-427.
Rhodes C. Principles of testing for acute toxic effects. In: Ballantyne B, Marrs T, Syversen T, editors. General and Applied Toxicology. Bath Press, 1999; 1:p.39
Robins V, Kumar SL.: Basic Pathology, 4th edn. Philadelphia: W.B.Saunder Co; 1987.
Robinson GB, Molar J, Winzler RJ.Biosynthesis of glycoproteins. J. Biol. Chem ,. 1964;239;1134-1141.
Rosa D, Catala´ A. Fatty acid profiles and nonenzymatic lipid peroxidation of microsomes and mitochondria from bovine liver, kidney, lung and heart. Arch Physiol Biochem. 1998;106:33–37.
Rosalki SB, Rou D. Serum γGT activity in alcoholism Clin Chim Acta 1972; 39:41-47.
Rouser G, Fleisher S, Yamantoto A. Two dimentional thin layer chromatographic separation of polar lipids and determination of phospholipid by phosphorus analysis of sots. Lipids 1970;5:494-496.
Saxena A, Garg NK. Effect of Liv.52 on hepatic enzymes. Ind J Exp boil 1979;7:662.
Sedlak J, Lindsay RH. Estimation of total, protein bound and non-protein sulfhydryl groups in tissue with ElIman’s reagent. Anal Biochem 1968;25:192-205.
Sedlak J, Lindsay RH. Estimation of total, protein bound and non-protein sulfhydryl groups in tissue with ElIman’s reagent. Anal Biochem 1968; 25: 192-205.
Seifert WF, Bosma A, Hendriks HF, Van-Leeuwen RE. Beta carotene (provitamin A) decreases the severity of carbon tetrachloride induced hepatic inflammation and fibrosis in rats. Liver 1995; 15: 1–8.
Sevanian A, Hochstein P. Mechanism and consequences of lipid peroxidation in biological systems. Annu Rev Nutr 1985;5:365–390.
Singh B, Saxena AK, Chandan BK, Anand KK, Suri OP, Suri KA, Satti NK. Hepatoprotective activity of verbenalin on experimental liver damage in rodents. Fitoterapia 1998;69:135-140.
Sinha, AK. Colorimetric assay of catalase. Anal Biochem1972; 47:389-94.
Song CS, Rubin W, Rifkind AB, Kappas A. Membrane preparations.J Cell Biol 1969;41:124-132.
Stehoven MS,Bonting SL.Transport of adenosine triphosphates propereities and functions Physio. Rev 1981;61:1-76.
Stohr JR, Xiao PG, Bauer R. Constituents of Chinese Piper species and their inhibitory activity on prostaglandin and leukotriene biosynthesis in vitro. J. Ethnopharmacol. 2001;75:133-139.
Surh Y. Molecular mechanisms of chemopreventive effects of selected dietary and medicinal phenolic substances. Mutation Research 1999;428:305–327.
Svingen BA, Buege JA, O’Neal FO, Aust SD.The mechanism of NADPH-dependent lipid peroxidation. J Biol Chem 1979;254: 5892–5899.
Szasz G. A Kinectic Photometric method for serum γ Glutamyl transpeptidase. Clin Chem 1969;15:124-136.
Tanaka K, lizuka Y. Suppression of enzyme releasefrom isolated rat liver lysosomes by non-steroidal anti-inflammatory drugs. Biochemical Pharmacol 1968;17:2023-2032.
Thabrew MI, Joice PDTM, Rajatissa W. A comparative study of the efficacy of Pavetta indica and Osbekia octandra in the treatmentof liver dysfunction. Planta Medica 1987;53:239-241.
The Organization of Economic Co-operation and Development (OECD).The OECD guideline for testing of chemical: 420 Acute Oral Toxicity, France, 2001.
Tirmenstein MA, Nelson SD. Acetaminophen-induced oxidation of protein thiols. Contribution of impaired thiol-metabolizing enzymes and the breakdown of adenine nucleotides. J Biol Chem 1990;265:3059-3065.
Torres Durán, PV, Miranda Zamora R, Paredes Carbajal MC, Mascher D, Blé Castillo J, D´ıaz Zagoya JC, Juarez oropeza MA. Spirulina maxima prevents induction of fatty liver by carbon tetrachloride in the rat. Biochem Mol Biol Inter 1998;44:787–793.
Turner RA. Screening Methods in Pharmacology. London: Academic Press; 1965.
Upadhyay RK, Pandey MB, Jha RN, Pandey VB. Eclalbatin, a triterpine saponins from Eclipta alba. J Asian Nat Prod Res 2001;3:213–217.
Van handle, Rice EW. (1970 ) Triglycerides in serum. In standard methods in Clinical chemistry, Roderick mac Donald P (ed) New York Academic Press, 1970:p215-222.
Venkateswaran S, Pari L,Viswanathan P.Anti peroxidation effect of Livex, a herbal formulation against erythromycin estolate induced lipid peroxidation in rats. Phy the Res 1998;12:465-471.
Vermeulen NPE, Bessems JGM, Van de Straat R. Molecular aspects of paracetamol-induced hepatotoxicity and its mechanism based prevention. Drug Metab Rev 1992;24: 367-371.
Vitaglione P, Morisco F, Caporaso N, Fogliano V. Dietary antioxidant compounds and liver health Crit. Rev. Food Sci Nutr 2004;44:575-586.
Wagner WD. More sensitive assay discriminating galactosamine and glucosamine in mixture. Anal Biochem 1979;94:394-397.
Wanita A, Lorenz K. Antioxidant potential of 5-N-pentadecylresorcinol.J Food Process Preserv 1996;20:417-429.
Warren L The thiobarbituric acid assay of sialic acid. J Biol Chem 1959; 234:1971-1975.
Weissberger LH. 1940. Increase in phospholipid and total P metabolismof kidney, following the administration of NH4Cl with radioactive P as an indicator. J Biol Chem 1940; 132:219–225.
Wells FE. Tests in liver and biliary tract disease. In: Gowenlock HA. Ed. Varley’s Practical Clinical Biochemistry.Florida: CRC Press; 1988.
Wilson DE, Spiger MJ. A dual precipitation method for quantitative lipoprotein measurement without ultra centrifugation. J Lab Clin Med 1973; 72:473-483.
World Health Organization (WHO). General guidelines for methodologies on research and evaluation of traditional medicine. Switzerland, 2000.
Wybenga DR, Pileggi VJ, Dirstine PI, Giorgio D.Direct manual determination of serum total cholesterol with a single stable reagent. Clin Chem 1970;16:980-984.
Yasuda H, Izugami N, Shimadar O, Koba Yakawa Y, Nakanishi M. The protective effect of tinoride against carbontetrachloride hepatotoxicity. Toxicol Appl Pharmacol 1980;52:4207-4213.
Zakut H, Even L, Birkenfeld S. Modified Properties of Serum Cholinesterases in Primary Carcinomas Cancer 1988;61(4):727-37.
Zilversmith DP, Davis AK. Estimation of phospholipids J Lab clin med 1950;35:115-121.
Zimmerman HJ, Seef LB.Enzymes in hepatic disease. In:Goodly EI Ed.Diagnostic Enzymology. Philadelphia: Lea and Febiger;1970.
198
SUMMARY
Hepatoprotective efficacy of BHE on CCl4 intoxicated rats was
performed to propose a new insight to the pharmacological action of BHE,
which is a combined biherbal ethanolic extract made up of equal quantities of
leaves of Eclipta alba and the seeds of Piper longum. Since polyherbal
formulations are generally considered to be more effective due to the
synergistic activity than a single herbal drug,the study has been undertaken to
evaluate the protective effect of biherbal extract in comparison with its
individual plants Eclipta alba and Piper longum .
The present investigation has been divided into two parts. In one part
of the investigation the plants have been processed, screened for the
phytochemicals and tested for free radical scavenging activities by using
standard models in vitro.
The phytochemical investigation of the plants revealed the following
results
In the present investigation, preliminary phytochemical screening of
EAE, PLE and BHE showed the presence of constituents like alkaloid,
carbohydrates, phytosterol, tannins, phenol, flavonoids, glycosides, terpene,
saponins and lignin. In all these extracts proteins, gums and mucilage were
found to be absent.
The presence of phytochemicals was confirmed by HPTLC finger
printing of individual preparations of different extracts of Eclipta alba and
199
piper longum. The estimation of the macronutrients like carbohydrates,
proteins, lipids and micronutrients present in the leaves of Eclipta alba and
seeds of the piper longum showed the nutritive value of the plants.
The BHE showed a concentration dependent scavenging activities of
the free radicals such as DPPH, super oxide, hydroxyl, nitric oxide, hydrogen
peroxide and acted as an efficient chelator of ferric and ferrous ions. It was
also found to be effective in reducing the formation of protein carbonyl
groups.BHE contained considerable amount of the flavonoid and phenolic
compounds which could be accounted for the free radical scavenging
activities.
The inhibitory action of the BHE on DNA fragmentation induced by
fenton reactants in the hepatic tissue was studied. In the CCl4 intoxicated
animals the extent of DNA damage was detected by the increased mobility of
the DNA molecule due to the decrease in the molecular weight. On the other
hand the BHE at the concentration of 20µg/ml and 40µg/ml protected the
DNA from damage was evidenced by the decreased mobility of the DNA
molecule suggested that these extracts have compounds which may combat
against free radical-mediated degradation to the deoxyribose sugar moiety of
DNA.
The second part of the investigation comprises of the evaluation of
non-toxic dosage by acute and chronic toxicity on mice and albino Wistar
strain rat models according to the guidelines of OECD. After assessing the
dosage by acute and chronic toxicity studies efficacy of the single and the
200
biherbal drugs have been ascertained by using CCl4 induced hepatotoxicity
model in rats. The hepatoprotective nature of the drugs has been assessed by
various biochemical estimations and histological observations. Rats treated
with standard drug silymarin have also been utilised in this study to compare
the hepatoprotective efficacy of the test drugs.
In the acute toxicity studies death was recorded during the treatment
period in the experimental rats which received 500mg/kg body weight of
Biherbal extract orally. So from this the ED50 dose of 50 mg/kg was selected
for the hepatoprotective efficacy studies.
The three month daily oral application of BHE to rats yielded no signs
of toxicity. The dosage range and study duration applied in this study are
relevant for long-term human use.
Male albino rats were pre-treated with 50 mg/kg of BHE intubation
for 14 days and intoxicated with CCl4 on days 7 to 14. Normal rats were
maintained with the BHE to assess the drug toxicity. Standard drug silymarin
was used as positive control for comparison.
Biochemical analysis of the blood and serum revealed some important
results as follows
In the present investigation a significant reduction in the liver weight,
serum urea and bilirubin levels were seen in the BHE pre-treated animals
when compared to that of rats intoxicated with CCl4. Decreased level of blood
201
glucose in CCl4 induced rats were found to be normalized on BHE
supplementation.
The total protein and albumin levels in serum were increased in BHE
pretreated, CCl4 insulted animals showing the regeneration of hepatic cells.
This increase in the protein level are more pronounced in BHE treated
animals, when compared with the group IV and V, which received its
individual preparations EAE and PLE.
The serum levels of the liver marker enzymes like AST ALT, ALP,
ACP, γGT 5'-NT, ICD and LDH were significantly increased in CCl4
intoxicated animals. BHE treatment reverted the increased levels of these
enzymes to near normalcy, which was comparable to that of silymarin a
standard drug in the present study.
The parallel decrease in the concentration of serum lipids and
lipoproteins along with the increase of these parameters in liver tissues of
CCl4 insulted rats were normalized on BHE treatment .The increased serum
phospholipids were also brought back to normal levels.
The decrease in liver total protein and glycogen in the rats treated with
CCl4 were normalized on BHE supplementation.
The BHE was effective in reducing the levels of in vivo lipid
peroxidation products like MDA, CD, iron, nitric oxides and LOOH in the
tissues of CCl4 rats. The in vitro nonenzymatic lipid peroxidation induced by
202
the presence ascorbate, Fe2+/Fe3+ and H2O2 were also significantly reduced
by BHE treatment.
Pretreatment with BHE to CCl4 treated rats increased the activities of
SOD, CAT, GPX, GST and GR indicates the enhanced antilipid peroxidative
nature of the BHE.
Elevated levels of non-enzymic antioxidants such as vitamin C,
vitamin E, Vitamin A, thiols, uric acid, and cereloplasmin in BHE treated
animals offer protection against the oxidative injury caused by the free
radicals produced by CCl4 in the present study.
The decreased level of membrane bound enzymes such Na+/K+-
ATPase,Mg2+- ATP ase and Ca2+- ATP ase in the liver tissues of CCl4
intoxicated rats may be because of the alteration of membrane lipid
composition due to the release of free radicals. The rats which received BHE,
EAE, and PLE restored the enzyme levels to near normal levels, which could
be due to the ability of plant extracts to protect the membranes from oxidative
damage through inhibition of lipid peroxidation
The activity of gluconeogenic enzymes and glycolytic enzymes in liver
were found to be significantly decreased in CCl4 intoxicated rats. These
decreased enzymes levels were restored to normal levels in BHE pretreated
rats indicating that the BHE has got protective action on the mitochondria
from damage enabling them to secreate the enzymes and keeping the blood
glucose in normal levels.
203
A significant decrease in the levels of Glycoprotein was observed in
CCl4 treated animals due to the increased load of the toxic metabolites. The
increase in glycoprotein content of BHE treated animals suggested the
cytoprotective nature of the formulation.
The histopathological observations which showed a faster
regeneration of the hepatic cells in rats pretreated with BHE seems to suggest
the possibility of BHE being able to condition the hepatic cells towards
accelerated regeneration.
204
CONCLUSION
In conclusion, the BHE afforded protection from CCl4 induced liver
damage, significantly when compared to that of the individual preparations.
The beneficial effects of BHE were found comparable to those of silymarin.
By trapping oxygen related free radicals, the extract could hinder their
interaction with polyunsaturated fatty acids and abolish the enhancement of
lipid peroxidative processes. The effect may be due to the presence of
flavonoids and phenolic compounds which are strong antioxidants.
Antioxidant principles from herbal resources are multifaceted in their effects
and provide enormous scope in correcting the imbalance through their
consumption.Thus from the foregoing findins,it was observed that BHE
exhibited protective effect against CCl4 induced liver damage, which may be
due to its antilipid peroxidative and free radical scavenging activities.It has
promising therapeutic application in future to combat the liver related
problems associated with free radical formation.
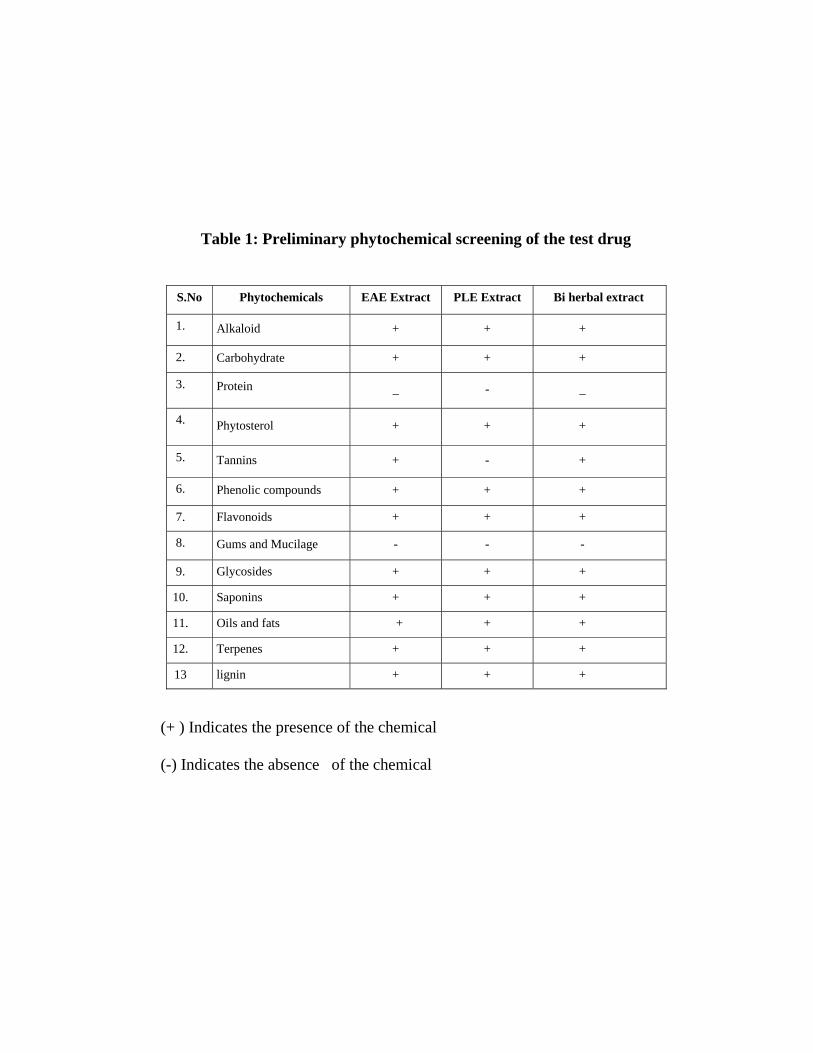
Table 1: Preliminary phytochemical screening of the test drug
S.No Phytochemicals EAE Extract PLE Extract Bi herbal extract
1. Alkaloid + + +
2. Carbohydrate + + +
3. Protein
_ - _
4. Phytosterol + + +
5. Tannins + - +
6. Phenolic compounds + + +
7. Flavonoids + + +
8. Gums and Mucilage - - -
9. Glycosides + + +
10. Saponins + + +
11. Oils and fats + + +
12. Terpenes + + +
13 lignin + + +
(+ ) Indicates the presence of the chemical
(-) Indicates the absence of the chemical
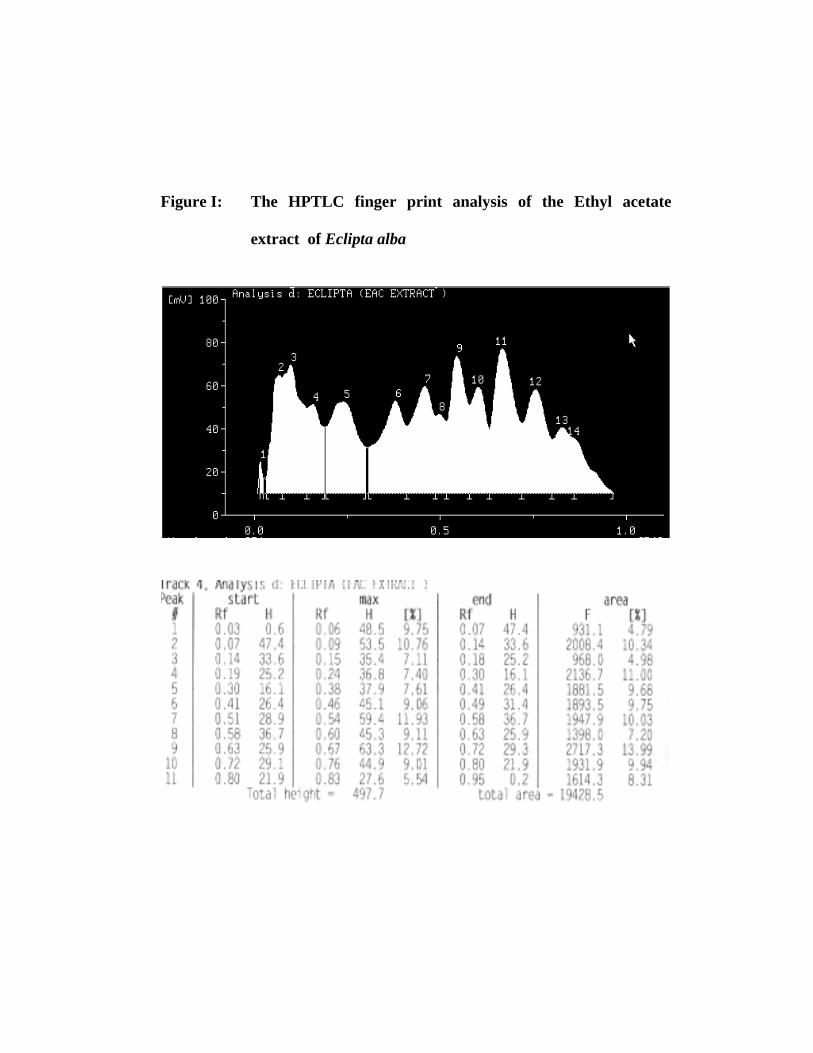
Figure I: The HPTLC finger print analysis of the Ethyl acetate
extract of Eclipta alba
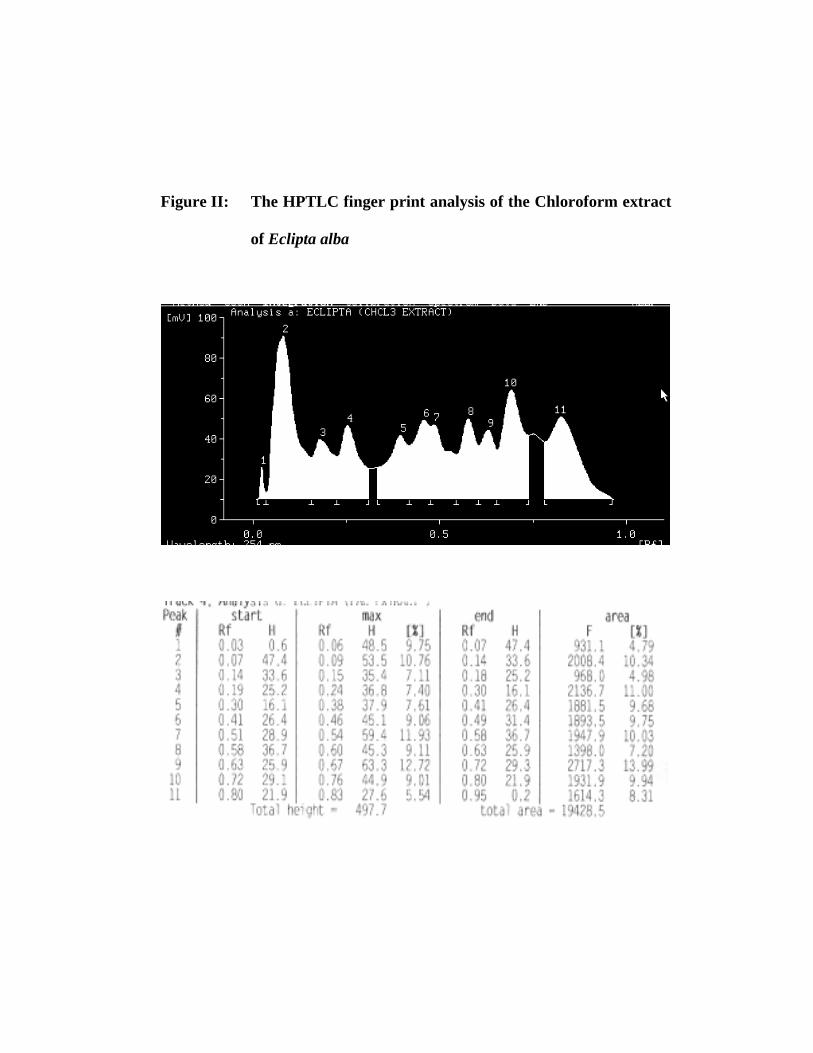
Figure II: The HPTLC finger print analysis of the Chloroform extract
of Eclipta alba
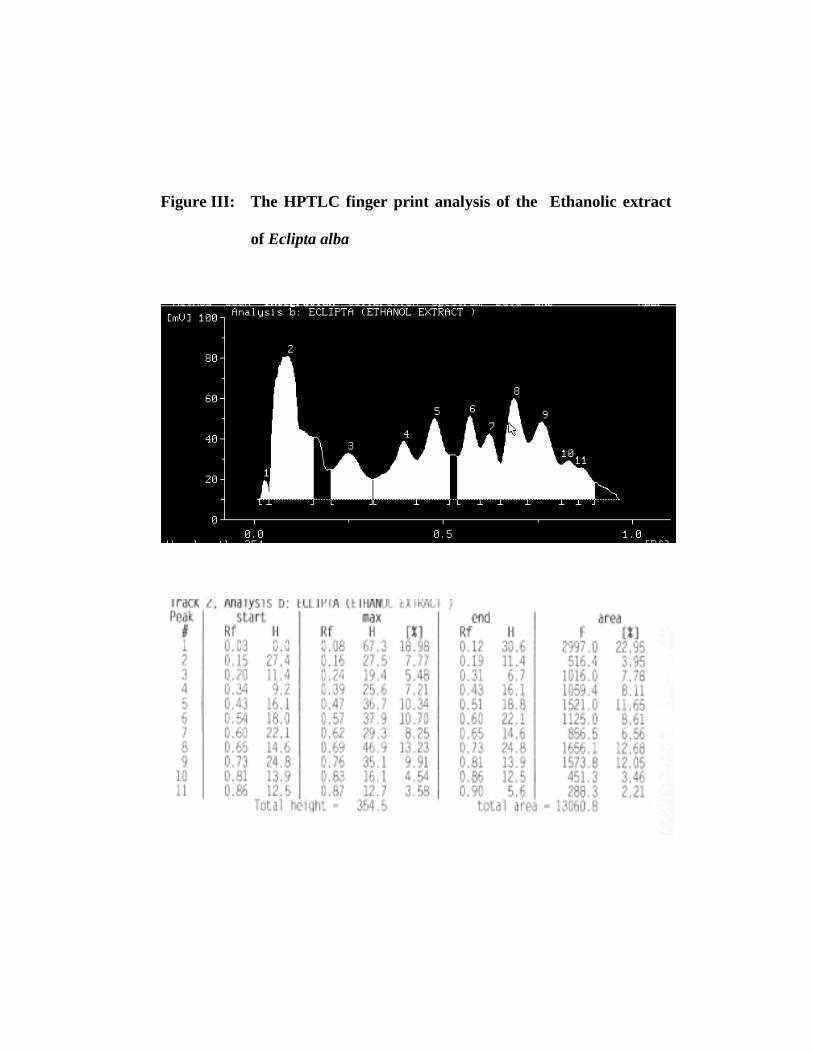
Figure III: The HPTLC finger print analysis of the Ethanolic extract
of Eclipta alba
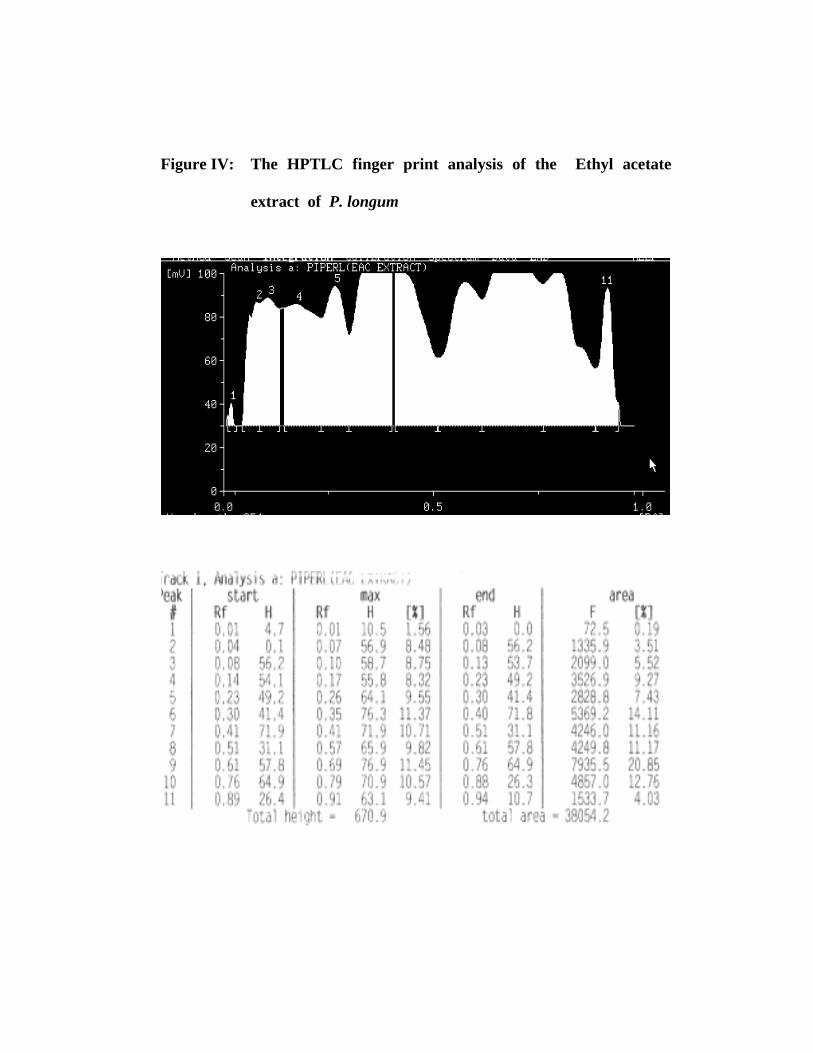
Figure IV: The HPTLC finger print analysis of the Ethyl acetate
extract of P. longum

Figure V : The HPTLC finger print analysis of the Chloroform
extract of P. longum
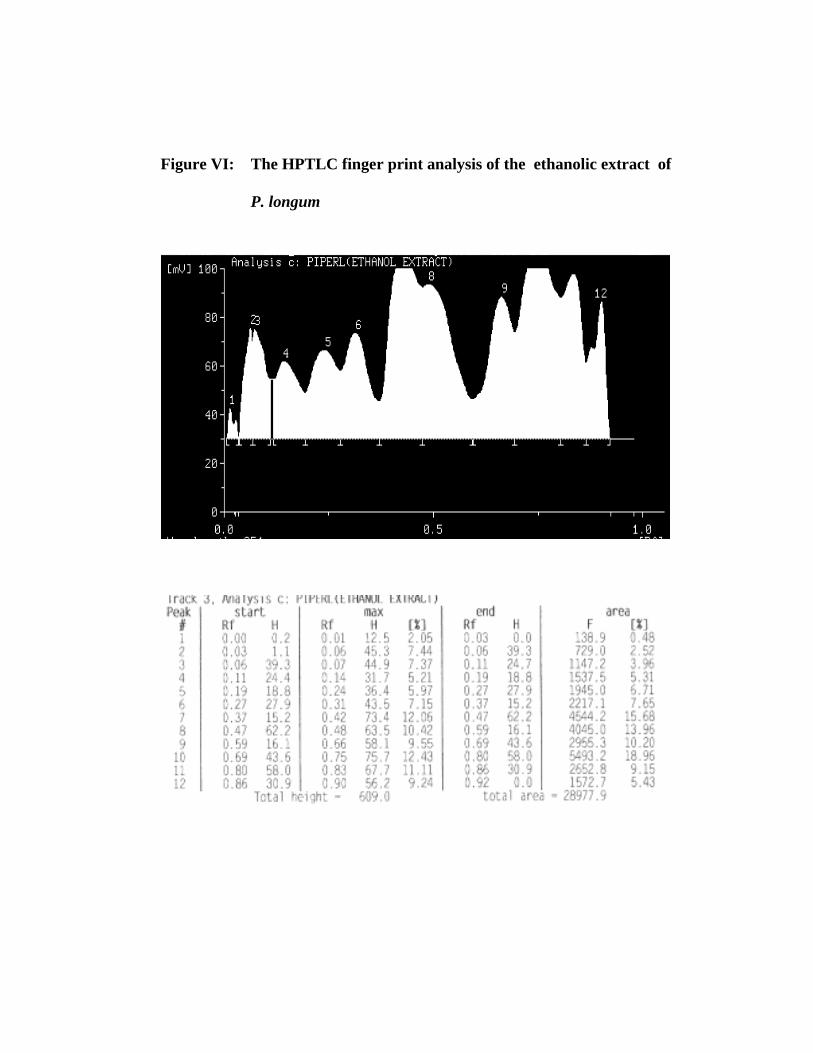
Figure VI: The HPTLC finger print analysis of the ethanolic extract of
P. longum
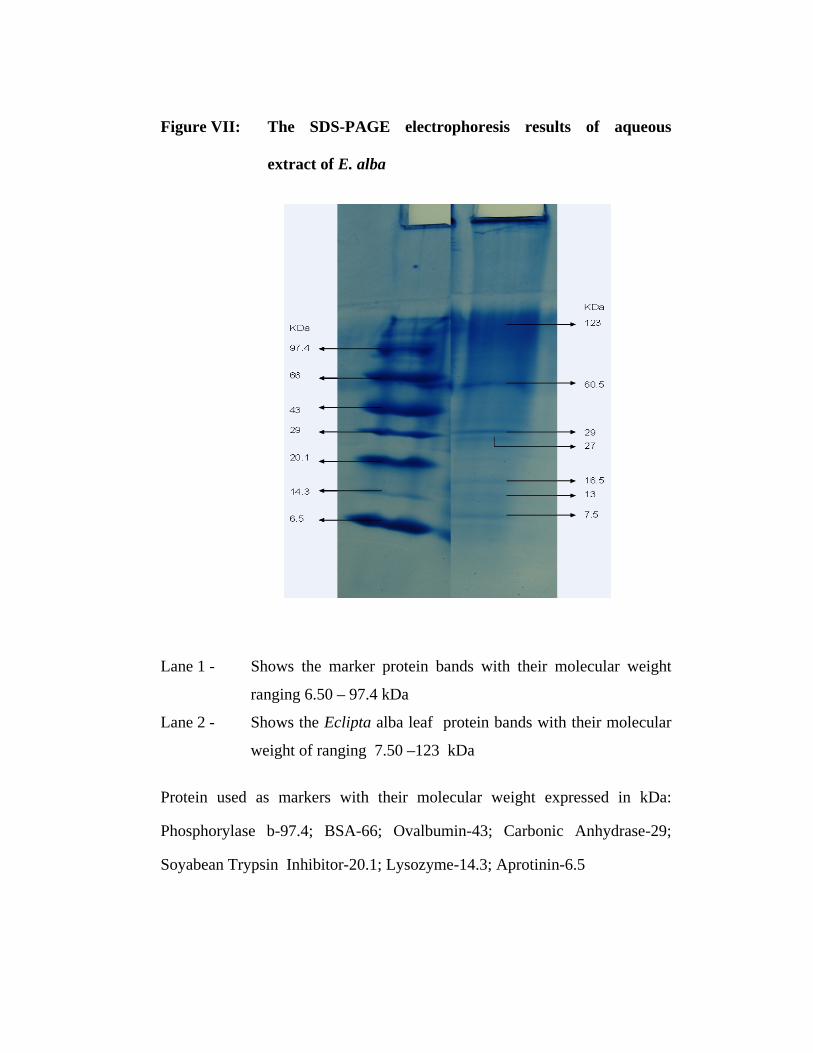
Figure VII: The SDS-PAGE electrophoresis results of aqueous
extract of E. alba
Lane 1 - Shows the marker protein bands with their molecular weight
ranging 6.50 – 97.4 kDa
Lane 2 - Shows the Eclipta alba leaf protein bands with their molecular
weight of ranging 7.50 –123 kDa
Protein used as markers with their molecular weight expressed in kDa:
Phosphorylase b-97.4; BSA-66; Ovalbumin-43; Carbonic Anhydrase-29;
Soyabean Trypsin Inhibitor-20.1; Lysozyme-14.3; Aprotinin-6.5

Table II: Concentration of Macronutrients
S.NO Macronutrients
Leaves of Eclipta
alba
(Expressed in
mgs/100gms)
Seeds of Piper longum
(Expressed in
mgs/100gms)
1. Total sugars 27.78 15.56
2. Total protein 26.23 8.80
3. Total lipid 24.94 3.89
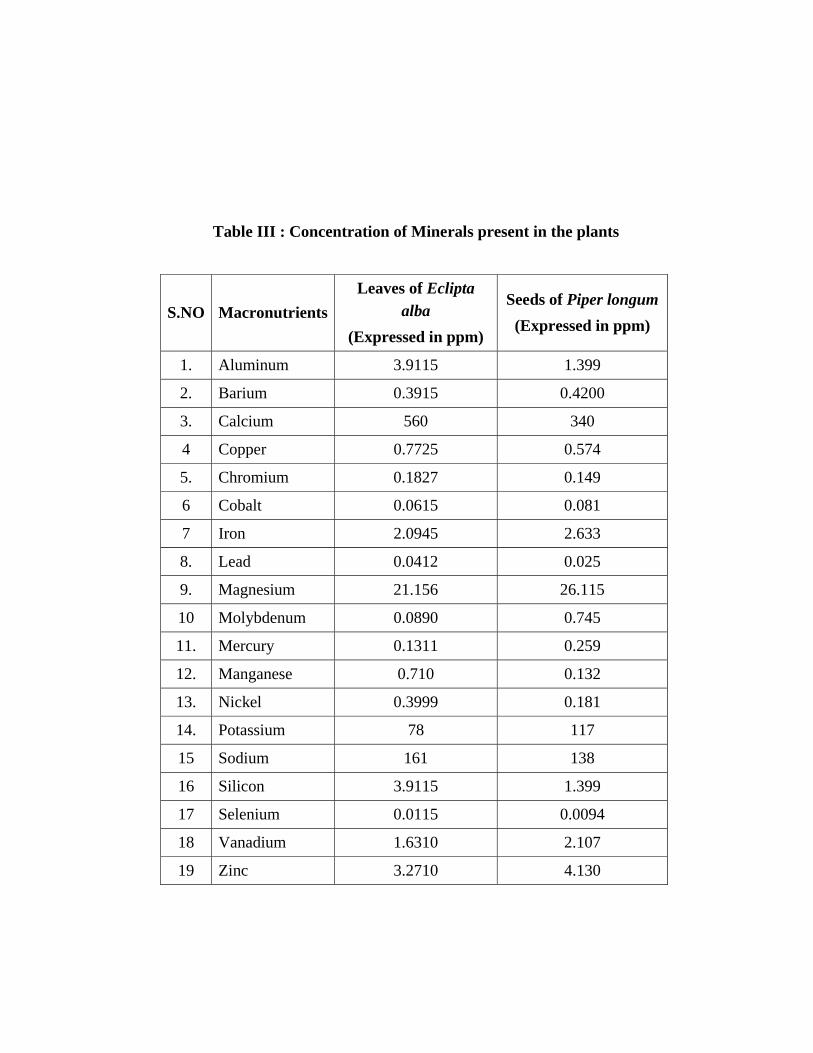
Table III : Concentration of Minerals present in the plants
S.NO MacronutrientsLeaves of Eclipta
alba (Expressed in ppm)
Seeds of Piper longum(Expressed in ppm)
1. Aluminum 3.9115 1.399
2. Barium 0.3915 0.4200
3. Calcium 560 340
4 Copper 0.7725 0.574
5. Chromium 0.1827 0.149
6 Cobalt 0.0615 0.081
7 Iron 2.0945 2.633
8. Lead 0.0412 0.025
9. Magnesium 21.156 26.115
10 Molybdenum 0.0890 0.745
11. Mercury 0.1311 0.259
12. Manganese 0.710 0.132
13. Nickel 0.3999 0.181
14. Potassium 78 117
15 Sodium 161 138
16 Silicon 3.9115 1.399
17 Selenium 0.0115 0.0094
18 Vanadium 1.6310 2.107
19 Zinc 3.2710 4.130
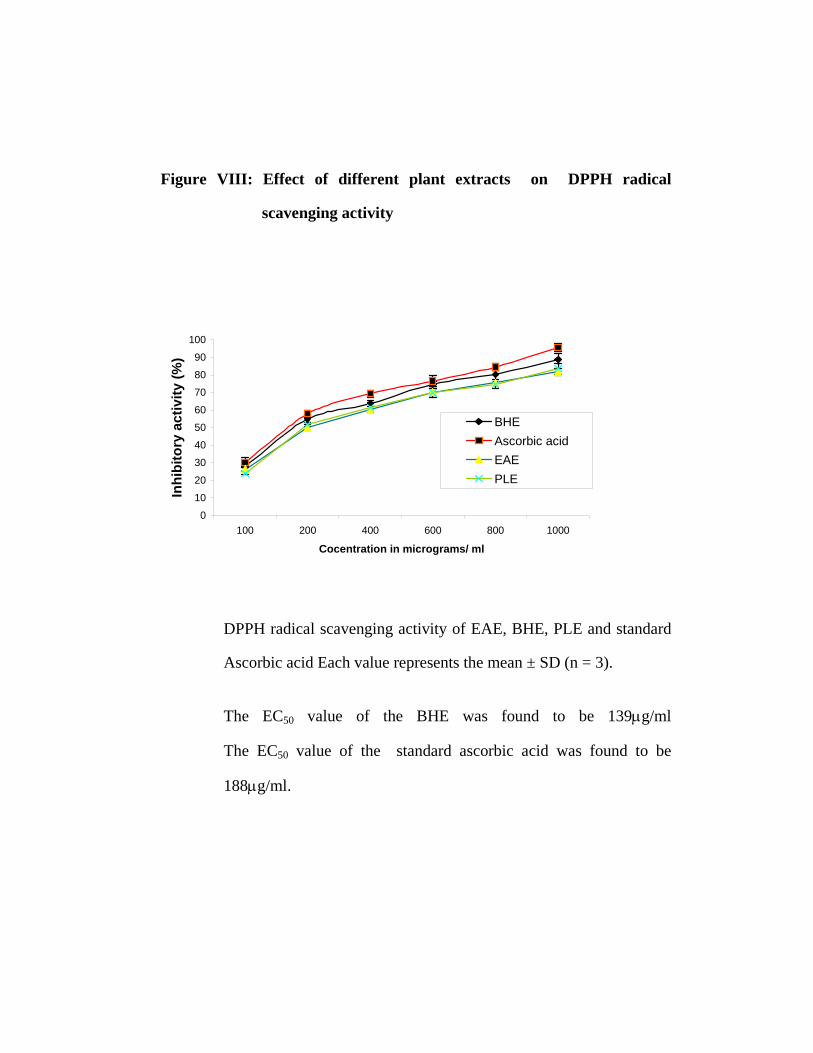
Figure VIII: Effect of different plant extracts on DPPH radical
scavenging activity
0
10
20
30
40
50
60
70
80
90
100
100 200 400 600 800 1000
Cocentration in micrograms/ ml
Inhi
bito
ry a
ctiv
ity (%
)
BHEAscorbic acidEAEPLE
DPPH radical scavenging activity of EAE, BHE, PLE and standard
Ascorbic acid Each value represents the mean ± SD (n = 3).
The EC50 value of the BHE was found to be 139µg/ml
The EC50 value of the standard ascorbic acid was found to be
188µg/ml.
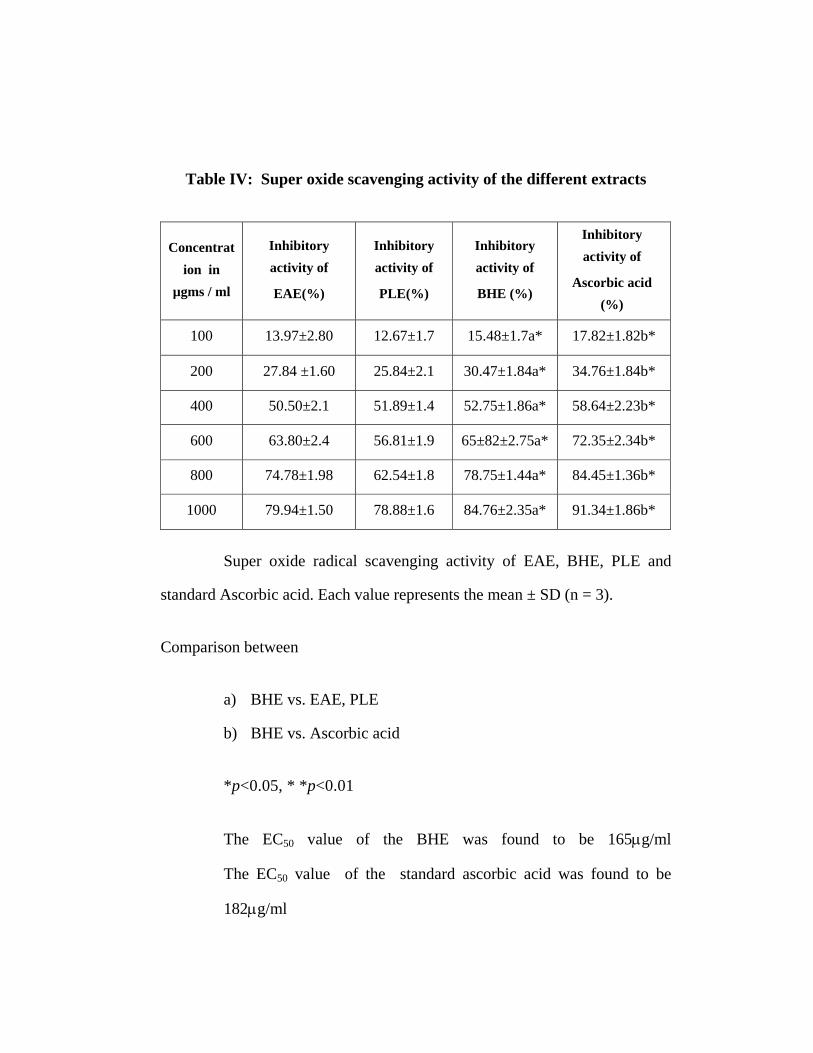
Table IV: Super oxide scavenging activity of the different extracts
Concentration in
µgms / ml
Inhibitory activity of
EAE(%)
Inhibitory activity of
PLE(%)
Inhibitory activity of
BHE (%)
Inhibitory activity of
Ascorbic acid (%)
100 13.97±2.80 12.67±1.7 15.48±1.7a* 17.82±1.82b*
200 27.84 ±1.60 25.84±2.1 30.47±1.84a* 34.76±1.84b*
400 50.50±2.1 51.89±1.4 52.75±1.86a* 58.64±2.23b*
600 63.80±2.4 56.81±1.9 65±82±2.75a* 72.35±2.34b*
800 74.78±1.98 62.54±1.8 78.75±1.44a* 84.45±1.36b*
1000 79.94±1.50 78.88±1.6 84.76±2.35a* 91.34±1.86b* [
Super oxide radical scavenging activity of EAE, BHE, PLE and
standard Ascorbic acid. Each value represents the mean ± SD (n = 3).
Comparison between
a) BHE vs. EAE, PLE
b) BHE vs. Ascorbic acid
*p<0.05, * *p<0.01
The EC50 value of the BHE was found to be 165µg/ml
The EC50 value of the standard ascorbic acid was found to be
182µg/ml
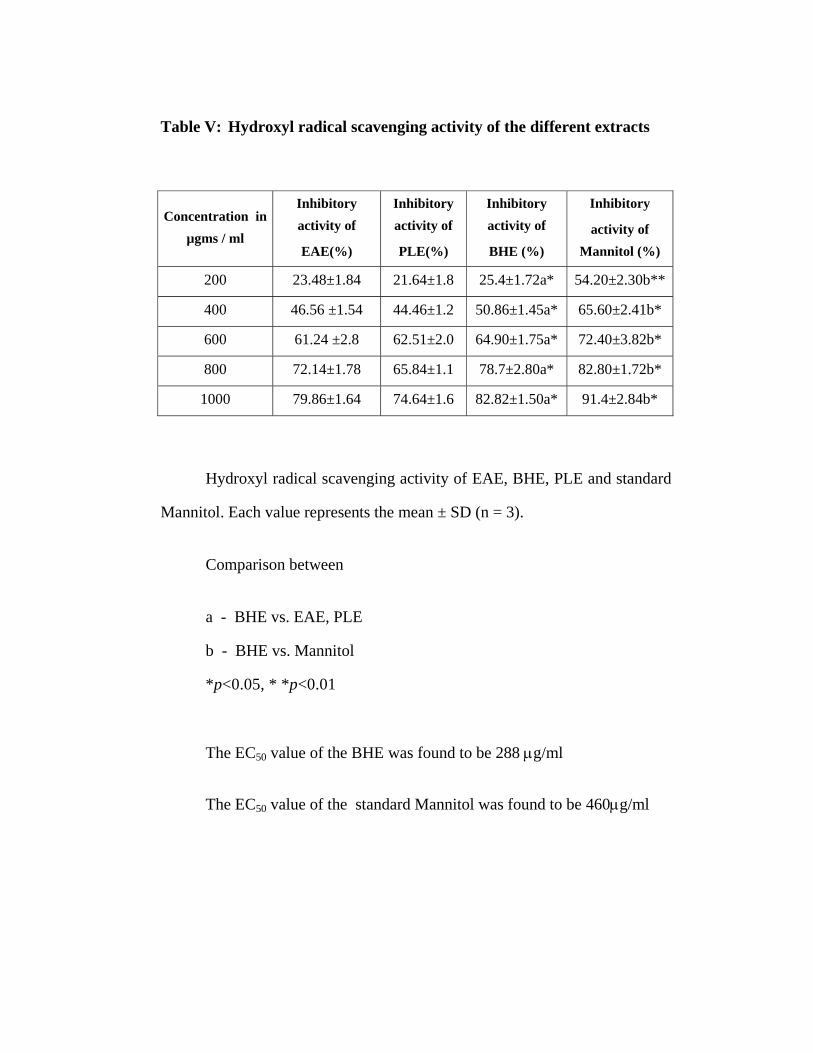
Table V: Hydroxyl radical scavenging activity of the different extracts
Concentration in µgms / ml
Inhibitory activity of
EAE(%)
Inhibitory activity of
PLE(%)
Inhibitory activity of
BHE (%)
Inhibitory
activity of Mannitol (%)
200 23.48±1.84 21.64±1.8 25.4±1.72a* 54.20±2.30b**
400 46.56 ±1.54 44.46±1.2 50.86±1.45a* 65.60±2.41b*
600 61.24 ±2.8 62.51±2.0 64.90±1.75a* 72.40±3.82b*
800 72.14±1.78 65.84±1.1 78.7±2.80a* 82.80±1.72b*
1000 79.86±1.64 74.64±1.6 82.82±1.50a* 91.4±2.84b*
Hydroxyl radical scavenging activity of EAE, BHE, PLE and standard
Mannitol. Each value represents the mean ± SD (n = 3).
Comparison between
a - BHE vs. EAE, PLE
b - BHE vs. Mannitol
*p<0.05, * *p<0.01
The EC50 value of the BHE was found to be 288 µg/ml
The EC50 value of the standard Mannitol was found to be 460µg/ml
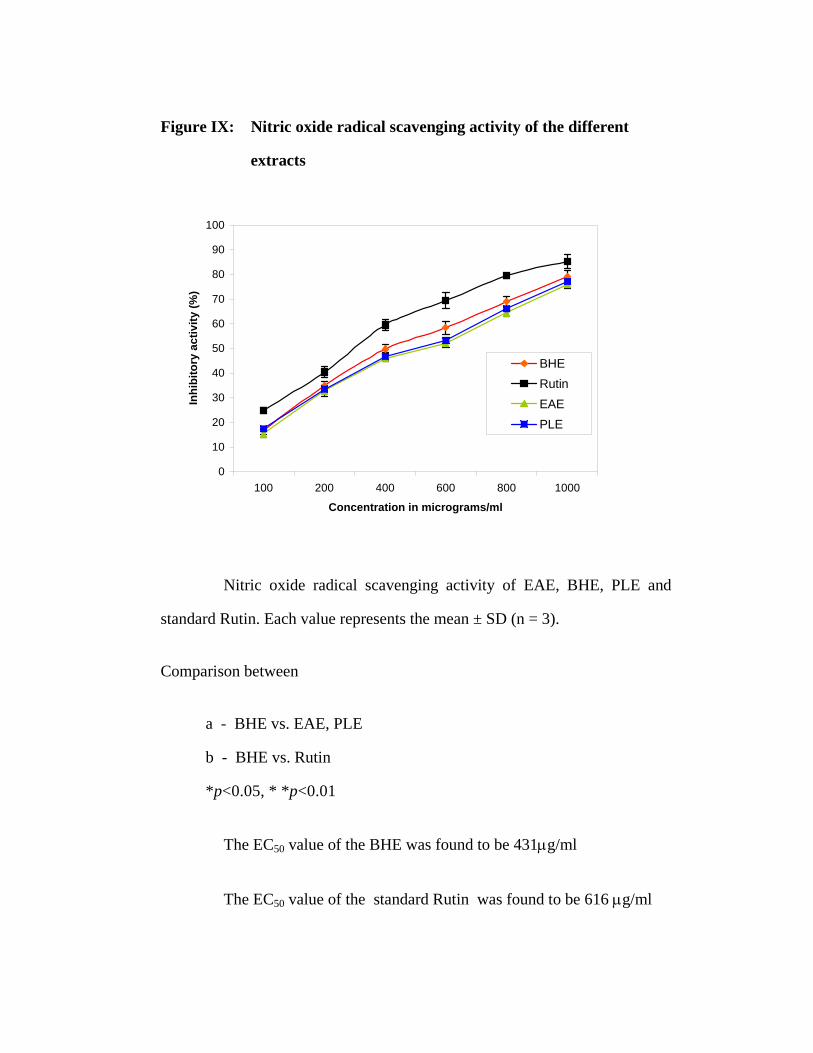
Figure IX: Nitric oxide radical scavenging activity of the different
extracts
0
10
20
30
40
50
60
70
80
90
100
100 200 400 600 800 1000
Concentration in micrograms/ml
Inhi
bito
ry a
ctiv
ity (%
)
BHERutinEAEPLE
Nitric oxide radical scavenging activity of EAE, BHE, PLE and
standard Rutin. Each value represents the mean ± SD (n = 3).
Comparison between
a - BHE vs. EAE, PLE
b - BHE vs. Rutin
*p<0.05, * *p<0.01
The EC50 value of the BHE was found to be 431µg/ml
The EC50 value of the standard Rutin was found to be 616 µg/ml
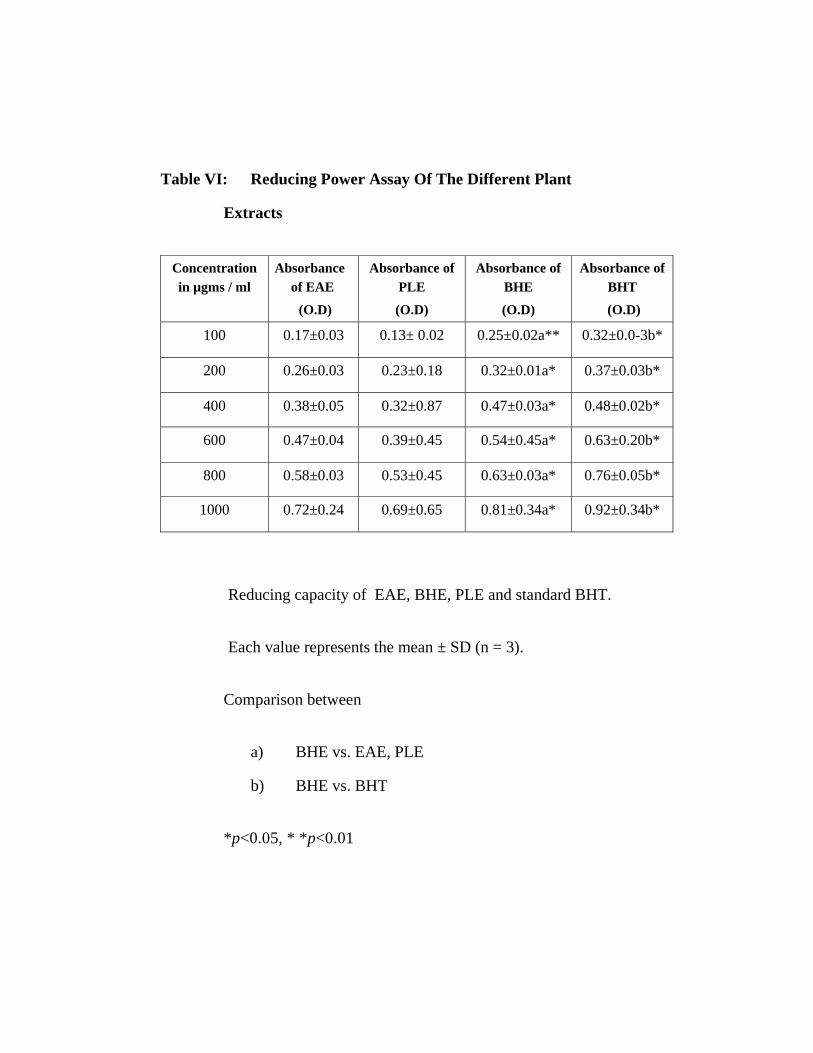
Table VI: Reducing Power Assay Of The Different Plant
Extracts
Concentration in µgms / ml
Absorbance of EAE
(O.D)
Absorbance of PLE
(O.D)
Absorbance of BHE
(O.D)
Absorbance of BHT
(O.D)
100 0.17±0.03 0.13± 0.02 0.25±0.02a** 0.32±0.0-3b*
200 0.26±0.03 0.23±0.18 0.32±0.01a* 0.37±0.03b*
400 0.38±0.05 0.32±0.87 0.47±0.03a* 0.48±0.02b*
600 0.47±0.04 0.39±0.45 0.54±0.45a* 0.63±0.20b*
800 0.58±0.03 0.53±0.45 0.63±0.03a* 0.76±0.05b*
1000 0.72±0.24 0.69±0.65 0.81±0.34a* 0.92±0.34b*
Reducing capacity of EAE, BHE, PLE and standard BHT.
Each value represents the mean ± SD (n = 3).
Comparison between
a) BHE vs. EAE, PLE
b) BHE vs. BHT
*p<0.05, * *p<0.01
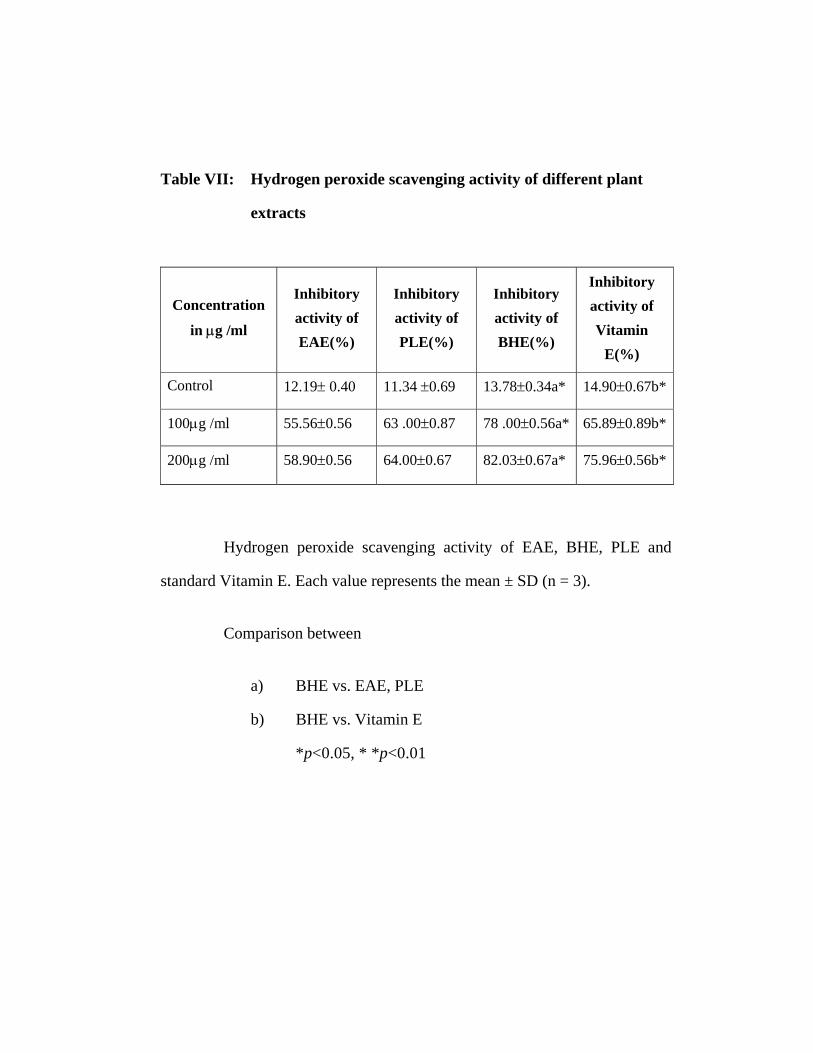
Table VII: Hydrogen peroxide scavenging activity of different plant
extracts
Concentration
in µg /ml
Inhibitory activity of EAE(%)
Inhibitory activity of PLE(%)
Inhibitory activity of BHE(%)
Inhibitory activity of Vitamin
E(%)
Control 12.19± 0.40 11.34 ±0.69 13.78±0.34a* 14.90±0.67b*
100µg /ml 55.56±0.56 63 .00±0.87 78 .00±0.56a* 65.89±0.89b*
200µg /ml 58.90±0.56 64.00±0.67 82.03±0.67a* 75.96±0.56b*
Hydrogen peroxide scavenging activity of EAE, BHE, PLE and
standard Vitamin E. Each value represents the mean ± SD (n = 3).
Comparison between
a) BHE vs. EAE, PLE
b) BHE vs. Vitamin E
*p<0.05, * *p<0.01
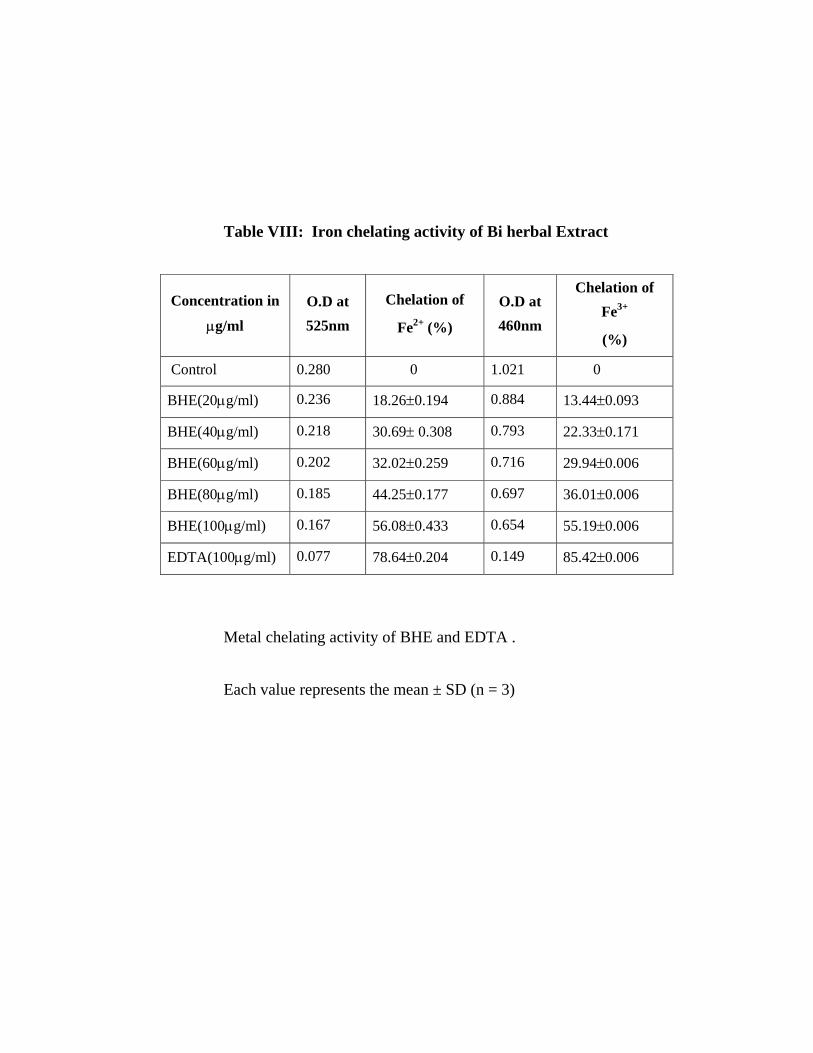
Table VIII: Iron chelating activity of Bi herbal Extract
Concentration in
µg/ml O.D at 525nm
Chelation of
Fe2+ (%)
O.D at 460nm
Chelation of Fe3+
(%)
Control 0.280 0 1.021 0
BHE(20µg/ml) 0.236 18.26±0.194 0.884 13.44±0.093
BHE(40µg/ml) 0.218 30.69± 0.308 0.793 22.33±0.171
BHE(60µg/ml) 0.202 32.02±0.259 0.716 29.94±0.006
BHE(80µg/ml) 0.185 44.25±0.177 0.697 36.01±0.006
BHE(100µg/ml) 0.167 56.08±0.433 0.654 55.19±0.006
EDTA(100µg/ml) 0.077 78.64±0.204 0.149 85.42±0.006
Metal chelating activity of BHE and EDTA .
Each value represents the mean ± SD (n = 3)
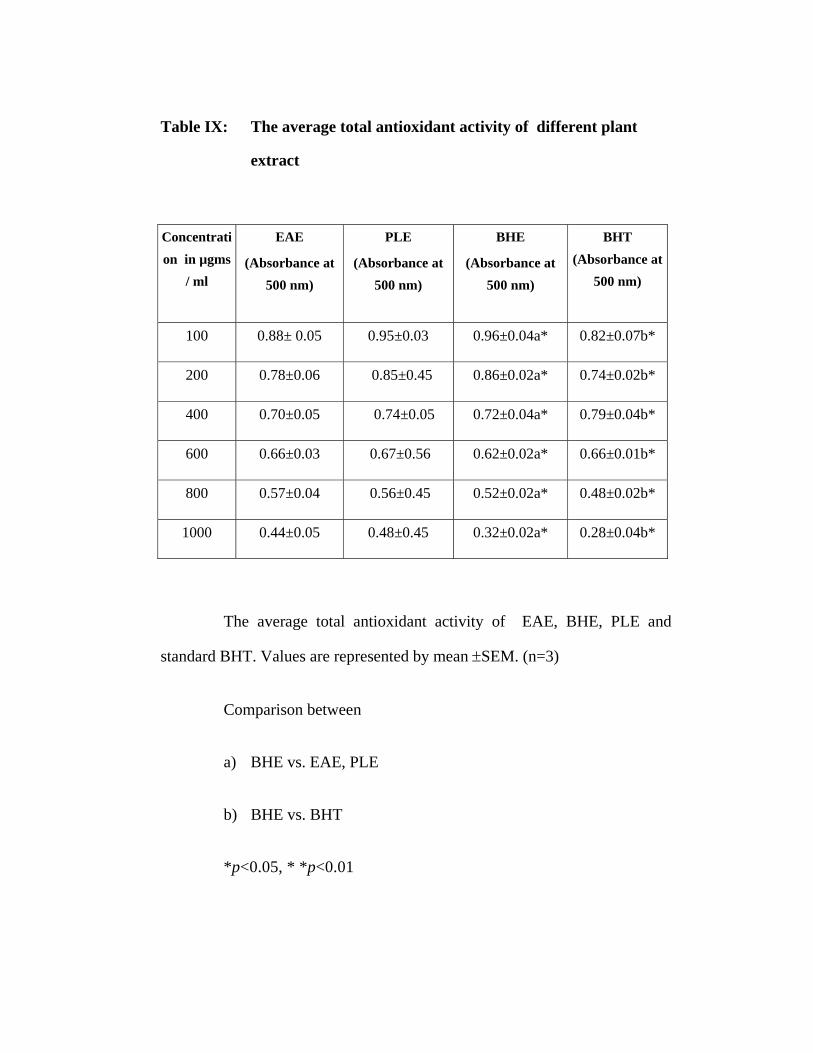
Table IX: The average total antioxidant activity of different plant
extract
Concentration in µgms
/ ml
EAE
(Absorbance at 500 nm)
PLE
(Absorbance at 500 nm)
BHE
(Absorbance at 500 nm)
BHT (Absorbance at
500 nm)
100 0.88± 0.05 0.95±0.03 0.96±0.04a* 0.82±0.07b*
200 0.78±0.06 0.85±0.45 0.86±0.02a* 0.74±0.02b*
400 0.70±0.05 0.74±0.05 0.72±0.04a* 0.79±0.04b*
600 0.66±0.03 0.67±0.56 0.62±0.02a* 0.66±0.01b*
800 0.57±0.04 0.56±0.45 0.52±0.02a* 0.48±0.02b*
1000 0.44±0.05 0.48±0.45 0.32±0.02a* 0.28±0.04b*
The average total antioxidant activity of EAE, BHE, PLE and
standard BHT. Values are represented by mean ±SEM. (n=3)
Comparison between
a) BHE vs. EAE, PLE
b) BHE vs. BHT
*p<0.05, * *p<0.01
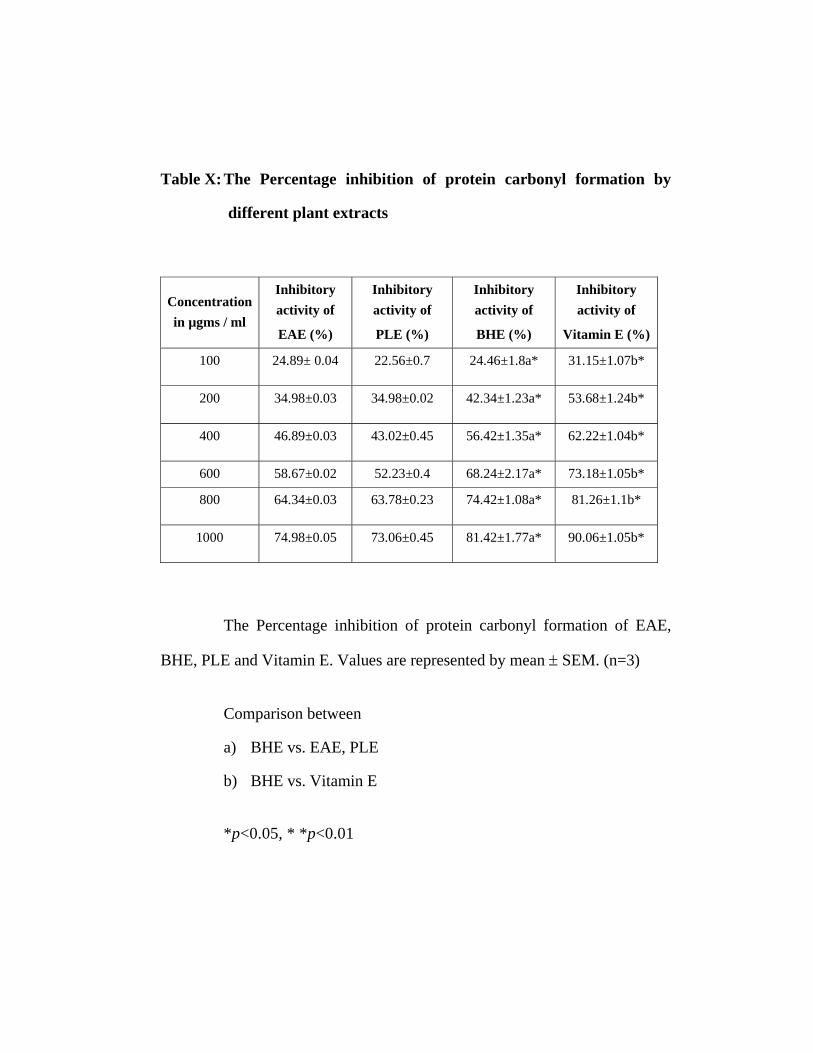
Table X: The Percentage inhibition of protein carbonyl formation by
different plant extracts
Concentration in µgms / ml
Inhibitory activity of
EAE (%)
Inhibitory activity of
PLE (%)
Inhibitory activity of
BHE (%)
Inhibitory activity of
Vitamin E (%)
100 24.89± 0.04 22.56±0.7 24.46±1.8a* 31.15±1.07b*
200 34.98±0.03 34.98±0.02 42.34±1.23a* 53.68±1.24b*
400 46.89±0.03 43.02±0.45 56.42±1.35a* 62.22±1.04b*
600 58.67±0.02 52.23±0.4 68.24±2.17a* 73.18±1.05b*
800 64.34±0.03 63.78±0.23 74.42±1.08a* 81.26±1.1b*
1000 74.98±0.05 73.06±0.45 81.42±1.77a* 90.06±1.05b*
The Percentage inhibition of protein carbonyl formation of EAE,
BHE, PLE and Vitamin E. Values are represented by mean ± SEM. (n=3)
Comparison between
a) BHE vs. EAE, PLE
b) BHE vs. Vitamin E
*p<0.05, * *p<0.01
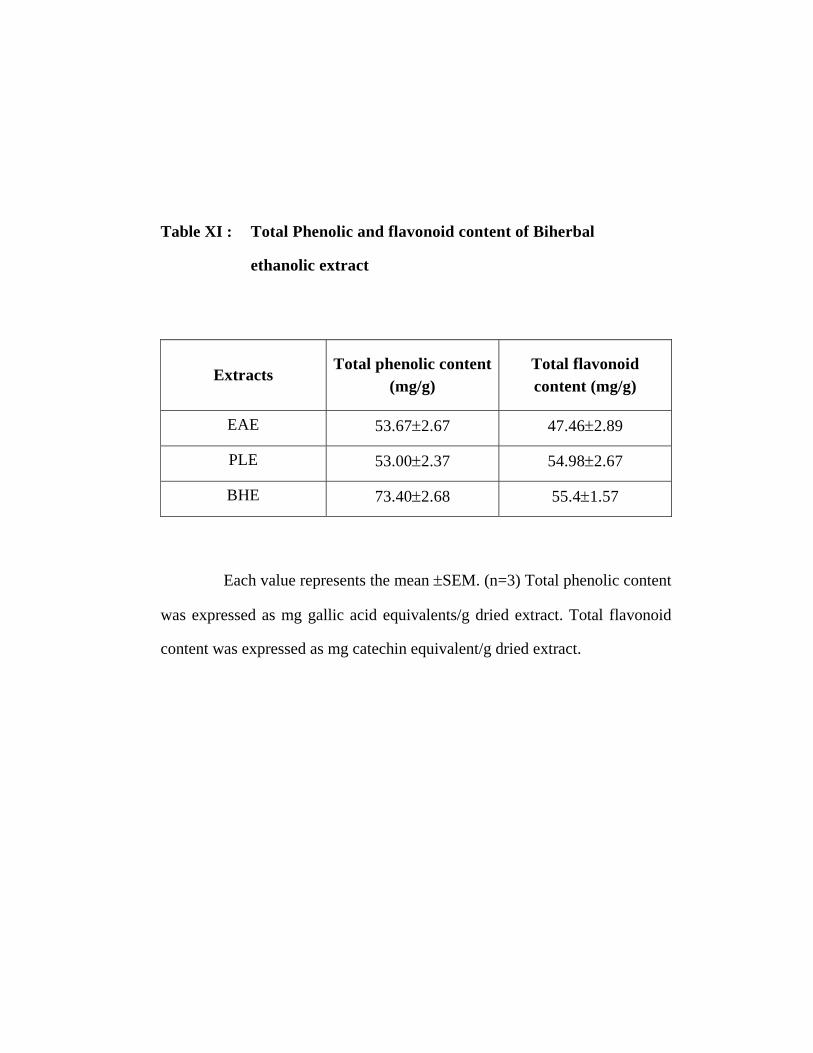
Table XI : Total Phenolic and flavonoid content of Biherbal
ethanolic extract
Extracts Total phenolic content
(mg/g) Total flavonoid content (mg/g)
EAE 53.67±2.67 47.46±2.89
PLE 53.00±2.37 54.98±2.67
BHE 73.40±2.68 55.4±1.57
Each value represents the mean ±SEM. (n=3) Total phenolic content
was expressed as mg gallic acid equivalents/g dried extract. Total flavonoid
content was expressed as mg catechin equivalent/g dried extract.
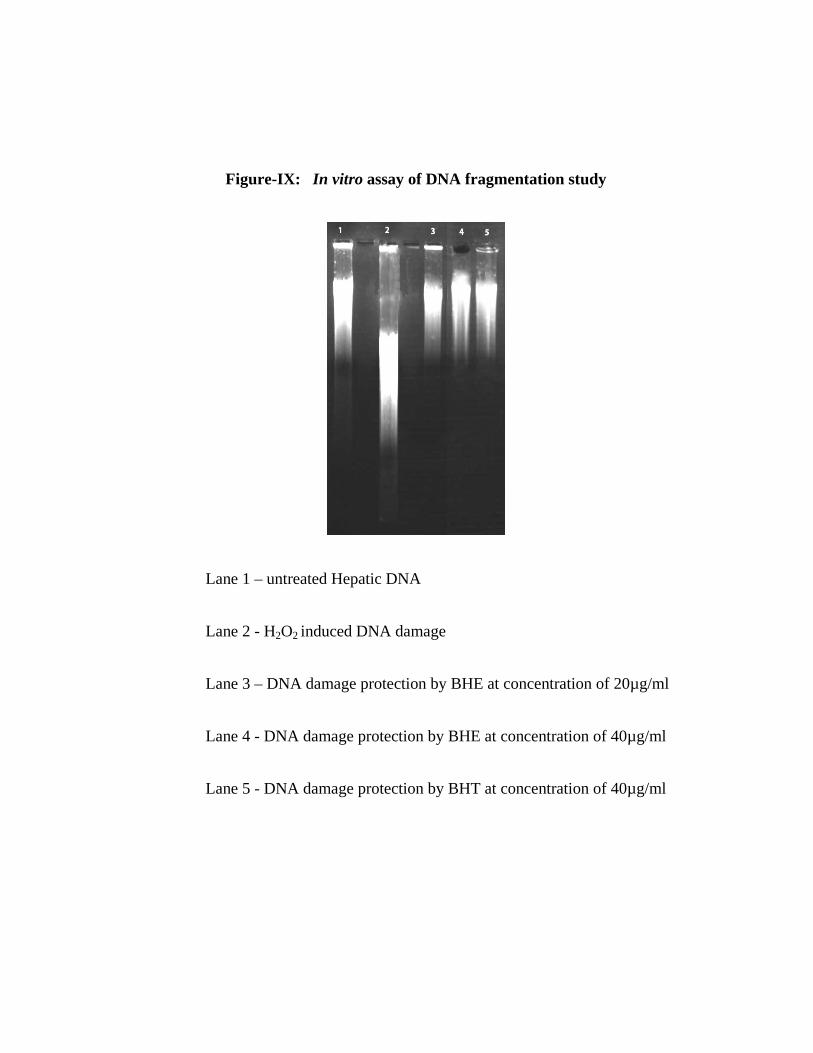
Figure-IX: In vitro assay of DNA fragmentation study
Lane 1 – untreated Hepatic DNA
Lane 2 - H2O2 induced DNA damage
Lane 3 – DNA damage protection by BHE at concentration of 20µg/ml
Lane 4 - DNA damage protection by BHE at concentration of 40µg/ml
Lane 5 - DNA damage protection by BHT at concentration of 40µg/ml
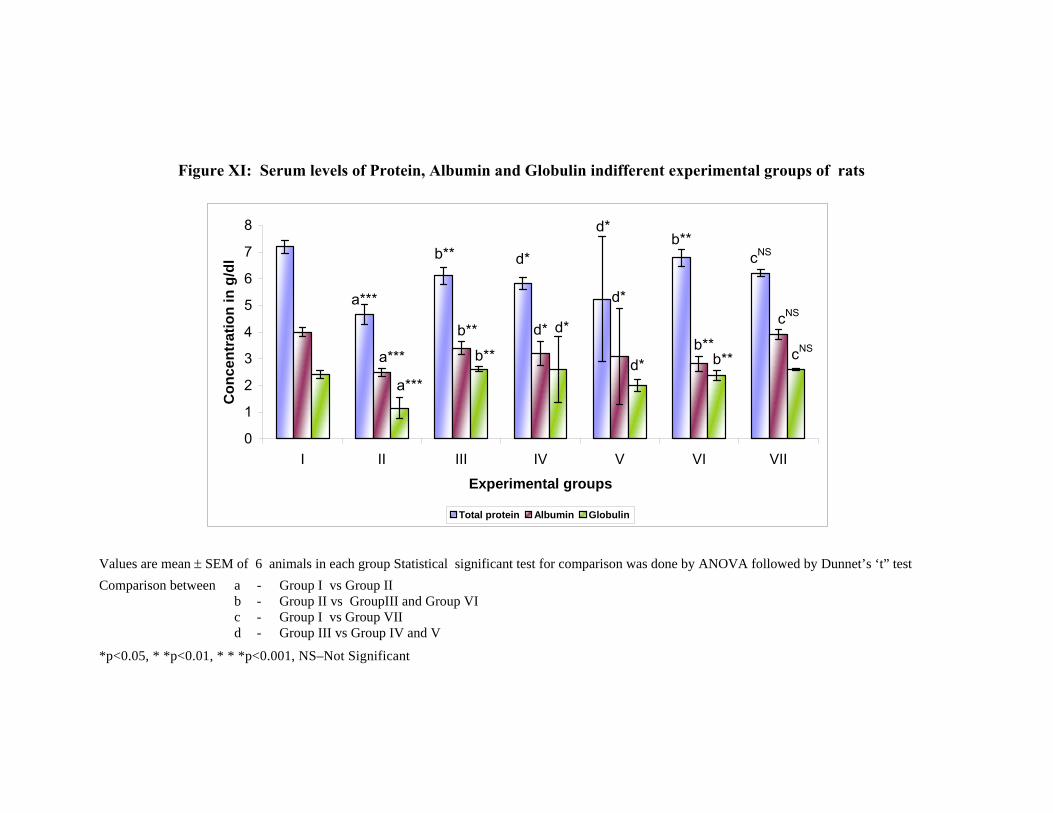
Figure XI: Serum levels of Protein, Albumin and Globulin indifferent experimental groups of rats
cNSb**
d*
d*b**
a***cNS
b**
d*
d*b**
a*** cNSb**d*
d*
b**
a***
0
1
2
3
4
5
6
7
8
I II III IV V VI VII
Experimental groups
Con
cent
ratio
n in
g/d
l
Total protein Albumin Globulin
Values are mean ± SEM of 6 animals in each group Statistical significant test for comparison was done by ANOVA followed by Dunnet’s ‘t” test
Comparison between a - Group I vs Group II b - Group II vs GroupIII and Group VI c - Group I vs Group VII d - Group III vs Group IV and V
*p<0.05, * *p<0.01, * * *p<0.001, NS–Not Significant
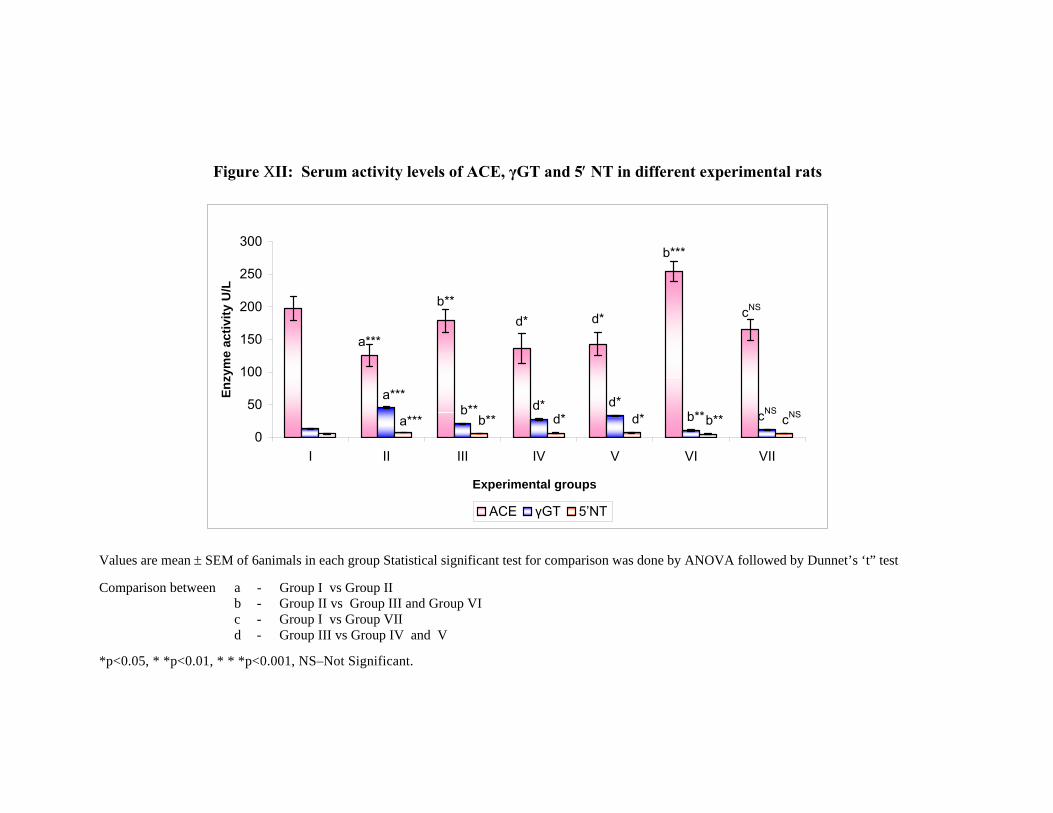
Figure XII: Serum activity levels of ACE, γGT and 5′ NT in different experimental rats
cNS
b***
d*d*b**
a***
cNSb**d*d*b**
a***
cNSb**d*d*b**a***0
50
100
150
200
250
300
I II III IV V VI VII
Experimental groups
Enzy
me
activ
ity U
/L
ACE γGT 5’NT
Values are mean ± SEM of 6animals in each group Statistical significant test for comparison was done by ANOVA followed by Dunnet’s ‘t” test Comparison between a - Group I vs Group II
b - Group II vs Group III and Group VI c - Group I vs Group VII d - Group III vs Group IV and V
*p<0.05, * *p<0.01, * * *p<0.001, NS–Not Significant.
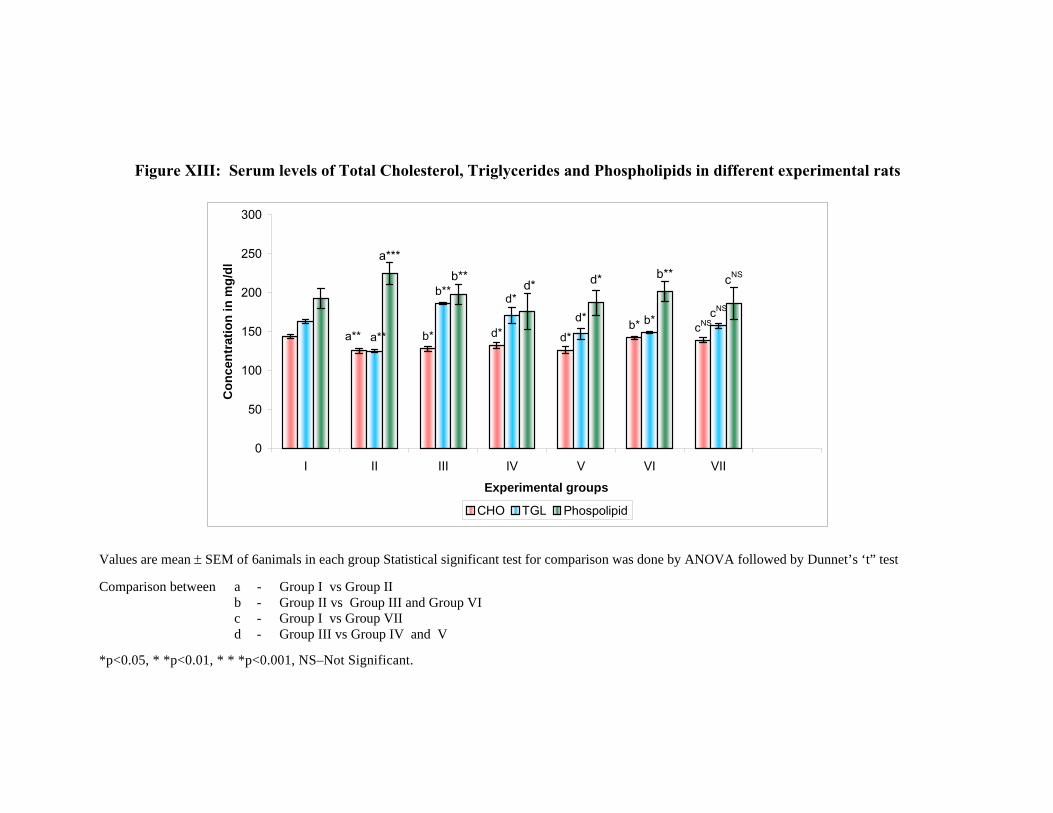
Figure XIII: Serum levels of Total Cholesterol, Triglycerides and Phospholipids in different experimental rats
cNSb*d*d*b*a**
cNSb*d*
d*b**
a**
cNSb**d*d*b**
a***
0
50
100
150
200
250
300
I II III IV V VI VII
Experimental groups
Con
cent
ratio
n in
mg/
dl
CHO TGL Phospolipid
Values are mean ± SEM of 6animals in each group Statistical significant test for comparison was done by ANOVA followed by Dunnet’s ‘t” test Comparison between a - Group I vs Group II
b - Group II vs Group III and Group VI c - Group I vs Group VII d - Group III vs Group IV and V
*p<0.05, * *p<0.01, * * *p<0.001, NS–Not Significant.
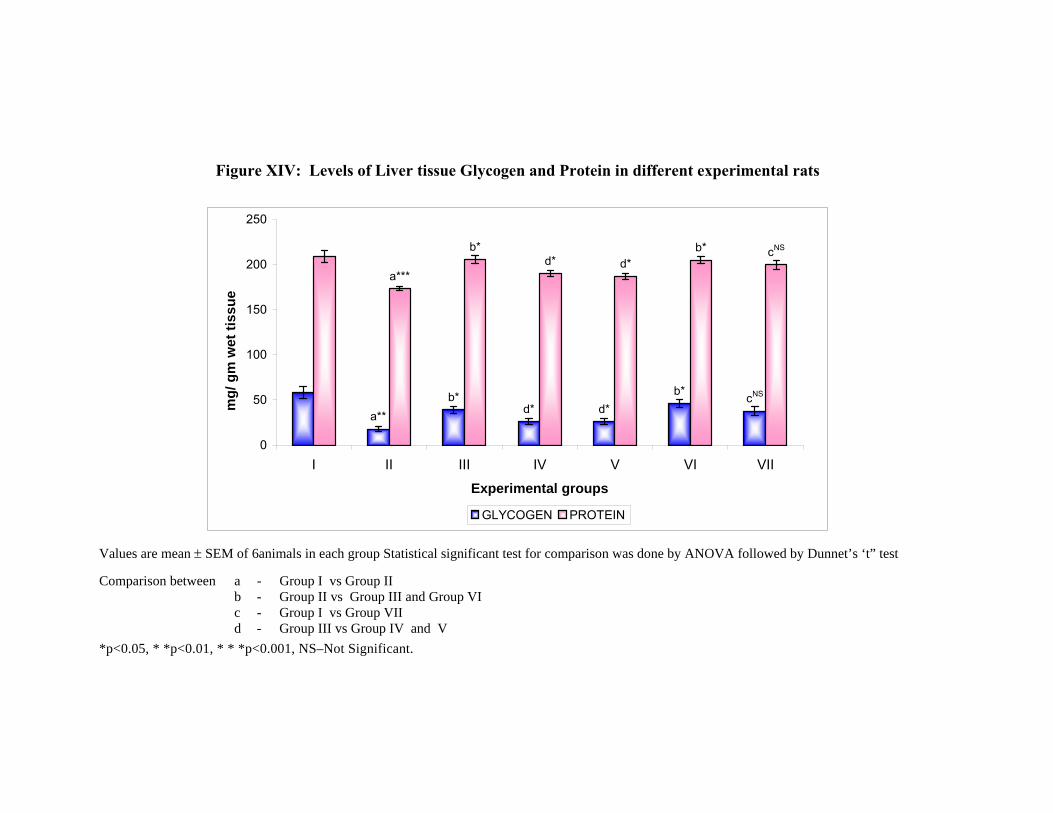
Figure XIV: Levels of Liver tissue Glycogen and Protein in different experimental rats
cNSb*d*d*
b*a**
cNSb*d*d*
b*
a***
0
50
100
150
200
250
I II III IV V VI VII
Experimental groups
mg/
gm
wet
tiss
ue
GLYCOGEN PROTEIN
Values are mean ± SEM of 6animals in each group Statistical significant test for comparison was done by ANOVA followed by Dunnet’s ‘t” test Comparison between a - Group I vs Group II
b - Group II vs Group III and Group VI c - Group I vs Group VII d - Group III vs Group IV and V
*p<0.05, * *p<0.01, * * *p<0.001, NS–Not Significant.
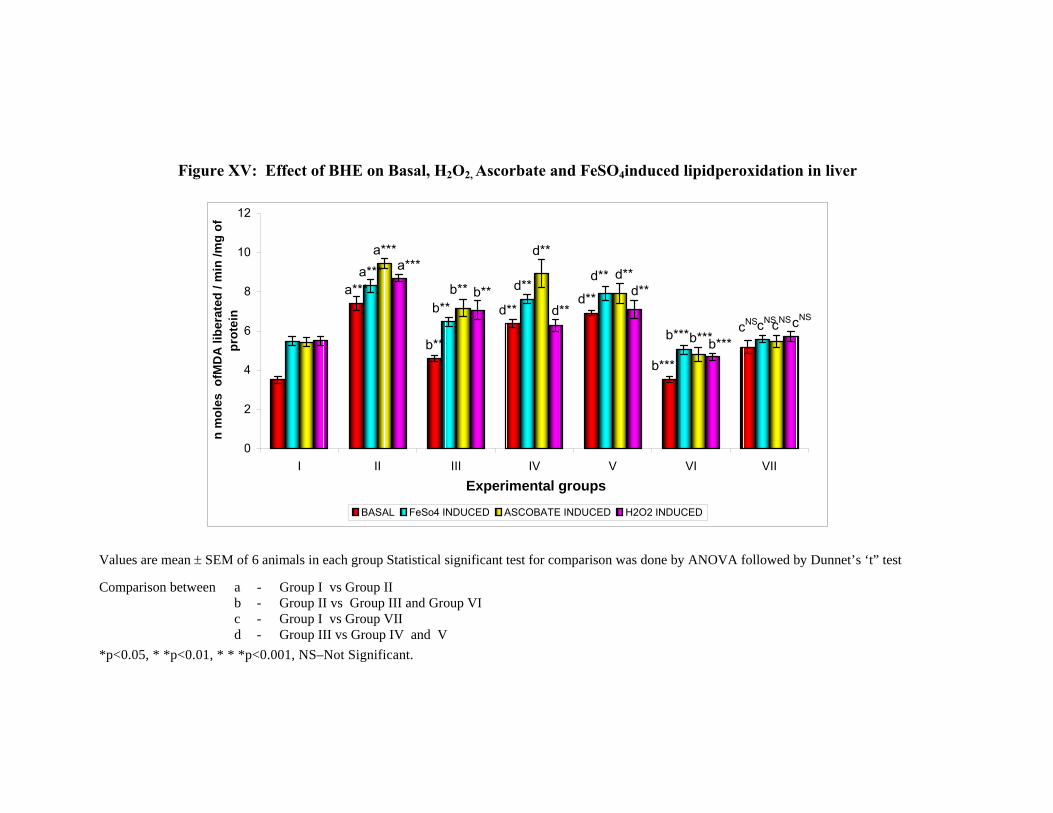
Figure XV: Effect of BHE on Basal, H2O2, Ascorbate and FeSO4induced lipidperoxidation in liver
cNS
b***
d**d**
b**
a***
cNS
b***
d**d**
b**
a***
cNS
b***
d**
d**
b**
a***
cNS
b***
d**d**
b**
a***
0
2
4
6
8
10
12
I II III IV V VI VII
Experimental groups
n m
oles
ofM
DA
libe
rate
d / m
in /m
g of
prot
ein
BASAL FeSo4 INDUCED ASCOBATE INDUCED H2O2 INDUCED
Values are mean ± SEM of 6 animals in each group Statistical significant test for comparison was done by ANOVA followed by Dunnet’s ‘t” test Comparison between a - Group I vs Group II
b - Group II vs Group III and Group VI c - Group I vs Group VII d - Group III vs Group IV and V
*p<0.05, * *p<0.01, * * *p<0.001, NS–Not Significant.
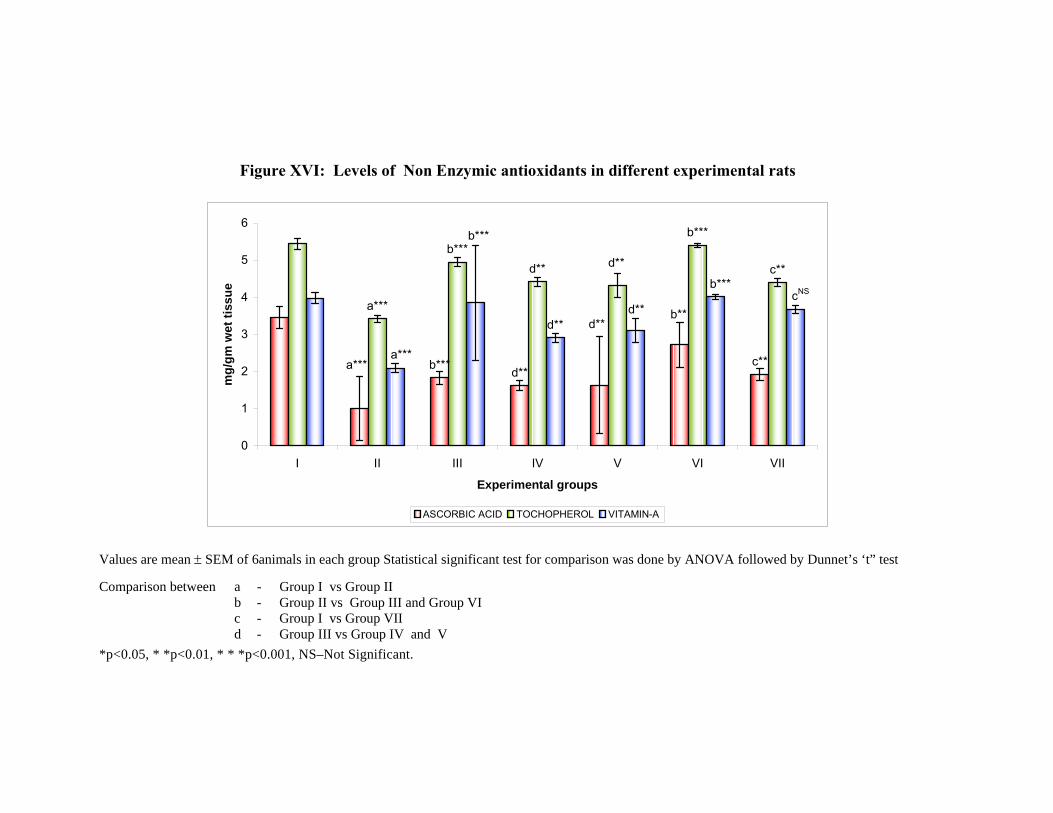
Figure XVI: Levels of Non Enzymic antioxidants in different experimental rats
c**
b**d**
d**b***a***
c**
b***
d**d**b***
a***cNS
b***
d**d**
b***
a***
0
1
2
3
4
5
6
I II III IV V VI VII
Experimental groups
mg/
gm w
et ti
ssue
ASCORBIC ACID TOCHOPHEROL VITAMIN-A
Values are mean ± SEM of 6animals in each group Statistical significant test for comparison was done by ANOVA followed by Dunnet’s ‘t” test Comparison between a - Group I vs Group II
b - Group II vs Group III and Group VI c - Group I vs Group VII d - Group III vs Group IV and V
*p<0.05, * *p<0.01, * * *p<0.001, NS–Not Significant.
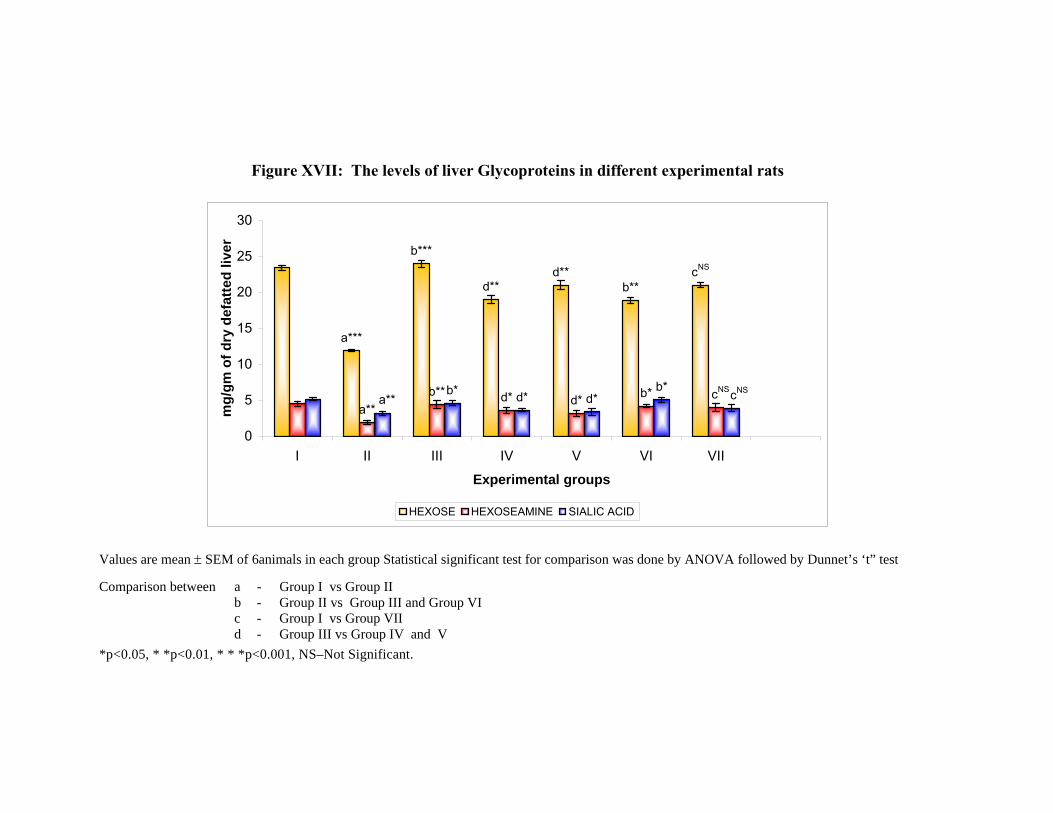
Figure XVII: The levels of liver Glycoproteins in different experimental rats
cNS
b**d**
d**
b***
a***
cNSb*d*d*b**a**
cNSb*d*d*b*
a**
0
5
10
15
20
25
30
I II III IV V VI VII
Experimental groups
mg/
gm o
f dry
def
atte
d liv
er
HEXOSE HEXOSEAMINE SIALIC ACID
Values are mean ± SEM of 6animals in each group Statistical significant test for comparison was done by ANOVA followed by Dunnet’s ‘t” test Comparison between a - Group I vs Group II
b - Group II vs Group III and Group VI c - Group I vs Group VII d - Group III vs Group IV and V
*p<0.05, * *p<0.01, * * *p<0.001, NS–Not Significant.
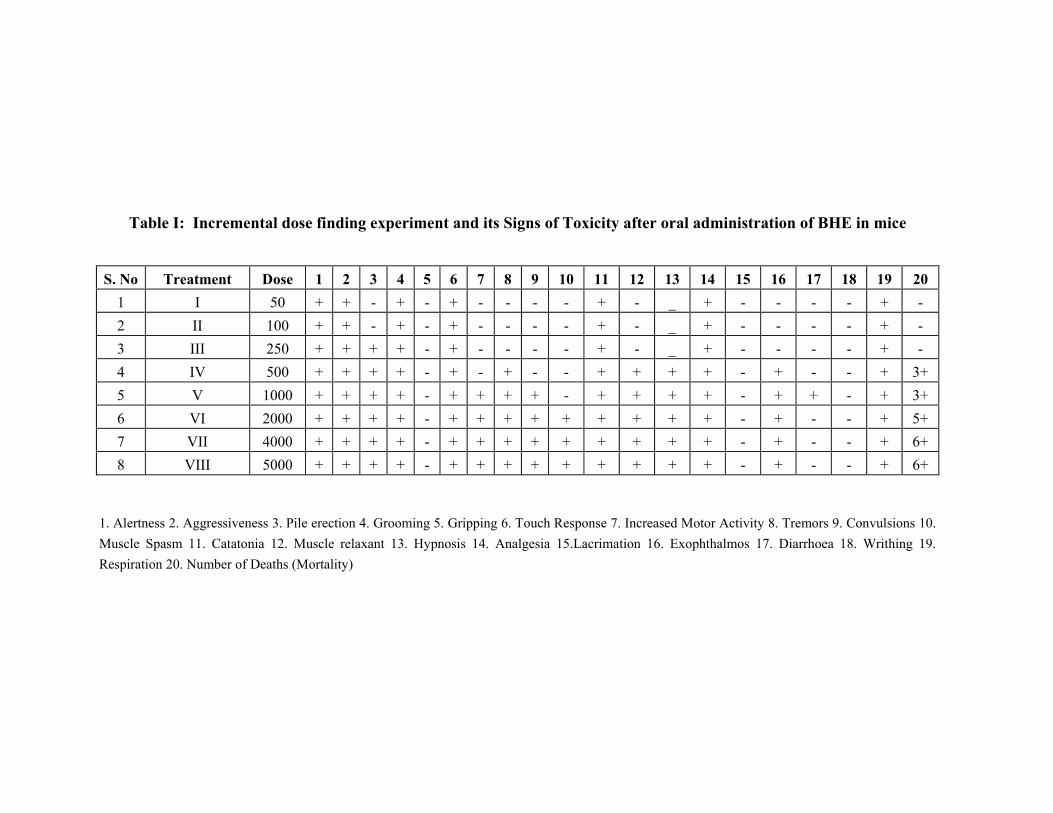
Table I: Incremental dose finding experiment and its Signs of Toxicity after oral administration of BHE in mice
S. No Treatment Dose 1 2 3 4 5 6 7 8 9 10 11 12 13 14 15 16 17 18 19 20 1 I 50 + + - + - + - - - - + - _ + - - - - + - 2 II 100 + + - + - + - - - - + - _ + - - - - + - 3 III 250 + + + + - + - - - - + - _ + - - - - + - 4 IV 500 + + + + - + - + - - + + + + - + - - + 3+ 5 V 1000 + + + + - + + + + - + + + + - + + - + 3+ 6 VI 2000 + + + + - + + + + + + + + + - + - - + 5+ 7 VII 4000 + + + + - + + + + + + + + + - + - - + 6+ 8 VIII 5000 + + + + - + + + + + + + + + - + - - + 6+
1. Alertness 2. Aggressiveness 3. Pile erection 4. Grooming 5. Gripping 6. Touch Response 7. Increased Motor Activity 8. Tremors 9. Convulsions 10. Muscle Spasm 11. Catatonia 12. Muscle relaxant 13. Hypnosis 14. Analgesia 15.Lacrimation 16. Exophthalmos 17. Diarrhoea 18. Writhing 19. Respiration 20. Number of Deaths (Mortality)
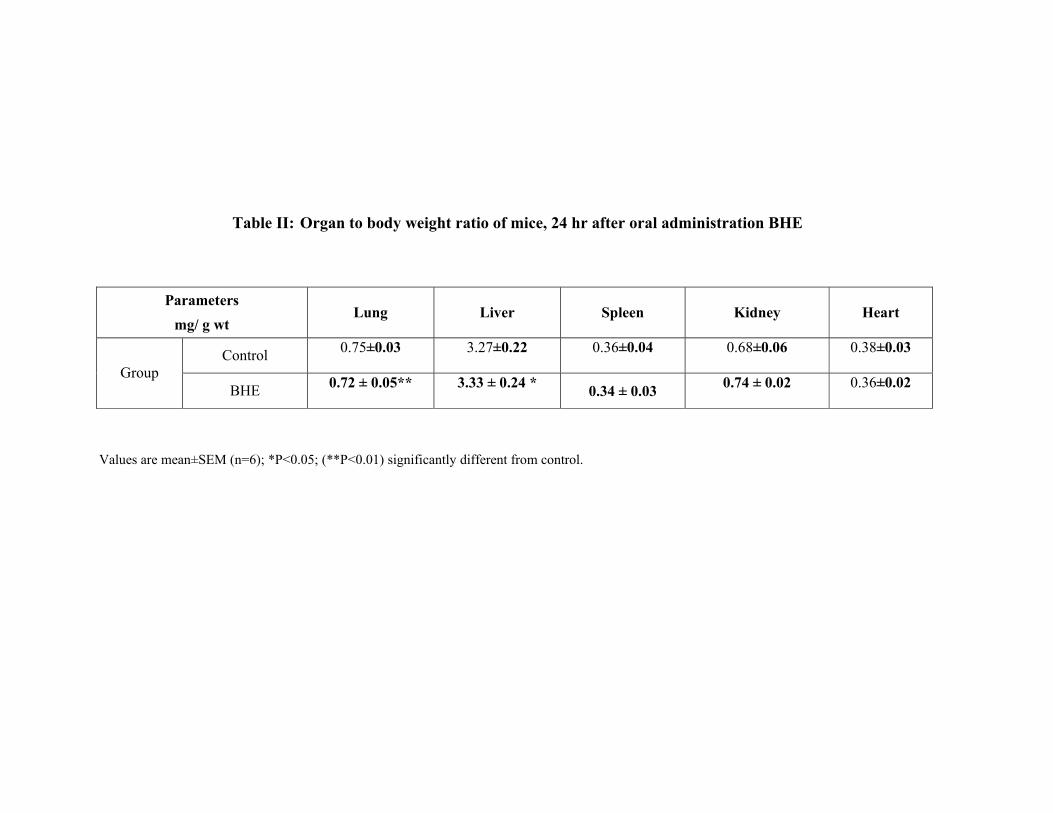
Table II: Organ to body weight ratio of mice, 24 hr after oral administration BHE
Parameters mg/ g wt
Lung Liver Spleen Kidney Heart
Control 0.75±0.03 3.27±0.22 0.36±0.04 0.68±0.06 0.38±0.03
Group BHE 0.72 ± 0.05** 3.33 ± 0.24 * 0.34 ± 0.03 0.74 ± 0.02 0.36±0.02
Values are mean±SEM (n=6); *P<0.05; (**P<0.01) significantly different from control.
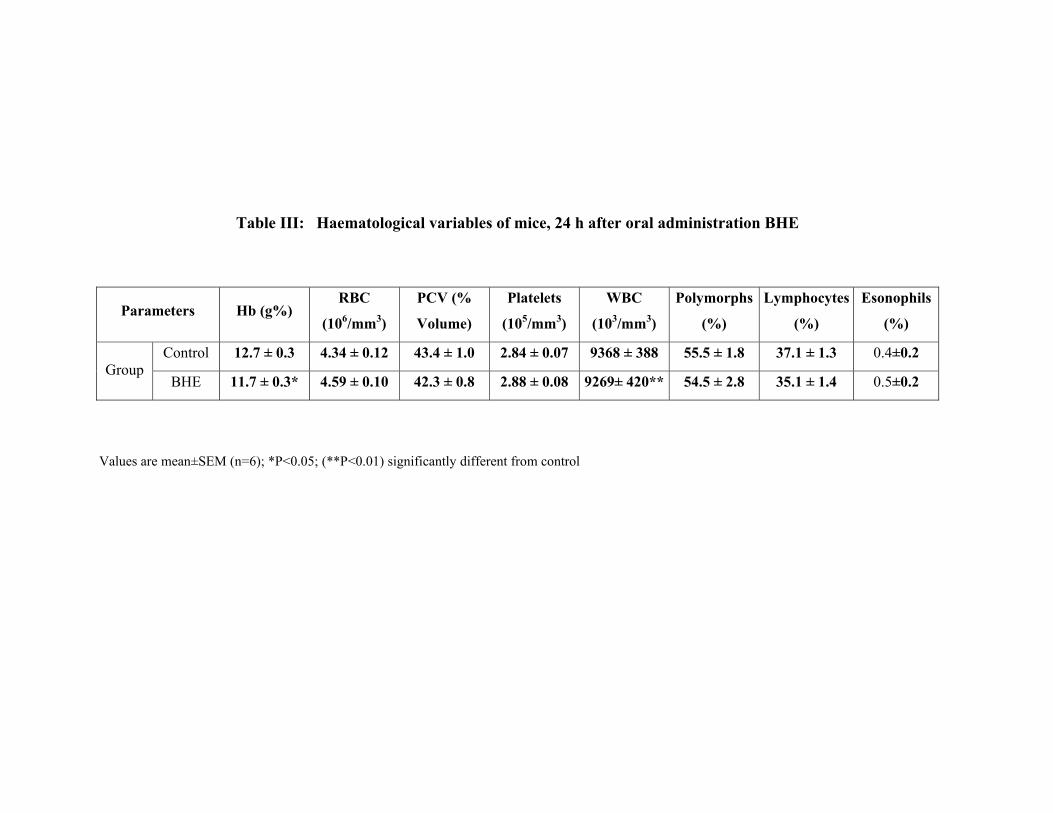
Table III: Haematological variables of mice, 24 h after oral administration BHE
Parameters Hb (g%) RBC
(106/mm3)
PCV (%
Volume)
Platelets
(105/mm3)
WBC
(103/mm3)
Polymorphs
(%)
Lymphocytes
(%)
Esonophils
(%)
Control 12.7 ± 0.3 4.34 ± 0.12 43.4 ± 1.0 2.84 ± 0.07 9368 ± 388 55.5 ± 1.8 37.1 ± 1.3 0.4±0.2 Group
BHE 11.7 ± 0.3* 4.59 ± 0.10 42.3 ± 0.8 2.88 ± 0.08 9269± 420** 54.5 ± 2.8 35.1 ± 1.4 0.5±0.2
Values are mean±SEM (n=6); *P<0.05; (**P<0.01) significantly different from control
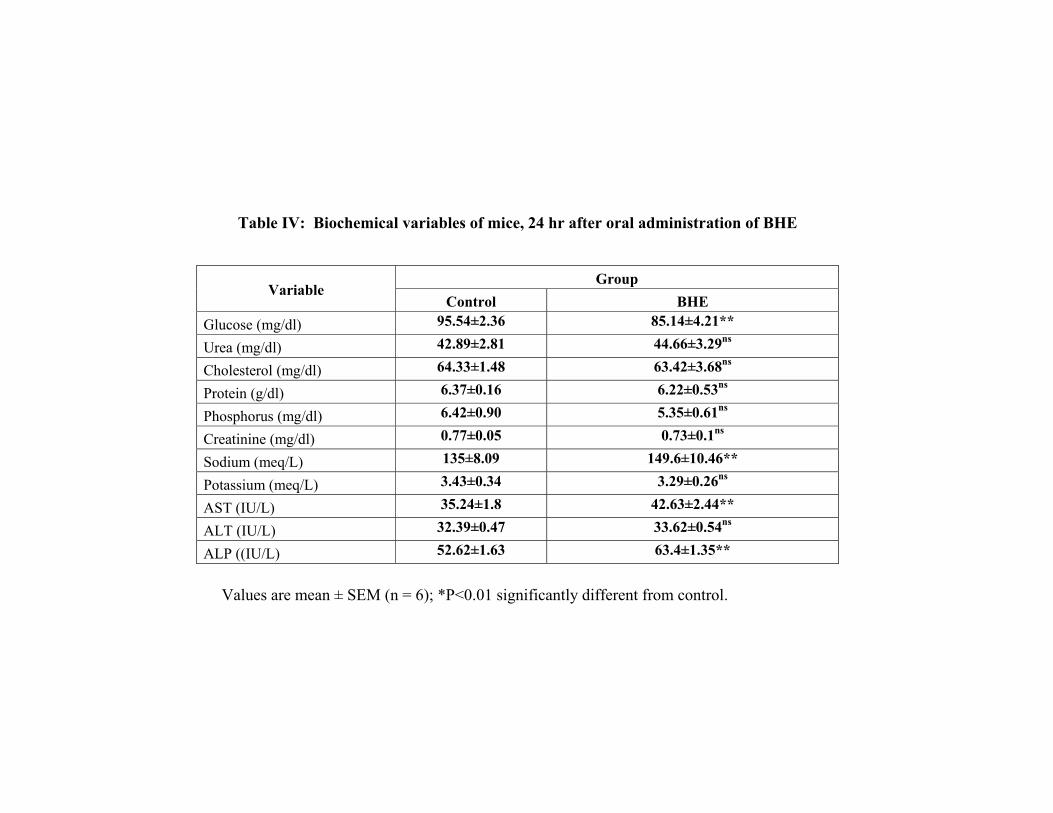
Table IV: Biochemical variables of mice, 24 hr after oral administration of BHE
Group Variable
Control BHE Glucose (mg/dl) 95.54±2.36 85.14±4.21**
Urea (mg/dl) 42.89±2.81 44.66±3.29ns
Cholesterol (mg/dl) 64.33±1.48 63.42±3.68ns
Protein (g/dl) 6.37±0.16 6.22±0.53ns
Phosphorus (mg/dl) 6.42±0.90 5.35±0.61ns
Creatinine (mg/dl) 0.77±0.05 0.73±0.1ns
Sodium (meq/L) 135±8.09 149.6±10.46**
Potassium (meq/L) 3.43±0.34 3.29±0.26ns
AST (IU/L) 35.24±1.8 42.63±2.44**
ALT (IU/L) 32.39±0.47 33.62±0.54ns
ALP ((IU/L) 52.62±1.63 63.4±1.35**
Values are mean ± SEM (n = 6); *P<0.01 significantly different from control.
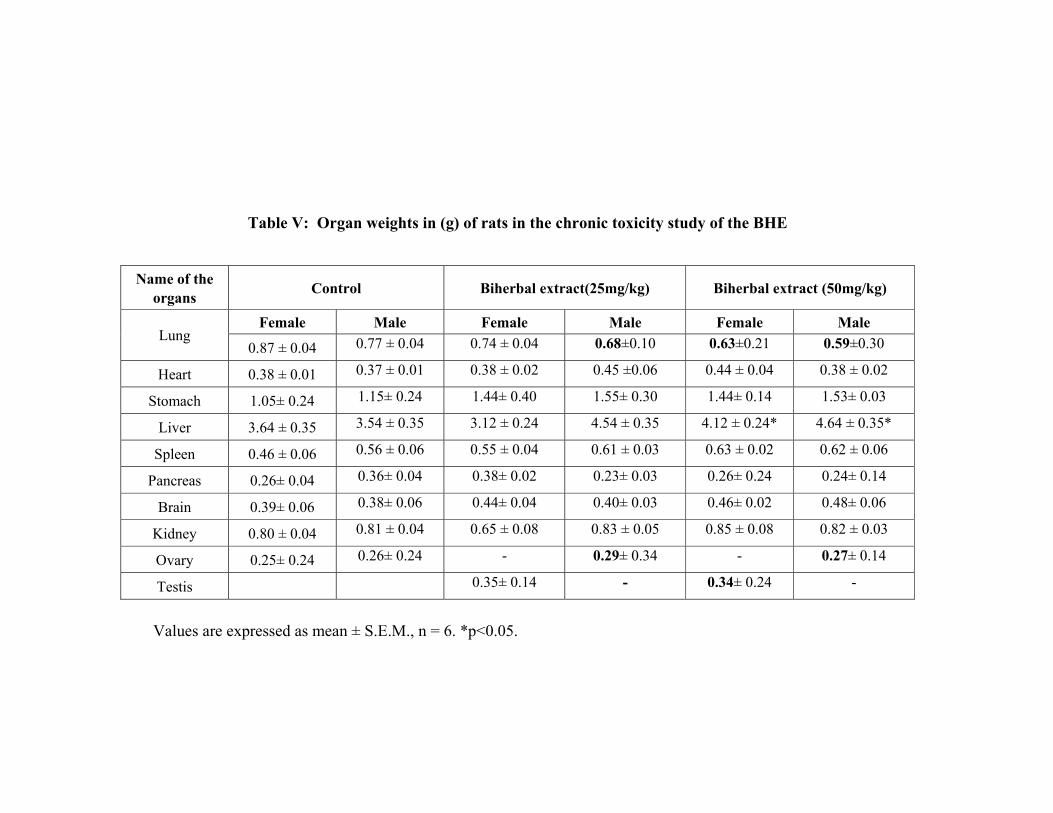
Table V: Organ weights in (g) of rats in the chronic toxicity study of the BHE
Name of the organs Control Biherbal extract(25mg/kg) Biherbal extract (50mg/kg)
Female Male Female Male Female Male Lung
0.87 ± 0.04 0.77 ± 0.04 0.74 ± 0.04 0.68±0.10 0.63±0.21 0.59±0.30
Heart 0.38 ± 0.01 0.37 ± 0.01 0.38 ± 0.02 0.45 ±0.06 0.44 ± 0.04 0.38 ± 0.02
Stomach 1.05± 0.24 1.15± 0.24 1.44± 0.40 1.55± 0.30 1.44± 0.14 1.53± 0.03
Liver 3.64 ± 0.35 3.54 ± 0.35 3.12 ± 0.24 4.54 ± 0.35 4.12 ± 0.24* 4.64 ± 0.35*
Spleen 0.46 ± 0.06 0.56 ± 0.06 0.55 ± 0.04 0.61 ± 0.03 0.63 ± 0.02 0.62 ± 0.06
Pancreas 0.26± 0.04 0.36± 0.04 0.38± 0.02 0.23± 0.03 0.26± 0.24 0.24± 0.14
Brain 0.39± 0.06 0.38± 0.06 0.44± 0.04 0.40± 0.03 0.46± 0.02 0.48± 0.06
Kidney 0.80 ± 0.04 0.81 ± 0.04 0.65 ± 0.08 0.83 ± 0.05 0.85 ± 0.08 0.82 ± 0.03
Ovary 0.25± 0.24 0.26± 0.24 - 0.29± 0.34 - 0.27± 0.14
Testis 0.35± 0.14 - 0.34± 0.24 -
Values are expressed as mean ± S.E.M., n = 6. *p<0.05.
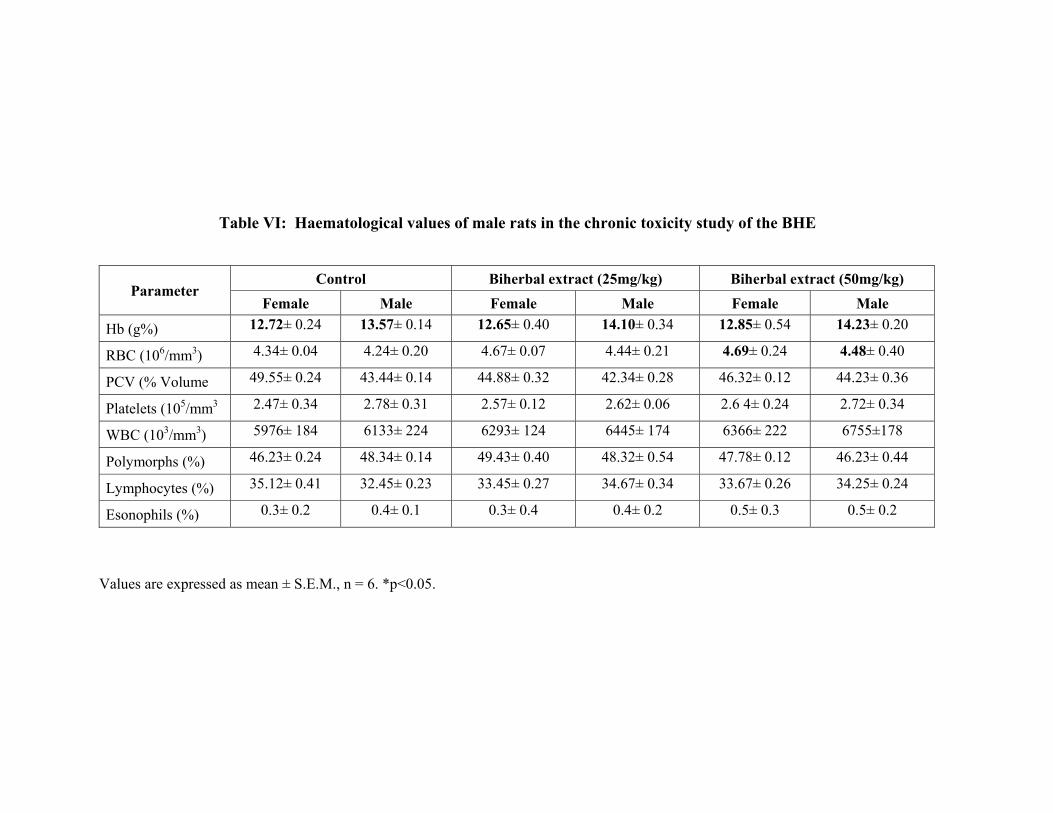
Table VI: Haematological values of male rats in the chronic toxicity study of the BHE
Control Biherbal extract (25mg/kg) Biherbal extract (50mg/kg) Parameter
Female Male Female Male Female Male
Hb (g%) 12.72± 0.24 13.57± 0.14 12.65± 0.40 14.10± 0.34 12.85± 0.54 14.23± 0.20
RBC (106/mm3) 4.34± 0.04 4.24± 0.20 4.67± 0.07 4.44± 0.21 4.69± 0.24 4.48± 0.40
PCV (% Volume 49.55± 0.24 43.44± 0.14 44.88± 0.32 42.34± 0.28 46.32± 0.12 44.23± 0.36
Platelets (105/mm3 2.47± 0.34 2.78± 0.31 2.57± 0.12 2.62± 0.06 2.6 4± 0.24 2.72± 0.34
WBC (103/mm3) 5976± 184 6133± 224 6293± 124 6445± 174 6366± 222 6755±178
Polymorphs (%) 46.23± 0.24 48.34± 0.14 49.43± 0.40 48.32± 0.54 47.78± 0.12 46.23± 0.44
Lymphocytes (%) 35.12± 0.41 32.45± 0.23 33.45± 0.27 34.67± 0.34 33.67± 0.26 34.25± 0.24
Esonophils (%) 0.3± 0.2 0.4± 0.1 0.3± 0.4 0.4± 0.2 0.5± 0.3 0.5± 0.2
Values are expressed as mean ± S.E.M., n = 6. *p<0.05.
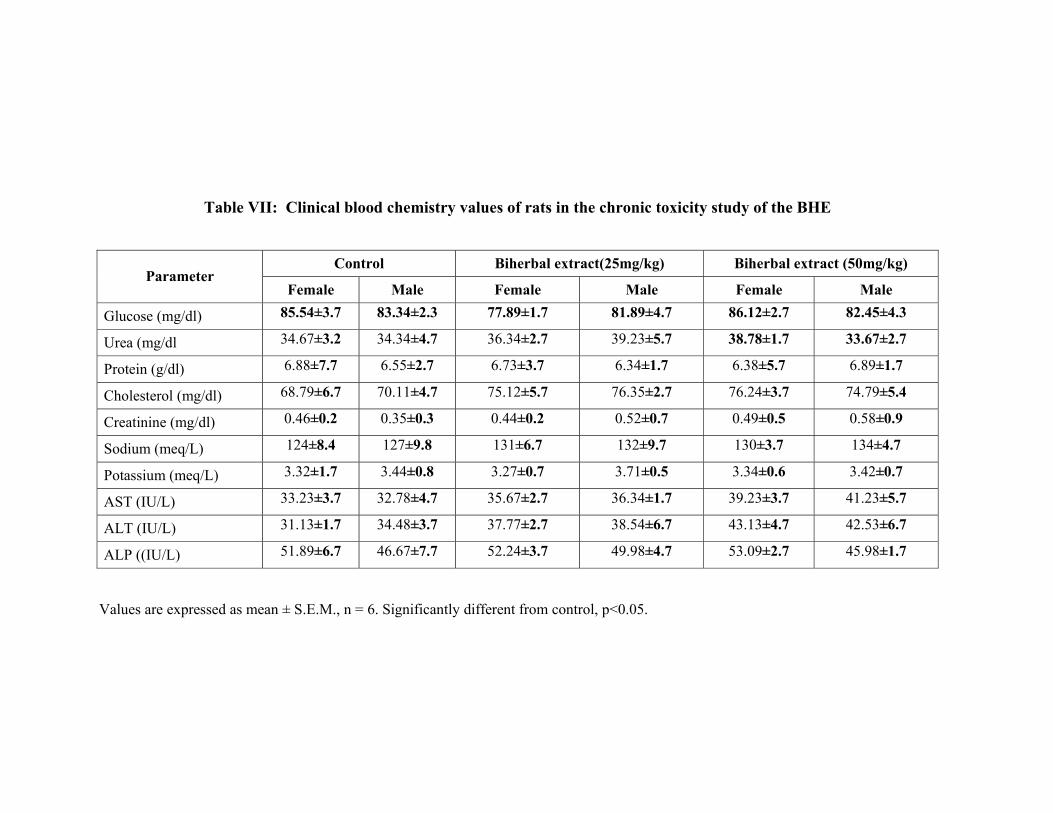
Table VII: Clinical blood chemistry values of rats in the chronic toxicity study of the BHE
Control Biherbal extract(25mg/kg) Biherbal extract (50mg/kg) Parameter
Female Male Female Male Female Male
Glucose (mg/dl) 85.54±3.7 83.34±2.3 77.89±1.7 81.89±4.7 86.12±2.7 82.45±4.3
Urea (mg/dl 34.67±3.2 34.34±4.7 36.34±2.7 39.23±5.7 38.78±1.7 33.67±2.7
Protein (g/dl) 6.88±7.7 6.55±2.7 6.73±3.7 6.34±1.7 6.38±5.7 6.89±1.7
Cholesterol (mg/dl) 68.79±6.7 70.11±4.7 75.12±5.7 76.35±2.7 76.24±3.7 74.79±5.4
Creatinine (mg/dl) 0.46±0.2 0.35±0.3 0.44±0.2 0.52±0.7 0.49±0.5 0.58±0.9
Sodium (meq/L) 124±8.4 127±9.8 131±6.7 132±9.7 130±3.7 134±4.7
Potassium (meq/L) 3.32±1.7 3.44±0.8 3.27±0.7 3.71±0.5 3.34±0.6 3.42±0.7
AST (IU/L) 33.23±3.7 32.78±4.7 35.67±2.7 36.34±1.7 39.23±3.7 41.23±5.7
ALT (IU/L) 31.13±1.7 34.48±3.7 37.77±2.7 38.54±6.7 43.13±4.7 42.53±6.7
ALP ((IU/L) 51.89±6.7 46.67±7.7 52.24±3.7 49.98±4.7 53.09±2.7 45.98±1.7
Values are expressed as mean ± S.E.M., n = 6. Significantly different from control, p<0.05.
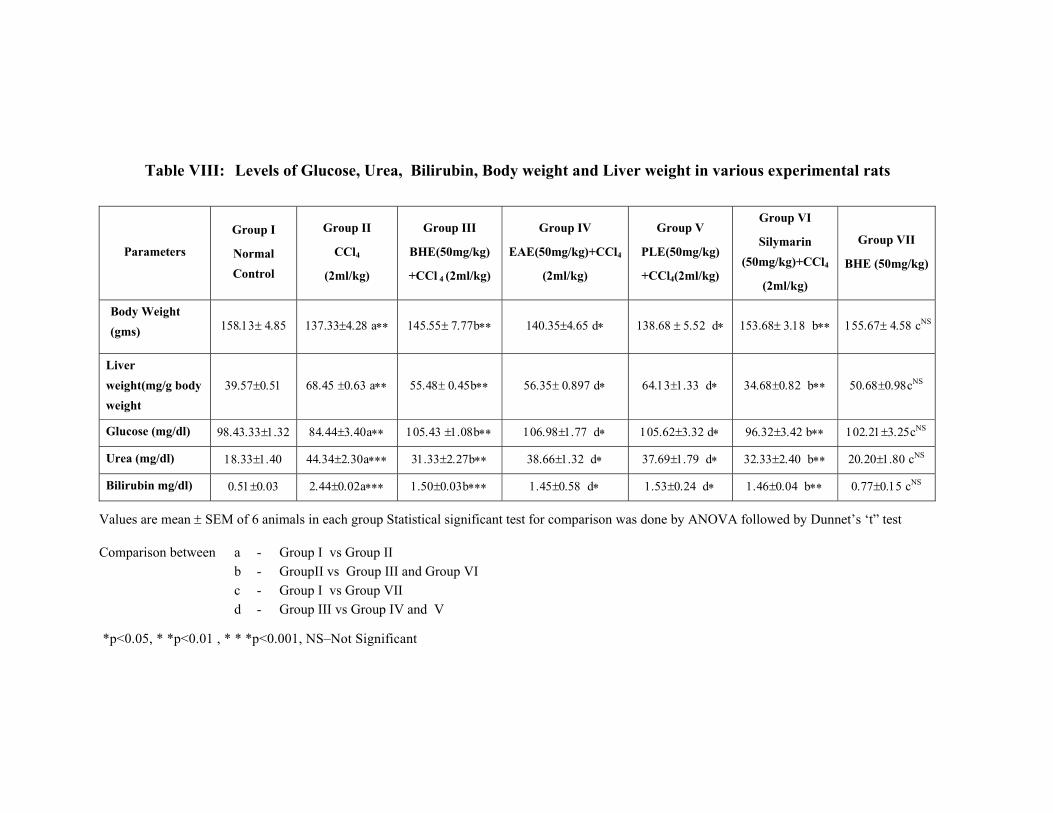
Table VIII: Levels of Glucose, Urea, Bilirubin, Body weight and Liver weight in various experimental rats
Parameters
Group I
Normal Control
Group II
CCl4
(2ml/kg)
Group III
BHE(50mg/kg)
+CCl 4 (2ml/kg)
Group IV
EAE(50mg/kg)+CCl4
(2ml/kg)
Group V
PLE(50mg/kg)
+CCl4(2ml/kg)
Group VI
Silymarin (50mg/kg)+CCl4
(2ml/kg)
Group VII
BHE (50mg/kg)
Body Weight (gms)
158.13± 4.85 137.33±4.28 a∗∗ 145.55± 7.77b∗∗ 140.35±4.65 d∗ 138.68 ± 5.52 d∗ 153.68± 3.18 b∗∗ 155.67± 4.58 cNS
Liver weight(mg/g body weight
39.57±0.51 68.45 ±0.63 a∗∗ 55.48± 0.45b∗∗ 56.35± 0.897 d∗ 64.13±1.33 d∗ 34.68±0.82 b∗∗ 50.68±0.98cNS
Glucose (mg/dl) 98.43.33±1.32 84.44±3.40a∗∗ 105.43 ±1.08b∗∗ 106.98±1.77 d∗ 105.62±3.32 d∗ 96.32±3.42 b∗∗ 102.21±3.25cNS
Urea (mg/dl) 18.33±1.40 44.34±2.30a∗∗∗ 31.33±2.27b∗∗ 38.66±1.32 d∗ 37.69±1.79 d∗ 32.33±2.40 b∗∗ 20.20±1.80 cNS
Bilirubin mg/dl) 0.51±0.03 2.44±0.02a∗∗∗ 1.50±0.03b∗∗∗ 1.45±0.58 d∗ 1.53±0.24 d∗ 1.46±0.04 b∗∗ 0.77±0.15 cNS
Values are mean ± SEM of 6 animals in each group Statistical significant test for comparison was done by ANOVA followed by Dunnet’s ‘t” test
Comparison between a - Group I vs Group II b - GroupII vs Group III and Group VI c - Group I vs Group VII d - Group III vs Group IV and V
*p<0.05, * *p<0.01 , * * *p<0.001, NS–Not Significant
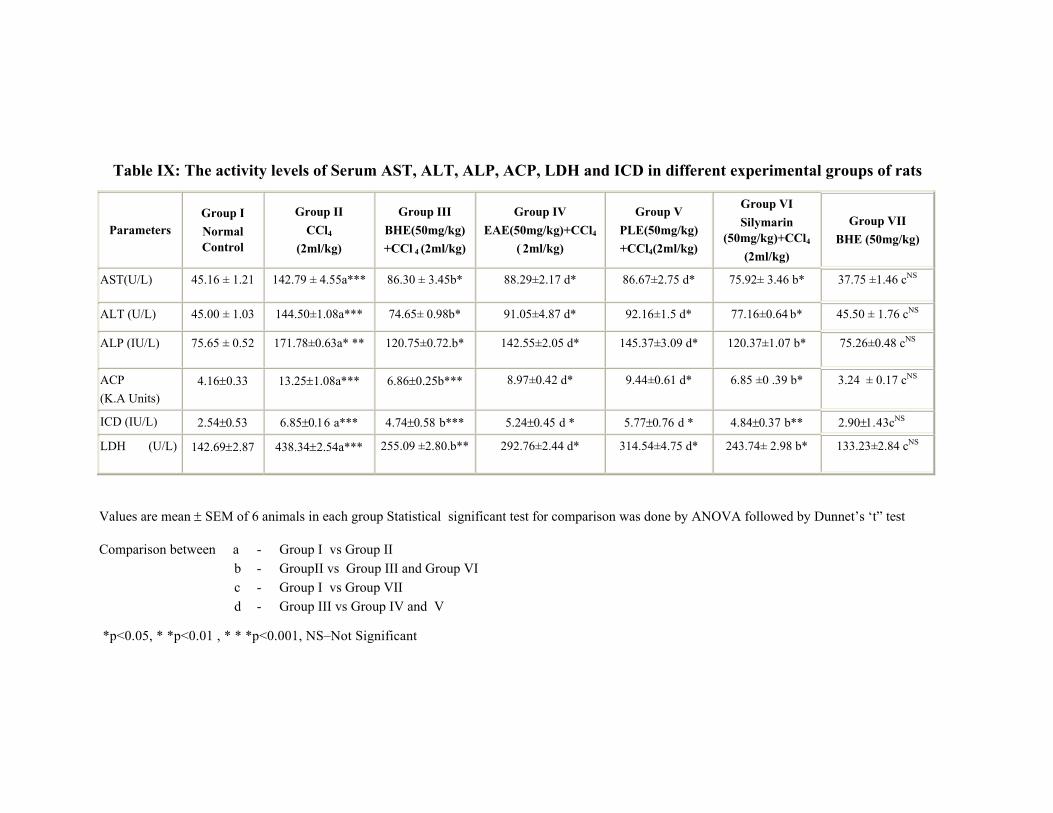
Table IX: The activity levels of Serum AST, ALT, ALP, ACP, LDH and ICD in different experimental groups of rats
Parameters Group I Normal Control
Group II CCl4
(2ml/kg)
Group III BHE(50mg/kg) +CCl 4 (2ml/kg)
Group IV EAE(50mg/kg)+CCl4
( 2ml/kg)
Group V PLE(50mg/kg) +CCl4(2ml/kg)
Group VI Silymarin
(50mg/kg)+CCl4 (2ml/kg)
Group VII BHE (50mg/kg)
AST(U/L) 45.16 ± 1.21 142.79 ± 4.55a*** 86.30 ± 3.45b* 88.29±2.17 d* 86.67±2.75 d* 75.92± 3.46 b* 37.75 ±1.46 cNS
ALT (U/L) 45.00 ± 1.03 144.50±1.08a*** 74.65± 0.98b* 91.05±4.87 d* 92.16±1.5 d* 77.16±0.64 b* 45.50 ± 1.76 cNS
ALP (IU/L) 75.65 ± 0.52 171.78±0.63a* ** 120.75±0.72.b* 142.55±2.05 d* 145.37±3.09 d* 120.37±1.07 b* 75.26±0.48 cNS
ACP (K.A Units)
4.16±0.33 13.25±1.08a*** 6.86±0.25b***
8.97±0.42 d* 9.44±0.61 d* 6.85 ±0 .39 b* 3.24 ± 0.17 cNS
ICD (IU/L) 2.54±0.53 6.85±0.16 a*** 4.74±0.58 b*** 5.24±0.45 d * 5.77±0.76 d * 4.84±0.37 b** 2.90±1.43cNS
LDH (U/L)
142.69±2.87 438.34±2.54a*** 255.09 ±2.80.b** 292.76±2.44 d* 314.54±4.75 d* 243.74± 2.98 b* 133.23±2.84 cNS
Values are mean ± SEM of 6 animals in each group Statistical significant test for comparison was done by ANOVA followed by Dunnet’s ‘t” test
Comparison between a - Group I vs Group II b - GroupII vs Group III and Group VI c - Group I vs Group VII d - Group III vs Group IV and V
*p<0.05, * *p<0.01 , * * *p<0.001, NS–Not Significant
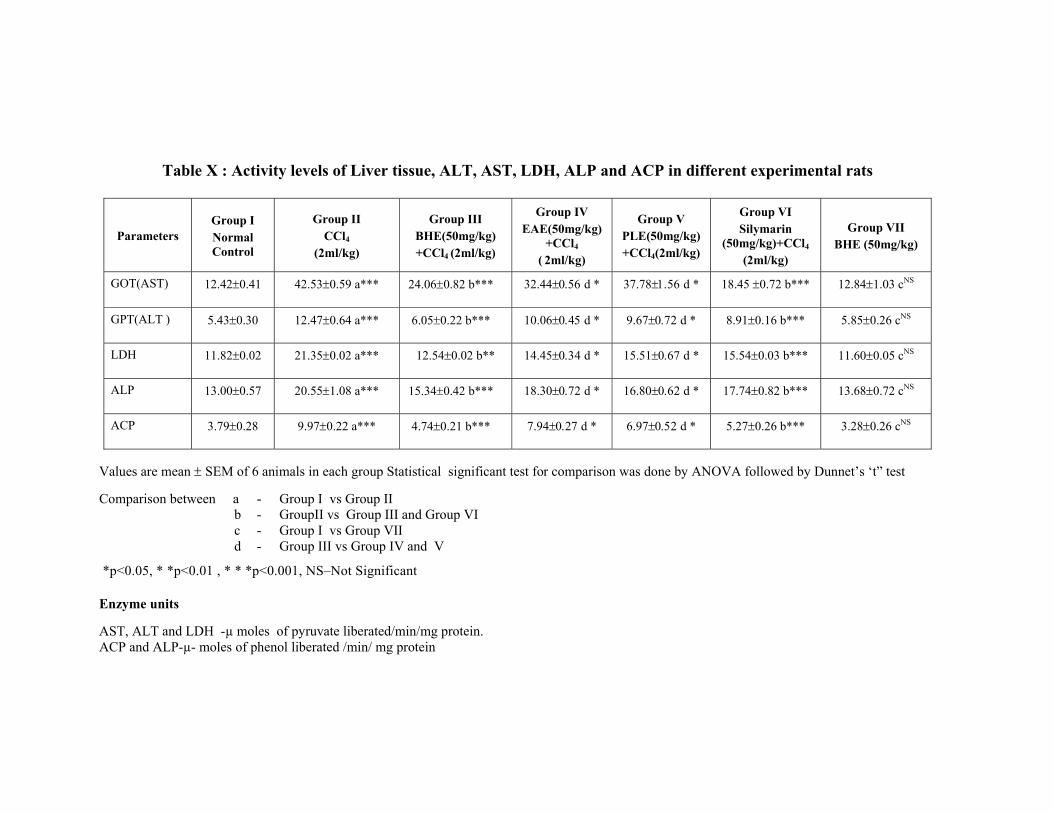
Table X : Activity levels of Liver tissue, ALT, AST, LDH, ALP and ACP in different experimental rats
Parameters Group I Normal Control
Group II CCl4
(2ml/kg)
Group III BHE(50mg/kg) +CCl4 (2ml/kg)
Group IV EAE(50mg/kg)
+CCl4
( 2ml/kg)
Group V PLE(50mg/kg) +CCl4(2ml/kg)
Group VI Silymarin
(50mg/kg)+CCl4 (2ml/kg)
Group VII BHE (50mg/kg)
GOT(AST) 12.42±0.41 42.53±0.59 a*** 24.06±0.82 b***
32.44±0.56 d * 37.78±1.56 d * 18.45 ±0.72 b*** 12.84±1.03 cNS
GPT(ALT ) 5.43±0.30 12.47±0.64 a*** 6.05±0.22 b***
10.06±0.45 d * 9.67±0.72 d * 8.91±0.16 b*** 5.85±0.26 cNS
LDH 11.82±0.02 21.35±0.02 a*** 12.54±0.02 b** 14.45±0.34 d * 15.51±0.67 d * 15.54±0.03 b*** 11.60±0.05 cNS
ALP 13.00±0.57 20.55±1.08 a*** 15.34±0.42 b***
18.30±0.72 d * 16.80±0.62 d * 17.74±0.82 b*** 13.68±0.72 cNS
ACP 3.79±0.28 9.97±0.22 a*** 4.74±0.21 b***
7.94±0.27 d * 6.97±0.52 d * 5.27±0.26 b*** 3.28±0.26 cNS
Values are mean ± SEM of 6 animals in each group Statistical significant test for comparison was done by ANOVA followed by Dunnet’s ‘t” test Comparison between a - Group I vs Group II
b - GroupII vs Group III and Group VI c - Group I vs Group VII d - Group III vs Group IV and V
*p<0.05, * *p<0.01 , * * *p<0.001, NS–Not Significant Enzyme units AST, ALT and LDH -µ moles of pyruvate liberated/min/mg protein. ACP and ALP-µ- moles of phenol liberated /min/ mg protein
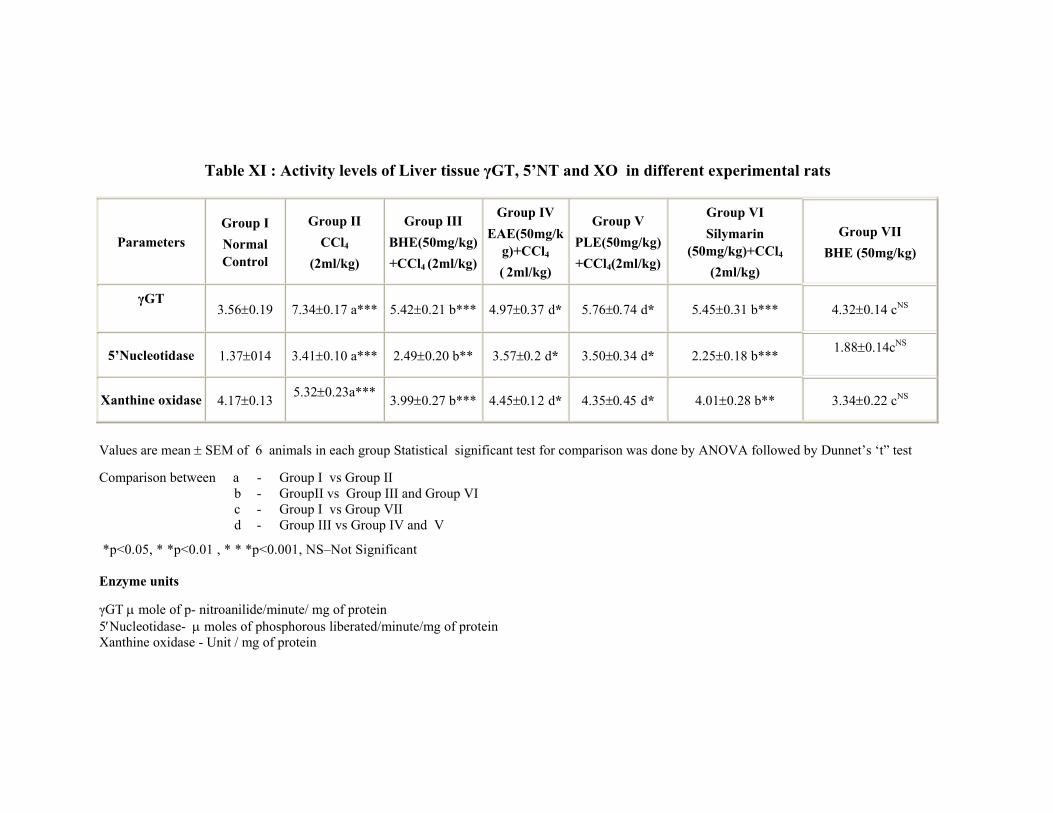
Table XI : Activity levels of Liver tissue γGT, 5’NT and XO in different experimental rats
Parameters Group I Normal Control
Group II CCl4
(2ml/kg)
Group III BHE(50mg/kg)+CCl4 (2ml/kg)
Group IV EAE(50mg/k
g)+CCl4
( 2ml/kg)
Group V PLE(50mg/kg)+CCl4(2ml/kg)
Group VI Silymarin
(50mg/kg)+CCl4 (2ml/kg)
Group VII BHE (50mg/kg)
γGT
3.56±0.19 7.34±0.17 a*** 5.42±0.21 b*** 4.97±0.37 d* 5.76±0.74 d* 5.45±0.31 b*** 4.32±0.14 cNS
5’Nucleotidase 1.37±014 3.41±0.10 a*** 2.49±0.20 b** 3.57±0.2 d* 3.50±0.34 d* 2.25±0.18 b*** 1.88±0.14cNS
Xanthine oxidase 4.17±0.13 5.32±0.23a*** 3.99±0.27 b*** 4.45±0.12 d* 4.35±0.45 d* 4.01±0.28 b** 3.34±0.22 cNS
Values are mean ± SEM of 6 animals in each group Statistical significant test for comparison was done by ANOVA followed by Dunnet’s ‘t” test Comparison between a - Group I vs Group II
b - GroupII vs Group III and Group VI c - Group I vs Group VII d - Group III vs Group IV and V
*p<0.05, * *p<0.01 , * * *p<0.001, NS–Not Significant Enzyme units γGT µ mole of p- nitroanilide/minute/ mg of protein 5′Nucleotidase- µ moles of phosphorous liberated/minute/mg of protein Xanthine oxidase - Unit / mg of protein

Table XII : Serum levels of Lipoprotein Cholesterol in different experimental rats
Parameters Group I Normal Control
Group II CCl4
(2ml/kg)
Group III BHE(50mg/kg
) +CCl4
(2ml/kg)
Group IV EAE(50mg/kg) +CCl4(2ml/kg)
Group V PLE(50mg/kg) +CCl4(2ml/kg)
Group VI Silymarin
(50mg/kg)+CCl4 (2ml/kg)
GroupVII BHE (50mg/kg)
HDL Cholesterol (mg/dl)
51.37±5.53 30.57±2.43 a** 46.64±3.97 b* 41.64±3.97 d * 40.26±3.6 d* 50.38±2.41 b** 47.27±4.12 cNS
LDL Cholesterol (mg/dl)
36.67±4.34 74.08±4.13 a*** 33.06±5.06 b* 37.79±3.45 d * 39.24±4.5 d* 34.68±2.79 b** 45.77±4.53 cNS
VLDL Cholesterol (mg/dl) 24.14±2.64 41.00±3.21 a* 22.52±4.12b** 26.94±2.56 d * 24.85±3.56 d * 226.96± 3.45 b* 27.26±2.98 cNS
Values are mean ± SEM of 6 animals in each group Statistical significant test for comparison was done by ANOVA followed by Dunnet’s ‘t” test
Comparison between a - Group I vs Group II b - GroupII vs Group III and Group VI c - Group I vs Group VII d - Group III vs Group IV and V
*p<0.05, * *p<0.01 , * * *p<0.001, NS–Not Significant
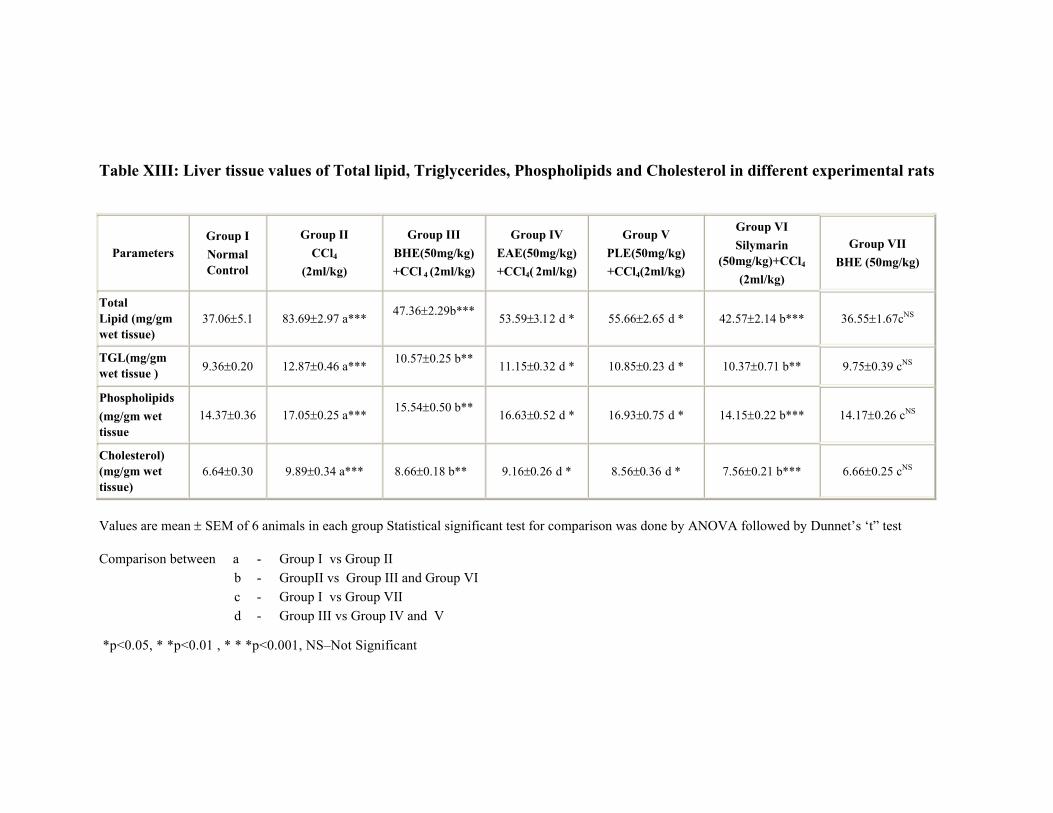
Table XIII: Liver tissue values of Total lipid, Triglycerides, Phospholipids and Cholesterol in different experimental rats
Parameters Group I Normal Control
Group II CCl4
(2ml/kg)
Group III BHE(50mg/kg) +CCl 4 (2ml/kg)
Group IV EAE(50mg/kg) +CCl4( 2ml/kg)
Group V PLE(50mg/kg) +CCl4(2ml/kg)
Group VI Silymarin
(50mg/kg)+CCl4 (2ml/kg)
Group VII BHE (50mg/kg)
Total Lipid (mg/gm wet tissue)
37.06±5.1 83.69±2.97 a*** 47.36±2.29b*** 53.59±3.12 d * 55.66±2.65 d * 42.57±2.14 b*** 36.55±1.67cNS
TGL(mg/gm wet tissue ) 9.36±0.20 12.87±0.46 a*** 10.57±0.25 b**
11.15±0.32 d * 10.85±0.23 d * 10.37±0.71 b** 9.75±0.39 cNS
Phospholipids (mg/gm wet tissue
14.37±0.36 17.05±0.25 a*** 15.54±0.50 b** 16.63±0.52 d * 16.93±0.75 d * 14.15±0.22 b*** 14.17±0.26 cNS
Cholesterol) (mg/gm wet tissue)
6.64±0.30 9.89±0.34 a*** 8.66±0.18 b** 9.16±0.26 d * 8.56±0.36 d * 7.56±0.21 b*** 6.66±0.25 cNS
Values are mean ± SEM of 6 animals in each group Statistical significant test for comparison was done by ANOVA followed by Dunnet’s ‘t” test
Comparison between a - Group I vs Group II b - GroupII vs Group III and Group VI c - Group I vs Group VII d - Group III vs Group IV and V
*p<0.05, * *p<0.01 , * * *p<0.001, NS–Not Significant
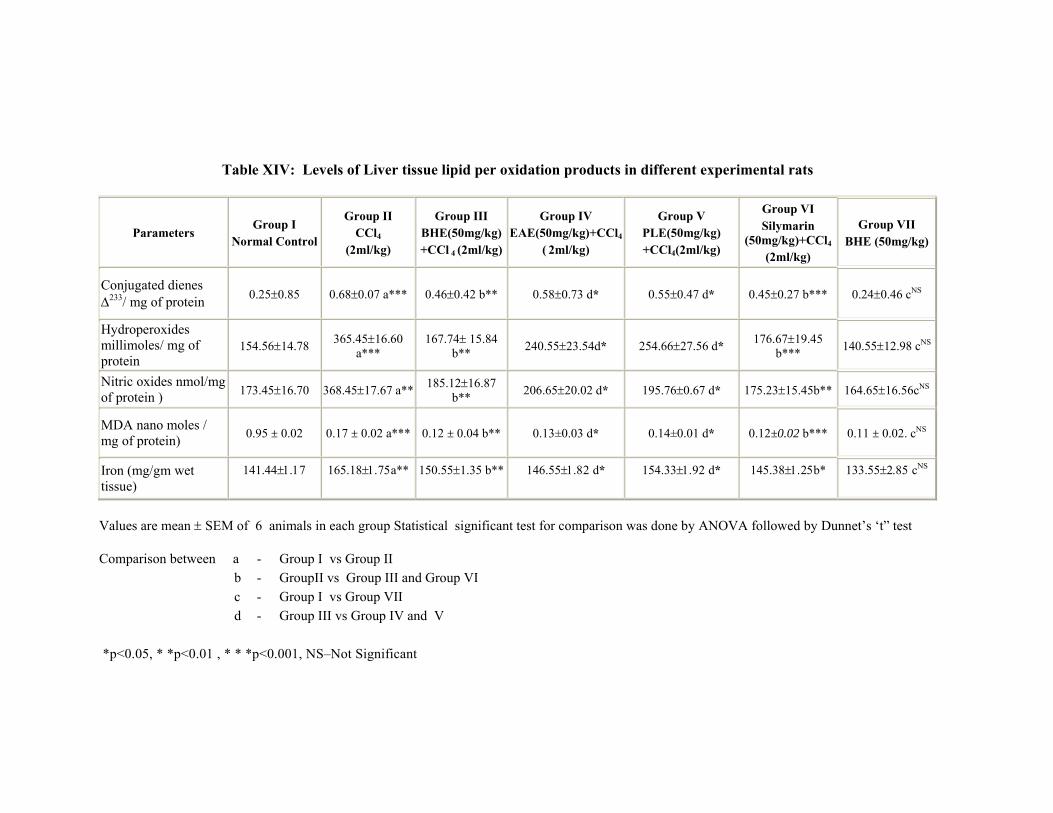
Table XIV: Levels of Liver tissue lipid per oxidation products in different experimental rats
Parameters Group I Normal Control
Group II CCl4
(2ml/kg)
Group III BHE(50mg/kg)+CCl 4 (2ml/kg)
Group IV EAE(50mg/kg)+CCl4
( 2ml/kg)
Group V PLE(50mg/kg) +CCl4(2ml/kg)
Group VI Silymarin
(50mg/kg)+CCl4
(2ml/kg)
Group VII BHE (50mg/kg)
Conjugated dienes ∆233/ mg of protein 0.25±0.85 0.68±0.07 a*** 0.46±0.42 b** 0.58±0.73 d* 0.55±0.47 d* 0.45±0.27 b*** 0.24±0.46 cNS
Hydroperoxides millimoles/ mg of protein
154.56±14.78 365.45±16.60 a***
167.74± 15.84 b** 240.55±23.54d* 254.66±27.56 d* 176.67±19.45
b*** 140.55±12.98 cNS
Nitric oxides nmol/mg of protein ) 173.45±16.70 368.45±17.67 a** 185.12±16.87
b** 206.65±20.02 d* 195.76±0.67 d* 175.23±15.45b** 164.65±16.56cNS
MDA nano moles / mg of protein) 0.95 ± 0.02 0.17 ± 0.02 a*** 0.12 ± 0.04 b** 0.13±0.03 d* 0.14±0.01 d* 0.12±0.02 b*** 0.11 ± 0.02. cNS
Iron (mg/gm wet tissue)
141.44±1.17 165.18±1.75a** 150.55±1.35 b** 146.55±1.82 d* 154.33±1.92 d* 145.38±1.25b* 133.55±2.85 cNS
Values are mean ± SEM of 6 animals in each group Statistical significant test for comparison was done by ANOVA followed by Dunnet’s ‘t” test
Comparison between a - Group I vs Group II b - GroupII vs Group III and Group VI c - Group I vs Group VII d - Group III vs Group IV and V
*p<0.05, * *p<0.01 , * * *p<0.001, NS–Not Significant
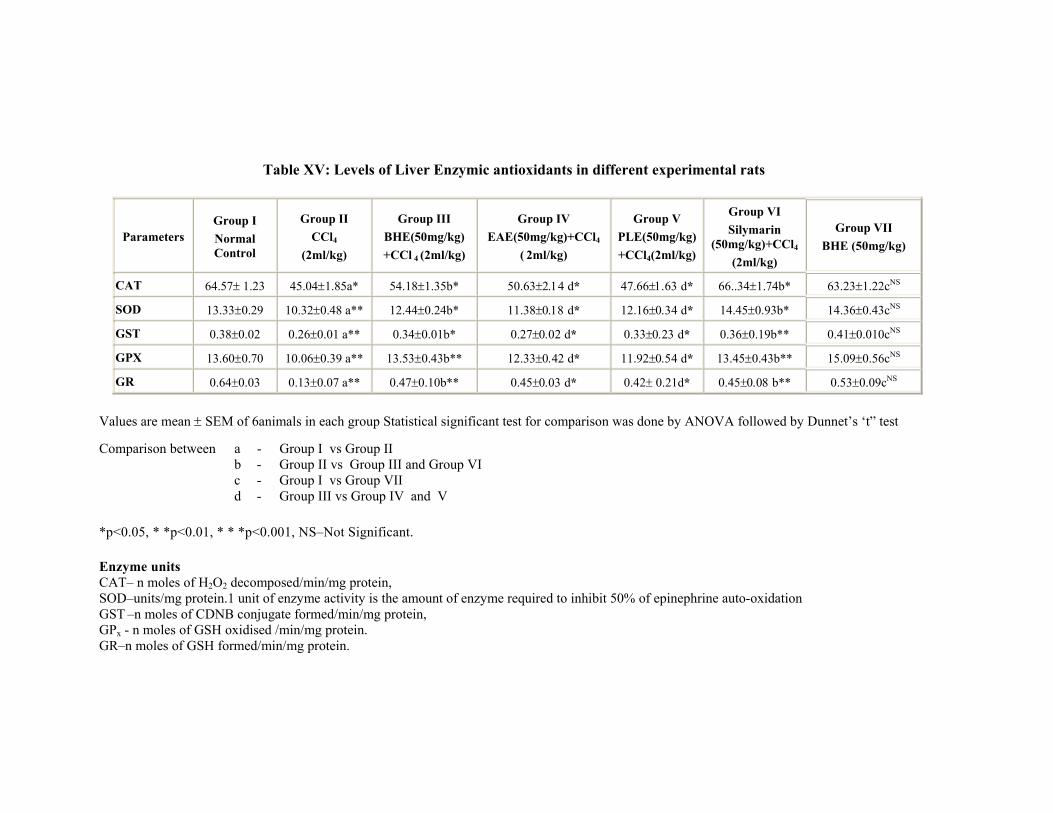
Table XV: Levels of Liver Enzymic antioxidants in different experimental rats
Parameters Group I Normal Control
Group II CCl4
(2ml/kg)
Group III BHE(50mg/kg) +CCl 4 (2ml/kg)
Group IV EAE(50mg/kg)+CCl4
( 2ml/kg)
Group V PLE(50mg/kg)+CCl4(2ml/kg)
Group VI Silymarin
(50mg/kg)+CCl4
(2ml/kg)
Group VII BHE (50mg/kg)
CAT 64.57± 1.23 45.04±1.85a* 54.18±1.35b* 50.63±2.14 d* 47.66±1.63 d* 66..34±1.74b* 63.23±1.22cNS
SOD 13.33±0.29 10.32±0.48 a** 12.44±0.24b* 11.38±0.18 d* 12.16±0.34 d* 14.45±0.93b* 14.36±0.43cNS
GST 0.38±0.02 0.26±0.01 a** 0.34±0.01b* 0.27±0.02 d* 0.33±0.23 d* 0.36±0.19b** 0.41±0.010cNS
GPX 13.60±0.70 10.06±0.39 a** 13.53±0.43b** 12.33±0.42 d* 11.92±0.54 d* 13.45±0.43b** 15.09±0.56cNS
GR 0.64±0.03 0.13±0.07 a** 0.47±0.10b** 0.45±0.03 d* 0.42± 0.21d* 0.45±0.08 b** 0.53±0.09cNS
Values are mean ± SEM of 6animals in each group Statistical significant test for comparison was done by ANOVA followed by Dunnet’s ‘t” test Comparison between a - Group I vs Group II
b - Group II vs Group III and Group VI c - Group I vs Group VII d - Group III vs Group IV and V
*p<0.05, * *p<0.01, * * *p<0.001, NS–Not Significant. Enzyme units CAT– n moles of H2O2 decomposed/min/mg protein, SOD–units/mg protein.1 unit of enzyme activity is the amount of enzyme required to inhibit 50% of epinephrine auto-oxidation GST –n moles of CDNB conjugate formed/min/mg protein, GPx - n moles of GSH oxidised /min/mg protein. GR–n moles of GSH formed/min/mg protein.
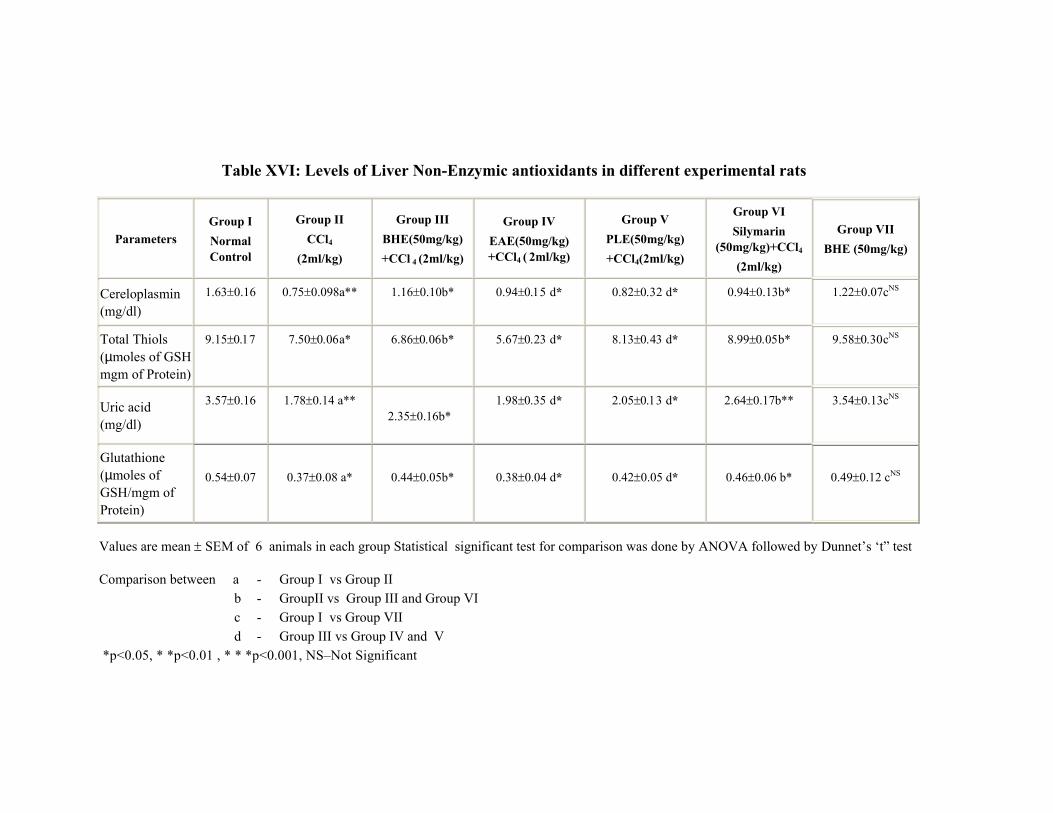
Table XVI: Levels of Liver Non-Enzymic antioxidants in different experimental rats
Parameters Group I Normal Control
Group II CCl4
(2ml/kg)
Group III BHE(50mg/kg) +CCl 4 (2ml/kg)
Group IV EAE(50mg/kg) +CCl4 ( 2ml/kg)
Group V PLE(50mg/kg) +CCl4(2ml/kg)
Group VI Silymarin
(50mg/kg)+CCl4 (2ml/kg)
Group VII BHE (50mg/kg)
Cereloplasmin (mg/dl)
1.63±0.16 0.75±0.098a** 1.16±0.10b* 0.94±0.15 d* 0.82±0.32 d* 0.94±0.13b* 1.22±0.07cNS
Total Thiols (µmoles of GSH mgm of Protein)
9.15±0.17 7.50±0.06a* 6.86±0.06b*
5.67±0.23 d* 8.13±0.43 d* 8.99±0.05b*
9.58±0.30cNS
Uric acid (mg/dl)
3.57±0.16 1.78±0.14 a** 2.35±0.16b*
1.98±0.35 d* 2.05±0.13 d* 2.64±0.17b** 3.54±0.13cNS
Glutathione (µmoles of GSH/mgm of Protein)
0.54±0.07
0.37±0.08 a*
0.44±0.05b*
0.38±0.04 d*
0.42±0.05 d*
0.46±0.06 b*
0.49±0.12 cNS
Values are mean ± SEM of 6 animals in each group Statistical significant test for comparison was done by ANOVA followed by Dunnet’s ‘t” test
Comparison between a - Group I vs Group II b - GroupII vs Group III and Group VI c - Group I vs Group VII d - Group III vs Group IV and V
*p<0.05, * *p<0.01 , * * *p<0.001, NS–Not Significant
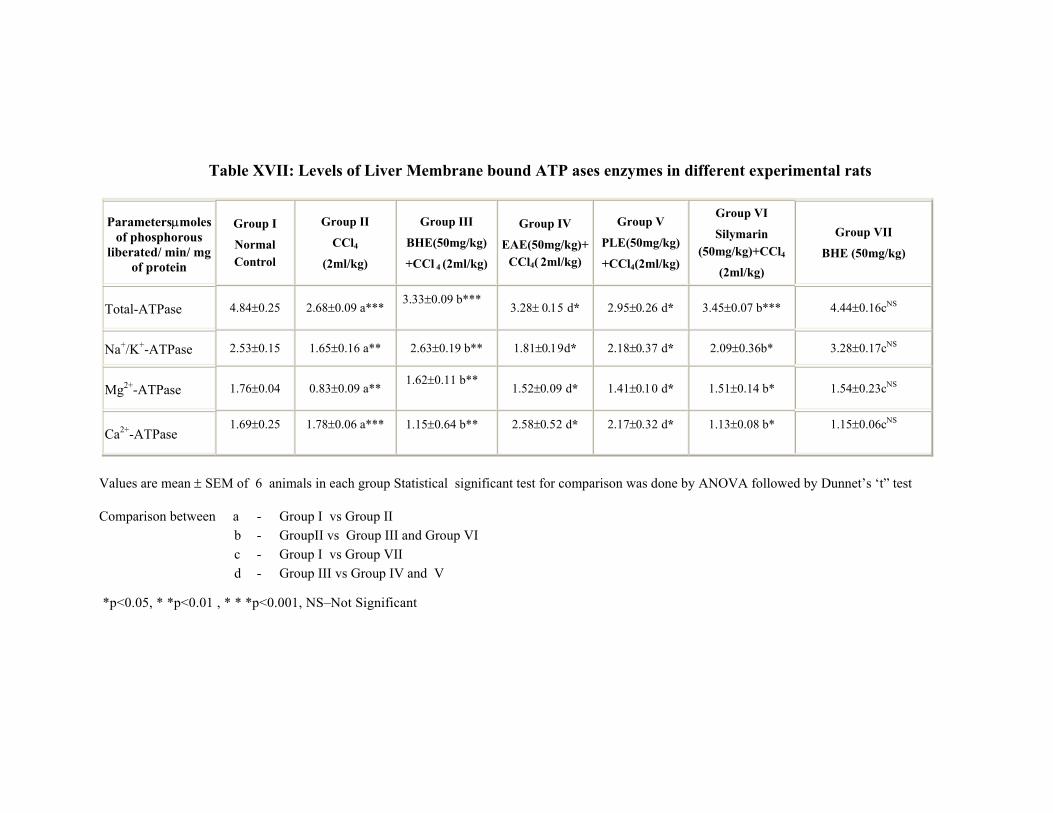
Table XVII: Levels of Liver Membrane bound ATP ases enzymes in different experimental rats
Parametersµmoles of phosphorous
liberated/ min/ mg of protein
Group I Normal Control
Group II CCl4
(2ml/kg)
Group III BHE(50mg/kg) +CCl 4 (2ml/kg)
Group IV EAE(50mg/kg)+
CCl4( 2ml/kg)
Group V PLE(50mg/kg) +CCl4(2ml/kg)
Group VI Silymarin
(50mg/kg)+CCl4 (2ml/kg)
Group VII BHE (50mg/kg)
Total-ATPase 4.84±0.25 2.68±0.09 a*** 3.33±0.09 b***
3.28± 0.15 d* 2.95±0.26 d* 3.45±0.07 b*** 4.44±0.16cNS
Na+/K+-ATPase 2.53±0.15 1.65±0.16 a** 2.63±0.19 b** 1.81±0.19d* 2.18±0.37 d* 2.09±0.36b* 3.28±0.17cNS
Mg2+-ATPase 1.76±0.04 0.83±0.09 a** 1.62±0.11 b**
1.52±0.09 d* 1.41±0.10 d* 1.51±0.14 b* 1.54±0.23cNS
Ca2+-ATPase 1.69±0.25 1.78±0.06 a*** 1.15±0.64 b**
2.58±0.52 d* 2.17±0.32 d* 1.13±0.08 b* 1.15±0.06cNS
Values are mean ± SEM of 6 animals in each group Statistical significant test for comparison was done by ANOVA followed by Dunnet’s ‘t” test
Comparison between a - Group I vs Group II b - GroupII vs Group III and Group VI c - Group I vs Group VII d - Group III vs Group IV and V
*p<0.05, * *p<0.01 , * * *p<0.001, NS–Not Significant
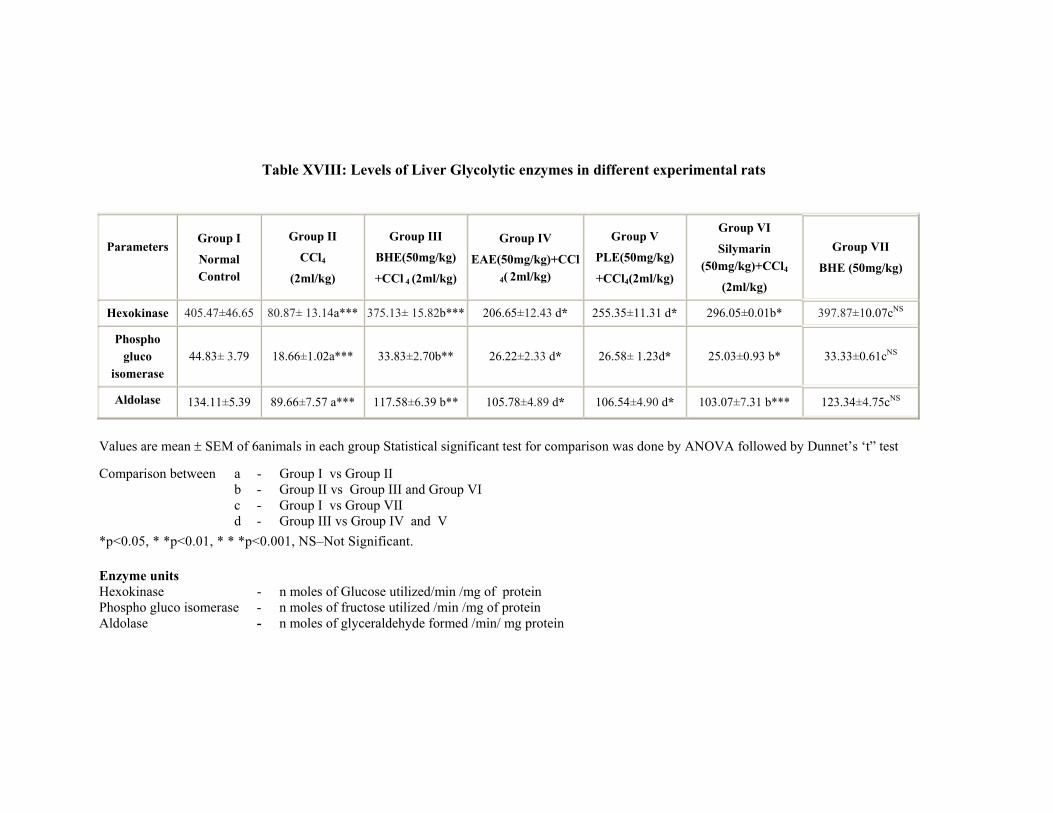
Table XVIII: Levels of Liver Glycolytic enzymes in different experimental rats
Parameters
Group I
Normal Control
Group II
CCl4
(2ml/kg)
Group III
BHE(50mg/kg)
+CCl 4 (2ml/kg)
Group IV
EAE(50mg/kg)+CCl4( 2ml/kg)
Group V
PLE(50mg/kg)
+CCl4(2ml/kg)
Group VI
Silymarin (50mg/kg)+CCl4
(2ml/kg)
Group VII
BHE (50mg/kg)
Hexokinase 405.47±46.65 80.87± 13.14a*** 375.13± 15.82b*** 206.65±12.43 d* 255.35±11.31 d* 296.05±0.01b* 397.87±10.07cNS
Phospho gluco
isomerase 44.83± 3.79 18.66±1.02a*** 33.83±2.70b** 26.22±2.33 d* 26.58± 1.23d* 25.03±0.93 b* 33.33±0.61cNS
Aldolase 134.11±5.39 89.66±7.57 a*** 117.58±6.39 b** 105.78±4.89 d* 106.54±4.90 d* 103.07±7.31 b*** 123.34±4.75cNS
Values are mean ± SEM of 6animals in each group Statistical significant test for comparison was done by ANOVA followed by Dunnet’s ‘t” test Comparison between a - Group I vs Group II
b - Group II vs Group III and Group VI c - Group I vs Group VII d - Group III vs Group IV and V
*p<0.05, * *p<0.01, * * *p<0.001, NS–Not Significant. Enzyme units Hexokinase - n moles of Glucose utilized/min /mg of protein Phospho gluco isomerase - n moles of fructose utilized /min /mg of protein Aldolase - n moles of glyceraldehyde formed /min/ mg protein
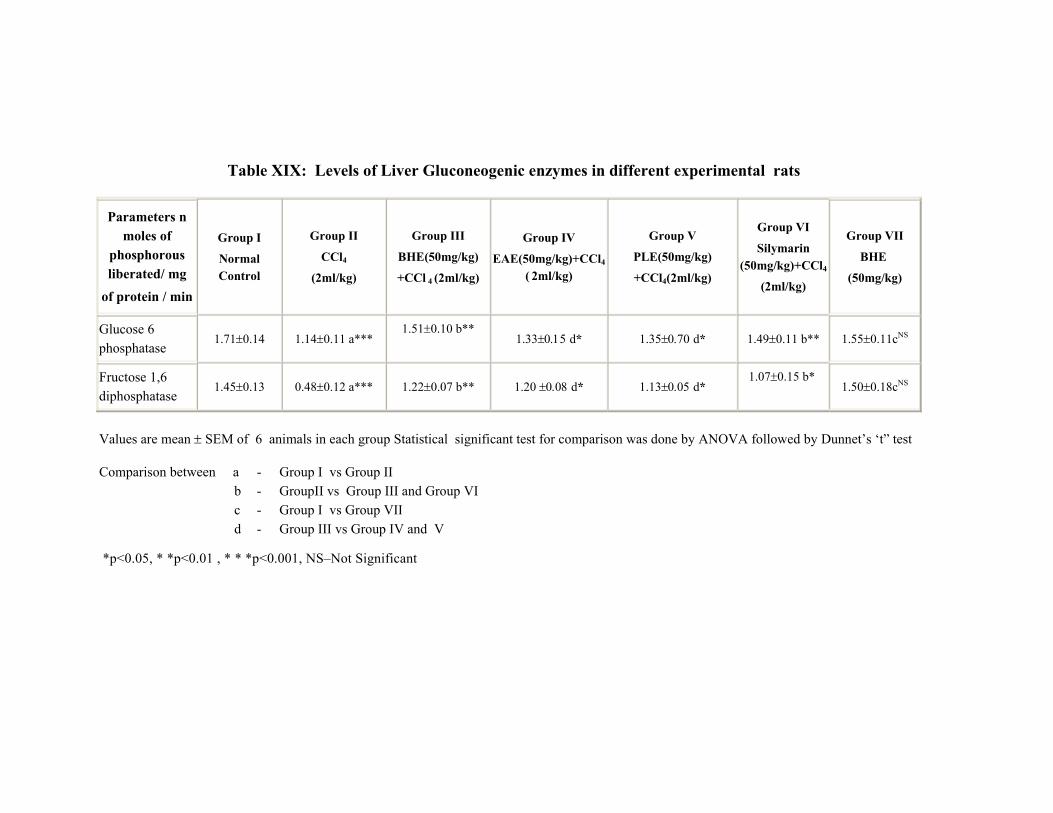
Table XIX: Levels of Liver Gluconeogenic enzymes in different experimental rats
Parameters n moles of
phosphorous liberated/ mg
of protein / min
Group I
Normal Control
Group II
CCl4
(2ml/kg)
Group III
BHE(50mg/kg)
+CCl 4 (2ml/kg)
Group IV
EAE(50mg/kg)+CCl4
( 2ml/kg)
Group V
PLE(50mg/kg)
+CCl4(2ml/kg)
Group VI
Silymarin (50mg/kg)+CCl4
(2ml/kg)
Group VII
BHE
(50mg/kg)
Glucose 6 phosphatase
1.71±0.14 1.14±0.11 a*** 1.51±0.10 b**
1.33±0.15 d* 1.35±0.70 d* 1.49±0.11 b** 1.55±0.11cNS
Fructose 1,6 diphosphatase
1.45±0.13 0.48±0.12 a*** 1.22±0.07 b** 1.20 ±0.08 d* 1.13±0.05 d* 1.07±0.15 b*
1.50±0.18cNS
Values are mean ± SEM of 6 animals in each group Statistical significant test for comparison was done by ANOVA followed by Dunnet’s ‘t” test
Comparison between a - Group I vs Group II b - GroupII vs Group III and Group VI c - Group I vs Group VII d - Group III vs Group IV and V
*p<0.05, * *p<0.01 , * * *p<0.001, NS–Not Significant
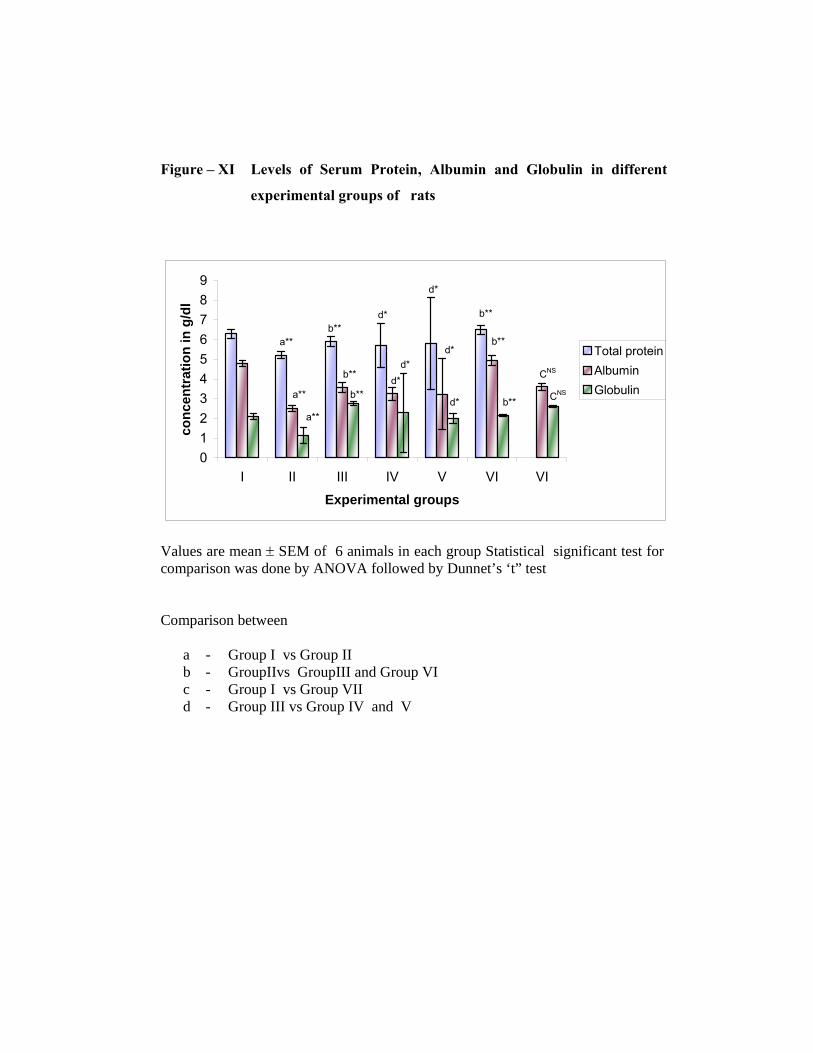
Figure – XI Levels of Serum Protein, Albumin and Globulin in different
experimental groups of rats
0123456789
I II III IV V VI VI
Experimental groups
conc
entr
atio
n in
g/d
l
Total proteinAlbuminGlobulin
a**
a**
a**
b**
b**
b**
d*
d*d*
d*
d*
d*
b**
b**
b**
CNS
CNS
Values are mean ± SEM of 6 animals in each group Statistical significant test for comparison was done by ANOVA followed by Dunnet’s ‘t” test Comparison between
a - Group I vs Group II b - GroupIIvs GroupIII and Group VI c - Group I vs Group VII d - Group III vs Group IV and V
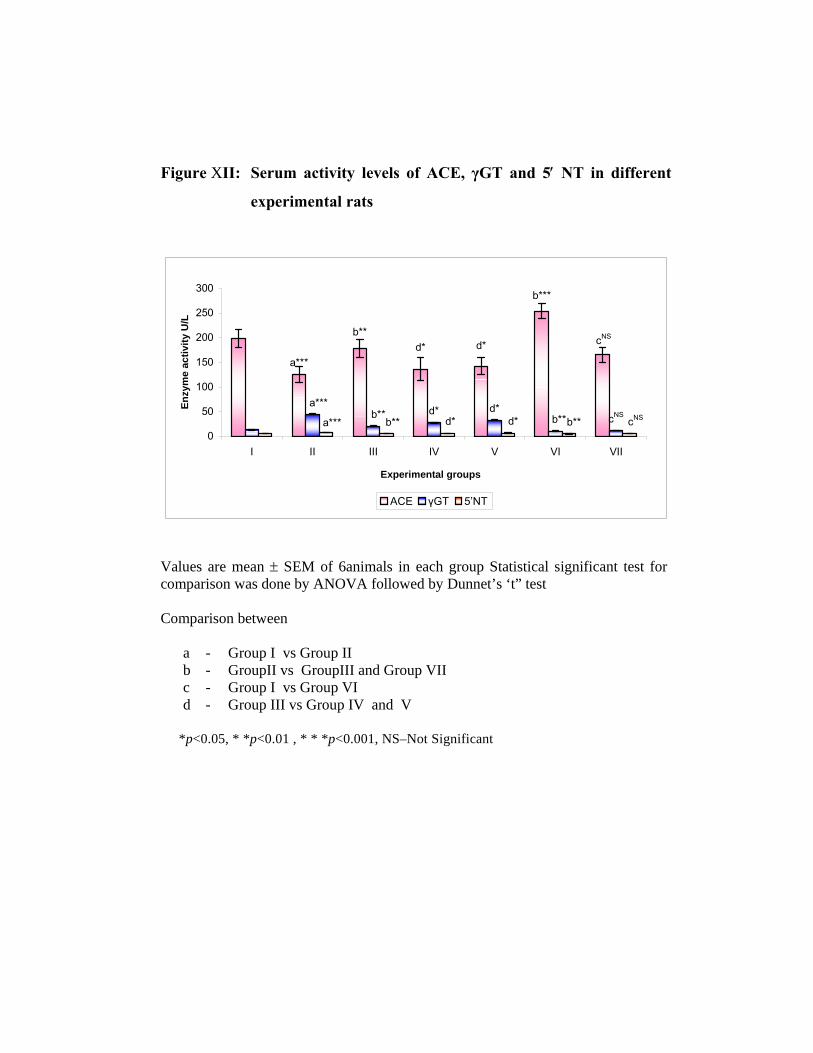
Figure XII: Serum activity levels of ACE, γGT and 5′ NT in different
experimental rats
cNS
b***
d*d*b**
a***
cNSb**d*d*b**
a***
cNSb**d*d*b**a***0
50
100
150
200
250
300
I II III IV V VI VII
Experimental groups
Enzy
me
activ
ity U
/L
ACE γGT 5’NT
Values are mean ± SEM of 6animals in each group Statistical significant test for comparison was done by ANOVA followed by Dunnet’s ‘t” test Comparison between a - Group I vs Group II b - GroupII vs GroupIII and Group VII c - Group I vs Group VI d - Group III vs Group IV and V
*p<0.05, * *p<0.01 , * * *p<0.001, NS–Not Significant
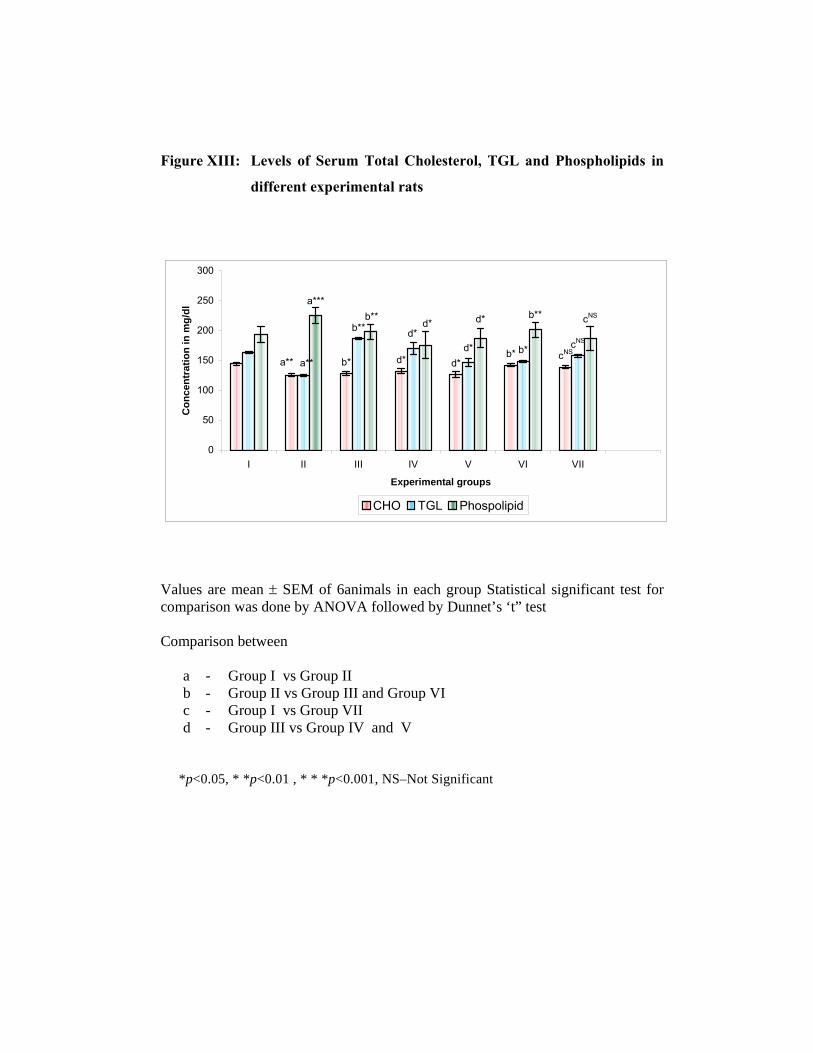
Figure XIII: Levels of Serum Total Cholesterol, TGL and Phospholipids in
different experimental rats
cNSb*d*d*b*a**
cNSb*d*
d*b**
a**
cNSb**d*d*b**
a***
0
50
100
150
200
250
300
I II III IV V VI VII
Experimental groups
Con
cent
ratio
n in
mg/
dl
CHO TGL Phospolipid
Values are mean ± SEM of 6animals in each group Statistical significant test for comparison was done by ANOVA followed by Dunnet’s ‘t” test Comparison between a - Group I vs Group II b - Group II vs Group III and Group VI c - Group I vs Group VII d - Group III vs Group IV and V
*p<0.05, * *p<0.01 , * * *p<0.001, NS–Not Significant
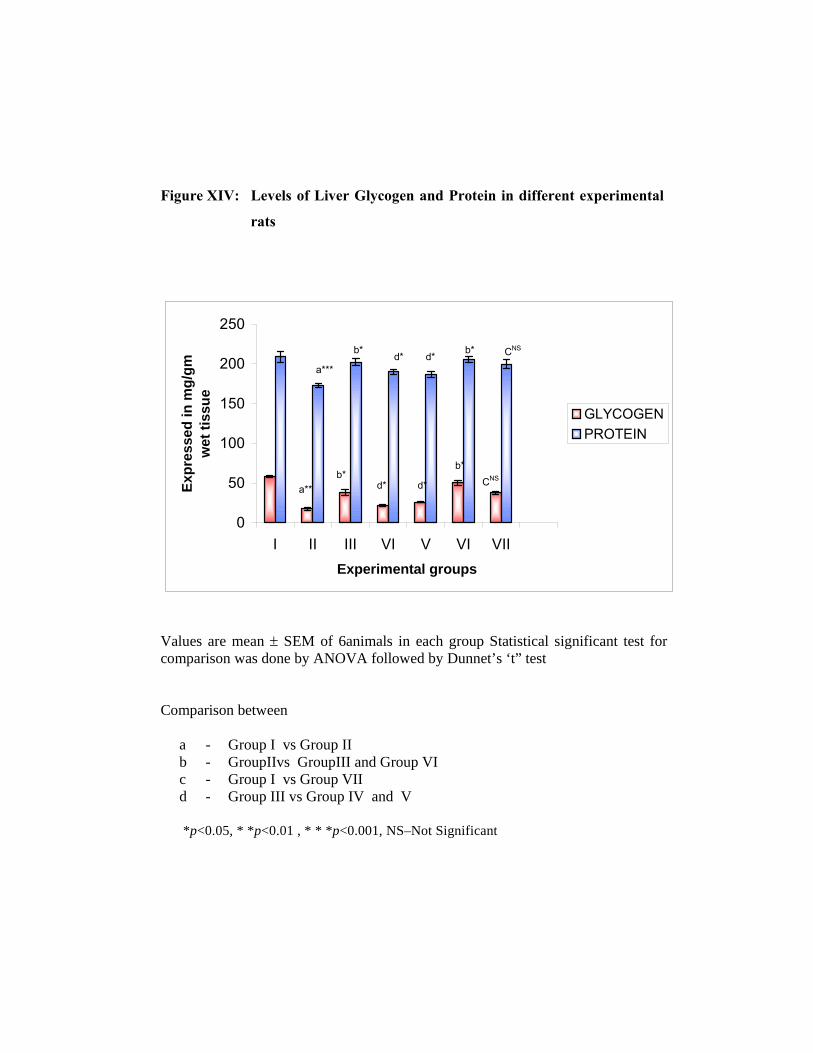
Figure XIV: Levels of Liver Glycogen and Protein in different experimental
rats
0
50
100
150
200
250
I II III VI V VI VIIExperimental groups
Expr
esse
d in
mg/
gm
wet
tiss
ue
GLYCOGENPROTEIN
a***
a**b*
b*
d*
d*
d*
d*
b*
b*
CNS
CNS
Values are mean ± SEM of 6animals in each group Statistical significant test for comparison was done by ANOVA followed by Dunnet’s ‘t” test Comparison between a - Group I vs Group II b - GroupIIvs GroupIII and Group VI c - Group I vs Group VII d - Group III vs Group IV and V
*p<0.05, * *p<0.01 , * * *p<0.001, NS–Not Significant
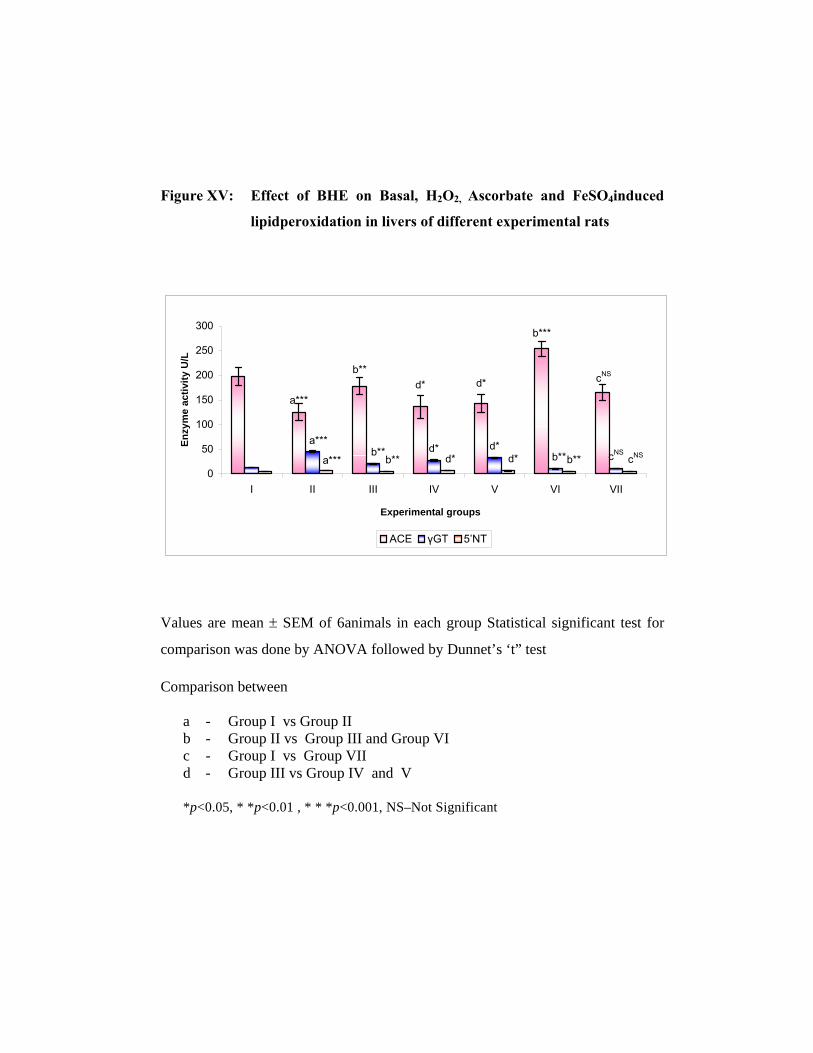
Figure XV: Effect of BHE on Basal, H2O2, Ascorbate and FeSO4induced
lipidperoxidation in livers of different experimental rats
cNS
b***
d*d*b**
a***
cNSb**d*d*b**
a***
cNSb**d*d*b**a***0
50
100
150
200
250
300
I II III IV V VI VII
Experimental groups
Enzy
me
activ
ity U
/L
ACE γGT 5’NT
Values are mean ± SEM of 6animals in each group Statistical significant test for
comparison was done by ANOVA followed by Dunnet’s ‘t” test Comparison between a - Group I vs Group II b - Group II vs Group III and Group VI c - Group I vs Group VII d - Group III vs Group IV and V
*p<0.05, * *p<0.01 , * * *p<0.001, NS–Not Significant
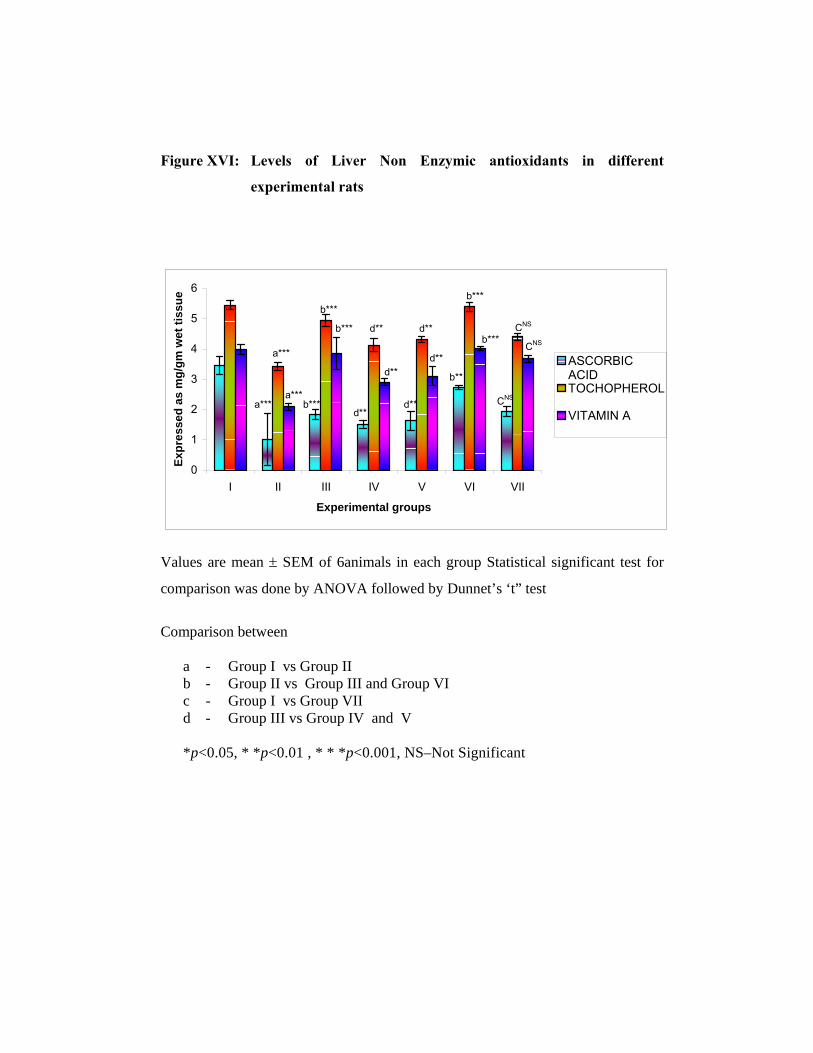
Figure XVI: Levels of Liver Non Enzymic antioxidants in different
experimental rats
0
1
2
3
4
5
6
I II III IV V VI VII
Experimental groups
Expr
esse
d as
mg/
gm w
et ti
ssue
ASCORBICACIDTOCHOPHEROL
VITAMIN A
a***
a***a***
b***
b***
b***
d**
d**
d**
d**
d**
d**
b**
b***
b***
CNS
CNS
CNS
Values are mean ± SEM of 6animals in each group Statistical significant test for
comparison was done by ANOVA followed by Dunnet’s ‘t” test
Comparison between a - Group I vs Group II b - Group II vs Group III and Group VI c - Group I vs Group VII d - Group III vs Group IV and V *p<0.05, * *p<0.01 , * * *p<0.001, NS–Not Significant
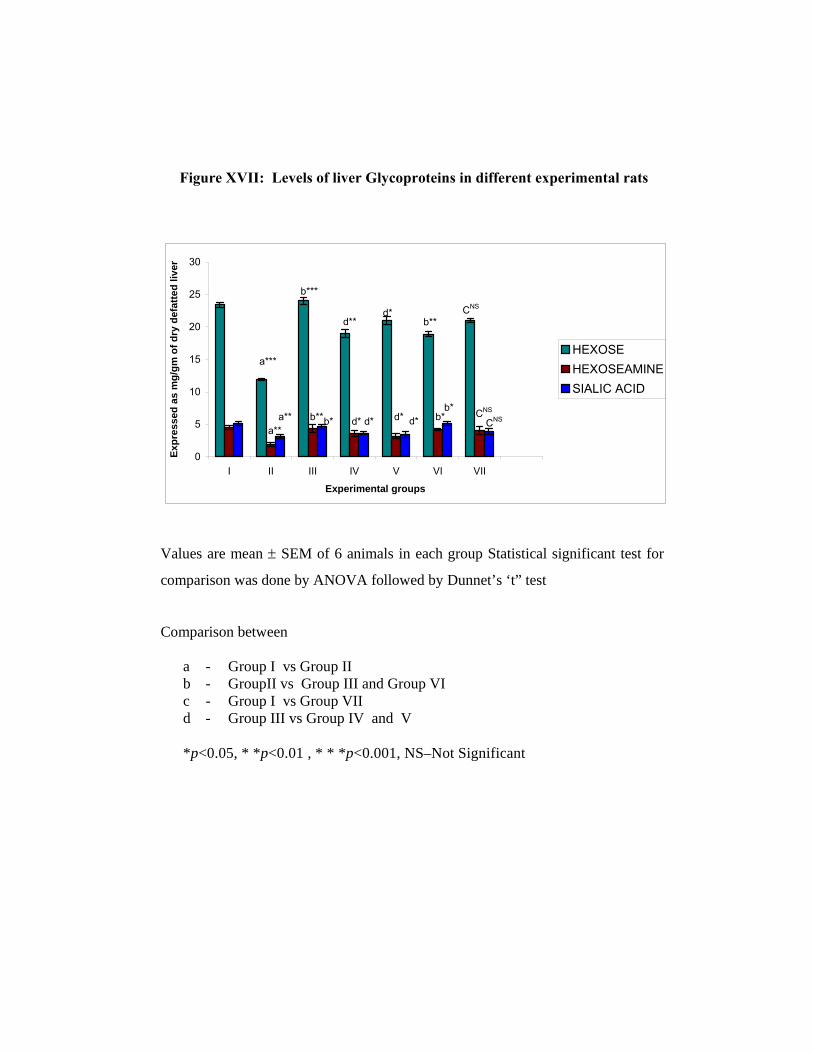
Figure XVII: Levels of liver Glycoproteins in different experimental rats
0
5
10
15
20
25
30
I II III IV V VI VII
Experimental groups
Expr
esse
d as
mg/
gm o
f dry
def
atte
d liv
er
HEXOSEHEXOSEAMINESIALIC ACID
a***
a**a**
b***
b**b*
d**
d* d*
d*
d* d*
b**
b*b*
CNS
CNS
CNS
Values are mean ± SEM of 6 animals in each group Statistical significant test for
comparison was done by ANOVA followed by Dunnet’s ‘t” test
Comparison between a - Group I vs Group II b - GroupII vs Group III and Group VI c - Group I vs Group VII d - Group III vs Group IV and V
*p<0.05, * *p<0.01 , * * *p<0.001, NS–Not Significant
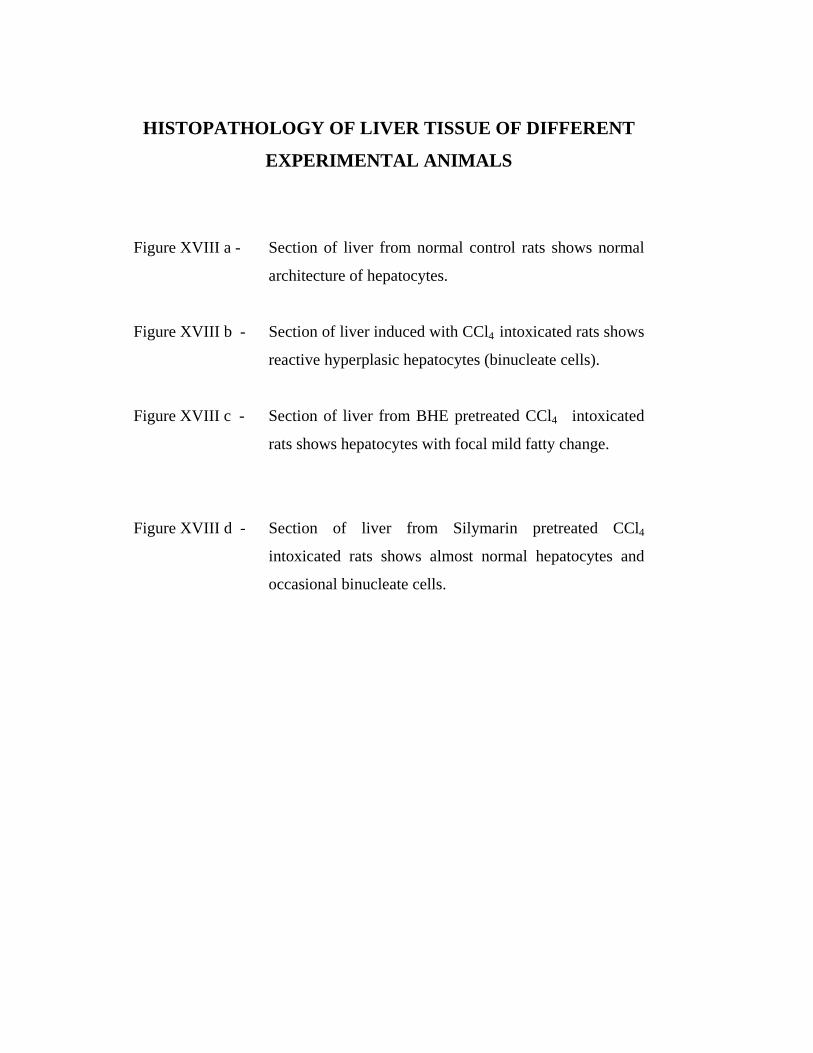
HISTOPATHOLOGY OF LIVER TISSUE OF DIFFERENT
EXPERIMENTAL ANIMALS
Figure XVIII a - Section of liver from normal control rats shows normal
architecture of hepatocytes.
Figure XVIII b - Section of liver induced with CCl4 intoxicated rats shows
reactive hyperplasic hepatocytes (binucleate cells).
Figure XVIII c - Section of liver from BHE pretreated CCl4 intoxicated
rats shows hepatocytes with focal mild fatty change.
Figure XVIII d - Section of liver from Silymarin pretreated CCl4
intoxicated rats shows almost normal hepatocytes and
occasional binucleate cells.
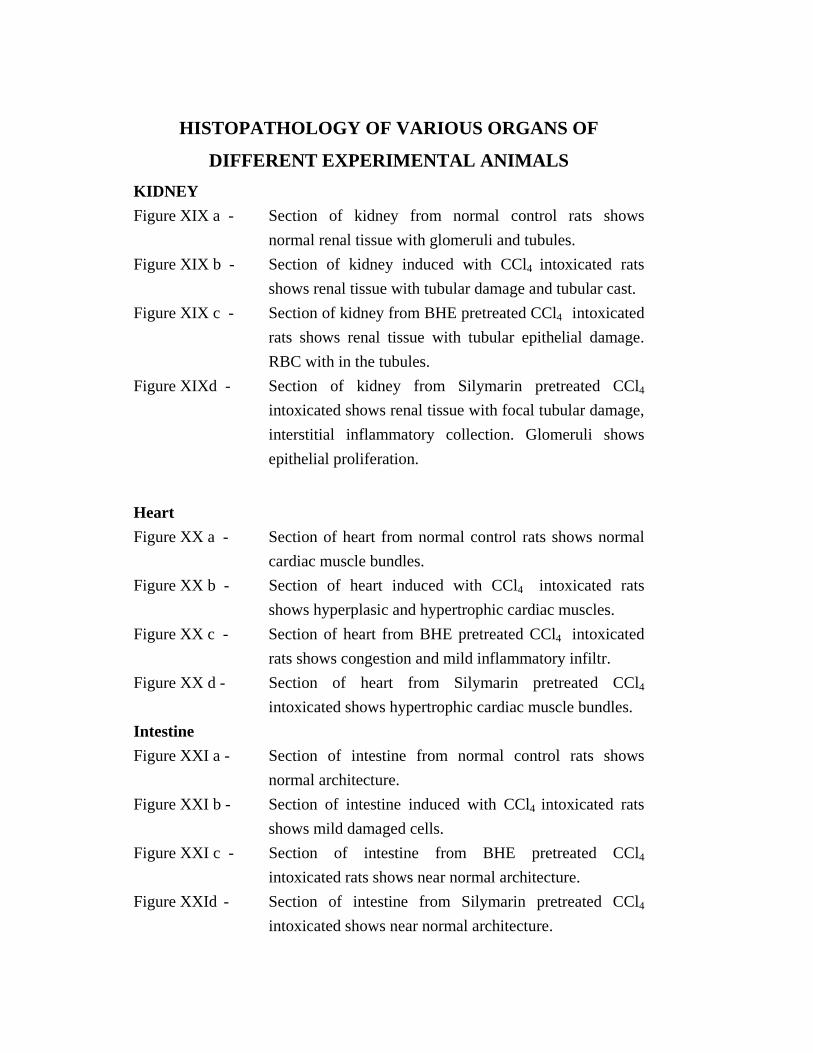
HISTOPATHOLOGY OF VARIOUS ORGANS OF
DIFFERENT EXPERIMENTAL ANIMALS
KIDNEY Figure XIX a - Section of kidney from normal control rats shows
normal renal tissue with glomeruli and tubules. Figure XIX b - Section of kidney induced with CCl4 intoxicated rats
shows renal tissue with tubular damage and tubular cast. Figure XIX c - Section of kidney from BHE pretreated CCl4 intoxicated
rats shows renal tissue with tubular epithelial damage. RBC with in the tubules.
Figure XIXd - Section of kidney from Silymarin pretreated CCl4 intoxicated shows renal tissue with focal tubular damage, interstitial inflammatory collection. Glomeruli shows epithelial proliferation.
Heart Figure XX a - Section of heart from normal control rats shows normal
cardiac muscle bundles. Figure XX b - Section of heart induced with CCl4 intoxicated rats
shows hyperplasic and hypertrophic cardiac muscles. Figure XX c - Section of heart from BHE pretreated CCl4 intoxicated
rats shows congestion and mild inflammatory infiltr. Figure XX d - Section of heart from Silymarin pretreated CCl4
intoxicated shows hypertrophic cardiac muscle bundles. Intestine Figure XXI a - Section of intestine from normal control rats shows
normal architecture. Figure XXI b - Section of intestine induced with CCl4 intoxicated rats
shows mild damaged cells. Figure XXI c - Section of intestine from BHE pretreated CCl4
intoxicated rats shows near normal architecture. Figure XXId - Section of intestine from Silymarin pretreated CCl4
intoxicated shows near normal architecture.

Figure XVIII: Histopathology of Liver tissues of different
experimental animals
Normal CCl 4
[a] [b]
BHE Standard
[c] [d]
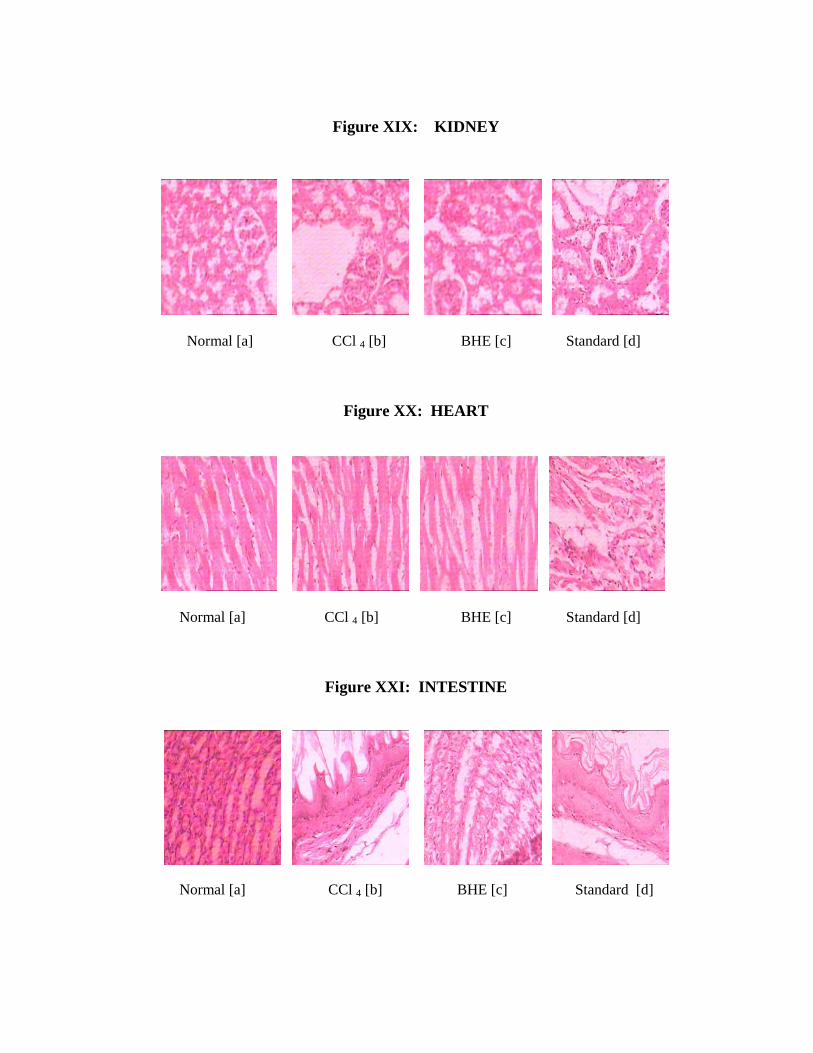
Figure XIX: KIDNEY
Normal [a] CCl 4 [b] BHE [c] Standard [d]
Figure XX: HEART
Normal [a] CCl 4 [b] BHE [c] Standard [d]
Figure XXI: INTESTINE
Normal [a] CCl 4 [b] BHE [c] Standard [d]
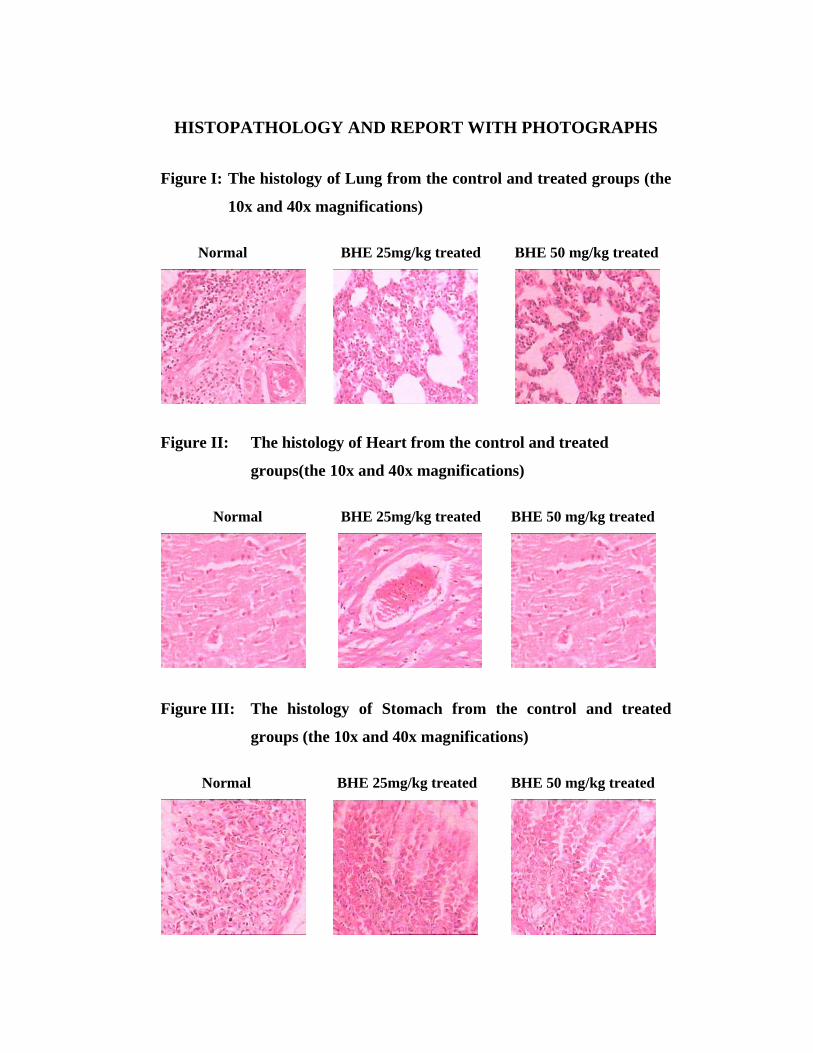
HISTOPATHOLOGY AND REPORT WITH PHOTOGRAPHS
Figure I: The histology of Lung from the control and treated groups (the
10x and 40x magnifications)
Normal BHE 25mg/kg treated BHE 50 mg/kg treated
Figure II: The histology of Heart from the control and treated
groups(the 10x and 40x magnifications)
Normal BHE 25mg/kg treated BHE 50 mg/kg treated
Figure III: The histology of Stomach from the control and treated
groups (the 10x and 40x magnifications)
Normal BHE 25mg/kg treated BHE 50 mg/kg treated
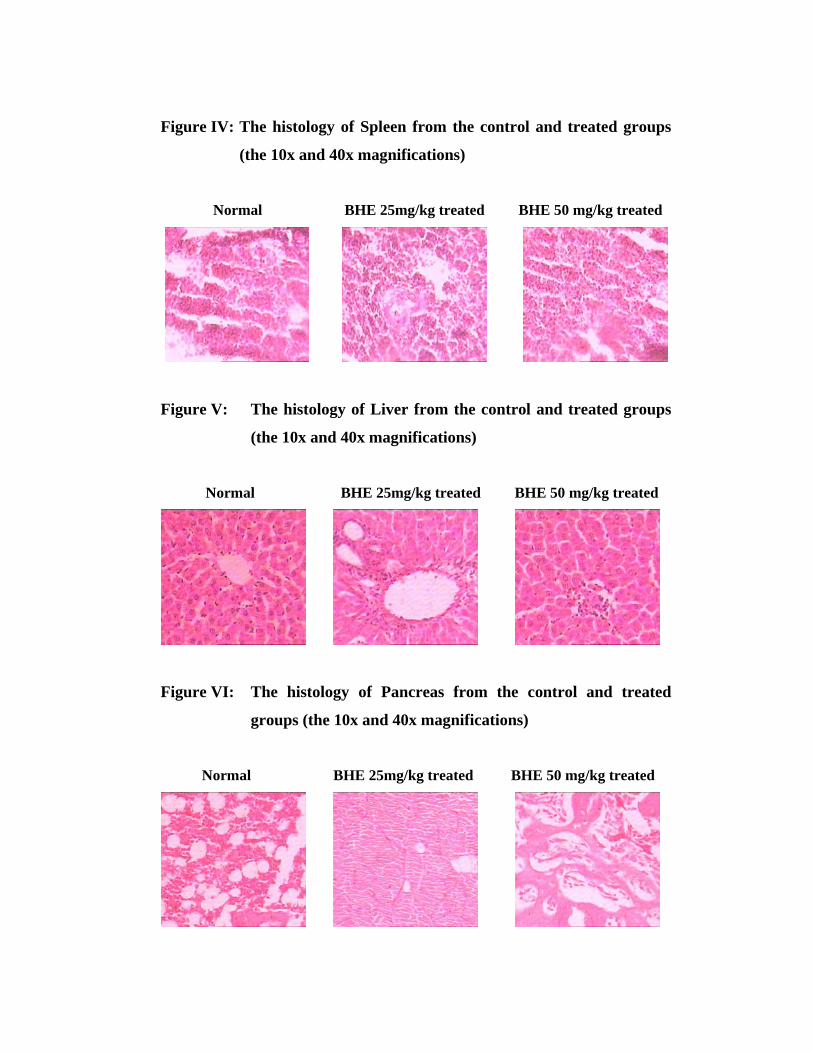
Figure IV: The histology of Spleen from the control and treated groups
(the 10x and 40x magnifications)
Normal BHE 25mg/kg treated BHE 50 mg/kg treated
Figure V: The histology of Liver from the control and treated groups
(the 10x and 40x magnifications)
Normal BHE 25mg/kg treated BHE 50 mg/kg treated
Figure VI: The histology of Pancreas from the control and treated
groups (the 10x and 40x magnifications)
Normal BHE 25mg/kg treated BHE 50 mg/kg treated
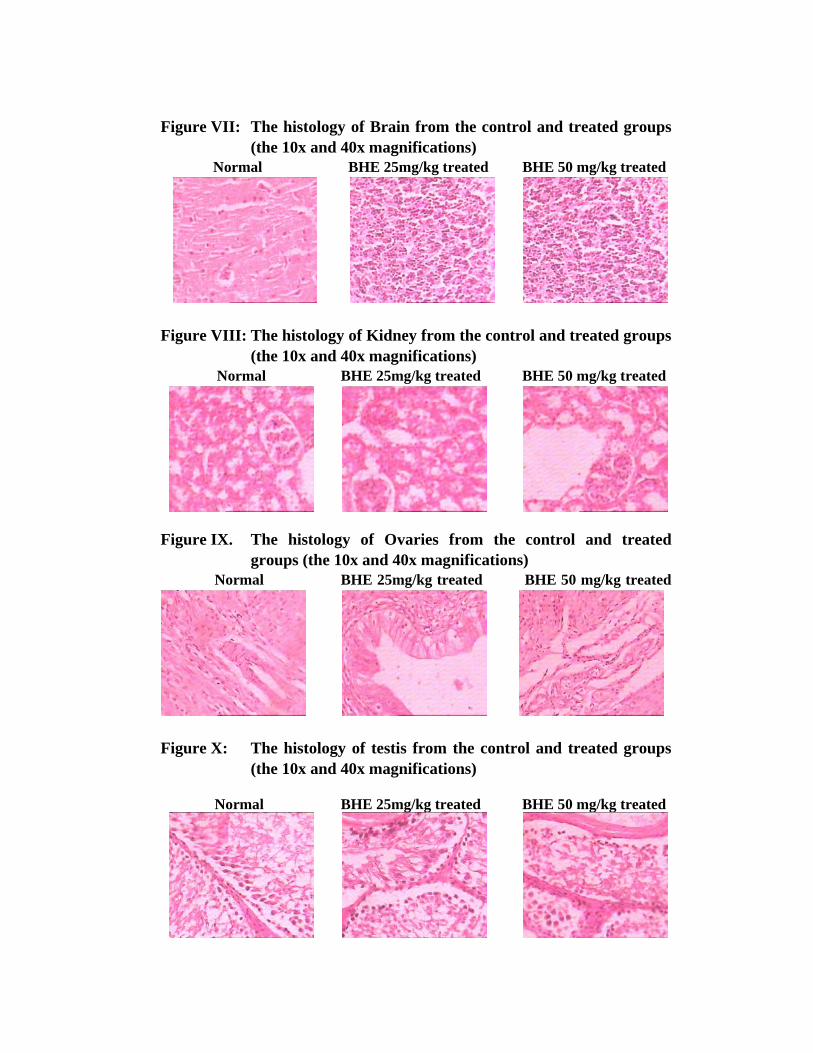
Figure VII: The histology of Brain from the control and treated groups (the 10x and 40x magnifications)
Normal BHE 25mg/kg treated BHE 50 mg/kg treated
Figure VIII: The histology of Kidney from the control and treated groups
(the 10x and 40x magnifications) Normal BHE 25mg/kg treated BHE 50 mg/kg treated
Figure IX. The histology of Ovaries from the control and treated groups (the 10x and 40x magnifications)
Normal BHE 25mg/kg treated BHE 50 mg/kg treated
Figure X: The histology of testis from the control and treated groups (the 10x and 40x magnifications)
Normal BHE 25mg/kg treated BHE 50 mg/kg treated
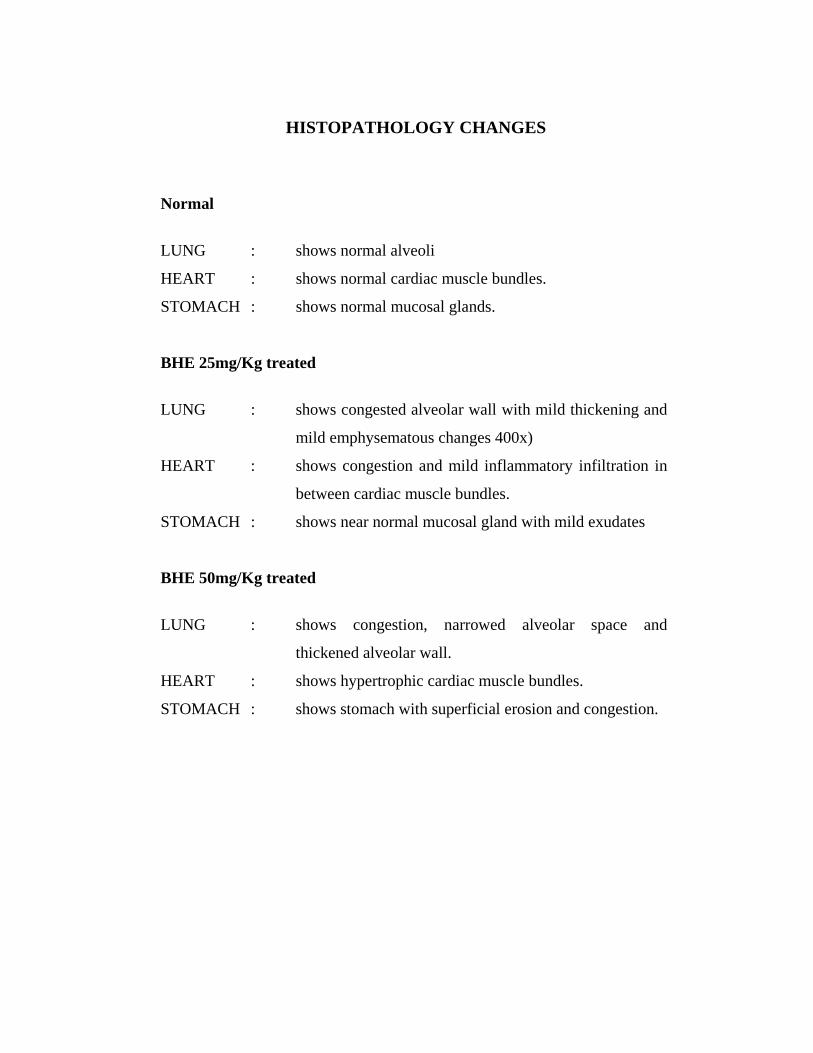
HISTOPATHOLOGY CHANGES
Normal
LUNG : shows normal alveoli
HEART : shows normal cardiac muscle bundles.
STOMACH : shows normal mucosal glands.
BHE 25mg/Kg treated
LUNG : shows congested alveolar wall with mild thickening and
mild emphysematous changes 400x)
HEART : shows congestion and mild inflammatory infiltration in
between cardiac muscle bundles.
STOMACH : shows near normal mucosal gland with mild exudates
BHE 50mg/Kg treated
LUNG : shows congestion, narrowed alveolar space and
thickened alveolar wall.
HEART : shows hypertrophic cardiac muscle bundles.
STOMACH : shows stomach with superficial erosion and congestion.
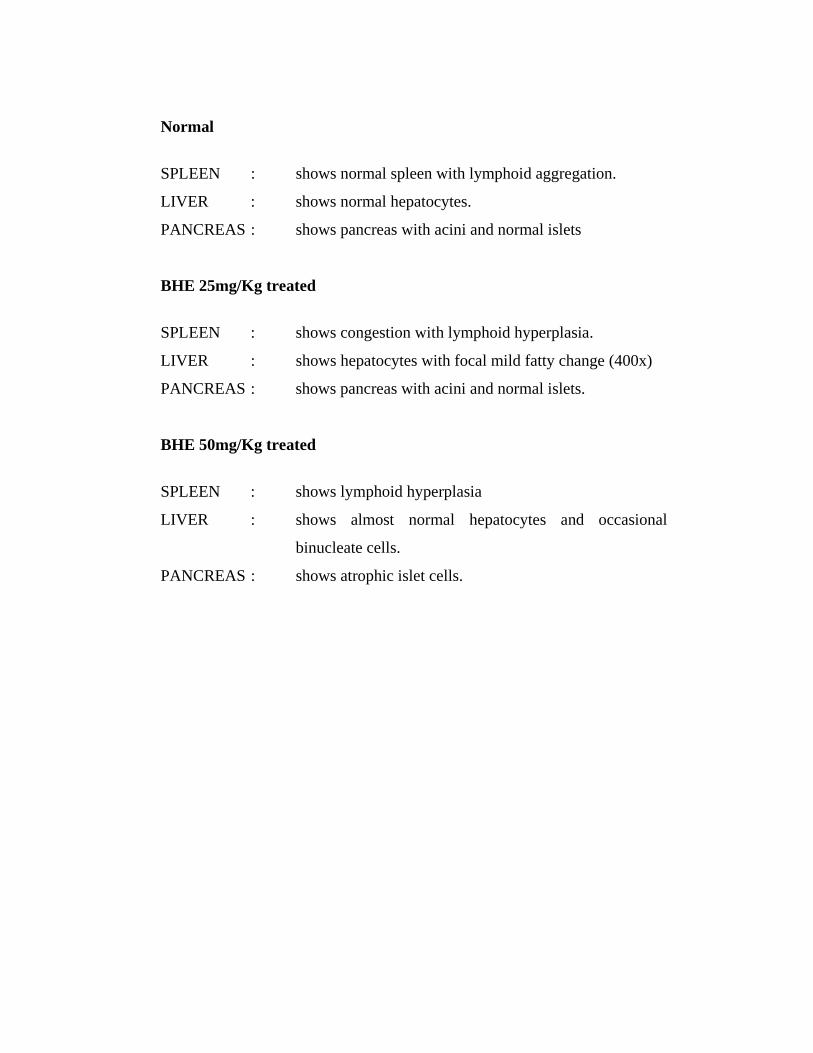
Normal
SPLEEN : shows normal spleen with lymphoid aggregation.
LIVER : shows normal hepatocytes.
PANCREAS : shows pancreas with acini and normal islets
BHE 25mg/Kg treated
SPLEEN : shows congestion with lymphoid hyperplasia.
LIVER : shows hepatocytes with focal mild fatty change (400x)
PANCREAS : shows pancreas with acini and normal islets.
BHE 50mg/Kg treated
SPLEEN : shows lymphoid hyperplasia
LIVER : shows almost normal hepatocytes and occasional
binucleate cells.
PANCREAS : shows atrophic islet cells.
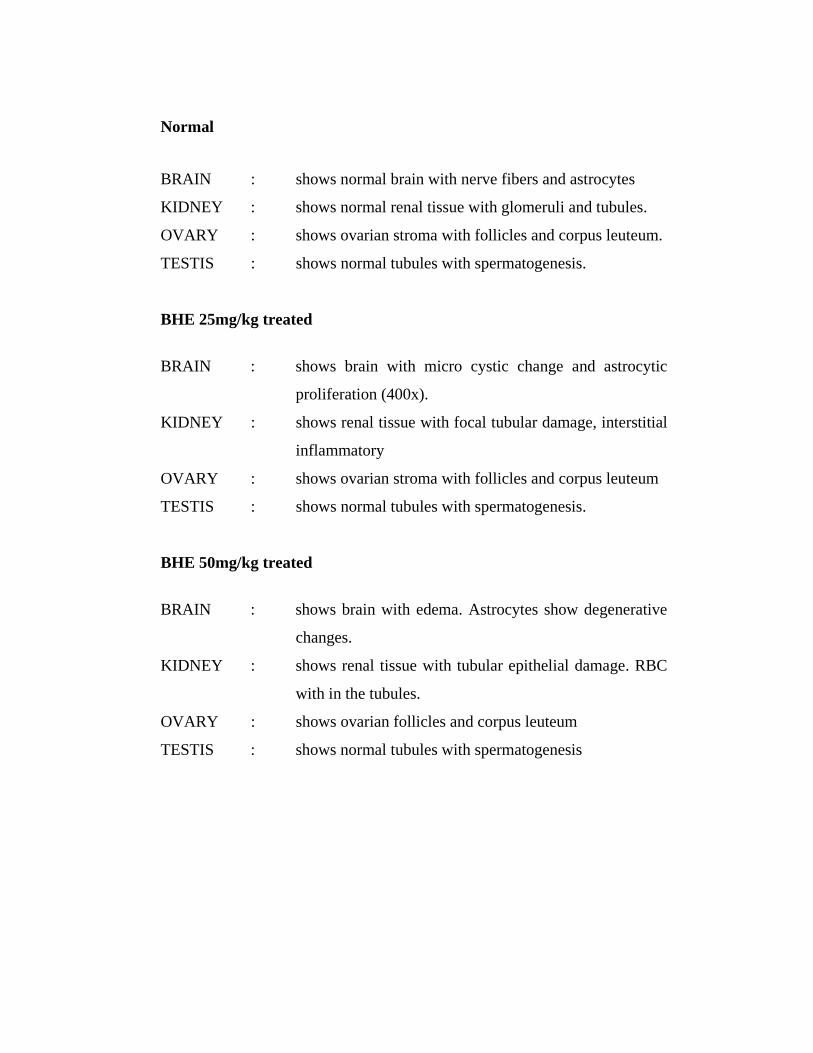
Normal
BRAIN : shows normal brain with nerve fibers and astrocytes
KIDNEY : shows normal renal tissue with glomeruli and tubules.
OVARY : shows ovarian stroma with follicles and corpus leuteum.
TESTIS : shows normal tubules with spermatogenesis.
BHE 25mg/kg treated
BRAIN : shows brain with micro cystic change and astrocytic
proliferation (400x).
KIDNEY : shows renal tissue with focal tubular damage, interstitial
inflammatory
OVARY : shows ovarian stroma with follicles and corpus leuteum
TESTIS : shows normal tubules with spermatogenesis.
BHE 50mg/kg treated
BRAIN : shows brain with edema. Astrocytes show degenerative
changes.
KIDNEY : shows renal tissue with tubular epithelial damage. RBC
with in the tubules.
OVARY : shows ovarian follicles and corpus leuteum
TESTIS : shows normal tubules with spermatogenesis
RESEARCH PUBLICATIONS
JOURNALS :
International - 4
1. Hepatoprotective activity of methanolic polyherbal extract on ccl4 –
induced hepatic damage in rats in the Journal Biomedicine Vol. 27,
No.2, 2007, Page No. 53-56.
2. Hepatoprotective activity Bi- herbal ethanolic extract onCCL4 induced
hepatic damage in rats. African Journal of Biochemistry Research
Vol.2 (2), pp. 061-065, February 2008.
3. Antioxidant and antihepatotoxic activity of ethanolic biherbal crude
extracts of Eclipta alba and piper longum, in the Journal Biomedicine
Vol. 28, No.1, 2008, Page No. 39-42.
4. Hepatoprotective activity Bi- herbal ethanolic extract onCCL4 induced
hepatic damage in rats. Asian Journal of Biochemistry, 2008, 1-7.