the tectonic history of the tasman sea: a puzzle with 13...
TRANSCRIPT
JOURNAL OF GEOPHYSICAL RESEARCH, VOL. 103, NO. B6, PAGES 12,413-12,433, JUNE 10, 1998
The tectonic history of the Tasman Sea: A puzzle with 13 pieces
Carmen Gaina, • Dietmar R. Mtiller, • Jean-Yves Royer,: Joann Stock, 3 Jeanne Hardebeck, 3 and Phil Symonds 4
Abstract. We present a new model for the tectonic evolution of the Tasman Sea based on dense satellite altimetry data and a new shipboard data set. We utilized a combined set of revised magnetic anomaly and fracture zone interpretations to calculate relative motions and their uncertainties between the Australian and the Lord Howe Rise plates from 73.6 Ma to 52 Ma when spreading ceased. From chron 31 (67.7 Ma) to chron 29 (64.0 Ma) the model implies transpression between the Chesterfield and the Marion plateaus, followed by strike-slip motion. This transpression may have been responsible for the formation of the Capricorn Basin south of the Marion Plateau. Another major tectonic event took place at chron 27 (61.2 Ma), when a counterclockwise change in spreading direction occurred, contemporaneous with a similar event in the southwest Pacific Ocean. The early opening of the Tasman Sea cannot be modeled by a simple two-plate system because (1) rifting in this basin propagated from south to north in several stages and (2) several rifts failed. We identified 13 continental blocks which acted as microplates between 90 Ma and 64 Ma. Our model is constrained by tectonic lineaments visible in the gravity anomaly grid and interpreted as strike-slip faults, by magnetic anomaly, bathymetry and seismic data, and in case of the South Tasman Rise, by the age and affinity of dredged rocks. By combining all this information we derived finite rotations that describe the dispersal of these tectonic elements during the early opening of the Tasman Sea.
1. Introduction
About two decades ago the opening of the Tasman Sea was modeled by several authors as a simple two-plate spreading system, active between chron 33old (80 Ma) and post-chron 24 (52 Ma). New geophysical data, however, offer an opportunity for reconstructing the tectonic history of the Tasman Sea in much more detail than previously possible. We present a new tectonic model based on gravity anomaly data derived from satellite altimetry and on both existing and new magnetic data, as well as on seismic and geological data.
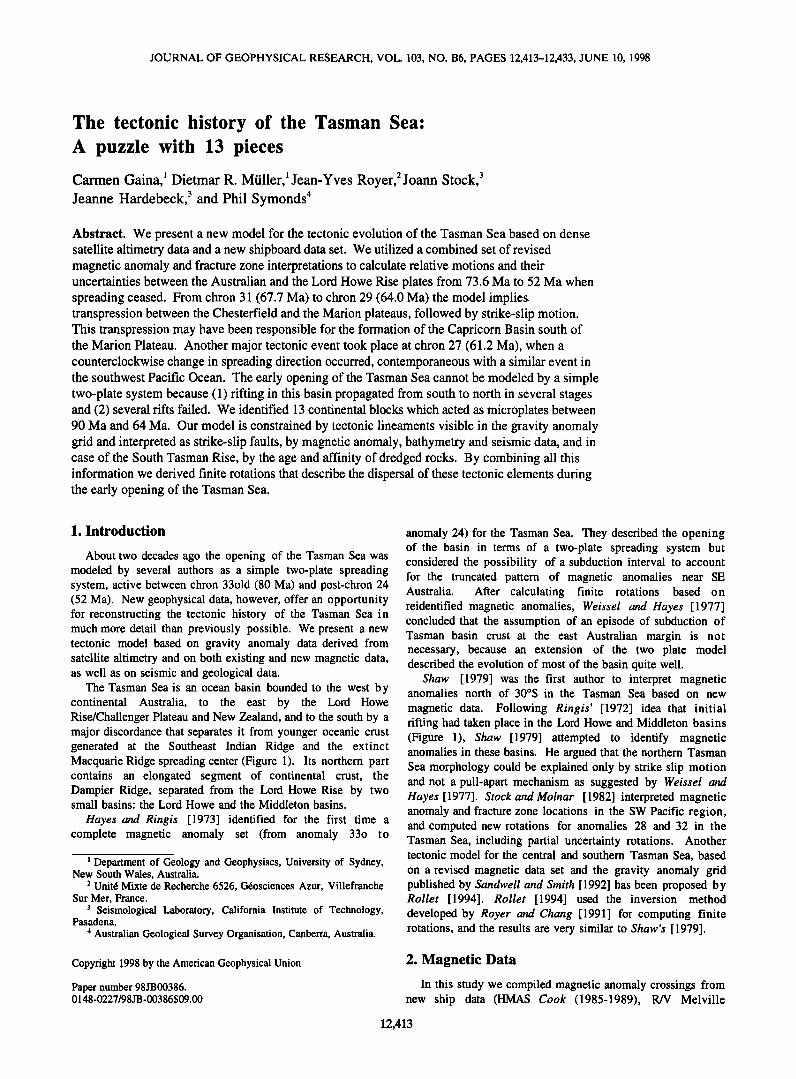
The Tasman Sea is an ocean basin bounded to the west by continental Australia, to the east by the Lord Howe Rise/Challenger Plateau and New Zealand, and to the south by a major discordance that separates it from younger oceanic crust generated at the Southeast Indian Ridge and the extinct Macquarie Ridge spreading center (Figure 1). Its northern part contains an elongated segment of continental crust, the Dampier Ridge, separated from the Lord Howe Rise by two small basins: the Lord Howe and the Middleton basins.
Hayes and Ringis [1973] identified for the first time a complete magnetic anomaly set (from anomaly 330 to
• Department of Geology and Geophysiscs, University of Sydney, New South Wales, Australia.
2 Unit6 Mixte de Recherche 6526, G6osciences Azur, Villefranche Sur Mer, France.
3 Seismological Laboratory, California Institute of Technology, Pasadena.
4 Australian Geological Survey Organisation, Canberra, Australia.
Copyright 1998 by the American Geophysical Union
Paper number 98JB00386. 0148-0227/98 JB-00386509.00
anomaly 24) for the Tasman Sea. They described the opening of the basin in terms of a two-plate spreading system but considered the possibility of a subduction interval to account for the truncated pattern of magnetic anomalies near SE Australia. After calculating finite rotations based on reidentified magnetic anomalies, Weissel and Hayes [1977] concluded that the assumption of an episode of subduction of Tasman basin crust at the east Australian margin is not necessary, because an extension of the two plate model described the evolution of most of the basin quite well.
Shaw [1979] was the first author to interpret magnetic anomalies north of 30øS in the Tasman Sea based on new
magnetic data. Following Ringis' [1972] idea that initial rifting had taken place in the Lord Howe and Middleton basins (Figure 1), Shaw [1979] attempted to identify magnetic anomalies in these basins. He argued that the northern Tasman Sea morphology could be explained only by strike slip motion and not a pull-apart mechanism as suggested by Weissel and Hayes [1977]. Stock and Molnar [1982] interpreted magnetic anomaly and fracture zone locations in the SW Pacific region, and computed new rotations for anomalies 28 and 32 in the Tasman Sea, including partial uncertainty rotations. Another tectonic model for the central and southern Tasman Sea, based
on a revised magnetic data set and the gravity anomaly grid published by Sandwell and Smith [1992] has been proposed by Rollet [1994]. Rollet [1994] used the inversion method developed by Royer and Chang [1991] for computing finite rotations, and the results are very similar to Shaw's [1979].
2. Magnetic Data
In this study we compiled magnetic anomaly crossings from new ship data (HMAS Cook (1985-1989), R/V Melville
12,413
12,414 GAINA ET AL.: TECTONIC HISTORY OF THE TASMAN SEA
25 øS
30'S
l
TASMAN SEA
magnetic anomaly • 24o, 28y, 33y, • 25y c• 260, 31y, 34y o 27o, 32y • 29y v 30y
35'S
40'S
45'S
• .
50øS l"_ I I I I I I I I I I I ll 150øE 155•E 160øE 165•E 170øE
Figure 1. Tasman Sea, magnetic anomalies plotted along selected ship tracks. Shaded areas indicate continental crust; AUS, Australia; TAS, Tasmania; LHR, Lord Howe Rise; DR, Dampier Ridge; STR, South Tasman Rise; GSM, Gilbert Seamount Complex; NZ, New Zealand; Chest. P1, Chesterfield Plateau; Chall. P1, Challenger Plateau; Bellona Tr, Bellona Trough; Lord Howe, Lord Howe basin; Middleton, Middleton basin; ETR, East Tasman Plateau; Marion P1, Marion Plateau; dark grey line represents extinct ridge axis. Bold profiles are presented in Figures 3 and 10.
GAINA ET AL.: TECTONIC HISTORY OF THE TASMAN SEA 12,415
sw
extinct ridge axis
bmr14 /• _^ )•, ,•/• I I .I I I I I , I I
• , , ' ' , ; ' ; •; • ,
mv9512 ,',' I • • : ' ; ' • '" I I ' ' ' I I
I I I ' r . ß
' • ' . I
at941
, I !
, - , , , ,, synthetic ! , , ' , , I , '
, ,, , , , : , , profile • t ' I I ., {l I a .
• '.' , , ' •. • , , , ! ' ' { , I ' I I I I • I I , , , , , , , , , , , , , , • • , • , , , , • ',
34y 33o 33 32 31 30 29 28 27 26 25 • • 25 26 27 •29 30 31 32 33 330 •y
4 m•yr q, . 22 mm/yr • 16 •yr • 20 •yr _,.4 mm/yr h•f spread•g ute
83 79,1 I I
Ma
73.6 71.0 67.7 64.0 61.2 55.9 53.3 I I I I I I I
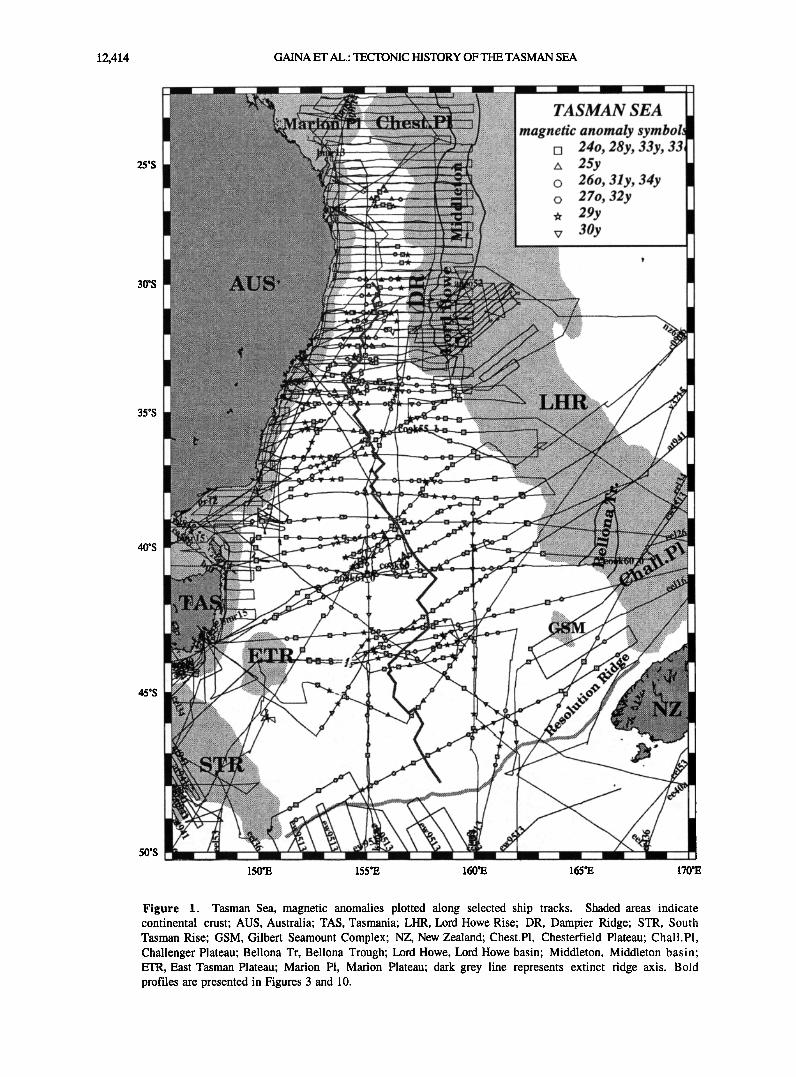
Figure 2. Selected magnetic anomaly profiles of the Tasman Sea compared with synthetic magnetic anomalies (see locations in Figure 1). The synthetic profiles are based on the geomagnetic timescale of Cande and Kent [1995], a depth to the upper surface of the magnetized layer of 3 km, a thickness of the magnetized layer of 1.5 km and an azimuth of 150 ø. The present inclination and declination of the magnetic field were calculated from the IGRF90 reference field and the paleoinclination and paleodeclination were calculated based on the position of the paleomagnetic pole for the Australian plate at 52 Ma [from Irving and Irving, 1982]. Australia's latitudinal position did not change substantially while the Tasman Sea was opening; hence we found that it makes little difference for the phase shift of synthetic magnetic anomalies whether we use a late Cretaceous or an early Tertiary paleomagnetic pole.
(1995), N/O L'Atalante (1994), and R/V Maurice Ewing (1996)) and reinterpreted previously existing data (Figure 1). Using the Cande and Kent [1995] reversal timescale, we identified either young or old ends of magnetic chrons (Figure 2), unlike previous authors who chose the center of magnetic anomalies [Weissel and Hayes, 1977; Shaw, 1979] or only the older ends [Rollet, 1994]. Anomalies on the western flank lie farther from the ridge than corresponding anomalies on the eastern flank. Asymmetry in crustal accretion occurred especially between chron 270 and chron 33y. This observation is mostly based on magnetic data from the central Tasman Sea,
where we were able to identify a considerable number of magnetic anomalies. However, a detailed discussion of spreading asymmetry is beyond the scope of this paper. Special attention has been paid to the northern part of the Tasman Sea where volcanic activity has partly obliterated magnetic lineations on the seafloor; we succeeded in identifying magnetic anomalies in the northernmost Tasman Sea but not in the Lord Howe or Middleton basins, which are
likely to be underlain by extended continental crust. We identified anomalies 330 and 34y (young) in the central Tasman Sea. However, the scarcity of data hinder the

12,416 GAINA ET AL.: TECTONIC HISTORY OFTHE TASMAN SEA
interpretation of Late Cretaceous anomalies in the southern Tasman Sea.
3. Fracture Zone Data
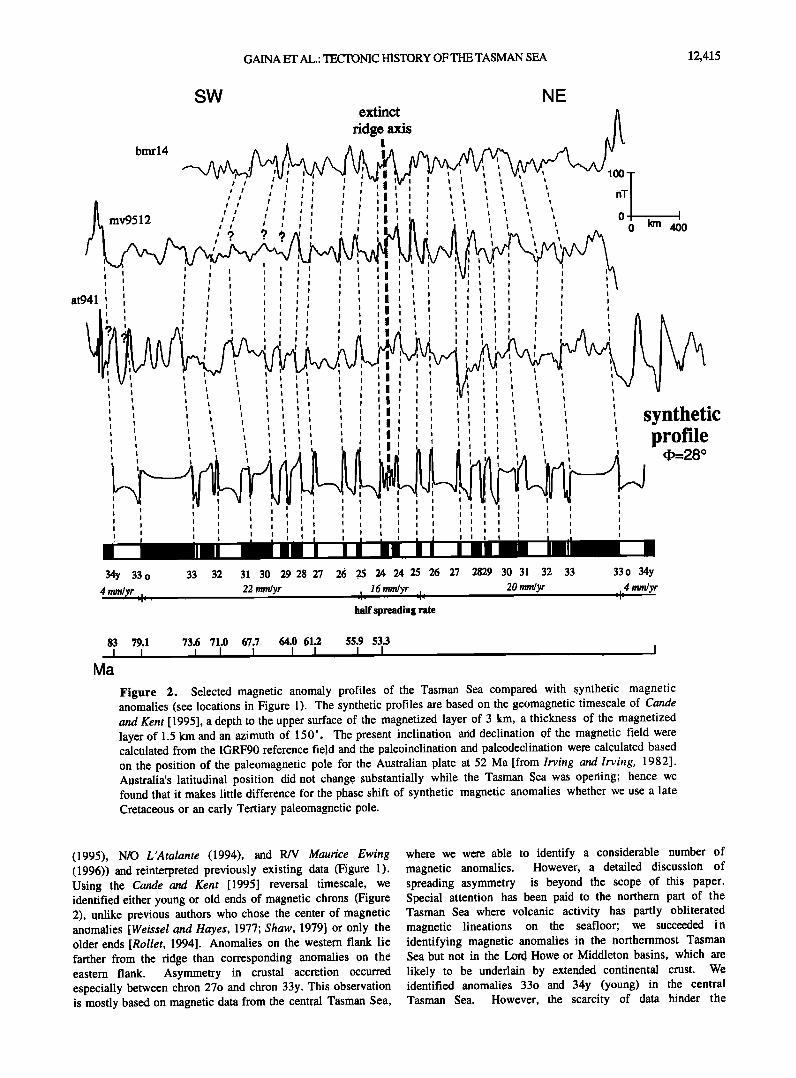
Images of the marine gravity field [Sandwell and Smith, 1997] from satellite altimetry allow improved interpretations of fracture zones and other tectonic features (an extinct
spreading ridge, continent ocean boundary, V-shaped features). The general NNE trend of the fracture zones interpreted from dense satellite gravity data differs from previously interpreted fracture zones by about 10 ø (NNE versus NE). Many fracture zones show a distinct counterclockwise change in spreading direction which occurred shortly before spreading ceased, possibly at chron 25. The new gravity anomaly data allowed us also to better map the fracture zones in the northern Tasman Sea (fracture zone valleys are characterized by negative gravity anomalies, see Figure 3), previously mapped only from magnetic anomaly and bathymetric data. The fracture zones undulate which reflects several changes in spreading direction. Because of insufficient magnetic anomaly identifications in the northern Tasman Sea and because of large offsets of northern Tasman Sea fracture zones, we did not use these fracture zones to constrain our reconstructions. Only one fracture zone (which is located at about 40øS) in the entire Tasman Sea fulfilled our requirements to be included in the inversion: namely, it shows a medium offset (about 120 km), appears to follow a flow line, and its location is constrained by magnetic anomaly data on both sides as well as by satellite gravity data.
The location of fracture zones depends on the type of the ocean floor spreading regime. Large offset Pacific fracture zones (i.e., a fast spreading regime) exhibit a depth/age step (the old side is lower due to the depth-age relationship of oceanic lithosphere) [Sandwell and Shubert, 1982], whereas small to medium offset Atlantic and western Indian Ocean (slow
spreading regime) fracture zones are characterized by a central valley [Van Andel, 1971; Fox and Gallo, 1986]. Medium and large offset fracture zones observed in the North Atlantic are asymmetric in cross section, with a high wall on the old side of the fracture zone [Collette and Roest, 1992].
To determine the correct location of the eastern limb of the
fracture zone that we chose for our inversions, we combined
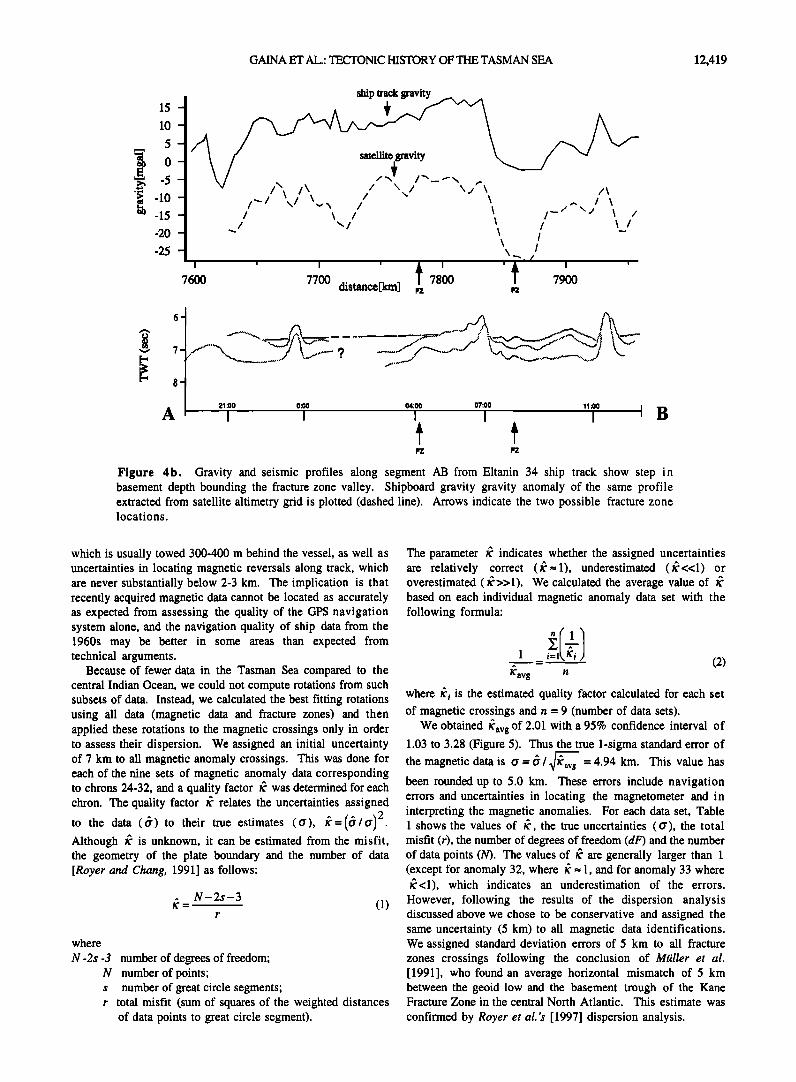
observations of magnetic anomalies and gravity anomalies from ship and satellite and seismic data. The gravity anomaly grid from satellite altimetry displays two possible locations for the eastern limb of the selected fracture zone (Figure 4a). A seismic profile (Eltanin 34), which crosses the two possible locations indicates an obvious change in topography (about 1000 m) at 40øS, 160øE (intersection with the northern fracture zone) and a high wall on the old side of the northern fracture zone as described for Northern Atlantic fracture zones by Collette and Roest [1992] (Figure 4b). The gravity anomaly from the Eltanin 34 profile shows a dramatic change in values (--20 mGal)coincident with the change in topography visible on the seismic profile. The two possible fracture zone locations are intersected by three magnetic profiles: two Verna profiles (v3215, v1812), and one Cook profile (cook60_0) (Figure 4a). The shapes of the easternmost anomalies observed on profile v1812 more closely resemble anomaly 33 (as interpreted on profile v3215) than anomalies 32 and 33 (as identified on profile Melville-mv9512, north of v3215), indicating that the correct interpretation of this fracture zone is the northern alternative.
The selected fracture zone limb displays the same pattern as the other fracture zone in the Tasman Sea (i.e., a change in spreading direction shortly before the ridge became extinct; Figure 3). As the morphology of this fracture zone resembles the Atlantic type (a central valley bounded by a high wall on the older side), we used the troughs in the gravity anomaly as the actual location of the fracture zone. To better constrain
reconstructions for chrons 25y and 240, which imply a change in the direction of spreading, we included additional points from other relevant fracture zone segments.
4. Method
The new magnetic anomaly picks and fracture zone traces digitized from satellite data have been combined to calculate new finite rotations and their 95% uncertainty confidence regions for the opening of the Tasman Sea. They have been computed using an inversion method based on Hellinger's [1981] criterion of fit, developed by Royer and Chang [ 1991 ]. In this method both magnetic and fracture zone data are regarded as points on two conjugate isochrons consisting of great circle segments. The best fit reconstruction is derived from minimizing the sum of the misfits of conjugate sets of magnetic anomaly and fracture zone data points with respect to individual great circle segments.
Since the quality of the determination of the best fitting rotations and their uncertainties depends on the errors assigned to the inverted data, we carried out an analysis of data dispersion. For assigning navigation uncertainties to the ship data, we faced a choice of either estimating navigation error through time since the 1960s, based on changing navigation methods in the last 30 years (Rollet's [1994] approach) or rather assuming that the navigation error is roughly similar for all data we have used. The latter approach was adopted in a detailed analysis by Royer et al. [1997] in the Indian Ocean. To investigate whether navigation errors do vary substantially resulting from different navigation methods, Royer et al. [1997] divided magnetic data into four categories based on the quality of the navigation: the A category included data since 1985 (based on Global Positioning System (GPS) navigation), the B category included data from 1980 to 1985 (based on GPS and Transit satellites navigation), the C category included data from the 1970s which relied mainly on Transit satellite navigation and the D category included pre-1970 cruises without satellite navigation. Their expectation was that the navigational errors should increase for older data. Because the number of data points in individual categories was not large enough to be inverted separately, they combined two or three groups of data for their dispersion analysis. Their results surprisingly show that navigational uncertainties for data included in categories A, B, and C differ by a small amount only, ranging from 3.0 km for the new data to 3.9 km for the older data. The D data were assigned an uncertainty of 5.2 km. It is important to point out, however, that uncertainties resulting from this analysis of dispersion do not strictly reflect navigational errors alone but rather reflect a sum of uncertainties in navigation and in locating the magnetometer with respect to the ship and in identifying the magnetic anomalies. If the sum of these errors were dominated by navigation errors, then magnetic anomaly identifications from GPS navigated cruises would be expected to show errors in the range from 0.2 to 1 km, rather than 3.0 km, as found by Royer et al. [1997]. The discrepancy likely reflects uncertainties in locating the magnetometer with respect to the GPS antenna,

GAINA ET AL.: TECTONIC HISTORY OF THE TASMAN SEA 12,417
38'S
39'S
40'S
41'S
42'S
156'E 157'E 158'E 159'E 160*E 16 I*E 162'E 163'E
90
80
70
60
50
40
30
20
10
0
-10
-20
-30
-40
-50
15-
10-
5-
0-
-5
-10 -
-15 -
-20 -
-25 -
ship track gravity
' \ I• /- x. ../ i •1 ,,,I \'..- 'x I
/ \ /
7600 7700 7800 7900 distance[km] Fz Fz
/\ \ ^ / \ \ i..../ .x./ \ / • i \ I
\ I
6-
7-
21:00 0:00 04:00 07:00 11 :•0 A I" I !
FZ FZ
Figure 4a. Grey shaded contours of gravity anomalies from satellite altimetry (Mercator projection); superimposed are magnetic anomaly wiggles from ship data along several ship tracks which cross this area. Thin solid lines are two possible fracture zone locations (see text for discussion), thick solid line is the extinct ridge axis. Magnetic anomaly identifications are represented by solid dots accompanied by their identification numbers. The profile AB is from Eltanin 34 and displays time annotations.
GAINA ET AL.: TECTONIC HISTORY OF THE TASMAN SEA 12,419
ship track gravity
10
5
0 -5 /'"- • • ,..
/\
-10 /•/ ',,,/ \¾.• // " \\ ^ / \ -15 / \ / \ /'-/ •'/ \ / •/ x/ \\ / \ / -20 / •
-25 /
I ' I ' I '\•' { I ' 7600 7700 7900 •7800 distance[kin] •z
8
21 .'00 0:00 04:00
I
FZ
07:00 1170 i I B
FZ
Figure 4b. Gravity and seismic profiles along segment AB from Eltanin 34 ship track show step in basement depth bounding the fracture zone valley. Shipboard gravity gravity anomaly of the same profile extracted from satellite altimetry grid is plotted (dashed line). Arrows indicate the two possible fracture zone locations.
which is usually towed 300-400 m behind the vessel, as well as uncertainties in locating magnetic reversals along track, which are never substantially below 2-3 km. The implication is that recently acquired magnetic data cannot be located as accurately as expected from assessing the quality of the GPS navigation system alone, and the navigation quality of ship data from the 1960s may be better in some areas than expected from technical arguments.
Because of fewer data in the Tasman Sea compared to the central Indian Ocean, we could not compute rotations from such subsets of data. Instead, we calculated the best fitting rotations using all data (magnetic data and fracture zones) and then applied these rotations to the magnetic crossings only in order to assess their dispersion. We assigned an initial uncertainty of 7 km to all magnetic anomaly crossings. This was done for each of the nine sets of magnetic anomaly data corresponding to chrons 24-32, and a quality factor t• was determined for each chron. The quality factor •' relates the uncertainties assigned
to the data (6') to their true estimates (0'), t•=(•'/o') 2. Although t• is unknown, it can be estimated from the misfit, the geometry of the plate boundary and the number of data [Royer and Chang, 1991] as follows:
• = N-2s-3 (1) r
where
N-2s -3 number of degrees of freedom; N number of points; s number of great circle segments; r total misfit (sum of squares of the weighted distances
of data points to great circle segment).
The parameter •' indicates whether the assigned uncertainties are relatively correct (t• = 1), underestimated (•'<<1) or overestimated (t•>>l). We calculated the average value of t• based on each individual magnetic anomaly data set with the following formula:
i._L_ _ i=1•, tCi._•__•} (2) K'avg tt
where t• i is the estimated quality factor calculated for each set of magnetic crossings and n = 9 (number of data sets).
We obtained •avg of 2.01 with a 95% confidence interval of 1.03 to 3.28 (Figure 5). Thus the true 1-sigma standard error of
the magnetic data is o' = •' / • = 4.94 km. This value has been rounded up to 5.0 km. These errors include navigation errors and uncertainties in locating the magnetometer and in interpreting the magnetic anomalies. For each data set, Table 1 shows the values of t•, the true uncertainties (O'), the total misfit (r), the number of degrees of freedom (dF) and the number of data points (N). The values of •' are generally larger than 1 (except for anomaly 32, where • = 1, and for anomaly 33 where t•<l), which indicates an underestimation of the errors. However, following the results of the dispersion analysis discussed above we chose to be conservative and assigned the same uncertainty (5 km) to all magnetic data identifications. We assigned standard deviation errors of 5 km to all fracture zones crossings following the conclusion of Miiller et al. [1991], who found an average horizontal mismatch of 5 km between the geoid low and the basement trough of the Kane Fracture Zone in the central North Atlantic. This estimate was
confirmed by Royer et al. 's [1997] dispersion analysis.

12,420 GAINA ET AL.: TECTONIC HISTORY OF THE TASMAN SEA
I I I
:::::::::::::::::::::::::::::::::::::::::::::::::::::::::::::::::::::::::::::
i i
o a24y a25y a26o a27o a28y a29y a3Oy a31y a32y
Figure 5. Estimation of standard error assigned to magnetic anomaly crossings. Confidence intervals for •' have been computed for each anomaly data set (excluding fracture zone crossings). The resulting has been averaged, in order to obtain an averaged tCavg value which is included in each confidence interval (stippled area shows the uncertainty for the averaged •'). This estimated •' has then been used to infer the uncertainties in the magnetic data locations (see text for discussion).
5. Results and Discussion
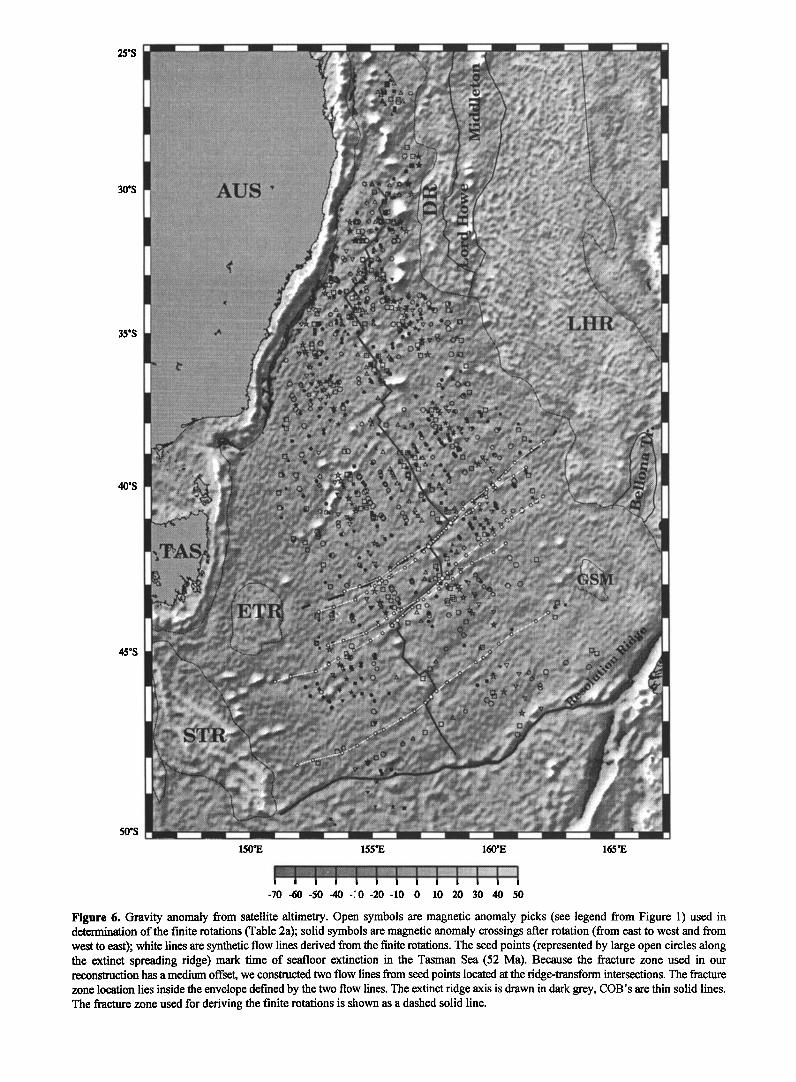
We present locations of anomaly picks used in this study (open symbols) along with their restored positions (rotated using the new set of finite rotations, solid symbols), for both the eastern and western flanks of the Tasman Sea (Figure 6). Generally, the fitted data match fairly well, except for the reconstruction at chron 33y which is represented by few data points and is less constrained.
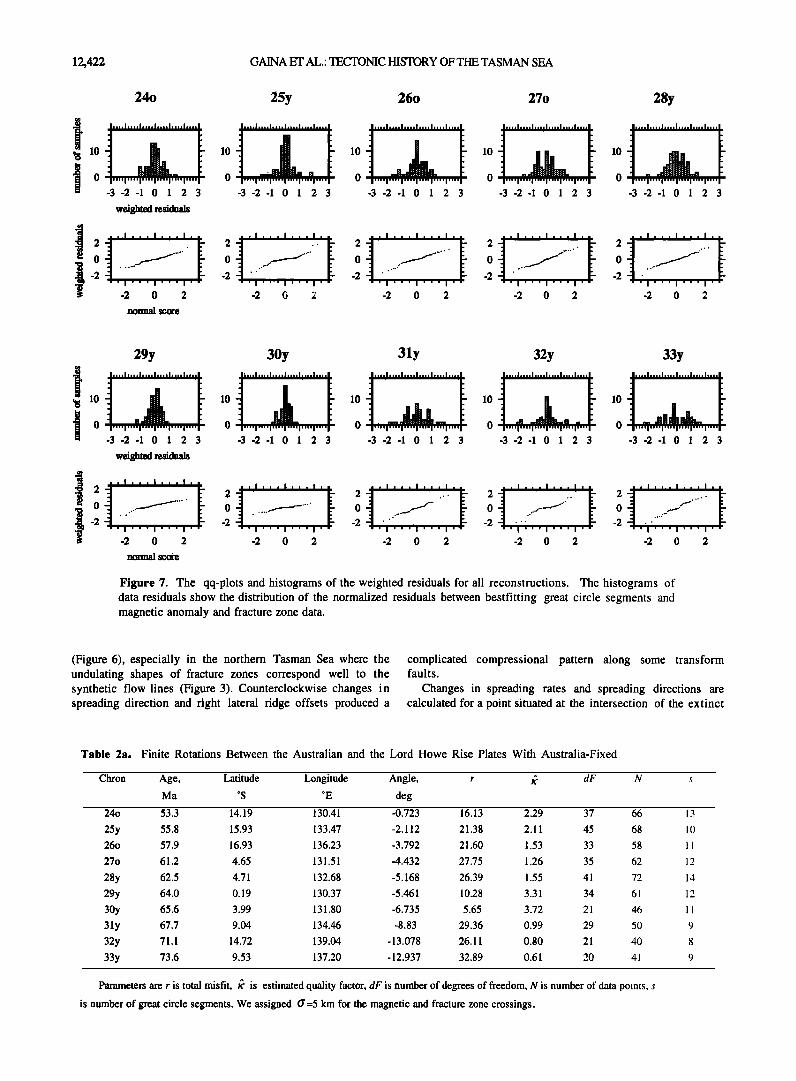
We analyzed the variance based on the assumption that the data are selected from approximately normal distributions. The normality of the distribution can be verified using a normal quantile plot (qq plot). This representation arranges the data residuals in increasing order and then plots each data value at a position in a normal distribution. If the data residuals are normally distributed, all points in the plot should lie on a straight line. Figure 7 shows qq plots and histograms of the weighted residuals. The histograms of data residuals show the distribution of normalized residuals between best fitting great circle segments and magnetic anomaly and fracture zone data.
Most reconstructions are characterized by an approximately linear distribution in qq plots. For the older reconstructions, the curves formed by the histogram peaks differ from a Gaussian distribution, mainly because of few data points or, as in the case of anomaly 33, slight underestimation of uncertainties in the data.
We show the finite rotation pole positions and their uncertainties (Table 2a) in comparison with poles of rotation obtained by other authors (Figure 8). We present covariance matrices which describe uncertainties in rotation locations
which are computed in a reference frame fixed to the Australian plate (Table 2b). They were computed as following:
(1!/•') X d x 10 -6 (3).
Finite rotations for chrons 34y (83.0 Ma)and 33o (79.0 Ma) were calculated assuming that the pole of the oldest derived stage rotation (between chrons 33y and 32y) remained stable since chron 34y. The number of data points for these two reconstruction times is insufficient to derive total
reconstructions independently. The path defined by our rotation poles shows the same SE-NW trend as the poles previously calculated, but it is situated more westward and includes two cusps defined by poles of anomalies 34y, 32y, and 29y and poles of anomalies 270, 260, and 25y. The differences between the locations of the new poles and other rotation poles are the result of using an improved magnetic data set (a larger number of magnetic anomaly identifications, which includes magnetic data in the northern Tasman Sea), a different interpretation of fracture zones orientation, and a different computation method. The pole determined for chron 240 has the largest confidence ellipse due to its very small rotation angle.
Using the new set of finite rotations, we derived stage rotations and several synthetic flow lines in the Tasman Sea. The stage poles cluster in one group located in northern Australia, except for stage poles between chrons 33-32, 29-28, and 27-26 which have more remote locations (Figure 9). Taking into account the sparse data used in older reconstructions, the stage poles determined for the more recent intervals are more reliable than those determined for older
anomalies. The synthetic flow lines and the trends of the fracture zones observed from gravity anomalies match well
Table 1. Statistical Parameters for Finite Rotations Derived From Inversion of Magnetic Anomaly Data Only
Chron ? mag O' mag Fmag dFma• Nmag 24o 3.88 3.55 0.51 29 54 25y 2.77 4.20 0.60 29 48 26o 2.33 4.58 0.65 29 52 27o 1.34 6.05 0.86 32 57 28y 1.62 5.49 0.78 35 64 29y 3.82 3.58 0.51 30 55 30y 4.39 3.34 0.48 17 40 31y 1.57 5.59 0.80 22 41 32y 1.07 6.76 0.97 15 32 33y 0.68 8.50 1.21 13 32
The •' represents the estimated quality factor, O' is the true unknown uncertainty (in km) estimated
from t• obtained by inverting the magnetic crossings only with a •' = 7.0 km, cr = •' / •/-•avg, r is the total misfit, dF is the degree of freedom and N is number of data points in each data set.
25 øS
30øS
35øS
40øS
45 øS
50øS
1500E 1550E 1600E 1650E
I I I I I I I I I I I I I
-70 -60 -50 -40 -.'-0 -20 -10 0 10 20 30 40 50
Figure 6. Gravity anomaly from satellite altimetry. Open symbols are magnetic anomaly picks (see legend from Figure 1) used in determination of the finite rotations (Table 2a); solid symbols are magnetic anomaly crossings after rotation (from east to west and from west to east); white lines are synthetic flow lines derived from the finite rotations. The seed points (represented by large open circles along the extinct spreading ridge) mark time of seafloor extinction in the Tasman Sea (52 Ma). Because the fracture zone used in our reconstruction has a medium offset, we constructed two flow lines from seed points located at the ridge-transform intersections. The fracture zone location lies inside the envelope defined by the two flow lines. The extinct ridge axis is drawn in dark grey, COB's are thin solid lines. The fracture zone used for deriving the finite rotations is shown as a dashed solid line.
12,422 GAINA ET AL,: TECTONIC HISTORY OF THE TASMAN SEA
24o 25y 26o 27o 28y
0 i .... I .... I .... • .... • .... • .... •- 0 • .... • .... • .... • .... • .... i .... ! 0 • .... • ................ • .... 0 'l .... I .... • .... • .... • i"'• .... i .... • .... i .... • .... -3-2-1 0 1 2 3 -3-2-1 0 1 2 3 -3-2-1 0 1 2 3 -3-2-1 0 1 2 3 -3-2-1 0 1 2 3
weighted residuals
2 2 2 2 . 2 ...
ß • .... •.' o ..... o ..... o ..... o o
• ...... .. . ....-' . .... -2 -2 ' -2 ' -2 ' ,2 ß . ' I ' ' ' I ' ' ' I ' I ''-' I •' ' I ' ' I ' ' ' I ' ' ' I ' I '' '• '' ' I '
-2 0 2 -2 •. 2 -2 0 2 -2 0 2 -2 0 2
29y 30y 31y 32y 33y
i i illl illill iii [ill illl. ii Iii1•1 I.,i,, I,,,, I,,,, I,,,,I,i,,, I, ,,,I lli I.I I III II Illl Illl IIII I I Ill I. Illll IIIll,l,l• II"11 II IIl,I, III I II III II,111l It I IllIll II.•l IfilIll f ß
0 I .... I .... i .... I .... i .... I .... I 0 '"i ....... I .... 0 i .... i .... i .... i .... i'"*i .... I 0 I .... I .... I .... i .... I .... I •"' 0 .... I .... I .... I .... I .... I .... I -3-2-1 0 1 2 3 -3-2-! 0 1 2 3 -3-2-1 0 ! 2 3 -3-2-1 0 1 2 3 -3-2-1 0 1 2 3
weighted residuals
Figure 7. The qq-plots and histograms of the weighted residuals for all reconstructions. The histograms of data residuals show the distribution of the normalized residuals between bestfitting great circle segments and magnetic anomaly and fracture zone data.
(Figure 6), especially in the northern Tasman Sea where the undulating shapes of fracture zones correspond well to the synthetic flow lines (Figure 3). Counterclockwise changes in spreading direction and right lateral ridge offsets produced a
complicated compressional pattern along some transform faults.
Changes in spreading rates and spreading directions are calculated for a point situated at the intersection of the extinct
Table 2ao Finite Rotations Between the Australian and the Lord Howe Rise Plates With Australia-Fixed
Chron Age, Latitude Longitude Angle, r t• dF N s
Ma øS øE deg
24o 53.3 14.19 130.41 -0.723 16.13 2.29 37 66 13
25y 55.8 15.93 133.47 -2.112 21.38 2.11 45 68 I() 260 57.9 16.93 136.23 -3.792 21.60 1.53 33 58 I I
270 61.2 4.65 131.51 -4.432 27.75 1.26 35 62 12
28y 62.5 4.71 132.68 -5.168 26.39 1.55 41 72 14
29y 64.0 0.19 130.37 -5.461 10.28 3.31 34 61 12
30y 65.6 3.99 131.80 -6.735 5.65 3.72 21 46 l l
31 y 67.7 9.04 134.46 -8.83 29.36 0.99 29 50 9
32y 71.1 14.72 139.04 -13.078 26.11 0.80 21 40 8
33y 73.6 9.53 137.20 -12.937 32.89 0.61 20 41 9
Parameters are r is total misfit, •' is estimated quality factor, dF is number of degrees of freedom, N is number of data points, s
is number of great circle segments. We assigned CY =5 km for the magnetic and fracture zone crossings.

GAINA ET AL.: TECTONIC HISTORY OF THE TASMAN SEA 12,423
10'S
20'S © this study ¸ Rollet, 1994 © Stock andMolnar, 1982 •, Shaw, 1979 ß W½tss½l & Hayes, 1977
26
120'E 130'E 140'E 150'i:t.
Figure 8. Locations of the finite reconstruction poles (Table 2a) and their 95% confidence regions for the relative motion of Australia/Lord Howe Rise from chron 34y (83 Ma) to chron 240 (53.3 Ma). Previously determined pole paths are shown for comparison.
ridge with the fracture zone that we constrains our plate model (Figure 10). Errors in the spreading directions and rates for chrons 240 to 33y are derived from the covariance matrices of the stage rotations. Seafloor spreading in the Tasman Sea began before chron 34y (at ~ 84 Ma) in a NE-SW direction at a
slow half spreading rate of 3.1 mm/yr. At 79 Ma (chron 33o), the half spreading rate increased to about 20 mm/yr and has been approximately constant until chron 25y (53.3 Ma), when it decreased to 16 mm/yr. The errors in the half spreading rates are within +2 mm/yr; whereas for stages 31y-30y, 30y-29y,
Table 2b. Australia-Lord Howe Rise Rotation Uncertainties
Chron a b c d e f _.
240 5.098 -2.583 4.238 1.593 -2.344 3.775
25y 8.027 -3.805 6.735 2.422 -3.710 6.265 260 1.120 -5.325 1.027 3.133 -5.384 1.003
270 1.119 -5.135 9.585 2.897 -4.798 8.719
28y 1.128 -1.965 7.455 1.605 -2.308 5.889
29y 9.889 - 1.695 6.104 1.664 -2.127 4.769
30y 3.076 - 1.839 3.426 1.748 -2.682 4.47 i
3 ly 2.100 -1.014 1.981 5.707 -1.028 1.954
32y 3.149 - 1.661 3.058 9.136 - 1.634 3.006
33y 2.838 -1.489 2.804 8.307 -1.490 2.800
The uncertainties in the finite rotations are described by covariance matrices, here computed in a reference frame fixed to the Australian plate.

12,424 GAINA ET AL.: TECTONIC HISTORY OF THE TASMAN SEA
-31
Figure 9. Stage poles and their 95% uncertainty ellipses for Australia-Lord Howe Rise relative motion (Australia is fixed). The dashed line shows the stage poles path.
and 28y-27o, the errors are larger. Uncertainty in the directions of spreading is large, especially for stage poles 33y- 32y, 31y-30y, 30y-29y and 28y-27o (Figure 10). However, the changes in spreading direction exhibit three successive trends. From chron 33y to chron 29y, spreading direction changed counterclockwise, from chron 29y to 270 this trend was reversed, and then relative motion changed counterclockwise again. Because of the relatively sparse data we used in computing the finite rotations, individual changes in spreading direction are not significant within the 95% confidence interval. However, changes in spreading direction at chron 29y and 270 are supported by other observations, e.g., changes in fracture zone directions visible on satellite altimetry data in the Tasman Sea. The chron 270 tectonic event has also been recorded in fracture zones of the southwest Pacific Ocean [Cande et al., 1995].
From chron 31 (67.7 Ma) to chron 29 (64.0 Ma), our model suggests transpression between the Chesterfield Plateau and the Marion Plateau (Figure 1), followed by strike slip. This part of our model is well constrained by magnetic anomaly and
fracture zone identifications. The transpression may have been responsible for the formation of the Capricorn Basin south of
the Marion Plateau. We propose an "edge-driven" mechanism [Schouten and Klitgord, 1994] where the counterclockwise rotation of the southeastern part of the Marion Plateau is the result of forces applied to its margins by the NE movement of the Chesterfield Plateau. Thus the southeastern part of the Marion Plateau has been temporarily transformed into a microplate whose rotation determined extension and opening of the Capricorn Basin. The axis of the basin is roughly perpendicular to the southern strike-slip margin of the Marion Plateau. The oldest dated marine sediments in the Capricorn Basin are of Late Oligocene age [Davies et al., 1989]. However, they are underlain by over 1000 m of claystone, likely Early Tertiary in age, which are underlain by sandstones drilled at Aquarius 1 in the northern part of the basin [Davies et
al., 1989]. Therefore, initiation of rifting in the basin between about 68 and 64 Ma resulting from left-lateral transpression, followed by strike-slip, is supported by the sedimentary section recovered at Aquarius-1.
Seafloor spreading ceased shortly after chron 240 (53.3 Ma). The tectonic events which started at chron 270 and culminated in the cessation of spreading reflect a major change in plate driving forces of the Australian plate during that time, that predates the beginning of the India-Eurasia collision at chron 24 [Rowley, 19961.
6. Tectonic Elements
The early opening of the Tasman Sea cannot be modeled by a simple two-plate system because rifting in this basin propagated from south to north in several stages and several rifts. The boundaries between continental and oceanic crust
(COB) used in this study have been defined by combining satellite gravity anomalies, bathymetric contours (ETOPO-5), magnetic data and, where possible, seismic data. We identified 13 continental blocks which acted as microplates between 90 Ma and 64 Ma, namely, the Lord Howe Rise, split into three blocks; the Challenger Plateau; four fragments of the Dampier Ridge; the Chesterfield Plateau; the east and west South Tasman Rise; the East Tasman Plateau; and the Gilbert Seamount
Complex (Figure 1). Our model is constrained by tectonic lineaments visible in the gravity grid interpreted as strike-slip faults, by magnetic anomaly, bathymetry, and seismic data,
time (Ma) 55 60 65 70 75 80 85
:...,. -,-....,-.:........: ?.:: .::.i•..:::.: ........
¾y ¾y ,4y
Figure 10. Spreading rates and directions of spreading computed along a flow line corresponding to the major fracture zone at 40S. Grey areas indicate the 95% uncertainties in the spreading rate and direction values. Spreading rates are based on the reversal time scale of Cande and Kent [ 1995].

GAINA ET AL.: TECTONIC HISTORY OF THE TASMAN SEA 12,425
and, as in case of the South Tasman Rise, by the age and affinity of dredged rocks.
Lord Howe Rise, the major continental fragment [Willcox et al., 1980], whose separation from Australia led to the opening of the Tasman Sea, is interpreted as a conglomerate of four microplates (including the Challenger Plateau). The tectonic lineaments visible on the gravity map, interpreted as strike- slip faults, suggest that the northern and middle fragments of Lord Howe Rise acted as separate tectonic blocks. Three seismic profiles display changes in basement character that correspond to the observed gravity anomalies. Seismic data indicate that the boundary between the northern and middle Lord Howe Rise is relatively wide, but for the purpose of modeling the tectonic history between these blocks we consider it as a continuous lineament. The southern extension
of the Lord Howe Rise, the Challenger Plateau, is separated from the middle Lord Howe Rise by the Bellona Trough and a small fragment of continental crust whose boundaries represent strike-slip faults interpreted from the gravity map. The two faults (visible on seismic lines as shown by Bentz [1974]) are likely to represent the change in strike of the western margin of the Challenger Plateau from north to northwest.
The origin of the Dampier Ridge has been much debated, but dredged rock samples have revealed its continental nature [McDougall et al., 1994]. Some of the N-NE fracture zones pass across the Dampier Ridge, dividing it into four main elements. Another continental plateau, the Chesterfield Plateau, is located north of the Dampier Ridge and was first considered by Shaw [1979] as an active tectonic block in the opening of the Tasman Sea. The boundary between the Chesterfield Plateau and the northern Lord Howe Rise is not
clearly defined, and we have constrained it only by gravity derived from satellite altimetry data.
The South Tasman Rise is a continental fragment which belonged to Eastern Gondwanaland [Kennet et al., 1975]. Recently, Rollet et al. [1996] suggested that the South Tasman Rise is composed of two major continental terraenes separated by an N-S transform fault. The western fragment was attached to Antarctica during the early opening of the Southeast Indian Ocean, while the eastern fragment belonged to the Australian plate. The East Tasman Plateau, a circular plateau separated from Tasmania by a deep saddle floored by oceanic crust [Shaw, 1979], is underlain by continental basement rocks [Exon et al, 1996]. This supports the Soela Seamount guyot formed as the result of Paleogene hotspot volcanism [Duncan and McDougal, 1989]. The South Tasman Rise is separated from Tasmania by a deep basin which seems to be underlain by extended continental crust. There is evidence of ocean floor formed by spreading between the South Tasman Rise and East Tasman Plateau: for example, magnetic anomalies and seismic data collected on L'Atalante [Rollet et al., 1996] indicate the presence of a triple junction between East Tasman Plateau, South Tasman Rise, and Lord Howe Rise. Royer aa•d Rollet [1997] propose a tentative interpretation for four magnetic profiles crossing the basin between the East Tasman Plateau and South Tasman Rise and dated the end of this triple junction activity at 65.6 Ma (chron 30y).
Seismic evidence as well as magnetic anomalies suggest a continental nature of the Gilbert Seamount Complex [Ringis, 1972]; it separated from the Australian continent by early rifting. Recent geophysical data (R/V Maurice Ewing, 1996), including single-channel seismic data and magnetic data, confirmed Ringis's theory. Interpretation of seismic profiles
(Figure 11) shows normal faults which bound the main block of the Gilbert Seamount. This block is also characterized by low magnetic anomaly values. The unpublished interpretation of new multichannel seismic data (collected by Rig Seismic in late 1996) shows a more detailed structure of the Gilbert Seamount Complex and presents additional evidence for its continental origin.
7. Tectonic History
A major tectonic event at 95 Ma that changed the configuration of plates around Australia also affected its eastern part [Mailer et al., 1997]. Therefore rifting started between Australia and the Lord Howe Rise after a slow
spreading system was established in the south between Australia and East Antarctica.
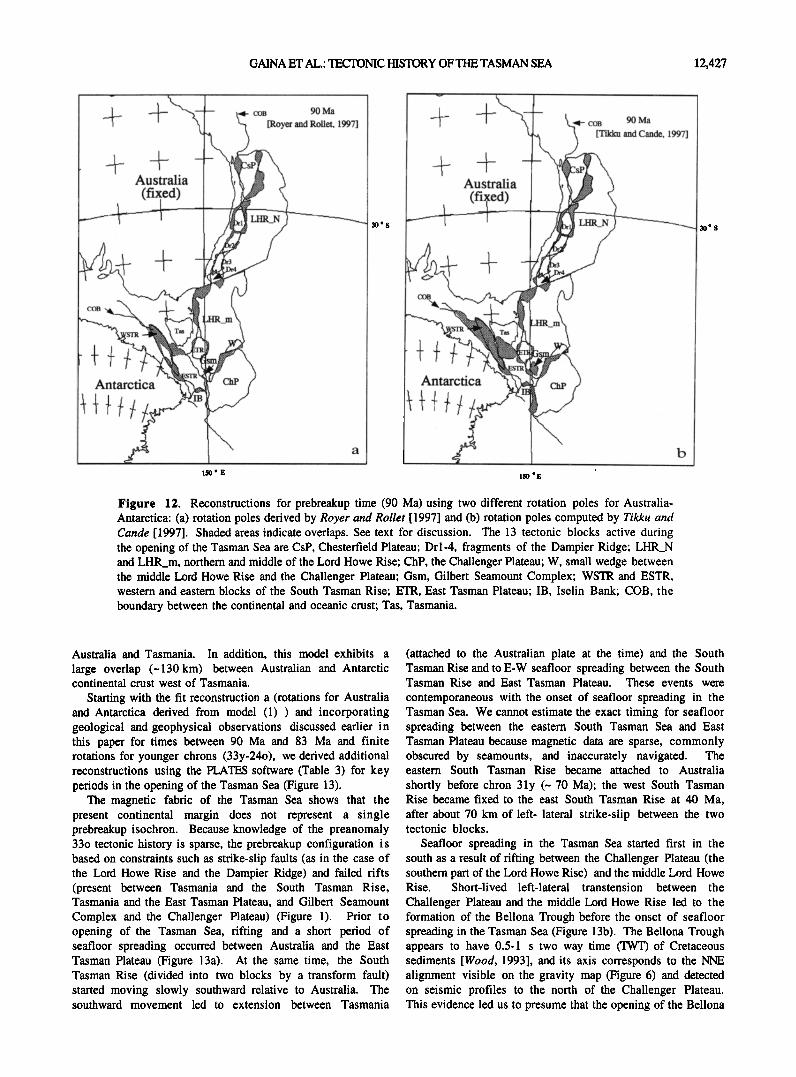
To evaluate our tectonic model for the opening of the Tasman Sea in a larger framework, we tested two positions of East Antarctica relative to Australia given by finite rotation poles calculated by Royer and Rollet [1997] and Tikku and Cande [1997] (Figure 12). Royer and Rollet's [1997] tectonic model of relative motion between Australia and Antarctica in
Cretaceous time is based on magnetic anomalies identified between the two plates, continent ocean boundaries interpreted from the satellite altimetry data in the Great Australian Bight, west of Tasmania and east of East Antarctica. The
reconstruction for 95 Ma modeled by Tikku and Cande [1997] is constrained by two NW-SE fracture zone crossings (Perth and Vincennes) and the Cretaceous quiet zone magnetic anomalies identified in the Australian-Antarctic basin. The pole for this reconstruction has been obtained by fitting a stage pole to a fracture zone and closing it until the Cretaceous quiet zone magnetic anomalies in the Antarctic-Australian basin matched. For the time of rifting and opening in the south Tasman Sea (95-83 Ma), Royer and Rollet's [1997] model predicts NW-SE motion between Australia and East Antarctica which changes to NNW-SSE after chron 34. Tikku and Cande's [1997] model implies NNW-SSE motion from 95 Ma until 61.2 Ma (chron 27). We present two reconstructions (Figures 12a and 12b) for the Tasman Sea area for prebreakup time (90 Ma) including all the tectonic blocks recognized as parts of Gondwanaland that were dispersed during opening of the Tasman Sea. Subsidence analysis of the SE margin of Australia demonstrates that the Bass, Otway and Gippsland basins began to form during Mesozoic rifting and the most rapid and widespread subsidence ended during Early Cretaceous time [Hegarty et al., 1988]. Consequently, we assume that extension in these basins was almost completed at our reconstruction time (90 Ma) with Tasmania in its present-day location relative to Australia. We interpreted the boundary between continental and oceanic crust (COB) of East Antarctica from the gravity grid derived from satellite altimetry north of 72øS [Sandwell and Smith, 1997] and from the gravity grid derived from ERS-1 satellite altimetry south of 72øS [McAdoo and Laxon, 1997]. The bathymetric contours agree well with the distinct positive gravity anomaly that corresponds to the COB, as observed from several seismic lines which cross it [Cande et al., 1998]. Another tectonic feature we included in our reconstructions is the Iselin Bank, a continental block that is part of West Antarctica. Several analyses [Stock and Molnar, 1982, 1987; Cande et al., 1995] of the tectonic framework of Pacific, Antarctic and Australian plates require an additional plate boundary between East and West Antarctica which may have been active since chron 27

12,426 GAINA ET AL.: TECTONIC HISTORY OFTHE TASMAN SEA
Gravity anomaly
Magnetic anomaly
Distance (kin)
Figure 11. Gilbert Seamount Complex: gravity, magnetic, and seismic profiles from Ewing 9513 cruise (profile outlined in bold on Figure 1). The low values of magnetic anomalies along with some normal faults observed on the seismic profile strongly suggest a continental nature of the main block for the Gilbert Seamount Complex.
(61.2 Ma). Cande et al. [1996] suggested that at the time seafloor spreading staffed in the Tasman Sea, the Iselin Bank may have been part of East Antarctica. Rocks dredged from two sites on Iselin Bank (crest and east flank) show similarities
with dredged material from northern Victoria Land. Since the dredged samples consist of moderately rounded grains and there are no known processes which could have transported the dredged material eastward of the Victoria Land Basin, these similarities likely reflect correlation in lithologies [Wong et al., 1987]. In addition, basement rocks underlying Iselin Bank have a two-layer velocity structure similar to that of the Victoria Land Basin [Cooper et al., 1987]. Multichannel seismic reflection data across the Iselin Bank revealed an
asymmetry between the western flank (bordered by numerous normal faults) and the eastern flank (bordered by a steep normal fault) [Davey and Cooper, 1987].
In the reconstruction based on Royer and Rollet's [1997] model (Fig. 12a) the West South Tasman Rise lies west of East South Tasman Rise and Tasmania, overlapping the extended crust of East Australia and Australia. The reconstructed
position of the Iselin Bank fills most of the gap between the SW Challenger Plateau and the easternmost part of Antarctic continental oceanic boundary. This reconstruction displays a gap among the eastern South Tasman Rise, East Tasman Plateau, Gilbert Seamount Complex, and Lord Howe Rise and
some overlaps between the tectonic blocks that account for the continental stretching during this time. The second reconstruction (Figure 12b), which uses the rotations for Australia and Antarctica derived by Tikku and Cande [1997], locates Antarctica in a more eastward position, reducing the space left for the two South Tasman Rise blocks. Partial closing of embayments and reduction of plateaus proportional to their probable extension would lead to a better reassembly. It has been suggested that Wilkes Basin, an Antarctic depression situated near the coast, is the result of Mesozoic crustal extension [Steed, 1983] and microfloras are similar to these in the Otway Basin of Australia [Quilty, 1986]. Accordingly, Bradshaw [1991] proposed a reassembly of the southwest Pacific-Antarctic region before breakup which reduced the area of the Wilkes Basin and Ross Sea. We
mentioned before that the Otway Basin likely formed before breakup in the Tasman Sea [Hegarty et al., 1988]; this implies no significant extension in this basin and its Antarctic counterpart subsequent to 90 Ma. Compared with the Royer and Rollct [1997] based reconstruction (Figure 12a), the Tikku and Cande [1997] based reconstruction (Figure 12b) requires that the eastern South Tasman Rise was in a more northerly position, resulting in substantial overlap among this block and the neighbouring microplates, in particular among the two blocks of the South Tasman Rise and the extended crust of
GAINA ET AL.: TECTONIC HISTORY OF THE TASMAN SEA 12,427
Australia
COB
Antarctica
150 ø E
cob 90 Ma
[Royer and Rollet, 1997]
30øS
Australia
Antarctica
150 øE
cob 90 Ma [Tikku and Cande. 1997]
b
Figure 12. Reconstructions for prebreakup time (90 Ma) using two different rotation poles for Australia- Antarctica: (a) rotation poles derived by Royer and Rollet [1997] and (b) rotation poles computed by Tikku and Cande [1997]. Shaded areas indicate overlaps. See text for discussion. The 13 tectonic blocks active during the opening of the Tasman Sea are CsP, Chesterfield Plateau; Drl-4, fragments of the Dampier Ridge; LHR_N and LHR_m, northern and middle of the Lord Howe Rise; ChP, the Challenger Plateau; W, small wedge between the middle Lord Howe Rise and the Challenger Plateau; Gsm, Gilbert Seamount Complex; WSTR and ESTR, western and eastern blocks of the South Tasman Rise; ETR, East Tasman Plateau; IB, Iselin Bank; COB, the
boundary between the continental and oceanic crust; Tas, Tasmania.
30øS
Australia and Tasmania. In addition, this model exhibits a
large overlap (~ 130 km) between Australian and Antarctic continental crust west of Tasmania.
Starting with the fit reconstruction a (rotations for Australia and Antarctica derived from model (1)) and incorporating geological and geophysical observations discussed earlier in this paper for times between 90 Ma and 83 Ma and finite rotations for younger chrons (33y-24o), we derived additional reconstructions using the PLATES software (Table 3) for key periods in the opening of the Tasman Sea (Figure 13).
The magnetic fabric of the Tasman Sea shows that the present continental margin does not represent a single prebreakup isochron. Because knowledge of the preanomaly 330 tectonic history is sparse, the prebreakup configuration is based on constraints such as strike-slip faults (as in the case of the Lord Howe Rise and the Dampier Ridge) and failed rifts (present between Tasmania and the South Tasman Rise, Tasmania and the East Tasman Plateau, and Gilbert Seamount
Complex and the Challenger Plateau) (Figure 1). Prior to opening of the Tasman Sea, rifting and a short period of seafloor spreading occurred between Australia and the East Tasman Plateau (Figure 13a). At the same time, the South Tasman Rise (divided into two blocks by a transform fault) started moving slowly southward relative to Australia. The southward movement led to extension between Tasmania
(attached to the Australian plate at the time) and the South Tasman Rise and to E-W seafloor spreading between the South Tasman Rise and East Tasman Plateau. These events were
contemporaneous with the onset of seafloor spreading in the Tasman Sea. We cannot estimate the exact timing for seafloor spreading between the eastern South Tasman Sea and East Tasman Plateau because magnetic data are sparse, commonly obscured by seamounts, and inaccurately navigated. The eastern South Tasman Rise became attached to Australia
shortly before chron 31y (~ 70 Ma); the west South Tasman Rise became fixed to the east South Tasman Rise at 40 Ma,
after about 70 km of left- lateral strike-slip between the two tectonic blocks.
Seafloor spreading in the Tasman Sea started first in the south as a result of rifting between the Challenger Plateau (the southern part of the Lord Howe Rise) and the middle Lord Howe Rise. Short-lived left-lateral transtension between the
Challenger Plateau and the middle Lord Howe Rise led to the formation of the Bellona Trough before the onset of seafloor spreading in the Tasman Sea (Figure 13b). The Bellona Trough appears to have 0.5-1 s two way time (TWT)of Cretaceous sediments [Wood, 1993], and its axis corresponds to the NNE alignment visible on the gravity map (Figure 6) and detected on seismic profiles to the north of the Challenger Plateau. This evidence led us to presume that the opening of the Bellona
12,428 GAINA ET AL.: TECTONIC HISTORY OF THE TASMAN SEA
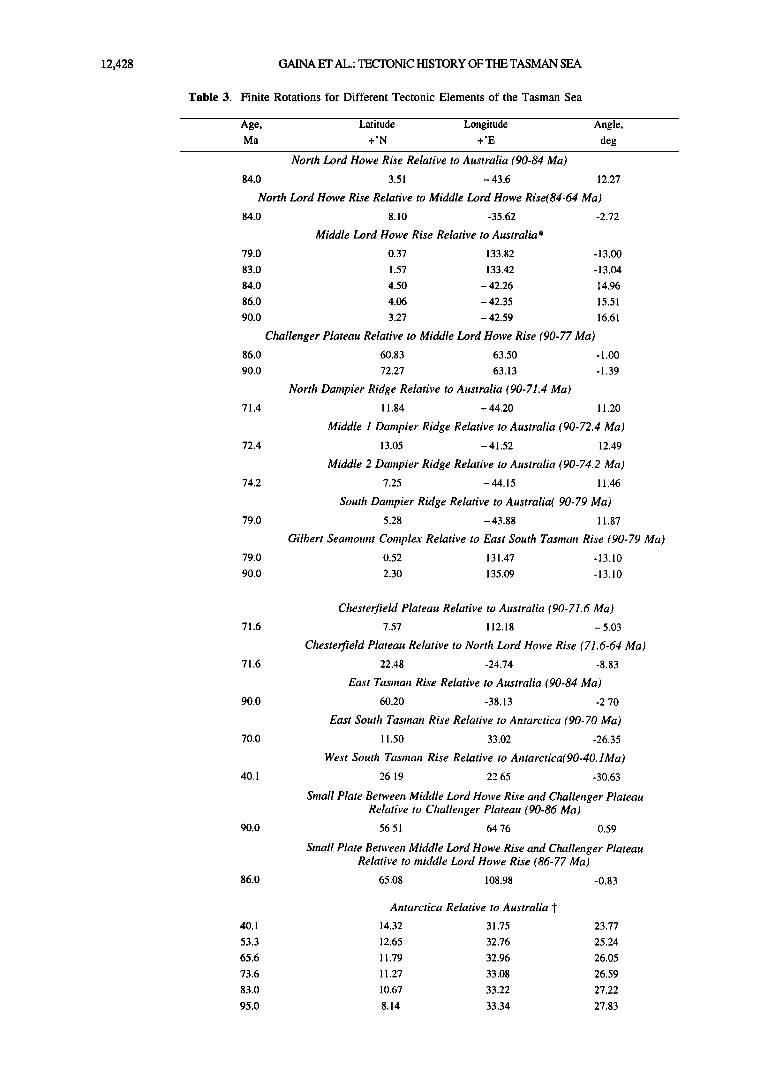
Table 3. Finite Rotations for Different Tectonic Elements of the Tasman Sea
Age, Latitude Longitude Angle,
Ma +øN +øE deg
North Lord Howe Rise Relative to Australia (90-84 Ma)
84.0 3.51 - 43.6 12.27
North Lord Howe Rise Relative to Middle Lord Howe Rise(84-64 Ma)
84.0 8.10 -35.62 -2.72
Middle Lord Howe Rise Relative to Australia*
79.0 0.37 133.82 -13.00
83.0 1.57 133.42 -13.04
84.0 4.50 - 42.26 14.96
86.0 4.06 -42.35 15.51
90.0 3.27 -42.59 16.61
86.0
90.0
71.4
72.4
74.2
79.0
79.0
90.0
Challenger Plateau Relative to Middle Lord Howe Rise (90-77 Ma) 60.83 63.50 -1.00
72.27 63.13 -1.39
North Dampier Ridge Relative to Australia (90-71.4 Ma) 11.84 - 44.20 11.20
Middle 1 Dampier Ridge Relative to Australia (90-72.4 Ma) 13.05 -41.52 12.49
Middle 2 Dampier Ridge Relative to Australia (90-74.2 Ma) 7.25 - 44.15 11.46
South Dampier Ridge Relative to Australia( 90-79 Ma) 5.28 -43.88 11.87
Gilbert Seamotmt Complex Relative to East South Tasman Rise (90-79 Ma) 0.52 131.47 -13.10
2.30 135.09 -13.10
71.6
71.6
90.0
70.0
40.1
90.0
86.0
Chesterfield Plateau Relative to Australia (90-71.6 Ma)
7.57 112.18 - 5.03
Chesterfield Plateau Relative to North Lord Howe Rise (71.6-64 Ma)
22.48 -24.74 -8.83
East Tasman Rise Relative to Australia (90-84 Ma)
60.20 -38.13 -2.70
East South Tasman Rise Relative to Antarctica (90-70 Ma)
11.50 33.02 -26.35
West South Tasman Rise Relative to Antarctica(90-40. IMa)
26.19 22.65 -30.63
Small Plate Between Middle Lord Howe Rise and Challenger Plateau Relative to Challenger Plateau (90-86 Ma)
56.51 64.76 0.59
Small Plate Between Middle Lord Howe Rise and Challenger Plateau Relative to middle Lord Howe Rise (86-77 Ma)
65.08 108.98 -0.83
Antarctica Relative to Australia
40.1 14.32 31.75 23.77
53.3 12.65 32.76 25.24
65.6 11.79 32.96 26.05
73.6 11.27 33.08 26.59
83.0 10.67 33.22 27.22
95.0 8.14 33.34 27.83
GAINA ET AL.: TECTONIC HISTORY OF THE TASMAN SEA 12,429
Table 3. (continued)
Age, Ma
Latitude
+øN
Longitude +øE
Angle,
deg
61.2
95.0
Antarctica Relative to Australia
7.86 35.81
5.50 36.58
* See Table 2 for younger rotations from chron 240 - 333,. p Rotations calculated by Royer and Rollet [1997]. -I: Rotations calculated by Tikku and Cande [1997].
25.54
28.14
Trough preceded opening of the Tasman Sea basin. Following this event, the Challenger Plateau, attached to the middle Lord Howe Rise, and Australia separated. We identified anomaly 33y very close to the Gilbert Seamount Complex (Figure 1) and estimated that 250 km of oceanic crust between the Gilbert
Seamount Complex and the Challenger Plateau is the result of ocean spreading between 83 and 77 Ma. Therefore we suggest that early rifting commenced at about 84 Ma, after short-lived strike-slip motion between the Gilbert Seamount Complex and the South Tasman Rise, and stopped prior to anomaly 33y time when the Gilbert Seamount Complex was transferred to the Challenger Plateau (Figure 13b).
At 84 Ma, extension began between the subsequent Dampier Ridge and the northern part of the Lord Howe Rise creating the Lord Howe and Middleton basins. At that time, the fragments which would later constitute the Dampier Ridge were part of the Australian continent. Before chron 33y (79 Ma) the southern Dampier Ridge became attached to the northern Lord Howe Rise following a ridge propagation from the Lord Howe basin to the Tasman Sea (we interpreted anomaly 33y very close to the southernmost part of this tectonic block). As a consequence, transtension began between the two fragments south of the Dampier Ridge. This motion ceased when the second block of the Dampier Ridge joined the northern Lord Howe Rise and strike-slip motion occurred between the two middle elements of the Dampier Ridge. At 72 Ma, after short-lived transtension between the northern Dampier Ridge and the adjacent fragment to the south, the entire Dampier Ridge became attached to the Lord Howe Rise and rifting in the Lord Howe and Middleton basins ceased (Figure 13c). The northern Dampier Ridge moved along the Australian margin shortly before the onset of seafloor spreading in the northern Tasman Sea. The last stage of rift propagation at chron 28 separated the Chesterfield Plateau and the Australian plate (Figure 13d) and established a continuous spreading center in the Tasman Sea. At the same time, the northern Lord Howe Rise became attached to the
middle Lord Howe Rise after 260 km of left-lateral strike-slip motion.
To better evaluate the fit of all tectonic blocks in this area
and correlations between tectonic lineaments on the gravity grid of the 13 tectonic elements that were part of the Australian continent prior to the opening of the Tasman Sea, we constructed a gravity grid mosaic for prebreakup time (Figure 14). The gravity grid polygons for each tectonic block were converted to ASCII format and rotated about their fit rotation
poles relative to Australia, averaged by a block mean filter and regridded using a spline interpolation algorithm with a tension value of 0.25 [Wessel and Smith, 1991]. Clear SW-NE oriented lineations on the southern Queensland Australian margin
gravity grid are consistent with similar features observed on the juxtaposed Chesterfield Plateau gravity grid in its reconstructed position. Gravity highs present on the Challenger Plateau appear to follow the direction of other gravity highs from the middle of the Lord Howe Rise. Since the middle Lord Howe Rise and the Challenger Plateau experienced transtension during the opening of the Tasman Sea, this reconstruction reveals the prebreakup position of the elevated tectonic features observed on the Lord Howe Rise.
8. Conclusions
We present a new, comprehensive model for the opening of the Tasman Sea, based on a new gravity anomaly grid, an improved magnetic data set and other geophysical data. We have combined a qualitative model for the early, prechron 3 3 y opening of the Tasman Sea based on all available geophysical and geological data with a quantitative model for the postchron 33y opening of the Tasman Sea from inverting magnetic anomaly and fracture zone data to obtain finite rotations and their uncertainties.
The early opening of the Tasman Sea cannot by modeled b y a simple two-plate system, because rifting propagated northward in several stages, creating several failed rifts and strike-slip faults. We identified 13 tectonic units, based on tectonic lineaments visible in the gravity grid and interpreted as strike-slip faults, by magnetic anomaly, bathymetry, and seismic data, and, as in case of the South Tasman Rise, by the age and affinity of dredged rocks. These 13 tectonic blocks and the Australian continent gradually separated due to either extensional or strike-slip movements, generating the Tasman Sea, the Lord Howe and the Middleton basins, and several failed rifts. We suggest that strike-slip motion occurred between the northern and the middle Lord Howe Rise along a fault visible on the gravity grid and seismic reflection data. We also considered the Challenger Plateau as a separate microplate, whose motion relative to the middle Lord Howe Rise constrains
the plate circuit among Antarctica, Australia, and New Zealand. The opening of the northern Tasman Sea is well explained by the gradual stepwise separation of four Dampier Ridge tectonic fragments plus the Chesterfield Plateau and Australia in the framework of a northward propagating rift. Transtension or strike-slip motion characterized the motion of each tectonic block of the Dampier Ridge relative to adjacent blocks.
Our postchron 33y model describes a number of tectonic events in the spreading history of the Tasman sea basin. The general trend of the youngest fracture zones observed in the satellite gravity grid differs from previously interpreted fracture zones by about 10 ø (NNE versus NE). Hence the

12,430 GAINA ET AL.: TECTONIC HISTORY OF THE TASMAN SEA
30 øS
be
Ce
-• +•'• - t• '•--cOs Chron 33 (73.6 Ma)
150 øE 150 øE
de
30 øS
150 øE 150 øE
30 øS
30 øS
30os
f,
150 *E 150 *E
Figure 13. Set of reconstructions of the Tasman Sea opening: (a) chron 34y (83 Ma), (b) chron 33y (73.6 Ma), (c) 31y (67.7 Ma), (d) chron 28y (62.5 Ma), (e) chron 260 (57.9 Ma), (f) chron 24 (52 Ma). Small dots are magnetic anomaly and fracture zone identifications. For tectonic blocks identification, see Figure 12 caption.
30 *S

GAINA ET AL.: TECTONIC HISTORY OFTHE TASMAN SEA 12,43!
-25 ø
-30'
-35 ø
-45'
_50 ø
145' 150' 155 ø 160 ø
I I I I I I I I I I I I I I I I I I
-890-790-690-590-490-390-290-190-90 10 110 210 310 410 510 610 710 810
Figure 14. Gravity mosaic for prebreakup time (90 Ma). Black lines represent boundaries between continental oceanic crust. Overlaps among different tectonic blocks account for synrift crustal extension. All overlaps between tectonic elements and Australia show Australian plate gravity values. Other areas of gap or overlaps between different tectonic blocks show averaged or interpolated gravity values, respectively, and can be ignored (the Australian continental gravity grid used in this reconstruction was produced by Australian Geological Survey Organization). See Figure 1 for continental block identifications.
direction of spreading is inferred to be more SSW-NNE than SW-NE, as previously suggested, and spreading direction changed several times most notably counterclockwise just before spreading ceased, possible at chron 25. Our model predicts transpression between the Chesterfield Plateau and the
Marion Plateau, followed by strike-slip, from chron 31 (67.7 Ma) to chron 29 (64.0 Ma). This previously unrecognized transpression is well constrained by magnetic anomalies and fracture zone crossings and may be responsible for the formation of the Capricorn Basin south of the Marion Plateau.
12,432 GAINA ET AL.: TECTONIC HISTORY OF THE TASMAN SEA
Another major tectonic event took place at chron 27o (61.2 Ma), when spreading direction changed counterclockwise, correlating well with a synchronous event in the southwest Pacific Ocean [Cande et al., 1995]. This event, a subsequent counterclockwise change in spreading direction at about chron 25y (55.9 Ma) accompanied by a further decrease in spreading rate, lead to the cessation of spreading soon after chron 24o (52 Ma) and reflect a major change in plate driving forces of the Australian plate, which predates the beginning of India- Eurasia collision at chron 24 [Rowley, 1996]. (Magnetic and fracture zone crossings (in digital format) used in this study are available on the Worldwide Web site: www.es.su.oz.au.)
Acknowledglnents. The results presented here are part of a Ph.D. project sponsored by the Australian Geological Survey Organisation. The first author acknowledges support from the Department of Geology and Geophysics, University of Sydney. We thank the Royal Australian Navy for making digital magnetic anomaly data collected by the HMAS Cook available to us. We benefited from some insightful discussions with and unbiased views (at the 95% confidence level) from Ted Chang and Richard Gordon while they were visiting Sydney University. For digitizing magnetic anomaly identifications we used a program developed by Anahita Tikku from the Scripps Institution of Oceanography. Most of the figures were drafted using the GMT software [Wessel and Smith, 1991]. This work was partially supported by National Science Foundation grant OCE-9416779 to J. Stock. JYR acknowledges support from the Centre National de la Recherche Scientifique and from the French Ministry of Education during his stay in Sydney. Marine gravity data south of 72øS supplied by Seymour Laxon, University College London, and Dave McAdoo, NOAA. G6osciences Azur contribution 174.
References
Bentz, F.P., Marine geology of the southern Lord Howe Rise, southwest Pacific, in The Geology of Continental Margins, edited by C.A. Burk and C.L. Drake, pp. 537-547, Springer-Verlag, New York, 1974.
Bradshaw, J.D., Cretaceous dispersion of Gondwana: Continental and oceanic spreading in the south-west Pacific-Antarctic sector, in Geological Evolution of Antarctica; Proceedings of the Fifth International Symposium on Antarctic Earth Sciences, Int. Symp. Antarct. Earth Sci., vol. 5, edited by M.R.A. Thomson, J.A Crame, and J.W. Thompson, pp. 581-585, Cambridge Univ. Press, New York, 1991.
Cande, S.C., and D.V. Kent, Revised calibration of the geomagnetic polarity timescale for the Late Cretaceous and Cenozoic, J. Geophys. Res., 100, 6093-6095, 1995.
Cande, S.C., C.A. Raymond, J. Stock, and W.F. Haxby, Geophysics of the Pitman fracture zone and Pacific Antarctic plate motion during the Cenozoic, Science, 270, 947-953, 1995.
Cande, S., J. Stock, R.D. Miiller, C. Raymond, and A. Tikku, Early Tertiary motion between East and West Antarctica, Eos Trans. AGU, 77(46), Fall Meet. Suppl., F647, 1996.
Cande, S., J. Stock., C. Raymond, and R.D. MiJller, New constraints on an old plate tectonic puzzle of the southwest Pacific, Eos Trans. AGU, 79, 1998
Collette, B.J., and W.R. Roest, Further investigations of the Noah Atlantic between 10 ø and 40øN and an analysis of spreading from 118 Ma ago to Present, Proc. K. Ned. Akad. Wet. Set. B, 95(2), 159- 206, 1992.
Cooper, A.K., F.J. Davey, and G.R. Cochrane, Structure of extensionally rifted crust beneath the western Ross Sea and Iselin Bank, Antarctica, from suonobuoy seismic data, in The Antarctic Continental Margin, Geology and Geophysics of the Western Ross Sea, Earth Sci. Set., vol. 5B, pp. 93-119, Circum-Pac. Counc. for Energy and Miner. Resour., Houston, Tex., 1987.
Davey, F.J., and A.K. Cooper, Gravity studies of the Victoria Land Basin and Iselin Bank, in The Antarctic Continental Margin, Geology and Geophysics of the Western Ross Sea, Earth Sci. Ser, vol. 5B, pp. 119-139, Circum-Pac. Counc. for Energy and Miner. Resour., Houston, Tex., 1987.
Davies, P.J., P.A. Symonds, D.A. Feary, and C.J. Pigram, The evolution of the carbonate platforms of northeast Australia, in Controls on Carbonate Pla(form and Basin Development, edited by P.D. Crevello et al., Spec. Publ., Soc. Econ. Paleontol. Mineral., 44, 233- 258, 1989.
Duncan, R., and I. McDougall, Volcanic time-space relationships, in Intraplate Volcanism in Eastern Australia and New Zealand, edited by R. Johnson, pp. 43-54, Cambridge Univ. Press, New York, 1989.
Exon, N.F., J.P. Kennett, J. Mascle, P.J. Hill, J.-Y. Royer, G.C.H. Chaproniere, and S. Shafik, The "Southern Gateway" between Australia and Antarctica: A proposal for ODP paleoclimatic, paleoceanographic and transform margin drilling, A GSO Rec. 34, Aust. Geol. Surv. Org., Canberra, 1996.
Fox, P.J. and D.G. Gallo, The geology of the North Atlantic transform plate boundaries and their aseismic extensions, in The Geology of the North America, vol M, The Western North Atlantic Region, edited by R. Vogt and B.E. Tucholke, pp. 157-172, Geol. Soc. of Am., Boulder, Colo., 1986.
Hayes, D.E., and J. Ringis, Seafloor spreading in the Tasman Sea, Nature, 243, 454-458, 1973.
Hegarty, K.A., J.K. Weissel, and J.C. Mutter, Subsidence history of Australia's southern margin: Constraints on basin models, AAPG Bull., 72, 615-633, 1988.
Hellinger, S.J., The uncertainties of finite rotations in plate tectonics, J. Geophys. Res., 86, 9312-9318, 1981.
Irving, E., and G.A. Irving, Apparent polar wander paths Carboniferous through Cenozoic and the assembly of Gondwana, Geophys. Surv., 5, 141-88, 1982.
Kennett, J.P., et al., Initial Reports of the Deep Sea Drilling Project, vol. 29, 1197 pp., U.S. Govt. Print. Off., Washington, D.C., 1975.
McAdoo, D.C., and S.W. Laxon, Antarctic tectonics: Constraints from a new satellite maxine gravity field, Science, 276, 556-561, 1997.
McDougall, M.A., M.A.H. Maboko, P.A. Symonds, M.T. McCulloch, I.S. Williams, and H.R, Kudrass, Dampier Ridge, Tasman Sea, as a stranded continental fragment, Aust. J. Earth Sci., 41, 395-406, 1994.
Mtiller, R.D., D.T. Sandwell, B.E. Tucholke, J.G. Sclater, and P.R. Shaw, Depth to basement and geoid expression of the Kane fracture zone: A comparison, Mar. Geophys. Res., 13, 105-129, 1991.
Mtiller, R.D., A. Tikku, D. Mihut, C. Gaina, J. Stock, and S. Cande, The 95 Ma and 61 Ma (Chron 27) Tectonic events around Australia: The Relationship between absolute and relative plate motion, abstract presented at the Chapman Conference on the History and Dynamics of Global Plate Motions, AGU, Marshall, Calif., 1997.
Quilty, P.G., Australia's Antarctic basins: Identification and evolution, Pet. Explor. Soc. Aust. J., 8(1), 93-101, 1986.
Ringis, J., The structure and history of the Tasman Sea and the southeast Australian margin, Ph.D. thesis, Univ. of New South Wales, Sydney, 1972.
Rollet, N., Ouverture de l'oc/•an austral dans la region du South Tasman Rise (SE Australie): apport d'un lev• de bathymetrie multifaisceaux ( campagne Tasmante 1994)et des donn•es de gravin•trie satellitaire (GEOSAT GM), Raport du stage de Magist6re, Univ. Paxis, 1994.
Rollet, N., J.-Y. Royer, N.F. Exon, and P.J. Hill, Le Plateau Sud_Tasman (Australie): collage de deux fragments du Gondwana Oriental ?, C. R. Acad. Sci. Oceanogr. Geophys. Mar., Ser. lla, 323, 865-872, 1996.
Rowley, D.B., Age of initiation of collision between India and Asia: A review of stratigraphic data, Earth Planet. Sci. Lett., 145, 1-113, 1996.
Royer, J.-Y., T. and Chang, Evidence for relative motions between the Indian and Australian plates during the last 20 m.y. from plate tectonic reconstructions: Implications for the deformation of the Indo-Australian plate, J. Geophys. Res., 96, 11,779-11,802, 1991.
Royer, J-Y., and N. Rollet, Plate tectonic setting of the Tasmanian region, Aust. J. Earth Sci., 44, 543-560, 1997.
Royer, J.-Y., R.G. Gordon, C. DeMets, and P.R. Vogt, New limits on the motion between India and Australia since chron 5 (11 Ma) and implications for lithospheric deformation in the equatorial Indian Ocean, J. Geophys. Int., 129, 41-74, 1997.
Sandwell, D.T., and G. Shubert, Lithospheric flexure at fracture zones, J. Geophys. Res., 87, 4657-4667, 1982.
Sandwell, D.T., and W.H.F. Smith., Global maxine gravity anomaly ERS-I, Geosat and Seasat reveals new tectonic fabric, Eos Trans. AGU. 73(43) Fall Meet. Suppl., 133, 1992.
GAINA ET AL.: TECTONIC HISTORY OF THE TASMAN SEA 12,433
Sandwell, D.T., and W.H.F. Smith, Marine gravity anomaly from ERS- 1, Geosat and satellite altimetry, J. Geophys. Res., 102, 10039- 10045, 1997.
Schouten, H., and K.D. Klitgord, Mechanistic solutions to the opening of the Gulf of Mexico, Geology, 22, 507-510, 1994.
Shaw, R.D., On the evolution of the Tasman Sea and adjacent continental margins, Ph.D. thesis, Univ. of Sydney, Sydney, N.S.W., Australia, 1979.
Steed, R.H.N., Structural interpretation of Wilkes land, Antarctica, in Antarctic Earth Science, edited by R.L. Oliver, P.R. James, and J.B. Jago, pp. 567-572, Aust. Acad. of Sci., Canberra, 1983.
Stock, J., and P. Molnar, Uncertainties in the relative positions of the Australia, Antarctica, Lord Howe, and Pacific plates since the late Cretaceous, J. Geophys. Res., 87, 4697-4714, 1982.
Stock, J., and P. Molnar, Revised history of early Tertiary plate motion in the south-west Pacific, Nature, 325, 495-499, 1987.
Tikku, A. and S. Cande, Reconstruction of Australia and East Antarctica from total fit to the Early Tertiary, abstract presented at the Chapman Conference on the History and Dynamics of Global Plate Motions, AGU, Marshall, Calif., 1997.
Van Andel, T.H., Fracture zones, Comments on earth sciences, Geophysics, 1, 159-166, 1971.
Wessel, P., and W.H.F. Smith, Free software helps map and display data, Eos Trans. AGU, 72, 441,445-446, 1991.
Weissel, J.K., and D.E. Hayes, Evolution of the Tasman Sea reappraised, Earth Planet. Sci. Lett., 36, 77-84, 1977.
Willcox, J.B., P.A. Symonds, K. Hinz, and D. Bennett, Lord Howe Rise,
Tasman Sea-preliminary geophysical results and petroleum prospects, BMR J. Aust. Geol. Geophys., 5, 225-236, 1980.
Wong, F.L., P.J. Barett, J. Gamble, and D.G. Howell, Petrography of rock samples from Iselin Bank, Ross Sea, Antarctica, in The Antarctic Continental Margin, Geology and Geophysics of the Western Ross Sea, Earth Sci. Ser., vol. 5B, pp. 231-253, Circu•n- Pac. Counc. for Energy and Miner. Res., Houston, Tex., 1987.
Wood, R.A., The Challenger Plateau, South Pacific Sedimentary Basins of the World, vol. 2, pp. 351-364, F. Ballance, Elsevier, New York, 1993.
C. Gaina and R.D. Mtiller, Department of Geology and Geophysics, Edgeworth David Building, F05, The University of Sydney, New South Wales 2006, Australia. (e-mail: [email protected]; dietmar @ es .s u. o z.au)
J.-Y. Royer, Unit6 Mixte de Recherche 6526, G6osciences Azur, Quai de la Darse-BP 48, Villefranche Sur Mer, France. ( e- mail:royer@ obs-vlfr.fr)
J. Stock and J. Hardebeck, Seismological Laboratory, MS 252-21, California Institute of Technology, Pasadena, CA 91125. (e-mail: jstock @gps.caltech.edu, jhardebeck @gps.caltech.edu)
P. Symonds, Australian Geological Survey Organisation, Cnr Constitution Ave. & Anzac Pde, Canberra A.C.T., Australia. ( e- mail: psymonds @ agso.go v.au.)
(Received August 20, 1997; revised December 23, 1997; accepted January 27, 1998)