the telangana disability study summary...
TRANSCRIPT

http://disabilitycentre.lshtm.ac.uk
http://disabilitycentre.lshtm.ac.uk
The Telangana Disability Study
Summary Report
The full report is available at http://disabilitycentre.lshtm.ac.uk and www.phfi.org/
Project Investigators: Islay Mactaggart1, Sarah Polack1, Hannah Kuper1, Jayanthi Sagar2, GVS Murthy2
1International Centre for Evidence in Disability, London School of Hygiene and Tropical Medicine 2South Asia Centre for Disability Inclusive Development and Research, Indian Institute of Public Health, Public Health Foundation of India Funder: CBM www.cbm.org

Andhra Pradesh Disability Study
http://disabilitycentre.lshtm.ac.uk
http://disabilitycentre.lshtm.ac.uk
Fig 1: ICF Framework of disability
Source: Rehab-scales.org
Study Aim: Develop and test a best-practice population-based survey methodology to estimate the prevalence of disability in children and adults in India, and to compare the extent to which people with and without disabilities access key mainstream services and opportunities including health, education and livelihoods in Telangana State, India.
Study Objectives:
1. Develop a population-based survey methodology to assess prevalence of i)Visual, hearing,
musculoskeletal impairment and depression; and ii)Self-reported Disability
2. In Telangana State, India:
i) Estimate the prevalence of disability (impairments and activity limitations)
ii) Explore the extent to which people with disabilities (PWD) access mainstream health,
education, employment and livelihood opportunities in comparison to non-disabled peers
and their experiences of participation
iii) Identify factors that predict access to health, education, employment and livelihood
amongst persons with disabilities
iv) Identify barriers and facilitators which mediate access to services
Study Background
Few robust quantitative data on the magnitude and impact of disability on people’s lives are available globally. Even amongst the limited evidence base that exists, different methodologies used in defining disability make comparison between countries and over time extremely difficult. These data are urgently needed to estimate the prevalence and impact of disability on people’s lives, so as to plan appropriate, disability inclusive programmes, policies and societies.
Figure 1 presents the International
Classification of Functioning, Disability and
Health (ICF) Model. This model views
disability as the interaction between health
conditions and/or impairments in body
function and structure, activity limitations
caused by the impairment/health condition
and the impact on the individual’s
participation. The relationship between
these components is mediated by
environmental, personal and contextual
factors.
Measurements of disability tend to focus on a particular component within the ICF (e.g self-report
only, or impairment measures only). This project aimed to address this gap through development of
a new comprehensive disability survey methodology that includes self-reported measures, objective
impairment measures and participation measures of disability. The project used this methodology to
assess the magnitude and impact of disability on people’s lives in Telangana State.

Andhra Pradesh Disability Study
http://disabilitycentre.lshtm.ac.uk
http://disabilitycentre.lshtm.ac.uk
Study Design:
The study consisted of an all-age population-based random sample, with nested case-control and a qualitative component. 1. All-age population-based survey of disability (n=4080) in Mahbubnagar
District, Telangana State, measuring: a. Self-reported functional limitations b. Clinical screening for visual impairment, hearing impairment,
musculoskeletal impairment and clinical depression (18+ only)
All participants aged ≥5 years who screened positive to either self-reported functional limitations or clinical impairments (‘cases’) were invited to participate in the nested case-control study alongside one age, gender and cluster matched control.
An additional one adult and two children with disabilities per cluster were identified via case-finding to ensure that the sample size was sufficient. 2. Nested case-control study of people with and without disabilities, assessing:
a. Impact of disability on access to health, education, livelihoods, participation etc. b. Availability of rehabilitation, inclusive education and assistive devices
3. Qualitative study:
30 participants identified with disabilities from the population-based sample and the nested case control, plus 14 key informants, were interviewed using a semi-structured questionnaire for the qualitative component. The results of this component of the study are reported separately. Study setting:
The study was conducted in the Northern
half of Mahbubnagar District (estimated
district population size: 4,053,028) in
Telangana State. The study worked in
partnership with service providers, policy
makers and research institutes including the
Public Health Foundation of India (PHFI),
the Andhra Pradesh Society for Elimination
of Rural Poverty (SERP), the Mahbubnagar
District Collector’s Office and the
Aarogyshri Registry.
Photo: A village participant reports on whether she has
functional limitations

Andhra Pradesh Disability Study
http://disabilitycentre.lshtm.ac.uk
http://disabilitycentre.lshtm.ac.uk
Definitions:
Screening criteria used to identify persons with disabilities were based on international recommendations:
Self-reported Activity Limitations: reporting “a lot of difficulty” or “cannot do” any basic activity
domain
Vision Impairment: Presenting vision in better eye of <6/18
Hearing Impairment: Presenting hearing loss in better ear of >40 dBA (adults) or >35dBA (children)
Musculoskeletal Impairment (MSI): Structure impairment with moderate effect on the
musculoskeletal system’s ability to function as a whole 25-49%
Epilepsy: 3 or more tonic clonic seizures previously
Depression: score of 20 or above
Disability: Any one of the above
Referrals and Follow Up: Medical and rehabilitative referral services (including community-based rehabilitative services) available in the region were mapped pre-emptively and contacted to guarantee support. Clinical team members provided referrals to partner organisations as appropriate. All identified cases in the study, regardless of health or other need, were given information for the local SERP coordinator and the Aarorgya Mitra Registry program for additional support in education, health, livelihoods, benefits etc. Follow up support was provided at the end of the study, with field teams re-contacting all 681 participants who had been offered medical and rehabilitative referrals to provide additional information and offer logistical support. Amongst these, 231 participants were directly assisted in attending follow-up screening.
Key Findings:
4,080 people (51 clusters of 80 people) enumerated for the population-based survey, of whom 3,574 were screened (response rate 88%)
Overall prevalence of disability in Telengana State estimated at 12.2% (95% CI 10.6-14.1), which does not vary significantly by gender
Prevalence increases strongly with age from 3.6% of children under 18, to 8.1% of adults 18-49 and 38.3% of adults 50+
Overall prevalence of clinical impairments in Telegana State estimated at 10.5% (95% CI 9.4-11.7) and also increases significantly with age (2.9% of children under 18, 6.3% of adults 18-49 and 35.0% of adults 50+
Physical impairments (1.5%) and Epilepsy (1.1%) were most common impairments/health conditions in children, followed by vision (0.5%) and
hearing (0.5%). 0.4% of children had multiple impairments/health conditions.
Hearing impairments (2.0%) and Epilepsy (2.0%) were most common amongst adults 18-49, followed by physical impairments (1.4%), vision impairments (1.1%) and depression (0.4%). Prevalence of multiple impairments was 0.6% in this age group.
Photo: Enumeration

Andhra Pradesh Disability Study
http://disabilitycentre.lshtm.ac.uk
http://disabilitycentre.lshtm.ac.uk
Amongst adults aged 50 and above, 17.4% were identified to have hearing impairments, 15.0% to have vision impairments, 12.4% to have physical impairments, 2.4% with Epilepsy and 2.8% with depression. 11.4% of this age group had multiple impairments.
The prevalence of reported significant activity limitations was 7.5% (5.9%-9.4%), and slightly more common in women (8.4% vs 6.5%) and increases in accordance with age from 2.3% of children 2-17, to 4.7% of adults 18-49 and 23.1% of adults 50+
Using a single question to assess disability status (asking “do you consider yourself/your child to have a disability?” leads to substantial underreporting (3.8% vs 12.2% using other methods)
Children with disabilities are less likely to go to school than children without disabilities (51% vs 91%) and 6 times more likely to have repeated the same class
Adults with disabilities are less likely to be working (44.4% vs 80.1%) and more likely to have experienced a serious health condition in the previous 12 months than adults without disability
Adults with disabilities aged 18-49 are nearly 3 times more likely to be in the poorest quarter than adults without disabilities, whilst there is less relationship between poverty and disability amongst adults aged 50+
Significant participation restrictions and environmental barriers were experienced by children and adults with disabilities of all ages compared to those without disabilities– this included in access to transport, availability of heath care services and prejudice and discrimination
Awareness of and access to rehabilitation and assistive devices amongst people with disabilities was low, with 12.4% having ever previously received any rehabilitation and 7.7% having received an assistive device.
Table 1: Overall Prevalence of Disability
Total 0-17 years 18-49 years 50+ years Male Female
n
% (95% CI)
n %
(95% CI) n
% (95% CI)
n %
(95% CI) N
% (95% CI)
N %
(95% CI)
Any disability 437
12.2 (10.6-14.1) 44
3.6 (2.6-4.9) 137
8.1 (6.0-11.0) 256
38.3 (33.6-43.3) 199
11.7 (9.7-14.0) 238
12.2 (10.9-14.8)
Self-Reported Limitations (2+) 258
7.5 (5.9-9.4)
25 2.3
(1.4-3.7) 79
4.7 (2.8-7.7)
154 23.1
(19.5-27.1) 107
6.5 (4.7-8.8)
151 8.4
(6.6-10.6)
Any moderate or severe impairment
376 10.5
(9.4-11.7) 36
2.9 (2.1-4.0)
106 6.3
(5.1-7.8) 234
35.0 (30.6-39.6)
175 10.2
(8.9-11.7) 201
10.8 (9.3-12.4)
Any vision impairment
124 3.5
(2.7-4.4) 6
0.5 (0.2-1.0)
19 1.1
(0.6-1.9) 99
15.0 (11.4-19.3)
49 2.9
(2.0-4.0) 75
4.0 (3.1-5.2)
Hearing impairment
157 4.4
(3.7-5.2) 6
0.5 (0.2-1.2)
35 2.0
(1.4-3.1) 116
17.4 (14.6-20.7)
71 4.2
(3.3-5.3) 86
4.6 (3.8-5.7)
Physical impairment
125 3.5
(2.9-4.3) 18
1.5 (0.9-2.3)
24 1.4
(1.0-2.1) 83
12.4 (9.7-15.8)
63 3.7
(3.0-4.6) 62
3.3 (2.5-4.4)
Epilepsy 63 1.8
(1.4-2.2) 13
1.1 (0.6-1.7)
34 2.0
(1.4-3.0) 16
2.4 (1.5-3.8)
33 1.9
(1.4-2.7) 30
1.6 (1.1-2.4)
Depression (18+) 26 1.1
(0.7-1.6) - - 7
0.4 (0.2-1.0)
19 2.8
(1.8-4.6) 9
0.8 (0.4-1.6)
17 1.3
(0.9-2.1) Multiple impairments
91 2.5
(2.1-3.1) 5
0.4 (0.2-1.0)
10 0.6
(0.3-1.1) 76
11.4 (9.2-13.9)
43 2.5
(1.9-3.4) 48
2.6 (2.0-3.4)
Single Question 135 3.8
(2.9-4.9) 27
2.2 (1.5-3.3)
47 2.8
(1.8-4.4) 61
9.1 (7.0-11.8)
71 4.2
(3.0-5.8) 64
3.4 (2.6-4.5)
Andhra Pradesh Disability Study
http://disabilitycentre.lshtm.ac.uk
http://disabilitycentre.lshtm.ac.uk
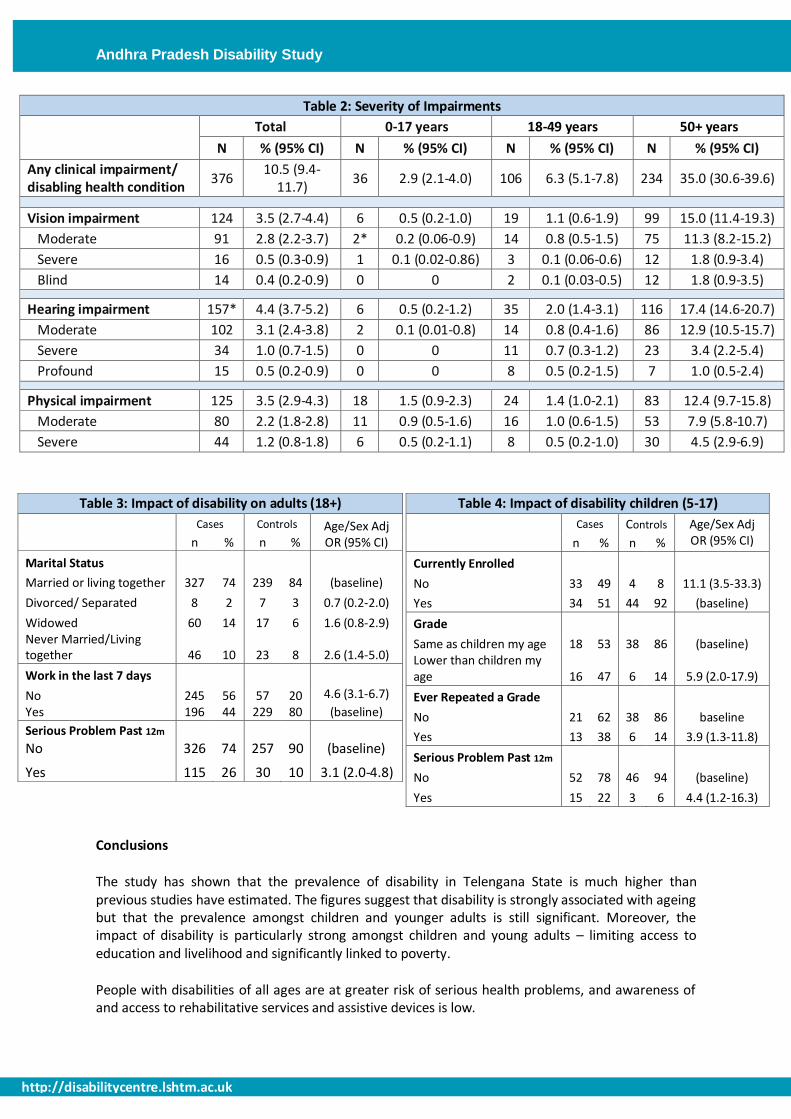
Table 2: Severity of Impairments
Total 0-17 years 18-49 years 50+ years
N % (95% CI) N % (95% CI) N % (95% CI) N % (95% CI)
Any clinical impairment/ disabling health condition
376 10.5 (9.4-
11.7) 36 2.9 (2.1-4.0) 106 6.3 (5.1-7.8) 234 35.0 (30.6-39.6)
Vision impairment 124 3.5 (2.7-4.4) 6 0.5 (0.2-1.0) 19 1.1 (0.6-1.9) 99 15.0 (11.4-19.3)
Moderate 91 2.8 (2.2-3.7) 2* 0.2 (0.06-0.9) 14 0.8 (0.5-1.5) 75 11.3 (8.2-15.2)
Severe 16 0.5 (0.3-0.9) 1 0.1 (0.02-0.86) 3 0.1 (0.06-0.6) 12 1.8 (0.9-3.4)
Blind 14 0.4 (0.2-0.9) 0 0 2 0.1 (0.03-0.5) 12 1.8 (0.9-3.5)
Hearing impairment 157* 4.4 (3.7-5.2) 6 0.5 (0.2-1.2) 35 2.0 (1.4-3.1) 116 17.4 (14.6-20.7)
Moderate 102 3.1 (2.4-3.8) 2 0.1 (0.01-0.8) 14 0.8 (0.4-1.6) 86 12.9 (10.5-15.7)
Severe 34 1.0 (0.7-1.5) 0 0 11 0.7 (0.3-1.2) 23 3.4 (2.2-5.4)
Profound 15 0.5 (0.2-0.9) 0 0 8 0.5 (0.2-1.5) 7 1.0 (0.5-2.4)
Physical impairment 125 3.5 (2.9-4.3) 18 1.5 (0.9-2.3) 24 1.4 (1.0-2.1) 83 12.4 (9.7-15.8)
Moderate 80 2.2 (1.8-2.8) 11 0.9 (0.5-1.6) 16 1.0 (0.6-1.5) 53 7.9 (5.8-10.7)
Severe 44 1.2 (0.8-1.8) 6 0.5 (0.2-1.1) 8 0.5 (0.2-1.0) 30 4.5 (2.9-6.9)
Conclusions
The study has shown that the prevalence of disability in Telengana State is much higher than previous studies have estimated. The figures suggest that disability is strongly associated with ageing but that the prevalence amongst children and younger adults is still significant. Moreover, the impact of disability is particularly strong amongst children and young adults – limiting access to education and livelihood and significantly linked to poverty.
People with disabilities of all ages are at greater risk of serious health problems, and awareness of and access to rehabilitative services and assistive devices is low.
Table 3: Impact of disability on adults (18+)
Cases Controls Age/Sex Adj OR (95% CI) n % n %
Marital Status
Married or living together 327 74 239 84 (baseline)
Divorced/ Separated 8 2 7 3 0.7 (0.2-2.0)
Widowed 60 14 17 6 1.6 (0.8-2.9) Never Married/Living together 46 10 23 8 2.6 (1.4-5.0)
Work in the last 7 days
No 245 56 57 20 4.6 (3.1-6.7)
Yes 196 44 229 80 (baseline)
Serious Problem Past 12m No 326 74 257 90 (baseline)
Yes 115 26 30 10 3.1 (2.0-4.8)
Table 4: Impact of disability children (5-17)
Cases Controls Age/Sex Adj OR (95% CI) n % n %
Currently Enrolled
No 33 49 4 8 11.1 (3.5-33.3)
Yes 34 51 44 92 (baseline)
Grade Same as children my age 18 53 38 86 (baseline)
Lower than children my age 16 47 6 14 5.9 (2.0-17.9)
Ever Repeated a Grade No 21 62 38 86 baseline
Yes 13 38 6 14 3.9 (1.3-11.8)
Serious Problem Past 12m
No 52 78 46 94 (baseline)
Yes 15 22 3 6 4.4 (1.2-16.3)

Andhra Pradesh Disability Study
http://disabilitycentre.lshtm.ac.uk
http://disabilitycentre.lshtm.ac.uk
Recommendations for Indian Disability Inclusion
The following use of the study findings is recommended to policy makers, service providers and other disability advocates and stakeholders:
1. To raise awareness of the prevalence of disability in Telengana State, and specifically the large prevalence of disability and multiple impairments amongst adults aged 50+
2. To advocate strongly for greater inclusion of children with disabilities in education in Telengana State and particularly to ensuring appropriate methods of education that allow disabled children to progress through school
3. To advocate for better access to health and rehabilitative services amongst children and adults with disabilities in Telengana State, including linking people with disabilities to available services and greater community outreach and support
4. To intensify efforts and advocacy for inclusive societies and services that alleviate the restrictions in participation felt by people with disabilities including barriers in the built and natural environment and as a result of stigma and discrimination
5. To understand the differences in estimates derived from different methodologies of disability measurement, and the most appropriate measures for programs and surveys
Practical Recommendations on disability data collection:
1. Self-Reported tools that measure activity limitation are the most appropriate and resource efficient way to measure disability in a population or within a program or project.
2. Moderate clinical impairments may not be captured using this method, so we recommend that all participants who report even “some” limitation in a particular domain should also undergo a simple clinical screen
3. Measures of participation should also be included to fully capture disability.
Corresponding Author: [email protected]
Citing this document: International Centre for Evidence in Disability (ICED), The Telengana Disability Study, India Summary Report, London School of Hygiene and Tropical Medicine (LSHTM) 2014 [available from http://disabilitycentre.lshtm.ac.uk]
For full and summary country reports for India and Cameroon respectively, and for further resources related
to this study, visit http://disabilitycentre.lshtm.ac.uk
Opinions expressed are of the authors. Neither the London School of Hygiene and Tropical Medicine, nor
CBM take responsibility of the views expressed herein.
Report design based on original design and artwork by RW Design Ltd. Email: [email protected]
Photo: Village children leave school for lunch