the territorial division of power: a survey on brazil1paperroom.ipsa.org/papers/paper_31705.pdfthe...
TRANSCRIPT

1
The Territorial Division of Power: A survey on Brazil1
Marta Arretche
Rogerio Schlegel Diogo Ferrari
ABSTRACT
Two main approaches divide the literature on the territorial distribution of power, one focusing on identity, the other on political economy. The former argues that strong regional identities favor preferences for a decentralization of authority and resources and, conversely, that identities more inclined to the Nation-State support centralized polities. The latter approach depicts the geography of income and median voter preferences as core determinants of choices regarding these institutions.
This paper examines these propositions in the case of Brazil, a federation where the bulk of interpersonal income redistribution occurs at the central level. A representative national survey, with oversampling in states with differing wealth and income distribution profiles, gives empirical support to the analysis. Data is explored through multivariate models to gauge the independent effect of identity- and socioeconomic status-related variables on preferences regarding the territorial distribution of authority. Measures of preferences for the vertical distribution of authority were built that take into account individuals' choices for change as well as their evaluation of the current relevance of the different levels of government in Brazil.
Our findings show that voters see Brazil as a centralized federation. The vast majority of respondents perceive the most important elections and most important decisions as taking place in the federal sphere. A larger share hold a preference for either maintaining the status quo or further centralizing the federation, although the preference for further empowering local governments is not negligible. Identity does not seem to explain individuals’ preferences. Instead, we found evidence confirming the old-fashioned notion that class does matter when preferences as to the vertical distribution of authority are at stake. Moreover, preferences for centralization are associated to trust in the federal government. However, although we found evidence that the region where people live can also matter for their preferences, our preliminary results does not allow to clearly depict which attributes of regions affect choices about institutional design.
Paper to be delivered to the 23rd IPSA Congress of Political Science
Research Committee 28, Comparative Federalism and Multilevel Governance Montreal, 19-24 July 2014
1 This paper benefited greatly from previous collaboration with Charles Jeffery (University of Edinburgh)
on the Project Exchanging Data and Skills on ‘Place Inequality’: A UK-Brazilian Collaboration, funded by the ESRC as part of the Pathfinder Project. The authors are also grateful for support from the São Paulo Research Foundation (FAPESP, Project No. 2013/07616-7), and the National Council for Scientific and Technological Development (CNPq) through the National Institutes Program, to the Center for Metropolitan Studies (Centro de Estudos da Metrópole, CEM), which funded the survey “Images of the Federation”. Authors also thanks comments by Murilo Junqueira, Patrick Silva, Paulo Loyola, and Thiago Nascimento Fonseca.

2
The Territorial Division of Power: A survey on Brazil
Marta Arretche2 Rogerio Schlegel3
Diogo Ferrari4
Introduction
Since the 1970s, the territorial reorganization of Nation-States has taken center stage in
many countries’ domestic politics. Change previously achieved by means of bloody wars then
started being processed under democratic rule. Political scientists applied considerable effort
and imagination to mapping out initiatives as different as the emergence of the European
Union, the breakup of nations, pressures toward regional independence, and the rescaling of
political and policy authority. Taken as a whole, these shifts ultimately challenged the
superiority of the Nation-State as a form of political organization, which had long been taken
for granted. However, as in many areas of empirical investigation, the outcomes assessments
are not clearly conclusive. Just to mention some examples, Hooghe et al. (2010), who
developed a Regional Authority Index (RAI) to measure 42 democracies or quasi-democracies
on different continents on an annual basis over the period 1950–2006, found a convergent
trend toward stronger regional authority. The project Rescaling of Social Welfare Policies
scrutinized social policies in 8 European countries and found no convergent practices, but
rather territorial changes pointing in different directions, from further centralization to a range
of central-local arrangements (Kazepov and Barberis, 2013).
Brazil is a good example of country whose institutional history is characterized by
rescaling. Its recent trajectory illustrates this trend well. The Brazilian military regime (1964-85)
was a highly centralized polity, in that both taxation and the framing and implementation of
nearly all policies were in the hands of central authorities (Draibe, 1989; Serra and Afonso,
1999). The transition to democracy was followed by increasing fiscal decentralization along
with interregional redistribution of tax revenues (Abrucio, 1998; Arretche, 2005). In the
Constituent Assembly held in 1987 and 1988, the scale of policy-making and decision-making
2 Full professor at the Department of Political Science, University of São Paulo, and Director of the Center for Metropolitan Studies. 3 Post-doc researcher at the Center for Metropolitan Studies. 4 PhD student at University of Michigan.

3
were at the forefront, along with a fierce dispute over the rules of interregional income
redistribution (Ferrari, 2013), which eventually concentrated the authority to frame subnational
policies and taxation at the federal level (Arretche, 2007), increasing the extent of income
redistribution between states (Ferrari, 2013; Leme, 1992) and decentralizing policy-making
toward states and municipalities (Souza, 1997). From the mid-1990s on, rescaling further
entitled the Union to regulate and supervise the constituent units’ taxation and policy affairs
(Almeida, 2005; Rodden, 2006). These decisions were approved peacefully in Brazil’s symmetric
bicameral system, meaning that states’ rights were not infringed (Arretche, 2013).
Studies of the territorial distribution of authority have focused mainly on outcomes, and
the empirical findings could not be more polarized. At one extreme, public-choice scholars
argue that decentralized decision-making is a necessary condition for economic growth
(Weingast, 1997) and citizens protection against rent-seeking bureaucracies (Buchanan, 1995).
At the other, Peterson (1995) warns against the risk that decentralization can trigger a race to
the bottom in social policies (Peterson, 1995), while Gerring et al. (2005) show that
centralization of authority leads to better governance, provided that broad political inclusion is
assured. Others argue that many benefits attributed to either centralized or decentralized
arrangements are often explained by other factors (Pierson, 2005; Treisman, 2007). In fact, the
endogeneity problem attendant on most comparative research has drawn attention to the
origin of institutions. If institutions (such as federalism) are not randomly assigned to countries,
investigation of their consequences risks attributing causal effects to the wrong suspects, and
overlooking factors that may be the real culprits.
Acknowledgement of that problem has made the study of the sources underlying choices
for the territorial distribution of political and policy authority a central theme of the political
science agenda. Most studies stress the macro-political foundations of such phenomena. The
transition towards democracy (Montero and Samuels, 2004; Moreno, 1997), welfare state
reforms (Kazepov and Barberis, 2013), the reconfiguration of Europe (Keating, 2013), and the
breakup of the Soviet Union (Bolton and Roland, 1997) are the most scrutinized candidate
explanations. Although this literature offers important insights and sheds some light on the
causes of the rescaling of authority, it generally fails to provide an explanation of the decision-
making process behind such changes. To the extent that they focus on structural causes, they
underestimate the micro-foundations that underpin institutional choices. Shifting the focus
away from structural causes, an extensive literature has highlighted the role of deliberate
choices in determining the rescaling of authority. One important strand of this literature

4
emphasizes the role of citizens’ preferences as the main incentive shaping political actors’
choices (Page and Shapiro, 1992; Wlezien, 1995; Erikson and Wright, 1997; Powell, 2000;
Soroka and Wlezien, 2005). These theories are our point of departure.
The statement that voter preferences do shape representatives’ preferences and
eventually influence policy decisions is debatable (Alesina and Giuliano, 2011; Bartels, 2008).
However, it does not make scrutiny of the electorate’s preferences towards the territorial
distribution of authority any less important as a central element of theoretical and empirical
investigation. The empirical investigation of such preferences is indeed crucial precisely
because many studies that emphasize its critical role in shaping institutional choices start from
assumptions about the conditions under which they are formed. If such exogenously attributed
preferences are not found among the electorate though, the robustness of theoretical
explanations that emphasize the role of voters’ preferences on politicians’ decision-making is
weakened.
This paper uses survey data on Brazil to depict preferences regarding the vertical
distribution of authority, and to test two theories on their formation. One stresses the role of
territorial identities, while the other holds that such preferences are explained mainly by the
geography of income. The former is influential among European scholars; the latter
predominates among US academics. Efforts to bridge between these two traditions are
extremely rare. This paper has five sections in addition to this introduction. The first presents
the theories and propositions we are discussing. The next describes the survey conducted in
Brazil and the independent variables of our study. The third develops an original methodology
to capture rescaling preferences that takes account of both the multipolar notion of citizenship
typical of federal states and the interviewees’ evaluation of the current vertical distribution of
authority. Section 4 explores inferential analyses featuring regression models of pooled data,
and giving special attention to two predictors: territorial identity and per capita household
income. Finally, section 5 features regression models with data for each observed macro-region
and oversampled state, to discuss impacts of inequalities within areas. Concluding remarks
close the paper.
1. Theories and propositions
Explanation of how preferences towards the territorial distribution of power are formed
derive from two main perspectives in political science. Although both argue that ultimately
political conflicts about institutional arrangements are driven by representatives’ constituency
5
preferences, each stresses quite different assumptions about how voters’ preferences are
formed.
The first approach states that identity is the most important factor behind voters’
preferences regarding the design of state institutions. The argument’s theoretical foundation
dates from Livingston’s (1952: 88) statement that “the more diversified the society, the greater
is the necessity of providing some means for articulating the diversities; for these diversities are
nothing less than tensions and as tensions they demand and require means of self-expression”.
Rokkan (1975) portrayed the modern European state as originating from the intertwining of
institutional structures and cultural orientations, closely relating territorial identity with the
settlement of states’ boundaries. Accordingly, a superior form of institutional arrangement
would be one that accommodates the territorial boundaries of states and of their component
nation(s) (Lipjhart, 1968, 1977).
On this view, demands for the rescaling of authority in Europe are explained mainly by
the existence of nations, defined as deep-rooted communities with shared identity, values or
interests, whose territorial boundaries do not coincide with the boundaries of their own states.
Culturally heterogeneous societies create favorable conditions for the emergence of multiple
identities, which operate as landmarks for political action. This results in the emergence of
claims ranging from devolution to independence, in order for these nations to have a say in
policy design (Jeffery, 2009; Moreno, 1997). The decentralization carried out in Europe with the
blooming of elected regional governments since the 1970s is evidence of such phenomena
(Moreno and McEwen, 2005; Harrison, 2005; Lodge and Schmuecker, 2010). This strand of
literature also highlights the role of a “multilevel citizenship”, according to which Marshall’s
notion of citizenship mistakenly conflates citizens’ rights with the Nation-State (understood as
the central government) on the grounds that this scale is the unique and natural sphere where
policy decisions should be made; instead, multilevel citizenship would involve different ties and
expectations toward different levels of government. As a result, politically significant cleavages
are explained by the existence of multilevel citizenship, which shapes bonds of solidarity and
affects policy preferences. A logic of proximity and responsiveness of decision-making is
regarded to operate at the local-region level, while a logic of equity and solidarity translates
into demands for uniform policies and services throughout the whole country (Banting, 2006),
although one orientation need not contradict or dominate the other (Handerson et al., 2014).
The second approach sees the geography of income and inequality as the core
determinant of voters’ preferences. This perspective was advanced primarily by political

6
economy studies, such as those of Foley (1967), Romer (1975) and Roberts (1977). The
argument is that poor citizens favor high rates of income tax, while the wealthy favor low rates;
the equilibrium tax rate would thus be the one preferred by the median-income voter, whose
preferences would be decisive in a setting with universal suffrage and majority rule. Meltzer
and Richard (1981) went beyond this view, arguing that “the size of government depends on the
relation of mean income to the income of the decisive voter” (p. 916). As income distribution in
capitalist societies is usually skewed to the right, mean income tends to exceed median income,
favoring a pivotal preference for redistribution. Sustained extension of the franchise to poorer
voters would then explain the sustained growth of the state.
Taking these insights as its point of departure, a more recent strain in the literature
argues that voters foresee the distributive consequences of alternative arrangements and
choose those which maximize their incomes. With the aim of explaining why nations break up,
Bolton and Roland (1997) argued that the winners and losers from regional independence vary
with income distribution across and within regions. Voters in regions with small income
inequality may want to break away from a nation with greater income inequality and high tax
rates in order to pay lower taxes; a region displaying greater income inequality may want to
secede in order to impose more redistribution than prevails in the unified country. Under
majority rule, each region would be expected to prefer a tax policy closer to the policy most
preferred by its median voter.
Beramendi (2007) argues that citizens’ preferences regarding tax arrangements are
defined as a function of the geography of income. Decisions about institutional design are also
choices about territorial income redistribution, with individuals’ preferences depending on both
interregional and intra-regional income inequality. Accordingly, wealthy individuals in less
unequal, wealthy regions prefer decentralized tax arrangements, because the resulting political
equilibrium would involve lower tax rates. On the other hand, wealthy individuals in unequal,
wealthy regions may prefer centralization in order to share the costs of redistribution with
taxpayers of other regions, and so reduce the burden of redistribution to be borne (Beramendi,
2012). Dahlby, Rodden and Wilson (2009) also apply the median-voter model to explain
decisions about grants from central to subnational governments in federations. They assume
that voter preferences take account of the interaction between the taxes they expect to be
levied by both central and regional governments: the greater the federal transfers, the lesser
the need for provinces to tax their own citizens directly. Such a calculation would be foreseen
on the basis of the tax base of each. So, jurisdictions’ income is more important than within-

7
regions income inequality when options on the amount of federal grants are selected. Drawing
on these theories, we developed three propositions and related hypotheses for empirical
investigation. The first aims to test theories that stress the role of identity, whereas the other
two seek to examine the role of the geography of income.
Proposition 1: Territorial identity trumps class. Stronger regional identity associates
negatively with preferences for centralized authority, while associating positively with
individuals’ preferences for decentralized policy decision-making.
Proposition 2: Inter-region inequality trumps class. Regardless of their income, people
prefer centralized authority if mean income in their own region is below the national average.
Likewise, people living in wealthier regions prefer decentralized designs, regardless of their
individual incomes.
Proposition 3: Within-region inequality trumps class and inter-region inequality. The
pivotal role of the median voter and his relative position in the (national and region) income
distribution affect preferences for institutional design. Such choices are associated to the
distance between the (national and region) median voters' income and the (national and
region) mean income. The preferred arena for redistribution would then be a function of
expected burden and gains resulting from redistribution. As a result, e.g., poor people in poor,
unequal regions would prefer decentralized arrangements, because their pivotal position in
regional decision-making works in their favor in obtaining more income through tax
redistribution.
2. The study
In March 20135, the Center for Metropolitan Studies (Centro de Estudos da Metrópole,
CEM) conducted a national survey of Brazilian citizens’ attitudes to key characteristics of the
Brazilian federation. The questions were designed to allow comparisons with results from
projects in other countries. Accordingly, we included many questions of the CANS (Citizenship
After the Nation-State) project questionnaire, with additional questions seeking to test
hypotheses related to the geography of income6.
5 The period to conduct the survey was scheduled to avoid proximity with elections, which are suspected to affect voter perception on the importance of government-tiers. The last Brazilian local government elections were held in October 2012, whereas general elections are scheduled for late 2014. 6 The CANS (Citizenship After Nation-State) project applied a common questionnaire to randomly selected samples of at least 900 respondents in 14 regions of five European countries, starting in 2009. Led by Charles Jeffery and Ailsa Henderson, from the University of Edinburgh’s Institute of Governance,

8
Studies of Brazil usually aggregate states into 5 macro-regions. Although these have no
administrative or political power, each comprises states with similar economic characteristics
and cultural identity. Accordingly, the survey developed a representative sample of these
macro-regions: South (SU), Southeast (SE), North (NO), Northeast (NE), and Center-West (CW)
of 2,285 interviewees, 18-years old or over7. Interviewees were distributed by quotas according
to age, sex, and schooling, based on 2010 Brazilian Census data. Around four hundred
interviews were conducted in each of the five macro-regions. Three states – selected on the
criterion of their ranking in national income distribution – were also oversampled in two
different macro-regions: the wealthiest state, São Paulo (SP); a poor and largely unequal state,
Bahia (BA); and a poor and comparatively less-unequal state, Ceará (CE). Each was sampled so
as to represent an independent, representative stratum, with a margin of error of less than 5%.
Figure 1 shows how each ranks in national income distribution whereas Figure 2 displays
declared territorial-cultural identity.
In Figure 1, units are distributed in two dimensions: inequality (Gini coefficient) and
wealth (average per capita income of respondents’ households, in Brazilian currency). The
Northeast region (NE), the poorest and most unequal, returned average per capita income of
less than BRL 700 (equivalent to US$ 350 at the time of the interviews) and a Gini coefficient
over 0.54. It and the North (NO) macro-region both display levels of inequality above, and levels
of wealth below, the Brazilian means (shown by dotted lines). Two of the oversampled states
belong to the Northeast macro-region, and thus appear in the upper left of the chart. Bahia
state (BA) can be seen to be considerably more unequal than average for the Northeast macro-
region, whereas Ceará state (CE) is slightly poorer and reasonably less unequal than Bahia.
The wealthiest macro-regions appear on the right of the chart. Their average per capita
income is over BRL 1200 (US$ 600). The Gini coefficient for the Southeast (SE) macro-region
practically coincides with the dotted line representing the Brazilian mean. The Center-West
macro-region is more unequal, whereas the South macro-region is the least unequal. São Paulo
(SP), a southeastern state, the wealthiest unit surveyed, has a Gini coefficient below the
national average.
the project explored how far citizens’ understandings and practices of political participation and social solidarity were regionalized rather than nationalized at the scale of the Nation-State. 7 As in the CANS Project, interviews were conducted by telephone.

9
Figure 1: Distribution of territories by income and Gini coefficient
Source: IBGE, Pesquisa Nacional por Amostra Domiciliar, 2013 (household survey)
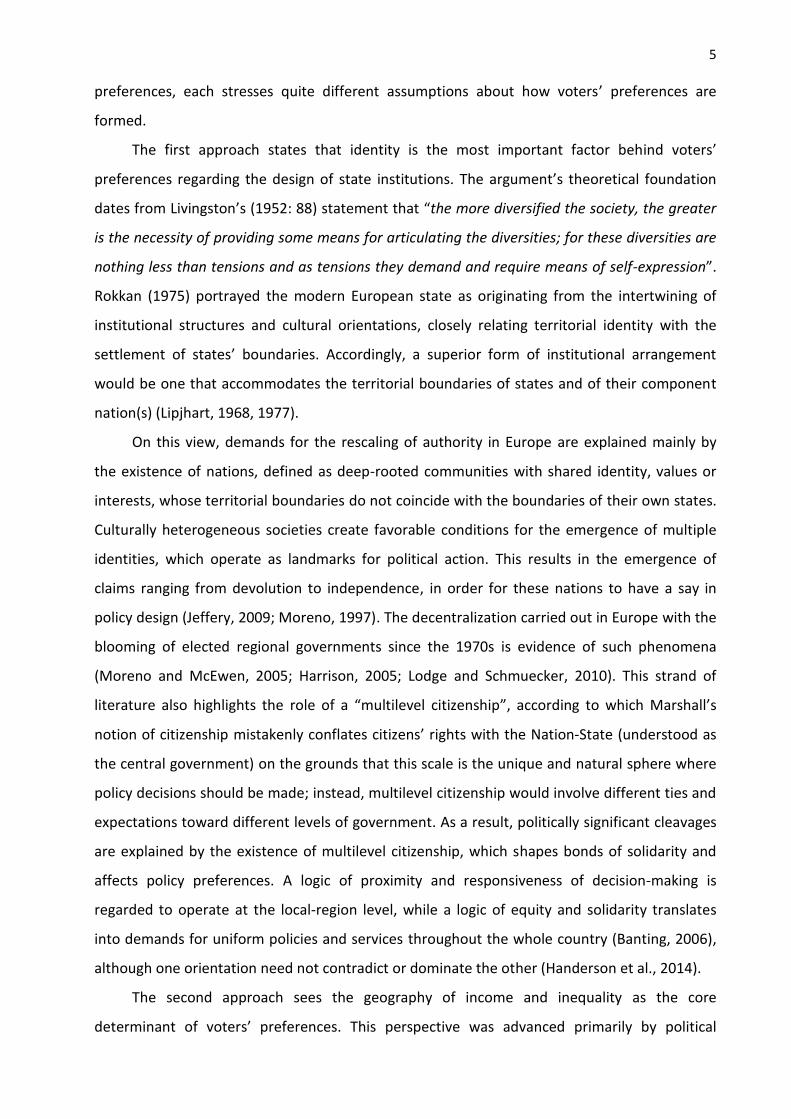
Figure 2: Distribution of territories by identity
Source: Survey “Images of the Brazilian Federation”, Center for Metropolitan Studies (2013)
Figure 2 displays values for territorial identity. We applied the “Moreno question” to ask
respondents their feelings of identity toward either their state of residence or Brazil, with five
excluding options (Moreno, 2001). Options ranged from high regional identity to high national
13% 15% 21%
14% 19%
24% 28%
12%
63% 65% 60%
65% 70%
57% 53%
66%
23% 20%
17% 20%
10%
18% 18% 22%
0%
10%
20%
30%
40%
50%
60%
70%
80%
BA CE CW NE NO SE SP SU
National.ID Both Regional.ID

10
identity8. Answers were aggregated by assigning respondents to three categories. Those who
identified equally with Brazil and their home state were considered as supporting both
identities (a neutral position, and so, in regression models, the reference category). Those who
declared an attachment to their own state, but not to the country, plus those who felt more
attached to their own state than to the country, were considered to have a regional identity
(R). Lastly, a third category comprised those who reported attachment to Brazil, but not to their
home state, plus those who declared greater attachment to the country than to their own
state. These were considered to have a national identity (N).
As can be seen from the values in the figure, the two pole groups – those attached to the
country (N) and those attached to their own states (R) – are not a majority in any unit of
observation. Even taking both groups together, they do not total half the interviewees in any
macro-region or state. The majority, therefore, feels attachment to both Brazil and their own
states. This is an important finding with regard to the kind of territorial attachment that best
describes Brazil. In the CANS project, none of the five countries surveyed returned similar
scores for this dual attachment, revealing more polarized identities9 (Jones et al., 2012: 22).
In two macro-regions – the South (SU) and the Northeast (NE) – regional identity prevails
over national identity. In the former, 22% of the sample were sorted as R against only 12%
more attached to their national identity. Both the Northeast macro-region and its oversampled
states – Bahia and Ceará – display the same pattern. Although the majority of respondents
declared they were as attached to their own states as to Brazil, the second most preferred
choice revealed stronger attachment to states.
In the other three macro-regions, preferences ranked differently, with national identity
(N) prevailing over regional identity (R). North was the macro-region with the smallest
proportion (only 10%) of respondents declaring regional identity. The Center-West and the
Southeast score high on national identity: marginal frequencies were 20% in both units. In São
Paulo, the group of those who felt Brazilian outnumbered those feeling fundamentally
“paulista”. Again, the oversampled state displayed a pattern similar to its surrounding macro-
8 Question: I am going to read various statements and you choose which one describes your feelings best. (1) I identify with my [state of residence], but not with Brazil; (2) I identify more with my [state of residence] than with Brazil; (3) I identify equally with my [state of residence] and with Brazil; (4) I identify more with Brazil than with my [state of residence]; or (5) I identify with Brazil, but not with my [state of residence]. 9 Only 4 out of the 14 regions observed scored 50% or more on dual identity: Salzburg (Germany), Alsace (France), Galicia and Castilla la Mancha (Spain); no region in the United Kingdom and Austria showed comparable figures.

11
region: although the majority declared feeling as attached to São Paulo as to Brazil, the second
largest group identified mainly with Brazil rather than São Paulo.
Observe that the geographies of identity and income do not seem to correlate. Poorer
and wealthier regions display different patterns of feelings of attachment. Migration history can
be deployed in the endeavor to understand this territorial distribution of feelings of belonging.
From the 1970s on, the three macro-regions where N R were the destination of a massive
wave of low-skilled immigrants seeking jobs either in flourishing industries in the Southeast or
in the expanding mining and agricultural frontier of the North and Center-West. Meanwhile,
there was emigration from the South and the Northeast. This is explained mainly by extreme
poverty in the Northeast, and a combination of smallholdings and large families in the South.
The regression models include other independent variables originating in the survey:
Per capita household income: two different questions asked about the approximate total
income in the household and the number of people living there; accordingly, our per capita
income measure refers to the respondent’s household. However, a measure test conducted
with 2010 Census data returned values which, although not exactly the same, are distributed in
a manner that correlates strongly with the values we collected. We are therefore confident that
the geography of income returned by our survey is reliable as an independent variable.
Importance of elections: people were asked at which level of government they cared
most about elections10. Interviewees could file a single or multiple answer, but were asked to
rank their responses.
Importance of decision-making: people were asked which level of government makes the
most important decisions11. Interviewers could provide a single or multiple answer, but were
asked to rank their responses.
Both independent variables were designed to assess respondents’ perceptions regarding
the current distribution of political and policy authority in Brazil.
Trust in the federal government: people were asked how much they trusted various
different institutions of government12. Those declaring they had some or great trust in the
10 Question: Which of the following elections do you consider the most important? In case of multiple choices, please rank the first and second most important: (i) mayor; (ii) city councilor; (iii) governor; (iv) state representative; (v) president; (vi) senator; (vii) federal representative; or (viii) all are important. 11 Question: Which of the following decisions are most important to you? In case of multiple choices, please rank the first and second most important: (i) decisions by the mayor or city government; (ii) decisions by the governor or state government; (iii) decisions by the president or federal government; or (iv) they all are equally important.

12
federal government, were coded 1; those declaring little or no trust were coded 0. This variable
was designed to control for the effect of appraisal of the federal government on preferences
regarding the territorial distribution of authority. Trust in government is seen as expressing
enduring orientation in favor of a political system as well as evaluation of the incumbent Citrin
and Luks, 2001). In multilevel arrangements, trust in a given government-tier is viewed as
sensible to elections and associated to preferences on the distribution of decision-making
authority (Kincaid and Cole, 2011).
Age: control variable, continuous, in years. Alesina and Giuliano (2011) found that women
and young people display stronger preferences for redistribution.
3. Preferences for Rescaling
This section describes the marginal frequencies of preferences regarding the distribution
of policy and political authority. Table 1 shows preferences on rescaling, either for further
empowering or disempowering a given level of government. It clearly suggests that the status
quo is the single most preferred scenario. Over 40% of respondents would not concentrate
more authority in any of the levels of the federation, nor would almost 49% limit the power of
any of them. Therefore, the status quo is the choice of at least two-fifths of the sample.
Table 1: Preferences for rescaling
(raw data)
Who should have more power(1)?
Total
Presidency State
government Municipal
government Multiple
Answer(*) All None
Preferences 19.1 14.6 20.7 2.7 2.5 40.3 100
Who should have less power (2)?
Preferences 13.1 14.2 19.7 0.8 3.4 48.8 100
Source: Survey “Images of the Brazilian Federation”, Center for Metropolitan Studies (2013) Notes: (1) Question: Considering your mayor, governor, and the president, which of these levels of government should have more power than it has today? Multiple choice is allowed. (2) Question: Considering your mayor, governor, and the president, which of these levels of government should have less power than it has today? Multiple choice is allowed. (*) The respondent chose one the following three combinations: (i) president and governor; (ii) governor and mayor; or (iii) presidency and mayor.
12 Question: How much do you trust the following institutions? (i) the city government; (ii) the state government; (iii) the federal government; and (iv) the judiciary. Options were: (a) trust a lot; (b) some trust; (c) little trust; or (d) no trust at all.

13
On the other hand, most respondents would prefer alternative arrangements to the
current vertical distribution of authority. Roughly one-fifth would further empower the
presidency, and nearly the same proportion would vest more authority in municipal
government; and almost 15% think state governments should have more power. At the same
time, one-fifth wanted municipalities to have less power, 14% would restrict the authority of
state governments, and 13%, the power of the presidency.
True to the multipolarity of the Brazilian Federation, there is no discernible majority in
favor of either further centralization or further decentralization. Municipalities are the first
choice both to have more and to have less power. There is no hierarchy of choices that could be
interpreted as signaling a ranking of preferences. Respondents in favor of the status quo
represent the largest single group and, although the majority of the sample supports some kind
of rescaling, no alternative has the support of more than one-fifth of respondents.
It may be argued that the numbers in Table 1 fall short of producing a precise picture of
public attitudes toward the Brazilian Federation. Two considerations should be borne in mind.
First, prescribing more power to one level of government does not necessarily mean imposing
limits on the others. Second, the questions referred to desired changes, that is, they elicited a
normative preference, while ignoring assessments about how the federation actually works. A
respondent might want the president to have more power because of a perception that too
much authority is concentrated in the hands of governors and/or mayors. We address these
issues in the subsections below.
3.1.Directions of rescaling: refining measures of preferences
Preferences for rescaling (in any direction) or for the status quo should be understood in
terms of the multi-scaled notion of membership of a state. Citizens living in a political union
have been educated politically in a polity where power is distributed across different levels of
government. Accordingly, their preferences toward the vertical distribution of authority do not
necessarily imply a zero-sum game where extending the power of a given level of government
necessarily means diminishing the power of another. Actually, such a zero-sum game would be
plausible only in dual federations, where policy-making authority in its entirety is clearly
separated among jurisdictions.
However, the dual model is rare among federal states, as a number of empirical studies
have demonstrated (Braun, 2000; Grodzins, 1966; Rodden, 2004), and Brazil is no exception. In
addition, power in Brazil is shared functionally, meaning that different levels of government are

14
entitled to authority over the same policies. Accordingly, preferring both the Union and the
municipalities to have more power cannot necessarily be understood as contradictory, since
further empowering both may merely mean entitling public authorities to intervene in more
policy areas.
To address this problem, we combined the questions of Table 1 and built a variable we
call rescaling preference. Consistently opting for the status quo requires saying you would
neither further empower nor limit the current powers of any level of government. As a result,
preferences toward the vertical distribution of authority result from the combination of wishes
regarding further empowering one level of government and not empowering any other. Table 2
shows the distribution of our sample’s rescaling preferences categorized into four respondent
profiles (see table A1 in the Appendix). “Centralists” are those who supported further
empowering the presidency and also either wanted to limit the authority of the two other
levels or felt none should have less power. “Regionalists” wanted both more power for state
governors and either less power or no additional limitation for the two other levels.
“Municipalists” advocated further empowering municipal governments and answered that the
powers of the president or governors should be lessened or simply stay the same.
Table 2: Rescaling Preferences (% by row)
Region/State Centralist Regionalist Municipalist Status quo
Brazil (BR) 19.34 13.52 20.44 24.86
Center-West (CW) 17.81 14.38 18.49 23.29
Northeast (NE) 22.42 12.2 21 24.41
North (N) 18.59 16.67 15.38 25.64
Southeast (SE) 17.25 13.26 19.97 27.16
South (S) 14 16.67 23 22
Bahia (BA) 21.61 11.46 23.96 22.4
Ceará (CE) 21.35 13.02 22.66 24.22
Sao Paulo (SP) 17.19 13.02 22.14 24.74
Source: Survey “Images of the Brazilian Federation”, Center for Metropolitan Studies (2013) Notes: Rows do not total 100 because percentages were calculated using the whole sample.
Even if we apply these more restrictive criteria, the Status quo group continues the
largest. Roughly 1 in 4 respondents would not change the vertical distribution of authority in
the Brazilian federation. Centralists and Municipalists are the second most frequent options:
each group represents around 20% of the interviewees. Regionalists comprise only 13.5% of the
sample. Once again, although the ranking of preferences clearly shows a majority in favor of the

15
status quo, the differences between the percentages in favor of each option are not that large.
Normative preferences regarding the vertical distribution of authority are more or less evenly
distributed across the different possible alternatives. Except for those in favor of further
empowering governors, the three other options account for a fifth to a quarter of public
opinion.
All over the world, normative preferences toward the vertical distribution of authority are
concentrated territorially, as the cases of Quebec, Catalonia and Scotland clearly show. That is,
national averages say little about them. So, Table 2 also displays the distribution of such
preferences across Brazilian macro-regions and selected states. It clearly shows that the
preference for the status quo is consistently the majority option in all units of observation,
revealing that it is an choice shared all over the country.
3.2. Rescaling preferences and favorable assessment
Normative preferences are not isolated from favorable assessments of a given state of
the world (Buchanan, 1995; Ferejohn and Pasquino, 2001), as do preferences feed back into
policy changes. Wlezien (1995) advanced the “thermostatic model”, according to which the
public sends signals to adjust a given policy when the actual policy “temperature” differs from
their preferred level; once sufficiently adjusted, the signal stops. Thus, current public
preferences for more spending, for instance, reflect both preferred levels of spending and an
assessment of current spending levels.
The “thermostatic model” can be applied to afford a better understanding of preferences
towards institutional design. Is the Centralist preference due to an evaluation that the Brazilian
federation is too decentralized, as authors like Shah (2006) have argued, or do Centralists see
the Brazilian federation as already highly centralized, as Arretche (2012) has argued? In other
words, the same normative preference can be based on quite contrasting assessments of a
current vertical distribution of authority.
The data from assessing public opinion on the current state of the vertical distribution of
authority in the Brazilian federation allow us to address this issue. Questions about the
importance of elections and the right to decide were put to interviewees13, and the responses
were combined with the rescaling preference profiles shown in Table 2. These two questions
were used as indicators of the interviewees’ evaluation of the current importance of each level
of government. Note that it does not matter whether respondents’ evaluation is right or wrong.
13 For the questions, see footnotes 10 and 11.

16
What matters is the relationship between their perceptions and their normative preferences. A
respondent who prescribes no change, but perceives the Brazilian federation as quite
centralized, can be depicted as a Centralist. However, another individual may be equally in
favor of the status quo, but sees municipalities as being currently the most important source of
authority. That individual should be regarded as a Municipalist.
Table 3 shows data combining the normative preferences from Table 2 with each
interviewee’s ranking of the importance of elections. Federal elections are seen as by far the
most important. More than three-fifths of respondents think that voting in the federal elections
ranks highest. Moreover, the group that gives more importance to local elections is nearly
twice as large as that giving more importance to state-level elections. Therefore, although both
states and municipalities have the same status in the Brazilian federation, in that both are
equally autonomous federal entities under the 1988 Federal Constitution, voters appear to give
more importance to the local level than the state level. The fact that a minority of the public
sees state-level elections and decision-making arenas as most important is rather striking given
that Brazil is a federation and one might expect states to be perceived as more important than
local governments.
Table 3: Rescaling Preferences and Perceptions of the importance of elections (in %)
Rescaling Preferences Elections(*)
Centralist Regionalist Municipalist Status quo Total
Federal 17.56 9.11 15.63 19.55 61.86
State 2.29 4.04 1.93 2.66 10.92
Local 3.02 2.53 7.18 5.55 18.29
All 2.17 1.21 1.51 4.04 8.93
Total 25.05 16.9 26.25 31.8 100
Source: Survey “Images of the Brazilian Federation”, Center for Metropolitan Studies (2013) Note: X2 = 105.2, df = 9, p-value = 0 (*) Variables: Importance of elections: (1) Municipal (includes both the election for mayor and for municipal councilors); (2) State (includes both the election for governor and for state representatives); (3) Federal (includes the President, and upper and lower houses of congress) (4) All: all elections.
The data in Table 3 show that the majority within each group of rescaling preferences
acknowledges federal elections as most important. Both those preferring the status quo or any
form of rescaling rank federal elections highest by a long margin. On the other hand, there
seems to be some association between rescaling preferences and election ranking. Regionalists
form the largest group of those who identify state elections as the most important, while those
who ascribe most value to local elections are the largest single group among the Municipalists.

17
Table 4 shows the same combination between rescaling preferences and positive
perception of the Brazilian federation, now taking decision-making as the observable variable.
Figures are somehow different from those in Table 3, but the results point in the same
direction. The majority of interviewees sees the presidency as making the most important
decisions in Brazil. For all groups of normative preferences, most respondents perceive the
President as making the decisions they care most about. The hierarchy of importance is also
similar: after the president, mayors are seen as making more important decisions than
governors.
Table 4: Rescaling Preferences vs. Perceptions of the Importance of decision-making (%)
Rescaling Preferences Decision-making
Centralist Regionalist Municipalist Status quo Total
President 15.74 8.44 14.55 15.52 54.25
Governor 4.51 3.71 4.73 15.92
Mayor 4.28 3.88 6.85 7.19 22.19
All 1.65 0.68 1.31 3.99 7.64
Total 24.64 17.51 26.41 31.43 100
Source: Survey “Images of the Brazilian Federation”, Center for Metropolitan Studies (2013) Notes: X2= 72.3, df = 9, p-value = 0
Both variables on the perception of the Brazilian federation correlate. So, we can combine
the answers to these two questions and build a variable that measures preferences for the
vertical distribution of power and takes account of voters’ perceptions of the “temperature” of
the Brazilian federation, as suggested by the “thermostatic model’. We believe this variable
captures strong rescaling preferences, because it groups individuals according to their declared
wish to empower the level of government they perceive as currently the most important. As a
result, this new variable makes it possible to distinguish better the true normative preferences
of those who declared their support for the status quo.
The variable has four categories. Centralists are those who would like to further empower
the Union plus those who prefer the status quo (as in Table 2) and perceive the current vertical
distribution of authority as already centralized (as in Tables 3 and 4). Regionalists are those who
would give more authority to states plus those who favor the status quo and also perceive the
state level as both holding the most important elections and making the most important
decisions. Municipalists are those who advocate rescaling in favor of municipalities plus those
in favor of the status quo who identify local power as prominent. The fourth category, the

18
Indifferents, comprises individuals who have no discernible rescaling profile nor express any
substantial opinion regarding the present degree of (de)centralization in the federation14.
The results are shown in Table 5. As already said, the main advantage of this variable is
that it offers a better description of the rescaling profile of the group that favors the status quo.
Most of them think the Brazilian federation is already centralized and normatively agree with
this vertical distribution of authority. Note that strong Centralists represent 30.6% of our
sample (Table 5), against the 19.3% Centralists (in Table 2). For this reason, the Indifferent
represent a smaller proportion in our sample – 9.1% in Table 5.
Table 5: Strong Rescaling Preferences in Brazil (% by row)
Region/State Strong Centralist Strong
Regionalist Strong
Municipalist Indifferent
Brazil (BR) 30.59 14.7 23.76 9.1
Center-West (CW) 28.08 15.75 20.55 9.59
Northeast (NE) 33.87 13.34 24.5 8.33
North (N) 25 20.51 19.87 10.9
Southeast (SE) 30.35 13.9 22.04 11.34
South (S) 23.67 17.67 28.33 6
Bahia (BA) 33.33 11.72 27.34 7.03
Ceará (CE) 32.55 14.84 24.74 9.11
Sao Paulo (SP) 27.86 13.28 23.96 11.98
Source: Survey “Images of the Brazilian Federation”, Center for Metropolitan Studies (2013) Note: Rows do not total 100 because percentages were computed using the whole sample.
Note that this method of capturing rescaling preferences did not change the ranking of
preferences found from the outset. After all controlling measures had been applied,
Municipalists rank ahead of Regionalists in all units of observation except the North macro-
region. Only around 15% of the public thinks Brazilian states should be further empowered,
even if that would not imply limiting the authority of the Union and municipalities. Even in the
wealthiest state, Sao Paulo, priority for the regional level does outrank support for empowering
other levels. As for localism, it is quite remarkable that the South is the only macro-region
where those in favor of empowering municipalities outnumber the Centralists.
Perhaps surprisingly, Regionalists, those who would like to rescale toward the state level,
are a minority among our respondents. Brazil is widely depicted as a polity dominated by
governors, with states at the center of gravity of a highly decentralized federation. This
14 The categories are described in full in the Appendix.

19
conventional view has been challenged by empirical studies (e.g. Arretche, 2012), and our
survey brings new evidence to question that assumption.
In sum, we have two measures on the normative preferences for the vertical distribution
of power in Brazil. One -- called rescaling preferences -- groups individuals according to their
preferences for change regardless of their evaluation about the current distribution of authority
in the Brazilian federation. In this case, the pro-status quo group (25%) is the largest one
although municipalists (21%) and centralists (19%) represent an important share of the public.
The second variable -- called strong rescaling preferences -- aims at unpacking the pro-status
quo group and better distinguish which institutional design they indeed prefer. In this group,
rescaling preferences are controlled by individual's perception about which tier of government
holds the most important elections and makes the most important decisions. According to this
measure, strong centralists are the largest group (31%) although strong municipalists represent
24% of our sample.
The next step is to understand better the factors behind this distribution of preferences
toward the vertical distribution of authority, and explore the explanatory power of the two
main theories discussed in section 2.
4. Identity, geography of income and rescaling preferences
Given that support for the centralization of political authority is unambiguous, we
decided to take this option as the main dimension of interest. We recoded each original
variable as a binary. From here on, the value of the rescaling preference variable is 1 if the
individual advocates further empowerment of the central level. Note that individuals grouped
as Centralists by this variable declared themselves in favor of further empowering the central
sphere and also diminishing the powers of the other two levels (in Table 2). We named this new
variable RTC (Rescaling Toward the Center). The strong rescaling preference in favor of
centralization was also recoded as a dummy in the same way, so that 1 represents those who
support a centralized design even though they perceive the central government as being
currently the strongest and if their option means either further empowering the central
government or maintaining the status quo (in Table 5). This variable was named CID
(Centralized Institutional Design).
Table 6 shows the results of logit regressions using RTC and CID as dependent variables.
Details of the model design and model selection can be found in the appendix. The reference
category for the logit is the group living in the Northeast macro-region, who declared

20
themselves as identifying equally with the whole country and their own state, who think that
subnational elections are as important as national elections, that central and local government
decisions are equally important, and who express distrust of the federal government.
Therefore, except for the variables related to trust in the federal government and to macro-
region of residence, the reference category is individuals who expressed a rather neutral
position in the dimensions considered. In two of the six models (3 and 6), income groups were
divided by quartiles, and the reference group is the first quartile.
Our results show unambiguously that – regardless of regional identity, how the income-
related variables are operationalized – individual income is the best predictor of the preference
for centralization. Put simply, wealthier citizens are less favorable to centralized vertical
distribution of authority, whereas the poor preferred a centralized design, no matter what
attachment they revealed toward the territory. Regression models with aggregate data, as well
as those for each macro-region, returned results in the same direction, whether income was
treated as a continuous variable or as a categorical variable expressed in quartiles. The most
eloquent results were found in models regressing the rescaling preference (RTC).
When the dependent variable was the preference for rescaling toward centralization
(RTC), income proved significant in both models tested with pooled data, involving respondents
from the whole sample. On the assumption that the marginal effect of income was uniform
within each group, preference for centralization was just 0.78 times as likely15 to appear when
income increased by BRL 72416. If income increased by BRL 1,448, the option for centralization
was just 0.62 times as likely. In this case, our estimation showed that the value may be as low
as 0.49 or as high as 0.78, at a 95% level of confidence.
15 The figure expresses the odds ratio between those, at a given income level, who prefer rescaling and those who do not. 16 The national minimum wage in May 2014 (=US$ 327).

21
Table 6: Logit Regression
RTC RTC RTC CID CID CID
(1) (2) (3) (4) (5) (6)
NationalId 0.075 0.073 0.064 0.052 0.055 0.050
(0.167) (0.168) (0.167) (0.144) (0.144) (0.144)
LocalId 0.144 0.167 0.119 -0.159 -0.145 -0.170
(0.165) (0.166) (0.164) (0.142) (0.143) (0.142)
Income -0.0003***
-0.0003**
-0.0001 -0.00004
(0.0001) (0.0001)
(0.0001) (0.0001)
Income 4th Q
-0.605
***
-0.238
(0.192)
(0.159)
Income 3th Q
-0.219
-0.006
(0.166)
(0.145)
Income 2th Q
-0.173
-0.160
(0.168)
(0.150)
CW -0.137 -0.511 -0.148 -0.070 -0.122 -0.071
(0.266) (0.371) (0.266) (0.226) (0.307) (0.227)
NO -0.189 -0.368 -0.185 -0.486**
-0.411 -0.462**
(0.268) (0.360) (0.268) (0.232) (0.314) (0.233)
SE -0.323**
-0.099 -0.340**
-0.106 -0.116 -0.126
(0.155) (0.222) (0.156) (0.132) (0.162) (0.133)
SU -0.547***
-0.193 -0.563***
-0.362**
-0.068 -0.367**
(0.211) (0.324) (0.212) (0.170) (0.245) (0.172)
Imp Elec UF/Mun -0.456* -0.457
* -0.449
*
(0.256) (0.257) (0.256)
Imp Elec Nat -0.002 -0.009 -0.009
(0.235) (0.236) (0.234)
Imp Dec Nat 0.477
* 0.473
* 0.465
*
(0.258) (0.259) (0.258)
Imp Dec UF/Mun 0.070 0.067 0.064
(0.269) (0.270) (0.269)
Trust Fed Gov 0.066 0.063 0.070 0.143
*** 0.144
*** 0.140
***
(0.062) (0.062) (0.062) (0.052) (0.053) (0.053)
Age 0.019***
0.019***
0.018***
0.010***
0.010***
0.010***
(0.004) (0.004) (0.004) (0.004) (0.004) (0.004)
CW:Income
0.0004
0.00004
(0.0003)
(0.0002)
NO:Income
0.0002
-0.0001
(0.0003)
(0.0003)
SE:Income
-0.0003
0.00000
(0.0002)
(0.0001)
SU:Income
-0.0005
-0.0003
(0.0003)
(0.0002)
Const -1.887
*** -1.921
*** -1.859
*** -0.999
*** -1.018
*** -0.965
***
(0.387) (0.389) (0.392) (0.198) (0.204) (0.209)
N 1,497 1,497 1,494 1,537 1,537 1,534
Log Likelihood -790.246 -786.308 -794.730 -1,005.861 -1,004.260 -1,002.739
AIC 1,608.493 1,608.615 1,621.460 2,031.722 2,036.520 2,029.479 *p < .1;
**p < .05;
***p < .01

22
Profiles of territorial identity revealed no consistent association at the 0.05 level of
confidence; the p-value for categories assessing identity was greater than 0.38. Macro-region of
residence made a difference in some cases: living in two of the three areas where per capita
income was above the national average was accompanied by lower probabilities of support for
rescaling toward the center. In the model that do not include interactive term, preference for
centralization was 0.72 times as likely to be found in the Southeast as in the Northeast (the
macro-region of reference); at a 95% confidence level, this figure could be as low as 0.53 or as
high as 0.98. In the South, the preference for centralization was 0.38 to 0.87 times as likely as in
the Northeast, at the same confidence interval. Note that no significant difference was found in
the Center-West or the North.
In Model 3, where income is expressed in quartiles, one of the categories for individual
earnings was found to associate with stronger rejection of further empowering the center.
Preference for centralization was 0.54 times as likely in the 4th income distribution quartile as in
the first. In this case, the confidence interval lies between 0.38 and 0.80. Once again, living in
the South and Southeast is associated with stronger rejection of centralization, at a magnitude
similar to that found in the previous model.
However, income is not significant in models that have CID as dependent variable. In
Model 4, where income is a continuous variable, the p-value was 0.17. In Model 6, none of the
four income categories was consistently associated with CID. The same applied to the variables
expressing territorial identity.
Of the macro-regions, the Southeast did not differ significantly from the Northeast (the
reference category) in either model. Rejection of centralization in the South still holds: the
proportion of those in favor of a centralized design is significantly lower than among
northeasterners, no matter how individual income is operationalized. In terms of CID, support
for centralization differs significantly between the North and Northeast; preference for a
centralized institutional design is 0.49 time as likely in the former macro-region as in the latter.
This is an interesting finding. Although North and Northeast do not differ in terms of the
proportion of people who would prefer to change the status quo toward centralization, they do
differ in terms of support for centralized design. In this case, support for centralized design is
significantly more likely in the Northeast than in the North.
Some control variables turned out to be consistently associated with our dependent
variables. In the appendix, we include gender and education as controls. Models 1, 2, and 3 of

23
table 6 controlled for the effects of the individual attributes on perceptions of elections and
decisions at the different levels of government. At a 0.1 level of confidence, perceiving
subnational elections (at either the state or local level) as the most important was significantly
and negatively associated with preference for centralization. Consistent with that, support is
more common among those who regard decisions at the federal level as the most important.
Trust in the federal government seems positively associated with a strong preference for
centralized institutional design. That option is 1.15 times more likely to appear among people
who trust this level of government than among those who do not. For a 95% confidence
interval, this value can range from 1.05 to 1.27.
Overall, assuming that pooled data provides valid information, that the assumption of
linearity of the continuous covariates in the logit of RTC and CID holds for the pooled data (see
Appendix), and that the marginal effect of such covariates is constant between groups, regional
identity can be said not to affect preferences toward the vertical distribution of authority in
Brazil. Instead, income is consistently and negatively associated with a preference for
centralization. However, this association is weakened among individuals who prefer a
centralized design and who acknowledge that the Brazilian federation is already centralized. For
this group of individuals, trust in the federal government appears as a covariate with significant
effect on preference for centralized design.
Figure 1 shows that the CW and SU differ slightly in average per capita income, but are on
opposite sides regarding within-region income inequality. Table 6 meanwhile, shows that,
controlling for income, the South (SU) and Southeast (SE) regions are significantly different
from the North (NO), displaying much less support for centralization. Although a better
measure of within-region inequality is required here, this does suggest that this may be the
dimension that matters for preferences. In other words, the SU is significantly less inclined to
support centralization that the NO and CW, because it is less unequal. The model with
interaction points in the same direction. Finally, as clear in Table 6, no evidence was found of
support for centralization increasing with increased income in poor and unequal regions.

24
5. Concluding remarks
This study used national survey data to examine preferences with regard to the vertical
distribution of authority in Brazil, and to test two broad, competing explanatory theories – one
stressing the role of identity and the other, the geography of income – as to the underlying
formative sources of such preferences.
Our findings show that voters perceive Brazil to be a centralized federation, in that the
vast majority of respondents regarded the federal sphere as holding more important elections
and making more important decisions than either the state or municipal levels. Nonetheless,
most interviewees held a preference for either maintaining the status quo or further
centralizing the federation.
Preference for further empowering local governments was not negligible, however. It was
the second most frequent option all over the country, indeed outnumbering the preference for
centralization in the South macro-region, the wealthiest and least unequal macro-region of the
country. Perhaps surprisingly, given the widespread notion that states are powerful in the
Brazilian federation, the state sphere fared worst in terms of the wishes expressed by the
public.
The way we operationalize the data and our results yielded evidence supporting the claim
that neither the geography of income nor cultural identities fully explained preferences
regarding the vertical distribution of authority. Regression models controlling for income, age,
perceived importance of elections and decision-making, and trust in the federal government,
showed that identity-related variables had no significance at the 0.1 level.
If our calculations are not wrong, we found evidence to support the old-fashioned
proposition that class trumps region in preferences regarding the vertical distribution of
authority. Roughly speaking, support for centralization was significantly more frequent among
poorer citizens, regardless of the wealth of the region they lived in. Actually, the most eloquent
evidence gathered points to an association with a single direction: the wealthier the citizen, the
less frequent the support for centralization.
This statement held for different models with pooled data, data from macro-regions, and
from oversampled states. Operationalized as a continuous variable in BRL, low income turned
out to be an unrivaled predictor of preference for centralization, with statistical significance in
all but two models (for the poor and unequal states of Bahia and Ceará).
However, strong preference for centralization – that is, the subgroup of citizens who see
the Brazilian polity as currently centralized, because the most important decisions and elections

25
take place in the federal sphere – is more consistently associated with trust in the federal
government. Less robust results on the importance of income in shaping preferences regarding
centralization are found when perceptions on the current distribution of authority are taken
into account. In this case, we found significance for income only in models for the South macro-
region and the states of Bahia and Ceará.
This evidence allows us to advance a story that can be explained as follows. History can
be a valuable source to put these findings in perspective. In Brazil, since the early decades of
the 20th century, the central government has played a crucial role in ensuring working class
rights. Most of the existing welfare structure, as well as high-visibility initiatives such as the
Bolsa-Família cash-transfer program, unemployment compensation and raising minimum-wage
real values are supported by the central level. Thus, it is the central government that can claim
most credit in protecting the poor. Hence, historical evidence and symbolic dynamics are
promising dimensions to be explored in order to frame the initial findings of this project
appropriately.
References Abrucio, Fernando (1998). Os Barões da Federação. São Paulo: Hucitec e Edusp. Alesina, Alberto & Giuliano, Paola Giuliano (2011). “Preferences for Redistribution“. in: Bisin, A.
and Benhabib, J. Handbook of Social Economics. North Holland. pp. 93-132. Almeida, Maria Hermínia Tavares de (2005). “Recentralizando a federação?”, Revista de
Sociologia e Política, 24: 29-40. Arretche, Marta (2005). “Quem taxa e quem gasta: a barganha federativa na federação
brasileira”, Revista de Sociologia e Política, no. 24: 69-86. Arretche, Marta (2007). “The Veto Power of territorial governments in Brazil: political
institutions and representatives voting behaviour”, Brazilian Political Science Review, 2: 40-73.
Arretche, Marta (2012). Democracia, Federalismo e centralização no Brasil. Rio de Janeiro: FGV/Fiocruz.
Arretche, Marta (2013) “Demos-Constraining or Demos-Enabling Federalism? Political Institutions and Policy Change in Brazil”, Journal of Politics in Latin America, 5 (2): 133-150.
Bartels, Larry (2008). Unequal Democracy. Princeton: Princeton University Press. Beramendi, Pablo (2007). “Inequality and the Territorial Fragmentation of Solidarity”,
International Organization, 61(4): 783-820. Beramendi, Pablo (2012). The Political Geography of Inequality. Regions and Redistribution.
Cambridge: Cambridge University Press. Bolton, Patrick and Roland, Gérard (1997). “The Breakup of Nations: a political economy
analysis”, The Quarterly Journal of Economics, November, pp. 1057-89. Braun, Dietmar (2000). Public Policy and Federalism. Burlington: Ashgate. Buchanan, James M. (1995). “Federalism as an Ideal Political Order and an Objective of
Constitutional Reform”, Publius: The Journal of Federalism, 25(2): 19-27.

26
Citrin, Jack and Luks, Samantha (2001). "Political trust revisited: déjà vu all over again?", In: Hibbin, John R. and Theiss-Morse (eds.). What is about government that Americans dislike? Cambridge: Cambridge University Press.
Dahlby, B; Rodden, J.; Wilson, L.S. A median voter model of the vertical fiscal gap. Department of Economics, University of Alberta, Working Paper no. 2009-14 (March, 2009).
Draibe, S. (1989). “As políticas sociais do regime militar brasileiro: 1964-84”. In: Soares, Gláucio D. & D’Araújo, Celina (1994). 21 Anos de Regime Militar. Rio de Janeiro: FGV.
Erikson, R. S.; McKuen, M. B.; Stimsom, J.A. (2002). The macro polity. Cambridge: Cambridge University Press.
Ferejohn, John & Pasquino, Pasquale (2001). A teoria da escolha racional na ciência política: conceitos de racionalidade em teoria política. Revista Brasileira de Ciências Sociais: vol. 16, n. 45: pp. 05-24.
Ferrari, Diogo Augusto (2013). Descentralização Fiscal e Repartição da Receita Pública: o FPE na Constituinte de 1988. Masters Dissertation, University of São Paulo.
Foley, Duncan. Resource allocation and the public sector. Yale Economic Essays, VII (9167), 45-98.
Gerring, John; Thacker, Strom C; Moreno Carola (2005). “Centripetal democratic governance: A
theory and global inquiry”. American Political Science Review, 99 (4): 567.
Grodzins, Morton. (1966). The American System: A New View of the Government of the United States. New York: Rand McNally.
Hooghe, Liesbet; Marks, Gary; Schakel, Arjan H. (2010). The Rise of Regional Authority: a comparative study of 42 democracies (1950-2006). London: Routledge.
Hosmer Jr, D. W. and Lemeshow. S. (2004). Applied logistic regression. John Wiley & Sons. Jeffery, Charlie (2009). “Devolution in the United Kingdom: Problems of a Piecemeal Approach
to Constitutional Change”, Publius: the Journal of Federalism, 39 (2): 289-313 Jeffery, Charlie; Lodge, Guy; Schmueker, Katie (2010). “The devolution paradox”, in: Lodge, Guy
& Schmueker, Katie (2010). Devolution in Practice 2010. Edinburgh: Institute of Public Policy Research.
Jones, Richard W.; Lodge, Guy; Henderson, Ailsa; Wincott, Daniel (2012). The dog that finally barked. IPPR Report. London: Institute for Public Policy Research, Jan 2012.
Kazepov, Yuri and Barberis, Eduardo. “Social Assistance Governance in Europe: Towards a Multilevel Perspective”, in Marx, Ive and Nelson, Kenneth (2013). Minimum Income Protection in Flux. Palgrave Macmillan, pp. 217-48.
Keating, Michael (2013). Rescaling the European State. The Making of Territory and the Rise of the Meso. Oxford: Oxford University Press.
Kincaid, John and Cole, Richard L. (2011). Citizens attitudes toward issues of Federalism in Canada, Mexico, and the United States. Publius, 41, no. 1, pp. 53-75.
Leme, H. J. C. (1992). O Federalismo na Constituinte de 1988: representação política e distribuição de recursos tributários. Universidade de Campinas.
Lipjhart, Arendt (1968). The Politics of Accommodation. Pluralism and Democracy in the Netherlands. Berkeley: University of California Press.
Lipjhart, Arendt (1977). Democracy in Plural Societies: A Comparative Exploration. New Haven: Yale University Press.
Livingston, William S. (1952). “A Note on the Nature of Federalism”. Political Science Quarterly, Vol. 67, No. 1 (Mar), pp. 81-95.
Meltzer, Allan H; Richard, Scott F. A rational theory of the size of government. The Journal of Political Economy, vol. 89, 5 (Oct. 1981), 914-927.

27
Montero, Alfred P. and Samuels, David J. (ed.) (2004). Decentralization and Democracy in Latin America. University of Notre Dame Press.
Moreno, Luis (1997). “Federalization and Ethnoterritorial Concurrence in Spain”, Publius: The Journal of Federalism, 27:4 (Fall), pp. 65-84.
______ (2001). The Federalization of Spain. London: Frank Cass. Page, Benjamin I. and Shapiro, Robert Y. (1992). The rational public: fifty years of trends in
Americans’ policy preferences. Chicago: The University of Chicago Press. Peterson. P, (1995). The Price of Federalism. The Brookings Institutions, Washington, DC. Powell Jr., G. Bingham (2000). Elections as instruments for democracy: majoritarian and
proportional views. New Heaven: Yale University Press. Roberts, Kevin W. S. (1977). "Voting over income tax schedules", Journal of Public Economy, 8,
Dec: 329-40. Rodden, Jonathan (2004). Comparative Federalism and Decentralization: on Meaning and
Measurement. Comparative Politics, 36, 4: 481-500. Rodden, Jonathan A. (2006). Hamilton’s Paradox. The Promise and Peril of Fiscal Federalism.
Cambridge, Cambridge University Press. Rokkan, Stein (1975). "Dimensions of State Formation and Nation-Building: A Possible Paradigm
for Research Variation within Europe", in Tilly, C. (ed). The Formation of National States in Europe. Princeton: Princeton University Press.
Romer, Thomas (1975). "Individual welfare, majority voting and the properties of a linear income tax", Journal of Public Economy , 4, Feb: 163-85.
Royston, Patrick and Altman, Douglas G. (1994). “Regression using fractional polynomials of continuous covariates: parsimonious parametric modelling”, Applied Statistics: 429-467.
Serra, José and Afonso, J. R. R. (1999). “Federalismo Fiscal à Brasileira: Algumas Reflexões”, in: Revista do BNDES, 6(12): 3-30.
Shah, Anwar (ed.) (2006). Local Governance in Developing Countries. Washington: The World Bank.
Samuels, David J. and Mainwaring, Scott. (2004), “Strong Federalism, Constraints on the Central Government, and Economic Reform in Brazil”, in E. L. Gibson (ed.), Federalism and Democracy in Latin America. Baltimore/London, Johns Hopkins University Press.
Souza, Celina (1997). Constitutional Engineering in Brazil; The Politics of Federalism and Decentralization. Houndmills, London, New York: Macmillan and St. Martin’s Press.
Treisman, Daniel S. (2007). The Architecture of Government: Rethinking Political
Decentralization. Cambridge: Cambridge University Press.
Weingast, Barry (1995). “The Economic Role of Political Institutions: Market-Preserving Federalism and Economic Development”, in: Journal of Law, Economics, & Organization, Vol. 11, No. 1 (April), pp. 1-31.
Wlezien, Christopher (1995). The public as thermostat: dynamics of preferences for spending". American Journal of Political Science, vol. 39, no. 4 , Nov, pp. 981-1000.

28
Appendix
1. Model Selection The model was selected using the procedure described in Hosmer & Lemeshow (2004). After
checking for significance level of the variables and taking account of theoretical arguments, the variables shown in Table 1 were chosen. Linearity of age and household per capita income were ascertained using non-parametric regression for the dependent variables. Age generally seemed to fit linearly in the logit, although between 50 and about 78 a logarithmic/square root shape is seen, and over 78 a negative quadratic shape appears. Therefore, between continuous age and these options, we decided to use continuous age.
The graphical check of linearity of income in the logit provides even more compelling evidence that modeling the logit of preference as a linear function of household per capita income is a right approach to our sample. The graphics below show the result of a non-parametric regression of logit of preferences in income. The plot at right shows the three quartiles in detail. There is a unique rupture in the linear decrease in the logit of preference for centralization in the third quartile.
When we checked the behavior of the regression with income in categories (four quartiles), log likelihood improved by about 4 points. In the case of income, both approaches were used, because they provided a better test for the hypotheses.
0 2000 4000 6000 8000 12000
-4
-3
-2
-1
0
Overall Distribution
Household Income Capita
Sm
oo
the
d L
og
it
0 500 1000 1500
-4
-3
-2
-1
0
Zoom in the quantile cutpoints
Household Income Capita
Sm
oo
the
d L
og
it
0 300 500 1000

29
The fractional polynomials method (Royston & Altman, 2004) was also used. This method offer the possibility of checking whether a power term can improve overall model fit as compared with the pure linear result given by:
where the term is the sum of J terms that represent the fractional polynomials, and
are the j power functions. Following Hosmer & Lemeshow (2004), we used p={-2,-1,-
.5,0,.5,1,2,3}, but restricted to J={1,2}. The power function is defined by
The model chosen is the one with largest log-likelihood. Given the choice of J={1,2}, we fitted 8 models for J=1 and 36 models for J=2 for each of the continuous variables. In addition to this procedure, the option for a non-linear model in age (and/or income) was considered only if it yielded significant improvement as compared to the linear model (J=1, ). As argued by Royston & Altman (1994) and
Hosmer & Lemeshow (2004), the partial likelihood ratio test with the difference in the log-likelihood from the linear model and the model with power terms as well as the difference between the model with one (J=1) and two (J=2) terms are chi-squared distributed. Accordingly, this test was used to decide the final format with which the continuous variables entered the model. Given the similarity of the results and the relative gain in interpretation, we used the linear model for the continuous variables.
The same procedure, using Lowess, was used to ascertain whether income and age were linear within regions. In a few cases, the relationship seemed to be linear. We therefore used income in categories to evaluate how loglikelihood changed with income within regions, and cut-off points were chosen according to the change in the direction of the curve given by the predicted value of the Lowess regression.
2. Variables A. Territorial identity: We used the “Moreno question” (Moreno, 2001) to measure identity, with five excluding options, ranging from strong regional identity to strong national identity. The question: “I am going to read different statements and you choose which best describes your feelings. (1) I identify with [my state of residence], but not with Brazil; (2) I identify more with [my state of residence] than with Brazil; (3) I identify equally with [my state of residence] and with Brazil; (4) I identify more with Brazil than with [my state of residence]; or (5) I identify with Brazil but not with [my state of residence].” Thus the reference for regional identity was always the state, even in areas where no oversampling was applied. In order to aggregate answers, we assigned the respondents to three categories:
Neutral category: Those who identified equally with Brazil and their home states; Category R (regional identity): Those who declared an attachment to their home state, but not to
Brazil, plus those who felt more attachment to their home state than to Brazil; and Category N (national identity): Those who reported attachment to Brazil, but not to their state of
residence, plus those who declared more attachment to Brazil than to their state. B. Household per capita income: in two different questions, people were asked the approximate total income in their household and the number of people living there; therefore, our per capita income measure refers to income in the respondent’s household. C. Importance of elections: people were asked which level of government holds the most important elections, and provision was made for single or multiple answers. Which election is most important to you: municipal government (including the municipal chamber), governorship (including the state congress) or presidency (including the upper and lower houses of Congress)? D. Importance of decisions: people were asked which level of government makes the most important decisions, and provision was made for single or multiple answers. Which decision is most important to your: those made by the municipality, the governorship or the presidency?

30 E. Trust in the federal government: people were asked how much they trusted different levels and institutions of government; those declaring some or great trust in the federal government were coded 1, those with little or no trust were coded 0. This variable aims to control for effects of evaluations of the present federal government on preferences regarding the distribution of authority. F. Age: continuous control variable expressed in years. G. Rescaling preference: dummy variable created by combining two survey questions. People were asked:
Of your local government, your state government, and the federal government, which should have more power?
Of your local government, your state government, and the federal government, which should have less power?
Individuals could give multiple answers to those questions. For example, they could answer “All should have more power” and “None should have less power”. Respondents were considered to be in favor of centralization if they answered that the federal government should have more power, and that other levels should have less or remain unaltered.
Table A1: Rescaling preference (in %)
Who should have more
power?
Who should have less power? Preferences
Presidency State
government Municipal
government
Multiple Answers
(*) All None Total
Presidency - 3.67 9.30 0.18 (0.18) 5.80 18.96 Centralist
State government
4.12 - 5.23 - (0.16) 5.13 14.49 Regionalist
Municipal government
5.09 6.17 - - (0.22) 9.10 20.51 Municipalist
Multiple answers
0.85 - - - - 0.64 1.49
All - - - - - 2.49 2.49
None 3.03 4.07 4.69 0.51 2.82 25.12 40.28 Statuo Quo (25.12)
Total 13.09 14.17 19.68 0.69 3.38 48.79 100.00
Source: Survey “Images of the Brazilian Federation”, Center for Metropolitan Studies (2013) Note: (*) respondents who chose one of three combinations: (i) presidency and state government; (ii) state government and municipal government; or (iii) presidency and municipal government. H. Strong rescaling preference: This variable was constructed based on the rescaling preference variable, but including as centralist/regionalist/municipalist those who perceived authority as already centralized/decentralized and preferred either the status quo or further empowering such level of government. The two questions that measure perception of the current relative power of each level of government are described above.
Multiple answers were accepted to both questions. Respondents could answer that all levels were important or that, for instance, the central government represents the most important election, but the most important decisions are made by local government. We recoded support for the status quo as relative preference for centralization only in unambiguous cases. That is, interviewees who responded to both questions, for instance, that the federal government makes the most important decisions and holds the most important elections, and also that they preferred the status quo, were considered Centralists on the index measuring strong rescaling preferences. If they answered that the federal government makes the most important decisions, but all elections are equally important, and also that they prefers the status quo over any alternative rescaling, they were considered Centralists. Given that the Brazilian federation has three layers of government, individuals who, for instance, considered some combination of the lower two layers (municipal and state) as important, but preferred the status quo,

31 were not recoded. The same holds for combinations with the upper level (individuals who said, for instance, that the federal government makes the most important decisions, but the local government holds the most important elections). Such cases were not recoded for the rescaling preference index. Accordingly, there remain some cases of preference for the status quo, which here represent the ambiguous cases.
3. Regression with controls (gender and education)

32
Regression Pooled Data - Incluing Educ and Gender as Controls
RTC RTC RTC CID CID CID
(1) (2) (3) (4) (5) (6)
NationalId 0.075 0.041 0.039 0.052 0.049 0.041
(0.167) (0.169) (0.169) (0.144) (0.145) (0.145)
LocalId 0.144 0.106 0.093 -0.159 -0.169 -0.189
(0.165) (0.166) (0.166) (0.142) (0.142) (0.143)
Income -0.0003*** -0.0001* -0.0002** -0.0001 -0.00001 -0.00004
(0.0001) (0.0001) (0.0001) (0.0001) (0.0001) (0.0001)
Center-West -0.137 -0.185 -0.211 -0.070 -0.085 -0.119
(0.266) (0.269) (0.269) (0.226) (0.227) (0.228)
North -0.189 -0.123 -0.125 -0.486** -0.450* -0.456*
(0.268) (0.271) (0.272) (0.232) (0.234) (0.234)
Southest -0.323** -0.385** -0.394** -0.106 -0.132 -0.142
(0.155) (0.157) (0.157) (0.132) (0.133) (0.134)
South -0.547*** -0.615*** -0.607*** -0.362** -0.381** -0.372**
(0.211) (0.212) (0.213) (0.170) (0.170) (0.171)
ImpElec UF/Munic -0.456* -0.520** -0.540**
(0.256) (0.259) (0.259)
ImpElec Nat -0.002 -0.064 -0.083
(0.235) (0.237) (0.237)
ImpDecNat 0.477* 0.510** 0.512**
(0.258) (0.259) (0.260)
ImpDecUF/Munic 0.070 0.107 0.113
(0.269) (0.270) (0.271)
TrustGovFed 0.066 0.069 0.055 0.143*** 0.144*** 0.127**
(0.062) (0.062) (0.062) (0.052) (0.053) (0.053)
Age 0.019*** 0.017*** 0.018*** 0.010*** 0.010*** 0.011***
(0.004) (0.005) (0.005) (0.004) (0.004) (0.004)
Elem Sch
-0.043 -0.027
0.0003 0.016
(0.172) (0.172)
(0.152) (0.152)
High Sch
-0.206 -0.189
0.021 0.036
(0.164) (0.164)
(0.141) (0.141)
Undergrad +
-1.316*** -1.270***
-0.500** -0.459**
(0.353) (0.354)
(0.233) (0.234)
Female
-0.270**
-0.328***
(0.130)
(0.111)
Const -1.887*** -1.716*** -1.527*** -0.999*** -1.014*** -0.805***
(0.387) (0.417) (0.427) (0.198) (0.241) (0.251)
N 1,497 1,497 1,497 1,537 1,537 1,537
Log Likelihood -790.246 -781.620 -779.472 -1,005.861 -1,002.917 -998.551
AIC 1,608.493 1,597.239 1,594.944 2,031.722 2,031.835 2,025.101
*p < .1; **p < .05; ***p < .01