the total economic impact™ of ibm pureflex system · ibm provided the customer names for the...
TRANSCRIPT

A Forrester Total Economic
Impact™ Study
Commissioned By IBM
Project Directors
Jon Erickson and Anish Shah
May 2014
The Total Economic
Impact™ Of IBM PureFlex
System Cost Savings And Business Benefits Enabled By Implementing IBM’s PureFlex System

Table Of Contents
Executive Summary .................................................................................... 1
Disclosures .................................................................................................. 2
TEI Framework And Methodology ............................................................ 3
Analysis ........................................................................................................ 4
Financial Summary ................................................................................... 15
IBM PureFlex System: Overview ............................................................. 16
Appendix A: Composite Organization Description .............................. 17
Appendix B: Total Economic Impact™ Overview ................................. 18
Appendix C: Glossary ............................................................................... 19
ABOUT FORRESTER CONSULTING
Forrester Consulting provides independent and objective research-based
consulting to help leaders succeed in their organizations. Ranging in scope from a
short strategy session to custom projects, Forrester’s Consulting services connect
you directly with research analysts who apply expert insight to your specific
business challenges. For more information, visit forrester.com/consulting.
© 2014, Forrester Research, Inc. All rights reserved. Unauthorized reproduction is strictly prohibited.
Information is based on best available resources. Opinions reflect judgment at the time and are subject to
change. Forrester®, Technographics
®, Forrester Wave, RoleView, TechRadar, and Total Economic Impact
are trademarks of Forrester Research, Inc. All other trademarks are the property of their respective
companies. For additional information, go to www.forrester.com.

1
Executive Summary
IBM commissioned Forrester Consulting to conduct a Total
Economic Impact™ (TEI) study and examine the potential
return on investment (ROI) enterprises may realize by
deploying PureFlex System. The purpose of this study is to
provide readers with a framework to evaluate the potential
financial impact of the PureFlex System on their
organizations.
To better understand the benefits, costs, and risks associated
with a PureFlex System implementation, Forrester interviewed
three customers and conducted an in-depth survey with
another customer. These customers have had nearly a year
of experience using the PureFlex System to streamline their infrastructure and energy costs, increase flexibility through
virtualization, reduce time to integrate new platforms, and to more efficiently provide hybrid cloud infrastructure
environments.
Prior to implementing PureFlex, customers had operated using blade servers in their data center environment for all their
networking and storage needs. However, prior attempts yielded limited success, leaving customers with limited flexibility to
respond to today’s business challenges. These limitations led to high energy costs, increase in IT staff to manage and
administer the environment, and increase in time to deploy cloud strategies. With PureFlex System, customers were able to
streamline and automate processes across key functions and lines of business, enabling them to meet their objectives,
increase productivity, and keep costs in check. Said one IT manager, “PureFlex System is a part of our company’s strategy
to be agile and flexible in addition to reducing our IT costs; it is an important solution for us.”
IBM PUREFLEX GENERATES COST SAVINGS AND INCREASES BOTH END USER AND IT PRODUCITIVITY
Our interviews with three existing customers, an in-depth survey, and subsequent financial analysis found that a composite
organization based on these interviewed organizations experienced the risk-adjusted ROI, benefits, and costs shown in
Figure 1. (See Appendix A for a description of the composite organization.)
The analysis points to benefits of about $560,000 in Year 1 and then $720,000 per year thereafter. On the cost side,
hardware, implementation, and integration costs are estimated at about $250,000 and annual costs in the first three years
which include support, administration, and software maintenance costs are estimated at about $100,000 per year. The total
three-year net present value (NPV) is about $1.05 million.
Beyond the financial benefits, organizations can more quickly deploy their cloud strategies and integrate new platforms onto
the PureFlex System while streamlining their response processes to business needs.
FIGURE 1
Financial Summary Showing Three-Year Risk-Adjusted Results
ROI: 194%
Total three-year NPV: $1.05 million
Payback: 8.5 months
Total three-year benefits: $1.6 million
IBM PureFlex System can help save energy costs,
improve IT staff productivity, and provide agility
and flexibility as the costs and benefits for a
composite organization of 1,200 employees,
based on customer interviews and surveys, are:
Hardware costs: $250,000
Implementation/integration costs: $50,000
Annual support, administration and
software maintenance costs: $100,000
Three-year NPV: over $1 million
2
Source: Forrester Research, Inc.
› Benefits. The composite organization experienced the following risk-adjusted benefits:
• Energy savings of 40% due to consolidation of servers into the PureFlex integrated solution. The composite
organization uses approximately 50 kWh of energy and would realize savings of $200,000 per year on its energy
costs.
• Reduction in application and database software licensing fees. Implementing PureFlex allows companies to
reduce their overall application and database software license fees by 20% due to consolidation. This benefit is
realized starting in Year 2 after implementation.
• Operational efficiencies by consolidating servers, storage systems, and networks. PureFlex significantly
reduces IT management and administration costs through virtualization and consolidation of servers. Our composite
organization can reduce its IT costs by three fully burdened equivalents or $360,000.
• Increase in end user productivity. PureFlex allows a company to manage one system that leads to reduction in
unplanned downtime, which can result in an increase in business productivity by $125,000.
› Costs. The composite organization experienced the following risk-adjusted costs:
• Hardware costs of $250,000. These are initial, one-time fees paid to IBM for purchasing, maintaining, and replacing
hardware to support the PureFlex System.
• Implementation/integration costs of $50,000. These include about 60 man-hours of time to implement the
PureFlex hardware, and integration costs which include data/application migration, professional service fees,
training costs, overlap server environments, and other transition costs.
• Annual support, administration, and software maintenance costs of $100,000. This includes software
maintenance and support costs paid to IBM each year as well as internal support and administration costs to
manage the PureFlex System on a yearly basis. It is important to note that Forrester does not estimate any
hardware maintenance costs to manage PureFlex in the first 3 years of implementation.
Disclosures
The reader should be aware of the following:
› The study is commissioned by IBM and delivered by Forrester Consulting. It is not meant to be used as a competitive
analysis.
› Forrester makes no assumptions as to the potential ROI that other organizations will receive. Forrester strongly advises
that readers use their own estimates within the framework provided in the report to determine the appropriateness of an
investment in IBM PureFlex System.
› IBM reviewed and provided feedback to Forrester, but Forrester maintains editorial control over the study and its findings
and does not accept changes to the study that contradict Forrester’s findings or obscure the meaning of the study.
› IBM provided the customer names for the interview(s) but did not participate in the interviews.

3
TEI Framework And Methodology
INTRODUCTION
From the information provided in the interviews, Forrester has constructed a Total Economic Impact™ (TEI) framework for
those organizations considering implementing IBM PureFlex System. The objective of the framework is to identify the cost,
benefit, flexibility, and risk factors that affect the investment decision.
APPROACH AND METHODOLOGY
Forrester took a multistep approach to evaluate the impact that IBM PureFlex System can have on an organization (see
Figure 2). Specifically, we:
› Interviewed IBM marketing, sales, IT personnel, along with Forrester analysts, to gather data relative to PureFlex System
and the marketplace for PureFlex System.
› Interviewed three organizations and surveyed one organization currently using IBM’s PureFlex System to obtain data with
respect to costs, benefits, and risks.
› Designed a composite organization based on characteristics of the interviewed organizations (see Appendix A).
› Constructed a financial model representative of the interviews using the TEI methodology. The financial model is
populated with the cost and benefit data obtained from the interviews as applied to the composite organization.
› Risk adjustment is a key part of the TEI methodology. While interviewed organizations provided cost and benefit estimates,
some categories included a broad range of responses or had a number of outside forces that might have affected the
results. For that reason, some cost and benefit totals have been risk-adjusted, and is detailed in each relevant section.
Forrester employed four fundamental elements of TEI in modeling IBM PureFlex System’s service: benefits, costs, flexibility,
and risks.
Given the increasing sophistication that enterprises have regarding ROI analyses related to IT investments, Forrester’s TEI
methodology serves to provide a complete picture of the total economic impact of purchase decisions. Please see Appendix
B for additional information on the TEI methodology.
FIGURE 2
TEI Approach
Source: Forrester Research, Inc.
Perform due diligence
Conduct customer interviews
Design composite
organization
Construct financial
model using TEI framework
Write case study
4
Analysis
COMPOSITE ORGANIZATION
For this study, Forrester conducted a total of three interviews and one survey response with representatives from the
following companies, which are IBM PureFlex customers based across the globe:
› Children’s entertainment and consumer products company headquarted in Canada with about 1,000 employees. The
company has offices in multiple countries and distributes its content and products around the world.
› Airline company headquartered in Europe that has an airline fleet that operates mail and cargo flights for postal offices,
newspaper dispatches, and charter services for tour operators.
› Large mining services company based in Southeast Asia with $900 million in annual revenue and 1,000 employees. Does
work with multiple countries in the region.
Based on these interviews, Forrester constructed a TEI framework and an associated ROI analysis that illustrates the areas
these organizations identified as having the greatest financial impact and collected them into a single representative
organization model of costs and benefits.
The organizations began implementation of PureFlex in early 2013 and have been using the PureFlex solution for over six
months. The characteristics of a representative organization that implemented PureFlex include:
› A privately held services company headquartered in Europe.
› Total top line sales of $800 million.
› 1,200 employees across multiple geographies.
› Yearly IT budget of $80 million.
› Single data center environment with yearly opex and capex
budget of $15 million.
› Data center uses about 50 kWh of energy per month.
› Interested in investing into a two-chassis system.
INTERVIEW HIGHLIGHTS
Situation
In 2013, organizations were looking for additional flexibility and control over their infrastructure environment and were asked
to more quickly respond to business challenges. A key area of concern for organizations was managing the complexity within
their SAP application environment. As the SAP application environment continued to grow, organizations were looking at the
benefits of physical and virtual consolidation of their IT environment that supports their SAP applications. Their existing
environment was disintegrated and resulted in lots of skilled IT workers to ensure their systems were managed appropriately
and operated at the efficiencies that their business constituencies required. In addition, cost pressures to do more with less
forced IT executives at the organizations to explore new options. The organizations identified several key points they
considered before deciding to purchase PureFlex:
“The PureFlex solution allows
for our company’s IT
department to be more agile in
fulfilling the business’ needs.”
~IT director, mining services company

5
› Infrastructure-as-a-service (IaaS) platform that can combine
server, storage, and networking hardware needs into one
system.
› Energy cost savings involved with maintaining their blade
servers.
› Flexible environment that can be leveraged with an increased
focus on managing their suite of SAP applications and leveraging
their cloud strategy.
› Increase in IT staff productivity.
› Ease of deployment into their environment.
Solution
The composite organization selected PureFlex System because it is easy to deploy, assists in reducing data center costs,
and has the ability to meet today’s complex and ever-changing business demands.
Results
The organizations’ interview results were collected into a composite model summarizing the costs and benefits of a
representative organization:
› Energy cost savings of 40%. One of the most significant benefits experienced by the composite organization was the
immediate energy savings. These energy savings are realized because of the following features of the PureFlex System:
• The adaptive cooling controls which minimizes system cooling power consumption and airflow requirements, due to
more sophistication in server design with adaptive cooling components that require much less power than traditional
blade servers.
• The chassis data center energy management modes (AKA acoustic modes) which are used to balance acoustics
and airflow usage requirements against performance help optimize power usage.
• The ambient health awareness console which detects hot air recirculation (HAR sensor) and the chassis CFM usage
console which helps organizations manage their energy usage.
› Software license fees reduce by 20%. Because the PureFlex System combines server, storage, and networking into one
management infrastructure, the representative organization was
able to see reduced yearly fees on its software costs. PureFlex
was able to reduce both the application and database software
license costs for organizations. This benefit is realized starting in
Year 2 after implementing PureFlex.
› Increase in IT management and administration productivity.
The preconfigured and converged hardware system comes with
a very easy interface. The reduced time to manage means IT
organizations can re-shift their resources to more strategic items
than just “keeping the lights on.” The composite organization was
able to save up to three full-time equivalent staff members after
implementing PureFlex.
“PureFlex has an extremely
user-friendly interface which
makes it easy to manage our
storage and network.”
~IT director, airline operator
“With PureFlex, we have
reduced costs and increased
productivity.”
~IT director, airline operator

6
› Reduction in unplanned downtime improves end user productivity. The composite organization used to experience
approximately 10 outages a year across severity. These outages would have a severe effect on end user productivity, as
its key applications would go down for approximately one day. By implementing PureFlex, Forrester estimates that this
unplanned downtime is reduced by 50%, which directly impacts end user productivity. Due to its preconfigured and tested
environment, unplanned downtime is decreased due to human error and faster resource provisioning to get at the root of
an issue.

7
BENEFITS
The composite organization experienced a number of quantified benefits in this case study:
› Energy savings by utilizing less power.
› Reduced software licensed fees.
› Increase in IT management and administration productivity.
› Reduction in unplanned downtime of end user applications.
Another important benefit mentioned by interviewed organizations was the ease of which to deploy the system into their
environments. While implementation time depends on a number of factors, the organizations regarded the ease of working
with IBM’s implementation team to install PureFlex into their environment and realize an accelerated payback for their
investment
Energy Cost Savings
The composite organization indicated that a key benefit from the PureFlex implementation was the energy savings that it
experienced starting in Year 1. Prior to implementing PureFlex, the composite organization averaged using 50,000 watts, or
50 kWh, of energy per month to power its data center server environment. For the representative organization, this would
result in an energy bill of approximately $625,000 per year using $0.12/hour costs ($0.12/hour is the average cost based on
the input received from interviewed organizations) and 8,677 hours per year. During the first year, the representative
organization would save 120 hours of energy as it ramps up the PureFlex System into its operation. Starting in Year 2,
organizations can estimate to realize the full energy savings of 40% of their current costs. After implementing PureFlex and
consolidating its storage, server, and networking hardware into one system, the composite organization used 40% or 240
kWh less of energy per year in the steady state after Year 2 which translates in risk adjusted energy cost avoidance of
~$200,000 per year (see Table 1).
TABLE 1
Energy Cost Savings
Source: Forrester Research, Inc.
Ref. Calculation Initial Year 1 Year 2 Year 3 Total
Present
Value
B1 Composite 0 240 240 240
B2 Composite $0.12 $0.12 $0.12 $0.12
B3 Composite 8,677 8,677 8,677 8,677
Bt B1*B2*B3 $0 $249,898 $249,898 $249,898
80%
Btr $0 $199,918 $199,918 $199,918 $599,754 $497,167
Energy Cost Avoidance
Metric
Energy cost avoidance (Risk-
Adjusted)
Amount of kWh energy saved
Energy cost avoidance
Risk Adjustment
Composite Organization uses 50,000 watts or 50 kWh per month or 600 kWh per year. PureFlex helps save 40% on Energy costs.
Average cost per kWh
Number of hours in a year

8
Reduced Software License Fees
The composite organization indicated that another key benefit from the PureFlex System implementation was a reduction in
its yearly software license costs. The organization was able to reduce its software license fees by 20% by having one
converged hardware infrastructure system (see Table 2). Prior to PureFlex, the composite organization averaged $200,000
per year in software license fees across its applications and database licenses. After implementing PureFlex, the yearly
software license fees for the composite organization went down to a risk-adjusted level of $160,000 beginning in Year 2.
TABLE 2
Reduced Software License Fees
Source: Forrester Research, Inc.
Increase In IT Management And Administration Produtivity
Prior to PureFlex, the composite organization had six IT management and administration FTEs with a fully burdened cost of
$120,000 per year. Due to an increase in virtualization and integration of resources across networking, computing, and
storage with PureFlex, after implementation, the composite organization was able to reduce its FTE requirements by 50% in
the steady state. In addition, the organization was able to reduce two FTEs in Year 1 and then an additional FTE in
subsequent years (see Table 3). This result is $342,000 of risk-adjusted cost avoidance per year for the composite
organization after implementing PureFlex.
Ref. Calculation Initial Year 1 Year 2 Year 3 Total
Present
Value
C1 Composite -$ 200,000$ 200,000$
C2 Composite 0% 20% 20%
Ct C1*C2 $0 $0 $40,000 $40,000
100%
Ctr $0 $0 $40,000 $40,000 $80,000 $63,110Software License Cost
Avoidance (Risk-Adjusted)
Fees Avoidance
Software License Cost Avoidance
Composite Organization averages $200,000 per year in software licencing fees. PureFlex helps reduce annual software licencing costs by 20%
Metric
Software Licence Fees
Software License Cost
Avoidance
Risk Adjustment
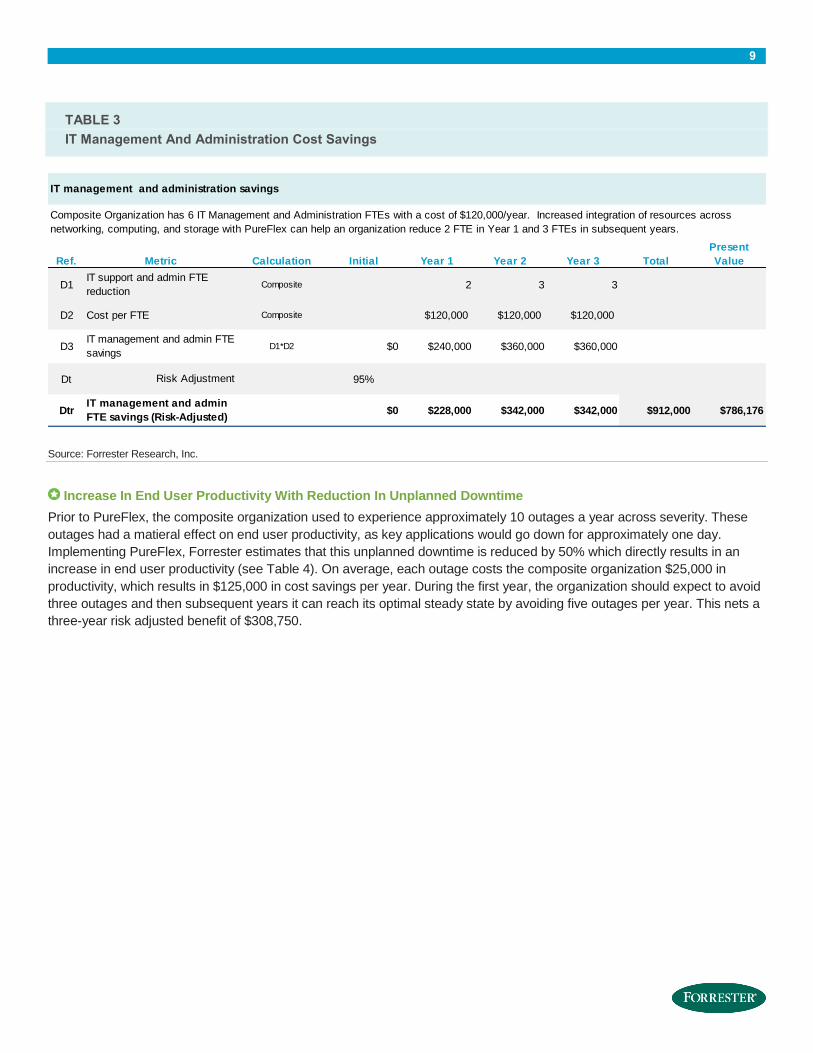
9
TABLE 3
IT Management And Administration Cost Savings
Source: Forrester Research, Inc.
Increase In End User Productivity With Reduction In Unplanned Downtime
Prior to PureFlex, the composite organization used to experience approximately 10 outages a year across severity. These
outages had a matieral effect on end user productivity, as key applications would go down for approximately one day.
Implementing PureFlex, Forrester estimates that this unplanned downtime is reduced by 50% which directly results in an
increase in end user productivity (see Table 4). On average, each outage costs the composite organization $25,000 in
productivity, which results in $125,000 in cost savings per year. During the first year, the organization should expect to avoid
three outages and then subsequent years it can reach its optimal steady state by avoiding five outages per year. This nets a
three-year risk adjusted benefit of $308,750.
Ref. Calculation Initial Year 1 Year 2 Year 3 Total
Present
Value
D1 Composite 2 3 3
D2 Composite 120,000$ 120,000$ 120,000$
D3 D1*D2 $0 $240,000 $360,000 $360,000
Dt 95%
Dtr $0 $228,000 $342,000 $342,000 $912,000 $786,176
IT support and admin FTE
reduction
IT management and administration savings
Composite Organization has 6 IT Management and Administration FTEs with a cost of $120,000/year. Increased integration of resources across
networking, computing, and storage with PureFlex can help an organization reduce 2 FTE in Year 1 and 3 FTEs in subsequent years.
Metric
IT management and admin FTE
savings
Risk Adjustment
IT management and admin
FTE savings (Risk-Adjusted)
Cost per FTE
10
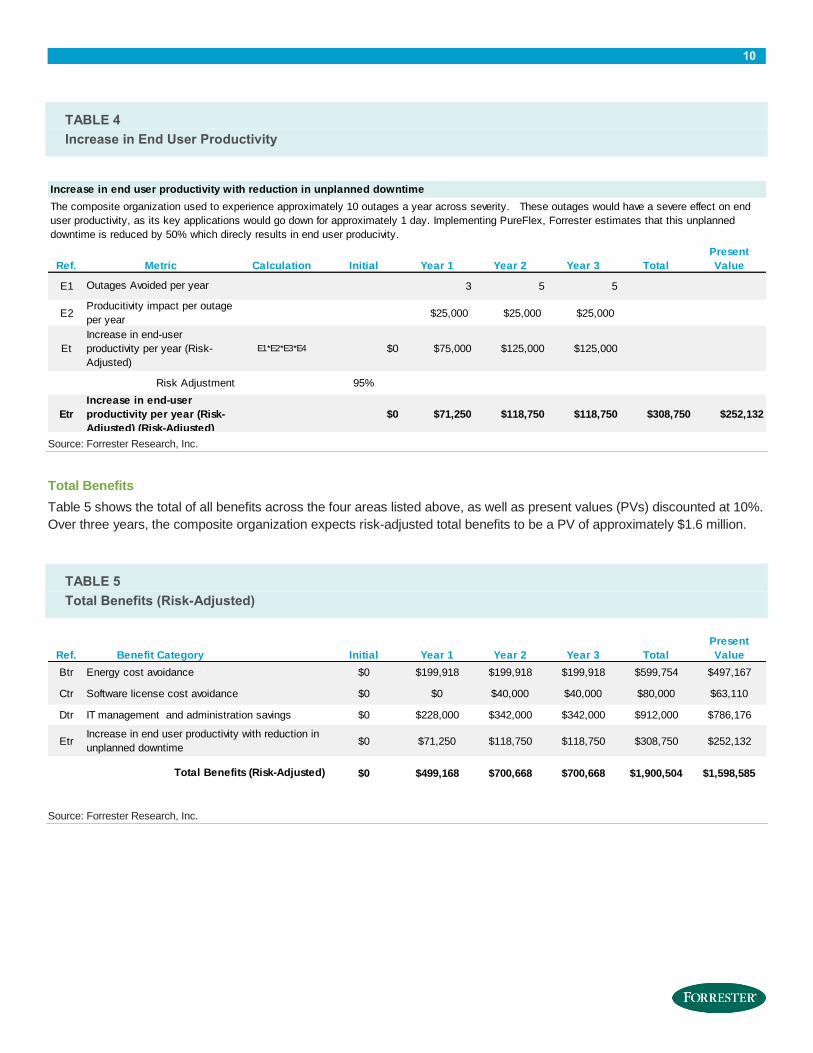
TABLE 4
Increase in End User Productivity
Source: Forrester Research, Inc.
Total Benefits
Table 5 shows the total of all benefits across the four areas listed above, as well as present values (PVs) discounted at 10%.
Over three years, the composite organization expects risk-adjusted total benefits to be a PV of approximately $1.6 million.
TABLE 5
Total Benefits (Risk-Adjusted)
Source: Forrester Research, Inc.
Ref. Calculation Initial Year 1 Year 2 Year 3 Total
Present
Value
E1 3 5 5
E2 25,000$ 25,000$ 25,000$
Et E1*E2*E3*E4 $0 $75,000 $125,000 $125,000
95%
Etr $0 $71,250 $118,750 $118,750 $308,750 $252,132
Increase in end user productivity with reduction in unplanned downtime
The composite organization used to experience approximately 10 outages a year across severity. These outages would have a severe effect on end
user productivity, as its key applications would go down for approximately 1 day. Implementing PureFlex, Forrester estimates that this unplanned
downtime is reduced by 50% which direcly results in end user producivity.
Metric
Outages Avoided per year
Increase in end-user
productivity per year (Risk-
Adjusted)
Risk Adjustment
Increase in end-user
productivity per year (Risk-
Adjusted) (Risk-Adjusted)
Producitivity impact per outage
per year
Ref. Initial Year 1 Year 2 Year 3 Total
Present
Value
Btr $0 $199,918 $199,918 $199,918 $599,754 $497,167
Ctr $0 $0 $40,000 $40,000 $80,000 $63,110
Dtr $0 $228,000 $342,000 $342,000 $912,000 $786,176
Etr $0 $71,250 $118,750 $118,750 $308,750 $252,132
$0 $499,168 $700,668 $700,668 $1,900,504 $1,598,585
Increase in end user productivity with reduction in
unplanned downtime
Software license cost avoidance
Benefit Category
Energy cost avoidance
IT management and administration savings
Total Benefits (Risk-Adjusted)
11
COSTS
The composite organization experienced a number of costs associated with the PureFlex System solution:
› Initial hardware cost.
› Implementation/integration cost.
› Annual support, administration, and software maintenance costs.
These represent the mix of internal and external costs experienced by the composite organization for initial planning,
implementation, and ongoing software maintenance associated with the solution.
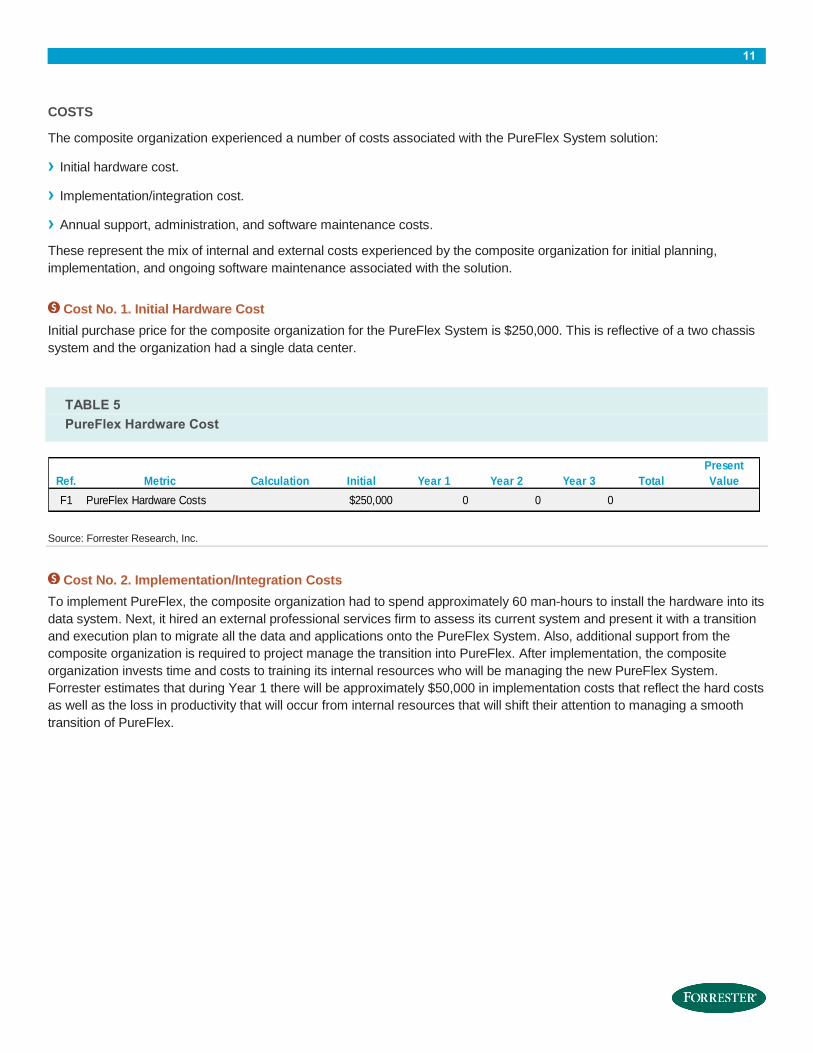
Cost No. 1. Initial Hardware Cost
Initial purchase price for the composite organization for the PureFlex System is $250,000. This is reflective of a two chassis
system and the organization had a single data center.
TABLE 5
PureFlex Hardware Cost
Source: Forrester Research, Inc.
Cost No. 2. Implementation/Integration Costs
To implement PureFlex, the composite organization had to spend approximately 60 man-hours to install the hardware into its
data system. Next, it hired an external professional services firm to assess its current system and present it with a transition
and execution plan to migrate all the data and applications onto the PureFlex System. Also, additional support from the
composite organization is required to project manage the transition into PureFlex. After implementation, the composite
organization invests time and costs to training its internal resources who will be managing the new PureFlex System.
Forrester estimates that during Year 1 there will be approximately $50,000 in implementation costs that reflect the hard costs
as well as the loss in productivity that will occur from internal resources that will shift their attention to managing a smooth
transition of PureFlex.
Ref. Calculation Initial Year 1 Year 2 Year 3 Total
Present
Value
F1 250,000$ 0 0 0
Metric
PureFlex Hardware Costs

12
TABLE 6
Implementation And Integration Costs
Source: Forrester Research, Inc.
Cost No. 3. Annual Support, Administration, and Software Costs
Each year, the composite organization incurred a maintenance fee for managing the PureFlex System. The maintenance fee
included 24x7 support and software upgrades developed by IBM that enhance core functionalities and expand the range of
industry-specific features. In addition to costs paid to IBM, the composite organization also had internal administration costs
of maintaining the PureFlex solution in their environment. In the first three years, Forrester does not expect any hardware
maintenance costs for PureFlex. The composite organization incurred $100,000 in annual support, administration and
software maintenance costs to manage the PureFlex System.
TABLE 7
Annual Support, Administration, and Software Costs
Source: Forrester Research, Inc.
Ref. Calculation Initial Year 1 Year 2 Year 3 Total
Present
Value
G1 0 50,000$ 0 0
G2 G1*G2 $0 $50,000 $0 $0
100%
Gtr $0 $50,000 $0 $0 $50,000 $45,455
Implementation and Integration Costs
PureFlex hardware impmentation and integratation costs including data migration, application configuration, training, outside professional service fees,
etc. to implement PureFlex
Metric
One-Time implementation
costsImplementation and Integration
Costs
Risk Adjustment
Implementation and
Integration Costs (Risk-
Adjusted)
Ref. Calculation Initial Year 1 Year 2 Year 3 Total
Present
Value
H1 0 100,000 100,000 100,000
100%
Htr $0 $100,000 $100,000 $100,000 $300,000 $248,685
Risk Adjustment
Total Annual support,
administration, and software
support costs (Risk-Adjusted)
Metric
Yearly maintenance costs for
PureFlex (support, administration, and
software maintenance)

13
Total Costs
Table 8 shows the total of all costs as well as associated present values, discounted at 10%. Over three years, the
composite organization expects total costs to total a net present value of a little more than $2.5 million, or $3,862 per user.
TABLE 8
Total Costs (Risk-Adjusted)
Source: Forrester Research, Inc.
FLEXIBILITY
Flexibility, as defined by TEI, represents an investment in additional capacity or capability that could be turned into business
benefit for some future additional investment. This provides an organization with the “right” or the ability to engage in future
initiatives but not the obligation to do so.
The PureFlex System combines system designs along with built-in expertise and integrates them into complete, optimized
solutions. This fully integrated infrastructure platform supports a mix of compute, storage, and networking resources to meet
the demands of your applications.
The solution is easily scalable with the addition of another chassis with the required nodes. With the PureFlex System
Manage, multiple chassis can be monitored from a single panel. This flexible chassis is simple to deploy, and can scale to
meet your needs in the future. PureFlex allows organizations to accelerate system deployment while simplifying cloud
service delivery. With PureFlex, organizations can accelerate their cloud service delivery by deploying in minutes and hours
rather than weeks or months and their scalable management capability manages up to 5 PureFlex racks to maximize
productivity.
RISKS
Forrester defines two types of risk associated with this analysis: “implementation risk” and “impact risk.” “Implementation risk”
is the risk that a proposed investment in PureFlex System may deviate from the original or expected requirements, resulting
in higher costs than anticipated. “Impact risk” refers to the risk that the business or technology needs of the organization may
not be met by the investment in PureFlex System, resulting in lower overall total benefits. The greater the uncertainty, the
wider the potential range of outcomes for cost and benefit estimates. Table 9 shows the variability in the benefit outcomes
that customers similar to the representative organization may achieve from implementing IBM PureFlex. For instance,
energy costs can differ by location and by existing contracts and Forrester estimates that the variability and the risk of this
benefit can be up to 20%. In addition, software license fees, IT management and administration savings, and IT end user
productivity are pretty standard and are likely to only deviate from the stated benefit by no more than 5%. The TEI analysis
shows that even with a risk adjustment the ROI and NPV of implementing PureFlex is highly positive.
Ref. Initial Year 1 Year 2 Year 3 Total
Present
Value
Ftr -$250,000 $0 $0 $0 -$250,000 -$250,000
Gtr $0 -$50,000 $0 $0 -$50,000 -$45,455
Htr $0 -$100,000 -$100,000 -$100,000 -$300,000 -$248,685
-$250,000 -$150,000 -$100,000 -$100,000 -$600,000 -$544,140
Annual Support, Administration, and Software Costs
Initial Hardware Costs
Cost Category
Total Costs (Risk-Adjusted)
Implementation and Integration Costs

14
TABLE 9
Risk Assessment: Benefits and Costs
Source: Forrester Research, Inc.
TABLE 9
Benefit And Cost Risk Adjustments
Benefits Adjustment
Energy Cost Avoidance 20%
Software License Cost Avoidance 5%
IT Management and Administration Savings 5%
Increase in End-User Productivity 5%

15
Financial Summary
The financial results calculated in the Benefits and Costs sections can be used to determine the ROI, NPV, and payback
period for the organization’s investment in PureFlex System.
Table 10 below shows the risk-adjusted ROI, NPV, and payback period values. These values are determined by applying the
risk-adjustment values from Table 9 in the Risks section to the unadjusted results in each relevant Cost and Benefit section.
FIGURE 3
Cash Flow Chart (Risk-Adjusted)
Source: Forrester Research, Inc.
TABLE 10
Cash Flow: Risk-Adjusted
Source: Forrester Research, Inc.
-$400,000
-$200,000
$0
$200,000
$400,000
$600,000
$800,000
$1,000,000
$1,200,000
$1,400,000
$1,600,000
Initial Year 1 Year 2 Year 3
Cas
h Fl
ows
Financial Analysis (risk-adjusted)
Total Costs Total Benefits Cumulative Total
Initial Year 1 Year 2 Year 3 Total
Present
Value
Total Costs (250,000)$ (150,000)$ (100,000)$ (100,000)$ (600,000)$ (544,140)$
$0 $499,168 $700,668 $700,668 $1,900,504 $1,598,585
-$250,000 $349,168 $600,668 $600,668 $1,300,504 $1,054,445
194%
8.5Payback Period (months)
Cash Flow Analysis (Risk-Adjusted Estimates)
Summary
Total Benefits
Total
ROI

16
IBM PureFlex System: Overview
The following information is provided by IBM. Forrester has not validated any claims and does not endorse IBM or its
offerings.
IBM PureFlex System is a complete, flexible cloud infrastructure system with integrated expertise. The system integrates and
optimizes all compute, storage and networking resources to deliver infrastructure-as-a-service (IaaS) out of the box.
› Integration by design: deeply integrated compute, storage, and networking resources so you can deploy in hours instead
of days.
› Built-in expertise: automated management and deployment expertise for physical and virtual resources so your experts
can focus on innovation.
› Simplified experience: optimized flexible configurations to accelerate purchase, deployment, and time to value for your
solution.
The IBM PureFlex System combines advanced IBM hardware and systems management software, integrating them into an
optimized configuration that is simple to acquire and deploy so you get fast time-to-value for your solution.
These fully integrated, optimized solutions can be configured for your specific business need and may be complemented by
a package of support services. These purchased services include flexible choices for warranty service upgrades (WSU), and
microcode analysis to ensure your PureFlex deployment maintains the latest levels of software and firmware.

17
Appendix A: Composite Organization Description
For this TEI study, Forrester has created a composite organization to illustrate the quantifiable benefits and costs of
implementing IBM’s PureFlex System. The composite company is intended to represent a privately held services company
headquartered in Europe with 1,200 employees and is based on characteristics of the interviewed customers.
The composite company has $800 million in annual sales and operates a single data center environment with yearly opex
and capex budget of $15 million. The composite company also uses 50 kWh of energy per month.
In purchasing PureFlex System, the composite company has the following objectives:
› To have a single data center environment that supports its long-term business objectives.
› Reduce the number of racks required for network storage to assist in reducing energy costs.
› Efficiently manage the company’s SAP architecture while reducing costs and increasing IT staff productivity.
› Reduce the time to deploy and install additional applications, and have the ability to align with the company’s goal to scale
through utilizing a more leveraged cloud strategy.
FRAMEWORK ASSUMPTIONS
Table 11 provides the model assumptions that Forrester used in this analysis.
The discount rate used in the PV and NPV calculations is10% and time horizon used for the financial modeling is three
years. Organizations typically use discount rates between 8% and 16% based on their current environment. Readers are
urged to consult with their respective company’s finance department to determine the most appropriate discount rate to use
within their own organizations.
TABLE 11
Model Assumptions
Ref. Metric Calculation Value
C1 Hours per week 40
C2 Hours per Year 8,677
C3 Cost per kWh $0.12
C4 Cost per fully burdened IT staff $120,000
Source: Forrester Research, Inc.

18
Appendix B: Total Economic Impact™ Overview
Total Economic Impact is a methodology developed by Forrester Research that enhances a company’s technology decision-
making processes and assists vendors in communicating the value proposition of their products and services to clients. The
TEI methodology helps companies demonstrate, justify, and realize the tangible value of IT initiatives to both senior
management and other key business stakeholders.
The TEI methodology consists of four components to evaluate investment value: benefits, costs, flexibility, and risks.
BENEFITS
Benefits represent the value delivered to the user organization — IT and/or business units — by the proposed product or
project. Often, product or project justification exercises focus just on IT cost and cost reduction, leaving little room to analyze
the effect of the technology on the entire organization. The TEI methodology and the resulting financial model place equal
weight on the measure of benefits and the measure of costs, allowing for a full examination of the effect of the technology on
the entire organization. Calculation of benefit estimates involves a clear dialogue with the user organization to understand
the specific value that is created. In addition, Forrester also requires that there be a clear line of accountability established
between the measurement and justification of benefit estimates after the project has been completed. This ensures that
benefit estimates tie back directly to the bottom line.
COSTS
Costs represent the investment necessary to capture the value, or benefits, of the proposed project. IT or the business units
may incur costs in the form of fully burdened labor, subcontractors, or materials. Costs consider all the investments and
expenses necessary to deliver the proposed value. In addition, the cost category within TEI captures any incremental costs
over the existing environment for ongoing costs associated with the solution. All costs must be tied to the benefits that are
created.
FLEXIBILITY
Within the TEI methodology, direct benefits represent one part of the investment value. While direct benefits can typically be
the primary way to justify a project, Forrester believes that organizations should be able to measure the strategic value of an
investment. Flexibility represents the value that can be obtained for some future additional investment building on top of the
initial investment already made. For instance, an investment in an enterprise wide upgrade of an office productivity suite can
potentially increase standardization (to increase efficiency) and reduce licensing costs. However, an embedded collaboration
feature may translate to greater worker productivity if activated. The collaboration can only be used with additional
investment in training at some future point. However, having the ability to capture that benefit has a PV that can be
estimated. The flexibility component of TEI captures that value.
RISKS
Risks measure the uncertainty of benefit and cost estimates contained within the investment. Uncertainty is measured in two
ways: 1) the likelihood that the cost and benefit estimates will meet the original projections, and 2) the likelihood that the
estimates will be measured and tracked over time. TEI applies a probability density function known as “triangular distribution”
to the values entered. At a minimum, three values are calculated to estimate the underlying range around each cost and
benefit.

19
Appendix C: Glossary
Discount rate: The interest rate used in cash flow analysis to take into account the time value of money. Companies set
their own a discount rate based on their business and investment environment. Forrester assumes a yearly discount rate of
10% for this analysis. Organizations typically use discount rates between 8% and 16% based on their current environment.
Readers are urged to consult their respective organizations to determine the most appropriate discount rate to use in their
own environment.
Net present value (NPV): The present or current value of (discounted) future net cash flows given an interest rate (the
discount rate). A positive project NPV normally indicates that the investment should be made, unless other projects have
higher NPVs.
Present value (PV): The present or current value of (discounted) cost and benefit estimates given at an interest rate (the
discount rate). The PV of costs and benefits feed into the total NPV of cash flows.
Payback period: The breakeven point for an investment. This is the point in time at which net benefits (benefits minus costs)
equal initial investment or cost.
Return on investment (ROI): A measure of a project’s expected return in percentage terms. ROI is calculated by dividing
net benefits (benefits minus costs) by costs.
A NOTE ON CASH FLOW TABLES
The following is a note on the cash flow tables used in this study (see the example table below). The initial investment
column contains costs incurred at “time 0” or at the beginning of Year 1. Those costs are not discounted. All other cash flows
in years 1 through 3 are discounted using the discount rate (shown in Framework Assumptions section) at the end of the
year. PV calculations are calculated for each total cost and benefit estimate. NPV calculations are not calculated until the
summary tables are the sum of the initial investment and the discounted cash flows in each year.