the total economic impact™ of microsoft office 365 proplus · productivity tools found in office...
TRANSCRIPT
A Forrester Total Economic Impact™
Study Commissioned By Microsoft
August 2019
The Total Economic Impact™ Of Microsoft Office 365 ProPlus
Cost Savings And Business Benefits Enabled By Office 365 ProPlus
Table Of Contents Executive Summary 1
Key Findings 2
TEI Framework And Methodology 4
The Office 365 ProPlus Customer Journey 5
Interviewed Organizations 5
Key Challenges 5
Key Results 6
Composite Organization 6
Analysis Of Benefits 8
Time Savings From Collaboration Tools 8
Improved Productivity From Mobile And Web Access 10
Cost Savings From Office 365 ProPlus Licensing 11
Total Trip Costs Avoided 12
Reduced TCO — Technology Infrastructure Cost Savings 13
Unquantified Benefits 14
Flexibility 14
Analysis Of Costs 16
License Costs 16
Planning, Implementation, And Deployment Costs 16
Financial Summary 18
Microsoft Office 365 ProPlus: Overview 19
Appendix A: Total Economic Impact 20
Appendix B: Supplemental Material 21
Project Director:
Corey McNair
ABOUT FORRESTER CONSULTING
Forrester Consulting provides independent and objective research-based
consulting to help leaders succeed in their organizations. Ranging in scope from a
short strategy session to custom projects, Forrester ’s Consulting services connect
you directly w ith research analysts w ho apply expert insight to your specif ic
business challenges. For more information, visit forrester.com/consulting.
© 2019, Forrester Research, Inc. All rights reserved. Unauthorized reproduction
is strictly prohibited. Information is based on best available resources.
Opinions reflect judgment at the time and are subject to change. Forrester®,
Technographics®, Forrester Wave, RoleView , TechRadar, and Total Economic
Impact are trademarks of Forrester Research, Inc. All other trademarks are the
property of their respective companies. For additional information, go to
forrester.com.

1 | The Total Economic Impact™ Of Microsoft Office 365 ProPlus
Executive Summary
Businesses that have been content with using Microsoft Office 2010 will have to consider upgrading their software soon as the product ’s support will reach end of life in October 2020.
Many businesses have yet to upgrade due to familiarity with Microsoft Office products that have worked well for them thus far. Businesses would rather wait until end of service to continue on with their current work environments. Meanwhile, businesses that have yet to adopt cloud storage systems for Office’s cloud features are hesitant due to the cost and risk related to migrating on-prem storage to a cloud or hybrid system.
Microsoft Office 365 ProPlus introduces new features to Outlook, OneDrive, Word, Excel, PowerPoint, SharePoint, OneNote, and Teams aimed at improving productivity, collaboration, and security, including:
• Real-time document coauthoring and collaboration.
• AI-powered creativity features like Designer and 3D animation tools for visualization in PowerPoint and intelligent insights and
data analytics in Excel.
• Cloud storage through OneDrive for Business.
• App access across mobile, PC, and Mac devices and on the
web.
Most critically, businesses adopting Office 365 ProPlus will no longer have to pay on a “per-device” model, but on a “per-user” basis, enabling multidevice access per user. Office 365 ProPlus stays always up to date as well with new feature updates pushed onto devices. As a result, organizations no longer have to interrupt users while going through a wave of updates with the latest Office releases.
Microsoft commissioned Forrester Consulting to conduct a Total Economic Impact™ (TEI) study and examine the potential return on investment (ROI) enterprises may realize by deploying Office 365 ProPlus. The purpose of this study is to provide readers with a framework to evaluate the potential financial impact of the Office 365 ProPlus on their organizations.
To better understand the benefits, costs, and risks associated with this investment, Forrester interviewed eight customers with years of experience using Office 365 ProPlus.
The interviewed organizations upgraded to Office 365 ProPlus after primarily using Office 2010 for several years. Since upgrading, they have noticed a direct benefit toward employee time savings from collaboration, communication, and service-connected AI features added to Word, Excel, and other applications. Specifically, employees have reduced time spent on the back-and-forth of emails reviewing documents, designing and building presentations or spreadsheets, and waiting for feedback.
Although it took some time and money for businesses to integrate cloud storage to their systems to use OneDrive for Business, they have justified their investments thus far by making employees more mobile. Office 365 ProPlus’ flexibility for device usage has provided employees with full access to Office applications and documents on secondary mobile devices while on the go. Meanwhile, the Click-to-Run feature has allowed IT to minimize downtime for users by downloading recent updates in the background to Office-enabled devices.
For further analysis of the AI features offered and Microsoft Teams, please see the studies, “New Tech TEI: The Total Economic Impact Of Microsoft
Benefits And Costs
Cost savings from ProPlus licensing change:
$144 saved from second device license avoided per user
Time savings from collaboration, communication, and file-sharing tools:
1.5 hours per week per FTE
License costs:
$1,880,060
2 | The Total Economic Impact™ Of Microsoft Office 365 ProPlus
365 AI For Knowledge Workers” and “The Total Economic Impact of Microsoft Teams.” This study only includes benefits related to office productivity tools found in Office 365 ProPlus and excludes broader collaboration and productivity tech (e.g., Exchange and SharePoint) found in Microsoft 365.
Key Findings
Quantified benefits. The following risk-adjusted present value (PV) quantified benefits are representative of those experienced by the
companies interviewed:
› Office 365 ProPlus’ collaboration, communication, design, and file-sharing tools have helped employees to create time savings of 1.5 hours per week. Employees have used OneDrive for Business to coauthor and share links to files, reducing the amount of time spent reviewing documents individually and then chains of emails going over feedback. Workers have become more active at using new design tools
and sharing feedback in real time to move projects along and save time.
› Regular access to Microsoft applications via the mobile app and the web while on the go has improved mobile worker productivity by 2.5 hours. Through OneDrive cloud storage and Microsoft’s licensing change to access on a per-user basis, workers have become capable of picking up where they left off on their work PC by using compatible
mobile devices to continue being productive.
› Organizations have saved on average $144 annually for every user’s secondary device with Office access. Since the licensing change, organizations no longer have to pay for every device that
employees use to access Microsoft Office applications.
› Organizations have avoided paying for 100 business trips traveled in a year. Although organizations already had video and phone conferencing solutions, the usage of Microsoft Teams with coauthoring tools has improved productivity in meetings. As a result, organizations
have been able to scale back some business travel costs.
Costs. The interviewed organizations experienced the following risk-adjusted PV costs:
› Subscription licensing for Microsoft Office 365 ProPlus. Organizations pay $144 per user on average annually for the Office 365 ProPlus license. Organizations can reassign licenses among users
every three months.
› Planning, implementation, and deployment costs for Office 365 ProPlus. Interviewed organizations varied in their adoption of Office 365 ProPlus. On average, adoption took place over two years, and one FTE
was needed for ongoing administration and management.
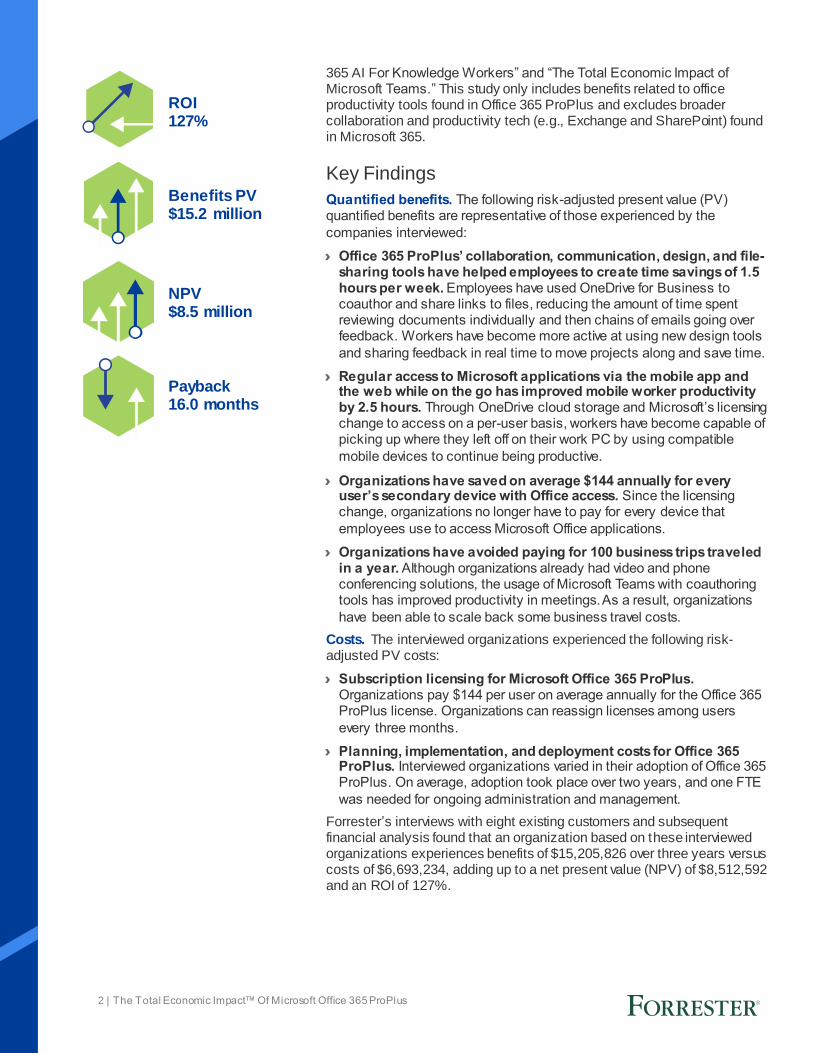
Forrester’s interviews with eight existing customers and subsequent financial analysis found that an organization based on these interviewed organizations experiences benefits of $15,205,826 over three years versus costs of $6,693,234, adding up to a net present value (NPV) of $8,512,592 and an ROI of 127%.
ROI 127%
Benefits PV $15.2 million
NPV $8.5 million
Payback 16.0 months
3 | The Total Economic Impact™ Of Microsoft Office 365 ProPlus
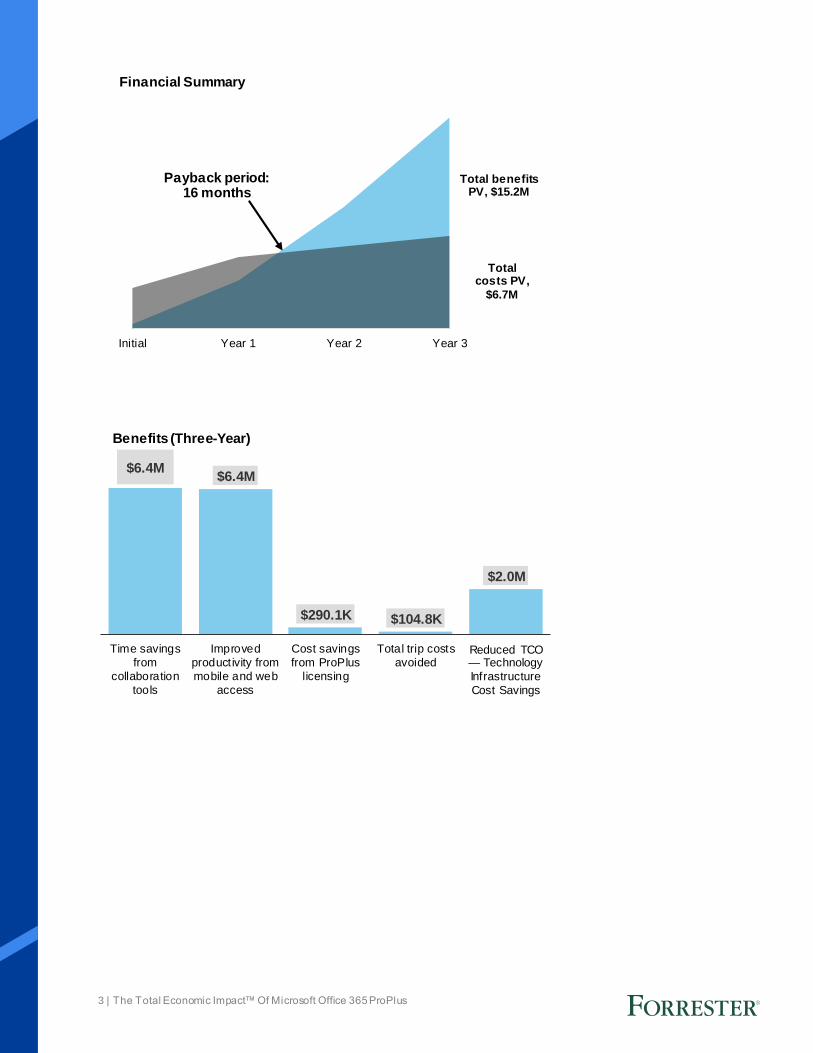
Total benefits PV, $15.2M
Total costs PV,
$6.7M
Initial Year 1 Year 2 Year 3
Financial Summary
Payback period:16 months
$6.4M$6.4M
$290.1K $104.8K
$2.0M
Time savings
from
collaboration
tools
Improved
productivity from
mobile and web
access
Cost savings
from ProPlus
licensing
Total trip costs
avoidedReduced TCO — Technology
Infrastructure
Cost Savings
Benefits (Three-Year)
4 | The Total Economic Impact™ Of Microsoft Office 365 ProPlus
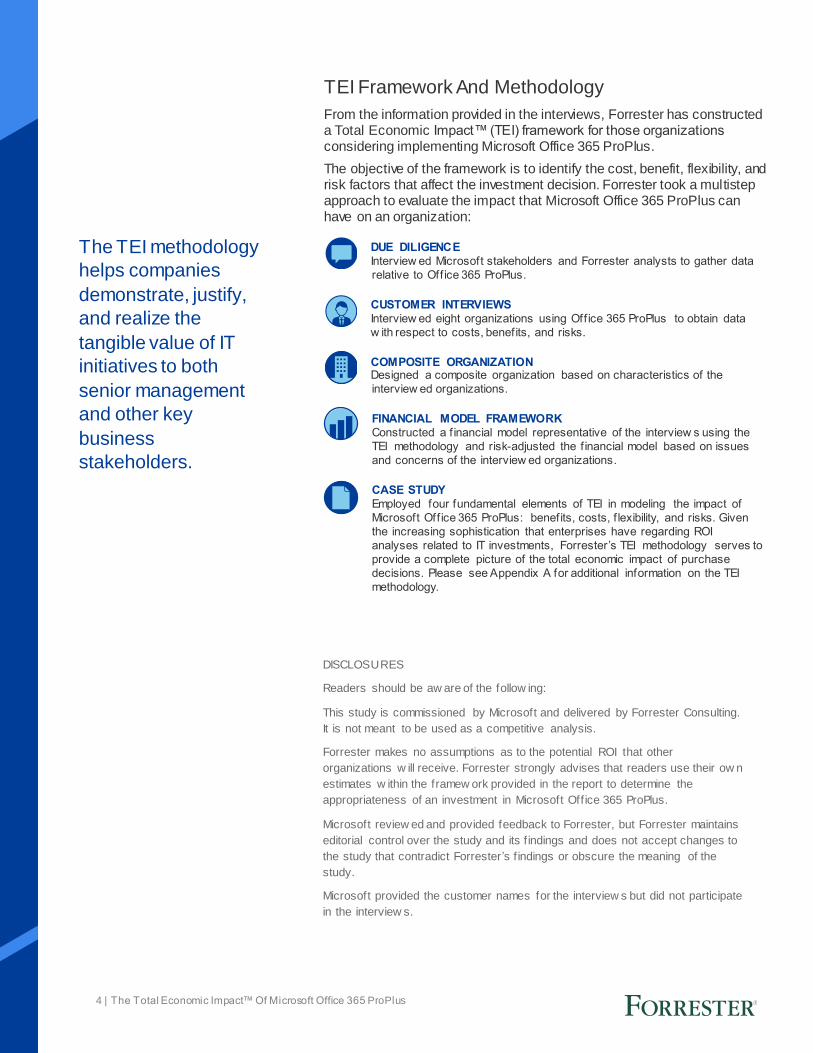
TEI Framework And Methodology
From the information provided in the interviews, Forrester has constructed a Total Economic Impact™ (TEI) framework for those organizations considering implementing Microsoft Office 365 ProPlus.
The objective of the framework is to identify the cost, benefit, flexibility, and risk factors that affect the investment decision. Forrester took a multistep approach to evaluate the impact that Microsoft Office 365 ProPlus can have on an organization:
DUE DILIGENCE
Interview ed Microsoft stakeholders and Forrester analysts to gather data
relative to Office 365 ProPlus.
CUSTOMER INTERVIEWS
Interview ed eight organizations using Office 365 ProPlus to obtain data
w ith respect to costs, benefits, and risks.
COMPOSITE ORGANIZATION Designed a composite organization based on characteristics of the
interview ed organizations.
FINANCIAL MODEL FRAMEWORK
Constructed a f inancial model representative of the interview s using the
TEI methodology and risk-adjusted the f inancial model based on issues
and concerns of the interview ed organizations.
CASE STUDY
Employed four fundamental elements of TEI in modeling the impact of
Microsoft Off ice 365 ProPlus: benefits, costs, f lexibility, and risks. Given
the increasing sophistication that enterprises have regarding ROI
analyses related to IT investments, Forrester’s TEI methodology serves to
provide a complete picture of the total economic impact of purchase
decisions. Please see Appendix A for additional information on the TEI
methodology.
The TEI methodology
helps companies
demonstrate, justify,
and realize the
tangible value of IT
initiatives to both
senior management
and other key
business
stakeholders.
DISCLOSURES
Readers should be aw are of the follow ing:
This study is commissioned by Microsoft and delivered by Forrester Consulting.
It is not meant to be used as a competitive analysis.
Forrester makes no assumptions as to the potential ROI that other
organizations w ill receive. Forrester strongly advises that readers use their ow n
estimates w ithin the framew ork provided in the report to determine the
appropriateness of an investment in Microsoft Off ice 365 ProPlus.
Microsoft review ed and provided feedback to Forrester, but Forrester maintains
editorial control over the study and its f indings and does not accept changes to
the study that contradict Forrester’s f indings or obscure the meaning of the
study.
Microsoft provided the customer names for the interview s but did not participate
in the interview s.
5 | The Total Economic Impact™ Of Microsoft Office 365 ProPlus
The Office 365 ProPlus Customer Journey
BEFORE AND AFTER THE OFFICE 365 PROPLUS INVESTMENT
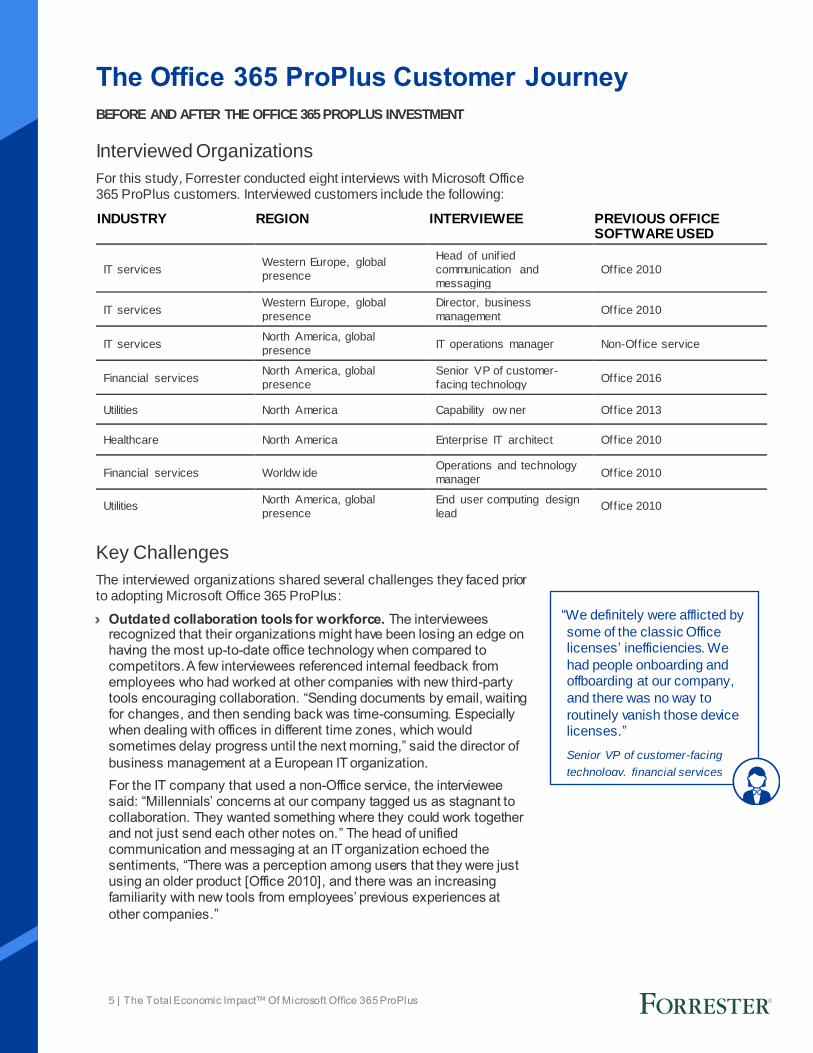
Interviewed Organizations
For this study, Forrester conducted eight interviews with Microsoft Office 365 ProPlus customers. Interviewed customers include the following:
Key Challenges
The interviewed organizations shared several challenges they faced prior to adopting Microsoft Office 365 ProPlus:
› Outdated collaboration tools for workforce. The interviewees recognized that their organizations might have been losing an edge on having the most up-to-date office technology when compared to competitors. A few interviewees referenced internal feedback from employees who had worked at other companies with new third-party tools encouraging collaboration. “Sending documents by email, waiting for changes, and then sending back was time-consuming. Especially when dealing with offices in different time zones, which would sometimes delay progress until the next morning,” said the director of
business management at a European IT organization.
For the IT company that used a non-Office service, the interviewee said: “Millennials’ concerns at our company tagged us as stagnant to collaboration. They wanted something where they could work together and not just send each other notes on.” The head of unified communication and messaging at an IT organization echoed the sentiments, “There was a perception among users that they were just using an older product [Office 2010], and there was an increasing familiarity with new tools from employees’ previous experiences at
other companies.”
INDUSTRY REGION INTERVIEWEE PREVIOUS OFFICE SOFTWARE USED
IT services Western Europe, global
presence
Head of unif ied
communication and
messaging
Office 2010
IT services Western Europe, global
presence
Director, business
management Office 2010
IT services North America, global
presence IT operations manager Non-Office service
Financial services North America, global
presence
Senior VP of customer-
facing technology Office 2016
Utilities North America Capability ow ner Office 2013
Healthcare North America Enterprise IT architect Office 2010
Financial services Worldw ide Operations and technology
manager Office 2010
Utilities North America, global
presence
End user computing design
lead Office 2010
“We definitely were afflicted by
some of the classic Office licenses’ inefficiencies. We
had people onboarding and offboarding at our company,
and there was no way to
routinely vanish those device licenses.”
Senior VP of customer-facing
technology, financial services
6 | The Total Economic Impact™ Of Microsoft Office 365 ProPlus
› Inability to work effectively while on the go. Business administrators noted that workers were limited by previous business solutions that didn’t enable mobile functionality beyond checking email. With employees increasingly seeking to work remote and when
traveling, organizations needed a new solution.
› Increasingly expensive Office licensing. A majority of the business administrators reported that they renewed their Office licensing every three to five years, coinciding with the release of a new version of Office. The licensing was on a per-device basis, which had become more expensive for interviewees as more employees worked remote. “From a cost-control perspective, we have an increasing number of mobile users and home small-office users. We needed to bring those costs to a more manageable rate,” said the operations and technology
manager at a financial services company.
Key Results
The interviews revealed that key results from the Office 365 ProPlus investment include:
› Greater efficiency in sharing and receiving updated documents. Employees began using links to documents in OneDrive in place of attaching documents to emails. By having the same shared link, employees can make edits to the same document that automatically saved to the project folder. As a result, workers no longer have to wait
for the updated document to be sent back to them.
› Greater productivity from employees having more flexibility by accessing Office via the web or on mobile devices. Office 365 ProPlus’ licensing model change from a per-device basis to per-user has enabled employees to work on additional compatible devices at no extra cost to their organizations. Tablet usage of Word and PowerPoint has increased; employees also use tablets to view documents that
aren’t accessible over email.
› Cost savings from per-user Office 365 ProPlus licensing instead of per-device licensing. Organizations have reduced their annual spending on Office because they no longer have to pay an additional fee for employees using a secondary device for Office-related activities. These savings are especially beneficial for organizations with
a highly mobile workforce.
› Cost savings in business trips avoided. Organizations have slightly reduced their spending toward business travel because of increasing collaboration over applications like OneDrive for Business and Microsoft Teams. Workers can stay in better alignment on the status of
projects, reducing the need to meet in person to catch up.
› Tools that enabled businesses to decommission usage of third-party tools. Specifically, organizations were able to use Office 365 ProPlus’ OneDrive for Business to decommission some third-party storage services and Microsoft Teams to retire conferencing
applications.
Composite Organization
Based on the interviews, Forrester constructed a TEI framework, a composite company, and an associated ROI analysis that illustrates the areas financially affected. The composite organization is representative
“The people in the field are
really benefitting from these
collaboration tools. They don’t have time for back-and-forth
and want documents readily
available, which Office 365 ProPlus has helped with.”
Head of unified communication
and messaging, IT services
“I think that Microsoft Teams
can replace hosting some
video bridges. Especially if it’s a collaboration effort between
a smaller group between two
to eight people.”
IT operations manager, IT
services
7 | The Total Economic Impact™ Of Microsoft Office 365 ProPlus
of the eight companies that Forrester interviewed and is used to present the aggregate financial analysis in the next section. The composite organization that Forrester synthesized from the customer interviews has the following characteristics:
Description of composite. The composite organization is a global organization with most of its business operations in North America and Europe. The organization has 5,000 knowledge workers who use Microsoft Office 365 ProPlus.
Deployment characteristics. The organization typically upgrades its Office suite with the release of a new iteration every five years. The organization upgrades from Microsoft Office 2010 by deploying Microsoft Office 365 ProPlus to all teams over the first 12 months. Office 365 ProPlus is deployed and provides immediate access to Excel, Outlook, PowerPoint, and Word. OneDrive for Business is not completely available in Year 1 as the organization migrates from on-prem to cloud storage. The organization completes its migration in Year 2. Microsoft Teams is added for usage in Year 2 as well.
Key assumptions
5,000 Office 365 ProPlus
users
Previously used Office
2010
Rollout over 12 months
8 | The Total Economic Impact™ Of Microsoft Office 365 ProPlus
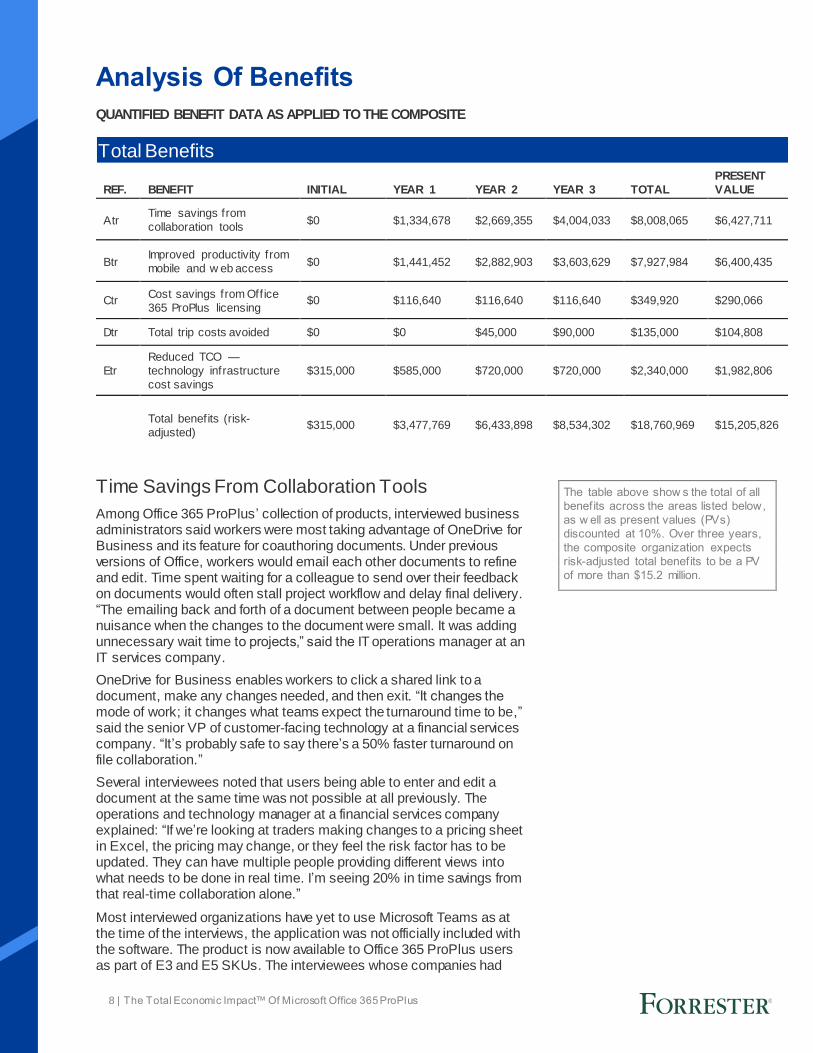
The table above show s the total of all
benefits across the areas listed below,
as w ell as present values (PVs)
discounted at 10%. Over three years,
the composite organization expects
risk-adjusted total benefits to be a PV
of more than $15.2 million.
Analysis Of Benefits
QUANTIFIED BENEFIT DATA AS APPLIED TO THE COMPOSITE
Time Savings From Collaboration Tools
Among Office 365 ProPlus’ collection of products, interviewed business administrators said workers were most taking advantage of OneDrive for Business and its feature for coauthoring documents. Under previous versions of Office, workers would email each other documents to refine and edit. Time spent waiting for a colleague to send over their feedback on documents would often stall project workflow and delay final delivery. “The emailing back and forth of a document between people became a nuisance when the changes to the document were small. It was adding unnecessary wait time to projects,” said the IT operations manager at an IT services company.
OneDrive for Business enables workers to click a shared link to a document, make any changes needed, and then exit. “It changes the mode of work; it changes what teams expect the turnaround time to be,” said the senior VP of customer-facing technology at a financial services company. “It’s probably safe to say there’s a 50% faster turnaround on file collaboration.”
Several interviewees noted that users being able to enter and edit a document at the same time was not possible at all previously. The operations and technology manager at a financial services company explained: “If we’re looking at traders making changes to a pricing sheet in Excel, the pricing may change, or they feel the risk factor has to be updated. They can have multiple people providing different views into what needs to be done in real time. I’m seeing 20% in time savings from that real-time collaboration alone.”
Most interviewed organizations have yet to use Microsoft Teams as at the time of the interviews, the application was not officially included with the software. The product is now available to Office 365 ProPlus users as part of E3 and E5 SKUs. The interviewees whose companies had
Total Benefits
REF. BENEFIT INITIAL YEAR 1 YEAR 2 YEAR 3 TOTAL
PRESENT
VALUE
Atr Time savings from
collaboration tools $0 $1,334,678 $2,669,355 $4,004,033 $8,008,065 $6,427,711
Btr Improved productivity from
mobile and w eb access $0 $1,441,452 $2,882,903 $3,603,629 $7,927,984 $6,400,435
Ctr Cost savings from Office
365 ProPlus licensing $0 $116,640 $116,640 $116,640 $349,920 $290,066
Dtr Total trip costs avoided $0 $0 $45,000 $90,000 $135,000 $104,808
Etr
Reduced TCO —
technology infrastructure
cost savings
$315,000 $585,000 $720,000 $720,000 $2,340,000 $1,982,806
Total benefits (risk-
adjusted) $315,000 $3,477,769 $6,433,898 $8,534,302 $18,760,969 $15,205,826
9 | The Total Economic Impact™ Of Microsoft Office 365 ProPlus
Impact risk is the risk that the business
or technology needs of the
organization may not be met by the
investment, resulting in low er overall
total benefits. The greater the
uncertainty, the w ider the potential
range of outcomes for benefit
estimates.
access to Microsoft Teams through their licensing agreements noted that it was an improvement over Skype in that they could create group chats for projects and save their conversations for later reference. “Our previous messaging platform didn’t allow you to save conversations in the way Teams does. This is particularly helpful since Office 365 ProPlus doesn’t have SharePoint, and Teams kind of creates a place where colleagues can address what they’re doing,” said an IT operations manager.
Other features that some interviewees have taken advantage of are “@ mentions” for tagging colleagues in emails or messages; PowerPoint Designer, which provides automatically generated slide deck designs; and 3D builder for adding animations to presentations. However, these features are still early in the adoption life cycle at the companies.
For the composite organization, Forrester assumes that:
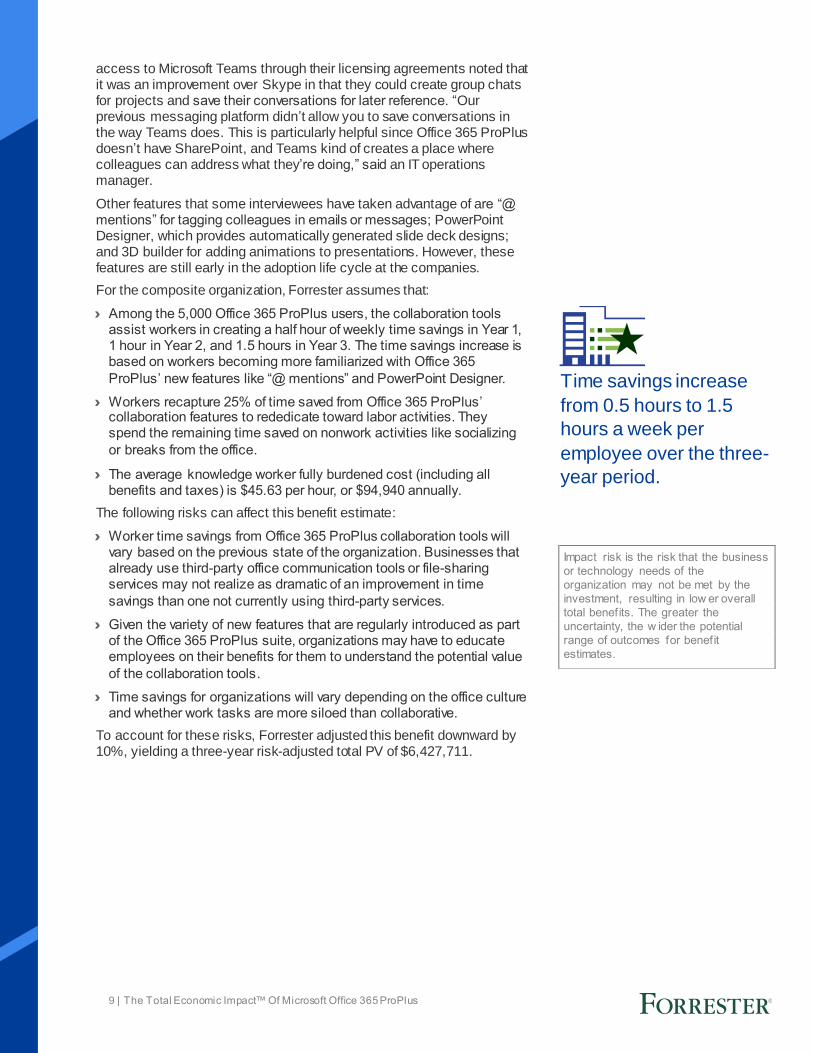
› Among the 5,000 Office 365 ProPlus users, the collaboration tools assist workers in creating a half hour of weekly time savings in Year 1, 1 hour in Year 2, and 1.5 hours in Year 3. The time savings increase is based on workers becoming more familiarized with Office 365
ProPlus’ new features like “@ mentions” and PowerPoint Designer.
› Workers recapture 25% of time saved from Office 365 ProPlus’ collaboration features to rededicate toward labor activities. They spend the remaining time saved on nonwork activities like socializing
or breaks from the office.
› The average knowledge worker fully burdened cost (including all benefits and taxes) is $45.63 per hour, or $94,940 annually.
The following risks can affect this benefit estimate:
› Worker time savings from Office 365 ProPlus collaboration tools will vary based on the previous state of the organization. Businesses that already use third-party office communication tools or file-sharing services may not realize as dramatic of an improvement in time
savings than one not currently using third-party services.
› Given the variety of new features that are regularly introduced as part of the Office 365 ProPlus suite, organizations may have to educate employees on their benefits for them to understand the potential value
of the collaboration tools.
› Time savings for organizations will vary depending on the office culture and whether work tasks are more siloed than collaborative.
To account for these risks, Forrester adjusted this benefit downward by 10%, yielding a three-year risk-adjusted total PV of $6,427,711.
Time savings increase
from 0.5 hours to 1.5
hours a week per
employee over the three-
year period.
10 | The Total Economic Impact™ Of Microsoft Office 365 ProPlus
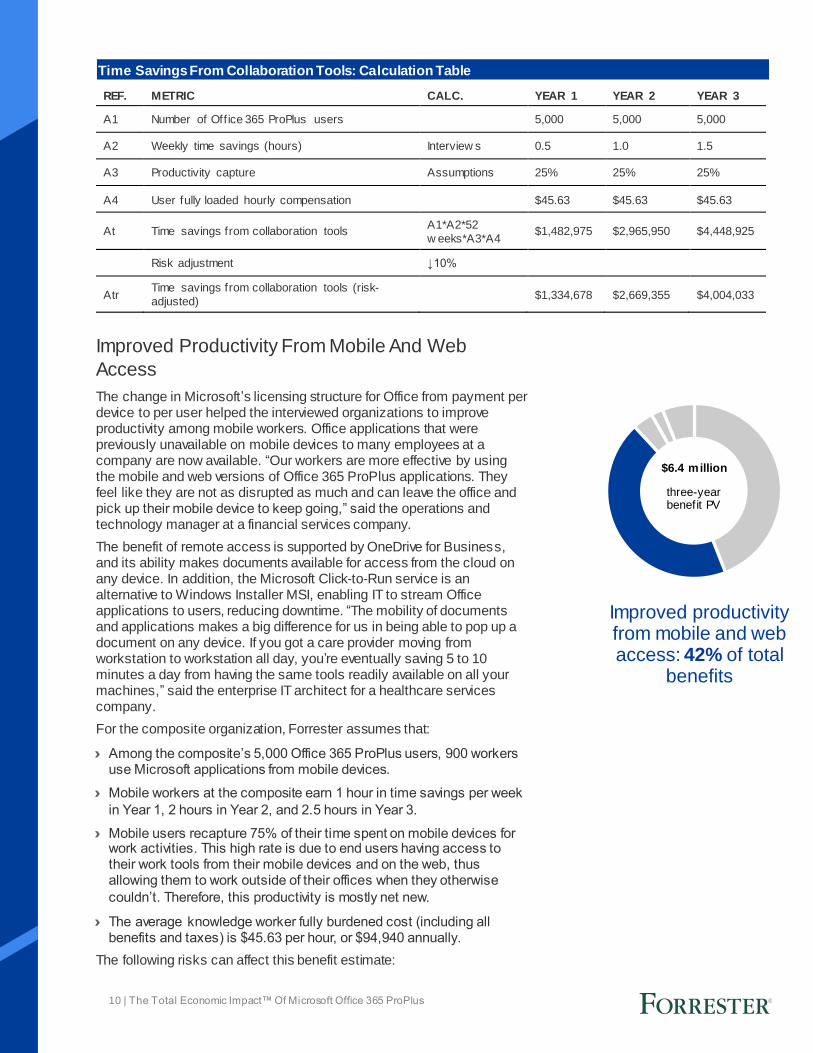
Improved productivity from mobile and web access: 42% of total
benefits
Improved Productivity From Mobile And Web
Access
The change in Microsoft’s licensing structure for Office from payment per device to per user helped the interviewed organizations to improve productivity among mobile workers. Office applications that were previously unavailable on mobile devices to many employees at a company are now available. “Our workers are more effective by using the mobile and web versions of Office 365 ProPlus applications. They feel like they are not as disrupted as much and can leave the office and pick up their mobile device to keep going,” said the operations and technology manager at a financial services company.
The benefit of remote access is supported by OneDrive for Business, and its ability makes documents available for access from the cloud on any device. In addition, the Microsoft Click-to-Run service is an alternative to Windows Installer MSI, enabling IT to stream Office applications to users, reducing downtime. “The mobility of documents and applications makes a big difference for us in being able to pop up a document on any device. If you got a care provider moving from workstation to workstation all day, you’re eventually saving 5 to 10 minutes a day from having the same tools readily available on all your machines,” said the enterprise IT architect for a healthcare services company.
For the composite organization, Forrester assumes that:
› Among the composite’s 5,000 Office 365 ProPlus users, 900 workers use Microsoft applications from mobile devices.
› Mobile workers at the composite earn 1 hour in time savings per week
in Year 1, 2 hours in Year 2, and 2.5 hours in Year 3.
› Mobile users recapture 75% of their time spent on mobile devices for work activities. This high rate is due to end users having access to their work tools from their mobile devices and on the web, thus allowing them to work outside of their offices when they otherwise
couldn’t. Therefore, this productivity is mostly net new.
› The average knowledge worker fully burdened cost (including all benefits and taxes) is $45.63 per hour, or $94,940 annually.
The following risks can affect this benefit estimate:
Time Savings From Collaboration Tools: Calculation Table
REF. METRIC CALC. YEAR 1 YEAR 2 YEAR 3
A1 Number of Office 365 ProPlus users 5,000 5,000 5,000
A2 Weekly time savings (hours) Interview s 0.5 1.0 1.5
A3 Productivity capture Assumptions 25% 25% 25%
A4 User fully loaded hourly compensation $45.63 $45.63 $45.63
At Time savings from collaboration tools A1*A2*52
w eeks*A3*A4 $1,482,975 $2,965,950 $4,448,925
Risk adjustment ↓10%
Atr Time savings from collaboration tools (risk-
adjusted) $1,334,678 $2,669,355 $4,004,033
three-year benefit PV
$6.4 million
11 | The Total Economic Impact™ Of Microsoft Office 365 ProPlus
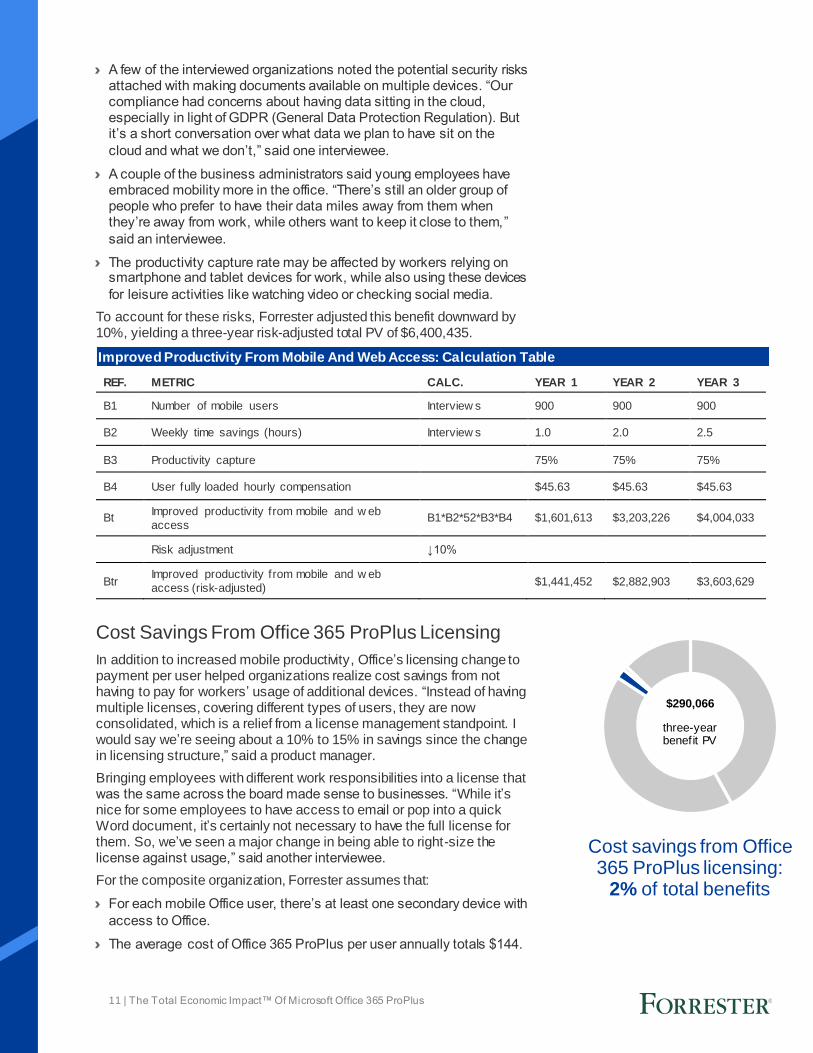
Cost savings from Office 365 ProPlus licensing:
2% of total benefits
› A few of the interviewed organizations noted the potential security risks attached with making documents available on multiple devices. “Our compliance had concerns about having data sitting in the cloud, especially in light of GDPR (General Data Protection Regulation). But it’s a short conversation over what data we plan to have sit on the
cloud and what we don’t,” said one interviewee.
› A couple of the business administrators said young employees have embraced mobility more in the office. “There’s still an older group of people who prefer to have their data miles away from them when they’re away from work, while others want to keep it close to them,”
said an interviewee.
› The productivity capture rate may be affected by workers relying on smartphone and tablet devices for work, while also using these devices
for leisure activities like watching video or checking social media.
To account for these risks, Forrester adjusted this benefit downward by 10%, yielding a three-year risk-adjusted total PV of $6,400,435.
Cost Savings From Office 365 ProPlus Licensing
In addition to increased mobile productivity, Office’s licensing change to payment per user helped organizations realize cost savings from not having to pay for workers’ usage of additional devices. “Instead of having multiple licenses, covering different types of users, they are now consolidated, which is a relief from a license management standpoint. I would say we’re seeing about a 10% to 15% in savings since the change in licensing structure,” said a product manager.
Bringing employees with different work responsibilities into a license that was the same across the board made sense to businesses. “While it’s nice for some employees to have access to email or pop into a quick Word document, it’s certainly not necessary to have the full license for them. So, we’ve seen a major change in being able to right-size the license against usage,” said another interviewee.
For the composite organization, Forrester assumes that:
› For each mobile Office user, there’s at least one secondary device with
access to Office.
› The average cost of Office 365 ProPlus per user annually totals $144.
Improved Productivity From Mobile And Web Access: Calculation Table
REF. METRIC CALC. YEAR 1 YEAR 2 YEAR 3
B1 Number of mobile users Interview s 900 900 900
B2 Weekly time savings (hours) Interview s 1.0 2.0 2.5
B3 Productivity capture 75% 75% 75%
B4 User fully loaded hourly compensation $45.63 $45.63 $45.63
Bt Improved productivity from mobile and w eb
access B1*B2*52*B3*B4 $1,601,613 $3,203,226 $4,004,033
Risk adjustment ↓10%
Btr Improved productivity from mobile and w eb
access (risk-adjusted) $1,441,452 $2,882,903 $3,603,629
three-year benefit PV
$290,066
12 | The Total Economic Impact™ Of Microsoft Office 365 ProPlus
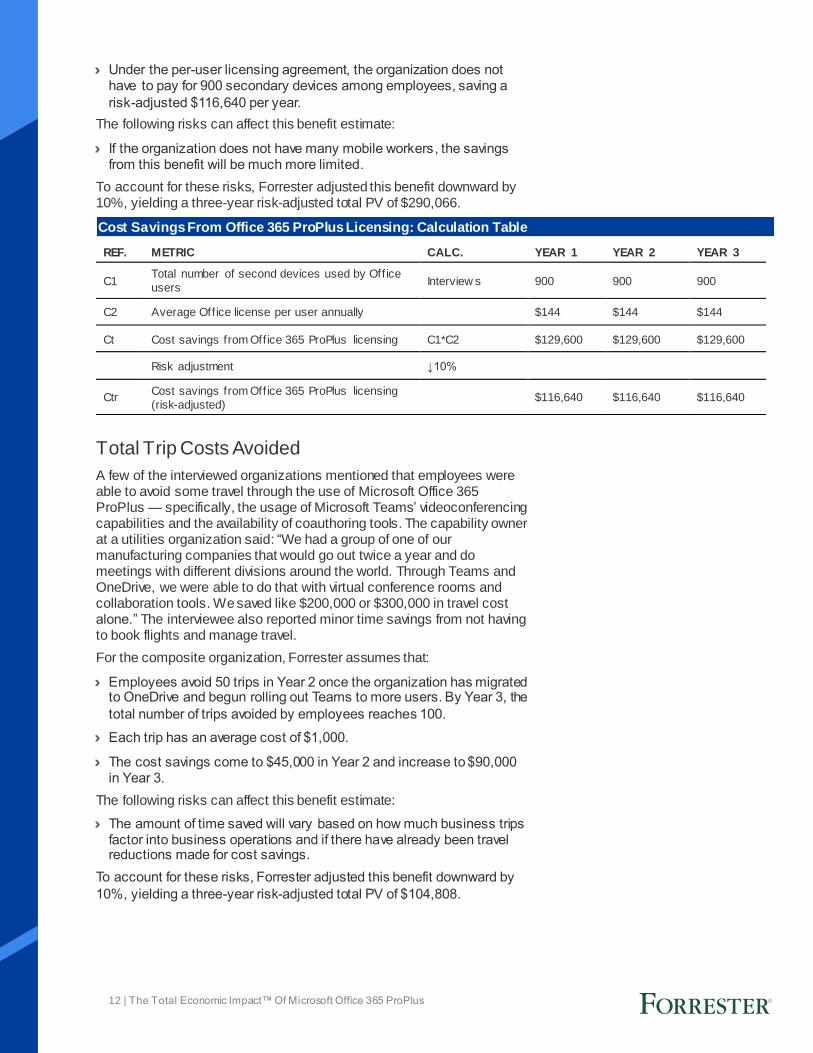
› Under the per-user licensing agreement, the organization does not have to pay for 900 secondary devices among employees, saving a
risk-adjusted $116,640 per year.
The following risks can affect this benefit estimate:
› If the organization does not have many mobile workers, the savings from this benefit will be much more limited.
To account for these risks, Forrester adjusted this benefit downward by 10%, yielding a three-year risk-adjusted total PV of $290,066.
Total Trip Costs Avoided
A few of the interviewed organizations mentioned that employees were able to avoid some travel through the use of Microsoft Office 365 ProPlus — specifically, the usage of Microsoft Teams’ videoconferencing capabilities and the availability of coauthoring tools. The capability owner at a utilities organization said: “We had a group of one of our manufacturing companies that would go out twice a year and do meetings with different divisions around the world. Through Teams and OneDrive, we were able to do that with virtual conference rooms and collaboration tools. We saved like $200,000 or $300,000 in travel cost alone.” The interviewee also reported minor time savings from not having to book flights and manage travel.
For the composite organization, Forrester assumes that:
› Employees avoid 50 trips in Year 2 once the organization has migrated to OneDrive and begun rolling out Teams to more users. By Year 3, the
total number of trips avoided by employees reaches 100.
› Each trip has an average cost of $1,000.
› The cost savings come to $45,000 in Year 2 and increase to $90,000 in Year 3.
The following risks can affect this benefit estimate:
› The amount of time saved will vary based on how much business trips factor into business operations and if there have already been travel reductions made for cost savings.
To account for these risks, Forrester adjusted this benefit downward by
10%, yielding a three-year risk-adjusted total PV of $104,808.
Cost Savings From Office 365 ProPlus Licensing: Calculation Table
REF. METRIC CALC. YEAR 1 YEAR 2 YEAR 3
C1 Total number of second devices used by Office
users Interview s 900 900 900
C2 Average Office license per user annually $144 $144 $144
Ct Cost savings from Office 365 ProPlus licensing C1*C2 $129,600 $129,600 $129,600
Risk adjustment ↓10%
Ctr Cost savings from Office 365 ProPlus licensing
(risk-adjusted) $116,640 $116,640 $116,640
13 | The Total Economic Impact™ Of Microsoft Office 365 ProPlus
Reduced TCO — technology infrastructure
cost savings: 13% of total benefits
Reduced TCO — Technology Infrastructure Cost
Savings
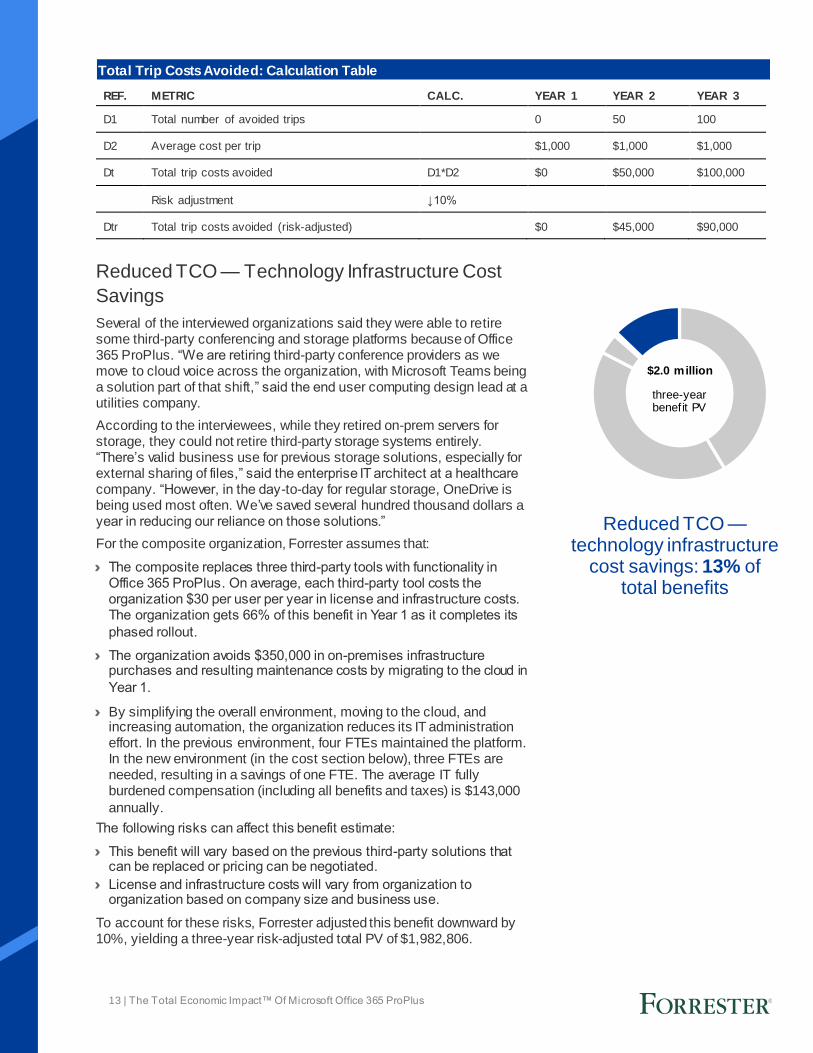
Several of the interviewed organizations said they were able to retire some third-party conferencing and storage platforms because of Office 365 ProPlus. “We are retiring third-party conference providers as we move to cloud voice across the organization, with Microsoft Teams being a solution part of that shift,” said the end user computing design lead at a utilities company.
According to the interviewees, while they retired on-prem servers for storage, they could not retire third-party storage systems entirely. “There’s valid business use for previous storage solutions, especially for external sharing of files,” said the enterprise IT architect at a healthcare company. “However, in the day-to-day for regular storage, OneDrive is being used most often. We’ve saved several hundred thousand dollars a year in reducing our reliance on those solutions.”
For the composite organization, Forrester assumes that:
› The composite replaces three third-party tools with functionality in Office 365 ProPlus. On average, each third-party tool costs the organization $30 per user per year in license and infrastructure costs. The organization gets 66% of this benefit in Year 1 as it completes its
phased rollout.
› The organization avoids $350,000 in on-premises infrastructure purchases and resulting maintenance costs by migrating to the cloud in
Year 1.
› By simplifying the overall environment, moving to the cloud, and increasing automation, the organization reduces its IT administration effort. In the previous environment, four FTEs maintained the platform. In the new environment (in the cost section below), three FTEs are needed, resulting in a savings of one FTE. The average IT fully burdened compensation (including all benefits and taxes) is $143,000
annually.
The following risks can affect this benefit estimate:
› This benefit will vary based on the previous third-party solutions that can be replaced or pricing can be negotiated.
› License and infrastructure costs will vary from organization to organization based on company size and business use.
To account for these risks, Forrester adjusted this benefit downward by 10%, yielding a three-year risk-adjusted total PV of $1,982,806.
Total Trip Costs Avoided: Calculation Table
REF. METRIC CALC. YEAR 1 YEAR 2 YEAR 3
D1 Total number of avoided trips 0 50 100
D2 Average cost per trip $1,000 $1,000 $1,000
Dt Total trip costs avoided D1*D2 $0 $50,000 $100,000
Risk adjustment ↓10%
Dtr Total trip costs avoided (risk-adjusted) $0 $45,000 $90,000
three-year benefit PV
$2.0 million
14 | The Total Economic Impact™ Of Microsoft Office 365 ProPlus
Flexibility, as defined by TEI,
represents an investment in additional
capacity or capability that could be
turned into business benefit for a future
additional investment. This provides an
organization w ith the "right" or the
ability to engage in future initiatives but
not the obligation to do so.
Unquantified Benefits
› OneDrive for Business and Office 365 ProPlus’ updated licensing structure is making the office environment more flexible. In one case, company culture was changing around being able to work on any desktop in the office. The senior VP of customer-facing technology at a financial services company said: “I wouldn’t be surprised if 50% of our office desktops are made available for anyone to work on. I don’t want to comment on the pros and cons of that, but an attitude is forming among employees where they don’t have an attachment to their physical desktop and will instead grab whichever is available to be
closer to certain colleagues or teams.”
› Productivity savings assist in improving the employee experience. Improvements from collaboration, file sharing, and having a full feature set in Office can potentially contribute to improved quality of life at work. Due to improved file-sharing and collaboration tools, employees may feel relief at not being included in another long email chain. Meanwhile, PowerPoint Designer may drive creativity for improved slide layouts. The director of business management at an IT company stated: “The improvement to the visualizations of PowerPoint are helping me to illustrate my points in new ways. Whereas previously I’d sometimes scour for third-party templates, it’s nice to have it right there.”
Flexibility
The value of flexibility is clearly unique to each customer, and the measure of its value varies from organization to organization. There are multiple scenarios in which a customer might choose to implement Office 365 ProPlus and later realize additional uses and business opportunities, including:
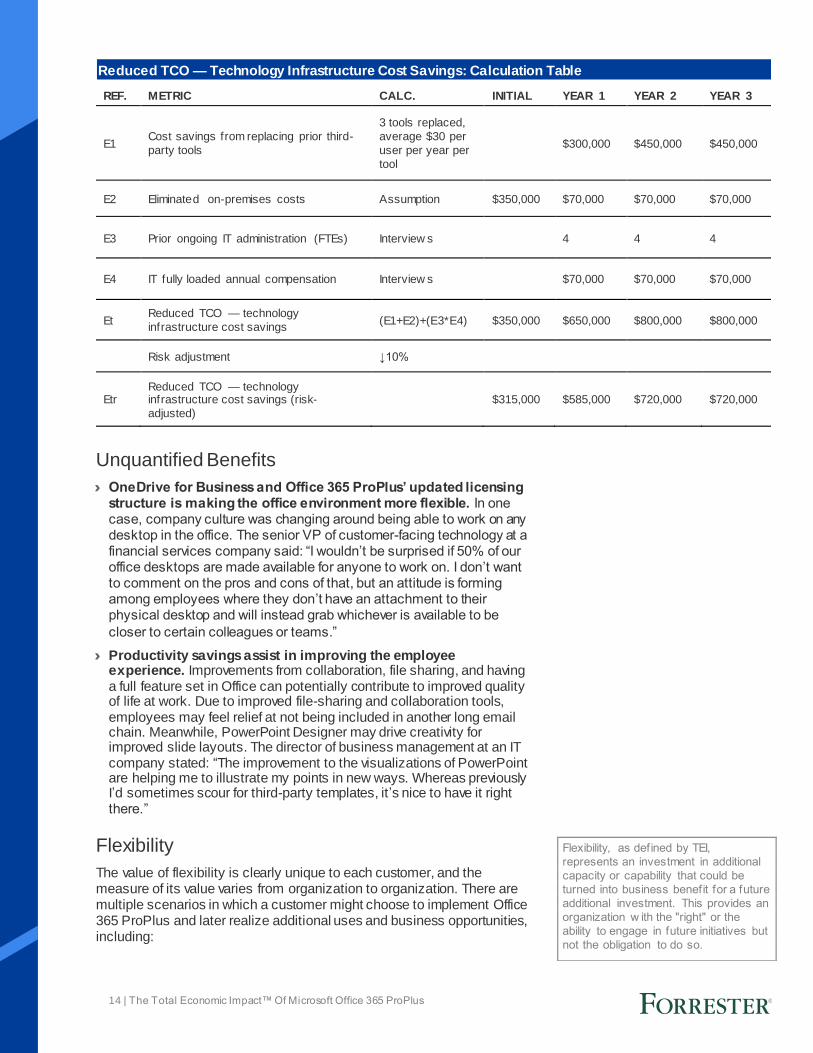
Reduced TCO — Technology Infrastructure Cost Savings: Calculation Table
REF. METRIC CALC. INITIAL YEAR 1 YEAR 2 YEAR 3
E1 Cost savings from replacing prior third-
party tools
3 tools replaced,
average $30 per
user per year per
tool
$300,000 $450,000 $450,000
E2 Eliminated on-premises costs Assumption $350,000 $70,000 $70,000 $70,000
E3 Prior ongoing IT administration (FTEs) Interview s 4 4 4
E4 IT fully loaded annual compensation Interview s $70,000 $70,000 $70,000
Et Reduced TCO — technology
infrastructure cost savings (E1+E2)+(E3*E4) $350,000 $650,000 $800,000 $800,000
Risk adjustment ↓10%
Etr Reduced TCO — technology infrastructure cost savings (risk-
adjusted)
$315,000 $585,000 $720,000 $720,000
15 | The Total Economic Impact™ Of Microsoft Office 365 ProPlus
› Upgrading Office 365 ProPlus license for additional features. The business administrators interviewed for this study had different service tiers of Office 365 running at their organizations, including E3 and E5 — which all include Office 365 ProPlus. Interviewees that had access to E1 and E3 spoke to benefits seen from a more integrated Exchange with other Microsoft applications for scheduling and file sharing. Meanwhile, SharePoint and Yammer helped teams to create hubs for project collaboration. E5 license users had full access to Office 365’s security features like advanced compliance, advanced threat protection, cloud app security, and threat intelligence, which enabled them to decommission third-party security applications. Here’s what some business administrators considered when choosing their Office
365 ProPlus license service tier:
• “We went with E5 because we’re big users of SharePoint, Exchange, and their servers. Previously, we had to install each product separately, and now they’re all a part of the Office 365 ProPlus. That all of the new Microsoft security features can be
included with the license is a bonus.”
• “We went with E3. We were looking at E5 but have a lot to do right now in terms of migrating SharePoint sites and making sure all of our employees are on Office 365 ProPlus, then
seeing how things are running with the software.”
16 | The Total Economic Impact™ Of Microsoft Office 365 ProPlus
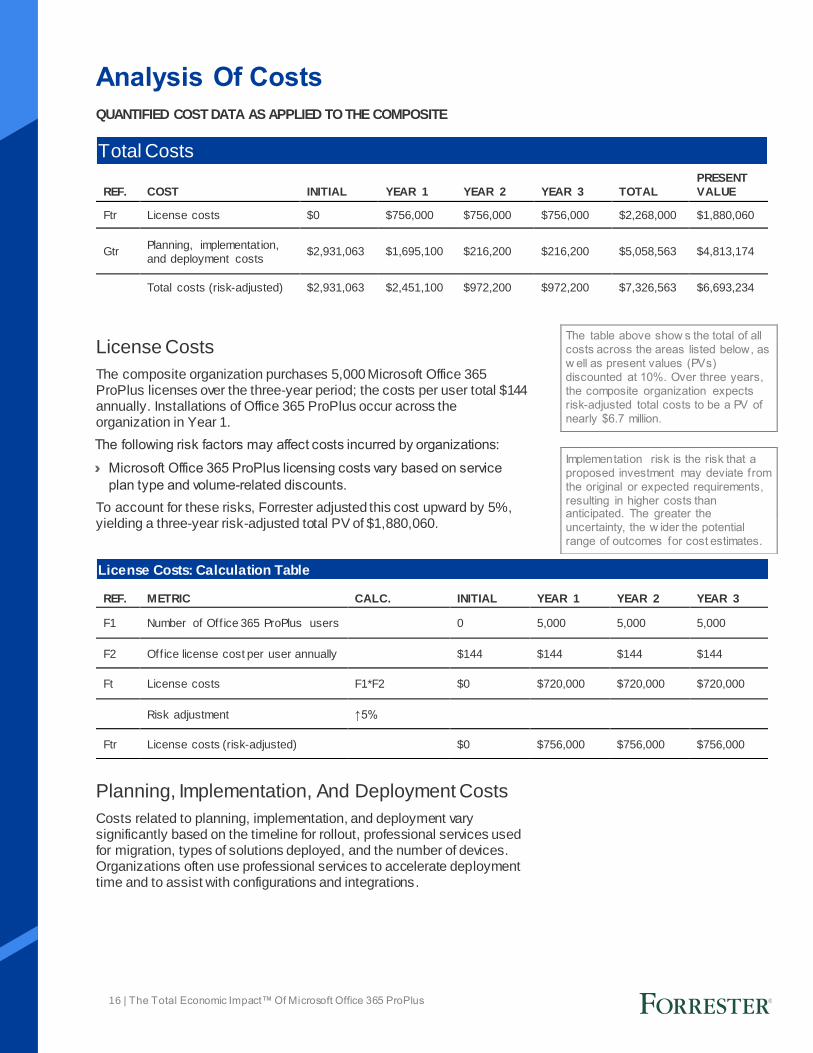
The table above show s the total of all
costs across the areas listed below, as
w ell as present values (PVs)
discounted at 10%. Over three years,
the composite organization expects
risk-adjusted total costs to be a PV of
nearly $6.7 million.
Implementation risk is the risk that a
proposed investment may deviate from
the original or expected requirements,
resulting in higher costs than anticipated. The greater the
uncertainty, the w ider the potential
range of outcomes for cost estimates.
Analysis Of Costs
QUANTIFIED COST DATA AS APPLIED TO THE COMPOSITE
License Costs
The composite organization purchases 5,000 Microsoft Office 365 ProPlus licenses over the three-year period; the costs per user total $144 annually. Installations of Office 365 ProPlus occur across the organization in Year 1.
The following risk factors may affect costs incurred by organizations:
› Microsoft Office 365 ProPlus licensing costs vary based on service
plan type and volume-related discounts.
To account for these risks, Forrester adjusted this cost upward by 5%, yielding a three-year risk-adjusted total PV of $1,880,060.
Planning, Implementation, And Deployment Costs
Costs related to planning, implementation, and deployment vary significantly based on the timeline for rollout, professional services used for migration, types of solutions deployed, and the number of devices. Organizations often use professional services to accelerate deployment time and to assist with configurations and integrations.
Total Costs
REF. COST INITIAL YEAR 1 YEAR 2 YEAR 3 TOTAL
PRESENT
VALUE
Ftr License costs $0 $756,000 $756,000 $756,000 $2,268,000 $1,880,060
Gtr Planning, implementation,
and deployment costs $2,931,063 $1,695,100 $216,200 $216,200 $5,058,563 $4,813,174
Total costs (risk-adjusted) $2,931,063 $2,451,100 $972,200 $972,200 $7,326,563 $6,693,234
License Costs: Calculation Table
REF. METRIC CALC. INITIAL YEAR 1 YEAR 2 YEAR 3
F1 Number of Office 365 ProPlus users 0 5,000 5,000 5,000
F2 Office license cost per user annually $144 $144 $144 $144
Ft License costs F1*F2 $0 $720,000 $720,000 $720,000
Risk adjustment ↑5%
Ftr License costs (risk-adjusted) $0 $756,000 $756,000 $756,000
17 | The Total Economic Impact™ Of Microsoft Office 365 ProPlus
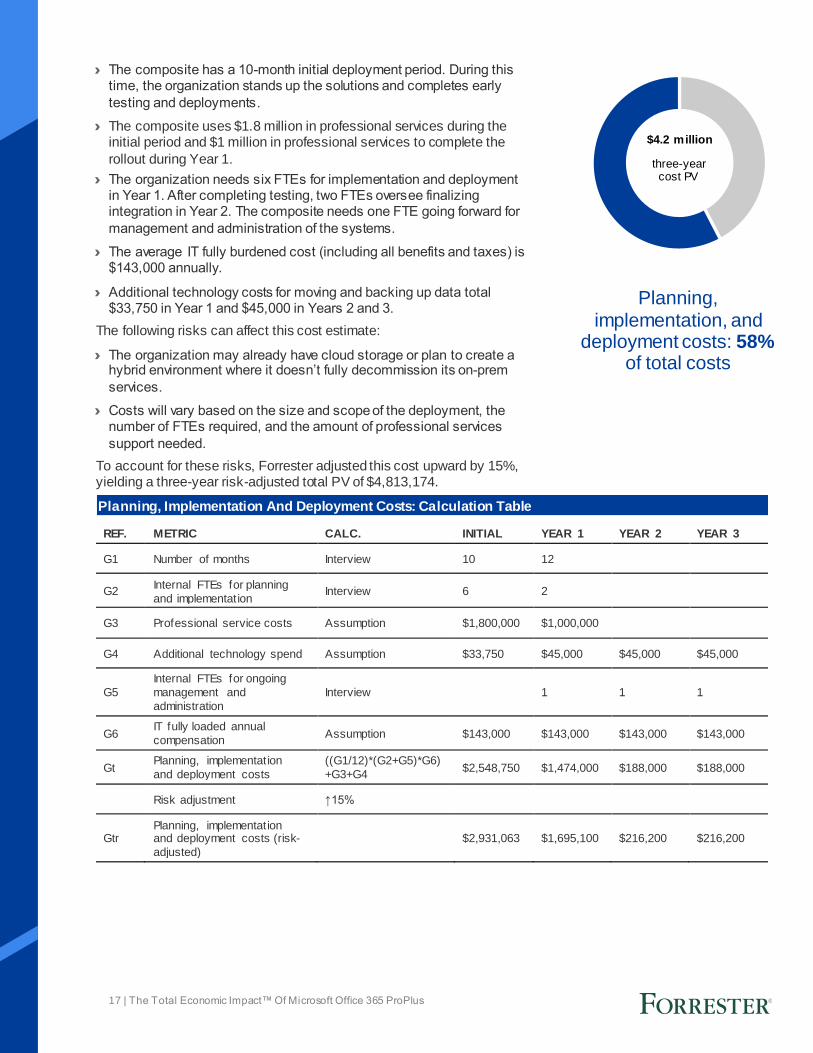
Planning, implementation, and
deployment costs: 58% of total costs
› The composite has a 10-month initial deployment period. During this time, the organization stands up the solutions and completes early
testing and deployments.
› The composite uses $1.8 million in professional services during the initial period and $1 million in professional services to complete the
rollout during Year 1.
› The organization needs six FTEs for implementation and deployment in Year 1. After completing testing, two FTEs oversee finalizing integration in Year 2. The composite needs one FTE going forward for
management and administration of the systems.
› The average IT fully burdened cost (including all benefits and taxes) is $143,000 annually.
› Additional technology costs for moving and backing up data total $33,750 in Year 1 and $45,000 in Years 2 and 3.
The following risks can affect this cost estimate:
› The organization may already have cloud storage or plan to create a hybrid environment where it doesn’t fully decommission its on-prem
services.
› Costs will vary based on the size and scope of the deployment, the number of FTEs required, and the amount of professional services
support needed.
To account for these risks, Forrester adjusted this cost upward by 15%, yielding a three-year risk-adjusted total PV of $4,813,174.
Planning, Implementation And Deployment Costs: Calculation Table
REF. METRIC CALC. INITIAL YEAR 1 YEAR 2 YEAR 3
G1 Number of months Interview 10 12
G2 Internal FTEs for planning
and implementation Interview 6 2
G3 Professional service costs Assumption $1,800,000 $1,000,000
G4 Additional technology spend Assumption $33,750 $45,000 $45,000 $45,000
G5
Internal FTEs for ongoing
management and
administration
Interview 1 1 1
G6 IT fully loaded annual
compensation Assumption $143,000 $143,000 $143,000 $143,000
Gt Planning, implementation
and deployment costs
((G1/12)*(G2+G5)*G6)
+G3+G4 $2,548,750 $1,474,000 $188,000 $188,000
Risk adjustment ↑15%
Gtr Planning, implementation and deployment costs (risk-
adjusted)
$2,931,063 $1,695,100 $216,200 $216,200
three-year cost PV
$4.2 million

18 | The Total Economic Impact™ Of Microsoft Office 365 ProPlus
The financial results calculated in the
Benefits and Costs sections can be
used to determine the ROI, NPV, and
payback period for the composite
organization’s investment. Forrester
assumes a yearly discount rate of 10%
for this analysis.
Financial Summary
CONSOLIDATED THREE-YEAR RISK-ADJUSTED METRICS
Cash Flow Chart (Risk-Adjusted)
-$4.0 M
-$2.0 M
$2.0 M
$4.0 M
$6.0 M
$8.0 M
$10.0 M
$12.0 M
$14.0 M
Initial Year 1 Year 2 Year 3
Cashf low s
Total costs
Total benefits
Cumulative net benefits
These risk-adjusted ROI,
NPV, and payback period
values are determined by
applying risk-adjustment
factors to the unadjusted
results in each Benefit and
Cost section.
Cash Flow Table (Risk-Adjusted)
INITIAL YEAR 1 YEAR 2 YEAR 3 TOTAL
PRESENT
VALUE
Total costs ($2,931,063) ($2,451,100) ($972,200) ($972,200) ($7,326,563) ($6,693,234)
Total benefits $315,000 $3,477,769 $6,433,898 $8,534,302 $18,760,969 $15,205,826
Net benefits ($2,616,063) $1,026,669 $5,461,698 $7,562,102 $11,434,407 $8,512,592
ROI 127%
Payback period 16 months
19 | The Total Economic Impact™ Of Microsoft Office 365 ProPlus
Microsoft Office 365 ProPlus: Overview
Office 365 ProPlus delivers cloud-connected and always up-to-date versions of the familiar Office desktop apps:
Word, Excel, PowerPoint, OneNote, Outlook, Teams, Project, Visio, Access*, and Publisher*. ProPlus SKUs also
come with a number of additional benefits including 5 installs, 1 TB of OneDrive storage and FastTrack
assistance.
*Only available on Windows PC
20 | The Total Economic Impact™ Of Microsoft Office 365 ProPlus
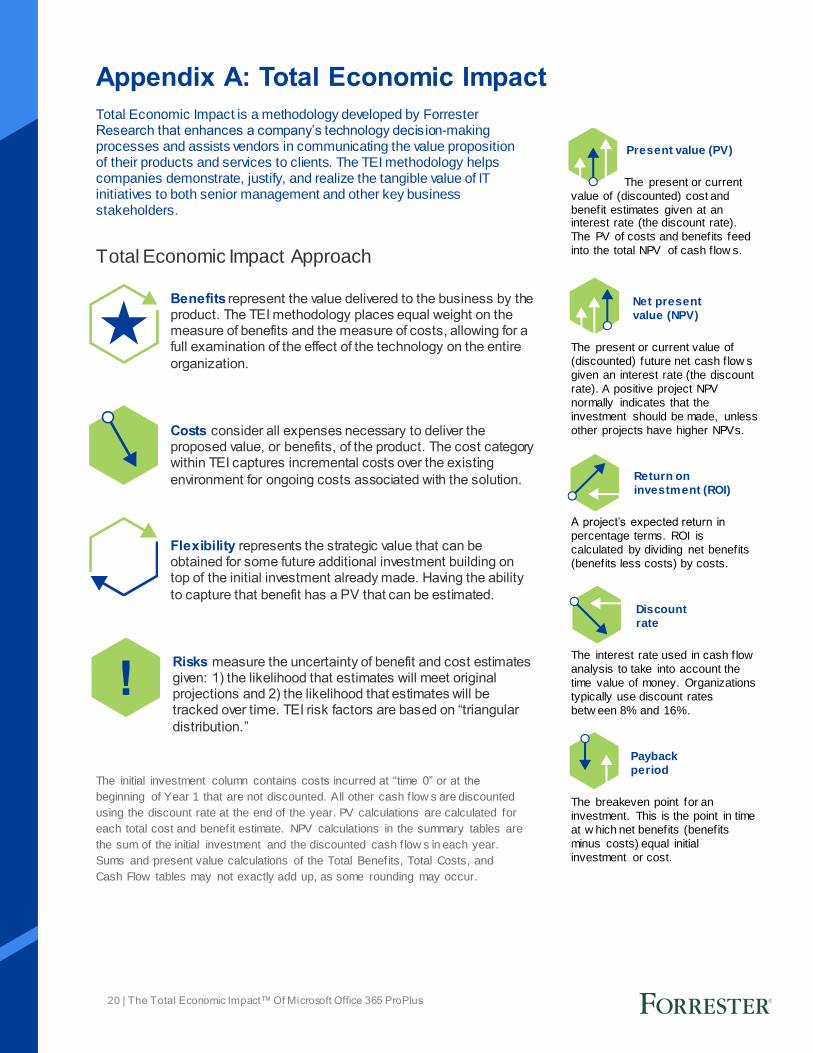
Appendix A: Total Economic Impact
Total Economic Impact is a methodology developed by Forrester Research that enhances a company’s technology decis ion-making processes and assists vendors in communicating the value proposition of their products and services to clients. The TEI methodology helps companies demonstrate, justify, and realize the tangible value of IT initiatives to both senior management and other key business stakeholders.
Total Economic Impact Approach
Benefits represent the value delivered to the business by the product. The TEI methodology places equal weight on the measure of benefits and the measure of costs, allowing for a full examination of the effect of the technology on the entire
organization.
Costs consider all expenses necessary to deliver the proposed value, or benefits, of the product. The cost category within TEI captures incremental costs over the existing
environment for ongoing costs associated with the solution.
Flexibility represents the strategic value that can be obtained for some future additional investment building on top of the initial investment already made. Having the ability
to capture that benefit has a PV that can be estimated.
Risks measure the uncertainty of benefit and cost estimates given: 1) the likelihood that estimates will meet original projections and 2) the likelihood that estimates will be tracked over time. TEI risk factors are based on “triangular
distribution.”
The initial investment column contains costs incurred at “time 0” or at the
beginning of Year 1 that are not discounted. All other cash f low s are discounted
using the discount rate at the end of the year. PV calculations are calculated for
each total cost and benefit estimate. NPV calculations in the summary tables are
the sum of the initial investment and the discounted cash f low s in each year.
Sums and present value calculations of the Total Benefits, Total Costs, and
Cash Flow tables may not exactly add up, as some rounding may occur.
Present value (PV)
The present or current
value of (discounted) cost and
benefit estimates given at an interest rate (the discount rate).
The PV of costs and benefits feed
into the total NPV of cash f low s.
Net present
value (NPV)
The present or current value of
(discounted) future net cash f low s
given an interest rate (the discount
rate). A positive project NPV
normally indicates that the
investment should be made, unless
other projects have higher NPVs.
Return on
investment (ROI)
A project’s expected return in
percentage terms. ROI is
calculated by dividing net benefits
(benefits less costs) by costs.
Discount
rate
The interest rate used in cash f low
analysis to take into account the
time value of money. Organizations
typically use discount rates
betw een 8% and 16%.
Payback
period
The breakeven point for an
investment. This is the point in time
at w hich net benefits (benefits
minus costs) equal initial
investment or cost.
21 | The Total Economic Impact™ Of Microsoft Office 365 ProPlus
Appendix B: Supplemental Material
Related Forrester Research
“The Total Economic Impact Of Microsoft 365,” Forrester Consulting report prepared for Microsoft, July 2019
“The Total Economic Impact Of Microsoft Teams,” Forrester Consulting report prepared for Microsoft, April 2019
(https://www.microsoft.com/en-us/microsoft-365/blog/wp-content/uploads/sites/2/2019/04/Total-Economic-Impact-Microsoft-Teams.pdf)
“New Tech TEI: The Total Economic Impact Of Microsoft 365 AI For Knowledge Workers,” Forrester Consulting report prepared for Microsoft, February 2019
(https://query.prod.cms.rt.microsoft.com/cms/api/am/binary/RWrZsV)