the traders’ traders ’ community you ... louis b. mendelsohn is a world-renowned pioneer in the...
TRANSCRIPT

AS A MEMBER, YOU'LL ENJOY:
Daily Market Commentaries
Educational Articles
Charts and Market Quotes
Headline News
Trading Contests
eBook Library
Blogs and Forums
Live Chat
Videos and Audio Podcasts
and much, much more
THE TRADERS’COMMUNIT Y YOU’VE BEEN WAITING FORH A S F I N A L LY A R R I V E D
THE TRADERS’COMMUNIT Y YOU’VE BEEN WAITING FORH A S F I N A L LY A R R I V E D
For Free Collection of Trading E-books, register at www.TraderPlanet.com/freebooks
TraderPlanet.com is the world's coolest social network built exclusively for traders.
We're building a community where people who have common interests in trading worldwide markets can come together and share resources, embrace new friendships, and make charitable
Be adventurous and explore TraderPlanet for yourself!
send you a FREE collection of trading e-books immediately upon registration. (Limited time only)
NEW
Summary
Trend Forecasting With Intermarket Analysis can help you better understand what it takes to be successful with
VantagePoint. The easy to read book covers:
• How to analyze today's global markets.
• Why intermarket data improves price forecasting accuracy.
• How neural networks detect trend changes early to give you an edge.
• Using predicted moving average crossover strategies to improve trading performance.
Bio
Louis B. Mendelsohn is a world-renowned pioneer in the use of intermarket analysis combined with neural-network
based software to analyze global financial markets. He is President and Chief Executive Officer of Market
Technologies, which he founded in 1979 to develop technical analysis trading software for the commodity futures
markets.
In 1983 Mr. Mendelsohn authored a series of ground-breaking articles in Futures magazine in which he outlined his
vision for strategy back testing for personal computers. That same year he introduced ProfitTaker Futures Trading
Software, the world’s first commercially available strategy back-testing trading software for personal computers.
In 1987, Lou introduced the first commercially available software to address the emerging globalization of the
financial markets through the application of intermarket analysis in trading software. In 1991, he introduced his
second-generation intermarket analysis software program, VantagePoint Intermarket Analysis Software, which applies
the pattern recognition capabilities of artificial intelligence to global intermarket data, and quantifies the effects of
related global markets on each other in order to make short-term market forecasts. Since then, Lou has continued to
improve VantagePoint’s predictive accuracy, which now makes trend forecasts for more than 600 global financial
markets with nearly 80% forecast accuracy.
Lou is a prolific author, having written dozens of articles on technical analysis and the global financial system in such
publications as Barron's; Futures; The Journal of Trading; Technical Analysis of Stocks & Commodities; Stocks,
Futures and Options Magazine; and the Journal of Commerce. As a contributor to TraderPlanet.com, he now brings his
wealth of knowledge to traders and investors around the globe.
11

22

Trend Forecasting With Intermarket Analysis
By Louis B. Mendelsohn
(Following are excerpts from the 2nd edition of Mendelsohn’s book published in 2008)
Historically, the methods that have been used by traders to analyze financial markets in an effort to identify and forecast the direction of price trends have been divided into two distinct approaches: fundamental analysis and technical analysis.
Fundamental analysis has been used by traders to make trading decisions by forecasting future prices and the trend direction on the basis of underlying economic factors affecting a particular financial market. For example, traders may decide to buy U.S. Treasury notes because they anticipate their prices will increase following the onset of a global crisis as traders exhibit a flight to quality. This is exactly what happened in 2007 as concerns over credit risk in the United States spread worldwide. Or, traders may buy corn because they expect crop losses due to expected drought conditions or higher demand due to an increase in ethanol production. They may buy shares of Intel because they expect this stock to beat the Street’s quarterly earnings estimates or Google because of the shift among advertisers to the Internet from more traditional media such as newspapers and magazines.
Every market is affected by a multitude of fundamental factors. The difficulty is getting reliable information before the rest of the marketplace knows it, sorting out what really will drive prices and anticipating correctly how other traders will react to this fundamental information, whether it’s a weather forecast or statistics in a government economic report. In other words, it can be a significant challenge to arrive at a sound and timely trading decision by considering all of the fundamental influences on a given market at a specific point in time.
Focusing on one factor
The premise behind technical analysis, which is contrary to that of fundamental analysis, is that all of the internal and external factors that are thought to affect a market at any given point in time are already built into that market’s price, even if these factors are based on fundamentals or mass-psychology. This price-discovery mechanism is one of the key underlying premises of technical analysis of the financial markets. In other words, a market’s current price is thought to reflect the rational collective judgment of all market participants, each with their own information on that market and their own perception of what they anticipate the market trend direction is likely to be in the immediate or near future.
Although fundamental analysis and technical analysis each have their own underlying philosophical foundation and specific analytic methodologies that look at the markets from two different viewpoints, both methods of analysis have essentially the same goal, namely determining the future trend direction of the various financial markets. It doesn’t matter whether the market is an individual stock, stock indexes, interest rates, currencies or commodity futures, the key questions in both types of analysis are:
• What is the current trend direction?
• How strong is the current trend?
• How long is the current trend likely to continue?
• When will the trend change direction? By asking these questions and analyzing either fundamental or technical data, traders are able to make trading decisions based on their conclusions about market direction with the intent to realize a profit if their market forecasts and timing prove to be correct.
Once traders analyze a specific market and form an opinion about the likely trend direction of that market, they must still decide when to get in or out of a position and at what price. As in many other walks of life, timing is everything. In today’s global financial markets, even if you were able to forecast the trend direction 100% correctly, you could still end up losing
3
money if your timing is off by even one day.
Market timing is especially challenging for futures and forex traders because of the risk involved due to their low capital requirements and high degree of leverage. Timing has also become an issue in the equities markets as the new breed of electronic day-traders spawned in the last decade move into and out of fast-moving individual stocks and ETFs with the same speed that futures traders buy and sell contracts on the Japanese yen or the S&P 500 Index. More equity traders now have to concern themselves with market timing than ever before.
As a trader, nothing is more frustrating than anticipating the trend direction correctly, getting into a position a little too soon, having the market go against you, getting stopped out and then watching the market turn around and move in the direction that you expected. When this scenario occurs, you either sit on the sidelines after having taken a loss or try to chase after the market. Both alternatives are very frustrating.
So, it is not just identifying the trend direction that is important. You also need to be able to anticipate when the market is poised to make a top or a bottom and change direction. When you have a reasonably accurate forecast of the expected trend direction, can identify impending turning points and have a good idea of the next day’s price range to help you determine entry and exit prices and set stops, you really have done your analysis. Now it’s just a matter of having the self-discipline and confidence to “pull the trigger.” This is where the psychology of trading comes into play.
Strategies that anticipate not react
Because the main objective of technical analysis is trend identification and forecasting, it would stand to reason that this goal could best be achieved by developing trading strategies that can somehow anticipate changes in trend direction, rather than relying upon trend-following, technical analysis approaches that lag behind the market. Popular single-market technical analysis indicators such as support and resistance lines, moving averages and chart pattern formations are popular lagging indicators that look internally at an individual market’s past price history and attempt to extrapolate from that data reoccurring price patterns that might prove useful for forecasting. This type of analysis really boils down to looking at what the market has already done and trying to guess where it is going next.
Despite frustration and disappointment with their trading results, many traders still use such lagging indicators, which were first popularized before personal computers came on the scene thirty years ago. Instead, I have advocated that traders, to be successful, need analysis tools that act as leading indicators, so traders can anticipate price action and identify whether or not the current trend is likely to continue or is on the verge of changing direction.
Using intermarket analysis to gain an edge
That realization sent me on a research mission more than two decades ago to see if I could find some way to retain the positive attributes of indicators like moving averages while overcoming their limitations – namely, their lagging nature. After years of studying the markets, observing the transition to global markets and developing countless computerized trading strategies, I began formulating an approach in the mid-1980s that explored the markets from an intermarket perspective. By incorporating the influence of market data from closely related markets in conjunction with price data from a target market, I was able to create quantitative indicators that no longer relied only on past price data for the target market alone but incorporated the effects of related markets.
Past price data for the target market are still an essential component of this analysis, but when combined with price data from related markets, innovative technical indicators can be developed that produce superior analytics when compared to traditional technical analysis indicators or studies using only single-market data. Intermarket data helps transform lagging indicators into leading indicators that can be used to forecast expected changes in market trend direction within a short time span of a day or two into the future with a relatively high degree of accuracy.
Of course, the further you try to look into the future, the less reliable the forecast. Weather forecasters trying to predict the weather for the next six months or a year have a rather spotty record because so many random and unforeseen events can
4
happen to alter weather patterns. In recent years, however, weather forecasters using more advanced forecasting tools have developed a good record for predicting the weather for the next few days.
The same thing is true in trading. It’s impossible to say where the price of crude oil or any other market will be six months or a year from now with any degree of precision. That’s why I have limited the time horizon for forecasting markets to the next few days. Even being able to anticipate price action for a day ahead is still more than enough lead time to provide a trader with a tremendous trading advantage over the masses of traders who still rely only on single-market, lagging indicators. Changing perspective It is not good enough to look only at each individual market by itself with popular single-market indicators that look retrospectively at an individual market’s past data in an effort to identify reoccurring patterns that can then be extrapolated into the future. This type of analysis really boils down to looking at where the market has been and trying to where it is going to go in the future.
I prefer to forecast market direction prospectively in a manner that captures the character and nature of today’s globally interdependent financial markets. This can be accomplished by using intermarket analysis tools comprised of leading indicators that can tell you whether an existing trend is likely to continue or is about to change direction, taking a lot of the guesswork out of trading.
The interrelationships of markets have become even more pronounced as the markets have become increasingly globalized. Despite the importance of analyzing intermarket relationships in this context, many traders are still too preoccupied with looking inward at each market, ignoring the interdependencies of the financial markets and their effects on one another.
In addition, technical analysts and traders have made little progress at objectively (quantitatively), not just subjectively (qualitatively), identifying repetitive patterns in market data, which is a necessary step for effective forecasting. It is now imperative for traders to adopt an intermarket perspective and to incorporate intermarket analysis into their trading strategies so they can deal with the global financial markets as they really exist.
A more quantitative approach to implementing intermarket analysis, such as I advocate, is not a radical departure from traditional technical analysis nor is it an attempt to replace it. Intermarket analysis is simply the next logical developmental stage in the evolution of technical analysis when you recognize the global nature of today’s interdependent, highly complex economies and integrated financial markets.
In truth, the only real piece of information you have to work with is the net effect of all these inputs, and that is price. As was emphasized earlier, the problem with past price data is that it has already occurred. Furthermore, everybody has access to historical price data, and they use many different techniques to massage old prices in an attempt to uncover new clues about future market strength and direction. Unfortunately, most traders who use these typical methods of analysis tend to lose money. It may not be the techniques they are using that are solely at fault; it may also be the limited, single-market data that they are feeding into their analysis.
Enter intermarket data
In the mid-1980s it became increasingly clear to me that the character and nature of the financial markets was beginning to undergo an inherent change as the global economy began to take form, and that intermarket analysis would become essential to traders who wanted to get an early reading on price direction in a target market ahead of the trading crowd. I realized quickly that widely used technical indicators with which I was already very familiar could be applied to intermarket analysis of global data in innovative ways by using an artificial intelligence tool known as neural networks to help make more accurate short-term trend forecasts.
Using extensive intermarket data and realizing that it would be impossible to make reliable price forecasts for more than a few days in the future (just like it is impossible to make long-term weather forecasts), I began researching and developing predictive
5

indicators that could forecast the market direction for the next day or two and forewarn whether or not a target market is about to make a top or bottom shortly and change trend direction. This is all done automatically through the pattern recognition and forecasting capabilities of neural networks applied to intermarket data. Once the neural networks have been researched, properly designed, trained and tested, they can be used in actual trading with current data updated each trading day to generate short-term trend forecasts for any chosen target market.
Applying neural networks to intermarket data to forecast moving averages and other commonly used technical indicators such as MACD, RSI and Stochastics supercharges these indicators by transforming them from lagging into leading indicators. With a small time advantage of even just one day, you can put the probabilities on your side and gain an edge over other traders, which can make the difference between success and failure. Remember the cliché, “The early bird gets the worm”.
Tapping a different data set
The road to a more reliable forecasting process begins with a more comprehensive set of price data available through intermarket analysis. Traditional technical indicators are computed using only past price data from a single market so any turning points they indicate will always lag behind the actual turning points in that market. By comparison, a predicted five-day moving average for two days in the future (based on both single-market and intermarket data) includes the most recent three days’ actual prices (which are already known), plus the next two days’ prices (which have not yet occurred).
By definition, this predicted moving average would have no lag and would be 100% accurate, if the prices for the next two trading days were somehow known in advance. That’s not possible, but if the prediction of the moving average is reasonably accurate, this information can give you a serious competitive advantage over other traders who are only looking backward at past price data, not forward in time.
I have found that predicted moving averages are most effective for trend forecasting when they are produced by analyzing intermarket data and are incorporated into more complex predictive indicators, such as moving average crossover strategies. These strategies can be used to identify not only the anticipated direction of the trend but also its strength by comparing several predicted moving averages for specific time periods in the future with each other or with today’s actual moving averages.
Applying predictive indicators
Most traders are eager to get some kind of trading edge – the few extra minutes or days spent studying the markets or the added insight from applying some new indicator that increases the odds that their trading will be more successful than it was before. By doing some form of intermarket analysis, an approach that many traders still do not use despite its obvious application in today’s global financial markets, traders could benefit from predictive indicators to provide market forecasts that can give them the edge they are seeking and, more important, desperately need.
Just having access to predictive indicators, however, does not assure trading success. Successful traders still need to develop methods or strategies with which they are comfortable and in which they have complete confidence so that when the markets become volatile (as they seem to be doing with more frequency due to their interconnectedness), traders will have a coherent trading framework on which they can rely.
This section will look at several basic strategies for using VantagePoint’s predictive indicators in conjunction with candlestick analysis and with an eye on fundamentals – the potentially volatile pricing periods associated with U.S. Fed Open Market Committee meetings, weather or other events. With the number and variety of predictive indicators in VantagePoint, strategies are limited only by the trader’s imagination. For further analysis of the predictive indicators, VantagePoint data can be exported to an Excel spreadsheet and massaged further, depending on how elaborate you want your strategies to be.
Before delving into the details of the sample strategies, several points need to be emphasized at the onset; otherwise, there is a tendency among traders to develop unrealistic expectations about trading:
• No strategy or indicator can be guaranteed to work 100% of the time. There is no such thing in trading. All you can hope to achieve is to improve your probability of success by using predictive indicators.
6
• Predictive indicators – or any indicators, for that matter – should not be used in isolation. Traders should apply predictive indicators in conjunction with traditional chart pattern analysis and the fundamentals of the market in a synergistic trading approach. As with candlestick analysis, the location of an indicator alert within the context of a price move is very important – that is, a buy indication that occurs after an extended downtrend is more likely to be legitimate than a buy indication that occurs after the market has already had an extended rally. • The comments below cover only the basics of the strategies discussed. There are countless variations to these strategies that can be implemented, and traders should feel free to conduct their own research to expand on or modify these strategies to suit their own trading style and comfort levels. • VantagePoint is an analytical software tool that provides intermarket-based predictive information. It is not a trading system per se and does not produce specific buy/sell signals.
Trading strategy premises
Time frames may vary, but trading strategies can be placed into one of two broad categories:
1 Trading with the breakout. When a market breaks through some kind of boundary – a trend line, moving average, support or resistance – the assumption is that prices will follow through on the breakout and launch a new trend. Not every breakout leads to a new trend, of course, but strategies based on breakouts and trend-following techniques count on riding longer extended trends following the breakout to more than offset those times when the breakout fails and results in small losses. 2 Trading against the breakout. When a market approaches some kind of boundary – a trend line, pivot points, moving average, support or resistance – the assumption is that prices will back away from that boundary and not break through into a new trend. Prices will eventually break through the boundary, of course, but this momentum, revert-to the-mean-type strategies count on the market’s tendency to respect key price points and maintain the trading range that is in place. VantagePoint offers predictive indicators that, when used with candlestick analysis and an assessment of where price action is occurring on a chart, can provide useful information for both types of trading strategies. In most cases, VantagePoint data can be viewed in either a tabular format on the Daily Report or History Report or in a more visual form on a chart, depending on your personal preference. You need to take some time to work with VantagePoint’s predictive indicators to determine which ones suit your style best. All of the indicators can give added insight into what’s happening in a given market and, therefore, can augment the typical single-market, lagging indicators that you may have been using and that most other traders continue to use.
Before getting into some strategy examples, the following are some general observations about VantagePoint’s predictive indicators that apply to a wide range of strategies.
Crossovers
When a predicted moving average or other predictive indicator line for one time period crosses above or below the moving average or other indicator line for another time period, it suggests a trend change in a number of different trading strategies familiar to most traders. The advantage of VantagePoint is that these crossovers that utilize predictive indicators often provide an indication of a trend reversal before typical moving averages and other lagging indicators would, thereby giving you an early warning about direction changes.
The crossovers may involve a shorter-term predictive exponential moving average with a longer-term predictive exponential moving average, or they may involve a predictive exponential moving average crossover with an actual simple moving average. In addition, the diverging (widening) or converging (narrowing) of two indicator lines can be used as a sign of a price move’s strength or weakness and can provide evidence to support adding to or reducing the size of a market position. When the difference between two downward sloping lines on a chart reaches a maximum negative value and starts to narrow, for example, it indicates that the downward trend is beginning to lose strength and provides an early warning that the market is likely to make a bottom and turn up soon. Rising or falling numbers
Forecasted moving averages and other leading technical indicators can give you valuable information by just looking at the
7
changes in their values on VantagePoint’s Daily Report or History Report without referring to a chart. When VantagePoint's forecasted moving average for a future date is greater than today's actual moving average, for example, the market is expected to move higher over that time frame. Similarly, when the forecasted moving average is less than today's actual moving average, the market is expected to move lower. The averages are updated with each new data download so the difference between the two moving averages from one time period to the next indicates the relative strength of the expected move over that time frame.
For those who prefer to look at the indicators on a chart, the slope of the indicator line provides important clues. An indicator line that is pointed up indicates strength and higher prices; an indicator line sloping downward indicates weakness and lower prices. The steepness of the line’s slope suggests the degree of strength or weakness of the trend.
The same conclusions can be applied to traditional moving averages and other lagging indicators based on single-market analysis, but the advantage of leading predictive indicators is that these changes in indicator direction and the slope of the rising/falling lines often are evident a day or two before they are noticeable on a chart of typical moving averages or trend-following indicators that are based only on the one market being observed. Traders can develop a number of different strategies based on this observation alone, with their response to this information depending on how aggressive they want to be in their trading.
The numbers for the Predicted Neural Index, as described in the previous chapter, do not get larger or smaller but alternate between a numerical value of 1.00 or 0.00. A Neural Index of 1.00 indicates that the trend direction is expected to be higher over the next two days. A Neural Index of 0.00 indicates that the trend direction is expected to be lower over the next two days.
Because VantagePoint’s neural networks have been developed and trained independently for each target market, Daily Reports from other target markets can be used for additional confirmation. The Neural Index can be used as a first alert that leads to further analysis or as a filter to confirm what other indicators might be suggesting, depending on where you want to start your analysis.
Breakout strategies
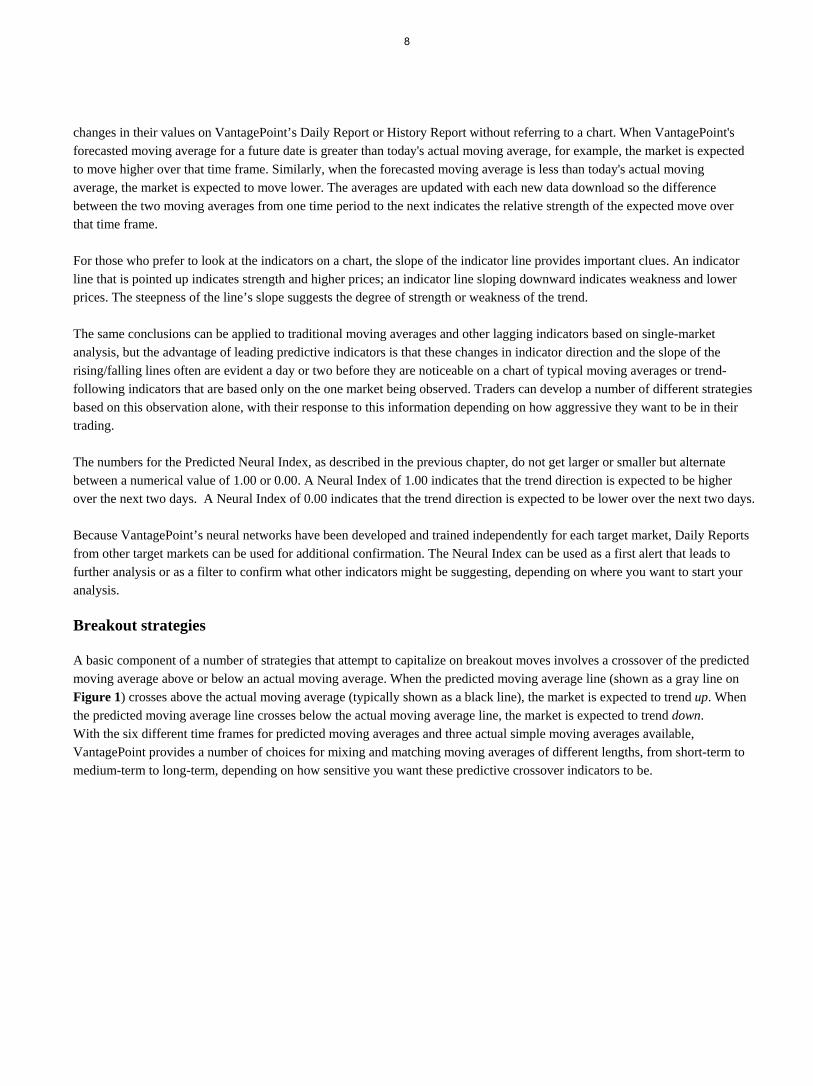
A basic component of a number of strategies that attempt to capitalize on breakout moves involves a crossover of the predicted moving average above or below an actual moving average. When the predicted moving average line (shown as a gray line on Figure 1) crosses above the actual moving average (typically shown as a black line), the market is expected to trend up. When the predicted moving average line crosses below the actual moving average line, the market is expected to trend down. With the six different time frames for predicted moving averages and three actual simple moving averages available, VantagePoint provides a number of choices for mixing and matching moving averages of different lengths, from short-term to medium-term to long-term, depending on how sensitive you want these predictive crossover indicators to be.
8
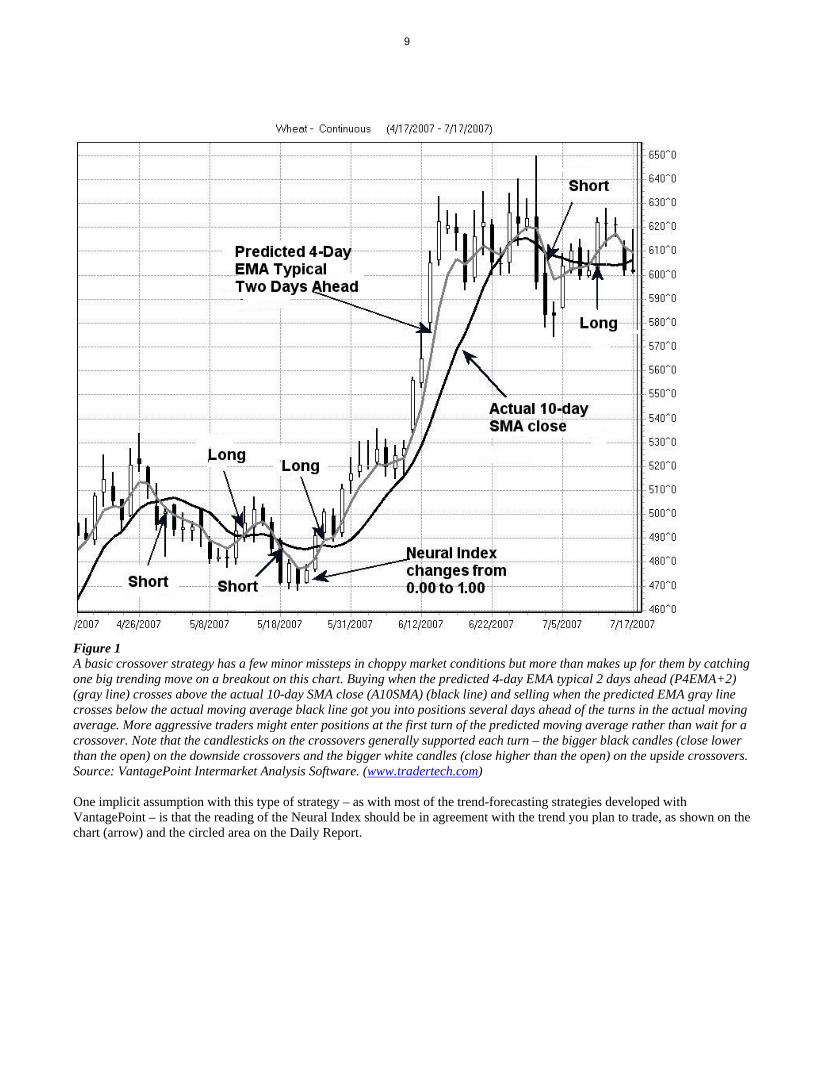
Figure 1 A basic crossover strategy has a few minor missteps in choppy market conditions but more than makes up for them by catching one big trending move on a breakout on this chart. Buying when the predicted 4-day EMA typical 2 days ahead (P4EMA+2) (gray line) crosses above the actual 10-day SMA close (A10SMA) (black line) and selling when the predicted EMA gray line crosses below the actual moving average black line got you into positions several days ahead of the turns in the actual moving average. More aggressive traders might enter positions at the first turn of the predicted moving average rather than wait for a crossover. Note that the candlesticks on the crossovers generally supported each turn – the bigger black candles (close lower than the open) on the downside crossovers and the bigger white candles (close higher than the open) on the upside crossovers. Source: VantagePoint Intermarket Analysis Software. (www.tradertech.com) One implicit assumption with this type of strategy – as with most of the trend-forecasting strategies developed with VantagePoint – is that the reading of the Neural Index should be in agreement with the trend you plan to trade, as shown on the chart (arrow) and the circled area on the Daily Report.
9
Figure 2 The shift of the Neural Index from 0.00 to 1.00 detected underlying strength based on intermarket analysis and provided an early alert for a long position a couple of days before the predicted moving average crossover. Source: VantagePoint Intermarket Analysis Software. (www.tradertech.com)
In addition to observing a crossover indicator on a VantagePoint chart, you can also see the trend changes reflected in the numbers in the predicted short-term, predicted medium-term and predicted long-term difference columns in the Daily Report. The difference numbers compare a predicted moving average against an actual moving average, and the direction of change in the numbers indicates market strength or weakness during the time period indicated. For a bullish indication, numbers in the predicted short-term, medium-term and long-term difference columns on the Daily Report turn from red (minus signs) to black (positive) or they are significantly strengthening – that is, black numbers are getting larger or red numbers are getting smaller. As you might expect, the short-term difference numbers usually tend to turn first and bounce back and forth more, followed by the medium-term and long-term difference numbers.
10
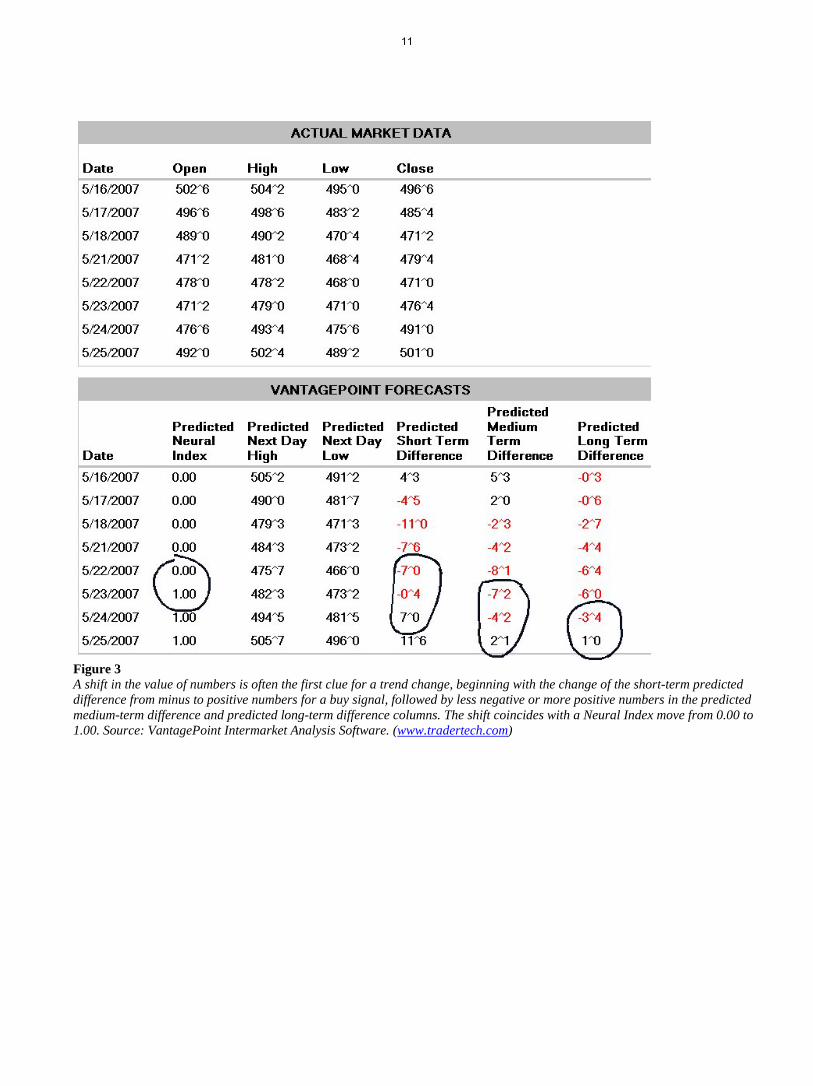
Figure 3 A shift in the value of numbers is often the first clue for a trend change, beginning with the change of the short-term predicted difference from minus to positive numbers for a buy signal, followed by less negative or more positive numbers in the predicted medium-term difference and predicted long-term difference columns. The shift coincides with a Neural Index move from 0.00 to 1.00. Source: VantagePoint Intermarket Analysis Software. (www.tradertech.com)
11
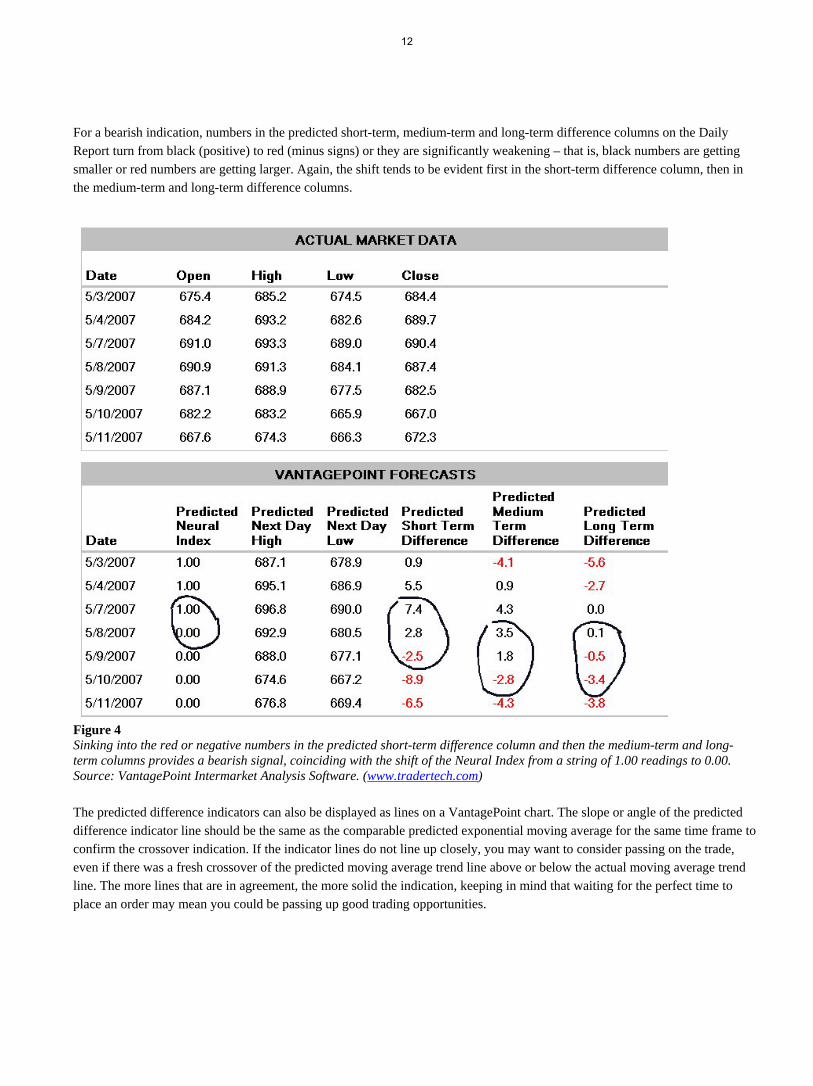
For a bearish indication, numbers in the predicted short-term, medium-term and long-term difference columns on the Daily Report turn from black (positive) to red (minus signs) or they are significantly weakening – that is, black numbers are getting smaller or red numbers are getting larger. Again, the shift tends to be evident first in the short-term difference column, then in the medium-term and long-term difference columns.
Figure 4 Sinking into the red or negative numbers in the predicted short-term difference column and then the medium-term and long-term columns provides a bearish signal, coinciding with the shift of the Neural Index from a string of 1.00 readings to 0.00. Source: VantagePoint Intermarket Analysis Software. (www.tradertech.com)
The predicted difference indicators can also be displayed as lines on a VantagePoint chart. The slope or angle of the predicted difference indicator line should be the same as the comparable predicted exponential moving average for the same time frame to confirm the crossover indication. If the indicator lines do not line up closely, you may want to consider passing on the trade, even if there was a fresh crossover of the predicted moving average trend line above or below the actual moving average trend line. The more lines that are in agreement, the more solid the indication, keeping in mind that waiting for the perfect time to place an order may mean you could be passing up good trading opportunities.
12
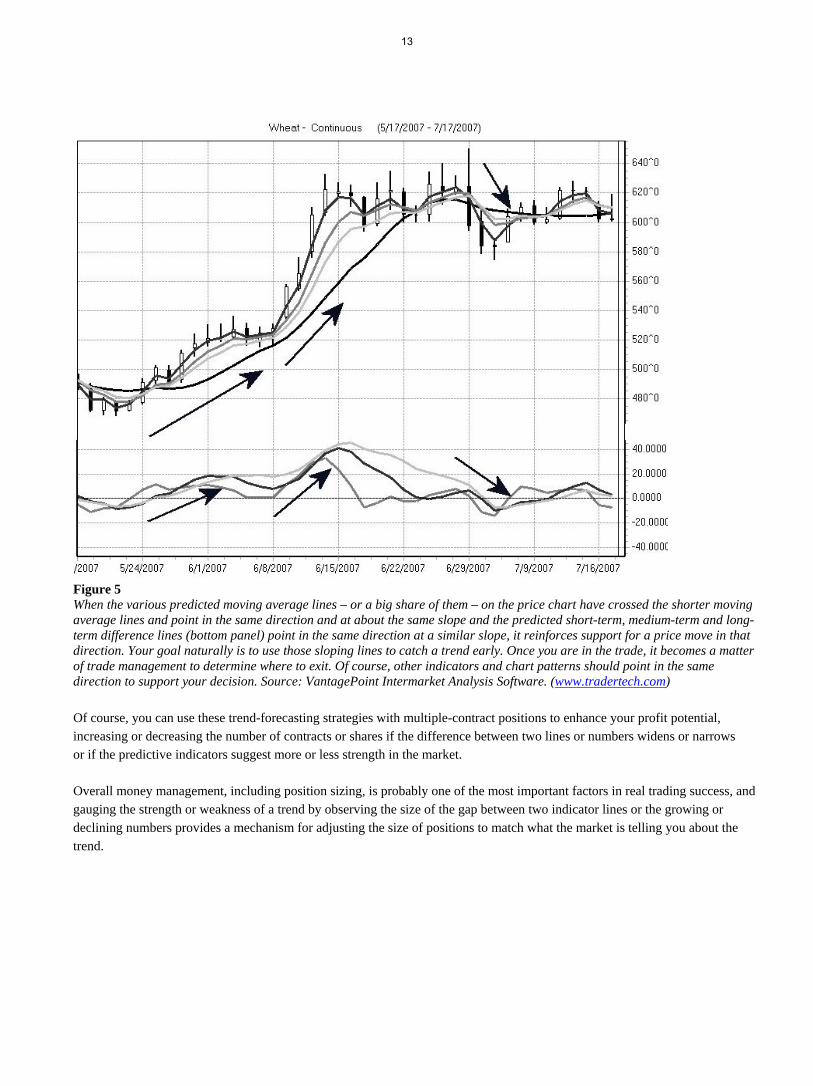
Figure 5 When the various predicted moving average lines – or a big share of them – on the price chart have crossed the shorter moving average lines and point in the same direction and at about the same slope and the predicted short-term, medium-term and long-term difference lines (bottom panel) point in the same direction at a similar slope, it reinforces support for a price move in that direction. Your goal naturally is to use those sloping lines to catch a trend early. Once you are in the trade, it becomes a matter of trade management to determine where to exit. Of course, other indicators and chart patterns should point in the same direction to support your decision. Source: VantagePoint Intermarket Analysis Software. (www.tradertech.com)
Of course, you can use these trend-forecasting strategies with multiple-contract positions to enhance your profit potential, increasing or decreasing the number of contracts or shares if the difference between two lines or numbers widens or narrows or if the predictive indicators suggest more or less strength in the market.
Overall money management, including position sizing, is probably one of the most important factors in real trading success, and gauging the strength or weakness of a trend by observing the size of the gap between two indicator lines or the growing or declining numbers provides a mechanism for adjusting the size of positions to match what the market is telling you about the trend.
13
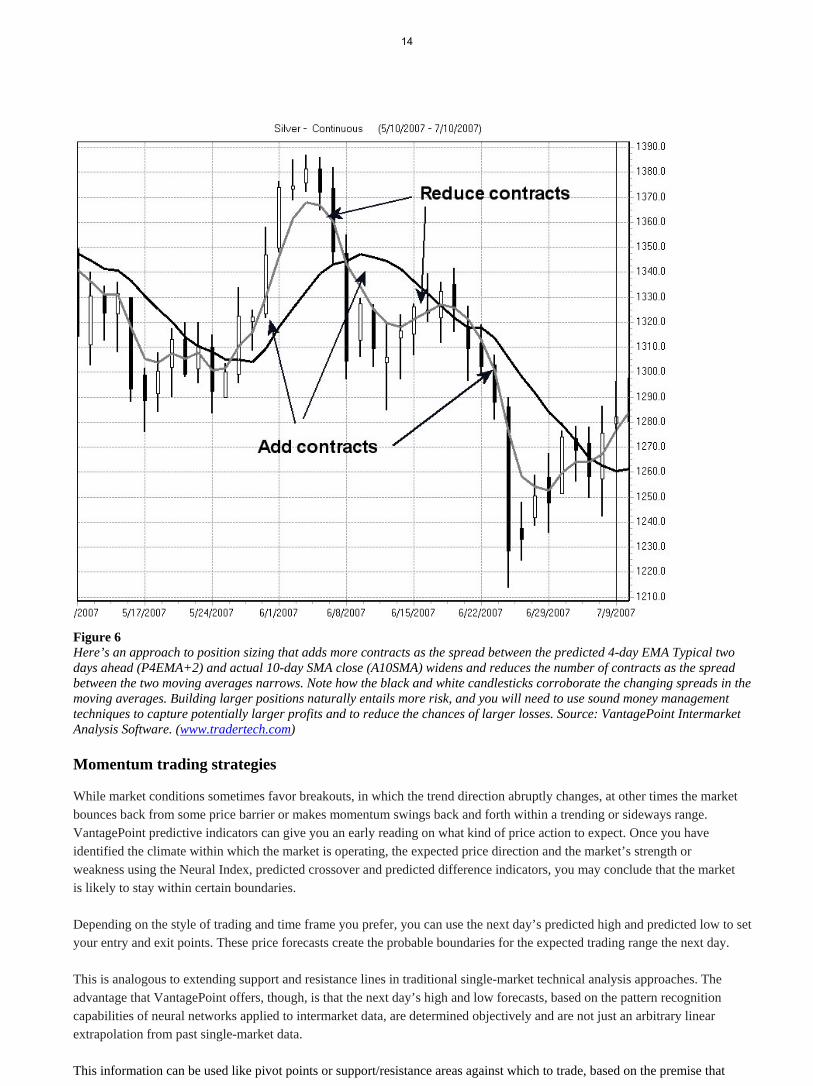
Figure 6 Here’s an approach to position sizing that adds more contracts as the spread between the predicted 4-day EMA Typical two days ahead (P4EMA+2) and actual 10-day SMA close (A10SMA) widens and reduces the number of contracts as the spread between the two moving averages narrows. Note how the black and white candlesticks corroborate the changing spreads in the moving averages. Building larger positions naturally entails more risk, and you will need to use sound money management techniques to capture potentially larger profits and to reduce the chances of larger losses. Source: VantagePoint Intermarket Analysis Software. (www.tradertech.com)
Momentum trading strategies
While market conditions sometimes favor breakouts, in which the trend direction abruptly changes, at other times the market bounces back from some price barrier or makes momentum swings back and forth within a trending or sideways range. VantagePoint predictive indicators can give you an early reading on what kind of price action to expect. Once you have identified the climate within which the market is operating, the expected price direction and the market’s strength or weakness using the Neural Index, predicted crossover and predicted difference indicators, you may conclude that the market is likely to stay within certain boundaries.
Depending on the style of trading and time frame you prefer, you can use the next day’s predicted high and predicted low to set your entry and exit points. These price forecasts create the probable boundaries for the expected trading range the next day.
This is analogous to extending support and resistance lines in traditional single-market technical analysis approaches. The advantage that VantagePoint offers, though, is that the next day’s high and low forecasts, based on the pattern recognition capabilities of neural networks applied to intermarket data, are determined objectively and are not just an arbitrary linear extrapolation from past single-market data.
This information can be used like pivot points or support/resistance areas against which to trade, based on the premise that
14

prices will generally stay within the day’s predicted range. Or, it can be used to determine where to place stops to enter or exit the market if prices move outside the predicted range.
A market that is advancing will usually not touch the line denoting the predicted lows, for example, making a point below the next day’s predicted low a good spot for a stop on a long position if the market does not continue to make the expected upward move. If a market that has been rising does tumble below the next day’s predicted low, it’s a sign that the market has turned weaker and may be set up for a trend reversal to the downside.
If you are a day trader, you can use the forecasts of the next day’s high and low to identify low-risk day trades. If the Neural Index and forecasted moving average indicators for a specific target market indicate that the next day is expected to be a down day, you can wait for the market to trade up toward the predicted high before initiating a short position with a limit or market order, with the intention of closing out the trade near the predicted low.
Similarly, long positions can be entered near the predicted low on a day the market is expected to move up, with exits near the predicted high.
You may place your limit order a specific number of ticks below the predicted high or above the predicted low for either entry or exit, or you may use a percentage of the day’s expected range to determine how far below the predicted high or above the predicted low your order should be. For example, the distance may be 20% of the day’s predicted range. For forex, the distance might be 15-20 pips inside the predicted low or predicted high. This is a judgment call and may vary with your experience with different markets.
If the current trend is up, you could place a limit buy order a specified distance above the predicted low and set a protective stop several ticks below the predicted low or at a logical chart point that is within your risk tolerance level. If the current trend is down, you could place a limit order to sell at a specified distance below the predicted high and set a protective stop several ticks above the predicted high or at a logical chart point that is within your risk tolerance level.
To exit a trade after you get into a position with your limit order, you might set a profit target that is about 80% of the day’s predicted trading range, placing another limit order to exit the position. In essence, you are only attempting to fade the day’s predicted high or low, assuming that the market will bounce back into the expected range after trading near the predicted high or low.
Note: You may not get into or out of a position with a limit order so you may have to use some discretion on entries/exits. With this type of trade, you take what the market gives you during the day and do not attempt to hold for a long-term trade that can put you at risk overnight or over a weekend.
This tactic allows day traders to sell rallies within an expected downtrend or buy dips within an expected uptrend one or more times daily, depending on the intraday market volatility. Although some traders day trade against the prevailing trend, day trading in the direction of the prevailing trend is generally a better choice for this strategy because in a downtrend, the market is more likely to be near its predicted high early in the trading session and to close near its daily low and the predicted low. In an uptrend, the market is likely to trade near its low early and then close near the day’s high and predicted high. The profitability of day trades that are executed with this strategy can be substantial with minimal risk because tight stops can be utilized.
15
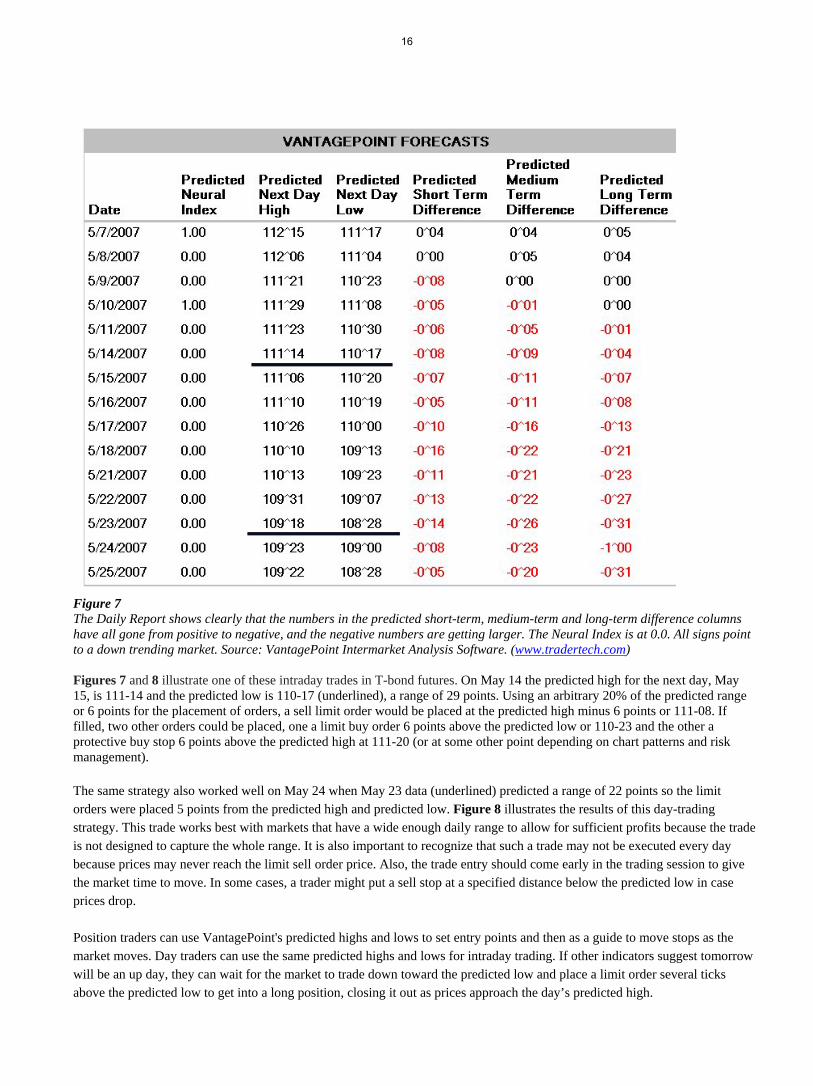
Figure 7 The Daily Report shows clearly that the numbers in the predicted short-term, medium-term and long-term difference columns have all gone from positive to negative, and the negative numbers are getting larger. The Neural Index is at 0.0. All signs point to a down trending market. Source: VantagePoint Intermarket Analysis Software. (www.tradertech.com) Figures 7 and 8 illustrate one of these intraday trades in T-bond futures. On May 14 the predicted high for the next day, May 15, is 111-14 and the predicted low is 110-17 (underlined), a range of 29 points. Using an arbitrary 20% of the predicted range or 6 points for the placement of orders, a sell limit order would be placed at the predicted high minus 6 points or 111-08. If filled, two other orders could be placed, one a limit buy order 6 points above the predicted low or 110-23 and the other a protective buy stop 6 points above the predicted high at 111-20 (or at some other point depending on chart patterns and risk management). The same strategy also worked well on May 24 when May 23 data (underlined) predicted a range of 22 points so the limit orders were placed 5 points from the predicted high and predicted low. Figure 8 illustrates the results of this day-trading strategy. This trade works best with markets that have a wide enough daily range to allow for sufficient profits because the trade is not designed to capture the whole range. It is also important to recognize that such a trade may not be executed every day because prices may never reach the limit sell order price. Also, the trade entry should come early in the trading session to give the market time to move. In some cases, a trader might put a sell stop at a specified distance below the predicted low in case prices drop. Position traders can use VantagePoint's predicted highs and lows to set entry points and then as a guide to move stops as the market moves. Day traders can use the same predicted highs and lows for intraday trading. If other indicators suggest tomorrow will be an up day, they can wait for the market to trade down toward the predicted low and place a limit order several ticks above the predicted low to get into a long position, closing it out as prices approach the day’s predicted high.
16

Figure 8 This chart summarizes the results of two short-term short trades within a bigger downtrend – no huge winners but good, solid profits. Source: VantagePoint Intermarket Analysis Software. (www.tradertech.com)
A position trader can use the same forecasts of the next day’s high and low to enter positions with a breakout strategy, then use the subsequent days’ forecasts to move stops or exit the trade. For example, if the market has been in a downtrend but the predictive indicators are pointing to a reversal to an uptrend, you could put a buy stop somewhere above the predicted high for the next day. The exact spot will depend on your risk propensity, but your stop should be sufficiently above VantagePoint’s predicted high for the next day to lessen the probability of getting into a position prematurely due to intraday market volatility. When prices make a sharp jump outside of their predicted range, it suggests a strong move in the direction of the breakout, which could continue enough to make a long position profitable. As protection, a sell stop could be placed below the predicted low or at a logical chart point in case there is no follow through on the upside breakout.
In a strong uptrend, the daily price ranges are noticeably above the predicted lows, and the market tends to close well above the predicted high, as the white candlesticks on the chart illustrate. In a strong downtrend, the daily ranges tend to stay below the predicted highs, and the market tends to close well below the predicted low, as the black candlesticks confirm. When a market open or low is above the predicted high, it is a particularly strong buy indication, especially in conjunction with a bullish chart pattern such as exceeding a previous high, as occurred on June 11 on this chart.
17
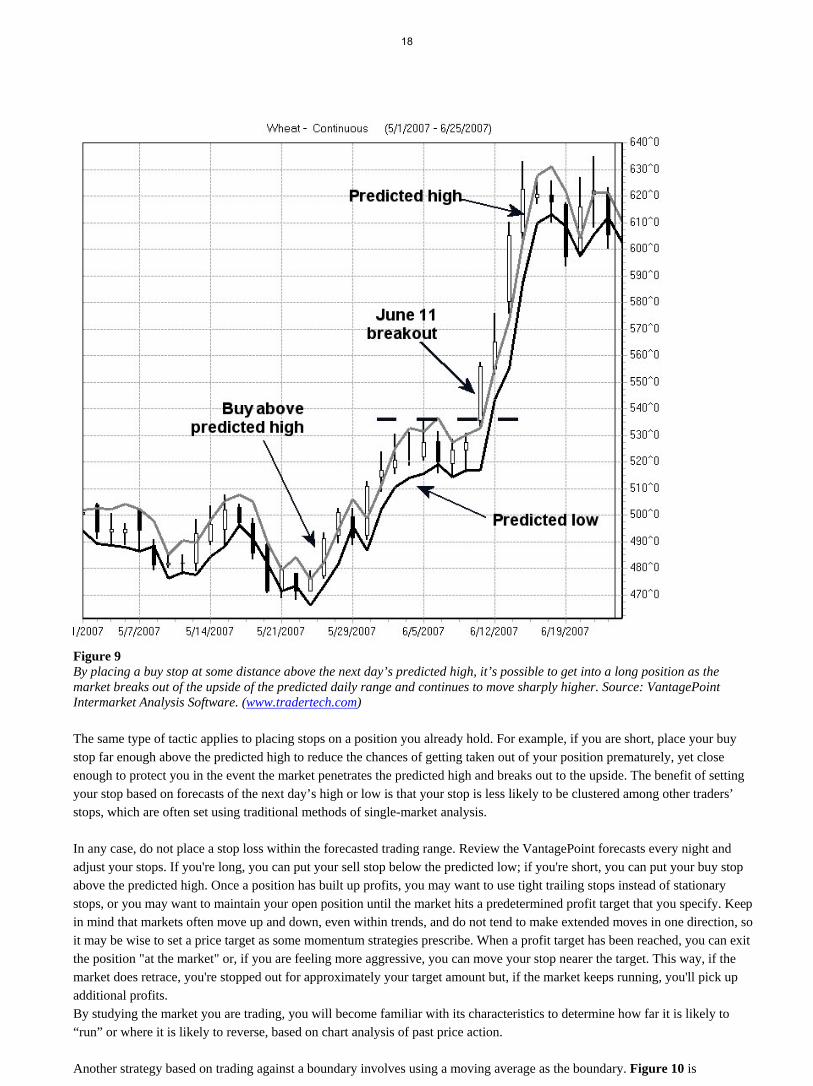
Figure 9 By placing a buy stop at some distance above the next day’s predicted high, it’s possible to get into a long position as the market breaks out of the upside of the predicted daily range and continues to move sharply higher. Source: VantagePoint Intermarket Analysis Software. (www.tradertech.com)
The same type of tactic applies to placing stops on a position you already hold. For example, if you are short, place your buy stop far enough above the predicted high to reduce the chances of getting taken out of your position prematurely, yet close enough to protect you in the event the market penetrates the predicted high and breaks out to the upside. The benefit of setting your stop based on forecasts of the next day’s high or low is that your stop is less likely to be clustered among other traders’ stops, which are often set using traditional methods of single-market analysis.
In any case, do not place a stop loss within the forecasted trading range. Review the VantagePoint forecasts every night and adjust your stops. If you're long, you can put your sell stop below the predicted low; if you're short, you can put your buy stop above the predicted high. Once a position has built up profits, you may want to use tight trailing stops instead of stationary stops, or you may want to maintain your open position until the market hits a predetermined profit target that you specify. Keep in mind that markets often move up and down, even within trends, and do not tend to make extended moves in one direction, so it may be wise to set a price target as some momentum strategies prescribe. When a profit target has been reached, you can exit the position "at the market" or, if you are feeling more aggressive, you can move your stop nearer the target. This way, if the market does retrace, you're stopped out for approximately your target amount but, if the market keeps running, you'll pick up additional profits. By studying the market you are trading, you will become familiar with its characteristics to determine how far it is likely to “run” or where it is likely to reverse, based on chart analysis of past price action.
Another strategy based on trading against a boundary involves using a moving average as the boundary. Figure 10 is
18
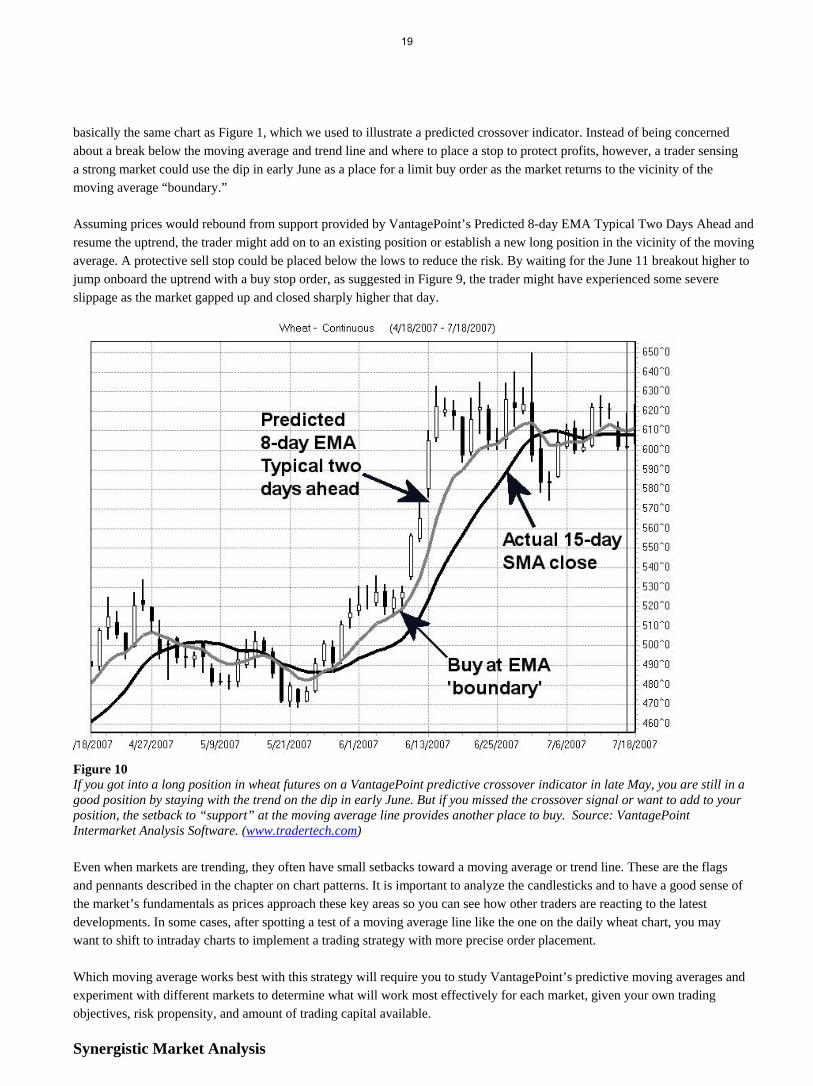
basically the same chart as Figure 1, which we used to illustrate a predicted crossover indicator. Instead of being concerned about a break below the moving average and trend line and where to place a stop to protect profits, however, a trader sensing a strong market could use the dip in early June as a place for a limit buy order as the market returns to the vicinity of the moving average “boundary.”
Assuming prices would rebound from support provided by VantagePoint’s Predicted 8-day EMA Typical Two Days Ahead and resume the uptrend, the trader might add on to an existing position or establish a new long position in the vicinity of the moving average. A protective sell stop could be placed below the lows to reduce the risk. By waiting for the June 11 breakout higher to jump onboard the uptrend with a buy stop order, as suggested in Figure 9, the trader might have experienced some severe slippage as the market gapped up and closed sharply higher that day.
Figure 10 If you got into a long position in wheat futures on a VantagePoint predictive crossover indicator in late May, you are still in a good position by staying with the trend on the dip in early June. But if you missed the crossover signal or want to add to your position, the setback to “support” at the moving average line provides another place to buy. Source: VantagePoint Intermarket Analysis Software. (www.tradertech.com)
Even when markets are trending, they often have small setbacks toward a moving average or trend line. These are the flags and pennants described in the chapter on chart patterns. It is important to analyze the candlesticks and to have a good sense of the market’s fundamentals as prices approach these key areas so you can see how other traders are reacting to the latest developments. In some cases, after spotting a test of a moving average line like the one on the daily wheat chart, you may want to shift to intraday charts to implement a trading strategy with more precise order placement.
Which moving average works best with this strategy will require you to study VantagePoint’s predictive moving averages and experiment with different markets to determine what will work most effectively for each market, given your own trading objectives, risk propensity, and amount of trading capital available.
Synergistic Market Analysis
19

As the world’s financial markets have become increasingly integrated, intermarket analysis now plays a crucial role in analyzing and trading today’s global markets, just as back-testing and optimization of single-market trading strategies became integral to computerized technical analysis in the 1980s. But successful market analysis means more than just intermarket analysis, as has been pointed out previously in this book. Traders have to look at today’s markets from a three-dimensional perspective. In the late 1980s I first wrote about this concept, which I call “Synergistic Market Analysis,” that combines single-market technical analysis, intermarket analysis and fundamental analysis. In effect, it looks at financial market analysis as a three-legged stool in which all three perspectives offer their own unique insight into market dynamics.
Interestingly, due to their robust nature, neural networks are not only well-suited to analyzing markets from both a single-market and an intermarket perspective but can also incorporate fundamental data inputs. These might include the latest supply and demand statistics or economic data such as the Gross Domestic Product, Producer Price Index, Consumer Price Index or employment statistics. Even comparative economic statistics from different countries can be included.
In effect, as the interrelationships of the global financial markets continue to evolve and become even more complex and fast-paced, technical analysis, intermarket analysis and fundamental analysis will need to become blended together. By utilizing the computational modeling capabilities of neural networks in a structured framework that integrates seemingly disparate technical, intermarket and fundamental data, innovative, quantitative trend forecasting indicators can be developed and tested, which will keep them at the cutting edge of financial market analysis for the foreseeable future.
20
About the Author and Market Technologies, LLC
Louis B. Mendelsohn is a world renowned pioneer in the application of personal computers and trading software to the global financial markets. He is President and Chief Executive Officer of Market Technologies which he founded in 1979 to develop technical analysis trading software for the commodity futures markets. Mr. Mendelsohn, himself, began trading equities and stock options in the early 1970s. Then, in the late 1970s he switched to commodities, as both a day and position trader, and developed trading software for the commodities futures markets.
In 1983 Mr. Mendelsohn authored a series of ground-breaking articles in Futures magazine in which he outlined his vision for strategy back testing and optimization for personal computers. That same year he introduced ProfitTaker Futures Trading Software, the world’s first commercially available strategy back-testing trading software for personal computers. By the mid-1980s these capabilities had become the standard in technical analysis trading software for both stock and futures traders throughout the world.
Following the October, 1987 global market crash, first predicted by ProfitTaker in August, 1987, Mr. Mendelsohn took technical analysis to the next generation when he introduced the first commercially available PC software in the financial industry to address the emerging globalization of the financial markets through the application of intermarket analysis in trading software. Several years later, in 1991 he introduced his second generation intermarket analysis software program, VantagePoint Intermarket Analysis Software, which applies the pattern recognition capabilities of artificial intelligence to global intermarket data, and quantifies the effects of related global markets on each other in order to make short term market forecasts.
Since then, Mr. Mendelsohn along with his research and development team, The Predictive Technologies Group, has been focused on the accelerating globalization of the financial markets and has continued to make improvements to VantagePoint’s predictive accuracy, which now makes trend forecasts for more than 600 global financial markets with nearly 80% forecast accuracy. These achievements have been responsible for Market Technologies’ phenomenal growth over the past decade, with thousands of trading software customers in nearly 100 countries worldwide, and three wins since 2004 in the Inc. magazine competition of the fastest growing privately-held companies in the United States.
Mr. Mendelsohn is a prolific author, having written dozens of articles on technical analysis and the global financial system in such publications as Barron's; Futures; The Journal of Trading; Technical Analysis of Stocks & Commodities; Stocks, Futures and Options Magazine; and the Journal of Commerce.
Following the October, 1989 aftershock exactly two years after the 1987 crash, Mr. Mendelsohn warned traders about the likelihood of more frequent and severe global financial aftershocks and the potential for a full-scale global meltdown. In numerous articles and editorials he called for clearing firms, regulators, and central banks to develop coordinated, worldwide contingency plans before, not after, the onset of a crisis that could ripple through the global financial system and bring about a full-scale meltdown.
In a Journal of Commerce editorial on February 5, 1990 entitled “Build a Global Safety Net”, Mr. Mendelsohn argued that “vital security, clearing and regulatory issues must be resolved to assure the fiduciary integrity of the international financial and banking systems, particularly during times of worldwide financial or political crisis”. In this editorial he went on to caution that “The integrity of the world financial and banking systems necessitates that international coordination and cooperation among the various stock and futures exchanges, central banks, finance ministries, regulatory agencies and international banks be implemented through formal agreements and informal understandings” to replace the “last minute, frantic telephone discussions during a crisis [which] has been the modus operandi”.
Months later in an April, 1990 editorial in Futures magazine entitled “24-Hour Trading: Let’s do it right”, Mr. Mendelsohn warned that “aftershocks following Black Monday's financial earthquake may become more commonplace…as the 24-hour electronic trading systems are fully implemented -- unless serious clearing, security and regulatory deficiencies are overcome”, and that “Global trading on a 24-hour basis, without a real-time global clearing mechanism, presents a major threat to the integrity of the world's financial markets”.
In 1995 in a seminal book entitled Artificial Intelligence in the Capital Markets, Mr. Mendelsohn devoted Chapter 5 to a detailed overview of the global financial system and the systemic risks that would become an ever-present danger for traders. In this chapter, Mr. Mendelsohn indicated that “…few traders comprehend the intricacies of derivatives… Since most derivatives did not exist during the last major bear equities market in 1974, the degree of influence that derivatives might have in precipitating or accelerating a major worldwide financial crisis, more severe than 1987, can not yet be measured”.
21
Mr. Mendelsohn has been widely quoted in other financial publications over the past quarter-century, including the Wall Street Journal and Investor's Business Daily, has contributed to more than half a dozen books on the global financial markets, has beeninterviewed live on CNN, Bloomberg, and CNBC, and since 2000 has authored three books on the global financial markets.
His book, Trend Forecasting with Technical Analysis: Unleashing the Hidden Power of Intermarket Analysis to Beat the Market, released in December 2000, has more than 45,000 copies in print to date. Chapter 1, entitled “Trading in the Global Economy”, addresses the factors that have brought about the global financial system in the 21st century and cautions traders andinvestors about the increasing risk that “financial crises can spin out of control quickly, as interdependent financial markets fall, setting off a chain reaction that reverberates worldwide”. His next book, Forex Trading Using Intermarket Analysis: Discovering Hidden Market Relationships That Provide Early Clues For Price Direction was released in March 2006. In this book he discussed the role of the currency and foreign exchange markets in the global financial system.
The following year, in a cover page article entitled “Ripple Effect Looms Large in FX Markets” in the November, 2007 issue of Stocks, Futures and Options Magazine, Mr. Mendelsohn was prophetic in his prediction of an impending worldwide financial meltdown. In this article he warned that “The commodity markets, such as crude oil and gold, have a tremendous effect on other financial markets—including U.S. Treasury notes and bonds, which, in turn, have a powerful impact on the global equity, debt and derivatives markets. They subsequently affect the U.S. dollar and forex markets, which then further influence prices of commodities. This dynamic has already played itself out a number of times since the 1987 crash, including the 1997 Asian currency crisis, the 1998 Long Term Capital Management debacle and the crisis following the 2001 terrorist attack on the United States. Each occurrence underscored the far-reaching implications regarding the fragile stability of the global financialsystem, itself, amid the ever-present prospect of a worldwide Category 5 financial meltdown”.
Again, in Mr. Mendelsohn’s most recent book published in June, 2008, entitled Trend Forecasting with Technical Analysis: Predicting Global Markets with Technical Analysis, he spelled out exactly what actions traders needed to take to protect their wealth and prosper at the onset of a global crisis that he believed would roil the global financial system and precipitate a full-scale meltdown of the financial markets. Traders who have applied Mr. Mendelsohn’s global intermarket software tools have been able to make rational, effective trading decisions during the 2008 global meltdown and are well positioned to take advantage of unprecedented trading opportunities while many other traders and investors have become paralyzed with fear and weakened financially because they lacked the proper analytic tools needed to succeed in the global financial markets of the 21stcentury.
Because of his expertise and pioneering achievements in the application of computers and trading software to the global financial markets over the past three decades, Mr. Mendelsohn's biography is highlighted in Marquis Who's Who in the World, Who's Who in America, Who's Who in Finance and Industry, and in a time capsule at the White House in Washington, D. C. He has been a full member of the Market Technicians Association since 1988 and a colleague of the International Federation of Technical Analysts.
Born in 1948 in Providence, Rhode Island, Mr. Mendelsohn received a B.S. degree in Administration and Management Science from Carnegie Mellon University's Tepper School of Business in 1969, a M.S.W. degree from the State University of New York at Buffalo in 1973, and a M.B.A. degree with Honors from Boston University in 1977.
As an avid collector of antique office technology and equipment, Mr. Mendelsohn has antique typewriters and pre-electric calculating machines (which are early forerunners to today's personal computers) that date back
Company Information: Market Technologies, LLC E-mail address: [email protected] Web site address: www.tradertech.comPhone: USA and Canada: 1-800-732-5407 Others: 813-973-0496 Fax: 813-973-2700
22

Membership is FREE – Join Today at TraderPlanet.com
STUDYING MARKETS AND TRADING ...
Lane J. Mendelsohn, Publisher, TraderPlanet.com
Less-experienced traders are always asking questions about how to best learn and study "fundamentals" or "technicals" in markets.
market fundamentals, and few trading books focus only on fundamentals that
books on fundamental analysis of futures markets are so rare is because the subject matter is so enormous. Here is just a smattering of macro fundamental factors
futures prices: weather, world politics, consumer tastes and consumer demand,
interest rates, currency values, natural disasters ... and the list could go on and on.
Technical analysis addresses part of the dilemma of keeping up with all the fundamental factors impacting futures market prices because price activity is a
and/or other fundamental factor known to all traders. Price activity also factors in ideas and speculation about the future prospects, and future news, for the market.
But the big challenge for traders has always been to be among those people who know about all those fundamentals and chart patterns in a timely manner and can interpret what they mean for prices in the market they are trading.
Now a new trading portal called TraderPlanet (www.TraderPlanet.com) gives traders a source of fresh fundamental and technical analysis information daily as well as many trading education features to help move the trader down the road of more successful trading. Markets are changing constantly every day and every minute, as anyone who has observed recent events can attest. What you read in newspapers and magazines can become outdated quickly, and traders need current information and data to succeed.
But TraderPlanet is more than just a one-way conduit of current news and information directed to users. It is a new social networking experience for traders that provides them with plenty of interaction with other traders and with top trading analysts and experts – blogs on a variety of topics, chat rooms, trading contests, sentiment surveys and a new gauge of market opinion, the TraderPlanet Indexes for eight market areas. And there are even “My Planet” personal pages for photos and details you may want to share with other traders.
Got a question and looking for an answer about a product, trading strategy or whatever else is on your mind? It is quite likely that there’s someone else out there on this trading planet who has been wondering the same thing or is willing to share their experience to help you out.
Want to talk to a corn farmer in Iowa or a sugar cane grower in Brazil or a banker in London? Somewhere on this planet someone may want to share their views with you, and TraderPlanet.com’s goal is to facilitate those connections wherever
is now a local community, and TraderPlanet.com is designed to get you acquainted with your trading neighbors.
Now, TraderPlanet.com is not going to guarantee you instant market knowledge and trading success. Many traders feel almost "naked" if they attempt to trade a market when they know little about the
to know all of the details about the market
the timing of key economic reports, the potential head-and-shoulders top and all those other things that make for an informed trader.
But wouldn’t you feel more comfortable trading if you had access to current news reports and expert commentaries and could tap the views and opinions of others in the trading community around the world? And do all of this for free?
TraderPlanet.com is a web site where, as its motto says, traders are likely to gravitate in the future.
I have been fortunate in my career in the futures industry. When I was a
reporter and editor for Futures World News (now Dow Jones Newswires), I was
forced to learn about the fundamentals impacting all the markets I covered,
which included all the U.S. markets and some traded overseas. I was able to
talk to traders and analysts every day for about a dozen years regarding the
fundamentals and chart action that impacted the particular market on
which I was reporting. Indeed, very few get that kind of unique opportunity to
learn about markets. But now TraderPlanet.com gives almost any trader
access to the same kind of information and insights at no charge.
The markets volatility has made it more important than ever for the
trader or investor to be educated, and TraderPlanet is the one community that
brings all of us that education. It gives me the opportunity to share my
experience and insight with other traders around the world, and learn from
them to build my knowledge base. Having so much educational content
from so many providers, in so many different forms like the videos, webinars,
and blogs, all in one place that I can trust, helps me ultimately become a more
successful trader! Keep up the great work TraderPlanet.
Grant Stern
Trader Planet has helped me develop my investment strategy by
blogging, which is the best way I can imagine to keep a rolling journal. The
trading community's comments on my investment ideas really give
important feedback about complex ideas.
Chris Mahlmann