the trading floor - nyquistdesign.com · the trading floor td ameritrade institutional 2 what is a...
TRANSCRIPT

The Trading FloorApril 2017
Table of Contents
TECHNICAL ANALYSIS
Bitcoin: How it Works and Correlations to Other Currencies ........................................................................ 2
INCOME & PROTECTION STRATEGIES
Trading Earnings – What to Expect from the Unexpected ........................................................................... 6
TRADING STRATEGIES
FedEx Corp. (FDX) – A Three Trade Package ............................................................................................. 9
SPECIAL FEATURE
What to Do at Market Highs? ..................................................................................................................... 12
KEY INDICATORS
A Surprise Twist in the Active/Passive Debate ........................................................................................... 15
EDUCATION & EVENTS
Upcoming Webcast Series and Live Events ............................................................................................... 17
BIOS
Meet the Contributing Writers ..................................................................................................................... 21

The Trading Floor | TD Ameritrade Institutional 2
What is a Bitcoin?
Simply put, a Bitcoin is a solution to a math problem. This particular math problem has exactly 21 million solutions, meaning there can never be more than 21 million Bitcoins in existence. There are currently just over 16 million Bitcoins, so over 75% of the eventual total have already been created. People can acquire Bitcoins by purchasing them with fiat currencies or trading goods and services for them. It’s also possible to obtain Bitcoins through mining them, however this gets harder to accomplish as time passes because there are fewer being created. At inception, there were 50 new Bitcoins created every 10 minutes. In 2013, that dropped to 25; now we’re at 12.5 and in 2020, it will drop again to 6.25. This amount gets cut in half every 3.5 years.
Why do Bitcoins have value?
Bitcoins have value for the same reason any other commodity or currency has value: there is a demand for it. The reason there is demand for it however; is more exciting. Bitcoin offers a method for consumers to transfer value directly, without needing a clearing house to verify transactions. Any transaction is posted to the public ledger and verified by the entire Bitcoin community, therefore eliminating the need for a central clearing house. This ability combined with the finite number of coins are two of the main factors driving demand. If demand drops so will the price of Bitcoin, however unlike fiat currencies, it is protected from being constantly inflated through the creation of an unlimited number of new units. We’ve seen this demand surge recently in both Nigeria and Venezuela as their currencies have experienced parabolic rates of inflation.
How Does One invest in Bitcoin?
As it stands now there is only one ETF for Bitcoins, and it’s only over the counter with extremely light volume making a financial investment difficult. There are many online providers that host Bitcoin wallets where you can buy and hold Bitcoins, but this isn’t a scalable vehicle, especially as a financial advisor looking for potential investments. It’s possible this may change in the near future as there are multiple ETF filings waiting for a ruling from the SEC, although the first major filing was denied on March 10, 2017. Here is a quote from the SEC’s response on why it was denied:
“Specifically, the Commission does not find that the proposed rule change is consistent with Section 6(b)(5) of the Exchange Act—which requires that the rules of a national securities exchange be designed, among other things, to prevent fraudulent and manipulative acts and practices and to protect investors and the public interest.”
One of the filings still pending has added insurance against fraud and manipulation in its management structure, so this ruling doesn’t necessarily mean the others will be denied. But it is an added level of difficulty to overcome.
Now that we’ve got the basics down, let’s take a look at its price history as well as the correlations between Bitcoin, gold, and the dollar. Below is a four year chart of the price of Bitcoin with a 50 day (pink line) and 200 day (yellow line) moving average. It’s no surprise that price has been extremely volatile over this time period. During 2013, price increased by over 120,000% as people first started to learn of its existence. 2014 was a crash back to reality, setting up a rounding bottom pattern that formed through
TECHNICAL ANALYSIS
Bitcoin: How it Works and Correlations to Other Currencies
by Clint Cowles, CMT

The Trading Floor | TD Ameritrade Institutional 3
TECHNICAL ANALYSIS: Bitcoin: How it Works and Correlations to Other Currencies
2015. At the end of 2015, Bitcoin started a more methodical (albeit still volatile) uptrend, creating higher highs and higher lows that is still expanding today. In October of 2015, it crossed above its 200-day moving average and in November 2015 it created a “golden cross” with the 50-day moving average crossing above the 200-day moving average. Those signals are still intact today so the longer term trend is still clearly bullish. The first potential reversal signal would be the price of Bitcoin crossing below the 200-day moving average.
Is Bitcoin a replacement for gold?
Below is a two-year chart comparing Bitcoin to gold with the white line representing Bitcoin and the blue line representing gold. There’s also a 50 day correlation study below the price chart. This chart is showing us that there have been times where these two have traded together and other times where they’ve been going in opposite directions. The correlation study has gone back and forth between +.2 and -.2 telling us the same thing, sometimes they’re together and other times not. What is interesting here is the correlation never passes .2 or 20% on either side, essentially saying there is no correlation between the two. As mentioned earlier, the two main drivers of Bitcoin demand are limited supply and no central regulating body. These match perfectly with two of the main drivers of demand for gold; however, looking at the data, we can now answer the question: Is Bitcoin a replacement for a gold investment? No, it is not.
For illustrative purposes only.

The Trading Floor | TD Ameritrade Institutional 4
TECHNICAL ANALYSIS: Bitcoin: How it Works and Correlations to Other Currencies
How does Bitcoin correlate to the dollar?
The previous chart is repeated below, but the blue line and the comparison study now represent the U.S. Dollar Index. We can see a very similar relationship between Bitcoin and the dollar as between Bitcoin and gold. This makes sense since gold and the dollar are inversely correlated but it’s still interesting to look further into this relationship. The 50 day correlation study is sitting at .0296, meaning that there is only a 2.96% correlation over the last 50 days. This clearly states that there is no recognizable correlation between the price of Bitcoin and the Dollar. This does not mean that there won’t be a correlation in the future as the price of Bitcoin settles down and a more liquid market develops, but that hasn’t happened so far.
For illustrative purposes only.
For illustrative purposes only.

The Trading Floor | TD Ameritrade Institutional 5
TECHNICAL ANALYSIS: Bitcoin: How it Works and Correlations to Other Currencies
Conclusion
We still have a lot to learn about Bitcoin as it pertains to the investment community but with what we know now, it appears that Bitcoin is here to stay. We’ll get a lot more information on how that will work as the market develops and further SEC decisions are released, but until then it is important to understand that Bitcoin is in a world all by itself with no real correlation to either the dollar or gold.
Carefully consider the investment objectives, risks, charges and expenses before investing in an ETF (Exchange Traded Fund). A prospectus, obtained by calling 800-388-2200, option 1, contains this and other important information about an investment company. Read carefully before investing.
Bitcoin is a very speculative investment, involves a high degree of risk and is not suitable for all investors. Investors must have the financial ability, sophistication/experience and willingness to bear the risks of an investment, and a potential total loss of their investment.

The Trading Floor | TD Ameritrade Institutional 6
INCOME & PROTECTION STRATEGIES
Trading Earnings – What to Expect from the Unexpected
by Michael Turvey, CFP®, CMT
An earnings release is akin to the big game on Sunday with a lot of interest and eyes watching because of the uncertainty surrounding the outcome. Holding or trading a stock through its earnings announcement (report card) can be a high-risk/high-reward venture, but also presents a unique backdrop to consider using a short-term options strategy. The reason for this is just prior to the earnings release uncertainty peaks, meaning that the underlying will experience some of its most extreme levels of volatility. Incorporating options can give you a potential opportunity to exploit the spike in implied volatility (IV) that accompanies this binary event. You can see this represented by the volatility graph below, which shows Netflix (NFLX) volatility over the last 90 days. What you see is that leading up to the earnings announcement, volatility is on an upward swing. Once the number is released and uncertainty removed, volatility is crushed (a rapid deflation of extrinsic premium) and reverts back to more normal levels. This is quite common and is the result of expectations for a big stock move being priced into the options (via implied volatility) ahead of the event. Following the event, the news is priced directly into the shares, and the “uncertainty premium” drops out of the options price.
Placing a trade specifically to capture the anticipated “volatility crush”, the logic leans to selling premium just prior to the release. The main reason buying options does not work leading up to the release is because rising IV is primarily attributed to option prices staying relatively stable while number of days (time) is decreasing, not rising prices themselves.
Earnings Trade Criteria
Choosing an Expiration:
Think of IV in relation to earnings as an upward climb. IV grows and grows as earnings near, and once announced, that upward climb turns into a downward spiral. Because the idea is to capture the peak of the climb, not the bottom of the spiral, the choice of option expiration is typically the one that is nearest to that announcement, but after the date of the actual announcement.
For illustrative purposes only.

The Trading Floor | TD Ameritrade Institutional 7
INCOME & PROTECTION STRATEGIES: Trading Earnings – What to Expect from the Unexpected
Picking a Direction: Bullish, Bearish, or Neutral
Formulating a bias will help you determine at what strike price to place a trade (which helps determine a trade’s breakeven point). This can be a tricky decision, but thinkpipes gives you a lifeline by calculating what is known as the “Market Maker Move” (MMM). This proprietary analysis tool uses current at-the-money option prices to calculate an “expected move” in the stock, which is directly attributed to that binary event.
If you go to the trade tab and open up the information available below the stocks name, you will be able to view a stock’s earnings date, and if upcoming, a MMM calculation showing the expected move based on that binary event.
Choosing a Strategy:
As stated earlier, most earnings strategies revolve around selling premium. This means that any strategy (partial list below) that allows a trade to be placed for a credit will meet that criteria.
COST Trade Example: Slightly bullish on earnings, sell a 1-day covered call, current price $177, expected move $5.35
• Sell a $182.5 strike call (2.8% OTM), just outside the expected move of $182.35 ($177 + $5.35)
• Strike currently has an ~76% probability of remaining OTM.
• $0.90 in premium collected equates to a 0.5% one-day yield enhancement
For illustrative purposes only. Not a recommendation.
*= Risk-Defined Strategy
Bullish Bearish Neutral
Short Put* Short Call Iron Condor*
Short Put Spread* Short Call Spread* Short Strangle
Covered Call* Short Straddle

The Trading Floor | TD Ameritrade Institutional 8
INCOME & PROTECTION STRATEGIES: Trading Earnings – What to Expect from the Unexpected
• Effective sales price of $183.40 (strike sold + credit received)
• Objective: stock stays inside expected move, IV deflates, and call is bought back on open
• Max Profit = $6.40 (one day return of 3.6%)
• Downside risk (real) = stock below $176.10 ($0.90 better than uncovered)
• Upside risk (opportunity loss) = occurs if stock above $183.40
Big Game Recap:
• Earnings announcements are binary events that happen quarterly
• IV builds up and spikes just before an earnings announcement, then collapses afterwards
• A good way to capitalize on volatility crushing after earnings is to sell premium at the nearest expiration cycle that encompasses the announcement
• Best to trade small, using capital set aside for speculation
• Best practice is to generally look to close trade as soon as possible after the announcement
• Earnings info and the expected move (MMM) are tools built into thinkpipes platform
Spreads, Straddles, and other multiple-leg option strategies can entail substantial transaction costs, including multiple commissions, which may impact any potential
return. These are advanced option strategies and often involve greater risk, and more complex risk, than basic options trades.
For illustrative purposes only. Not a recommendation.

The Trading Floor | TD Ameritrade Institutional 9
TRADING STRATEGIES
FedEx Corp. (FDX) – A Three Trade Package
by Michael Turvey, CFP®, CMT
Strategy Covered Strangle
Expiration 42 Days
Max Loss $36,240 (If FDX were at $0 at expiration)
Max Gain $1260(If FDX is above $200 at expiration)
Break-even $187.40 at expiration (Stock purchase price of $190.25 minus $2.85 credit from strangle sale)
If you were BULLISH, you could have... Bought 100 shares, sold 1 February $200 call, and sold 1 February $175 put for a total debit of $187.40.
FDX trading $190.25 on January 6, 2017
Explanation
A covered strangle combines the covered call and short cash-secured put strategies with long stock to potentially generate a higher amount of income (or effective cost reduction) than each strategy alone. (Selling OTM calls and puts without long stock is known as a strangle.) It comes with an obligation to buy additional shares at a lower price or sell shares at a higher price The strategy’s biggest risk is a significant drop in the stock price. At expiration, if the stock stays in between the call and put strike the options would expire worthless. If the stock closes below the put strike additional shares would be purchased, or if it closed above the call strike shares would be sold.
The Trading Floor | TD Ameritrade Institutional 10
TRADING STRATEGIES: FedEx Corp. (FDX) – A Three Trade Package
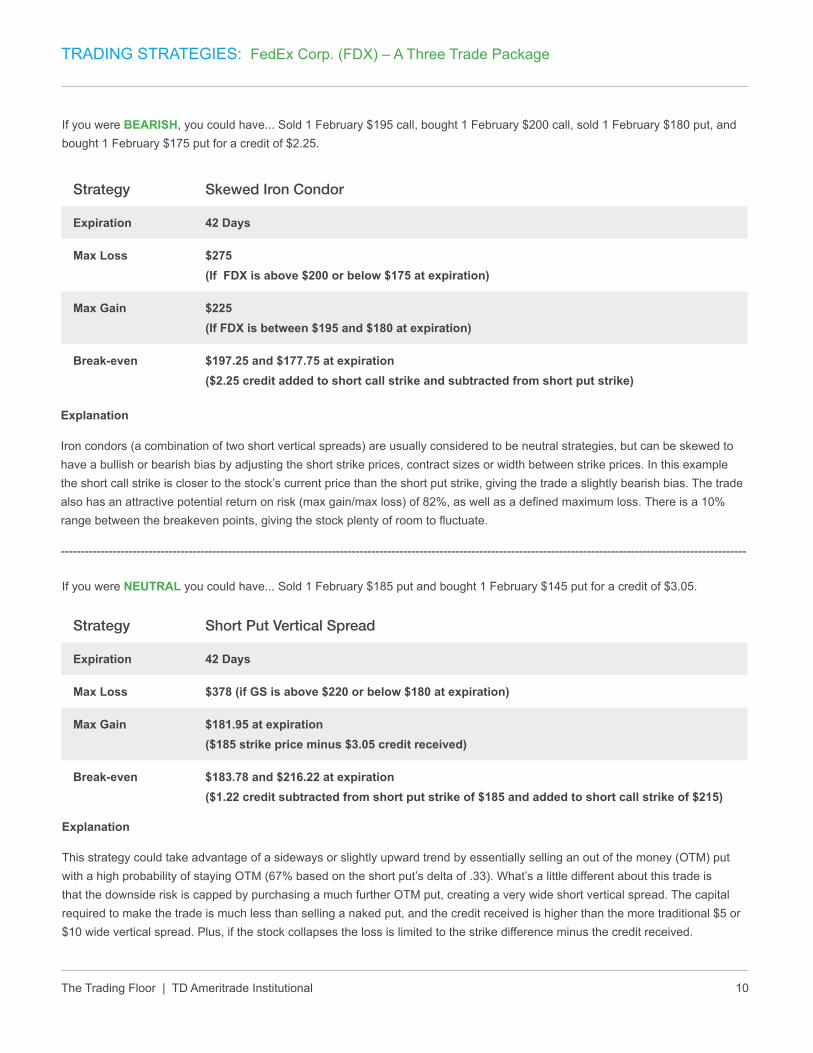
If you were BEARISH, you could have... Sold 1 February $195 call, bought 1 February $200 call, sold 1 February $180 put, and bought 1 February $175 put for a credit of $2.25.
Strategy Skewed Iron Condor
Expiration 42 Days
Max Loss $275(If FDX is above $200 or below $175 at expiration)
Max Gain $225(If FDX is between $195 and $180 at expiration)
Break-even $197.25 and $177.75 at expiration($2.25 credit added to short call strike and subtracted from short put strike)
Explanation
Iron condors (a combination of two short vertical spreads) are usually considered to be neutral strategies, but can be skewed to have a bullish or bearish bias by adjusting the short strike prices, contract sizes or width between strike prices. In this example the short call strike is closer to the stock’s current price than the short put strike, giving the trade a slightly bearish bias. The trade also has an attractive potential return on risk (max gain/max loss) of 82%, as well as a defined maximum loss. There is a 10% range between the breakeven points, giving the stock plenty of room to fluctuate.
----------------------------------------------------------------------------------------------------------------------------------------------------------------------------
Strategy Short Put Vertical Spread
Expiration 42 Days
Max Loss $378 (if GS is above $220 or below $180 at expiration)
Max Gain $181.95 at expiration($185 strike price minus $3.05 credit received)
Break-even $183.78 and $216.22 at expiration($1.22 credit subtracted from short put strike of $185 and added to short call strike of $215)
If you were NEUTRAL you could have... Sold 1 February $185 put and bought 1 February $145 put for a credit of $3.05.
Explanation
This strategy could take advantage of a sideways or slightly upward trend by essentially selling an out of the money (OTM) put with a high probability of staying OTM (67% based on the short put’s delta of .33). What’s a little different about this trade is that the downside risk is capped by purchasing a much further OTM put, creating a very wide short vertical spread. The capital required to make the trade is much less than selling a naked put, and the credit received is higher than the more traditional $5 or $10 wide vertical spread. Plus, if the stock collapses the loss is limited to the strike difference minus the credit received.

The Trading Floor | TD Ameritrade Institutional 11
TRADING STRATEGIES: FedEx Corp. (FDX) – A Three Trade Package
FDX - Here is what actually happened:
BULLISH: In this trade, the options expired OTM and worthless, while the stock experienced a modest gain. This would have resulted in an overall gain of $630 (minus transaction costs).
BEARISH: The stock ended up in between the short call and put strikes at expiration, meaning all options expired worthless. This would have resulted in the maximum gain of $225 (minus transaction costs).
NEUTRAL: At expiration, the stock closed at $193.70 and both options expired worthless. This would have resulted in the maximum gain of $305 (minus transaction costs).
Spreads, Straddles, and other multiple-leg option strategies can entail substantial transaction costs, including multiple commissions, which may impact any potential return. These are advanced option strategies and often involve greater risk, and more complex risk, than basic options trades.

The Trading Floor | TD Ameritrade Institutional 12
SPECIAL FEATURE
What to Do at Market Highs?
by Tripp Zimmerman, CFA, Associate Director of Research, WisdomTree Asset Management
With U.S. markets up over 300% since the March 2009 lows and continuing to set new all-time highs, where are investors to look for future returns1? Although US valuations are stretched compared to developed international (specifically Japan) and emerging markets, we think the pro-growth policies and potential tax cuts put forward by the newly elected government can help drive earnings growth for US companies, which in our opinion would help the market rally continue.
With investing, nothing can be certain and because valuation risks are elevated in the U.S., we think it is prudent to incorporate a risk-managed approach like an option strategy, which can help mitigate risk. Also, when investors perceive upside potential may be constrained as a result of past gains and high current valuations, options writing strategies that generate returns from selling premiums might make sense, even though your upside is capped.
The WisdomTree CBOE S&P 500 PutWrite Strategy Fund (PUTW)
The WisdomTree CBOE S&P 500 PutWrite Strategy Fund (PUTW) seeks investment results that, before fees and expenses, generally correspond to the performance of the CBOE S&P 500 PutWrite Index (PUT)2. The Fund, PUTW, invests in one- and three-month Treasury Bills and sells or “writes” S&P 500 Index put options. The Fund writes European style options and the number of put options sold are chosen to ensure full collateralization. Also, the options are written “at the money” or at the current level of the S&P 500 Index on a monthly basis.
The option premiums the Fund receives from selling puts can help mitigate the negative effects of investing in just investment vehicles that track the S&P 500 Index. Historically PUT, the index PUTW is designed to track, had similar returns to the S&P 500 Index with less risk, so blending the two could offer attractive risk-adjusted returns.
• PUT provided approximately 90% of the return of the S&P 500, but had a beta that was two-thirds that of the S&P 500 Index.
• Blending incremental amounts of PUT with the S&P 500 consistently lowered the risk while maintaining comparable levels of returns of the S&P 500.
• Blending a 30% allocation to PUT was able to generate a return that was over 98% of the S&P 500, but with 10% less risk.3

The Trading Floor | TD Ameritrade Institutional 13
SPECIAL FEATURE: What to Do at Market Highs?
Figure 1: Blending PUT Index with the S&P 500 Index
Sources: WisdomTree, Bloomberg, 6/30/07-12/31/16. 06/30/07 start date was chosen because it is the first month end date since PUT Index’s live inception date
of 6/20/07. Past performance is not indicative of future results. You cannot invest directly in an index. A fund or portfolio may differ significantly from the securities
included in the index. Index performance assumes reinvestment of dividends but does not reflect any management fees, transaction costs or other expenses that
would be incurred by a portfolio or fund, or brokerage commissions on transactions in fund shares. Such fees, expenses and commissions could reduce returns.
WisdomTree, its affiliates and their independent providers are not liable for any informational errors, incompleteness or delays or for any actions taken in reliance on
information contained herein.
What if Volatility Increases?
As mentioned above, at current valuations, we believe a wise move for investors could be incorporating potential “shock absorbers” in portfolios like PUTW, which can provide a cushion to portfolio drawdowns during periods of equity corrections.
The amount of premiums the Fund receives is tied to the implied volatility of the S&P 500 index, or how volatile investors perceive the index to be. The higher the implied volatility, the higher the premiums the Fund will receive, and conversely, the lower the implied volatility, the lower the premiums. Obviously, higher volatility and higher premiums don’t equate to higher returns, but the higher the premium the higher the potential cushion for a negative market move.
The most important relationship to watch is the one between implied and realized volatility. Historically, implied volatility was often higher than realized volatility, and if this relationship continues to hold, we believe the Fund may continue to profit by receiving more in premiums.

The Trading Floor | TD Ameritrade Institutional 14
Investors should carefully consider the investment objectives, risks, charges and expenses of the Funds before investing. To obtain a prospectus containing this and other important information, please call 866.909.WISE (9473) or visit www.wisdomtree.com to view or download a prospectus. Investors should read the prospectus carefully before investing.
There are risks associated with investing, including possible loss of principal. The Fund will invest in derivatives, including S&P 500 Index put options (“SPX Puts”).
Derivative investments can be volatile, and these investments may be less liquid than securities, and more sensitive to the effects of varied economic conditions. The
value of the SPX Puts in which the Fund invests is partly based on the volatility used by market participants to price such options (i.e., implied volatility). The options
values are partly based on the volatility used by dealers to price such options, so increases in the implied volatility of such options will cause the value of such options
to increase, which will result in a corresponding increase in the liabilities of the Fund and a decrease in the Fund’s NAV. Options may be subject to volatile swings in
price influenced by changes in the value of the underlying instrument. The potential return to the Fund is limited to the amount of option premiums it receives; however,
the Fund can potentially lose up to the entire strike price of each option it sells. Due to the investment strategy of the Fund, it may make higher capital gain distributions
than other ETFs. Please read the Fund’s prospectus for specific details regarding the Fund’s risk profile.
WisdomTree Funds are distributed by Foreside Fund Services, LLC in the US Only. Tripp Zimmerman is a registered representative of Foreside Fund Services.
Neither WisdomTree Investments, Inc., nor its affiliates, nor Foreside Fund Services, LLC, or its affiliates provide tax advice. All references to tax matters or information
provided in this material are for illustrative purposes only and should not be considered tax advice and cannot be used for the purpose of avoiding tax penalties.
Investors seeking tax advice should consult an independent tax advisor.
TD Ameritrade and WisdomTree Investments, Inc., Foreside Fund Services, LLC, are separate unaffiliated companies not responsible for each other’s services.
1 Sources: WisdomTree, Bloomberg, 3/9/09-2/28/17. US market refers to the S&P 500 Index. S&P 500 Index is a market capitalization-weighted benchmark of 500
stocks selected by the Standard and Poor’s Index Committee designed to represent the performance of the leading industries in the United States economy.
2 CBOE S&P 500 PutWrite Index (PUT): Measures the performance of a hypothetical portfolio that sells S&P 500 Index (SPX) put options against collateralized cash
reserves held in a money market account. The PUT strategy is designed to sell a sequence of one-month, at-the-money, S&P 500 Index puts and invest cash at
one- and three-month Treasury Bill Rates. The number of puts sold varies from month to month but is limited so that the amount held in Treasury Bills can finance the
maximum possible loss from final settlement of the SPX puts.
3 Sources: WisdomTree, Bloomberg, 6/30/07-12/31/16. Sources apply to all bullets.
SPECIAL FEATURE: What to Do at Market Highs?

The Trading Floor | TD Ameritrade Institutional 15
KEY INDICATORS
A Surprise Twist in the Active/Passive Debate
by Michael Turvey, CFP®, CMT
Out of the wake of the Great Recession of 2008-09, the markets were introduced to a new concept: quantitative easing, or QE for short. For the following six years, the U.S. Federal Reserve bought more than $3.7 trillion worth of bonds, and similar QE programs were implemented in Europe (some of which are still in place). This brought new meaning to the old saying “a rising tide lifts all boats”, as ultra-low interest rates were a huge boon to stock and bond investors.
Because a program of this nature and size had not been attempted previously, some unintended consequences were to be expected. The rising tide of QE led the various market sectors to become highly correlated to the overall market, which had a negative effect on hedge funds and other active managers who attempt to pick stocks and sectors they think will outperform. However, the end of QE in the U.S. along with potential policy changes from the new executive branch has recently produced a sharp drop in sector correlation to the S&P 500, to levels not seen since 2006 (and the dotcom era prior to that). This could potentially create a rare opportunity for active managers that use strategies such as individual stock selection and section rotation.
Sector rotation strategies have been in use for many years, and over the long term have generally shown outperformance versus the broad market (along with higher volatility). But like any strategy it will go through periods of underperformance. A recent white paper produced by Dorsey, Wright and Associates points out that some of the best performance of such strategies comes after periods of underperformance. The graph below highlights the recent underperformance (below zero line) of a sector rotation strategy over a rolling 5-year time horizon; the last such period had been in the late 1990s.
For Illustrative purposes only. Source: CNBC

The Trading Floor | TD Ameritrade Institutional 16
KEY INDICATORS: A Surprise Twist in the Active/Passive Debate
At a time when money continues to flow out of actively managed funds (due to cost concerns and years of underperformance, among other factors), it is interesting to see market conditions potentially shifting in favor of skilled managers. Since the election stocks and sectors seem to be moving based more on their own fundamentals, something we haven’t seen to this extent since 2009. Also consider that for the past 8 years interest rates, a significant variable in determining asset prices, have been stuck at historically low levels with little or no movement. If rates continue to rise it could contribute to more market volatility and persistent lower correlations between sectors and broad market indexes.
It’s still too early to know if these changes in correlations and their effect on active management are going to be long lasting. A few data points to watch would be fund inflows and outflows as well as how active fund managers perform versus their benchmarks. A recent report from Bank of America Merrill Lynch indicated that over 50% of large-capitalization U.S. fund managers beat their benchmark in January 2017. That’s a promising start, especially considering that in 2016 only 18% beat the S&P 500 index.
To review some key items that may be of interest to you, and that the Strategy Desk will be following in upcoming months, view the Economic Calendar *.
*Please note that by clicking the hyperlink provided, you will enter an unaffiliated third-party website to access its products and services. The third-party site is governed by its posted privacy policy and terms of use, and the third party is solely responsible for the content and offerings on its website.
For Illustrative purposes only. Source: Dorsey, Wright and Associates

The Trading Floor | TD Ameritrade Institutional 17
EDUCATION AND EVENTS
Upcoming Webcast Series and Live Events:
April 18
Options Strategies for Earnings and Special Events
Binary events such as earnings announcements or Fed meetings may produce big moves in stocks and unique opportunities in the underlying options market . This informative webcast can help you:
• Interpret changes in implied volatility leading up to and following binary events
• Calculate a stock’s expected move for a binary event
• Recognize the potential risks and rewards of placing options trades around these events
• Construct various options trades based on expected move, directional bias and probabilities
Continuing Education (CE) Credit: 1 Certified Financial Planner™ (CFP™) CE credit.
Note: CE credits are not available when accessing the webcast through the replay link. You must attend the live webcast to be eligible for the CE credits.
Register Now
Spreads, Straddles, and other multiple-leg option strategies can entail substantial transaction costs, including multiple commissions, which may impact any potential
return. These are advanced option strategies and often involve greater risk, and more complex risk, than basic options trades.
April 25
Technical Analysis: Battle of the Bands
Join us for a discussion on how indicators such as Bollinger Bands®, standard deviation bands and linear regression channels can be used to identify possible trends and market sentiment. This informative webcast can help you:
• Explain the similarities and differences between Bollinger Bands, moving average envelopes, standard deviation channels and linear regression channels
• Apply these indicators to stocks, indexes and ETFs to determine trends and key support and resistance levels
• Describe how these indicators can identify overbought and oversold conditions
Continuing Education (CE) Credit: 1 Certified Financial Planner™ (CFP™) CE credit.
Note: CE credits are not available when accessing the webcast through the replay link. You must attend the live webcast to be eligible for the CE credits.
Register Now
While this webcast discusses technical analysis, other approaches, including fundamental analysis, may assert very different views.
The Trading Floor | TD Ameritrade Institutional 18
EDUCATION AND EVENTS: Upcoming Webcast Series and Live Events
May 2
Maximizing Potential Yield with Covered Strangles
Two common options strategies for advisors are covered calls and cash-secured puts. Join us as we discuss combining the two as a means to potentially increase a portfolio’s yield, reduce effective cost at a faster rate, or buy and sell shares at pre-determined levels. This informative webcast can help you:
• Potentially lower portfolio volatility in multiple market directions
• Learn how to generate additional premium from selling multiple options
• Potentially increase monthly risk-adjusted returns
Continuing Education (CE) Credit: 1 Certified Financial Planner™ (CFP™) CE credit.
Note: CE credits are not available when accessing the webcast through the replay link. You must attend the live webcast to be eligible for the CE credits.
Register Now
Spreads, Straddles, and other multiple-leg option strategies can entail substantial transaction costs, including multiple commissions, which may impact any potential
return. These are advanced option strategies and often involve greater risk, and more complex risk, than basic options trades.
May 9
Intermarket Analysis – The Links Between Asset Classes
In this webcast we break down the relationship between the different asset classes—stocks, bonds, commodities and currencies. This informative webcast can help you:
• Recognize how to effectively track intermarket relationships
• Identify how movements in one asset class affect the others
• Interpret what current intermarket trends might be telling us
Continuing Education (CE) Credit: 1 CERTIFIED FINANCIAL PLANNERr™ (CFP™) CE credit.
Note: CE credits are not available when accessing the webcast through the replay link. You must attend the live webcast to be eligible for the CE credits.
Register Now
While this webcast discusses technical analysis, other approaches, including fundamental analysis, may assert very different views.
Probability analysis results are theoretical in nature, not guaranteed, and do not reflect any degree of certainty of an event occurring.

The Trading Floor | TD Ameritrade Institutional 19
May 16
Options Management: Exercise, Assignment and Expiration
Once an options trade has been initiated it is vital to understand what can happen as the expiration date approaches. Join us for a discussion of the potential outcomes with long and short options contracts. This informative webcast can help you:
• Explain the process of managing long contracts versus short contracts
• Recognize when assignment of short options contracts is likely to happen
• Develop guidelines for managing options trades into expiration dates
Continuing Education (CE) Credit: 1 Certified Financial Planner™ (CFP™) CE credit.
Note: CE credits are not available when accessing the webcast through the replay link. You must attend the live webcast to be eligible for the CE credits.
Register Now
May 23
Technical Analysis: Oscillating Indicators
Join us for a discussion about how utilizing oscillating indicators can help with trend identification and potentially more effective trade management. This informative webcast can help you to:
• Understand how oscillators are constructed
• Use oscillators to confirm trend strength or weakness
• Identify divergences in oscillators that show increased probability of trend reversals
Continuing Education (CE) Credit: 1 Certified Financial Planner™ (CFP™) CE credit.
Note: CE credits are not available when accessing the webcast through the replay link. You must attend the live webcast to be eligible for the CE credits.
Register Now
While this webcast discusses technical analysis, other approaches, including fundamental analysis, may assert very different views.
May 30
Index Options Strategies for Portfolios
Join us for a discussion on how index options could be used to protect or potentially enhance portfolio returns. This informative webcast can help you:
• Identify the characteristics and risks of index options and how they differ from equity and ETF options
• Evaluate potential income and protection strategies using index options
• Create an overlay strategy for a long equity portfolio using index short vertical spreads
EDUCATION AND EVENTS: Upcoming Webcast Series and Live Events

The Trading Floor | TD Ameritrade Institutional 20
Continuing Education (CE) Credit: 1 CERTIFIED FINANCIAL PLANNER™ (CFP™) CE credit.
Note: CE credits are not available when accessing the webcast through the replay link. You must attend the live webcast to be eligible for the CE credits.
Register Now
Spreads, Straddles, and other multiple-leg option strategies can entail substantial transaction costs, including multiple commissions, which may impact any potential
return. These are advanced option strategies and often involve greater risk, and more complex risk, than basic options trades.
EDUCATION AND EVENTS: Upcoming Webcast Series and Live Events

The Trading Floor | TD Ameritrade Institutional 21
Clint Cowles, CMT
With his technical analysis expertise, Clint Cowles focuses on helping advisors successfully incorporate sophisticated trading strategies and advanced allocation models into their practices. Whether facilitating webcasts, hosting workshops, or providing individual support, Clint provides the insight and expertise advisors need to improve their trading efficiency using thinkpipes—TD Ameritrade’s advanced trading platform that provides streaming market data, real-time analytics and robust charting features. Clint joined TD Ameritrade in 2011 and holds a Bachelor’s degree in Mathematics, the Chartered Market Technician (CMT) designation, and FINRA Series 3, 7, 63, 34 and 24 licenses.
Michael Turvey, CFP®, CMT
Leveraging his experiences as a former options broker and market maker, Michael Turvey focuses on helping emerging and established advisors to more efficiently manage their time—and their books. Through one-on-one support, weekly webcasts, and regional workshops, he gives advisors the insight and confidence they need to select, implement, and manage options strategies across multiple accounts. Michael joined TD Ameritrade in 2003. Additionally, he is a contributor to TD Ameritrade Institutional’s quarterly trading e-newsletter, and has written articles published on Forbes.com and in TD Ameritrade’s thinkmoney and Ticker Tape magazines. He has a Bachelor’s degree, is a Certified Financial Planner™ (CFP®) certificant and Chartered Market Technician (CMT) and holds FINRA Series 7 and 63 licenses.
MEET THE CONTRIBUTING WRITERS
Bios
Tripp Zimmerman, CFA, Associate Director of Research, WisdomTree Asset Management
Tripp Zimmerman began at WisdomTree as a Research Analyst in February 2013. Now, as an Associate Director of Research, he leads the Firm’s data analytics group, responsible for index creation, maintenance and reconstitution. Tripp travels domestically and internationally to speak about WisdomTree index capabilities and meets with clients across various sales channels. He is also involved in creating and communicating WisdomTree’s thoughts on the markets. Prior to joining WisdomTree, Tripp worked in various investment-related roles for TD Ameritrade, Wells Fargo Advisors, TIAA-CREF and Evergreen Investments. Tripp graduated from The University of North Carolina at Chapel Hill with dual degrees in Economics and Philosophy. Tripp is a holder of the Chartered Financial Analyst designation.

The Trading Floor | TD Ameritrade Institutional 22
Options are not suitable for all investors as the special risks inherent to options trading may expose investors to potentially rapid and substantial losses. Options trading subject to TD Ameritrade review and approval. Please read Characteristics and Risks of Standardized Options before investing in options. Spreads, straddles, and other multiple-leg option strategies can entail substantial transaction costs, including multiple commissions, which may impact any potential return. These are advanced option strategies and often involve greater risk, and more complex risk, than basic options trades. Investors should also consider contacting a tax advisor regarding the tax treatment applicable to multiple-leg transactions.
The short put strategy risks purchasing the corresponding stock at the strike price when the market price of the stock will likely be lower. Naked option strategies involve the highest amount of risk and are only appropriate for traders with the highest risk tolerance.
The preceding information is not a recommendation or endorsement of any particular investment or investment strategy. Returns will vary and all investments involve risk, including loss of principal.
Transaction costs (commissions, contract, exercise/assignment fees and other fees) are important factors and should be considered when evaluating any options trade.
Examples presented are provided for illustrative and educational use only and are not a recommendation or solicitation to purchase or sell any specific security or to use a specific strategy.
Supporting documentation for any claims, comparison, statistics, or other technical data in options communication will be supplied upon request.
IMPORTANT INFORMATION