the train dynamics of wheel rail contact and … figure 1: wheel and rail reference system and wheel...
TRANSCRIPT

1
Abstract This paper is focused on the vehicle dynamics caused by the forces exchanged, through buffers and draw gears, by consecutive vehicles on a curve. The results have been obtained by adding a buffers/draw gears contact model on an existing multibody code, previously developed by the authors. The multibody code manages rigid bodies connected by elastic and rigid constraints; the wheel/rail contact model is three dimensional and employs an elastic constraint among wheel and rail. The wheel/rail contact is managed by means of a numerical model called TOAM (third order approximation method). Numerical tests and experimental validations of the proposed model are here presented, considering a train made by three vehicles, running on an S shaped curve, subjected to parametric compressive forces. Keywords: train dynamics, wheel rail contact, buffers contact, longitudinal forces, derailment, train simulator. 1 Introduction Safety and efficiency of train transportation are more and more requested by the railway operators. In order to provide a reliable and flexible tool to study the dynamics of a train and to reduce the expensive experimental tests, a new numerical model have been proposed by the author [1-3].
In those previous papers, an original multibody software, capable to manage the dynamics of any number of rigid bodies (each one with six degrees of freedom -dofs-) coupled by elastic or rigid joints, has been developed. Moreover, the developed code considers a three-dimensional contact between the surfaces of wheel and rail, by considering also an elastic interaction among them.
The further development that has been introduced in this paper is the adding of a new module, which integrates the buffers contact in the multibody code; by this way, the multibody dynamics of three consecutive vehicles, subjected to
Paper 25 The Train Dynamics of Wheel Rail Contact and Longitudinal Lateral Interaction between Vehicles L. Cantone, D. Negretti and V. Vullo Department of Mechanical Engineering University of Rome “Tor Vergata”, Italy
©Civil-Comp Press, 2011 Proceedings of the Thirteenth International Conference on Civil, Structural and Environmental Engineering Computing, B.H.V. Topping and Y. Tsompanakis, (Editors), Civil-Comp Press, Stirlingshire, Scotland

2
longitudinal compressive forces (LCF), are investigated by computing the contact forces exchanged by the buffer heads of adjacent vehicles, running on a 3D track. Not only the normal contact forces but also the friction forces between the buffer heads are considered in the proposed model; the latter forces grow up due to the relative movements of wagons, during the running on a curve.
As proved by experimental pushing tests performed by Railways Operators (DB, SNCF) [4], the normal force on the buffer heads, due to LCF between consecutive vehicles, and also the friction coefficient between the buffer heads influence significantly the derailment risk. The above experimental tests refer to a series of vehicles where the first performs a braking and the last a traction, in order to impose a constant compressive longitudinal forces on the test wagon running on an S shaped curve.
In the paper, the main mathematical models are shortly described. Then a comparison between simulated and experimental data is shown. Lastly the effects of some operational parameters, such as the buffers gap and the friction coefficient between the buffer heads, on running safety, are investigated. 2 The numerical models 2.1 The TOAM wheel rail contact model In order to accurately reproduce the wheel-rail interaction forces, an on-line three-dimensional contact model has been developed [1-3]; such model will be afterwards mentioned by using the acronyms TOAM (third order approximation method). General profiles of wheel and rail can be managed by the model and they can be defined from the user by input points; a mathematical definition of the profile is performed by employing the minimum number of third order polynomial functions that fit the input points with a tolerance defined by the user. The wheel and rail profiles used in the simulations proposed in this paper are respectively ORE 1002 and UIC 60 defined in [5, 6]. These profiles are defined by 284 points for the wheel and 190 for the rail; the tolerance used to fit these points is 0.001 mm, obtaining, respectively, 9 third order polynomial functions for the rail and 16 for the wheel.
The evaluation of contact points is based on the DIFF method [7-9], which has been modified, by introducing a numerical approximation of the wheel surface, in order to improve the time efficiency of contact points detection, by a forward analytical development of the mathematical model. This approximation does not influence significantly the accuracy of the contact point detection as described in [1]; particularly, a good accuracy is obtained (with an error on the conicity angle below 5 %, respect to commercial software), if the maximum relative angles between the surfaces of wheel and rail are enclose in the common domain for railway operations (experimentally they are lower than 20 mrad for the attack angle and 33 mrad for the roll angle, as it can be inferred by [4]) .
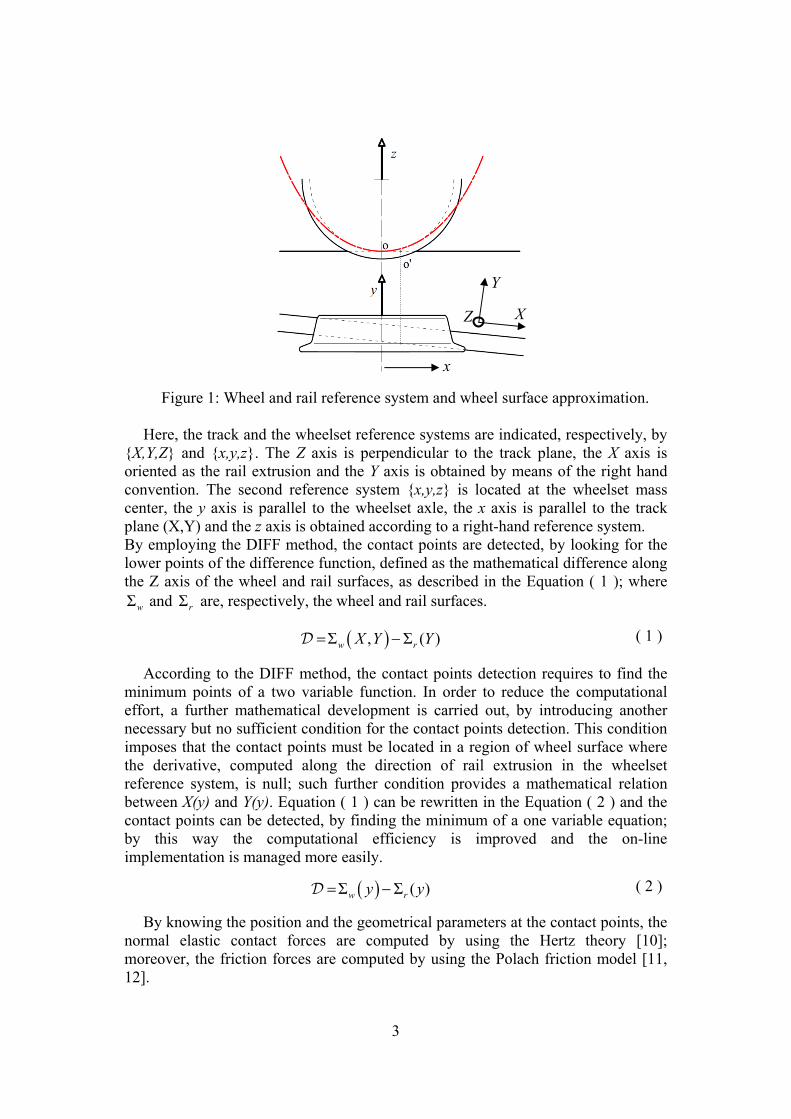
The previously mentioned approximation of the wheel surface consists in developing the wheel profile along a parabolic function that approximates the wheel circle in the lower point, as described in Figure 1.
3
Figure 1: Wheel and rail reference system and wheel surface approximation. Here, the track and the wheelset reference systems are indicated, respectively, by
{X,Y,Z} and {x,y,z}. The Z axis is perpendicular to the track plane, the X axis is oriented as the rail extrusion and the Y axis is obtained by means of the right hand convention. The second reference system {x,y,z} is located at the wheelset mass center, the y axis is parallel to the wheelset axle, the x axis is parallel to the track plane (X,Y) and the z axis is obtained according to a right-hand reference system. By employing the DIFF method, the contact points are detected, by looking for the lower points of the difference function, defined as the mathematical difference along the Z axis of the wheel and rail surfaces, as described in the Equation ( 1 ); where Σw and Σr are, respectively, the wheel and rail surfaces.
( )Σ , Σ ( )w rX Y Y= −D ( 1 )
According to the DIFF method, the contact points detection requires to find the minimum points of a two variable function. In order to reduce the computational effort, a further mathematical development is carried out, by introducing another necessary but no sufficient condition for the contact points detection. This condition imposes that the contact points must be located in a region of wheel surface where the derivative, computed along the direction of rail extrusion in the wheelset reference system, is null; such further condition provides a mathematical relation between X(y) and Y(y). Equation ( 1 ) can be rewritten in the Equation ( 2 ) and the contact points can be detected, by finding the minimum of a one variable equation; by this way the computational efficiency is improved and the on-line implementation is managed more easily.
( )Σ Σ ( )w ry y= −D ( 2 )
By knowing the position and the geometrical parameters at the contact points, the normal elastic contact forces are computed by using the Hertz theory [10]; moreover, the friction forces are computed by using the Polach friction model [11, 12].
X
Y
x
Z

2.2 In thromu
corat Tramo
dimtheconpla
geomogeaarebufand
com
spe
2 The bu
order to cough their
ultibody cod This new mrrespondingthe Univer
ansport of odel is now The geome
mensional ce buffer hensidered; buane. The forces ometry of boreover, thears defined e obtained bffers and drd in Figure 3
Figure 2: From the mpute the b The buffer
ecified in UI
uffers con
consider thbuffers, a n
de [3].
module hasg previous mrsdity of RoItaly and aadapted and
try of contaontact but aeights overut only the
exchangedbuffers, in e experimen
by the useby employiraw gear, ta3.
Buffer cha
force-displauffers and d
head geomIC Leaflet 5
ntact mod
he interactionew modul
been devemodel emploome Tor Vafterwards d implemen
act betweenas a planar r the track effect of n
d by consecterms of th
ntal load-uner are emploing the expaken by [4]
racteristic.
acement chdraw gears f
metry here c527-1, point
4
el
on forces ele has been
eloped by thoyed in TraVergata witcertified by
nted in the m
n the buffer hcontact; in
k plane benormal and
utive vehicheir positionload elastioyed. The n
perimental lAppendix
F
haracteristicforces acco
considered t 1.4.
exchanged n added to t
he AuthorsinDy [13], w
th the finany the UIC
multibody co
heads is notfact, in this
etween cond friction fo
cles are evan on the vc characternumerical rload-unload14 and 15,
Figure 3: Dr
cs defined rding to the
has a curv
by consecthe previou
, in order twhich has bncial suppo[14]. The
ode.
t still evaluas study the
nsecutive vorces parall
aluated by cvehicle and ristic of bufresults, showd elastic chaand display
raw gear cha
above, it e model repo
vature radiu
cutive vehicusly mentio
to improve been develoort of Faive
buffer con
ated as a throffset betwehicles is el to the tr
considering of head ra
ffers and dwn afterwaaracteristicsyed in Figur
aracteristic.
is possibleorted in [13
us of 1.5 m
cles oned
the oped eley
ntact
ree-ween
not rack
the adii; draw ards, s of re 2
e to 3].
, as
5
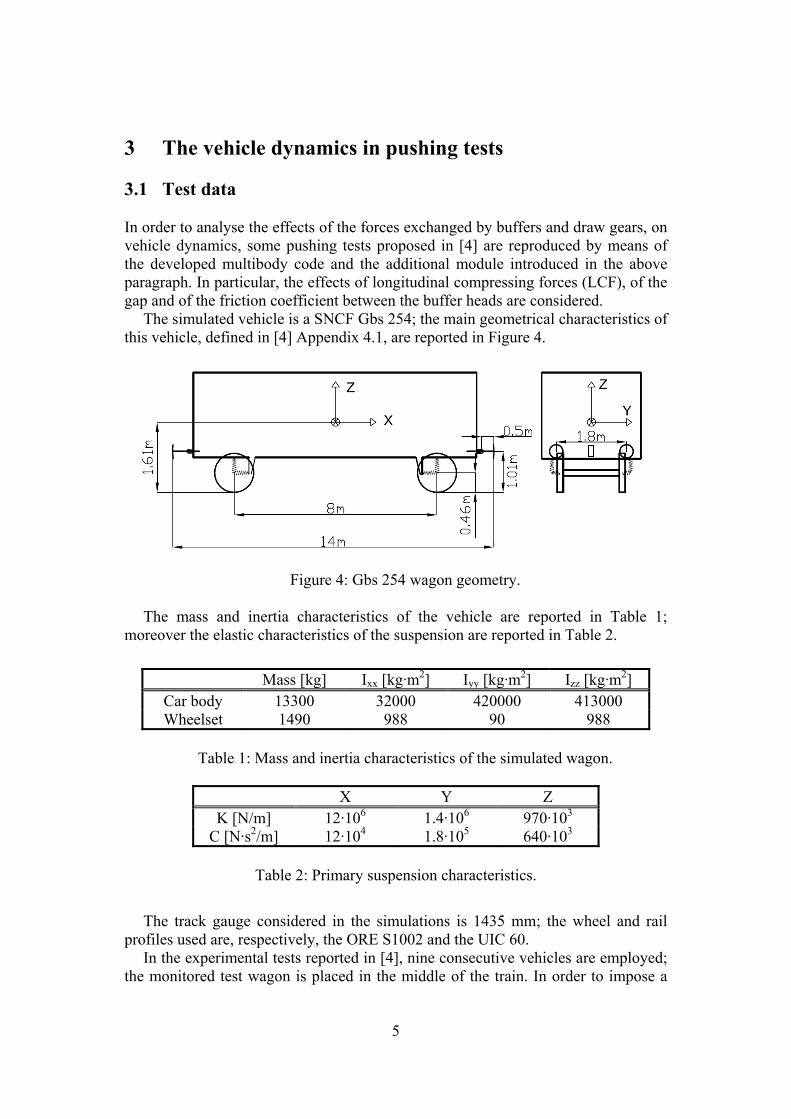
3 The vehicle dynamics in pushing tests 3.1 Test data In order to analyse the effects of the forces exchanged by buffers and draw gears, on vehicle dynamics, some pushing tests proposed in [4] are reproduced by means of the developed multibody code and the additional module introduced in the above paragraph. In particular, the effects of longitudinal compressing forces (LCF), of the gap and of the friction coefficient between the buffer heads are considered.
The simulated vehicle is a SNCF Gbs 254; the main geometrical characteristics of this vehicle, defined in [4] Appendix 4.1, are reported in Figure 4.
Figure 4: Gbs 254 wagon geometry.
The mass and inertia characteristics of the vehicle are reported in Table 1; moreover the elastic characteristics of the suspension are reported in Table 2.
Mass [kg] Ixx [kg·m2] Iyy [kg·m2] Izz [kg·m2]
Car body 13300 32000 420000 413000 Wheelset 1490 988 90 988
Table 1: Mass and inertia characteristics of the simulated wagon.
X Y Z
K [N/m] 12·106 1.4·106 970·103
C [N·s2/m] 12·104 1.8·105 640·103
Table 2: Primary suspension characteristics. The track gauge considered in the simulations is 1435 mm; the wheel and rail
profiles used are, respectively, the ORE S1002 and the UIC 60. In the experimental tests reported in [4], nine consecutive vehicles are employed;
the monitored test wagon is placed in the middle of the train. In order to impose a

6
fixed value of longitudinal forces, the first vehicle performs a braking whereas the last vehicle, a locomotive, performs a controlled traction. The vehicles adjacent to the test wagon are a Tds on the front and an Rs wagon on the rear; these wagons are loaded whereas the test wagon is unloaded, in order to reduce the wheel lifting risk of the non-tested wagons. In the experimental tests, with the train placed on a straight track, the draw gears between the tested wagon and each one of the adjacent wagons were drawn, until the buffers were put in contact.
In order to reduce the computational effort and the complexity of the problem, only three equal consecutive vehicles are simulated. The central vehicle is the test vehicle and the adjacent vehicles are loaded with 30 tons, in order to avoid the wheel lifting. The external buffers of the adjacent vehicles are loaded with longitudinal forces along the X axis of the car body (see Figure 4); by this way the compression of the train is imposed.
The track layout considered in the test is a 150 m track curve, with reverse curve and intermediate straight section, as it is specified in UIC Leaflet 527-1; this track layout is considered, according to the Railways Operators, as the most demanding from the point of view of running safety under a longitudinal compressive force.
The running speed used for the simulation is 30 km/h. Moreover, the experimental tests taken in account consider lubricated buffer heads; for this reason, a friction coefficient of 0.1 is considered in the numerical tests.
3.2 Tests results
In this paragraph, the numerical results are compared against experimental data; such data refer to a series of experimental tests carried on a family of wagons with characteristics similar to those reported above. In particular, in [4], several experimental tests are carried out considering similar two-axle vehicles in order to infer general safety rules. The differences, among the vehicles of this family, concern the stiffness of the primary suspensions, the stiffness of the axle journal, the torsional stiffness of the wagon and wheel base distance (some wagons have this parameters set to 9 m, instead the simulated wagon has a wheel base distance equal to 8 m). The other parameters, such as the wagon length (over buffers), the mass, the wheelset geometry and the buffers and draw gears elastic characteristics are the same for all the wagons of the family considered and are the same with respect to the simulated vehicle.
In order to define the operational limits, some criterions are taken into account as in [4]: the most limiting criterions for these tests are the “Distortion of journal axle” and the “Lateral displacement of the track”.
According to [4], the “Distortion of journal axle” criterion prescribes that the distortion of the axle journal measured 380 mm below the lower flange of the sole-bar must not exceed 25 mm; it corresponds to the limit of elastic deformation given in [4].
The “Lateral displacement of the track” criterion prescribes that the maximum lateral force applied to the track is function of the static axle load “P” (in kN); for reinforced track the value can be computed by the Equation ( 3 ), according to [4].
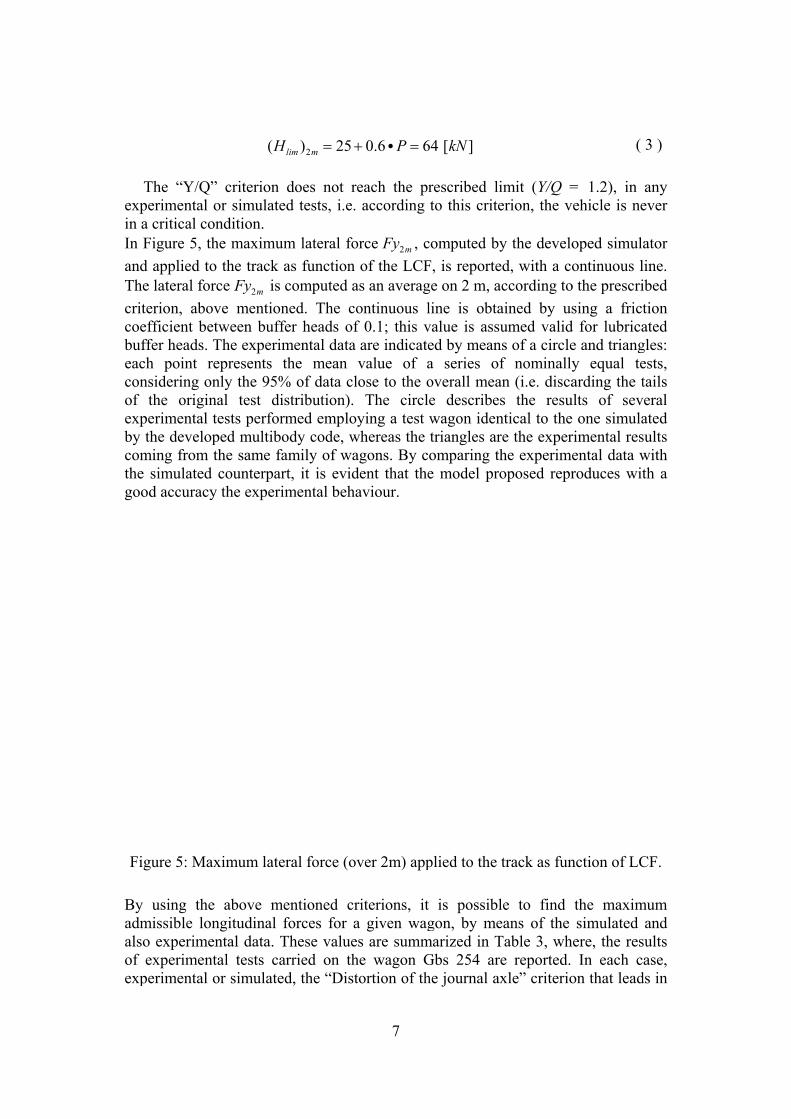
expin aIn andThecritcoebufeacconof expby comthegoo
Fi
Byadmalsoof exp
The “Y/Q”perimental oa critical coFigure 5, thd applied toe lateral forterion, abovefficient betffer heads. Tch point rensidering on
the originperimental tthe develop
ming from te simulated od accuracy
gure 5: Max using themissible lono experimeexperiment
perimental o
(H
” criterion or simulate
ondition. he maximumo the track arce 2 mFy is cve mentiontween buffeThe experimepresents tnly the 95%nal test distests performped multibothe same facounterpar
y the experim
ximum later
above mengitudinal fntal data. Ttal tests caror simulated
2) 25lim mH = +
does not red tests, i.e.
m lateral foas function computed aned. The coer heads ofmental data the mean
% of data clstribution). med employody code, wamily of wart, it is evidmental beha
ral force (ov
entioned crforces for aThese valuerried on thd, the “Dist
7
0.6 6P+ =C
each the praccording
orce 2 mFy , cof the LCF
as an averagontinuous lf 0.1; this vare indicatevalue of aose to the oThe circl
ying a test whereas the agons. By cdent that theaviour.
ver 2m) app
riterions, it a given wags are summ
he wagon Gtortion of th
64 [ ]kN
rescribed lito this crite
computed byF, is reportege on 2 m, aline is obtavalue is assued by meana series ofoverall meae describeswagon identriangles aromparing the model pro
plied to the
is possiblgon, by me
marized in TGbs 254 arehe journal ax
imit (Y/Q =erion, the v
y the develoed, with a coaccording toained by usumed valid
ns of a circlef nominally
an (i.e. discas the resuntical to there the experhe experimeoposed repr
track as fun
le to find eans of the Table 3, whe reported. xle” criterio
(
= 1.2), in vehicle is ne
oped simulaontinuous l
o the prescrising a frict
d for lubricae and triangy equal tearding the t
ults of seve one simularimental resental data wroduces wit
nction of LC
the maximsimulated
here, the resIn each c
on that lead
3 )
any ever
ator ine. ibed tion ated gles: ests, tails eral ated sults with th a
CF.
mum and
sults ase,
ds in

thisdisexpand(se
Ta
Fig
funbetpareffewashomm
s case to placement perimental ad 61 kN, loe Equation
Later
able 3: Com
gure 6: Max
Figure 6 shnction of LCtween the rameter is nfect of the gagons have bows the resum. In this fig
a limit vaof the tra
and simulatower than th
( 3 )).
Longitudin
ral force on
mparison of the “Distor
ximum valubu
hows the evoCF and of tbuffer hea
not used togap. The cobeen drawn ults when thgure it is cle
alue of 25 ack” criterited lateral fhe limiting
nal forces [k
the track F
experimentrtion of the
ue of Y/Q2m ruffer heads
olution of ththe gap betds of 0.1 evaluate thontinuous luntil the bu
he wagon arear that with
8
mm, has on. When forces on thvalue of 64
kN]
2mFy [kN]
tal and simuaxle journa
reached as fwith lubric
he Y/Q2m, ctween buffe(lubricated
he safety liine is compuffers were re drawn unh a longitud
been reacthe first
he track (Fy4 kN define
Experime
165
55
ulated safetyal” criterion
function of ated surface
computed wers, consided buffers). imits, but inputed consiput in conta
ntil the buffdinal compr
ched beforecriterion is
)2mFy are, reed by the se
ental Simu
1
6
y limits, whis reached.
the LCF anes.
with an averering a frictIn this casn order to idering 0 mact, instead fer heads haressive forc
e the “Lats reached, espectively,econd criter
ulated
170
60
en the limit
nd gap betw
rage on 2 mtion coefficse, the Y/Qinvestigate
mm of gap, the dotted
ave a gap ofe less than
eral the
, 55 rion
t of
een
m, as ient Q2m the the
line f 40 150

kNexpthisthevaltheconbufrepdrabufgapalre
Fig
TheappIt isigFyfric
N, the gap rplained by cs Figure 7,
e draw gearlues of gap. ere are tennsecutive wffers arise. Tported forceaw gear tensffers comprp disappeaready shown
gure 7: Max
e effect of plied, can bs clear that nificant inc2my force c
ction coeffic
reduces theconsidering the maxims are shownWhen ther
nsile forceswagons, impThe gap red
es are highlysion is reduression becors (see the n in Figure 6
ximum buffthe imp
gap and fribe investigat
an incremecrement of an be reducient.
Y/Q2m parthe Figure
mum forces (n, as functiore is no LCFs at draw posed by thduces such y affected buced, due toome similabehaviour
6.
fer compresposed LCF a
iction coeffted by meanent of the frthe lateral
uced by usi
9
rameter. Su7, showing(averaged oon of the exF, due to the
gears, cauhe curve, aforces, as s
by vehicle do the track ar to the app
of the cur
sion forces and gap bet
ficient betwns of the pariction coeffforce appliing a gap b
uch value og the effect oon 2 m) actxternally ime “bending”used by thand therefoshown by Fdynamic. Bcurve, hencplied LCF
rves above
and draw gtween buffe
ween buffer arameter Fyfficient betwed to the trbetween bu
of 150 kN of gap betwting on the mposed LCF” of the trainhe relative ore compresigure 7; in y increasin
ce the maxiand the ad150 kN), a
gear tractionr heads.
heads, whe2my , as show
ween buffer rack; also inuffers espec
can be furtween buffers
buffers andF, for differn on the curangle am
ssive forcesboth cases, g the LCF, mum forces
dvantage of as it has b
n in function
en no LCF wn in Figurheads bringn this case cially for h
ther s; in d on rent rve, ong s at the the
s of the
been
n of
are e 8. gs a the
high

w
thelonincdynhig
4 Thiconsimwhis m
repanabetSimextcurimphea
Figure 8: M
without LCF
The benefice same testngitudinal cocreases the Lnamics. In ghly excited Concl
is paper shnsecutive ve
mulations arhere each bomanaged thrExperiment
produced inalyses on thtween the bumulation reternally imprve. These posing a gaads consider
Maximum laF imposed, a
cial effect ot conditionompressiveLCF duringthe test ca
d due to the
lusions
hows the eehicles by mre carried oody is chararee dimensital pushing
n order to he effects ofuffer heads.esults showposed LCF
forces incap betweenrably increa
ateral force as function
b
of the gap, dn of the tee force on ag a typical bases reporteconstant LC
effects on vmeans of buout by usingacterized byionally by m tests on anverify the
f buffers op.
w that bufdue to the
crease the n the bufferase the max
10
exchanged of the gap a
buffer heads
described abest proposea curve. As braking maned here, theCF imposed
vehicle dynuffers and dg a multibo
y 6 degree omeans of then “S” curve
model properational pa
ffers compdraw gears
Y/Q2m or Fr heads. Moimum latera
with the traand frictions.
bove can bed, i.e. veha matter of
noeuvre, due train longd.
namics of tdraw gears, ody code dof freedom e contact moe, concerninoposed andarameters, a
ression fors tension, w
2mFy and oreover, thal forces ap
ack (averagn coefficient
e consideredhicle pushef fact, the pue to the tragitudinal dy
the forces on a S shapeveloped band the whodel TOAMng two axl
d to performas the gap a
rces occur when the wathey can be friction bplied to the
ed on 2 m),t between th
d valid onlyd by cons
presence of ain longitudynamics is
exchanged ped curve. Ty the Autheel rail con
M. e vehicles, m preliminand the frict
also withagons are obe reduced between bue track.
, he
y for tant gap
dinal not
by The
hors, ntact
are nary tion
hout on a
by uffer
11
References [1] D. Negretti, “A third order approximation method for three-dimensional wheel
rail contact”, Vehicle System Dynamics, 2011. (accepted) [2] L. Cantone, D. Negretti, V. Vullo “Sviluppo e validazione di un modello semi-
analitico del terz’ordine per l’analisi del contatto ruota rotaia”, SEF 2011, Roma, Italy, 18 February, 2011.
[3] L. Cantone, D. Negretti, V. Vullo “Analisi del contatto ruota rotaia mediante un’approssimazione del terzo ordine”, AIAS 2010, Maratea, Italy, 7-10 September, 2010.
[4] ORE Question B 12, Report No. 40, “Propelling tests with long two-axle wagons”, UTRECHT, April 1984.
[5] S. Iwnick, “Manchester Benchmarks for Rail Vehicle Simulation”, Vehicle System Dynamics, 30/3-4, 295 - 313, 1998.
[6] S. Iwnick, “The Manchester Benchmarks for Rail Vehicle Simulation”, Taylor & Francis, ISSN 0042-4114
[7] J. Auciello, S. Falomi, M. Malvezzi, E. Meli, and P. Toni, Determination of wheel/rail contact points in the simulation of a railway vehicle dynamics. Springer Science+Business Media B.V., 2008.
[8] S. Falomi, M. Malvezzi, E. Meli, and M. Rinchi, Multibody modeling of railway vehicles: innovative algorithms for the detection of wheel-rail contact points. 2009, 8th International Conference on Contact Mechanics and Wear of Rail/Wheel Systems (CM2009), Firenze, Italy.
[9] A. A. Shabana, K. E. Zaazaa, and H. Suguyama, Railroad Vehicle Dynamics A computational approach. CRC Press, Taylor & Francis Group, New York, 2007.
[10] S. Timoshenko and J. N. Goodier, Theory of Elasticity. McGraw-Hill Book Company, New York, 1951.
[11] O. Polach, A fast wheel-rail forces calculation computer code. Vehicle System Dynamic Supplement, 33, 1999, 728-739.
[12] O. Polach, Influence of Locomotive Tractive Effort on the Forces Between Wheel and Rail. Vehicle System Dynamic Supplement, 35, 2001, 7-22.
[13] L. Cantone, D. Negretti, “Modellazione dinamica disaccoppiata dei respingenti ferroviari”, AIAS 2009 9-11 Settembre Torino, 2009.
[14] L. Cantone, “TrainDy: the new Union Internationale des Chemins de Fer software for freight train interoperability”, Proc. IMechE, Part F: J. Rail and Rapid Transit, 2011, 225 (F1), 57-70. DOI 10.1243/09544097JRRT347.