the transcription bubble of the rna polymerase–promoter open
TRANSCRIPT

University of Groningen
The Transcription Bubble of the RNA Polymerase-Promoter Open Complex ExhibitsConformational Heterogeneity and Millisecond-Scale DynamicsRobb, Nicole C.; Cordes, Thorben; Hwang, Ling Chin; Gryte, Kristofer; Duchi, Diego; Craggs,Timothy D.; Santoso, Yusdi; Weiss, Shimon; Ebright, Richard H.; Kapanidis, Achillefs N.Published in:Journal of Molecular Biology
DOI:10.1016/j.jmb.2012.12.015
IMPORTANT NOTE: You are advised to consult the publisher's version (publisher's PDF) if you wish to cite fromit. Please check the document version below.
Document VersionPublisher's PDF, also known as Version of record
Publication date:2013
Link to publication in University of Groningen/UMCG research database
Citation for published version (APA):Robb, N. C., Cordes, T., Hwang, L. C., Gryte, K., Duchi, D., Craggs, T. D., ... Kapanidis, A. N. (2013). TheTranscription Bubble of the RNA Polymerase-Promoter Open Complex Exhibits ConformationalHeterogeneity and Millisecond-Scale Dynamics: Implications for Transcription Start-Site Selection. Journalof Molecular Biology, 425(5), 875-885. DOI: 10.1016/j.jmb.2012.12.015
CopyrightOther than for strictly personal use, it is not permitted to download or to forward/distribute the text or part of it without the consent of theauthor(s) and/or copyright holder(s), unless the work is under an open content license (like Creative Commons).
Take-down policyIf you believe that this document breaches copyright please contact us providing details, and we will remove access to the work immediatelyand investigate your claim.
Downloaded from the University of Groningen/UMCG research database (Pure): http://www.rug.nl/research/portal. For technical reasons thenumber of authors shown on this cover page is limited to 10 maximum.
Download date: 01-02-2018

The Transcription Bubble of the RNAPolymerase–Promoter Open Complex ExhibitsConformational Heterogeneity and Millisecond-ScaleDynamics: Implications for TranscriptionStart-Site Selection
Nicole C. Robb1†, Thorben Cordes1†, Ling Chin Hwang1†, Kristofer Gryte1, Diego Duchi1, Timothy D. Craggs1, Yusdi Santoso1,Shimon Weiss2, Richard H. Ebright3 and Achillefs N. Kapanidis1
1 - Biological Physics Research Group, Clarendon Laboratory, Department of Physics, University of Oxford, Parks Road,Oxford OX1 3PU, UK2 - Department of Chemistry and Biochemistry, University of California Los Angeles, Los Angeles, CA 90095, USA3 - Department of Chemistry, Howard Hughes Medical Institute and Waksman Institute, Rutgers University, Piscataway,NJ 08854, USA
Correspondence to Achillefs N. Kapanidis: [email protected]://dx.doi.org/10.1016/j.jmb.2012.12.015Edited by D. E. Draper
Abstract
Bacterial transcription is initiated after RNA polymerase (RNAP) binds to promoter DNA, melts ~14 bp aroundthe transcription start site and forms a single-stranded “transcription bubble” within a catalytically activeRNAP–DNA open complex (RPo). There is significant flexibility in the transcription start site, which causesvariable spacing between the promoter elements and the start site; this in turn causes differences in the lengthand sequence at the 5′ end of RNA transcripts and can be important for gene regulation. The start-sitevariability also implies the presence of some flexibility in the positioning of the DNA relative to the RNAP activesite in RPo. The flexibility may occur in the positioning of the transcription bubble prior to RNA synthesis andmay reflect bubble expansion (“scrunching”) or bubble contraction (“unscrunching”). Here, we assess thepresence of dynamic flexibility in RPo with single-molecule FRET (Förster resonance energy transfer). Weobtain experimental evidence for dynamic flexibility in RPo using different FRET rulers and labeling positions.An analysis of FRET distributions of RPo using burst variance analysis reveals conformational fluctuations inRPo in the millisecond timescale. Further experiments using subsets of nucleotides and DNA mutationsallowed us to reprogram the transcription start sites, in a way that can be described by repositioning of thesingle-stranded transcription bubble relative to the RNAP active site within RPo. Our study marks the firstexperimental observation of conformational dynamics in the transcription bubble of RPo and indicates thatDNA dynamics within the bubble affect the search for transcription start sites.
© 2013 Elsevier Ltd. All rights reserved.
Introduction
Transcription, the synthesis of RNA from a DNAtemplate, is the first step in gene expression and is ahighly regulated process. In Escherichia coli andother bacteria, RNA polymerase (RNAP) initiatestranscription after binding to specific sequenceswithin promoter DNA, where binding is controlled by
transcription initiation factors known as sigma (σ)factors. In typical bacterial promoters controlled bythe main sigma factor σ70, the RNAP-σ70 holoen-zyme initially binds to the −10 and −35 elements ofthe promoter (reviewed in Ref. 1), melts ~14 bp in theDNA surrounding the transcription start site to form asingle-stranded “transcription bubble” and yields thecatalytically active RNAP–DNA open complex (RPo).
0022-2836/$ - see front matter © 2013 Elsevier Ltd. All rights reserved. J. Mol. Biol. (2013) 425, 875–885

RNAP can initiate transcription from multiple posi-tions within the same promoter, in both prokaryotesand eukaryotes.2–15 In bacteria, transcription ismainly initiated by purines located within a region4–12 bp downstream of the −10 element, whichextends from position −7 to −12 relative to the +1site. Such preferences for start sites can be used forregulation of gene expression, since variation at the5′ ends of transcripts can affect transcript stability16
or control the formation of secondary structures thatin turn can affect translational initiation.17,18 Forexample, expression of the pyrC gene in E. coli isregulated by a translational control mechanismdependent on the presence or absence of a 5′hairpin loop structure whose synthesis depends onstart-site selection.3 In addition, different start sitescan affect the extent of abortive initiation or transcrip-tional slippage, both of which can influence thefrequency of initiation at a particular promoter.4,19,20
Flexibility in transcription start sites has also beenobserved in eukaryotes. An early study identifiedheterogeneity in the 5′ termini of adenovirus mRNAs,which are transcribed by cellular RNAP II.21 In yeast,RNAP II initiates transcription at multiple start siteslocated 40–120 bp downstream of the TATA box,22
presumably by actively scanning (through an ATP-driven process) for start sites downstream of the
transcription bubble, as in the case of the U4 smallnuclear RNA gene SNR14.23
The observed flexibility in transcription start sitesimplies that theremust be static or dynamic flexibility inthe positioning of the single-stranded transcriptionbubble relative to the RNAP active center in RPo(Fig. 1a). The discoveries that initial transcription byRNAP involves transcription-bubble expansion(“scrunching”)24,25 and that promoter escape byRNAP involves transcription-bubble contraction(“unscrunching”)25 provide precedents for the func-tional importance of transcription-bubble flexibility. Thediscovery of scrunching and unscrunching also sup-ported a mechanistic model4 for the role of transcrip-tion-bubble flexibility in start-site selection: namely,transcription-bubble expansion (similar to scrunching)in RPowould place further downstreamDNA in contactwith the RNAP active center, resulting in a moredownstream start site, and transcription-bubble con-traction (similar to unscrunching) in RPo would placemore upstream DNA in contact with the RNAP activecenter, resulting in a more upstream start site.In this work, we studied the mechanisms for start-
site heterogeneity by examining the E. coli lacpromoter. Specifically, we have performed single-molecule FRET (Förster resonance energy transfer)(smFRET) measurements on individual, freely
Fig. 1. Using smFRET to investigate dynamics of RNAP open complexes. (a) Schematic of the hypothesis thatdynamics of single-stranded DNA in the transcription bubble of the open complex allow RNAP to sample differenttranscriptional start sites. The positions of the RNAP active site (green oval) and the −10 element (orange downstreamregion) of the DNA are assumed to be fixed with respect to each other.36 Sampling of transcription start sites can thereforeproceed via movement of single-stranded DNA within the transcription bubble, as indicated by the two representations ofthe open complex (RPo). (b) Detecting RPo formation with smFRET. dsDNA was labeled with donor and acceptorfluorophores on either side of the transcription bubble [donor at position −15 with respect to the +1 position and acceptor atposition +15; see Supplementary Fig. 1 for the DNA sequence of lacCONS+2(A+2C) used in (b)]. smFRET spectroscopycombined with ALEX on diffusing molecules of dsDNA alone and dsDNA with RNAP (RPo) was carried out. Ratio E*represents the uncorrected FRET efficiency, and curves were fitted with Gaussian functions to determine the center andwidth of the distributions.
876 Dynamics of the Transcription Open Complex

diffusing molecules of RPo in solution24,26–28 in orderto detect transcription-bubble flexibility, to distinguishbetween static and dynamic transcription-bubbleflexibility and to relate transcription-bubble flexibilityand dynamics to start-site selection. By measuring theFRET efficiency between fluorophore pairs probingdifferent regionswithin promoter DNA, wewere able todetect the formation of the transcription bubble(Fig. 1b), as well as DNA movements associatedwith start-site selection. Our results establish that DNAwithin RPo exhibits conformational dynamics on themillisecond timescale. We further establish that theaddition of different initiating nucleotides or theintroduction of base-pair substitutions can reprogramstart-site selection by repositioning the transcription-bubble DNA relative to the RNAP active site in RPo.Our results are consistent with a mechanisticmodel4 in which flexibility in start-site selection resultsfrom transcription-bubble expansion (scrunching)24,25
and transcription-bubble contraction (unscrunching)25
in RPo.
Results
Start-site selection at lacCONS+2 andlacCONS+2 derivatives
The lacCONS+2 promoter used in this work is aderivative of the E. coli lacUV5 promoter; lac-CONS+2 differs from the lacUV5 promoter by havinga single-base-pair substitution in the −35 element (toform a consensus −35 element), a single-base-pairdeletion in the spacer region between the −35 and−10 elements (to form a consensus −10/−35 spacerregion) and a 2-bp insertion at position +9 in the initialtranscribed region.29 We examined the distribution oftranscription start sites at lacCONS+2 and at threelacCONS+2 derivatives containing substitutions inthe start-site region (Fig. 2). As anticipated fromprevious work on the start sites at the lac promoterand substituted lac promoter derivatives,2 lac-CONS+2 exhibited a major start site at position +1,and substituted lacCONS+2 derivatives exhibiteddifferent distributions of start sites (Fig. 2). Specifi-cally, lacCONS+2(T−3A) exhibited start sites at −2,+1, +2 and +3, while lacCONS+2(A+2C) exhibiteda start site at +1 and lacCONS+2(G−2T;A+1C)exhibited start sites at −1 and at +2.
Transcription-bubble flexibility in RPo: smFRETbetweenDNAsegments upstreamanddownstreamof the bubble
Having confirmed that RNAP can initiate tran-scription from multiple sites on the lacCONS+2derivatives, we used smFRET to investigate thedynamics of RPo. Experiments were conducted
using lacCONS+2(T−3A) (Fig. 2b) labeled withthe donor fluorophore Cy3B and the acceptorfluorophore ATTO647N in a variety of positions(for DNA sequences and labeling positions, seeSupplementary Fig. 1). In a first set of experiments,the FRET ruler (“downstream DNA ruler”) monitoredthe distance between DNA segments upstreamand downstream of the transcription bubble, bymonitoring FRET between an acceptor fluorophoreat position +15 and a donor fluorophore at position−15 (Fig. 3a, top panel; see Ref. 24). This FRETruler detects RPo formation through an increase inFRET due to opening of the transcription bubble(Fig. 3a). smFRET spectroscopy with ALEX (alter-nating-laser excitation)30,31 on diffusing moleculesof double-stranded DNA (dsDNA) and RPo resultedin FRET histograms for molecules containing bothdonor and acceptor fluorophores (Fig. 3a; seeMaterials and Methods for details).The FRET distribution of free dsDNA showed a
single species with low apparent FRET (mean valueof E*~0.23; Fig. 3a). As expected,24 addition ofRNAP to DNA to form RPo resulted in a bimodaldistribution that represents two species: dsDNA (dueto dissociation of nonspecific RNAP–DNA com-plexes during heparin challenge; see Materials andMethods) and RPo (Fig. 3a, third panel). The DNAdistribution was centered at E*~0.23, whereas theRPo distribution was centered at E*~0.39. TheFRET distribution of RPo was also unusually wide,both relative to dsDNA (which serves as a “static”standard; Fig. 3a, third panel) and to the expectedwidth for a static species with a known mean FRETefficiency and photon count distribution (“shot-noise-limited” width); the latter is due to the low photoncounts inherent to single-molecule fluorescencemeasurements.32 The calculated shot-noise-limitedwidth for the dsDNA peak (σ=0.038; Fig. 3a, redGaussian, first panel) was comparable with theactual width of the FRET distribution (σ=0.041); incontrast, the width for the RPo peak (σ=0.085;Fig. 3a, black Gaussian fit, third panel) substantiallyexceeded its shot-noise width (σ=0.044; Fig. 3a, redGaussian, third panel), pointing to the presence ofheterogeneity in the FRET distribution.A possible explanation for the wide distribution of
the RPo FRET peak is the presence of conforma-tional heterogeneity in RPo,
26,33,34 which may existin multiple static conformational states that do notinterconvert within the millisecond-timescale transitof single RPo complexes through the detectionvolume. Alternatively, RPo may be dynamic andinterconvert between different conformational stateswithin the millisecond timescale.26 To deconvolvestatic from dynamic heterogeneity, we analyzed theFRET data using burst variance analysis (BVA),27
which detects dynamics by examining how FRETefficiency fluctuates over time within single transitsof individual molecules. Essentially, molecules with
877Dynamics of the Transcription Open Complex

dynamic fluctuations in FRET are characterized byan increased FRET standard deviation compared tothat expected from shot noise; BVA compares theexperimentally observed standard deviations withthose expected for static limit (i.e., the expectedstandard deviation at a certain FRET value), thusproviding information on the source and timescaleof any dynamics.As expected, BVA showed that the experimental
standard deviations for free dsDNA (black trianglesin Fig. 3a, second panel) are close to the static limit(black continuous arc in Fig. 3a, second panel). Incontrast, BVA for RPo suggests dynamic behavior asthe values deviate significantly from the shot-noiseexpectation curve (Fig. 3a, bottom panel). In thissample, the free dsDNA population acts as an
internal control, remaining close to the static limit.These results are consistent with the hypothesis thatthe DNA within RPo has a dynamic component; theresults further suggest that RPo can interconvertbetween multiple conformational states within the0.1- to 5-ms timescale, wherein BVA is sensitive toFRET fluctuations.27
Transcription-bubble flexibility in RPo: smFRETbetween nontemplate and template strands ofthe bubble
In a second set of experiments, the FRET ruler(“bubble DNA ruler”) monitored the distance betweenthe nontemplate strand and template strand of thetranscription bubble, by monitoring FRET between a
Fig. 2. Start-site selection at lacCONS+2 and lacCONS+2 derivatives. (a) In vitro transcription reactions usinglacCONS+2 promoters with base-pair substitutions; RNAP, dsDNA, ATP, UTP, CTP and [α32P]GTP were incubated intranscription buffer at 37 °C for 5 min followed by heparin challenge and separation of the products on a polyacrylamidegel. Labeled RNA standards were used to determine the size of the products. (b) Sequences of the lacCONS+2 promoterand its derivatives. Boxes are drawn around the −10 and −35 elements and the +1 position is marked. The primary RNAproducts observed for each sequence are labeled in green.
878 Dynamics of the Transcription Open Complex
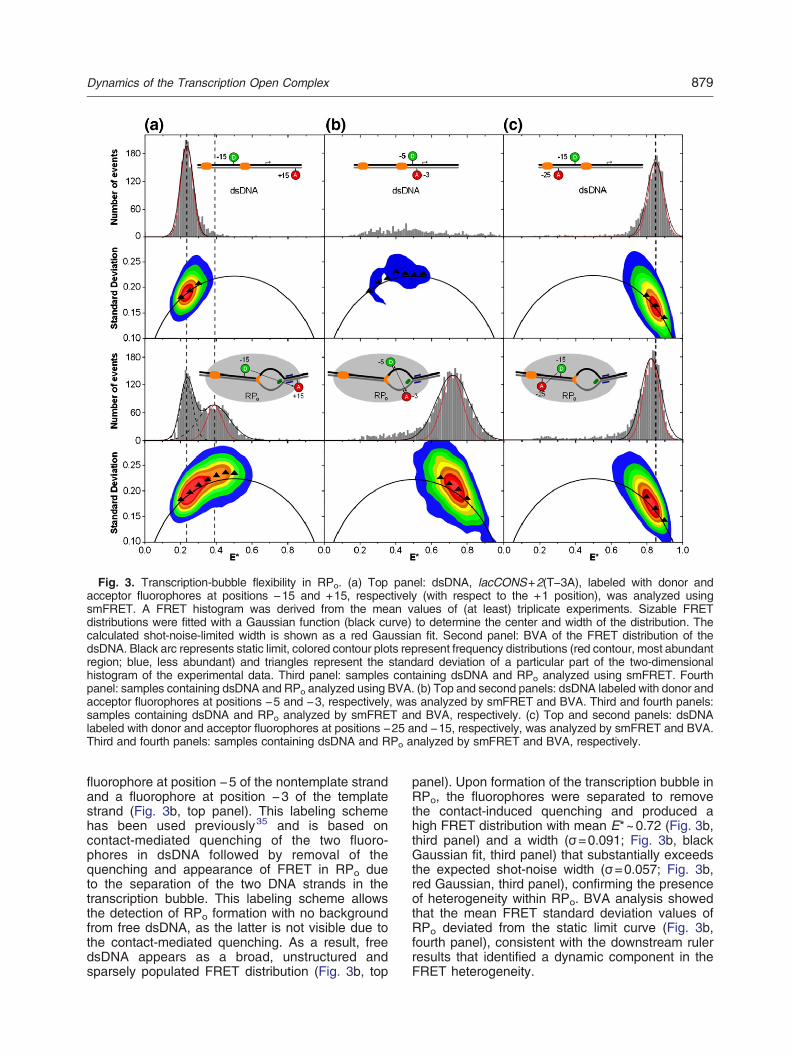
fluorophore at position −5 of the nontemplate strandand a fluorophore at position −3 of the templatestrand (Fig. 3b, top panel). This labeling schemehas been used previously35 and is based oncontact-mediated quenching of the two fluoro-phores in dsDNA followed by removal of thequenching and appearance of FRET in RPo dueto the separation of the two DNA strands in thetranscription bubble. This labeling scheme allowsthe detection of RPo formation with no backgroundfrom free dsDNA, as the latter is not visible due tothe contact-mediated quenching. As a result, freedsDNA appears as a broad, unstructured andsparsely populated FRET distribution (Fig. 3b, top
panel). Upon formation of the transcription bubble inRPo, the fluorophores were separated to removethe contact-induced quenching and produced ahigh FRET distribution with mean E*~0.72 (Fig. 3b,third panel) and a width (σ=0.091; Fig. 3b, blackGaussian fit, third panel) that substantially exceedsthe expected shot-noise width (σ=0.057; Fig. 3b,red Gaussian, third panel), confirming the presenceof heterogeneity within RPo. BVA analysis showedthat the mean FRET standard deviation values ofRPo deviated from the static limit curve (Fig. 3b,fourth panel), consistent with the downstream rulerresults that identified a dynamic component in theFRET heterogeneity.
Fig. 3. Transcription-bubble flexibility in RPo. (a) Top panel: dsDNA, lacCONS+2(T−3A), labeled with donor andacceptor fluorophores at positions −15 and +15, respectively (with respect to the +1 position), was analyzed usingsmFRET. A FRET histogram was derived from the mean values of (at least) triplicate experiments. Sizable FRETdistributions were fitted with a Gaussian function (black curve) to determine the center and width of the distribution. Thecalculated shot-noise-limited width is shown as a red Gaussian fit. Second panel: BVA of the FRET distribution of thedsDNA. Black arc represents static limit, colored contour plots represent frequency distributions (red contour, most abundantregion; blue, less abundant) and triangles represent the standard deviation of a particular part of the two-dimensionalhistogram of the experimental data. Third panel: samples containing dsDNA and RPo analyzed using smFRET. Fourthpanel: samples containing dsDNA and RPo analyzed using BVA. (b) Top and second panels: dsDNA labeled with donor andacceptor fluorophores at positions −5 and −3, respectively, was analyzed by smFRET and BVA. Third and fourth panels:samples containing dsDNA and RPo analyzed by smFRET and BVA, respectively. (c) Top and second panels: dsDNAlabeled with donor and acceptor fluorophores at positions −25 and −15, respectively, was analyzed by smFRET and BVA.Third and fourth panels: samples containing dsDNA and RPo analyzed by smFRET and BVA, respectively.
879Dynamics of the Transcription Open Complex

Transcription-bubble flexibility in RPo: smFRETbetween positions within upstream dsDNA
In a third set of control experiments, the FRET ruler(“control ruler”) monitored the distance betweenpositions within upstream dsDNA, by monitoringFRET between a fluorophore at position −15 of thenontemplate strand and a fluorophore at position −25 of the template strand. Since there are no knownor suggested dynamics associated with this region ofDNA in RPo, we reasoned that the control FRET rulerwould exhibit a static behavior in RPo.The apparent FRET distribution for free dsDNA
was centered at mean E*~0.85 (Fig. 3c, top panel),whereas RPo formation led to a small decrease in themean FRET value (E*~0.83; Fig. 3c, third panel). Toverify that the FRET histogram for RPo actuallyrepresented a substantial amount of complex for-mation (typically defined as having 40–60% of theDNA being involved in RPo formation), we usedfluorescence correlation spectroscopy to show thatthe diffusion times increased as expected forformation of RPo (Supplementary Fig. 2). The widthsof the FRET distributions of free dsDNA and of RPowere similar (σ=0.047 for dsDNA and σ=0.055 forRPo; Fig. 3c, black Gaussian fits in the first and thirdpanels), and both distributions were close to theirexpected shot-noise widths (σ=0.041 for dsDNAand σ=0.042 for RPo; Fig. 3c, red Gaussians in the
first and third panels). We note that the decrease inthe mean FRET efficiency between free dsDNA andRPo (from 0.85 to 0.83) suggests that part of thesmall increase in the FRET width (from 0.042 to0.055) arises from the inability to resolve the freeDNA and RPo distributions and, thus, is static innature. This assessment is supported by the BVAanalysis, which shows that the FRET standarddeviation values for both free dsDNA and for RPoremain close to the static limit (Fig. 3c, second andfourth panels). These results suggest that thedynamic behavior observed for RPo using thedownstream and bubble FRET rulers is specific tothe DNA within the transcription bubble.
Reprogramming start-site selection changes thedistance between DNA segments upstream anddownstream of the bubble
We subsequently examined the relationship be-tween reprogramming of start-site selection andrepositioning of transcription-bubble DNA withinRPo. To assess the ability of initiating nucleotidesto reposition transcription-bubble DNA within RPo,we used a “downstream ruler” based on thelacCONS+2(G−2T;A+1C) promoter, which initiatestranscription at positions −1 and +2 (confirmed by invitro transcription assays; Fig. 2). We used this rulerto study the effect of the addition of initiating
Fig. 4. Start-site reprogramming changes the distance between DNA segments upstream and downstream of thetranscription bubble. (a) Reprogramming by addition of initiating nucleotides. A lacCONS+2(G−2T;A+1C) promoter DNAfragment that can initiate transcription at positions −1 and +2 was mixed with RNAP to form open complexes (RPo). ThedsDNA promoter was labeled with fluorophores at positions −15 and +15 on either side of the transcription bubble. FREThistograms of RPo alone (gray histogram), RPo with GTP (blue histogram) and RPo with ATP (green histogram) were overlaid(top panel). The difference between the FRET histograms of (RPo+GTP) and (RPo+ATP) was calculated (bottom panel).Both histograms were normalized to the area of the Gaussian fit function of the RPo distribution. (b) Reprogramming by base-pair substitutions in the start-site region. A lacCONS+2(T−3A) promoter DNA fragment that initiates transcription at a range ofpositions from −2 to +3 was incubated with RNAP to form open complexes; these complexes were compared to opencomplexes formedusing a lacCONS+2promoterDNA fragment that initiates transcription from the+1position.Bothpromoterfragments were labeled with fluorophores at positions −15 and +15 on either side of the transcription bubble. FREThistograms of RPo of the lacCONS+2 promoter (top panel) and lacCONS+2(T−3A) promoter (lower panel) were compared.
880 Dynamics of the Transcription Open Complex

nucleotides that are complementary to, and there-fore that are expected to favor, different start sites.
The FRET distribution of RPo in the absence ofnucleotides was centered at E*~0.43 (Fig. 4a, toppanel, gray histogram). Similar to the RPo FRETcurve for the lacCONS+2(T−3A) promoter (Fig. 3),the RPo FRET curve for lacCONS+2(G−2T;A+1C)was significantly wider than the static DNA curve,suggesting heterogeneity in RPo. Upon addition ofthe initiating nucleotide GTP, which is complemen-tary to position −1 and that therefore is expected tofavor a start site at position −1, the FRET distributionshifts to slightly lower FRET values (Fig. 4a, toppanel, blue histogram). In contrast, upon addition ofthe initiating nucleotide ATP, which is complemen-tary to position +2 and that therefore is expected tofavor a start site at position +2, the FRET distributionshifts to slightly higher FRET values upon ATPaddition (Fig. 4a, top panel, green histogram). Thenucleotide-dependent FRET differences are smallbut reproducible; a difference histogram relating theFRET histograms for RPo+GTP and RPo+ATPshows the FRET differences more clearly (Fig. 4a,lower panel). Analysis of a structural model ofRPo
36,37 along with estimates of the positions ofthe donor and acceptor fluorophores38 (Supplemen-tary Fig. 3) suggests that the magnitude of theobserved FRET changes (from a mean E*~0.44 forRPo+ATP to 0.42 for RPo+GTP) are consistent witha small change in dye positions due to a 2-bpdifference in start-site selection (from a mean donor–acceptor distance of ~72 Å for RPo+ATP to ~76 Åfor RPo+GTP) and the corresponding changes intranslocational register of transcription-bubble DNArelative to the RNAP active site.According to our model, it may be expected that
NTP binding favors a single state of RPo, therebymaking the histograms for RPo+ATP/GTP morestatic and thus narrower. While the dsDNA peak inFig. 4a always has amean σ value of 0.03, the widthsof the RPo histograms upon nucleotide additionchange slightly (for RPo, σ=0.08; RPo+ATP, σ=0.085; RPo+GTP, σ=0.09). Therefore, althoughslight changes are observed, we do not see adecrease in the width of the FRET distributions.Thismay reflect the fact that the NTP concentration isnot fully saturating for binding to RPo; however, evenat saturating NTP concentrations, it is entirelypossible that the NTP-bound state is still dynamic,albeit biased for the NTP-based −1 or +2 transloca-tional register, and hence, the observed widths of thehistograms in our experiments may indeed representtrue heterogeneity.We also investigated the effects of reprogramming
of start-site selection by base-pair substitutions inthe start-site region. For this, we compared down-stream rulers based on lacCONS+2 (major start siteat +1; Fig. 2) and lacCONS+2(T−3A) (start sites at−2, +1, +2 and +3; Fig. 2). We found that, whereas
the FRET distribution for lacCONS+2 RPo wascentered at E*~0.45 (Fig. 4b, top panel), the FRETdistribution for lacCONS+2(T−3A) RPo was shiftedto a lower FRET efficiency (mean of E*~0.42;Fig. 4b, lower panel). We note that this change is,in fact, more significant than the mean change in E*suggests due to the asymmetry of the lacCONS+2RPo FRET peak. We interpret this shift as reflecting achange in start-site utilization between the twopromoters due to a corresponding shift in transloca-tional register of transcription-bubble DNA relative tothe RNAP active site.
Discussion
Using smFRET techniques, we have obtainedevidence for the presence of DNA conformationalheterogeneity and millisecond-timescale DNA con-formational dynamics within the single-strandedtranscription bubble of RPo. We have observedDNA conformational heterogeneity and dynamicsboth in experiments assessing the apparent “length”of the transcription bubble (distances between DNAsegments upstream and downstream of the tran-scription bubble) and in experiments assessing theapparent “width” of the transcription bubble (dis-tances between the nontemplate and templatestrands of the transcription bubble). Our experimentsassessing changes in the apparent length oftranscription bubble upon reprogramming of start-site selection also suggest that transcription-bubbleDNA conformational heterogeneity accounts forflexibility in start-site selection.Our data support a model wherein RNAP har-
nesses thermally driven DNA fluctuations to accessa distribution of transcription-bubble translocationalregisters relative to the RNAP active site, with eachdifferent translocational register corresponding to adifferent start site. In particular, our data support amodel where transcription-bubble expansion(scrunching24,25) places downstream DNA in con-tact with the RNAP active center, facilitating theusage of downstream start sites, and transcription-bubble contraction (unscrunching25) places up-stream DNA in contact with the RNAP active center,facilitating the usage of upstream start sites.Numerous factors, such as the DNA sequence, theavailability of nucleotides and possibly the presenceof transcriptional regulators, can alter the energylandscape describing the ensemble of translocationregisters and therefore select one or more transcrip-tion start sites.We have also considered whether part of the
fluctuations observedmay be a result of photophysicalchanges in the fluorophores used. We note that theproximity of a certain region of the RNAP to afluorophore may alter the optical properties of thatparticular fluorophore, therefore making comparison
881Dynamics of the Transcription Open Complex

between dyes at different positions on theDNA difficultto interpret. However, although we cannot completelyexclude the possibility that photophysics play a role inthe fluctuations, the comparisons over our entire set ofdata and the use of control samples (such as freeDNAfragments and the control ruler) indicate that the role ofphotophysics is likely to be minor.In our experiments analyzing RNAP open com-
plexes, we have assigned the first peak of thebimodal distribution to dsDNA and the second peakto RPo. It is important to note, however, that wecannot exclude the possibility that the DNA-onlypeak consists of not only unbound DNA but alsoclosed or partially closed states. Indeed, the poor fitof some of the distributions in our experiments doesindicate further complexity. Multiple intermediatestates in transcription initiation by σ70-RNAP havebeen described previously (reviewed in Ref. 39). It istherefore possible that we are detecting intermediatecomplexes in our analysis; additional experimentsusing immobilized RPo complexes should allowthese intermediate states to be studied further.Our data suggest that at least some of the DNA
dynamics occur on the timescale of milliseconds.Considering that each nucleotide addition duringtranscription elongation occurs on the ~30-mstimescale,40–43 it seems likely that partial or fullequilibration among transcription-bubble transloca-tional registers may occur before the formation of theinitiating dinucleotide in transcription initiation. Con-clusive arguments, however, must await real-timestudies of transcription-bubble DNA dynamics usingimmobilized complexes. In addition, methods usedin this study should enable the analysis of transcrip-tion-bubble conformational heterogeneity duringtranscription elongation, pausing and termination.
Materials and Methods
DNA and reagents
Amino-modified oligonucleotides (IBA, Germany) wereinternally labeled with fluorophores Cy3B (Invitrogen,USA) and ATTO647N (ATTO-TEC, Germany), as previ-ously described,35 and purified using gel electrophoresis.Single-stranded DNAs were annealed in hybridizationbuffer [50 mM Tris–HCl (pH 8.0), 1 mM ethylenediami-netetraacetic acid and 500 mM NaCl]. Sequences ofDNAs and the labeling schemes used are shown inSupplementary Fig. 1.
Formation of RNAP open complexes and initialtranscribing complexes
According to published procedures,24,35,44,45 opencomplexes (RPo) were formed by mixing dsDNA (10 nM)and E. coli RNAP holoenzyme (50 nM; Epicentre, USA) ina total volume of 20 μl KG7 buffer [40 mM Hepes–NaOH
(pH 7), 100 mM potassium glutamate, 10 mM MgCl2,1 mM DTT, 100 μg/ml bovine serum albumin, 5% glyceroland 1 mM mercaptoethylamine] and subsequent incuba-tion at 37 °C for 15 min. After incubation, heparinSepharose-coated beads (1 mg/ml; GE Healthcare) wereadded to disrupt nonspecific RNAP–DNA complexes andto remove free RNAP. After 30 s at 37 °C, samples werecentrifuged, and 13 μl of supernatant was transferred to apre-warmed tube. Wherever indicated, ribonucleotidesATP and GTP were added to the KG7 buffer at aconcentration of 1 mM after RPo formation.
In vitro transcription assays
The in vitro transcription reaction mixtures were set upby adding 0.24 U RNAP (Epicentre, USA), 10 nM dsDNApromoter, 12 U RNasin (Promega, USA), 50 μM UTP,50 μM CTP, 50 μM ATP (Fermentas, UK) and 0.3 μCi/μl[α32P]GTP [10 μCi/μl (PerkinElmer)] to 1× KG7 buffer[40 mM Hepes–NaOH (pH 7), 100 mM potassium gluta-mate, 10 mM MgCl2, 100 μg/ml bovine serum albumin,1 mM DTT, 1 mM mercaptoethylamine and 5% glycerol]and incubated for 5 min at 37 °C. Heparin Sepharose(1 mg/ml; GE Healthcare) was added, and the reactionwas allowed to continue at 37 °C for a further 55 min.Reactions were stopped by addition of 5 μl of loading dye(90% formamide, 10 mM ethylenediaminetetraacetic acid,bromophenol blue and xylene cyanol), and mixtures wereincubated for 5 min at 95 °C before being loaded on a 6-Murea, 20% polyacrylamide sequencing gel and visualizedby autoradiography.
Single-molecule fluorescence spectroscopy
A custom-built confocal microscope was used forsmFRET experiments as previously described.28,46 Thesetup was modified allowing ALEX of donor and acceptorfluorophores.30,31 For this purpose, the fiber-coupledoutputs of a green (532 nm, Samba; Cobolt, Sweden)and a red (638 nm; Cube Coherent, USA) laser werealternated with a modulation frequency of 10 kHz. Bothbeams were spatially filtered and coupled into an invertedconfocal microscope (IX71; Olympus, Germany) equippedwith an oil-immersion objective (60×, 1.35 NA, UPLSAPO60XO; Olympus, Germany). In a typical experiment, theaverage excitation intensities were 250 μW at 532 nm and60 μW at 635 nm. The same objective was used to collectthe resulting fluorescence; the emission was separatedfrom excitation light by a dichroic mirror, focused onto a200-μm pinhole and subsequently split spectrally on twoavalanche photodiodes (SPCM-AQR-14; PerkinElmer,UK) detecting the donor and acceptor fluorescence withtwo distinct spectral filters (green, 585DF70; red, 650LP).Custom-made LabVIEW software was used to register andevaluate the detector signal. For all experiments, thetemperature of the sample was set to 37±1 °C using acustom-made heated collar attached to the objective,which was connected to a heating bath.
Data analysis
Fluorescence photons were assigned to either donor-based (Dexc) or acceptor-based (Aexc) excitation with
882 Dynamics of the Transcription Open Complex

respect to their photon arrival time (donor detectionchannel, Dem; acceptor detection channel, Aem).
30,31
Two characteristic ratios, fluorophore stoichiometries Sand apparent FRET efficiencies E*, were calculated foreach fluorescent burst above a certain threshold yieldinga two-dimensional histogram. Stoichiometry S is theratio between the overall green fluorescence intensityover the total green and red fluorescence intensity anddescribes the ratio of donor-to-acceptor fluorophoreswithin a diffusing molecule.30,31 The uncorrected FRETE* efficiency [defined as DexcAem/(DexcAem+DexcDem)]monitors the proximity between the two fluorophores.We selected bursts characterized by three parameters(M, T and L) from the data. In this analysis, afluorescent signal is considered a burst if a total of Lphotons having M neighboring photons arrive at thedetector within a time interval of T microseconds.Acceptor-containing molecules were identified by apply-ing a burst search on AexcAem with parameters M=7,T=500 μs and L=12. We additionally applied per-binthresholds to remove spurious changes in fluorescenceintensity and to select for bright donor–acceptormolecules (AexcAemN30–100 photons). One-dimensionalE* distributions for donor–acceptor species wereobtained by using a 0.45bSb0.8 threshold. These E*distributions could be fitted using a Gaussian function,yielding the mean E* value for a certain distribution andan associated standard deviation σ. BVA analysis wasperformed as described previously.27
Fluorescence correlation spectroscopy
The same microscope and experimental configurationas described above was used for fluorescence correlationspectroscopy measurements. Excitation was at 532 nm incontinuous-wave fashion (150 μW). Photon-by-photonarrival times in the donor and acceptor channels werecorrelated using a hardware correlator. Data in themanuscript were derived from autocorrelation in the reddetection channel after green excitation to detect doublylabeled species.
Acknowledgements
We thank E. Fodor (Sir William Dunn School ofPathology, University of Oxford) for reagents andaccess to experimental facilities. T.C. was sup-ported by a Marie Curie Intra-European Fellowship(PIEF-GA-2009-255075) and Worcester College(University of Oxford), and A.N.K. was supportedby a European Commission Seventh FrameworkProgram grant (FP7/2007-2013 HEALTH-F4-2008-201418) and a Biotechnology and BiologicalSciences Research Council grant (BB/H01795X/1). A.N.K. and S.W. were supported by NationalInstitutes of Health grant GM069709. R.H.E. wassupported by the National Institutes of Healthgrant GM41376 and a Howard Hughes MedicalInvestigatorship.
Supplementary Data
Supplementary data to this article can be foundonline at http://dx.doi.org/10.1016/j.jmb.2012.12.015
Received 28 November 2012;Accepted 20 December 2012
Available online 28 December 2012
Keywords:RNA polymerase;
transcription initiation;start-site selection;
single-molecule FRET;DNA scrunching
† N.C.R., T.C. and L.C.H. contributed equally to this work.
Present addresses: T. Cordes, Molecular MicroscopyResearch Group and Single-Molecule Biophysics, ZernikeInstitute for Advanced Materials, University of Groningen,
Nijenborgh 4, 9747 AG Groningen, The Netherlands;L. C. Hwang, Laboratory of Molecular Biology, National
Institute of Diabetes and Digestive and Kidney Diseases,National Institutes of Health, Bethesda, MD 20892, USA.
Abbreviations used:RNAP, RNA polymerase; smFRET, single-molecule
FRET; dsDNA, double-stranded DNA;BVA, burst variance analysis.
References
1. Haugen, S. P., Ross, W. & Gourse, R. L. (2008).Advances in bacterial promoter recognition and itscontrol by factors that do not bind DNA. Nat. Rev.,Microbiol. 6, 507–519.
2. Jeong, W. & Kang, C. (1994). Start site selection atlacUV5 promoter affected by the sequence contextaround the initiation sites. Nucleic Acids Res. 22,4667–4672.
3. Liu, J. & Turnbough, C. L., Jr. (1994). Effects oftranscriptional start site sequence and position onnucleotide-sensitive selection of alternative start sitesat the pyrC promoter in Escherichia coli. J. Bacteriol.176, 2938–2945.
4. Carpousis, A. J., Stefano, J. E. & Gralla, J. D. (1982).5′ Nucleotide heterogeneity and altered initiation oftranscription at mutant lac promoters. J. Mol. Biol. 157,619–633.
5. Minkley, E. G. & Pribnow, D. (1973). Transcription ofthe early region of bacteriophage T7: selectiveinitiation with dinucleotides. J. Mol. Biol. 77, 255–277.
6. Hoffman, D. J. & Niyogi, S. K. (1973). RNA initiationwith dinucleoside monophosphates during transcrip-tion of bacteriophage T4 DNA with RNA polymerase ofEscherichia coli. Proc. Natl Acad. Sci. USA, 70,574–578.
7. Hoffman, D. J. & Niyogi, S. K. (1973). Differential effectsof sigma factor, ionic strength, and ribonucleoside
883Dynamics of the Transcription Open Complex

triphosphate concentration on the transcription of phageT4DNAwith ribonucleic acid polymerase ofEscherichiacoli. Biochim. Biophys. Acta, 299, 588–595.
8. Di Nocera, P. P., Avitabile, A. & Blasi, F. (1975). Invitro transcription of the Escherichia coli histidineoperon primed by dinucleotides. Effect of the firsthistidine biosynthetic enzyme. J. Biol. Chem. 250,8376–8381.
9. Dausse, J. P., Sentenac, A. & Fromageot, P. (1975).Interaction of RNA polymerase from Escherichia coliwith DNA. Analysis of T7 DNA early-promoter sites.Eur. J. Biochem. 57, 569–578.
10. Smagowicz, W. J. & Scheit, K. H. (1978). Primedabortive initiation of RNA synthesis by E. coli RNApolymerase on T7 DNA. Steady state kinetic studies.Nucleic Acids Res. 5, 1919–1932.
11. Grachev, M. A., Zaychikov, E. F., Ivanova, E. M.,Komarova, N. I., Kutyavin, I. V., Sidelnikova, N. P. &Frolova, I. P. (1984). Oligonucleotides complementaryto a promoter over the region −8…+2 as transcriptionprimers for E. coli RNA polymerase. Nucleic AcidsRes. 12, 8509–8524.
12. Learned, R. M. & Tjian, R. (1982). In vitro transcriptionof human ribosomal RNA genes by RNA polymeraseI. J. Mol. Appl. Genet. 1, 575–584.
13. Samuels, M., Fire, A. & Sharp, P. A. (1984).Dinucleotide priming of transcription mediated byRNA polymerase II. J. Biol. Chem. 259, 2517–2525.
14. Grove, A., Adessa, M. S., Geiduschek, E. P. &Kassavetis, G. A. (2002). Marking the start site ofRNA polymerase III transcription: the role of con-straint, compaction and continuity of the transcribedDNA strand. EMBO J. 21, 704–714.
15. Lewis, D. E. & Adhya, S. (2004). Axiom of determiningtranscription start points by RNA polymerase inEscherichia coli. Mol. Microbiol. 54, 692–701.
16. Emory, S. A., Bouvet, P. & Belasco, J. G. (1992). A 5′-terminal stem–loop structure can stabilize mRNA inEscherichia coli. Genes Dev. 6, 135–148.
17. de Smit, M. H. & van Duin, J. (1990). Secondarystructure of the ribosome binding site determinestranslational efficiency: a quantitative analysis. Proc.Natl Acad. Sci. USA, 87, 7668–7672.
18. de Smit, M. H. & van Duin, J. (1990). Control ofprokaryotic translational initiation by mRNA secondarystructure. Prog. Nucleic Acid Res. Mol. Biol. 38, 1–35.
19. Kammerer, W., Deuschle, U., Gentz, R. & Bujard, H.(1986). Functional dissection of Escherichia colipromoters: information in the transcribed region isinvolved in late steps of the overall process. EMBO J.5, 2995–3000.
20. Xiong, X. F. & Reznikoff, W. S. (1993). Transcriptionalslippage during the transcription initiation process at amutant lac promoter in vivo. J. Mol. Biol. 231,569–580.
21. Baker, C. C. & Ziff, E. B. (1981). Promoters andheterogeneous 5′ termini of the messenger RNAs ofadenovirus serotype 2. J. Mol. Biol. 149, 189–221.
22. Hampsey, M. (1998). Molecular genetics of the RNApolymerase II general transcriptional machinery.Microbiol. Mol. Biol. Rev. 62, 465–503.
23. Kuehner, J. N. & Brow, D. A. (2006). Quantitativeanalysis of in vivo initiator selection by yeast RNA
polymerase II supports a scanning model. J. Biol.Chem. 281, 14119–14128.
24. Kapanidis, A. N., Margeat, E., Ho, S. O., Kortkhonjia,E., Weiss, S. & Ebright, R. H. (2006). Initial transcrip-tion by RNA polymerase proceeds through a DNA-scrunching mechanism. Science, 314, 1144–1147.
25. Revyakin, A., Liu, C., Ebright, R. H. & Strick, T. R.(2006). Abortive initiation and productive initiation byRNA polymerase involve DNA scrunching. Science,314, 1139–1143.
26. Santoso, Y., Torella, J. P. & Kapanidis, A. N. (2010).Characterizing single-molecule FRET dynamics withprobability distribution analysis. ChemPhysChem, 11,2209–2219.
27. Torella, J. P., Holden, S. J., Santoso, Y., Hohlbein, J.& Kapanidis, A. N. (2011). Identifying moleculardynamics in single-molecule FRET experimentswith burst variance analysis. Biophys. J. 100,1568–1577.
28. Santoso, Y., Joyce, C. M., Potapova, O., Le Reste, L.,Hohlbein, J., Torella, J. P. et al. (2010). Conforma-tional transitions in DNA polymerase I revealed bysingle-molecule FRET. Proc. Natl Acad. Sci. USA,107, 715–720.
29. Mukhopadhyay, J., Kapanidis, A. N., Mekler, V.,Kortkhonjia, E., Ebright, Y. W. & Ebright, R. H.(2001). Translocation of σ70 with RNA polymeraseduring transcription: fluorescence resonance energytransfer assay for movement relative to DNA. Cell,106, 453–463.
30. Kapanidis, A. N., Laurence, T. A., Lee, N. K., Margeat,E., Kong, X. & Weiss, S. (2005). Alternating-laserexcitation of single molecules. Acc. Chem. Res. 38,523–533.
31. Kapanidis, A. N., Lee, N. K., Laurence, T. A., Doose,S., Margeat, E. & Weiss, S. (2004). Fluorescence-aided molecule sorting: analysis of structure andinteractions by alternating-laser excitation of singlemolecules. Proc. Natl Acad. Sci. USA, 101,8936–8941.
32. Nir, E., Michalet, X., Hamadani, K. M., Laurence, T. A.,Neuhauser, D., Kovchegov, Y. & Weiss, S. (2006).Shot-noise limited single-molecule FRET histograms:comparison between theory and experiments. J.Phys. Chem. B, 110, 22103–22124.
33. Kalinin, S., Sisamakis, E., Magennis, S. W., Felekyan,S. & Seidel, C. A. M. (2010). On the origin ofbroadening of single-molecule FRET efficiency distri-butions beyond shot noise limits. J. Phys. Chem. B,114, 6197–6206.
34. Holden, S. J., Uphoff, S., Hohlbein, J., Yadin, D., LeReste, L., Britton, O. J. & Kapanidis, A. N. (2010).Defining the limits of single-molecule FRET resolutionin TIRF microscopy. Biophys. J. 99, 3102–3111.
35. Cordes, T., Santoso, Y., Tomescu, A. I., Gryte, K.,Hwang, L. C., Camara, B. et al. (2010). SensingDNA opening in transcription using quenchableForster resonance energy transfer. Biochemistry,49, 9171–9180.
36. Murakami, K. S., Masuda, S., Campbell, E. A.,Muzzin, O. & Darst, S. A. (2002). Structural basis oftranscription initiation: an RNA polymerase holoen-zyme–DNA complex. Science, 296, 1285–1290.
884 Dynamics of the Transcription Open Complex

37. Zhang, Y., Feng, Y., Chatterjee, S., Tuske, S., Ho,M. X.,Arnold, E.&Ebright,R.H. (2012). Structural basisof transcription initiation. Science, 338, 1076–1080.
38. Muschielok, A., Andrecka, J., Jawhari, A., Bruckner,F., Cramer, P. & Michaelis, J. (2008). A nano-positioning system for macromolecular structuralanalysis. Nat. Methods, 5, 965–971.
39. Saecker, R. M., Record, M. T., Jr & Dehaseth, P. L.(2011). Mechanism of bacterial transcription initiation:RNA polymerase–promoter binding, isomerization toinitiation-competent open complexes, and initiation ofRNA synthesis. J. Mol. Biol. 412, 754–771.
40. Adelman, K., La Porta, A., Santangelo, T. J., Lis, J. T.,Roberts, J. W. & Wang, M. D. (2002). Single moleculeanalysis of RNA polymerase elongation revealsuniform kinetic behavior. Proc. Natl Acad. Sci. USA,99, 13538–13543.
41. Shaevitz, J. W., Abbondanzieri, E. A., Landick, R. &Block, S. M. (2003). Backtracking by single RNApolymerase molecules observed at near-base-pairresolution. Nature, 426, 684–687.
42. Yin, H., Wang, M. D., Svoboda, K., Landick, R., Block,S. M. & Gelles, J. (1995). Transcription against anapplied force. Science, 270, 1653–1657.
43. Forde, N. R., Izhaky, D., Woodcock, G. R., Wuite, G. J.& Bustamante, C. (2002). Using mechanical force toprobe the mechanism of pausing and arrest duringcontinuous elongation by Escherichia coli RNApolymerase. Proc. Natl Acad. Sci. USA, 99,11682–11687.
44. Kapanidis, A. N., Margeat, E., Laurence, T. A., Doose,S., Ho, S. O., Mukhopadhyay, J. et al. (2005).Retention of transcription initiation factor σ70 intranscription elongation: single-molecule analysis.Mol. Cell, 20, 347–356.
45. Kapanidis, A. N. & Strick, T. (2009). Biology, onemolecule at a time. Trends Biochem. Sci. 34,234–243.
46. Santoso, Y. & Kapanidis, A. N. (2009). Probingbiomolecular structures and dynamics of singlemolecules using in-gel alternating-laser excitation.Anal. Chem. 81, 9561–9570.
885Dynamics of the Transcription Open Complex