the transcriptional architecture of early human ... · 1 supplementary information the...
TRANSCRIPT

1
SUPPLEMENTARY INFORMATION The transcriptional architecture of early human hematopoiesis identifies multilevel control of lymphoid commitment Elisa Laurenti1, Sergei Doulatov1,3*, Sasan Zandi1*, Ian Plumb1, Jing Chen2, Craig April2, Jian-Bing Fan2, John E. Dick1
*these authors contributed equally to the work. 1Campbell Family Institute for Cancer Research, Ontario Cancer Institute, Princess Margaret Cancer Centre, University Health Network and Department of Molecular Genetics, University of Toronto, Toronto, Ontario. 2 Illumina, Inc., 9885 Towne Centre Drive, San Diego, CA 92121 3Current address: Division of Pediatric Hematology/Oncology, Boston Children's Hospital and Harvard Medical School, Harvard Stem Cell Institute, Boston MA, USA. Contact Information: John E. Dick, Toronto Medical Discovery Tower, Rm 8-301, 101 College Street, Toronto, Canada, M5G 1L7. Ph: 416-581-7472; FAX: 416-581-7471; Email: [email protected]
Contents: Supplementary Figures 1-6 Supplementary Tables 1-9 Supplementary Note 1
Nature Immunology doi:10.1038/ni.2615

2
Supplementary Figure 1: Unsupervised clustering methods applied to the DREGH genes. (a) Comparison of Eigenvalues of real data PCA and randomized data PCA. Only the first 2 components vary significantly from the randomized data and were thus considered for this study. (b) Unsupervised Pearson correlation coefficient based hierarchical clustering of DREGH genes.
Nature Immunology doi:10.1038/ni.2615
3
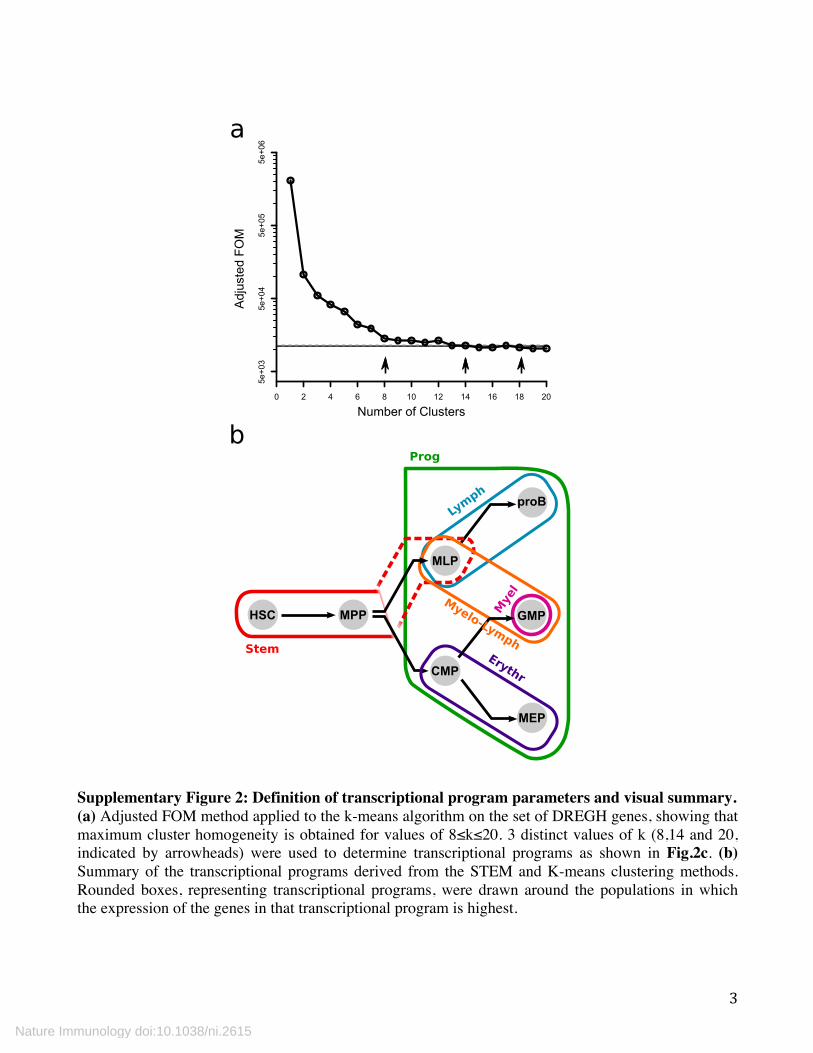
Supplementary Figure 2: Definition of transcriptional program parameters and visual summary. (a) Adjusted FOM method applied to the k-means algorithm on the set of DREGH genes, showing that maximum cluster homogeneity is obtained for values of 8≤k≤20. 3 distinct values of k (8,14 and 20, indicated by arrowheads) were used to determine transcriptional programs as shown in Fig.2c. (b) Summary of the transcriptional programs derived from the STEM and K-means clustering methods. Rounded boxes, representing transcriptional programs, were drawn around the populations in which the expression of the genes in that transcriptional program is highest.
Nature Immunology doi:10.1038/ni.2615

4
Supplementary Figure 3: Dynamic regulatory map of transcription factors controlling specification to B cells: complete DREM output. Top: gene-expression paths identified by the DREM algorithm. y axis: log transformed expression relative to HSC; x axis: cellular stages during B cell specification. The lines represent the average expression of a group of genes and the size of the circles its standard deviation. Each segment (group of genes which expression behaves similarly along that transition) is labeled with an identifier. Bottom: the transcription factor families which DNA-binding motifs are enriched in the promoters of the genes present in that segment, and are therefore predicted to control their expression.
Nature Immunology doi:10.1038/ni.2615
5
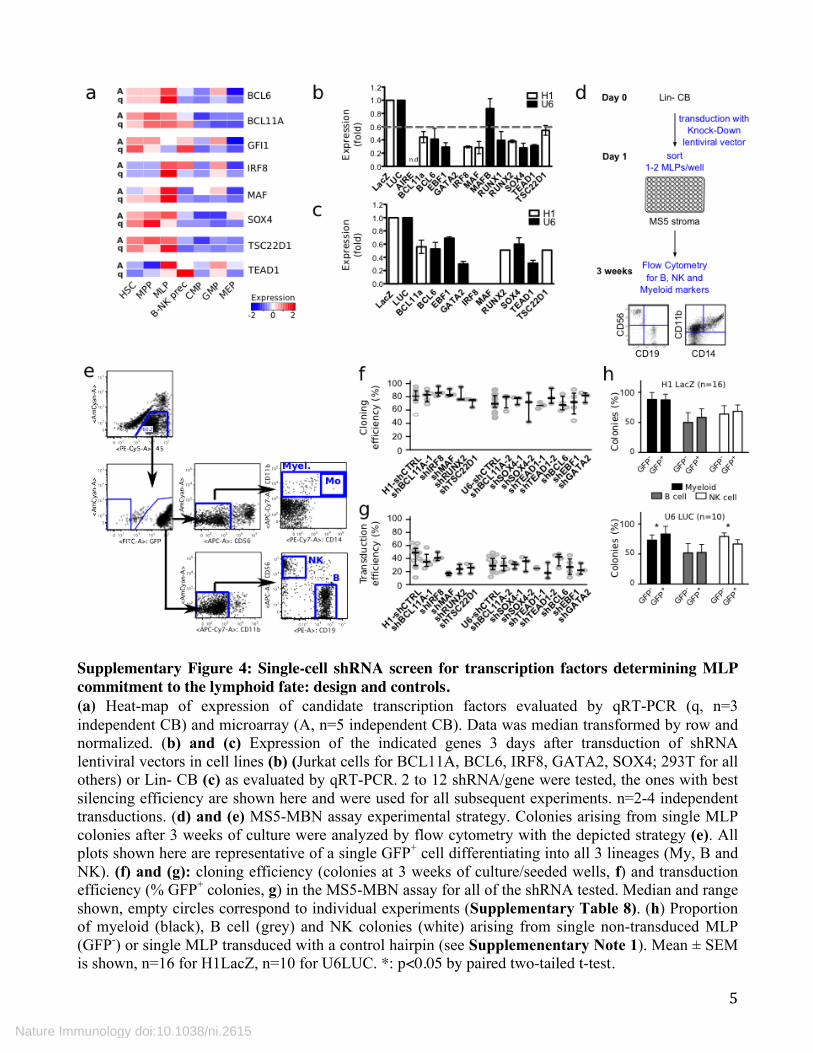
Supplementary Figure 4: Single-cell shRNA screen for transcription factors determining MLP commitment to the lymphoid fate: design and controls. (a) Heat-map of expression of candidate transcription factors evaluated by qRT-PCR (q, n=3 independent CB) and microarray (A, n=5 independent CB). Data was median transformed by row and normalized. (b) and (c) Expression of the indicated genes 3 days after transduction of shRNA lentiviral vectors in cell lines (b) (Jurkat cells for BCL11A, BCL6, IRF8, GATA2, SOX4; 293T for all others) or Lin- CB (c) as evaluated by qRT-PCR. 2 to 12 shRNA/gene were tested, the ones with best silencing efficiency are shown here and were used for all subsequent experiments. n=2-4 independent transductions. (d) and (e) MS5-MBN assay experimental strategy. Colonies arising from single MLP colonies after 3 weeks of culture were analyzed by flow cytometry with the depicted strategy (e). All plots shown here are representative of a single GFP+ cell differentiating into all 3 lineages (My, B and NK). (f) and (g): cloning efficiency (colonies at 3 weeks of culture/seeded wells, f) and transduction efficiency (% GFP+ colonies, g) in the MS5-MBN assay for all of the shRNA tested. Median and range shown, empty circles correspond to individual experiments (Supplementary Table 8). (h) Proportion of myeloid (black), B cell (grey) and NK colonies (white) arising from single non-transduced MLP (GFP-) or single MLP transduced with a control hairpin (see Supplemenentary Note 1). Mean ± SEM is shown, n=16 for H1LacZ, n=10 for U6LUC. *: p<0.05 by paired two-tailed t-test.
Nature Immunology doi:10.1038/ni.2615

6
Supplementary Figure 5: Effects of BCL6, BCL11A, SOX4 and TEAD1 KD on B cell progenitors in vivo: methodology and progenitor proportions. (a) Amount of mRNA transcripts in vivo after silencing of the indicated genes. B cell progenitors (early B, proB and/or preB) were purified by flow cytometry from the injected femur of mice transplanted with control or test shRNA transduced Lin- cells. RNA and cDNA were extracted and the levels of expression of the targeted genes were measured by qRT-PCR. Mean ± SEM is shown, n=9 for H1shBCL11A, n=12 for U6shBCL6, n=12 for U6shSOX4 and n=9 for shTEAD1. (b) Percentage of total B cells (CD19+) among human cells (CD45+ GFP+) in the non-injected bones. Circles represent individual animals; shLacZ, n=21; shBCL11A, n=19 (p = 0.0007); shLUC, n=23; shBCL6, n=5; shSOX4, n=12 (p = 0.006); shTEAD1, n=14 (p = 0.0082). (c) Percentage of total myeloid cells (CD33+) among human cells (CD45+ GFP+) in the injected bone. Circles represent individual animals; shLacZ, n=21; shBCL11A, n=19 (p < 0.0001 in (c), p = 0.0005 in (d)); shLUC, n=23; shBCL6, n=5; shSOX4, n=12 (p < 0.0001 in (c), p = 0.0005 in (d)); shTEAD1, n=14 (p = 0.0011 in (c), p = 0.0057 in (d)). Raw data pertaining to this figure is available in Supplementary Table 9. (d) Flow cytometry gating strategy for purification of B cell differentiation intermediates from xenografts. Human cells are selected based on the expression of GFP. The plots shown here are representative of the control situation. f) Quantification of each intermediate of B cell differentiation upon shRNA-silencing of BCL11A, BCL6, SOX4 and TEAD1 in the injected femur of transplanted mice. The percentage of each population among human cells (%GFP+) was renormalized to that observed in mice injected with control hairpins (black solid line). (e) Representative flow cytometry plots of the early B (right, gated on GFP+ CD33- CD19- CD34+ CD38+ CD45RA+ CD10+) and proB (left, gated on GFP+ CD33- CD19+ CD34+ CD10+) populations in shLUC (control, top) and shTEAD1 (bottom).
Nature Immunology doi:10.1038/ni.2615

7
Supplementary Figure 6: Model: Multiple transcription factors independently regulate entry into lymphoid specification from MLP. (a) Percentage of proB cells (left panel) and preB cells (right panel) in G0 (Ki67- Hoechst-), G1 (Ki67+ Hoechst-), and S-G2-M (Ki67+ Hoechst+) phases of the cell cycle as assessed by flow cytometry. (b) Percentage of AnnexinV+ proB cells (left panel) and preB cells (right panel). Mean ± SEM is shown, n=4 for shLacZ, n=11 for shLUC, n=3 for H1shBCL11A, n=6 for U6shSOX4 and n=4 for shTEAD1. *: p<0.1; **:p<0.05 by unpaired two tailed t-tests. (c) Mapping of transcription factor activity over the cellular hierarchical tree of lymphoid commitment. Transcription factors functionally validated in vitro and in vivo are respectively depicted in grey and in blue. Arrows symbolize activation and bars inhibition of the indicated cellular transitions. All transcription factors identified activate progression from MLP to B-NK precursors indicating that this transition is a restriction point for entry into B cell specification. Together with the finding that BCL11A, SOX4 and TEAD1 modulate the E2A-EBF1-PAX5 axis, these data reveal another level of transcription factor regulation of B cell specification above the classical master regulator cascade.
Nature Immunology doi:10.1038/ni.2615

8
SUPPLEMENTARY TABLES Population name
Cell surface phenotype Source
HSC1 Lin- CD34+ CD38- CD45RA- CD90+ CD49f+ Cord Blood HSC2 Lin- CD34+ CD38- CD45RA- CD90- CD49f+ Cord Blood MPP Lin- CD34+ CD38- CD45RA- CD90- CD49f- Cord Blood MLP Lin- CD34+ CD38- CD45RA+ CD10+ Cord Blood CMP Lin- CD34+ CD38+ CD10- CD7- CD45RA- CD135+ Cord Blood GMP Lin- CD34+ CD38+ CD10- CD7- CD45RA+ CD135+ Cord Blood MEP Lin- CD34+ CD38+ CD10- CD7- CD45RA- CD135- Cord Blood B-NK precursors CD34+ CD38+ CD10+ CD7- CD19- Cord Blood proB CD34+ CD10+ CD19+ Cord Blood ETP CD34+ CD1a- Neonatal thymus Supplementary Table 1: Cell surface markers of the populations subjected to gene expression profiling. Lin-: CD2-, CD3-, CD14-, CD16-, CD19-, CD24-, CD56-, CD66b- and Glycophorin A-.
Nature Immunology doi:10.1038/ni.2615

9
Group Name Contrast #
Population specific gene sets
10pop_HSC HSC1 - (MLP+CMP+GMP+MEP+B/NKprec+proB+ETP)/7 1
10pop_MLP MLP - (HSC1+CMP+GMP+MEP+B/NKprec+proB+ETP)/7 2
10pop_CMP CMP - (HSC1+MLP+GMP+MEP+B/NKprec+proB+ETP)/7 3
10pop_GMP GMP - (HSC1+MLP+CMP+MEP+B/NKprec+proB+ETP)/7 4
10pop_MEP MEP - (HSC1+MLP+CMP+GMP+B/NKprec+proB+ETP)/7 5
10pop_earlyB B/NKprec - (HSC1+MLP+CMP+GMP+MEP+proB+ETP)/7 6
10pop_proB proB - (HSC1+MLP+CMP+GMP+MEP+B/NKprec+ETP)/7 7
Transcriptional programs gene
sets
Sign_HSC_MLP
(HSC1+ MLP)/2 - (CMP +GMP +MEP)/3 8
Sign_MLP_GMP (MLP + GMP)/2 - (HSC1 + CMP +MEP)/3 9
Sign_HSC_MLP_GMP
(HSC1+ MLP +GMP)/3 - (CMP +MEP)/2 10
Sign_CMP_MEP (CMP + MEP)/2 - (HSC1 + MLP +GMP)/3 11
Precursor-product transition
gene sets
HSC1toHSC2 HSC2 - HSC1 12 HSC1toMPP MPP - HSC1 13 HSC1toMLP MLP - HSC1 14 HSC1toCMP CMP - HSC1 15 MPPtoMLP MLP - MPP 16 MPPtoCMP CMP - MPP 17
MLPtoBNKprec B/NKprec - MLP 18 MLPtoproB proB - MLP 19 MLPtoETP ETP - MLP 20
BNKprectoproB proB - B/NKprec 21 CMPtoGMP GMP - CMP 22 CMPtoMEP MEP - CMP 23 MLPtoGMP GMP - MLP 24
Supplementary Table 2: Summary of differential expression lists used in this study. Three sets of differential gene expression lists were generated using the Bioconductor limma package with the contrasts as indicated. Population-specific gene sets describe genes that are differentially expressed (FDR<0.05) between any single population and all others profiled. Transcriptional programs gene sets contain genes that are differentially expressed (FDR<0.05) in one of the transcriptional programs defined in Fig.1F. Precursor-product transition gene sets output genes that are significantly changed (FDR<0.05) during the transition from one cell type to its downstream progeny.
Nature Immunology doi:10.1038/ni.2615

10
Supplementary Table 3: Differential expression distances between human hematopoietic stem and progenitor cells. Differential expression distances were calculated by counting the number of differentially expressed genes in the precursor-product transition gene sets, using as cut-offs: adj.P.Val <0.05 and fold-change >2. UP: upregulated. Supplementary Table 4: Gene expression profiles determined with the STEM algorithm and K-means. In the STEM table are listed the profiles generated by the algorithm (0 to 49) ranked by significance (p.val), HSC expression is normalized to 0 and expression in the other populations is as indicated. The “profile” and “cluster” columns represent our classification into a transcriptional program. The K-means algorithm was run with k=14 clusters, the expression values for each probe assigned to a cluster are shown.
Transition Total UP in precursors UP in products
HSC1toMPP 29 29 0 MPPtoMLP 999 262 737 MPPtoCMP 7991 2968 5023 MLPtoBNKprec 2454 1320 1134 MLPtoproB 2560 965 1595 MLPtoETP 4622 2079 2543 BNKprectoproB 1247 548 699 CMPtoGMP 411 336 75 CMPtoMEP 45 15 30
Nature Immunology doi:10.1038/ni.2615
11
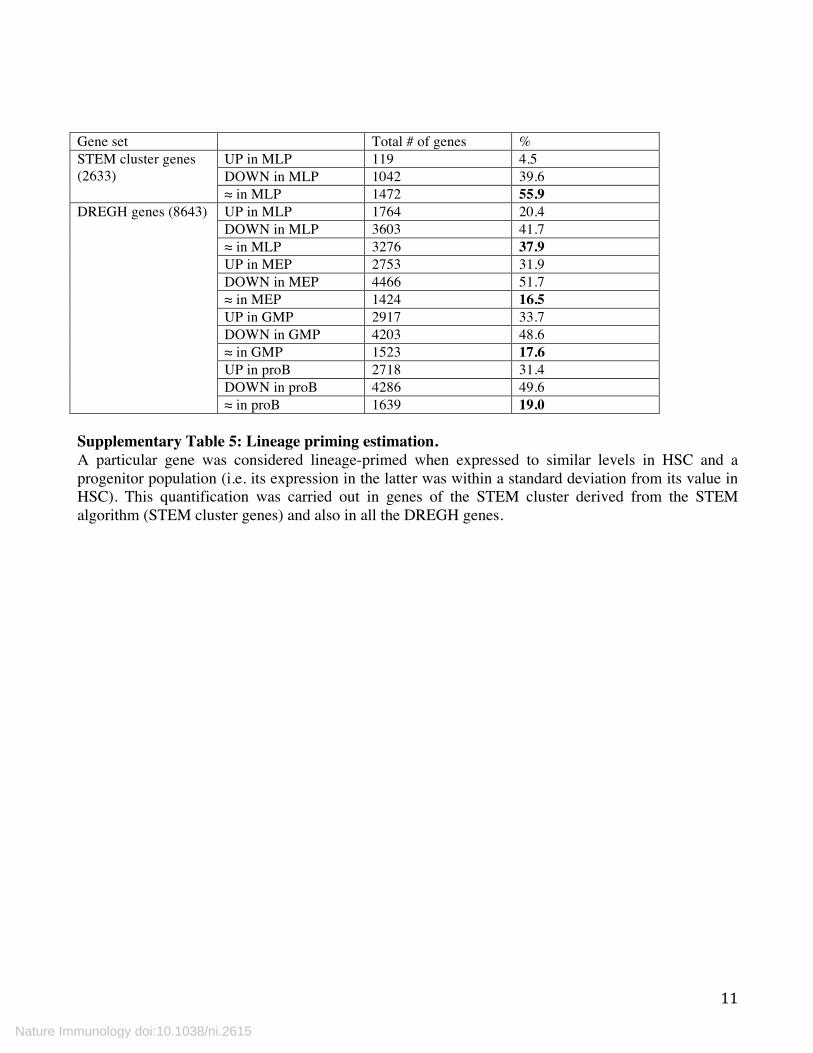
Gene set Total # of genes % STEM cluster genes (2633)
UP in MLP 119 4.5 DOWN in MLP 1042 39.6 ≈ in MLP 1472 55.9
DREGH genes (8643) UP in MLP 1764 20.4 DOWN in MLP 3603 41.7 ≈ in MLP 3276 37.9 UP in MEP 2753 31.9 DOWN in MEP 4466 51.7 ≈ in MEP 1424 16.5 UP in GMP 2917 33.7 DOWN in GMP 4203 48.6 ≈ in GMP 1523 17.6 UP in proB 2718 31.4 DOWN in proB 4286 49.6 ≈ in proB 1639 19.0
Supplementary Table 5: Lineage priming estimation. A particular gene was considered lineage-primed when expressed to similar levels in HSC and a progenitor population (i.e. its expression in the latter was within a standard deviation from its value in HSC). This quantification was carried out in genes of the STEM cluster derived from the STEM algorithm (STEM cluster genes) and also in all the DREGH genes.
Nature Immunology doi:10.1038/ni.2615

12
Supplementary Table 6: Transcription factors differentially expressed throughout the hierarchy. Transcription factors were extracted from the DREGH list (one-way ANOVA on all 10 profiled populations, FDR<0.01, fold-change >2). Supplementary Table 7: Gene-lists used for transcription factor binding motif enrichment. These gene lists correspond to the most differentially upregulated genes in each of the population specific gene sets. Adj.P.Value <0.05 and fold-change (FC) as indicated. Supplementary Table 8: Data for MS5-MBN assay. Supplementary Table 9: Human chimerism and proportions of B and myeloid cells in all mice analyzed.
Nature Immunology doi:10.1038/ni.2615

13
Supplementary Note 1: Validation of the capacity of the MS5-MBN assay to identify lineage commitment biases. To assess the effects of a given transcription factorr on lymphoid and myeloid fate choices in MLP, we wished to develop an assay that could not only quantify the probability of lineage outcomes governed by a given TF, but also identifies whether it acts before commitment to a lymphoid cell fate (affecting both B and NK colonies), or in a lineage-specific fashion (affecting either B or NK colonies). We thus adapted a protocol described in Doulatov et al.1 to allow for lentiviral transduction of MLP. Lineage depleted CB cells were transduced with lentiviral vectors overnight and single MLP were sorted into plates seeded with murine stromal MS-5 cells 28 in the presence of appropriate cytokines. After 3 weeks, the number of transduced (GFP+) myeloid, B and NK cell colonies was monitored by detection of lineage-specific cell surface markers (Supplementary Figure 4d-e). The median cloning efficiency for this assay was 76% ± 12 (Supplementary Figure 4f), while the mean transduction efficiency was 32% ± 12 (Supplementary Figure 4g). To validate the capacity of the MS5-MBN assay to identify accurately biases in lineage commitment we performed two proof-of-principle experiments. First, to exclude the possibility that lentiviral transduction inhibits certain lineage decisions, we compared the differentiated output of GFP+ cells transduced with control lentiviral vectors (H1-LacZ and U6-LUC) to that of untransduced cells (GFP-). All differentiated cell types were efficiently produced by transduced cells with no major skewing; the expression of a mock hairpin from the U6 promoter slightly reduced NK cells in favor of myeloid (Supplementary Figure 4h). Second, we used shRNA against EBF1 as a positive control B cell-specific TF, whereas shRNA against GATA2, a gene not expressed in MLP, served as a negative control. As expected, silencing of EBF1 significantly reduced the number of B cell colonies formed in our assay (p=0.049, 4 independent CB), without affecting myeloid or NK output. By contrast, silencing of GATA2 did not affect any of the developmental outcomes of MLP (Fig.4a). The MS5-MBN assay thus faithfully identifies the lineage decisions governed by a given transcription factor.
Nature Immunology doi:10.1038/ni.2615