the transition of dynamic rupture styles in elastic media...
TRANSCRIPT

JOURNAL OF GEOPHYSICAL RESEARCH, VOL. ???, XXXX, DOI:10.1029/,
The Transition of Dynamic Rupture Styles in Elastic
Media Under Velocity-Weakening Friction
A.-A. Gabriel1, J.-P. Ampuero
2, L. A. Dalguer
1, and P. M. Mai
3
A.-A. Gabriel, Swiss Seismological Service, Swiss Federal Institute of Technology Zurich, NO
F69.3, Sonneggstrasse 5, CH-8092 Zurich, Switzerland. ([email protected])
J.-P. Ampuero, Seismological Laboratory, California Institute of Technology, 1200 E. California
Blvd., MC 252-21, Pasadena, CA 91125, USA.
L. A. Dalguer, Swiss Seismological Service, Swiss Federal Institute of Technology Zurich, NO
F 69.5, Sonneggstrasse 5, CH-8092 Zurich, Switzerland.
P. M. Mai, Institute of Earth Science and Engineering, King Abdullah University of Science
and Technology, Thuwal 23955-6900, Kingdom of Saudi Arabia.
1Swiss Seismological Service, Swiss
Federal Institute of Technology Zurich,
Zurich, Switzerland.
2Seismological Laboratory, California
Institute of Technology, Pasadena,
California, USA.
3King Abdullah University of Science and
Technology, Thuwal, Saudi Arabia.
D R A F T August 7, 2012, 7:54pm D R A F T

X - 2 GABRIEL ET AL.: DYNAMIC RUPTURE STYLES
Abstract. Although kinematic earthquake source inversions show dom-
inantly pulse-like subshear rupture behavior, seismological observations, lab-
oratory experiments and theoretical models indicate that earthquakes can
operate with different rupture styles: either as pulses or cracks, that prop-
agate at subshear or supershear speeds. The determination of rupture style
and speed has important implications for ground motions and may inform
about the state of stress and strength of active fault zones. We conduct 2D
in-plane dynamic rupture simulations with a spectral element method to in-
vestigate the diversity of rupture styles on faults governed by velocity-and-
state-dependent friction with dramatic velocity-weakening at high slip rate.
Our rupture models are governed by uniform initial stresses, and are arti-
ficially initiated. We identify the conditions that lead to different rupture styles
by investigating the transitions between decaying, steady-state and growing
pulses, cracks, sub-shear and super-shear ruptures as a function of background
stress, nucleation size and characteristic velocity at the onset of severe weak-
ening. Our models show that small changes of background stress or nucle-
ation size may lead to dramatic changes of rupture style. We characterize
the asymptotic properties of steady state and self-similar pulses as a func-
tion of background stress. We show that an earthquake may not be restricted
to a single rupture style, but that complex rupture patterns may emerge that
consist of multiple rupture fronts, possibly involving different styles and back-
propagating fronts. We also demonstrate the possibility of a super-shear tran-
D R A F T August 7, 2012, 7:54pm D R A F T

GABRIEL ET AL.: DYNAMIC RUPTURE STYLES X - 3
sition for pulse-like ruptures. Eventually, we draw connections between our
findings and recent seismological observations.
D R A F T August 7, 2012, 7:54pm D R A F T

X - 4 GABRIEL ET AL.: DYNAMIC RUPTURE STYLES
1. Introduction
Earthquake ruptures are thought to propagate in one of two basic styles, either as
cracks or as pulses. During crack-like rupture the frictional strength of the fault suffers
irreversible reduction, the fault slides simultaneously over the entire ruptured area and
slip continues until arrest fronts arrive from the terminal edges of the rupture [Kostrov ,
1964]. In this case, the local duration of slip, also known as rise time, scales with the
shortest dimension of the final rupture area. In a pulse-like rupture, first postulated
by Brune [1970], frictional strength weakens only transiently and the rupture front is
closely followed by a healing front, which leads to short rise times. Such short rise times
were first inferred from kinematic source inversions of natural earthquakes by Heaton
[1990], and have been proposed to explain the complexity of seismicity patterns [Cochard
and Madariaga, 1996] and the lack of heat flow anomaly on the San Andreas Fault [Noda
et al., 2009]. The estimation of rise time remains severely affected by the limited resolution
and inherent non-uniqueness of kinematic source inversions [Ide et al., 2005; Page et al.,
2011]. For instance, there are contrasting interpretations of rupture style from near-source
ground motion recordings of the Mw 8.8 2010 Chile earthquake [Madariaga et al., 2010;
Heaton et al., 2011]. Nonetheless, pulse-like rupture has been assumed or inferred in most
source studies, with notable exceptions [Yomogida, 1988; Campillo et al., 1989; Peyrat
et al., 2001; Mavroeidis and Papageorgiou, 2010; Di Carli et al., 2010]. Despite the large
body of theoretical, computational, experimental and seismological work on pulse-like
rupture there are still outstanding open questions, such as: What controls the speed
D R A F T August 7, 2012, 7:54pm D R A F T

GABRIEL ET AL.: DYNAMIC RUPTURE STYLES X - 5
of the healing front? How short are rise times? What controls the selection between
crack-like and pulse-like rupture at high background stress?
Several mechanisms for the generation of pulse-like rupture have been proposed: self-
healing under velocity-dependent friction [Heaton, 1990], coupling between slip and dy-
namic normal stress changes in bimaterial faults [Andrews and Ben-Zion, 1997; Ampuero
and Ben-Zion, 2008; Dalguer and Day , 2009], healing fronts induced by the spatial het-
erogeneity of fault strength and initial stress [Beroza and Mikumo, 1996; Day et al., 1998;
Oglesby and Day , 2002], by the finite thickness of the seismogenic zone [Day , 1982; John-
son, 1992] or by waves reflected inside a low-velocity fault zone [Huang and Ampuero,
2011]. The focus of our current work is on the first mechanism. Dramatic velocity-
weakening at high slip rates is amply supported by laboratory experiments [e.g. Tsutsumi
and Shimamoto, 1997; Tullis and Goldsby , 2003; Di Toro et al., 2005; Hirose and Shi-
mamoto, 2005] and by theoretical studies [Rice, 2006; Beeler et al., 2008].
That earthquakes can operate either as pulses or cracks, depending on the background
fault stress, is supported by laboratory experiments [e.g. Xia et al., 2004; Lykotrafitis
et al., 2006; Lu et al., 2007] and theory [e.g. Cochard and Madariaga, 1994; Perrin et al.,
1995; Beeler and Tullis , 1996; Zheng and Rice, 1998; Nielsen and Carlson, 2000; Ampuero
and Ben-Zion, 2008; Noda et al., 2009; Dunham et al., 2011]. At low stress levels pulses
are found to be the natural rupture style and crack-like propagation is impossible [Zheng
and Rice, 1998; Nielsen and Carlson, 2000]. However, at intermediate stresses both styles
are admissible and the selection depends, among several factors, on details of the chosen
nucleation process, which is often artificially induced in experiments and simulations.
Rupture patterns that depart from the basic crack and pulse dichotomy, for instance
D R A F T August 7, 2012, 7:54pm D R A F T

X - 6 GABRIEL ET AL.: DYNAMIC RUPTURE STYLES
involving repeated slip episodes, have been observed in laboratory experiments [Nielsen
et al., 2010] and suggested from seismological observations [Lee et al., 2011; Yao et al.,
2011]. One goal of the present work is to develop a comprehensive view of the role of
nucleation, initial stress and velocity-weakening parameters on the selection of rupture
style, including complex rupture patterns with multiple simultaneous rupture fronts and
possible co-existence of pulses and cracks.
Earthquake ruptures can propagate at sub-shear or at intersonic speeds [Archuleta,
1984; Spudich and Cranswick , 1984; Dunham and Archuleta, 2004; Bouchon et al., 2010].
Theoretical and computational studies [Andrews , 1976; Andrews , 1985; Dunham, 2007]
have quantified the conditions for supershear transition, including the role of initial fault
stresses and friction law. However, these studies were essentially limited to cracks governed
by slip-weakening friction. On the other hand, supershear pulse-like rupture has been
observed in laboratory experiments [Lu et al., 2007; Lu et al., 2009]. In the present work
we explore the supershear transition for both cracks and pulses under velocity-weakening
friction.
Insights developed on the basis of idealized dynamic rupture models are fundamental to
gain further understanding of earthquake mechanics, to ultimately enable realistic ground
motion prediction for seismic hazard assessment, and to motivate further developments
in observational seismology. The main goals of the present computational study are
to identify the general rupture styles in which a fault can operate and to quantify the
conditions for their occurrence. We aim at defining the dynamic rupture styles that are
admissible under idealized conditions. We believe this fundamental study will provide
D R A F T August 7, 2012, 7:54pm D R A F T

GABRIEL ET AL.: DYNAMIC RUPTURE STYLES X - 7
building blocks of a framework for the interpretation of more realistic rupture scenarios
to be developed in ongoing and future studies.
In Section 2 we formulate an idealized model of rupture on a planar velocity-weakening
fault with uniform initial stress and a smooth nucleation procedure. In Section 3 we
present the results of a broad parametric study of the effect of the initial shear stress,
the nucleation size and the characteristic velocity for the onset of fast velocity-weakening.
We present a diversity of dynamic rupture styles, which we classify as pulses or cracks,
decaying or growing, sub-shear or super-shear, and single or multiple. We discuss their
stability, macroscopic properties and conditions of existence. Relations to previous work
and implications of our results are discussed in Section 4.
2. Model Setup
2.1. Problem Formulation
We model 2D in-plane spontaneous dynamic shear rupture in an isotropic linear elastic
continuum with shear modulus µ, shear wave speed cS, compressional wave speed cP and
Poisson’s ratio ν. We represent the fault by a linear interface across which displacement
discontinuity (slip) is allowed. Slip and stresses along the fault are related by a friction
law. Frictional shear strength, τc, is proportional to the effective normal stress on the
fault, σ (taken positive in compression): τc = µfσ, where µf is the friction coefficient.
The absolute magnitude of shear traction on the fault, τ , is bounded by τc, τ ≤ τc. If
τ < τc the fault remains locked. Sliding starts when the fault shear traction reaches the
shear strength, τ = τc. During sliding the fault shear traction remains equal to the shear
strength. The friction coefficient evolves as explained in the next section.
D R A F T August 7, 2012, 7:54pm D R A F T

X - 8 GABRIEL ET AL.: DYNAMIC RUPTURE STYLES
2.2. Friction Law
Physical weakening processes due to thermal effects can operate on natural faults at
slip velocities (V ) typical of dynamic earthquake sliding [Rice, 2006]. In particular, flash
heating can introduce severe velocity-weakening in the form of a 1/V behavior of frictional
strength [Rice, 2006; Beeler et al., 2008]. To represent such processes, we adopt a rate-
and state-dependent friction law with fast velocity-weakening, as assumed by Ampuero
and Ben-Zion [2008]. The friction coefficient is determined by the slip velocity and a state
variable (Θ) as:
µf = µs + aV
V + Vc− b Θ
Θ +Dc
, (1)
where µs is the static friction coefficient, Vc a characteristic velocity scale, Dc a charac-
teristic slip scale and a and b are two positive coefficients that quantify a direct effect and
an evolution effect, respectively. The state variable has units of slip and is governed by
the following evolution equation:
Θ = V −ΘVcDc
. (2)
The friction coefficient at steady-state, i.e. when Θ = 0, is
µf = µs + (a− b) V
V + Vc(3)
If a < b, the friction coefficient weakens asymptotically as 1/V . In the limit of V � Vc,
µf approaches the following dynamic friction coefficient
µd = µs + (a− b) (4)
over a relaxation time scale Dc/Vc. As described by Ampuero and Ben-Zion [2008], this
relaxation time tunes the weakening mechanism between the two extreme behaviors, slip-
D R A F T August 7, 2012, 7:54pm D R A F T

GABRIEL ET AL.: DYNAMIC RUPTURE STYLES X - 9
weakening and velocity-weakening. The nominal strength drop σ(µs − µd) = σ(b − a) is
denoted τD.
2.3. Nucleation Procedure
Observational constraints on earthquake initiation processes are elusive and earthquake
simulations that incorporate spontaneous aseismic nucleation are computationally de-
manding. Hence, dynamic rupture simulations often adopt artificial nucleation proce-
dures. Several studies have revealed that details of rupture initiation can significantly
affect the subsequent rupture propagation [Festa and Vilotte, 2006; Shi et al., 2008; Lu
et al., 2009; Bizzarri , 2010]. Here we assess the role of nucleation conditions in determin-
ing the rupture style by studying systematically the influence of the size of nucleation. We
adopt a self-healing nucleation procedure introduced by Andrews and Ben-Zion [1997],
which consists of a transient weakening process with subsequent healing. In Appendix A
we consider a nucleation procedure without healing.
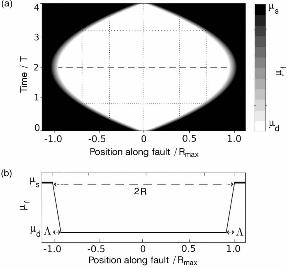
We prescribe a nucleation region with time-dependent size, within which we force the
friction coefficient to be smaller than a prescribed time-dependent value. The nucleation
region first expands and then contracts. Its half-size, R, is given by
R(t) =
{Vnt(1− t
4T
)for 0 ≤ t ≤ 4T
0 for t ≥ 4T,(5)
where Vn is the initial rupture propagation speed and 4T the total duration of nucleation.
The shape of the nucleation zone resulting from Eq. 5 is depicted in Fig. 1 (a). Its
maximum half-size is Rmax = VnT . We found that simulations with same Rmax but
different Vn and T lead to similar rupture styles. In our simulations we evaluate the
effect of nucleation by varying systematically the maximum nucleation half-size, Rmax.
D R A F T August 7, 2012, 7:54pm D R A F T

X - 10 GABRIEL ET AL.: DYNAMIC RUPTURE STYLES
We prescribe the following spatial distribution of the friction coefficient as a function of
position x along strike:
µf =
{µs − (R−|x|)
Λ(µs − µd) for R ≥ |x| > (R− Λ)
µd for |x| < (R− Λ),(6)
where Λ is the along-strike length across which the friction coefficient drops from its
static value µs to the dynamic one µd. The prescribed friction coefficient distribution is
illustrated in Fig. 1 (b).
Within the nucleation region we keep updating the state variable Θ according to Eq.
(2). We set the friction coefficient to the minimum between the prescribed time-dependent
value (Eq. 6) and the rate-and-state value (Eq. 1). Spontaneous rupture propagation
starts eventually once the frictional weakening becomes dominated by the rate-and-state
evolution. Healing in the nucleation region is never faster than the prescribed time-
weakening healing, but it may be slower when dominated by a slow evolution of Θ.
2.4. Initial Stresses
The initial stresses on the fault are known to affect rupture style [Zheng and Rice, 1998]
and rupture speed [Andrews , 1976]. However, their value in natural faults is uncertain.
We consider here a broad range of initial stress values, assuming they are uniform along
the fault. Due to the symmetries of the problem the normal stress remains constant. We
quantify the initial shear stress by the dimensionless parameter S [Das and Aki , 1977a],
the ratio of initial strength excess to (nominal) dynamic stress drop (see also Andrews
[1976]):
S =τs − τ0
τ0 − τd(7)
D R A F T August 7, 2012, 7:54pm D R A F T

GABRIEL ET AL.: DYNAMIC RUPTURE STYLES X - 11
where τs = σµs and τd = σµd are the static and dynamic strengths, respectively, and τ0 is
the initial shear stress. The “relative strength” S (sometimes also referred to as “seismic
ratio” [Templeton and Rice, 2008; Kaneko and Lapusta, 2010]) describes the strength of
the material relative to the dynamic stress drop [Das and Aki , 1977b], and provides a
measure of the closeness of the initial stress to the failure criterion.
The value of the friction coefficient during sliding is µd under slip-weakening friction.
However, it is generally higher than µd under velocity- and state-dependent friction and
τ0−τd is not an adequate estimate of the actual dynamic stress drop. Modified definitions
of the relative strength parameter that account for this are presented in Appendix B.
2.5. Non-dimensional Units and Parameter Space
Dimensional analysis shows that the problem formulated here depends on the following
non-dimensional numbers: S, RmaxτD/µDc, µVc/τDcS, ν, a/b and Vn/cS. This study is
focused on the effect of the three first quantities. The remaining three are held fixed.
Poissons ratio ν is not expected to affect our results within the narrow range of its usual
values. In fact, most of our conclusions, except the super-shear ruptures, hold also for anti-
plane deformation (mode III), in which Poisson’s ratio is irrelevant. We have verified that
for a given maximum nucleation half-size, Rmax = VnT , the non-dimensional nucleation
speed Vn/cs is irrelevant as long as it is slow enough. The value of the non-dimensional
parameter a/b is chosen small enough to have little impact on the rupture, but large
enough to provide efficient regularization of the velocity-weakening friction, i.e. to yield a
large enough critical wavelength [Ampuero and Ben-Zion, 2008] to be resolved numerically
at an affordable computational cost.
D R A F T August 7, 2012, 7:54pm D R A F T

X - 12 GABRIEL ET AL.: DYNAMIC RUPTURE STYLES
All parameters in this study are non-dimensional, making it possible to scale our results
to a range of values of physical parameters such as Dc or initial stress, which in reality are
poorly constrained. Stresses are scaled by the nominal strength drop, τD = σ(µs − µd),
slip by the characteristic slip scale Dc, distances by X = µDc/τD, time by X/cS and slip
rates by DccS/X = τDcS/µ. A typical set of model parameter values, listed in Table 2 in
real units, results in the following scaling factors: τD = 20 MPa, X = 10 m, time scale
2.7 ms and slip rate scale 2 m/s.
We conducted a large number of simulations which systematically explore the role of
initial stress level (characterized by S) and nucleation size (Rmax) in determining the
rupture style. In Appendix A we additionally report on the effect of the type of nucleation
procedure (with or without healing). Table 1 shows the explored range of S and Rmax, and
the fixed values of all the other model parameters. The chosen range of S spans subshear
and supershear rupture conditions in slip-weakening simulations [Andrews , 1976]. An
upper bound for the static stress drop is τ0 − τd = τD/(1 + S). The S values we explored
(0.25 ∼ 4) imply τ0 − τd = 4 ∼ 16 MPa, which is within the typical range of earthquake
stress drops. We adaptively refined the values of the parameters S and Rmax to capture
the details of the transitions between rupture styles. The parameter space of this study is
complementary to that of Ampuero and Ben-Zion [2008], who varied nucleation size and
Vc while keeping initial stress constant (S = 1.7) in most of their work (except in their
Appendix D).
In most of our simulations we set the characteristic velocity of the friction law to Vc =
0.07 (non dimensional). This value leads to a variety of rupture styles in the study of
Ampuero and Ben-Zion [2008]. Assuming the parameters of Table 2, this corresponds to
D R A F T August 7, 2012, 7:54pm D R A F T

GABRIEL ET AL.: DYNAMIC RUPTURE STYLES X - 13
Vc = 0.14 m/s. The value is higher if the assumed effective normal stress is larger. The
slip velocity at the onset of severe thermal weakening induced by flash heating is of the
order of 0.1 m/s for background temperatures at the middle depth of crustal seismogenic
zones [Rice, 2006], and a plausible range is 0.05 to 2 m/s [Beeler et al., 2008]. Significant
weakening induced by thermal pressurization is possible at mid-seismogenic depth if slip
rate exceeds 10/w, where w is the thickness of the slip zone in microns, e.g. V > 0.1 m/s if
w = 100 µm [Wibberley and Shimamoto, 2005]. Nielsen et al. [2008] observed weakening
by frictional melt in laboratory experiments with a characteristic slip velocity in the
range 0.04 to 0.14 m/s. Characteristic velocities in the range Vc ∼ 0.1 m/s have been
also inferred from seismological observations [Nielsen and Olsen, 2000]. In Section 3.7 we
explore the effect of Vc on rupture styles.
2.6. Numerical Method
Our simulations employ a spectral element method for 2D wave propagation and source
dynamics (SEM2DPACK, Ampuero [2008]), which solves for elasto-dynamic wave propa-
gation coupled to frictional sliding along the fault. The spectral element method is a well
established numerical method in seismic wave propagation [e.g. Komatitsch and Vilotte,
1998; Komatitsch and Tromp, 1999]. Its accuracy in solving rupture dynamics has been
demonstrated in benchmark problems [Kaneko et al., 2008; Harris et al., 2004; Huang
and Ampuero, 2011]. The equations of motion are solved by an explicit time-stepping
algorithm. The fault boundary conditions are handled as in the “tractions at split nodes”
method [Andrews , 1999; Kaneko et al., 2008]. The fault discontinuity is surrounded by a
thin layer of Kelvin-Voigt material to damp spurious high-frequency oscillations [Day and
Ely , 2002; Dalguer and Day , 2007].
D R A F T August 7, 2012, 7:54pm D R A F T

X - 14 GABRIEL ET AL.: DYNAMIC RUPTURE STYLES
To avoid the effect of spurious wave reflections from the imperfect absorbing boundaries
we set the domain size to conservatively large values. For a total simulation time t, the
conservative domain size in the fault-normal direction is wcons = cP t/2, where cP is the P
wave velocity. In the along-strike direction it is lcons = (cP + cR)t for subshear ruptures
and lcons = 2cP t for supershear ruptures, where cR is the Rayleigh wave speed.
We set the spectral element size to h = 1 and the polynomial order to p = 5, i.e.
6 × 6 Gauss-Lobatto-Legendre (GLL) nodes per element and ∆x = 0.2 average spacing
between GLL nodes. We verified that these settings allow the cohesive zone to be resolved
by at least 5 GLL nodes in all our simulations. During this study we performed several
thousands of simulations to finely resolve the parameter space. Non-dimensional durations
and domain sizes ranged from 200 to 1000 and 550 to 2650, respectively. The largest
simulations required 18 hours of single core CPU time and produced 100 GB of data per
run.
3. Results
Our simulations span a variety of rupture styles that we classify as decaying or sustained,
pulses or cracks, sub-shear or super-shear, single or multiple ruptures. The first aim of our
study is to determine the range of initial conditions (relative strength S and maximum
nucleation half-size Rmax) that lead to each of these rupture styles. The effect of Vc
is addressed only in Section 3.7. Our second aim is to characterize, as a function of
background shear stress, the rupture properties that do not depend on the details of
nucleation.
D R A F T August 7, 2012, 7:54pm D R A F T

GABRIEL ET AL.: DYNAMIC RUPTURE STYLES X - 15
3.1. Overview of Effects of Initial Stress and Nucleation Conditions on
Dynamic Rupture Styles
We fixed Rmax to the minimal value that allows self-sustained rupture with S = 1, and
then ran a series of simulations with varying values of S. We observe three main rupture
styles: decaying pulses at high S, growing pulses at lower S, and cracks at even lower
S. Figs. 2 (a),(c) and (e) show the spatial distribution of slip at regular times typical
of these three rupture styles. The insets show a typical snapshot (spatial distribution at
a selected time) of slip rate for each simulation. Pulses are distinguished from cracks by
the vanishing slip rate in the hypocentral region, induced by healing after the passage of
the rupture front. Growing pulses generate triangular slip profiles with an elliptical cap
at the leading front and cracks generate elliptical slip profiles. “Transitional” styles are
also shown in Fig. 2. Steady-state pulses, characterized by flat slip profiles (Fig. 2 (b)),
are the natural transition between decaying and growing pulses. In a narrow range of
S, between growing pulses and cracks, ruptures involve the superposition of a primary
pulse and a secondary crack nucleated at the hypocenter (Fig. 2 (d)). Ruptures that do
not involve such feature will be called “pure pulses” or “pure cracks”. At low S, cracks
trigger, near their rupture front, a secondary pulse that travels at supershear speed (Fig.
2 (f)).
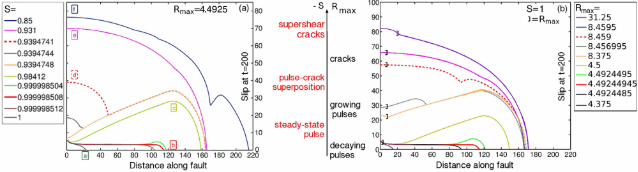
Fig. 3 summarizes all rupture styles found in this set of simulations by showing slip at
the (arbitrary) simulation time t = 200 (each curve corresponds to a different simulation
with a different value of S). The transitions between decaying and growing pulses, between
pulse-crack superposition and pure cracks and between sub- and supershear ruptures occur
at very specific values of S and are highlighted in Fig. 3 (a). We finely tuned the value
D R A F T August 7, 2012, 7:54pm D R A F T

X - 16 GABRIEL ET AL.: DYNAMIC RUPTURE STYLES
of S to find these transitional ruptures, following ad hoc procedures described later. The
precision of S reported in Fig. 3 reflects the extreme sensitivity of transitional styles to
changes in initial conditions.
In a second group of simulations we set S = 1 and varied the maximum nucleation
half-size Rmax. Slip at time t = 200 is shown in Fig. 3 (b) for all these simulations.
The same sequence of rupture styles can be identified, driven now by increasing values
of Rmax, from decaying pulses to growing pulses to cracks. We tuned Rmax to capture
the transitional rupture styles. The evolution of rupture speed for a range of examples
of different rupture styles (Fig. 4) clearly shows the transitions from decaying to growing
pulses and from subshear to supershear rupture.
We ran a large set of simulations spanning the parameter ranges 0.25 ≤ S ≤ 3.35 and
0.5 ≤ Rmax ≤ 200. At high values of S and Rmax, we increased the simulation time
and computational domain to fully capture the rupture style transitions. The conditions
leading to each of the rupture styles found in our simulations are summarized in Fig. 5.
This “phase diagram” shows the locus in parameter space (Rmax and S) of the transitional
rupture styles that separate decaying pulses, growing pulses, pulse-crack superimposed
ruptures and pure cracks, as well as sub- and supershear ruptures. The diagram focuses
only on the rupture style transitions of the primary front. These boundaries are sharp:
a slight change of Rmax or S can dramatically transform a rupture style. Along the
transition boundaries Rmax depends roughly exponentially on S. If S is increased less
potential energy is available and all rupture style transitions require higher nucleation
energies, which is provided by larger Rmax. The transition boundaries approach each
other at decreasing S, which necessitates even finer tuning. Fig. 5 indicates a “supershear
D R A F T August 7, 2012, 7:54pm D R A F T

GABRIEL ET AL.: DYNAMIC RUPTURE STYLES X - 17
transition” for the largest value of S at a given Rmax that enables supershear ruptures in
long simulations of duration t = 1000. This critical S for supershear transition depends
on Rmax and, for large enough Rmax, it is close to 1.2.
In Appendix A we ran the same set of simulations applying a non-healing nucleation
procedure. We found that the nucleation type does not affect significantly the rupture
transition processes.
In the following, all transitional and stable rupture regimes are characterized in more
detail.
3.2. Transition Between Decaying and Growing Pulses: Steady-state Pulses
The steady-state pulses in this study are defined, far from the nucleation region, by
spatially uniform rupture speed (Fig. 4), peak slip rate, and rise time. Their passage
leaves a spatially uniform slip (Fig. 2 (b)). Their rupture speed, peak slip rate, rise-
time and cumulated slip increase as a function of S (Fig. 6). Steady-state pulses may
propagate at low speeds, e.g. vr ≈ 0.6cS if S = 1 (Figs. 4 and 6). These steady-state
pulses exist only for specific combinations of S and Rmax values. For slightly different
values, pulses initially run in steady state but then transform into dying or growing pulses.
The departure from steady-state happens sharply at a “transition distance” that depends
strongly on the initial conditions. The transition distance diverges as the conditions for
steady-state rupture are approached (see the blue solid lines in Fig. 7 and Fig. 7 of
Ampuero and Ben-Zion [2008]). The transitional S and Rmax values in Figs. 3 (a) and
(b), respectively, lead to steady-state propagation at least up to t = 200. Finer tuning is
necessary to propagate a steady-state pulse over longer times (as in Fig. 5).
D R A F T August 7, 2012, 7:54pm D R A F T

X - 18 GABRIEL ET AL.: DYNAMIC RUPTURE STYLES
The properties of steady-state ruptures do not depend on the nucleation procedure nor
on the ultimate fate of the pulse (decay or growth) as long as they are measured during
a sufficiently stable steady-state portion of the rupture.
3.3. Growing Pulses
Growing pulses occur in a range of parameter space (Rmax and S) bounded at small
Rmax by steady-state pulses and at large Rmax by the onset of pure cracks if S is lower
than a certain value Spulse ≈ 1.95 (Fig. 5). Although the growing pulse regime is the
dynamically stable rupture style requiring the shortest nucleation size, the condition for
its existence is extremely narrow when S < Spulse. High initial stress thus favors crack-like
rupture.
All growing pulses approach an almost self-similar asymptotic behavior [Nielsen and
Carlson, 2000] with properties that depend on S but not on Rmax. The asymptotic
growing pulses have the following characteristics: constant slip gradient (Figs. 3), constant
rupture speed (Fig. 4), constant healing front speed, and rise time proportional to rupture
propagation distance. Figs. 8 (a) and (b) summarize the slip gradient, rupture speed and
healing front speed as a function of S. Slip is accumulated faster at lower S. Growing
pulses progressively accelerate towards the Rayleigh speed. This acceleration is slower
at higher S, yielding lower rupture speeds at higher S for a given simulation time. The
speed of the healing front is lower than the Rayleigh speed (Fig. 8 (b)) and depends
little on S. What controls the speed of the healing front is one of the aspects of the
dynamics of rupture pulses that remains poorly understood. Nevertheless, peak slip rates
(V ) do not approach a constant limit, as perfect self-similarity would require [Nielsen
and Madariaga, 2003], but grow as a function of hypocentral distance x (Fig. 9). As
D R A F T August 7, 2012, 7:54pm D R A F T

GABRIEL ET AL.: DYNAMIC RUPTURE STYLES X - 19
expected from fracture mechanics considerations (Appendix C), this growth is consistent
with a relation of the form V ln(V/Vc) ∝ x. This is illustrated in Fig. 9 for S = 0.923
and Rmax = 4. During supershear and crack-like ruptures the peak slip rate growth has
a similar shape but is slower (Fig. 9).
3.4. Transition From Pure Pulse to Pulse-crack Superposition
Growing pulses gradually concentrate stress in their hypocentral region. After a certain
propagation distance, this stress concentration overcomes the fault strength and reacti-
vates slip at the hypocenter, resulting in nucleation of a secondary rupture front. Fig. 10
shows the evolution of slip rate and incremental shear stress along the fault for a growing
pulse that triggers a secondary crack. Fig. 11 (a) shows another example.
The rupture style of the secondary front is controlled by the overall amplitude of the
“primary residual stress”, i.e. the stress left behind by the primary pulse. Secondary
ruptures are cracks in most of our simulations because the primary residual stress is often
large over a broad area near the hypocenter. Secondary cracks typically run at near-
Rayleigh rupture speed (Fig. 11 (a) at t < 350), but if the primary residual stress is high
enough they turn supershear (see Section 3.6) and eventually coalesce with the primary
front (Fig. 11 (a) at t ≈ 400). In contrast, if the primary residual stress is low then the
secondary rupture is a pulse. Secondary pulses have a steady-state transition similar to
that of primary pulses. One example of a growing pulse followed by a secondary steady-
state pulse is the case S = 1 and Rmax = 8.456995 in Fig. 3 (b). At higher S or longer
Rmax the secondary pulse is a growing one. A secondary growing pulse may, through the
same residual stress concentration mechanism, trigger a third rupture front. Conceivably,
the process can repeat, leading to a sequence of multiple pulses.
D R A F T August 7, 2012, 7:54pm D R A F T

X - 20 GABRIEL ET AL.: DYNAMIC RUPTURE STYLES
The triggering mechanism is largely independent of Rmax but depends on S. It operates
over a narrow range of S and is impeded by other transition processes. The efficiency
of the secondary triggering process depends on the spatial distribution of the primary
residual stresses, hence on the smoothness of the slip left behind by the primary pulse.
In particular, the rate of build up of the primary residual stress concentration correlates
with the gradient of slip left by the primary pulse, which is lower at lower stress drop /
higher S (Fig. 8 (a)). Hence the “transition distance” that a pulse needs to propagate
to trigger a secondary rupture at the hypocenter increases as a function of S (green solid
lines in Fig. 7). The S-dependence of the transition distance is steeper at low and high S.
At low S, the efficient stress transfer to the hypocenter prevents healing and promotes the
transition to crack-like behavior of the primary front. Primary cracks do not concentrate
stress at the hypocenter. At high S, the nucleation size Rmax required for growing pulses
is long and might interfere with the stress build up. More significantly, primary pulses are
preceded by a transient phase of steady pulse propagation. Their primary residual stress
concentrates near the location of the transition to pulse growth, which can be offset at
considerable distance from the hypocenter.
While delayed pulse growth prevents nucleation at the hypocenter, secondary triggering
can still happen away from the hypocenter and lead to complex rupture patterns. Fig. 11
(b) shows an initial steady pulse that starts to grow at t ≈ 130. The emerging growing
pulse rapidly concentrates stresses near its origin, at x = 50, and eventually triggers a
back-propagating front. In this particular example, triggering happens before the passage
of the healing front of the primary pulse, and the growing pulse rupture transforms into
a bilateral crack.
D R A F T August 7, 2012, 7:54pm D R A F T

GABRIEL ET AL.: DYNAMIC RUPTURE STYLES X - 21
3.5. Transition to Pure Cracks
Cracks do not exist if S is larger than a certain critical value Spulse = 1.95 (Fig. 5).
This is well explained by the “understressing theory” [Perrin et al., 1995; Zheng and
Rice, 1998], which for the friction law and friction parameters adopted here predicts that
a minimum stress τpulse = 0.54 is necessary for crack-like rupture. Below Spulse, our
simulations illustrate that the selection between cracks and pulses, and their coexistence,
has a non trivial dependence on initial conditions.
The transition between pulses and cracks involves complex rupture patterns with mul-
tiple fronts. With decreasing S and increasing Rmax, the separation between the healing
front of the primary pulse and the rupture front of the secondary rupture shortens and
eventually disappears. This defines the transition to pure cracks. The coexistence of
cracks and pulses, combined with nucleation effects complicate the definition of this tran-
sition. At high stresses (S � 1), the distance required to trigger a secondary rupture is
small and all ruptures, apart from decaying and steady-state pulses, can be essentially
classified as cracks.
3.6. Supershear Rupture Transition
Fig. 4 shows examples of cracks whose rupture speed approaches the Rayleigh speed
and eventually jumps to values faster than the S wave speed. This supershear transition is
due to the “daughter crack” mechanism described by Andrews [1976] for cracks governed
by slip-weakening friction: supershear fronts are triggered by the gradual build-up of a
dynamic stress peak traveling at the S wave speed, ahead of the primary rupture front.
Although in most of our simulations supershear ruptures are triggered by cracks, we
found that pulses can also nucleate supershear fronts. Two examples are shown in Figs.
D R A F T August 7, 2012, 7:54pm D R A F T

X - 22 GABRIEL ET AL.: DYNAMIC RUPTURE STYLES
12 (a) and (b). The supershear transition of pulses happens under a narrow range of
conditions, as indicated by the small overlap between the S-Rmax conditions for pulses
and supershear ruptures in the phase diagram of Fig. 5.
The supershear transition is enabled and enhanced by high background stresses [An-
drews , 1976]. The rupture propagation distance at which it occurs increases as a function
of S and diverges around a critical value Sss (see the black curves with stars in Fig. 7).
We found that Sss ≈ 1 for cracks and pulses, with a mild dependence on Rmax (dashed
curves with stars in Fig. 5).
Fig. 13 shows the evolution of rupture speed of typical supershear ruptures with S and
Rmax close to the supershear transition boundary of Fig. 5. Their rupture speed is close
to cP and decreases only slightly as a function of S, by less than 2%. This holds also
when S and Rmax are further away from the supershear transition. Moreover, the rupture
speed of supershear fronts is independent of the rupture style of the primary (subshear)
and secondary (supershear) fronts. For instance, in Fig. 13 the final rupture speed of the
three examples with S = 1 is very similar despite their different rupture styles.
The supershear daughter ruptures triggered by pulses may propagate either as pulses
or as cracks, as shown in Figs. 12 (a) and (b), respectively. When the daughter rupture is
crack-like, its back-propagating front may be sub-shear or super-shear, depending on the
stress level left behind by the primary pulse (low or high, respectively). Fig. 11 (b) shows
a steady-state pulse that eventually transforms into a bilateral crack and then triggers a
supershear daughter crack at its front. The back-propagating front of the daughter crack
becomes supershear when it enters the higher stress regions left by the steady-state pulse.
D R A F T August 7, 2012, 7:54pm D R A F T

GABRIEL ET AL.: DYNAMIC RUPTURE STYLES X - 23
Peak slip rate increases sharply at the onset of the supershear transition (Fig. 9). This
is due to the coalescence of the main rupture front and the back-propagating front of
the daughter crack. Peak slip rate then decays to values lower than during the initial
subshear propagation: the strength drop in the subshear front vanishes as most of the
frictional weakening occurs in the supershear front. Subsequently the peak slip rate at
the supershear front increases. The asymptotic properties of supershear ruptures, such
as peak slip rate and rupture velocity, do not depend on nucleation size (see the varying
Rmax in Figs. 4 and 6) and are similar for supershear ruptures nucleated by primary and
secondary ruptures.
Secondary ruptures may also nucleate supershear fronts. Fig. 11 (a) shows a secondary
crack, nucleated at the hypocenter, that eventually turns supershear. This rupture be-
havior is an additional feature to the supershear transition of the primary rupture front
(Fig. 7).
The supershear transition of a pulse and the reactivation of slip at the hypocenter
can interfere. At high Rmax and low S the back-propagating front of a supershear crack
removes the stress concentration at the hypocenter and hence prevents slip reactivation.
Conversely, a secondary crack nucleated at the hypocenter may turn supershear and even-
tually overtake the primary pulse front impeding its supershear transition (Fig. 11 (a)).
3.7. Influence of Characteristic Weakening Velocity on Rupture Styles
In the simulations we have presented so far we assumed that the characteristic velocity of
the friction law (Eq. 1) is Vc = 0.07 (normalized by τDcS/µ). As discussed in Section 2.5,
this parameter may span a broad range of values in natural faults. We hence performed
a set of simulations with different Vc values.
D R A F T August 7, 2012, 7:54pm D R A F T

X - 24 GABRIEL ET AL.: DYNAMIC RUPTURE STYLES
At given S and Rmax, changing Vc produces the same rupture style transitions as in
our previous simulations. Fig. 14 (a) shows transitions driven by a decrease of Vc from
decaying to growing pulse (through steady-state) and finally to crack. This behavior is
in general agreement with the results in section 3.1 of Ampuero and Ben-Zion [2008].
Decreasing Vc increases the velocity-weakening rate, and hence reduces the effective nu-
cleation size which in turn induces the transition to growing pulses. It also increases Spulse
[Nielsen and Carlson, 2000; Ampuero and Ben-Zion, 2008], which promotes the transi-
tion from pulses to cracks. Fig. 14 (b) summarizes the conditions of occurrence of each
rupture style transition in terms of S and Vc, at fixed Rmax = 4.4925. A reduction of Vc
affects the phase space of rupture style transitions in a predictable way: decreasing Vc
increases all transitional values of S. The critical S for supershear rupture is only weakly
affected by Vc and remains well below the critical value S = 1.77 of linear slip-weakening
friction. Spulse increases with decreasing Vc as expected from the analysis of Zheng and
Rice [1998]. At very low Vc the S-range of existence of pulses becomes extremely small,
consistently with the dominance of slip-weakening behavior in the friction law.
4. Discussion
Our dynamic rupture simulations generated a variety of rupture styles, which we classi-
fied following four distinct criteria: based on the stability of their peak slip rate, ruptures
were classified as decaying, steady or growing ruptures; based on their rise time, as pulses
or cracks; based on their rupture speed, as subshear or supershear; and based on their
complexity, as single or multiple ruptures. Most of these rupture styles are consistent with
those reported by previous numerical studies, laboratory experiments and earthquake ob-
servations, or predicted by previous theoretical studies. However, our simulation results
D R A F T August 7, 2012, 7:54pm D R A F T

GABRIEL ET AL.: DYNAMIC RUPTURE STYLES X - 25
provide a number of new insights. This section summarizes the new understandings of
known rupture patterns and highlights the original rupture patterns revealed by our sim-
ulations. We discuss important implications of our findings for seismogenic processes
and observational earthquake seismology, while mentioning limitations of our modeling
assumptions. Also, we draw connections to recent observations which can be interpreted
in the framework of our numerical findings.
4.1. The Initiation of Rupture
Our results on the effect of nucleation size Rmax provide insight into the conditions
necessary for rupture initiation. The simulations by Zheng and Rice [1998] produced self-
sustaining slip pulses only when the background stress was close to τpulse. By considering
systematically the effect of nucleation size, we found that sustained rupture is possible
at stresses lower than τpulse. Quantitatively, our results indicate that the nucleation size
Rmax required to initiate rupture depends exponentially on the relative strength S.
A shortcoming of the simulations presented here is the artificial nature of the rupture
initiation procedures employed, although in some of our models growing ruptures initiate
from a steady-state pulse far from the artificial nucleation regions. On the one hand,
our results provide a basis for the design and interpretation of future studies that will
incorporate more physical, spontaneous nucleation process through earthquake cycle sim-
ulations, although at a much higher computational cost [Lapusta and Rice, 2003; Kaneko
and Lapusta, 2008; Noda and Lapusta]. On the other hand, we can propose a physical
interpretation of our assumed nucleation procedure. Aochi and Ide [2005] envisioned a
hierarchical spatial distribution of fault friction properties, in which small patches with
fast weakening rate are embedded in large patches with slower weakening rate. Earth-
D R A F T August 7, 2012, 7:54pm D R A F T

X - 26 GABRIEL ET AL.: DYNAMIC RUPTURE STYLES
quakes nucleate on the smallest, most unstable patches, and might propagate to the largest
patches by a cascade of dynamic triggering. In this context, our simulations with uniform
friction properties are focused on a single scale, and our imposed nucleation procedure is a
proxy for the weakening induced by the rupture process at smaller scales. The compound
size of the smaller patches in the nucleation region is parameterized in our model by the
size of the imposed initiation zone, Rmax.
An interesting implication of this interpretation is related to the Gutenberg-Richter
distribution of seismicity. At our modeling scale the fault is subjected to a steady sequence
of nucleation attempts of various sizes, with smaller nucleation sizes (small Rmax) being
most likely. The steady-state pulse is the self-sustained rupture style that requires the
smallest Rmax, and hence might appear as the most likely mode of rupture initiation [see
also Noda et al., 2009]. However, at low S, pulses are generated only over a narrow range
of Rmax, hence crack-like ruptures might be equally likely. As tectonic stress increases
(decreasing S) the minimum nucleation size decreases dramatically (smaller Rmax required
for steady pulses) and the rate of successful nucleations should increase. This suggests that
whether a rupture initiates as a crack or as a pulse depends on a competition between the
tectonic loading rate and the background micro-seismicity rate. This competition should
also affect the typical level of stress at the onset of large earthquakes, which ultimately
controls stress drop and heat production.
4.2. Properties of Steady Pulses
We found that the rupture speed, peak slip rate, rise time and cumulated slip of steady
pulses increase as a function of S (Fig. 6). Most of these trends were also found by
Perrin et al. [1995] through an asymptotic analysis independent of nucleation assumptions,
D R A F T August 7, 2012, 7:54pm D R A F T

GABRIEL ET AL.: DYNAMIC RUPTURE STYLES X - 27
assuming a friction law with mild (logarithmic) dependence on slip velocity. The only
difference is for rise times, which they found to decrease with increasing S, probably
reflecting a special sensitivity of the healing process to the assumed friction law.
Decaying pulses could serve as a model for small earthquakes with spontaneous arrest.
They can propagate a significant distance as steady-state pulses before they decay. The
inverse correlation found here between the rupture speed of steady pulses and the back-
ground stress level is similar to the inverse correlation between rupture speed and stress
drop inferred by Tan and Helmberger [2010] from seismological observations of small earth-
quakes (3 < M < 5) in the 2003 Big Bear aftershock sequence. Low rupture speeds at
high stress also imply lower radiation efficiency [Venkataraman and Kanamori , 2004] for
smaller magnitude events, which is a subject of debate in observational seismology. How-
ever, steady pulses are very sensitive to perturbations of small length scales, comparable
to the pulse width, and may easily decay or transform into a growing pulse or crack if they
encounter spatial heterogeneities of initial stresses or strength, which we have ignored in
the present work.
4.3. Complex Ruptures Involving Multiple Fronts
Our results provide further theoretical support to the existence of multiple earthquake
rupture fronts, i.e. a fault patch may slip and stop more than once during the same earth-
quake. Complex ruptures with re-nucleation of slip after the passage of a pulse have been
observed before in numerical simulations [Cochard and Madariaga, 1996; Nielsen et al.,
2000] and laboratory experiments [Nielsen et al., 2010]. The mechanism for triggering
secondary fronts was explained by Nielsen and Madariaga [2003] based on the analyti-
cal solution for a singular self-similar pulse. However, the identification of this complex
D R A F T August 7, 2012, 7:54pm D R A F T

X - 28 GABRIEL ET AL.: DYNAMIC RUPTURE STYLES
rupture pattern in natural earthquakes requires source imaging at higher resolution than
usually achieved by finite source inversion studies, which are limited to low frequencies
and adopt restrictive assumptions about the rupture kinematics.
For the 2011 Mw 9 Tohoku-Oki earthquake, an exceptionally well recorded large event,
Lee et al. [2011] and Yao et al. [2011] suggested the occurrence of reactivated slip in the
hypocentral region based, respectively, on source inversion of teleseismic, strong motion
and geodetic data with a multiple-window parameterization of slip rate and on source
imaging by back-projection of teleseismic array data. While this inference is not present
in other studies of the Tohoku-Oki earthquake, it warrants efforts to improve the resolution
and robustness of source inversion and imaging techniques in order to distinguish rupture
patterns of complexity comparable to that found in dynamic simulations. Similar episodes
of multiple slip have been inferred for the 1999 Chi-Chi earthquake [Lee et al., 2006] and
the 1987 Superstitious Hills earthquake [Wald et al., 1990]. In Fig. 15 we visualize the
relevant aspects of the source models of the Tohoku-Oki earthquake by Lee et al. [2011]
and of the Chi-Chi earthquake by Lee et al. [2006]. We focus on a spatial cross-section
of the source models to obtain a representation similar to our Fig. 11 (a). These figures
highlight the slip reactivation phenomenon: in both earthquakes one can clearly observe
at least two distinct rupture fronts originating in the hypocentral area (indicated by red
lines in Fig .15)
Earthquakes are usually modeled as pulses in finite kinematic source inversions. How-
ever, rise time remains one of the least well constrained source parameters, which makes
it difficult to distinguish between true cracks and pulses with a long but weak slip-rate
tail. A further complication arises from the possibility of multiple ruptures: an appar-
D R A F T August 7, 2012, 7:54pm D R A F T

GABRIEL ET AL.: DYNAMIC RUPTURE STYLES X - 29
ent crack-like behavior could emerge as the low-frequency manifestation of a sequence of
multiple pulses.
If the stress left behind the primary pulse is relatively low, the secondary rupture is a
growing pulse. The secondary pulse can itself trigger a tertiary rupture, and triggering may
repeat multiple times leading to a sequence of self-similar pulses [Cochard and Madariaga,
1996; Nielsen et al., 2000]. These multiple-pulse ruptures have a different origin than the
“multi-pulse mode” or “train of pulses” observed in previous simulations [Coker et al.,
2005; Lapusta, 2005; Shi et al., 2008]. Both phenomena appear under conditions close to
the transition between (single) pulse-like and crack-like rupture. However, whereas the
former requires a primary pulse and relative long re-nucleation times, the latter arises
from an intrinsic instability present also for primary cracks [Lapusta, 2005] and involves
short time scales between multiple rupture fronts. Huang and Ampuero [2011] proposed a
mechanism for the generation of multiple pulses induced by reflected waves in the presence
of a low velocity fault zone. In contrast, the mechanism described here does not require
a heterogeneous elastic medium.
4.4. The Role of Multiple Ruptures on the Transition Between Pulses and
Cracks
Our results on multiple ruptures shed light into how an earthquake selects between
the two basic rupture styles, crack and pulse. While theoretical studies determined that
crack-like rupture is impossible when the background stress is below a critical value τpulse
[Zheng and Rice, 1998; Nielsen and Carlson, 2000], at higher stress both rupture styles
are possible and no recipe for rupture style selection is available. In contrast to the present
work, previous numerical studies did not systematically investigate the effect of the size of
D R A F T August 7, 2012, 7:54pm D R A F T

X - 30 GABRIEL ET AL.: DYNAMIC RUPTURE STYLES
the nucleation region. We found that the selection of rupture style does not only depend
on the background stress, but also on the nucleation size Rmax. The transition from pulse
to crack as a function of increasing Rmax involves a superposition of multiple rupture
fronts, a pulse triggering a crack at the hypocenter. This result highlights the importance
of the nucleation conditions for the character of the ensuing dynamic rupture.
4.5. Complex Ruptures Involving Back-propagating Fronts
Some of our models show back-propagating fronts. In Fig. 11 (b), a weak steady
pulse nucleates a stronger, bilateral rupture. One of the triggered fronts propagates
back towards the hypocenter. Evidence of a rupture front propagating in the direction
opposite to the overall rupture direction was reported for the 1984 Morgan Hill earthquake,
based on strong motion observations [Beroza and Spudich, 1988], and for the 2011 El
Mayor - Cucapah earthquake, based on an eyewitness account and on regional array back-
projection [Hudnut , 2011; Meng et al., 2011]. Proposed mechanisms involve the presence
of heterogeneities of fault strength or stress. Our results suggest that back-propagating
ruptures are possible even on a fault with uniform initial stress and friction properties.
4.6. The Supershear Transition of Pulse-like Ruptures
To our knowledge, the supershear transition from pulse-like ruptures, predicted by the
theoretical analysis of Dunham [2007] and observed in laboratory experiments [Lu et al.,
2007; Lu et al., 2009], is reported here for the first time in numerical simulations. However,
in our models this phenomenon is confined to a narrow range of initial stress and nucleation
conditions. The absence of fine tuning in the laboratory experiments might suggest that
the critical stress for pulse-crack transition is closer to the critical stress for supershear
D R A F T August 7, 2012, 7:54pm D R A F T

GABRIEL ET AL.: DYNAMIC RUPTURE STYLES X - 31
transition than assumed in our simulations, i.e. Spulse closer to Sss ≈ 1. This might imply
µVc/σ(µs − µd)cS ≈ 0.17 (beyond the range explored here, ≤ 0.09). Further quantitative
comparison between simulations and experiments also requires determination of the high-
velocity frictional properties of the laboratory samples.
4.7. Properties of Supershear Ruptures
In our velocity-weakening simulations the critical S for supershear transition is Sss ≈
1.2. For self-similar ruptures propagating at near-Rayleigh speed (Fig. 4), such low Sss
values are expected for pulses with near-Rayleigh healing front speed [Figure 3 of Dunham,
2007], which is the case in our growing pulse simulations (Fig. 8), but are not expected for
cracks. Analytical solutions for the dynamic stresses induced by self-similar cracks indicate
that Sss = 1.77 (Burridge [1973], corrected by Andrews [1985]). To a large extent, the
low Sss in dynamic ruptures under velocity-weakening friction can be attributed to a
limited applicability of the conventional definition of S, as elaborated in Appendix B. In
addition, finite size effects also affect the apparent Sss: as S approaches the true Sss the
supershear transition happens at a rupture distance larger than our computational domain
and beyond our simulation time (t ≤ 1000). The scarcity of supershear ruptures in nature
implies that S is relatively high, but our results suggest that it is not straightforward to
infer a more quantitative constraint on the lower bound of S.
In laboratory experiments [Lu et al., 2007] and in analytical studies [Samudrala et al.,
2002] the rupture speed was found to decrease with increasing S. Lu et al. [2009] found in
laboratory experiments that supershear fronts generated by pulses propagated slower than
those generated by cracks. The laboratory experiments may be dominated by transient
response. In contrast, our simulation results are more asymptotic and show insignificant
D R A F T August 7, 2012, 7:54pm D R A F T

X - 32 GABRIEL ET AL.: DYNAMIC RUPTURE STYLES
dependence of supershear rupture speed on S or on the style of the primary rupture. We
also found that strong slip rate peaks are generated at the transition to supershear rupture.
These should produce strong, high frequency radiation phases, perhaps observable in real
earthquakes by back-projection source imaging.
5. Conclusions
We conducted a systematic numerical study of 2D inplane dynamic rupture on faults
governed by a rate-and-state-dependent friction law with severe velocity-weakening at high
speed. Ruptures were artificially nucleated by prescribing a time-weakening zone of time-
dependent size. Our results show that ruptures can propagate with a variety of styles,
which we classified by several criteria: stability (decaying, steady or growing behavior
of peak slip rate), rise time (pulses or cracks), rupture speed (subshear or supershear),
and complexity (single or multiple rupture fronts). We identified the effect of initial
stress (relative strength parameter S), nucleation size (Rmax) and characteristic weakening
velocity (Vc) on the style of rupture, with special attention to the transitions between these
styles as a function of S and Rmax. The asymptotic properties (independent of nucleation)
of steady-state and self-similar pulses were quantified as a function of S. For steady-state
pulses, rupture speed, peak slip rate, rise time and cumulated slip increase with increasing
S. For self-similar pulses, rupture speed and slip gradient decrease with increasing S, and
the healing front speed does not depend significantly on S and remains close but slower
than the Rayleigh speed.
We found that rupture initiation requires a minimal nucleation size that depends ex-
ponentially on the relative strength S. The selection between crack and pulse behavior
depends on the size of the nucleation zone. Our results support the possibility of repeated
D R A F T August 7, 2012, 7:54pm D R A F T

GABRIEL ET AL.: DYNAMIC RUPTURE STYLES X - 33
slip due to multiple rupture fronts during an earthquake, under conditions intermediate
between pure pulse-like and crack-like behavior. Supershear ruptures under velocity-
weakening friction require lower S than under slip-weakening, generate high-frequency
radiation during transition and can be triggered also by initially pulse-like ruptures. Rup-
tures involving back-propagating fronts were also found. In an intrinsically heterogeneous
natural environment, earthquakes may not be restricted to a single rupture style but
rather involve complex rupture patterns with multiple rupture fronts and multiple styles.
Even if some propagation styles transition soon into a style present over a larger param-
eter range, the physical transition processes and macroscopic source properties implied
by each mode are important to understand. For example, we can speculate that if actual
earthquakes start under minimal but favorable nucleation energies, the steady-state pulse,
a rupture style which is found only in a narrow parameter range in our models, may well
occur in actual earthquakes, at least transiently.
Our study is limited to homogeneous initial stresses. While the fundamental rupture
styles found here are expected to manifest themselves also under heterogeneous initial
stresses, the robustness of the transition behaviors with respect to stress heterogeneities
is an important question to be investigated in future work.
The quantitative analysis of the conditions and physical mechanisms for a variety of rup-
ture behavior is of interest for a broad audience in earthquake science, including laboratory
studies of rock friction and seismological observations of earthquake source complexity.
The complex rupture patterns studied here warrant further developments in earthquake
source imaging. The detection of rupture style and its transitions may help elucidating
the state of stress and strength of active fault zones. Our results will be a starting point
D R A F T August 7, 2012, 7:54pm D R A F T

X - 34 GABRIEL ET AL.: DYNAMIC RUPTURE STYLES
to study the effect of rupture style on measurable earthquake source properties and strong
ground motion.
Acknowledgements
This work was supported by Pacific Gas and Electrics and by the National Science Foun-
dation (grant EAR-0944288) and by the Southern California Earthquake Center (which is
funded by NSF EAR-0106924 and USGS 02HQAG0008 cooperative agreements). We are
grateful to Shiang-Jong Lee for providing his finite source models, and to the Editor, As-
sociate Editor, S.M. Day and anonymous reviewers for their constructive comments. We
acknowledge the research computing facilities and support at King Abdullah University
of Science (KAUST). This is SCEC contribution number 1654.
References
Ampuero, J. P. (2008), SEM2DPACK, A spectral element method tool for 2D wave prop-
agation and earthquake source dynamics, Users guide, version 2.3.0.
Ampuero, J. P., and Y. Ben-Zion (2008), Cracks, pulses and macroscopic asymmetry of
dynamic rupture on a bimaterial interface with velocity-weakening friction, Geophys. J.
Int., 173 (2), 674–692, doi:10.1111/j.1365-246X.2008.03736.x.
Andrews, D. (1985), Dynamic plane-strain shear rupture with a slip-weakening friction
law calculated by a boundary integral method, Bull. Seismol. Soc. Am., 75 (1), 1–21,
doi:10.1.1.114.5819.
Andrews, D. J. (1976), Rupture velocity of plane strain shear cracks, J. Geophys. Res.,
81, 5679–5689, doi:10.1029/JB081i032p05679.
D R A F T August 7, 2012, 7:54pm D R A F T

GABRIEL ET AL.: DYNAMIC RUPTURE STYLES X - 35
Andrews, D. J. (1999), Test of two methods for faulting in finite-difference calculations,
Bull. Seismol. Soc. Am., 89 (4), 931–937.
Andrews, D. J., and Y. Ben-Zion (1997), Wrinkle-like slip pulse on a fault between different
materials, J. Geophys. Res., 102, 553–572, doi:10.1029/96JB02856.
Aochi, H., and S. Ide (2005), Earthquakes as multiscale dynamic ruptures with heteroge-
neous fracture surface energy, J. Geophys. Res., 110, 11,303, doi:10.1029/2004JB003591.
Archuleta, R. J. (1984), A faulting model for the 1979 Imperial Valley earthquake, J.
Geophys. Res., 89, 4559–4586, doi:10.1029/JB089iB06p04559.
Beeler, N., T. Tullis, and D. Goldsby (2008), Constitutive relationships and physical
basis of fault strength due to flash heating, J. Geophys. Res., 113 (12), 1401–+, doi:
10.1029/2007JB004988.
Beeler, N. M., and T. E. Tullis (1996), Self-healing slip pulses in dynamic rupture models
due to velocity-dependent strength, Bull. Seismol. Soc. Am., 86 (4), 1130–1148.
Beroza, G. C., and T. Mikumo (1996), Short slip duration in dynamic rupture in the
presence of heterogeneous fault properties, J. Geophys. Res., 101, 22,449–22,460, doi:
10.1029/96JB02291.
Beroza, G. C., and P. Spudich (1988), Linearized inversion for fault rupture behavior:
application to the 1984 Morgan Hill, California, earthquake, J. Geophys. Res., 93 (B6),
6275–6296, doi:10.1029/JB093iB06p06275.
Bizzarri, A. (2010), How to promote earthquake ruptures: Different nucleation strategies
in a dynamic model with slip-weakening friction, Bull. Seismol. Soc. Am., 100, 923–940,
doi:10.1785/0120090179.
D R A F T August 7, 2012, 7:54pm D R A F T

X - 36 GABRIEL ET AL.: DYNAMIC RUPTURE STYLES
Bouchon, M., H. Karabulut, M.-P. Bouin, J. Schmittbuhl, M. Vallee, R. Archuleta, S. Das,
F. Renard, and D. Marsan (2010), Faulting characteristics of supershear earthquakes,
Tectonophysics, 493 (3-4), 244–253, doi:10.1016/j.tecto.2010.06.011.
Brune, J. N. (1970), Tectonic stress and the spectra of seismic shear waves from earth-
quakes, J. Geophys. Res., 75 (26), 4997–5009, doi:10.1029/JB075i026p04997.
Burridge, R. (1973), Admissible speeds for plane-strain self-similar shear cracks with
friction but lacking cohesion, Geophys. J. Int., 35, 439–455, doi:10.1111/j.1365-
246X.1973.tb00608.x.
Campillo, M., J. C. Gariel, K. Aki, and F. J. Sanchez-Sesma (1989), ”Destructive strong
ground motion in Mexico city: Source, path, and site effects during great 1985 Michoa-
can earthquake”, Bull. Seismol. Soc. Am., 79 (6), 1718–1735.
Cochard, A., and R. Madariaga (1994), Dynamic faulting under rate-dependent friction,
Pure Appl. Geophys., 142 (3-4), 419–445, doi:10.1007/BF00876049.
Cochard, A., and R. Madariaga (1996), Complexity of seismicity due to highly rate-
dependent friction, J. Geophys. Res., 101 (B11), 25,321–25,336, doi:10.1029/96JB02095.
Coker, D., G. Lykotrafitis, A. Needleman, and A. Rosakis (2005), Frictional sliding modes
along an interface between identical elastic plates subject to shear impact loading, J.
Mech. Phys. Solids, 53 (4), 884 – 922, doi:10.1016/j.jmps.2004.11.003.
Dalguer, L. A., and S. M. Day (2007), Staggered-grid split-node method for spontaneous
rupture simulation, J. Geophys. Res., 112 (11), B02,302, doi:10.1029/2006JB004467.
Dalguer, L. A., and S. M. Day (2009), Asymmetric rupture of large aspect-ratio
faults at bimaterial interface in 3D, Geophys. Res. Lett., 36, 23,307–+, doi:
10.1029/2009GL040303.
D R A F T August 7, 2012, 7:54pm D R A F T

GABRIEL ET AL.: DYNAMIC RUPTURE STYLES X - 37
Das, S., and K. Aki (1977a), A numerical study of two-dimensional spontaneous rup-
ture propagation, Geophys. J. Roy. Astr. S., 50 (3), 643–668, doi:10.1111/j.1365-
246X.1977.tb01339.x.
Das, S., and K. Aki (1977b), Fault plane with barriers: A versatile earthquake model, J.
Geophys. Res., 82 (36), 5658–5670, doi:10.1029/JB082i036p05658.
Day, S. M. (1982), Three-dimensional finite difference simulation of fault dynamics: Rect-
angular faults with fixed rupture velocity, Bull. Seismol. Soc. Am., 72 (3), 705–727.
Day, S. M., and G. P. Ely (2002), Effect of a shallow weak zone on fault rupture: Numerical
simulation of scale-model experiments, Bull. Seismol. Soc. Am., 92 (8), 3022–3041, doi:
10.1785/0120010273.
Day, S. M., G. Yu, and D. J. Wald (1998), Dynamic stress changes during earthquake
rupture, Bull. Seismol. Soc. Am., 88 (2), 512–522.
Di Carli, S., C. Francois-Holden, S. Peyrat, and R. Madariaga (2010), Dynamic inversion
of the 2000 Tottori earthquake based on elliptical subfault approximations, J. Geophys.
Res., 115 (B12), 1–14, doi:10.1029/2009JB006358.
Di Toro, G., T. Hirose, S. Nielsen, G. Pennacchioni, and T. Shimamoto (2005), Natural
and experimental evidence of melt lubrication of faults during earthquakes, Eos Trans.
AGU, Fall Meet. Suppl., Abstract T13E-02.
Dunham, E. (2007), Conditions governing the occurrence of supershear ruptures under
slip-weakening friction, Geophys. J. Int., 112 (B7), 1–24, doi:10.1029/2006JB004717.
Dunham, E. M., and R. J. Archuleta (2004), Evidence for a supershear transient during
the 2002 Denali Fault Earthquake, Bull. Seismol. Soc. Am., 94 (6B), S256–268, doi:
10.1785/0120040616.
D R A F T August 7, 2012, 7:54pm D R A F T

X - 38 GABRIEL ET AL.: DYNAMIC RUPTURE STYLES
Dunham, E. M., D. Belanger, L. Cong, and J. E. Kozdon (2011), Earthquake ruptures
with strongly rate-weakening friction and off-fault plasticity: 1. Planar faults, Bull.
Seismol. Soc. Am., 101 (5), 2296–2307, doi:10.1785/0120100075.
Festa, G., and J. Vilotte (2006), Influence of the rupture initiation on the intersonic
transition: Crack-like versus pulse-like modes, Geophys. Res. Lett., , 33, 15,320–+,
doi:10.1029/2006GL026378.
Freund, L. (1990), Dynamic fracture mechanics, Cambridge Monographs on Mechanics
and Applied Mathematics, Cambridge University Press.
Harris, R. A., et al. (2004), The source physics of large earthquakes - Validating sponta-
neous rupture methods, Eos Trans. AGU, pp. A5+, Fall Meet. Suppl., Abstract S12A-
05.
Heaton, T., S. Minson, and M. Simons (2011), Characterization of the slip pulse for the
2010 M 8.8 Maule Earthquake, Eos Trans. AGU, pp. B3+, Fall Meet. Suppl., Abstract
S11A-2193.
Heaton, T. H. (1990), Evidence for and implications of self-healing pulses of slip in earth-
quake rupture, Phys. Earth Planet. In., 64 (1), 1 – 20, doi:10.1016/0031-9201(90)90002-
F.
Hirose, T., and T. Shimamoto (2005), Slip-weakening distance of faults during frictional
melting as inferred from experimental and natural pseudotachylytes, Bull. Seismol. Soc.
Am., 95 (5), 1666–1673, doi:10.1785/0120040131.
Huang, Y., and J.-P. Ampuero (2011), Pulse-like ruptures induced by low-velocity fault
zones, J. Geophys. Res., 116, doi:10.1029/2011JB008684.
D R A F T August 7, 2012, 7:54pm D R A F T

GABRIEL ET AL.: DYNAMIC RUPTURE STYLES X - 39
Hudnut, K. W. (2011), The 4 April 2010 El Mayor-Cucapah earthquake
source, from initial glimpse to synoptic overview, presented at the 2011
SCEC Annual Meeting, Palm Springs, California, Sept. 11-14, workshop on
“El Mayor-Cucapah Science and Earthquake Response”, available online at
http://www.scec.org/meetings/2011am/emc.html.
Ida, Y. (1972), Cohesive force across the tip of a longitudinal-shear crack and griffith’s spe-
cific surface energy, J. Geophys. Res., 77 (20), 3796–3805, doi:10.1029/JB077i020p03796.
Ide, S., G. C. Beroza, and J. J. McGuire (2005), Imaging earthquake source complexity,
Geoph. Monog. Series, 157, 117–135.
Johnson, E. (1992), The influence of the lithospheric thickness on bilateral slip, Geophys.
J. Int., 108, 151160, doi:10.1111/j.1365-246X.1992.tb00846.x.
Kaneko, Y., and N. Lapusta (2008), Variability of earthquake nucleation in continuum
models of rate-and-state faults and implications for aftershock rates, J. Geophys. Res.,
113 (12), B12312, doi:10.1029/2007JB005154.
Kaneko, Y., and N. Lapusta (2010), Supershear transition due to a free surface in 3D sim-
ulations of spontaneous dynamic rupture on vertical strike-slip faults, Tectonophysics,
493 (3-4), 272–284, doi:10.1016/j.tecto.2010.06.015.
Kaneko, Y., N. Lapusta, and J.-P. Ampuero (2008), Spectral element modeling of spon-
taneous earthquake rupture on rate and state faults: Effect of velocity-strengthening
friction at shallow depths, J. Geophys. Res., 113 (B9), 1–17, doi:10.1029/2007JB005553.
Komatitsch, D., and J. Tromp (1999), Introduction to the spectral-element method for
3-D seismic wave propagation, Geophys. J. Int., 139 (3), 806–822, doi:10.1046/j.1365-
246x.1999.00967.x.
D R A F T August 7, 2012, 7:54pm D R A F T

X - 40 GABRIEL ET AL.: DYNAMIC RUPTURE STYLES
Komatitsch, D., and J. P. Vilotte (1998), The spectral-element method: an efficient tool
to simulate the seismic response of 2D and 3D geological structures, Bull. Seismol. Soc.
Am., 88 (2), 368–392.
Kostrov, B. V. (1964), Self similar problems of propagation of shear cracks, J. Appl. Math.
Mech-USS, 28 (5), 1077 – 1087, doi:10.1016/0021-8928(64)90010-3.
Lapusta, N. (2005), Modes of dynamic rupture on interfaces with nonlinear rate and state
friction laws, in Proc. Int. Frac., Turin, Italy., Turin, Italy.
Lapusta, N., and J. R. Rice (2003), Nucleation and early seismic propagation of small
and large events in a crustal earthquake model, J. Geophys. Res., 108, 2205, doi:
10.1029/2001JB000793.
Lee, S.-J., K.-F. Ma, and H.-W. Chen (2006), Three-dimensional dense strong motion
waveform inversion for the rupture process of the 1999 chi-chi, taiwan, earthquake, J.
Geophys. Res., 111, B11,308, doi:10.1029/2005JB004097.
Lee, S.-J., B.-S. Huang, M. Ando, H.-C. Chiu, and J.-H. Wang (2011), Evidence of large
scale repeating slip during the 2011 Tohoku-Oki earthquake, Geophys. Res. Lett., , 38,
L19306, doi:10.1029/2011GL049580.
Lu, X., N. Lapusta, and A. J. Rosakis (2007), Pulse-like and crack-like ruptures in ex-
periments mimicking crustal earthquakes., P. Natl. Acad. Sci. USA, 104 (48), 18,931–6,
doi:10.1073/pnas.0704268104.
Lu, X., N. Lapusta, and A. J. Rosakis (2009), Analysis of supershear transition regimes
in rupture experiments: the effect of nucleation conditions and friction parameters,
Geophys. J. Int., 177, 717–732, doi:10.1111/j.1365-246X.2009.04091.x.
D R A F T August 7, 2012, 7:54pm D R A F T

GABRIEL ET AL.: DYNAMIC RUPTURE STYLES X - 41
Lykotrafitis, G., A. J. Rosakis, and G. Ravichandran (2006), Self-healing pulse-like shear
ruptures in the laboratory, Science, 313 (5794), 1765–1768, doi:10.1126/science.1128359.
Madariaga, R. I., C. Vigny, M. Lancieri, S. Ruiz, J. A. Campos, and The Montessus de
Ballore International Laboratory (2010), The February 27, 2010 Mw 8.8 Maule Earth-
quake as observed by cGPS and strong motion instruments (Invited), Eos Trans. AGU,
pp. B3+, Fall Meet. Suppl., Abstract U21B-03.
Mavroeidis, G. P., and A. S. Papageorgiou (2010), Effect of fault rupture character-
istics on near-fault strong ground motions, Bull. Seismol. Soc. Am., 100 (1), 37–58,
doi:10.1785/0120090018.
Meng, L., J.-P. Ampuero, M. T. Page, and K. W. Hudnut (2011), Seismological evidence
and dynamic model of reverse rupture propagation during the 2010 M7.2 El Mayor -
Cucapah earthquake, Eos Trans. AGU, Fall Meet. Suppl., Abstract S52B-04.
Nielsen, S., and R. Madariaga (2003), On the self-healing fracture mode, Bull. Seismol.
Soc. Am., 93 (6), 2375–2388.
Nielsen, S., G. Di Toro, T. Hirose, and T. Shimamoto (2008), Frictional melt and seismic
slip, J. Geophys. Res., 113, B01,308, doi:10.1029/2007JB005122.
Nielsen, S., J. Taddeucci, and S. Vinciguerra (2010), Experimental observation of
stick-slip instability fronts, Geophys. J. Int., 180 (2), 697–702, doi:10.1111/j.1365-
246X.2009.04444.x.
Nielsen, S. B., and J. M. Carlson (2000), Rupture pulse characterization: Self-healing, self-
similar, expanding solutions in a continuum model of fault dynamics, Bull. Seismol. Soc.
Am., 90 (6), 1480–1497, doi:10.1785/0120000021.
D R A F T August 7, 2012, 7:54pm D R A F T

X - 42 GABRIEL ET AL.: DYNAMIC RUPTURE STYLES
Nielsen, S. B., and K. B. Olsen (2000), Constraints on stress and friction from dynamic
rupture models of the 1994 Northridge, California, earthquake, Pure Appl. Geophys.,
157, 2029–2046, doi:10.1007/PL00001073.
Nielsen, S. B., J. M. Carlson, and K. B. Olsen (2000), Influence of friction and
fault geometry on earthquake rupture, J. Geophys. Res., 105 (B3), 60696088, doi:
10.1029/1999JB900350.
Noda, H., and N. Lapusta (), Three-dimensional earthquake sequence simulations with
evolving temperature and pore pressure due to shear heating: Effect of heterogeneous
hydraulic diffusivity, J. Geophys. Res.
Noda, H., E. M. Dunham, and J. R. Rice (2009), Earthquake ruptures with thermal
weakening and the operation of major faults at low overall stress levels, J. Geophys.
Res., 114 (B7), 1–27, doi:10.1029/2008JB006143.
Oglesby, D. D., and S. M. Day (2002), Stochastic fault stress: implications for fault
dynamics and ground motion, Bull. Seismol. Soc. Am., 92 (8), 3006–3021.
Page, M., P. M. Mai, and D. Schorlemmer (2011), Testing earthquake source inversion
methodologies, EOS Trans. AGU, 92, 75–75, doi:10.1029/2011EO090007.
Perrin, G., J. R. Rice, and G. Zheng (1995), Self-healing slip pulse on a frictional surface,
J. Mech. Phys. Solids, 43 (9), 1461–1495, doi:10.1016/0022-5096(95)00036-I.
Peyrat, S., K. Olsen, and R. Madariaga (2001), Dynamic modeling of the 1992 Landers
earthquake, J. Geophys. Res., 106, 26,467–26,482, doi:10.1029/2001JB000205.
Rice, J. R. (2006), Heating and weakening of faults during earthquake slip, J. Geophys.
Res., 111 (10), 5311–+, doi:10.1029/2005JB004006.
D R A F T August 7, 2012, 7:54pm D R A F T

GABRIEL ET AL.: DYNAMIC RUPTURE STYLES X - 43
Samudrala, O., Y. Huang, and A. J. Rosakis (2002), Subsonic and intersonic shear rupture
of weak planes with a velocity weakening cohesive zone, J. Geophys. Res., 107, 2170,
doi:10.1029/2001JB000460.
Shi, Z., Y. Ben-Zion, and A. Needleman (2008), Properties of dynamic rupture and energy
partition in a solid with a frictional interface, J. Mech. Phys. Solids, 56 (1), 5–24, doi:
10.1016/j.jmps.2007.04.006.
Spudich, P., and E. Cranswick (1984), Direct observation of rupture propagation during
the 1979 imperial valley earthquake using a short baseline accelerometer array, Bull.
Seismol. Soc. Am., 74 (6), 2083–2114.
Tan, Y., and D. Helmberger (2010), Rupture directivity characteristics of the 2003 Big
Bear sequence, Bull. Seismol. Soc. Am., 100 (3), 1089–1106, doi:10.1785/0120090074.
Templeton, E. L., and J. R. Rice (2008), Off-fault plasticity and earthquake rupture dy-
namics: 1. dry materials or neglect of fluid pressure changes, J. Geophys. Res., 113 (B9),
1–19, doi:10.1029/2007JB005529.
Tsutsumi, A., and T. Shimamoto (1997), High-velocity frictional properties of gabbro,
Geophys. Res. Lett., , 24 (6), 699, doi:10.1029/97GL00503.
Tullis, T. E., and D. L. Goldsby (2003), Flash melting of crustal rocks at almost seismic
slip rates, Eos Trans. AGU, pp. B5+, Fall Meet. Suppl., Abstract S51B-05.
Venkataraman, A. and H. Kanamori (2004), Observational constraints on the frac-
ture energy of subduction zone earthquakes, J. Geophys. Res., 109 (B18), 5302, doi:
10.1029/2003JB002549.
Wald, D. J., D. V. Helmberger, and S. H. Hartzell (1990), Rupture process of the 1987
Superstition Hills Earthquake from the inversion of strong-motion data, Bull. Seismol.
D R A F T August 7, 2012, 7:54pm D R A F T

X - 44 GABRIEL ET AL.: DYNAMIC RUPTURE STYLES
Soc. Am., 80 (5), 1079–1098+.
Wibberley, C. A. J., and T. Shimamoto (2005), Earthquake slip weakening and asperities
explained by thermal pressurization, Nature, 436, 689–692, doi:10.1038/nature03901.
Xia, K., A. J. Rosakis, and H. Kanamori (2004), Laboratory earthquakes:
The sub-Rayleigh-to-supershear rupture transition, Science, 303, 1859–1862, doi:
10.1126/science.1094022.
Yao, H., P. Gerstoft, P. M. Shearer, and C. Mecklenbr auker (2011), Compressive sensing
of the Tohoku-Oki Mw 9.0 earthquake: Frequency-dependent rupture modes, Geophys.
Res. Lett., 38, 20,310, doi:10.1029/2011GL049223.
Yomogida, K. (1988), Crack-like rupture processes observed in near-fault strong motion
data, Geophys. Res. Lett., 15, 1223–1226, doi:10.1029/GL015i011p01223.
Zheng, G., and J. Rice (1998), Conditions under which velocity-weakening friction allows
a self-healing versus a cracklike mode of rupture, Bull. Seismol. Soc. Am., 88 (6), 1466–
1483.
D R A F T August 7, 2012, 7:54pm D R A F T

GABRIEL ET AL.: DYNAMIC RUPTURE STYLES X - 45
Appendix A: Non-healing nucleation
We extend our study of the influence of nucleation on dynamic rupture style by con-
sidering a second, non-healing nucleation procedure. In this nucleation “procedure 2”,
we impose time-weakening without subsequent healing, as introduced by [Andrews , 1985].
The nucleation zone expands with constant rupture speed Vn up to duration T and final
half-size Rmax = VnT :
R(t) =
{Vnt for 0 ≤ t ≤ T
Rmax for t ≥ T.(A1)
The shape of the nucleation zone resulting from Eq. A1 is depicted in Figs. 16 (a)
and (b). Healing is prevented in the nucleation region. The previously introduced heal-
ing nucleation “procedure 1” and the newly defined non-healing “procedure 2” represent
two extreme cases of frictional behavior: a transient weakening process with subsequent
healing and an irreversible weakening process.
We ran the same set of simulations of Sec. 2.5 applying the non-healing nucleation
“procedure 2”. We found that the nucleation type does not affect significantly the rupture
transition processes. Both nucleation procedures result in the same qualitative dependence
of rupture style on S and Rmax (Fig. 16 (c)). They differ slightly in the size Rmax required
to trigger equivalent rupture styles at a given level of S. For example, “procedure 1”
requires larger nucleations to reach steady state compared to “procedure 2”, especially
at small values of Rmax for which the two procedures prescribe significantly different
nucleation front evolutions. This can be attributed to the lesser amount of energy provided
by “procedure 1” due to the onset of artificial healing. The range of values of Rmax and
S allowing sustained pulses is considerably narrower for “procedure 2” because it forces
the nucleation region to remain weak even after the end of nucleation.
D R A F T August 7, 2012, 7:54pm D R A F T

X - 46 GABRIEL ET AL.: DYNAMIC RUPTURE STYLES
Under nucleation “procedure 2”, the absence of prescribed healing favors reactivation
of slip at the hypocenter and the pulse-crack boundary in Fig. 16 (c) remains closer to
Spulse than with nucleation “procedure 1” (Fig. 5).
Appendix B: On the Low Critical S Value for Supershear Transition
We found in Section 3.6 that the supershear transition requires S < Sss ≈ 1, significantly
lower than under slip-weakening friction (Sss = 1.77). We show here that such low Sss
values can be attributed to the typically incomplete dynamic strength drop under velocity-
weakening friction, and attempt to derive a more appropriate predictor for supershear
transition.
The dynamic stress achieved in our simulations is higher than the nominal dynamic
stress, τd, involved in the definition Eq. 7. The inset of Fig. 17 shows that the dynamic
stress inside a typical subshear crack reaches its minimum at the tail of the process
zone and has a maximum near the hypocenter. To estimate higher and lower bounds
on the effective S (Smax and Smin, respectively) we replace τd in Eq. 7 by, respectively,
the maximum and minimum stress actually achieved inside a crack during a simulation.
These bounds are reported in Fig. 17 for a range of nominal S values. Remarkably, the
low values Sss ≈ 1 in our velocity-weakening crack simulations correspond to Smax ≈ 1.77,
the critical value for slip-weakening cracks.
To predict if a rupture will become supershear under a given background stress, we
define an effective relative strength parameter Seff that can be evaluated a priori. We
replace the nominal stress drop τ0 − τd in Eq. 7 by an estimate of the stress drop at the
D R A F T August 7, 2012, 7:54pm D R A F T

GABRIEL ET AL.: DYNAMIC RUPTURE STYLES X - 47
center of a crack [Zheng and Rice, 1998]:
∆τ = µVdyna/2cS (B1)
where Vdyna is the solution of
τ0 −µ
2cSVdyna = σµss(Vdyna) (B2)
The steady state friction coefficient µss is given by Eq. 3. We found that Seff is compa-
rable to the lower bound Smin derived from the numerical simulations (Fig. 17).
Appendix C: Fracture Mechanical Aspects of Rupture Speed and Peak Slip
Velocity
Insight on the evolution of peak slip rate V and rupture speed vr as a function of
propagation distance x is developed here from fracture mechanics considerations. The
fracture energy dissipated by our adopted friction law is [Eq. C4 of Ampuero and Ben-
Zion, 2008]:
Gc = σbDcV
Vc
ln(1 + VVc
)
(1 + VVc
). (C1)
where V is the peak slip rate, reached near the trailing edge of the process zone. At large
slip rate, V � Vc, we obtain
Gc(V ) ≈ σbDc ln(V/Vc). (C2)
The balance between the energy release rate G and the fracture energy Gc provides an
equation of motion for the rupture front [Freund , 1990]:
(τ0 − τmin)2(1− ν)
g(vr)2µk2(vh, vr) x = Gc(V ) (C3)
where x is the rupture propagation distance, vr = x is the rupture speed, g is a dimen-
sionless function of rupture speed and k is a dimensionless function of rupture speed and
D R A F T August 7, 2012, 7:54pm D R A F T

X - 48 GABRIEL ET AL.: DYNAMIC RUPTURE STYLES
(for self-similar pulses) of healing speed vh. Moreover, peak slip rate and rupture speed
are related by Ida [1972]:
V ∝ vr(τs − τmin)(1− ν)
g(vr)µ(C4)
For self-similar pulses and cracks k2/g ∝√
1− vr/cR and g ∝√
1− vr/cR when vr ≈ cR
[Freund , 1990; Nielsen and Madariaga, 2003], which implies:
x ∝ ln (V/Vc)√1− vr/cR
(C5)
and
V ∝ vr(τs − τmin)(1− ν)√1− vr/cRµ
(C6)
We infer from this that the rupture speed of sub-shear cracks and growing pulses accel-
erates towards the Rayleigh speed cR, and that the growth of peak slip rate as a function
of rupture propagation distance satisfies the following relation:
V ln (V/Vc) ∝ x. (C7)
Simple scaling factors in this relation seemingly provide fits for all rupture styles in our
models (Fig. 9).
D R A F T August 7, 2012, 7:54pm D R A F T

GABRIEL ET AL.: DYNAMIC RUPTURE STYLES X - 49
Table 1. Reference simulation parameters
cS Shear wave speed 1ν Poisson’s ratio 0.25µs Static friction coefficient. 0.6µd Dynamic friction coefficient. 0.1a Direct effect coefficient. 0.005b Evolution effect coefficient. 0.505µ Shear modulus 1Vc Characteristic frictional velocity scale 0.07Dc Characteristic frictional slip scale 1σ Background normal stress 2τ0 Background shear stress 0.4-1Λ Weakening length 1Vn Nucleation speed 0.5X Distance scaling factor 1XcS
Time scaling factor 1
τD Strength drop 1h Spectral element size 1T Nucleation duration 1-400Rmax Nucleation half-size 0.5-200S Relative strength 0.25-4
Table 2. Example parameters.
cS Shear wave speed 3700 m/sµ Shear modulus 37 GPaDc Characteristic slip scale 5.4 mmσ Background effective normal stress 40 MPaτ0 Background shear stress 8-20MPa
Figure 1. Nucleation with healing. Prescribed time-weakening friction coefficient µf . (a)
Spatio-temporal shape of nucleation area. Nucleation has duration 4 T and propagates with
decreasing speed from an initial value Vn. The nucleation zone reaches a maximum half-size
Rmax = Vn T . (b) Prescribed spatial distribution of µf at t = 2T during nucleation.
D R A F T August 7, 2012, 7:54pm D R A F T

X - 50 GABRIEL ET AL.: DYNAMIC RUPTURE STYLES
Figure 2. Typical rupture styles. Spatial distribution of slip at regular times and a snapshot
of slip rate as inset for (a) a decaying pulse, (b) a steady-state pulse, (c) a growing pulse, (d) a
superposition of a pulse and a crack, (e) a subshear crack and (f) a superposition of a subshear
crack and a supershear crack. (b),(d) and (f) are transitional rupture styles separating rupture
styles in (a), (c) and (e), respectively. The maximum nucleation half-size Rmax = 4.4925 is
indicated by a red line in the bottom left of each plot.
Figure 3. Rupture styles and their transitions as a function of S (a) or Rmax (b). (a) Slip
profiles at t = 200 for simulations with fixed Rmax = 4.4925 and varying relative strength S.
Each curve corresponds to a different value of S indicated in the legend. Transitional styles
are highlighted and are also summarized on the left S scale. The steady-state pulse (solid line)
separates decaying and growing pulses. Superpositions of a primary pulse and a secondary
crack nucleated at the hypocenter appear in an intermediate regime between pure pulses and
pure cracks. The labels (a-f) correspond to the examples shown in Figure 2. (b) Same plot
for simulations with fixed S = 1 and varying Rmax (see the legend). Note the appearance of
a secondary steady-state pulse at Rmax = 8.456995. The maximum half-size of the nucleation
zone, Rmax, is indicated by squared brackets for each simulation.
Figure 4. Evolution of rupture velocity vr as a function of rupture propagation distance
for different rupture styles with self-healing nucleation of varying maximum half-size Rmax and
S = 1. Transitional styles are highlighted. Steady-state pulses propagate with vr ≈ 0.6cS,
growing pulses and cracks with vr ≈ cR (Rayleigh speed) and supershear ruptures with vr ≈ cP .
D R A F T August 7, 2012, 7:54pm D R A F T

GABRIEL ET AL.: DYNAMIC RUPTURE STYLES X - 51
Figure 5. Summary of rupture styles as a function of S and Rmax after nucleation with pre-
scribed healing. Each small dot indicates one simulation out of a total of about 450 simulations
carried out to compose this diagram. The curves indicate the S-Rmax conditions at the transi-
tions between rupture styles in order of appearance in the legend: transition between decaying
and growing pulses (steady-state pulse), transition between pure pulses and mixed pulse-crack
ruptures, transition between pulse-crack superpositions and pure cracks, transition between sub-
shear and supershear ruptures (when supershear happens at t < 1000). Along most transition
boundaries Rmax depends roughly exponentially on S. The theoretical maximum S that allows
cracks [Zheng and Rice, 1998] is indicated as Spulse. The maximum S that allows supershear
ruptures is close to 1 and depends weakly on Rmax.
Figure 6. Properties of steady-state pulse-like ruptures. Slip, peak slip rate, rise time and
rupture velocity during steady-state pulse propagation as a function of relative strength S.
Figure 7. Transition distances for supershear transition, the onset of pulse-crack superposition
and steady-state transition, as a function of S for (a) Rmax = 4.4925 and (b) Rmax = 50.
Figure 8. Asymptotic properties of growing pulses as a function of S: (a) gradient of slip and
(c) rupture and healing front velocities.
Figure 9. Peak slip rate evolution for a growing pulse, a crack, a supershear secondary crack
and a supershear secondary pulse. Examples for S = 0.923 and Rmax given in the legend. The
growth of peak slip rate V as a function of rupture propagation distance x is consistent with a
prediction based on fracture mechanics arguments (fit shown for the growing pulse example), see
Appendix C.
D R A F T August 7, 2012, 7:54pm D R A F T

X - 52 GABRIEL ET AL.: DYNAMIC RUPTURE STYLES
Figure 10. Pulse-crack transition. Spatial distribution of slip rate (blue) and shear-stress
(red) at different times (indicated on the right of each plot) for an example of growing pulse that
triggers a crack at the hypocenter (case S = 0.9395 and Rmax = 4.4925).
Figure 11. Nucleation of multiple sub- and supershear fronts. Spatio-temporal evolution of
slip rate (left) and shear stress change (right). Nucleation areas are marked in red. (a) A growing
pulse triggers a subshear crack at t ≈ 150, which in turn nucleates a supershear crack at t ≈ 350
(case S = 0.9394 and Rmax = 4.4925). (b) A steady pulse transitions into an asymmetric bilateral
crack at t ≈ 135, which in turn nucleates supershear cracks at its forward- and back-propagating
fronts (case S = 0.67 and Rmax = 2.38).
Figure 12. Supershear ruptures triggered by a primary pulse. Spatio-temporal evolution of
slip rate (left) and shear stress change (right). Nucleation areas are marked in red. The resulting
supershear rupture can be a pulse, as shown in (a) for the case S = 1 and Rmax = 25, or a crack
as shown in (b) for the case S = 1 and Rmax = 10.63.
D R A F T August 7, 2012, 7:54pm D R A F T

GABRIEL ET AL.: DYNAMIC RUPTURE STYLES X - 53
Figure 13. Rupture velocity of supershear fronts. (a) Final rupture speed as a function of S
in supershear ruptures with S and Rmax close to the supershear transition boundary of Fig. 5.
Also shown are a supershear pulse and a supershear crack from a primary pulse at S = 1. The
final rupture speed is close to the P wave speed and decreases slightly with increasing S. The
styles of the primary and supershear ruptures do not affect rupture speed.
Figure 14. Rupture styles as a function of the characteristic slip velocity Vc of the velocity-
weakening friction law. (a) Slip at time t = 200 for ruptures with S = 1, Rmax = 4.4925 and
different values of Vc indicated in the legend. The rupture style transitions are summarized along
the Vc scale on the left. (b) Conditions for rupture style transitions as a function of S and Vc for
Rmax = 4.4925.
Figure 15. Re-activation of slip inferred for two large earthquakes. (a) The Tohoku-Oki
(Japan) 2011 earthquake: spatio-temporal distribution of moment rate at the hypocentral lati-
tude (38◦) from the source inversion model by [Lee et al., 2011] based on strong motion, teleseismic
and GPS data. (b) The Chi-Chi (Taiwan) 1999 earthquake: spatio-temporal distribution of slip
rate of all subfaults shallower than 10 km from the source inversion model by [Lee et al., 2006].
For both events the source inversion assumes multiple time windows in slip rate. The red lines
indicate interpreted multiple rupture fronts.
D R A F T August 7, 2012, 7:54pm D R A F T

X - 54 GABRIEL ET AL.: DYNAMIC RUPTURE STYLES
Figure 16. (a) Nucleation “procedure 2” without healing. It has duration T , expands
at constant speed Vn, and reaches a maximum half-size Rmax = Vn T . (b) Prescribed spatial
distribution of µf at t = T . (c) Summary of rupture styles as a function of S and Rmax for
nucleation “procedure 2”, similar to Fig. 5.
Figure 17. Theoretical estimate of an effective relative strength, Seff , as a function of nominal
S, compared to low and high bounds on effective S based on the minimal and maximal stress
drop measured in the simulations. We consider only subshear cracks with values of S and Rmax
very close to the supershear transition. Inset: the shear stress distribution along the fault for a
typical subshear crack.
D R A F T August 7, 2012, 7:54pm D R A F T