the treatment of federal receipts and expenditures in … · national income and product accounts...
TRANSCRIPT

CBO
The Treatment of Federal Receipts and Expenditures in the National Income and
Product Accounts
September 2006
A
P A P E R
The Congress of th
e United States O Congressional Budget Office

Preface
This report describes how the treatment of federal receipts and expenditures in the national income and product accounts differs from the recording of federal revenues and out-lays in the federal budget, as reported by the Office of Management and Budget. It is one of a series of reports that the Congressional Budget Office (CBO) issues each year to fulfill the requirement of section 202(e) of the Congressional Budget Act of 1974 for CBO to submit to the Committees on the Budget periodic reports about fiscal policy and to provide baseline projections of the federal budget. Most recently, in response to that requirement, CBO issued The Budget and Economic Outlook: An Update (August 2006).
Frank Russek of CBO’s Macroeconomic Analysis Division and Barry Blom and Luis Serna of CBO’s Budget Analysis Division wrote this report under the supervision of Robert Dennis and Bob Sunshine. Christine Bogusz edited and proofread the report, and Maureen Costan-tino prepared it for publication. Lenny Skutnik printed copies of the report, and Simone Thomas prepared the electronic version for CBO’s Web site (www.cbo.gov).
Donald B. MarronActing Director
September 2006

Contents
Conceptual Differences Between the NIPAs’ Federal Sector and the Federal Budget 2
Differences in Accounting for Major Transactions 2
The Measurement of National Saving 2
Capital Transfers and Exchanges of Existing Assets 3
Credit Programs 6
Geographic Coverage 6
Universal Service Fund 6
Interest Receipts 6
Surpluses of Government Enterprises 7
Military Sales and Assistance in-Kind 7
National Flood Insurance Program 7
Timing Differences 7
Business Activities 9
Presentation of the Federal Government’s Receipts and Expenditures in the NIPAs 9
Tables
1.
Relationship of the Budget to the Federal Sector of the National Income and Product Accounts 42.
Projections of Baseline Receipts and Expenditures as Measured by the National Income and Product Accounts 10

The Treatment of Federal Receipts and Expenditures in the National Income and Product Accounts
The fiscal transactions of the federal government are re-corded in two major sets of accounts that are conceptu-ally quite different. The presentation generally used by executive branch agencies and the Congress and typically discussed in the press (and the one followed in the Con-gressional Budget Office’s Budget and Economic Outlook) is the Budget of the United States Government, as reported by the Office of Management and Budget. The budget focuses on cash flows—revenues and outlays, or the col-lection of taxes and fees and the disbursement of cash for the various federal functions. The objectives of the bud-get are to provide information that can assist lawmakers in their policy deliberations; to facilitate the management and control of federal activities; and to help the Depart-ment of the Treasury manage its cash balances and deter-mine its borrowing needs.
The national income and product accounts (NIPAs) also record the federal government’s transactions, but with different objectives. The NIPAs, which are produced by the Bureau of Economic Analysis (BEA), an agency within the Department of Commerce, are intended to provide a comprehensive measure of current production and related income generated by the U.S. economy.1 A well-known measure of current production in the NIPAs is gross domestic product (GDP). The accounts, which are used extensively in macroeconomic analysis, divide the economy into four major sectors—business, govern-
1. The discussion of the national income and product accounts inthis document generally refers to Table 3.2 in the accounts,“Federal Government Current Receipts and Expenditures,”which most closely resembles the presentation in the budget.For other discussions of the NIPAs, see Department of Com-merce, Bureau of Economic Analysis, “Federal Budget Esti-mates for Fiscal Year 2007,” Survey of Current Business(March 2006); and Budget of the United States Government, Fiscal Year 2007: Analytical Perspectives.
ment, household, and the rest of the world (the foreign sector), each with its own set of accounts.2 The federal sector, which is the focus of this document, is one com-ponent of the government sector (the state and local sec-tor is the other component).3 Because the aims of the NIPAs differ from those of the budget, the two account-ing systems treat some government transactions very dif-ferently. On average, the differences cause receipts and expenditures in the NIPAs, as projected by CBO, to be about 3 percent higher than the corresponding budget totals for the 2007-2016 period.
The numbers in this report that derive from the national income and product accounts reflect BEA’s most recent revisions to data in the federal sector. Those historical re-visions, which are usually made in July of each year for the most recent three-year period, were not available when CBO updated its baseline economic projections through 2016.4 Consequently, CBO’s NIPA estimates through 2016 for federal receipts and expenditures do not take into account how BEA’s revisions would have al-tered CBO’s underlying baseline economic projections. CBO’s preliminary assessment, however, indicates that the revised data would be unlikely to have a major impact on the broad outlines of those baseline projections.
2. Some accounts in the NIPAs, such as the domestic capital account (which shows saving and investment), focus on components of gross domestic product or income rather than on a specific sector and bring together relevant information from all four sectors.
3. More formally, BEA regards the federal government and state and local governments as subsectors. The treatment of state and local governments’ transactions in the NIPAs closely resembles that of the federal government’s transactions.
4. See Congressional Budget Office, The Budget and Economic Out-look: An Update (August 2006).

2 THE TREATMENT OF FEDERAL RECEIPTS AND EXPENDITURES IN THE NATIONAL INCOME AND PRODUCT ACCOUNTS
Conceptual Differences Between the NIPAs’ Federal Sector and the Federal BudgetThe budget of the federal government is best understood as an information and management tool. It focuses pri-marily on cash flows, recording for each fiscal period the inflow of revenues and the outflow of spending. The pe-riod of foremost interest in the budget is the federal fiscal year, which runs from October 1 through September 30. There are a few exceptions to the general rule of record-ing transactions on a cash basis, but they are designed to improve the usefulness of the budget as a decisionmaking tool. For example, when the federal government makes direct loans or provides loan guarantees (as with student loans), tracking cash flows would give a misleading view of costs; under what is termed credit reform, the budget records the estimated subsidy costs and federal adminis-trative expenses at the time the loans are made.
The federal sector of the NIPAs possesses none of the planning and management goals of the budget. Instead, it focuses on displaying how the federal government fits into a general economic framework that describes current production and income within specific periods, the major sources of that production, and recipients of income by type. The main periods of interest for the NIPAs are cal-endar years and calendar quarters, although approximate totals for fiscal years can be derived from the quarterly es-timates. (The tables in this document show fiscal year numbers.)
From the perspective of the NIPAs, the federal govern-ment is both a producer and a consumer: its workforce produces government services, and its purchases consume some of the nation’s production. In addition, through its taxes and transfers, the federal government affects the re-sources available to the private sector. The purpose of the NIPAs is to record all of those activities in a consistent manner.
The federal sector of the NIPAs tracks how much the government spends on consumption purchases, and it records the transfer of resources that occurs through taxes, payments to beneficiaries of federal programs, and federal interest payments. The federal sector’s contribu-tion to GDP is presented elsewhere in the NIPAs.5
Differences in Accounting for Major TransactionsThe accounting differences between the NIPAs and the federal budget stem from the conceptual differences dis-cussed above. In attempting to properly incorporate fed-eral transactions into the framework used to determine GDP, the NIPAs reflect judgments about the best treat-ment of such transactions as government investment, sales and purchases of existing assets, federal credit, and federal activities that resemble those of businesses, along with transactions involving U.S. territories. In some cases, the appropriate treatment may be to move a trans-action from the federal sector to another place in the NIPAs or to exclude the transaction from the NIPAs en-tirely. In other cases, the appropriate treatment may in-volve recording as a receipt in the NIPAs an item that the federal budget reports as an offsetting (negative) budget outlay, or adjusting the timing of a federal transaction to better match the timing of related production or income flows.6
The Measurement of National SavingSeveral conventions in the NIPAs are intended to show the federal government’s contribution to the NIPA mea-sure of national saving. Two major departures from the budget are the treatment of federal investment spending (for such things as ships, computers, and office buildings) and the treatment of federal employees’ retirementprograms.
In the federal budget, outlays for investment purchases are treated like other cash outlays and thus are subtracted from budget revenues to determine the size of the federal deficit or surplus. By contrast, in the NIPAs, federal in-vestment is not counted as federal spending for the pur-pose of measuring net federal government saving (current receipts minus current expenditures)—because new pur-chases of federal capital (investments) do not measure the current inputs from the existing stock of capital used to
5. See Table 1.1.5 in the NIPAs.
6. The resulting differences between the numbers in the NIPAs and the budget are sometimes divided into three groups: coverage, timing, and netting. Although all three types of differences can affect total revenues or outlays, netting differences have no impact on the federal deficit or surplus because they affect revenues and outlays equally.
THE TREATMENT OF FEDERAL RECEIPTS AND EXPENDITURES IN THE NATIONAL INCOME AND PRODUCT ACCOUNTS 3
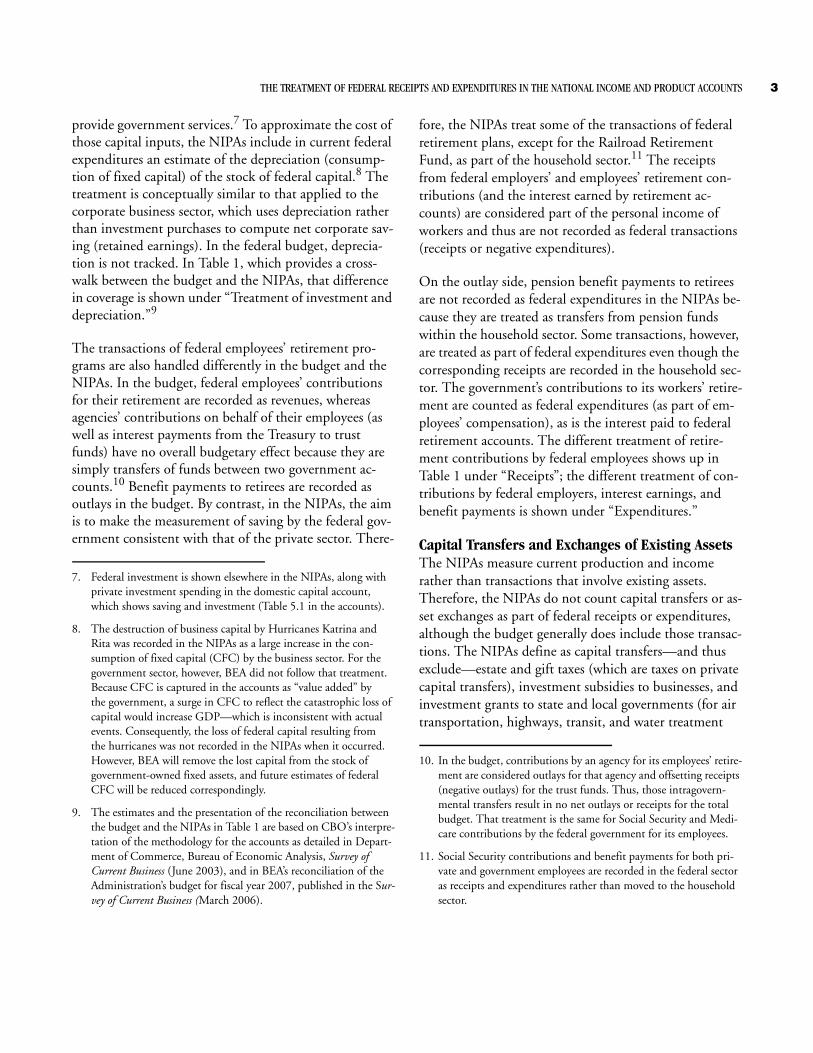
provide government services.7 To approximate the cost of those capital inputs, the NIPAs include in current federal expenditures an estimate of the depreciation (consump-tion of fixed capital) of the stock of federal capital.8 The treatment is conceptually similar to that applied to the corporate business sector, which uses depreciation rather than investment purchases to compute net corporate sav-ing (retained earnings). In the federal budget, deprecia-tion is not tracked. In Table 1, which provides a cross-walk between the budget and the NIPAs, that difference in coverage is shown under “Treatment of investment and depreciation.”9
The transactions of federal employees’ retirement pro-grams are also handled differently in the budget and the NIPAs. In the budget, federal employees’ contributions for their retirement are recorded as revenues, whereas agencies’ contributions on behalf of their employees (as well as interest payments from the Treasury to trust funds) have no overall budgetary effect because they are simply transfers of funds between two government ac-counts.10 Benefit payments to retirees are recorded as outlays in the budget. By contrast, in the NIPAs, the aim is to make the measurement of saving by the federal gov-ernment consistent with that of the private sector. There-
7. Federal investment is shown elsewhere in the NIPAs, along with private investment spending in the domestic capital account, which shows saving and investment (Table 5.1 in the accounts).
8. The destruction of business capital by Hurricanes Katrina and Rita was recorded in the NIPAs as a large increase in the con-sumption of fixed capital (CFC) by the business sector. For the government sector, however, BEA did not follow that treatment. Because CFC is captured in the accounts as “value added” by the government, a surge in CFC to reflect the catastrophic loss of capital would increase GDP—which is inconsistent with actual events. Consequently, the loss of federal capital resulting from the hurricanes was not recorded in the NIPAs when it occurred. However, BEA will remove the lost capital from the stock of government-owned fixed assets, and future estimates of federal CFC will be reduced correspondingly.
9. The estimates and the presentation of the reconciliation between the budget and the NIPAs in Table 1 are based on CBO’s interpre-tation of the methodology for the accounts as detailed in Depart-ment of Commerce, Bureau of Economic Analysis, Survey of Current Business (June 2003), and in BEA’s reconciliation of the Administration’s budget for fiscal year 2007, published in the Sur-vey of Current Business (March 2006).
fore, the NIPAs treat some of the transactions of federal retirement plans, except for the Railroad Retirement Fund, as part of the household sector.11 The receipts from federal employers’ and employees’ retirement con-tributions (and the interest earned by retirement ac-counts) are considered part of the personal income of workers and thus are not recorded as federal transactions (receipts or negative expenditures).
On the outlay side, pension benefit payments to retirees are not recorded as federal expenditures in the NIPAs be-cause they are treated as transfers from pension funds within the household sector. Some transactions, however, are treated as part of federal expenditures even though the corresponding receipts are recorded in the household sec-tor. The government’s contributions to its workers’ retire-ment are counted as federal expenditures (as part of em-ployees’ compensation), as is the interest paid to federal retirement accounts. The different treatment of retire-ment contributions by federal employees shows up in Table 1 under “Receipts”; the different treatment of con-tributions by federal employers, interest earnings, and benefit payments is shown under “Expenditures.”
Capital Transfers and Exchanges of Existing Assets The NIPAs measure current production and income rather than transactions that involve existing assets. Therefore, the NIPAs do not count capital transfers or as-set exchanges as part of federal receipts or expenditures, although the budget generally does include those transac-tions. The NIPAs define as capital transfers—and thus exclude—estate and gift taxes (which are taxes on private capital transfers), investment subsidies to businesses, and investment grants to state and local governments (for air transportation, highways, transit, and water treatment
10. In the budget, contributions by an agency for its employees’ retire-ment are considered outlays for that agency and offsetting receipts (negative outlays) for the trust funds. Thus, those intragovern-mental transfers result in no net outlays or receipts for the total budget. That treatment is the same for Social Security and Medi-care contributions by the federal government for its employees.
11. Social Security contributions and benefit payments for both pri-vate and government employees are recorded in the federal sector as receipts and expenditures rather than moved to the household sector.

4 THE TREATMENT OF FEDERAL RECEIPTS AND EXPENDITURES IN THE NATIONAL INCOME AND PRODUCT ACCOUNTS
Table 1.
Relationship of the Budget to the Federal Sector of the National Income and Product Accounts(Billions of dollars)
Continued
Actual2005 2006 2007 2008 2009 2010 2011 2012 2013 2014 2015 2016
2,154 2,403 2,515 2,672 2,775 2,890 3,156 3,398 3,555 3,733 3,922 4,118
-4 -5 -5 -4 -4 -4 -4 -4 -4 -4 -3 -3-25 -28 -24 -26 -27 -21 -21 -52 -57 -62 -70 -75
-4 -4 -4 -5 -5 -5 -5 -5 -6 -6 -6 -6-7 -8 -8 -8 -9 -9 -9 -9 -9 -9 -9 -10___ ___ ___ ___ ___ ___ ___ ___ ___ ___ ___ ___
-40 -44 -41 -43 -45 -39 -39 -70 -75 -81 -89 -94
38 45 56 62 66 70 75 80 87 97 108 122* 1 * 1 1 1 1 1 1 1 1 1
14 15 16 16 17 18 19 20 21 22 22 2314 14 17 19 19 20 21 21 23 23 23 24-4 -3 -6 -6 -6 -6 -6 -6 -6 -6 -7 -721 27 28 29 29 30 30 31 32 32 30 31___ ___ ___ ___ ___ ___ ___ ___ ___ ___ ___ ___83 99 112 122 126 132 139 146 157 168 178 194
-5 -3 3 0 0 7 3 -14 3 * 0 0-18 23 * -9 -1 * -7 -5 -2 1 2 2____ ____ ____ ____ ____ ____ ____ ____ ____ ____ ____ ____
Total Differences 20 75 74 69 80 100 97 57 84 89 91 101
Receipts in the NIPAs 2,174 2,478 2,588 2,741 2,855 2,990 3,253 3,455 3,639 3,822 4,013 4,219
2,472 2,663 2,801 2,945 3,079 3,217 3,382 3,451 3,631 3,797 3,979 4,211
-15 -23 -26 -27 -30 -32 -33 -34 -35 -36 -37 -39
36 36 34 34 34 35 36 37 39 41 43 45-45 -49 -52 -54 -55 -55 -56 -57 -57 -58 -59 -60
12 17 31 26 29 19 18 19 18 19 19 20-14 -15 -16 -17 -18 -19 -20 -20 -22 -23 -24 -25
-6 -7 -7 -8 -8 -8 -8 -8 -8 -9 -9 -9___ ___ ___ ___ ___ ___ ___ ___ ___ ___ ___ ___-32 -42 -36 -46 -47 -60 -63 -64 -65 -66 -67 -68
Expenditures
adjustmentsGeographic adjustments Universal Service Fund payments
Subtotal, coverage
Contributions for governmentemployees' retirement
Capital transfersLending and financial
DifferencesCoverage
Treatment of investment anddepreciation
Other adjustmentsb
Outlays (Budget)a
OASDI and HI for employeesIncome receipts on assetsSurpluses of government enterprisesOther
Universal Service Fund receipts
Subtotal, coverage
Timing shift of corporate estimatedtax payments
NettingMedicare premiumsDeposit insurance premiumsGovernment contributions for
Subtotal, netting
Contributions for government employees' retirement
Estate and gift taxesGeographic adjustments
Revenues (Budget)a
DifferencesCoverage
Receipts

THE TREATMENT OF FEDERAL RECEIPTS AND EXPENDITURES IN THE NATIONAL INCOME AND PRODUCT ACCOUNTS 5
Table 1.
Continued(Billions of dollars)
Source: Congressional Budget Office.
Note: * = between -$500 million and $500 million; OASDI = Old-Age, Survivors, and Disability Insurance; HI = Hospital Insurance.
a. Includes Social Security and the Postal Service.
b. Include timing differences not shown elsewhere in Table 1, plus discrepancies between figures in the NIPAs and in the budget that may diminish when BEA makes subsequent revisions. The figure for 2005 reflects netting adjustments for hurricane relief and recovery.
c. Reflects timing adjustments for hurricane relief and recovery.
d. Include coverage differences not shown elsewhere in Table 1, plus discrepancies in 2006 between figures in the NIPAs and in the budget that may diminish when BEA makes subsequent revisions.
Actual2005 2006 2007 2008 2009 2010 2011 2012 2013 2014 2015 2016
38 45 56 62 66 70 75 80 87 97 108 122* 1 * 1 1 1 1 1 1 1 1 1
14 15 16 16 17 18 19 20 21 22 22 2314 14 17 19 19 20 21 21 23 23 23 24-4 -3 -6 -6 -6 -6 -6 -6 -6 -6 -7 -721 27 28 29 29 30 30 31 32 32 30 31___ ___ ___ ___ ___ ___ ___ ___ ___ ___ ___ ___83 99 112 122 126 132 139 146 157 168 178 194
-15 13 6 0 0 0 -30 30 0 0 0 -43-1 -17 -3 0 0 0 0 0 0 0 0 02 -46 * 4 5 8 10 10 12 15 17 20___ ___ ___ ___ ___ ___ ___ ___ ___ ___ ___ ___
Total Differences 37 7 80 80 83 81 57 122 104 117 128 102
2,509 2,670 2,880 3,025 3,163 3,298 3,439 3,573 3,735 3,914 4,107 4,313
-318 -260 -286 -273 -304 -328 -227 -54 -76 -64 -56 -93
15 23 26 27 30 32 33 34 35 36 37 39
-40 -40 -39 -38 -38 -39 -40 -41 -43 -44 -46 -48-25 -28 -24 -26 -27 -21 -21 -52 -57 -62 -70 -7545 49 52 54 55 55 56 57 57 58 59 60
-12 -17 -31 -26 -29 -19 -18 -19 -18 -19 -19 -2010 11 12 13 13 14 15 15 16 17 18 19-1 0 -1 -1 -1 -1 -1 -1 -1 -1 -1 -1___ ___ ___ ___ ___ ___ ___ ___ ___ ___ ___ ___-9 -2 -5 3 2 21 24 -6 -10 -15 -22 -25
11 -16 -3 0 0 7 33 -44 3 * 0 431 17 3 0 0 0 0 0 0 0 0 0
-20 69 -1 -13 -5 -9 -17 -15 -14 -13 -15 -18___ ___ ___ ___ ___ ___ ___ ___ ___ ___ ___ ___Total Differences -17 68 -6 -10 -3 19 40 -65 -21 -28 -37 -1
-335 -192 -292 -283 -308 -308 -187 -119 -96 -92 -94 -94
Other adjustmentsb
Net Federal Government Saving
Expenditures (Continued)
Net Federal Government Saving
Flood insurance adjustmentcTiming adjustments
Geographic adjustmentsUniversal Service Fund
Subtotal, coverage
Estate and gift taxesCapital transfersLending and financial
adjustments
Treatment of investment anddepreciation
Contributions for governmentemployees' retirement
Budget Deficit (-) or Surplusa
DifferencesCoverage
Surpluses of government enterprisesOther
Subtotal, netting
Expenditures in the NIPAs
Flood insurance adjustmentc
Other adjustmentsd
Timing adjustments
Deposit insurance premiumsGovernment contributions for
OASDI and HI for employeesIncome receipts on assets
NettingMedicare premiums
Differences (Continued)

6 THE TREATMENT OF FEDERAL RECEIPTS AND EXPENDITURES IN THE NATIONAL INCOME AND PRODUCT ACCOUNTS
plants).12 Exchanges of existing assets include federal transactions for deposit insurance and sales and purchases of government assets (including assets that are not pro-duced, such as land and the radio spectrum). In Table 1, those differences between the NIPAs’ federal sector and the budget accounts show up on the revenue side as estate and gift taxes and on the outlay side as capital transfers and lending and financial adjustments.
Credit ProgramsFor federal credit programs (loans and loan guarantees), only the estimated credit subsidy and administrative costs are included in outlays. Cash flows from loan disburse-ments, repayments, and interest, by contrast, are reported in what are termed financing accounts, which have no ef-fect on outlays.
As in the budget, the NIPAs record administrative costs and generally exclude loan disbursements and repayments and other cash flows considered exchanges of existing as-sets or financial and lending transactions that are unre-lated to current production. By contrast, the NIPAs do not record subsidy costs. In another departure from the budget, the NIPAs include the interest receipts from credit programs (as part of federal receipts). Those differ-ences in the treatment of credit programs are recorded in two places: under “Expenditures” in Table 1, the lending and financial adjustments show the differences in han-dling the loan subsidies; and under “Receipts,” the differ-ence in treating loan interest is captured as part of income receipts on assets.
Geographic CoverageThe NIPAs exclude all government transactions with Pu-erto Rico and the U.S. territories, whose current produc-
12. Another type of capital transfer excluded by the Bureau of Eco-nomic Analysis in the national income and product accounts is the annual lump-sum payment from the Treasury to the Uni-formed Services Retiree Health Care Fund—a trust fund begun in 2003 to pay for benefits received by retired members of the armed forces who are Medicare-eligible and their dependents. Those pay-ments to the trust fund are for accrued but unfunded liabilities for benefits attributable to work performed before 2003, and BEA excludes those payments from federal expenditures because they are not related to current production. In the budget, those annual payments are recorded as outlays by the Treasury but as offsetting receipts (negative outlays) by the trust fund. Because those annual payments have no net impact on federal spending in either the NIPAs or the budget, there is no corresponding reconciliation item in Table 1.
tion, according to the NIPAs’ definition, is not part of U.S. GDP. Because federal transfers dominate those transactions, their exclusion tends to increase the NIPAs’ depiction of net federal government saving in comparison with the budget’s measure of saving—the federal deficit or surplus. That difference in coverage is shown as geo-graphic adjustments in Table 1.
Universal Service Fund The business activity of the Universal Service Fund, which provides resources to promote access to telecom-munications, is recorded in the budget, but not in the NIPAs’ federal sector. The Universal Service Fund re-ceives federally required payments from providers of in-terstate and international telecommunications services and disburses those funds to local providers that serve high-cost areas, low-income households, libraries, and schools, as well as to rural health care providers. The fund is administered by an independent nonprofit corpo-ration (the Universal Service Administrative Company), which is regulated by the Federal Communications Commission.
Although the Universal Service Fund’s revenues and out-lays appear in the federal budget, they have little net im-pact on the deficit or surplus. In the NIPAs, the fund’s re-ceipts and payments are classified as intracorporate transfers (from one business to another). The difference in treatment of the Universal Service Fund is so labeled in Table 1.
Interest ReceiptsIn the NIPAs, federal interest receipts are grouped with other types of federal receipts (in the category designated “Income receipts on assets”) rather than netted against federal interest payments, as they are in the federal bud-get.13 BEA’s treatment is consistent with international ac-counting practices, under which interest receipts and pay-ments are reported separately. That difference in the treatment of interest receipts in the NIPAs and in the fed-eral budget raises the NIPAs’ measure of government re-ceipts relative to federal budget revenues and increases the NIPAs’ measure of federal spending relative to budget outlays. However, because the difference in treatment af-fects receipts and expenditures in the NIPAs by exactly
13. About half of the NIPAs’ interest receipts, mainly from penalties on late tax payments, are recorded as revenues in the federalbudget.
THE TREATMENT OF FEDERAL RECEIPTS AND EXPENDITURES IN THE NATIONAL INCOME AND PRODUCT ACCOUNTS 7
the same amount, it has no impact on the NIPAs’ mea-surement of net federal government saving.
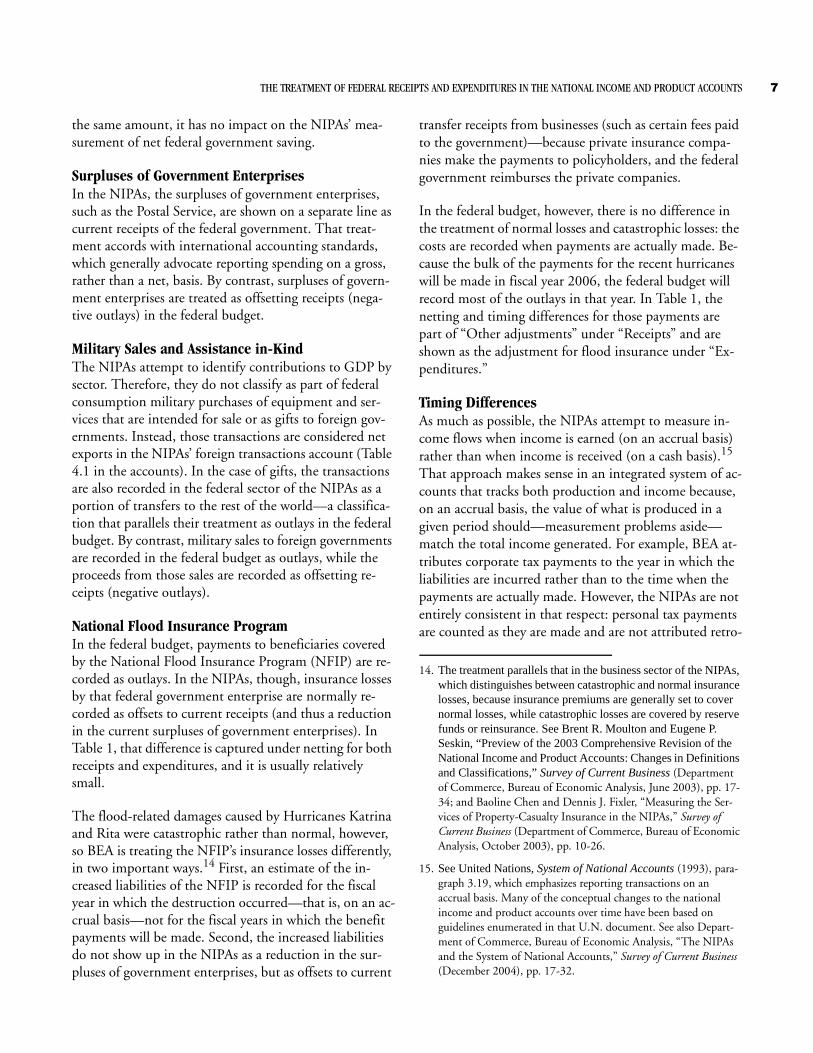
Surpluses of Government EnterprisesIn the NIPAs, the surpluses of government enterprises, such as the Postal Service, are shown on a separate line as current receipts of the federal government. That treat-ment accords with international accounting standards, which generally advocate reporting spending on a gross, rather than a net, basis. By contrast, surpluses of govern-ment enterprises are treated as offsetting receipts (nega-tive outlays) in the federal budget.
Military Sales and Assistance in-KindThe NIPAs attempt to identify contributions to GDP by sector. Therefore, they do not classify as part of federal consumption military purchases of equipment and ser-vices that are intended for sale or as gifts to foreign gov-ernments. Instead, those transactions are considered net exports in the NIPAs’ foreign transactions account (Table 4.1 in the accounts). In the case of gifts, the transactions are also recorded in the federal sector of the NIPAs as a portion of transfers to the rest of the world—a classifica-tion that parallels their treatment as outlays in the federal budget. By contrast, military sales to foreign governments are recorded in the federal budget as outlays, while the proceeds from those sales are recorded as offsetting re-ceipts (negative outlays).
National Flood Insurance ProgramIn the federal budget, payments to beneficiaries covered by the National Flood Insurance Program (NFIP) are re-corded as outlays. In the NIPAs, though, insurance losses by that federal government enterprise are normally re-corded as offsets to current receipts (and thus a reduction in the current surpluses of government enterprises). In Table 1, that difference is captured under netting for both receipts and expenditures, and it is usually relatively small.
The flood-related damages caused by Hurricanes Katrina and Rita were catastrophic rather than normal, however, so BEA is treating the NFIP’s insurance losses differently, in two important ways.14 First, an estimate of the in-creased liabilities of the NFIP is recorded for the fiscal year in which the destruction occurred—that is, on an ac-crual basis—not for the fiscal years in which the benefit payments will be made. Second, the increased liabilities do not show up in the NIPAs as a reduction in the sur-pluses of government enterprises, but as offsets to current
transfer receipts from businesses (such as certain fees paid to the government)—because private insurance compa-nies make the payments to policyholders, and the federal government reimburses the private companies.
In the federal budget, however, there is no difference in the treatment of normal losses and catastrophic losses: the costs are recorded when payments are actually made. Be-cause the bulk of the payments for the recent hurricanes will be made in fiscal year 2006, the federal budget will record most of the outlays in that year. In Table 1, the netting and timing differences for those payments are part of “Other adjustments” under “Receipts” and are shown as the adjustment for flood insurance under “Ex-penditures.”
Timing Differences As much as possible, the NIPAs attempt to measure in-come flows when income is earned (on an accrual basis) rather than when income is received (on a cash basis).15 That approach makes sense in an integrated system of ac-counts that tracks both production and income because, on an accrual basis, the value of what is produced in a given period should—measurement problems aside—match the total income generated. For example, BEA at-tributes corporate tax payments to the year in which the liabilities are incurred rather than to the time when the payments are actually made. However, the NIPAs are not entirely consistent in that respect: personal tax payments are counted as they are made and are not attributed retro-
14. The treatment parallels that in the business sector of the NIPAs,which distinguishes between catastrophic and normal insurancelosses, because insurance premiums are generally set to covernormal losses, while catastrophic losses are covered by reservefunds or reinsurance. See Brent R. Moulton and Eugene P.Seskin, “Preview of the 2003 Comprehensive Revision of theNational Income and Product Accounts: Changes in Definitionsand Classifications,” Survey of Current Business (Department of Commerce, Bureau of Economic Analysis, June 2003), pp. 17-34; and Baoline Chen and Dennis J. Fixler, “Measuring the Ser-vices of Property-Casualty Insurance in the NIPAs,” Survey of Current Business (Department of Commerce, Bureau of Economic Analysis, October 2003), pp. 10-26.
15. See United Nations, System of National Accounts (1993), para-graph 3.19, which emphasizes reporting transactions on an accrual basis. Many of the conceptual changes to the national income and product accounts over time have been based on guidelines enumerated in that U.N. document. See also Depart-ment of Commerce, Bureau of Economic Analysis, “The NIPAs and the System of National Accounts,” Survey of Current Business (December 2004), pp. 17-32.

8 THE TREATMENT OF FEDERAL RECEIPTS AND EXPENDITURES IN THE NATIONAL INCOME AND PRODUCT ACCOUNTS
actively to the year in which the liabilities were incurred. Currently, BEA is engaged in research to develop meth-ods for preparing accrual-based estimates of personal tax payments.
Because the budget is recorded mostly on a cash basis and the NIPAs’ federal sector is recorded largely on an accrual basis, differences exist in a number of areas in the timing of recorded transactions.
Corporate Taxes. Tax legislation sometimes temporarily shifts the timing of corporate tax payments (usually from the end of one fiscal year to the beginning of the next). The NIPAs exclude such timing shifts, which are not consistent with accrual accounting. The timing adjust-ments for the effects of the Economic Growth and Tax Relief Reconciliation Act of 2001 and the Tax Increase Prevention and Reconciliation Act of 2005 are shown as the timing shift of corporate estimated tax payments in Table 1.
Although corporations make estimated tax payments throughout the year, any shortfalls (or overpayments) are corrected in the form of final payments (or refunds) in subsequent years. The NIPAs shift those final payments back to the year in which the corporate profits that gave rise to the tax liabilities were actually generated, whereas the budget records them on a cash basis. The results of that difference are difficult to identify for recent history and thus appear as part of “Other adjustments” under “Receipts” in Table 1.16
Personal Taxes. Although personal taxes are not recorded on an accrual basis in the NIPAs, BEA nevertheless at-tempts to avoid large, distorting upward or downward spikes in personal disposable income that result from tim-ing quirks. Such quirks occur in April of each year, for ex-ample, when most final settlements for the previous year’s personal taxes are paid. In the NIPAs, therefore, those set-tlements are evenly spread over the four quarters of the calendar year in which they are paid. (As with accrual ac-counting, that treatment avoids spikes. Unlike accrual treatment, however, it does not move payments back to the year in which the liabilities were incurred.) Such “smoothing” can alter the relationship of the NIPAs and
16. “Other adjustments” include timing differences not shown else-where in Table 1, plus discrepancies between figures in the NIPAs and the budget that may diminish when BEA makes subsequent revisions.
the budget accounts for fiscal years because it shifts some receipts into the last quarter of the calendar year and thus into the following fiscal year.17
Those adjustments are difficult to identify for recent his-tory and thus are not shown separately in Table 1; they appear instead in the “Other adjustments” category under “Receipts.”
Transfers and Military Compensation. Timing adjust-ments are needed on the spending side of the NIPAs to align military compensation and government transfer payments—for example, veterans’ benefits, Supplemental Security Income (SSI) payments, and Medicare’s pay-ments to providers—with income that is reported on an accrual basis in the NIPAs. Misalignments can occur be-cause of delays in payments or quirks in the calendar.
For example, although SSI payments are usually made on the first day of each month, they are sometimes made a day or more in advance. That situation typically occurs when the first day of the month falls on a weekend or holiday. If it occurs for the October benefits, the pay-ments will be pushed into the previous fiscal year in the budget. In such cases, the NIPAs introduce a timing ad-justment that effectively moves the payments back to the first day of the month. Hence, the NIPAs’ adjustment al-ways ensures that there are exactly 12 monthly SSI pay-ments in a year, whereas in the budget, there can be 11 in some years and 13 in others.
For military compensation, which is paid at the begin-ning and middle of each month, the adjustment in the NIPAs always ensures 24 payments in a year. In the bud-get, by contrast, there can be 23 payments in some years and 25 in others. The timing adjustments for expendi-tures in Table 1 reflect that regularizing for transfers and for military pay.
In another contrast with the federal budget, the NIPAs record Medicare payments on an accrual basis rather than on a cash basis. That treatment better illustrates the link between the underlying economic activity (the medical services provided) and the associated federal transactions
17. A change in the relationship between receipts in the budget and in the NIPAs is projected to occur following certain changes in tax laws, such as the increases in tax rates and other changes scheduled to take effect in 2011 and assumed in CBO’s baseline for reve-nues.

THE TREATMENT OF FEDERAL RECEIPTS AND EXPENDITURES IN THE NATIONAL INCOME AND PRODUCT ACCOUNTS 9
(payment for those services), which can be several months apart. The timing adjustment, however, has only a small effect on the NIPAs’ measure of net federal government saving.
Business Activities The federal budget and the NIPAs both treat certain rev-enues as offsetting receipts (negative outlays) when they result from voluntary transactions with the public that re-semble business activities, such as proceeds from the sale of government publications. However, the NIPAs gener-ally have a stricter view of what resembles a business transaction. In particular, Medicare premiums, deposit insurance premiums, rents, royalties, and regulatory or inspection fees are deemed equivalent to business transac-tions in the budget but not in the NIPAs. Consequently, those transactions (negative outlays in the budget) are treated in the NIPAs as government receipts (contribu-tions for government social insurance and current trans-fers from business—fines and fees). Those differences are recorded under “Netting” in Table 1. Because they affect total current receipts and total current expenditures by exactly the same amounts, they have no effect on the NIPAs’ measure of net federal government saving.
Presentation of the Federal Government’s Receipts and Expenditures in the NIPAsAs in the budget, the federal sector of the NIPAs classifies receipts by type, but the categories differ (see Table 2). The NIPAs’ classifications help to determine measures such as disposable income and corporate profits after taxes. There are five major categories of current receipts. The largest one, current tax receipts, includes taxes on personal income, taxes on corporate income, taxes on production and imports, and taxes from the rest of the world. The next-largest category is contributions for gov-ernment social insurance, which consists of Social Secu-rity taxes, Medicare taxes and premiums, and unemploy-ment insurance taxes. The remaining categories are current transfer receipts (fines and fees), income receipts on assets (interest, rents, and royalties), and current sur-
pluses of government enterprises (such as the PostalService).
In the NIPAs, the government’s expenditures are classi-fied according to their purpose. The major groups, which are much fewer than those in the federal budget, are con-sumption expenditures, or purchases of goods and ser-vices (broken out for defense and nondefense purchases); transfer payments (to individuals, governments, and the rest of the world); interest payments; and subsidies to businesses and to government enterprises.
Consumption of goods and services (for both defense and nondefense purposes) consists of purchases made by the government for its immediate use in production. (The largest portion of such consumption is the compensation of military and civilian federal employees.) Among the government’s consumption expenditures, the consump-tion of fixed capital—depreciation—represents a partial measure of the services that the government receives from its stock of fixed assets, such as buildings or equipment.
Transfer payments (cash payments made directly to indi-viduals and the rest of the world as well as grants to state and local governments or foreign nations) constitute an-other grouping. Most of the transfers to individuals are for social benefits. Grants-in-aid are payments that the federal government makes to state or local governments, which generally use them for transfers (such as benefits provided by the Medicaid program) and consumption (such as the hiring of additional police officers). Grants-in-aid to foreigners include federal purchases of military equipment for delivery to foreign governments.
The NIPAs’ category for federal interest payments shows only payments and thus differs from the budget, which contains a category labeled “net interest.” In the NIPAs, federal interest receipts are classified with other federalreceipts.
The NIPAs’ category labeled “subsidies” primarily con-sists of grants paid by the federal government to busi-nesses, including state and local government enterprises such as public housing authorities. Federal housing and agricultural assistance have long dominated that category.

10 THE TREATMENT OF FEDERAL RECEIPTS AND EXPENDITURES IN THE NATIONAL INCOME AND PRODUCT ACCOUNTS
Table 2.
Projections of Baseline Receipts and Expenditures as Measured by the National Income and Product Accounts(Billions of dollars)
Source: Congressional Budget Office.
a. Includes Social Security taxes, Medicare taxes and premiums, and unemployment insurance taxes.
b. Includes Social Security and the Postal Service.
Actual2005 2006 2007 2008 2009 2010 2011 2012 2013 2014 2015 2016
893 1,035 1,121 1,213 1,286 1,362 1,555 1,695 1,803 1,908 2,017 2,135304 378 363 358 342 341 346 345 353 362 373 386100 102 90 100 104 107 112 117 121 125 127 131
11 11 11 12 13 14 16 18 19 20 21 22_____ _____ _____ _____ _____ _____ _____ _____ _____ _____ _____ _____1,308 1,525 1,585 1,682 1,745 1,823 2,029 2,175 2,296 2,415 2,538 2,674
841 900 944 995 1,046 1,099 1,153 1,208 1,266 1,328 1,392 1,4597 33 36 37 38 40 42 44 46 49 52 54
23 23 28 32 32 33 34 34 37 37 38 39
-4 -3 -6 -6 -6 -6 -6 -6 -6 -6 -7 -7
2,174 2,478 2,588 2,741 2,855 2,990 3,253 3,455 3,639 3,822 4,013 4,219
442 465 502 519 533 545 557 570 583 596 610 62467 70 71 72 73 75 77 80 84 87 90 93
224 236 249 259 269 276 283 289 297 305 313 32225 25 26 26 27 27 28 28 29 30 30 31____ ____ ____ ____ ____ ____ ____ ____ ____ _____ _____ _____
758 796 848 876 901 924 945 968 992 1,017 1,043 1,070
1,063 1,146 1,249 1,322 1,396 1,474 1,555 1,631 1,734 1,850 1,976 2,1123 3 3 4 4 4 4 4 5 5 5 6_____ _____ _____ _____ _____ _____ _____ _____ _____ _____ _____ _____
1,066 1,149 1,252 1,325 1,400 1,478 1,559 1,635 1,739 1,855 1,981 2,118
360 361 387 405 428 449 470 493 518 545 575 60630 28 26 25 26 26 26 27 27 28 28 29____ ____ ____ ____ ____ ____ ____ ____ ____ ____ ____ ____
390 390 413 430 454 475 496 519 545 573 603 635
241 279 314 340 357 373 392 404 411 421 431 44153 56 52 52 50 48 47 47 48 48 49 49_____ _____ _____ _____ _____ _____ _____ _____ _____ _____ _____ _____
2,509 2,670 2,880 3,025 3,163 3,298 3,439 3,573 3,735 3,914 4,107 4,313
-335 -192 -292 -283 -308 -308 -187 -119 -96 -92 -94 -94
Net Federal Government Saving
Net Federal Government Saving
Subtotal
Interest Paymentsb
Subsidies
ExpendituresTotal Current
Other transfer payments Grants-in-aid to state and
local governmentsb
To the rest of the world
Government social benefitsTo personsTo the rest of the world
Subtotal
ConsumptionConsumption of fixed capital
Subtotal
Current Transfer Payments
DefenseConsumptionConsumption of fixed capital
Nondefenseb
Enterprises
Total Current Receipts
ExpendituresConsumption Expenditures
Social Insurancea
Current Transfer ReceiptsIncome Receipts on AssetsCurrent Surpluses of Government
Taxes on production and importsTaxes from the rest of the world
Contributions for Government
Subtotal
ReceiptsCurrent Tax Receipts
Taxes on personal incomeTaxes on corporate income
THE TREATMENT OF FEDERAL RECEIPTS AND EXPENDITURES IN THE NATIONAL INCOME AND PRODUCT ACCOUNTS 11
Net federal government saving in the NIPAs is the differ-ence between the current receipts and the current expen-ditures of the federal sector.18 It is a component of net national saving (which also includes net saving by the state and local government sector, personal saving, and corporate retained earnings) and thus is a partial measure of how much of the nation’s income earned from current production is not consumed in the current period. Net federal saving (or dissaving) is not a good indicator of federal borrowing requirements because, unlike the bud-get deficit or surplus, it is not a measure of cash flows.19
18. Gross federal saving—a component of gross national saving—equals net federal saving plus depreciation (consumption of fixed capital).
19. As an addendum to the NIPAs’ Table 3.2, BEA publishes a mea-sure labeled “net lending or net borrowing,” which is closer to a cash or financial measure in several ways. Like the budget, it includes investment purchases as expenditures because those pur-chases must be financed from current receipts or from federal bor-rowing. At the same time, it excludes consumption of fixed capital because those accounting charges are not a drain on current finan-cial resources. In addition, it includes receipts from the sale of existing assets, as well as capital transfer receipts (for example, estate and gift taxes) and capital transfer payments (for example, investment grants to state and local governments), which are not part of current receipts or expenditures in the NIPAs but do affect cash flows. Despite those adjustments, net federal lending or bor-rowing in the NIPAs differs from the budget deficit or surplus because of all of the other differences in timing and coverage that distinguish the NIPAs from the budget. BEA presents those differ-ences in Table 3.18, which is similar to Table 1 presented here.


INSIDE MAIL
CONGRESS OF THE UNITED STATESCONGRESSIONAL BUDGET OFFICEWASHINGTON, DC 20515