the trillion dollar question ii: tracking ... paper | april 2016 | 3 the trillion dollar question...
TRANSCRIPT

WORKING PAPER
WORKING PAPER | April 2016 | 1
THE TRILLION DOLLAR QUESTION II: TRACKING INVESTMENT NEEDS IN TRANSPORTBENOIT LEFEVRE, AHMAD IQBAL CHAUDHARY, DEEBA YAVROM, AND AMAN SRIVASTAVA
EXECUTIVE SUMMARYInvestment in the transport sector has major economic and environmental impacts in both the developed and developing world. Currently, global capital investment in public and private transport is between $1.4 trillion and $2.1 trillion annually (Lefevre and Leipziger, 2014), but promoting a more sustainable low-carbon pathway for transport will depend on how future capital is invested.
This working paper seeks to elucidate the current esti-mates for transport infrastructure requirements, looking at a series of reports that consider projected global infra-structure needs in the coming few decades, and provide or quote a cost estimate for these needs. The reports we reviewed and analyzed come from the International Energy Agency, the Organisation for Economic Co-operation and Development, the World Economic Forum, the McKinsey Global Institute, the New Climate Economy, and the Institute for Transportation and Development Policy in association with the University of California, Davis. We evaluated the estimates under different climate scenarios and used the forecasts to assess a consolidated needs estimate, with up-to-date projections for every subsector for capital investment, at a global level.
The overall objective of this work is to compare “apples to apples” for current investment flows and investment needs, comparable to the global investment flows estimate of between $1.4 and $2.1 trillion annually. This paper projects a consolidated needs estimate of $2 trillion for a scenario of 2°C average global temperature increase by 2050 (2DS) and $2.3 trillion for a 4°C scenario (4DS).
CONTENTSExecutive Summary......................................................1
Introduction and Methodology .....................................2
Existing Global Estimates .............................................4
Summary of Global Investment Needs ......................13
Developing a Consolidated Global Investment
Needs Estimate...........................................................13
Limitations of Analysis ...............................................17
Conclusion .................................................................18
Appendix ....................................................................19
References .................................................................24
Endnotes ....................................................................25
Working Papers contain preliminary research, analysis, findings, and recommendations. They are circulated to stimulate timely discussion and critical feedback, and to influence ongoing debate on emerging issues. Working papers may eventually be published in another form and their content may be revised.
Suggested Citation: Lefevre, Benoit, Ahmad Iqbal Chaudhary, Deeba Yavrom, and Aman Srivastava. 2016. “The Trillion Dollar Question II: Tracking Investment Needs in Transport.” Working Paper. Washington, DC: World Resources Institute. http://www.wri.org/publication/tracking-investment-needs-in-transport

2 |
It concludes not only that there is a cost advantage in achieving the lower-carbon, 2°C scenario but also that a low-carbon pathway is attainable given current flows in transport investment.
If the world is to achieve a low-carbon pathway, local and national policymakers, who are able to frame the market around sustainable investment in transport, must play a pivotal role in diverting investment toward more sustain-able modes of transport. Development banks can do the same, setting trends in low-carbon portfolio allocation, as well as incentivizing and supporting more sustainable decisions by national and local policymakers.
INTRODUCTION AND METHODOLOGYTransport is an important part of global infrastructure, not only because it moves people and goods but also because of its critical role in driving economic growth, ensuring equitable access to amenities and opportunities, and moderating greenhouse gas emissions by providing sustainable options for the future (IEA 2012; Canning and Fay 1993). When studying current flows of finance to transport, it is important to understand the scale of overall investment needs facing the transport sector. A better understanding of the flows-versus-needs equation can help shift and appropriately increase the resources dedicated toward transport infrastructure generally and sustainable low-carbon transport specifically.
As world population growth, expanding developing econo-mies, and rapid urbanization increase demand for travel, widely varying forecasts (and significant uncertainty) have emerged with regard to the infrastructure investment needed in the transport sector. This paper aims to clarify the assumptions in existing forecasts in order to compare evaluations and build a transparent estimate of global investment needs in the transport sector.
The overall objective of this work is to compare “apples to apples” for current investment flows and investment needs, comparable to the global investment flows estimate of between $1.4 trillion and $2.1 trillion annually. This paper projects a consolidated needs estimate of $2 trillion for a scenario of 2°C average global temperature increase by 2050 (2DS) and $2.3 trillion for a 4°C scenario (4DS). It concludes not only that there is a cost advantage in achieving the lower-carbon, 2°C scenario also but that a low-carbon pathway is attainable given current flows in transport investment.
This paper reviews and analyzes the estimates of transport infrastructure requirements published by the Interna-tional Energy Agency (IEA 2013), the Organisation for Economic Co-operation and Development (OECD 2006, 2012), the World Economic Forum (WEF 2013), the McK-insey Global Institute (McKinsey 2013), the New Climate Economy (NCE 2014b), and the Institute for Transporta-tion and Development Policy/University of California, Davis (ITDP/UC Davis 2014). We chose these studies because they look at infrastructure needs on a global scale in the coming few decades and provide or quote an estimate for these needs.
These studies vary in scope and assumptions—different studies consider different sets of transport subsectors, cover different timelines, and assume different pathways for climate change mitigation. We will discuss these differ-ences in detail. We evaluate several climate scenarios—a low-carbon pathway or 2°C scenario (2DS), a business-as-usual or 4°C scenario (4DS), and a 6°C scenario (6DS)—and determine the resources needed for transport infrastructure development in a 2DS and a 4DS (see Box 1). To ensure accurate understanding, we have carefully reviewed all the assumptions and techniques used to build each report’s estimates, contacted each report’s authors to confirm our understanding of their work, and sought to clarify any points of difference that were not publicly explained. We synthesize existing global estimates in order to assess the consolidated needs at levels compa-rable to the total worldwide transport capital investment estimate of between $1.4 trillion and $2.1 trillion per year presented in WRI’s working paper “The Trillion Dollar Question: Tracking Public and Private Investment in Transport” (Lefevre and Leipziger 2014). In addition to global projections, we have also reviewed regional estimates of transport infrastructure investment needs in Africa, Asia, and Latin America.
The paper determines that a low-carbon pathway or 2DS for transport infrastructure development will require fewer resources compared to a 4DS or 6DS. This analysis is restricted to capital investment in new infrastructure and reconstruction or upgrading of old infrastructure, specifi-cally capital asset expenditure (or capex). Our consolidated estimate for global investment needs covers transport subsectors that include road, rail, bus rapid transit, parking, airports, and ports and does not include investment in rolling stock and vehicles or operations and maintenance of the infrastructure.1 The consolidated investment needs estimate reveals that from 2010 to 2030 a 2DS pathway to meet trans-

WORKING PAPER | April 2016 | 3
The Trillion Dollar Question II: Tracking Investment Needs in Transport
port infrastructure needs will cost $2 trillion per year, while a 4DS pathway will cost $2.3 trillion per year, representing an annual savings of over $300 billion. When we consider the WRI transport investment flows estimate of between $1.4 trillion and $2.1 trillion per year (Lefevre and Leipziger 2014), it becomes clear that transport infrastructure invest-ment needs in a low-carbon scenario may actually lie within the financial means currently available for transport infra-structure on a global level.
Our analysis of transport investment needs in Asia, Africa, and Latin America and the Caribbean finds that limited information is available on a regional level. An aggregation of the estimates available indicates that combined investment needs in these three regions are roughly $450 billion annu-ally; however, these estimates are not updated to reflect the growing needs of developing countries and fail to take into account the impact of transport infrastructure investments in the context of climate change. Better projections of regional investment estimates need to be developed. Because of this lack of data, we have decided to look at regional flows as a separate element in the appendix.
Box 1 | Climate Scenarios for Transport (6DS, 4DS, and 2DS)
Box 2 | The Trillion Dollar Question: Tracking Public and Private Investment in Transport
“The Trillion Dollar Question: Tracking Public and Private Investment in Transport” (Lefevre and Leipziger 2014) estimates capital investment in transport around the world, distinguishing public and private investment from domestic and international sources. Here are some of the paper’s key findings:
▪ Global transport investment is between $1.4 trillion and $2.1 trillion annually.
▪ In aggregate, private investment constitutes about 58 percent of global investment. In high-income countries, where three quarters of investment takes place, private investment is nearly 38 percent higher than public investment. In middle- and low-income countries, the public share is 27 percent larger.
▪ Of the public sources for global transport investment, 98 percent comes from the domestic level and only 2 percent from official development assistance (ODA) and climate funds.
Source: Lefevre and Leipziger 2014
The IEA’s Energy Technology Perspectives 2012 defines three climate scenarios.
▪ The 6°C Scenario (6DS) assumes that no new policy action is taken to address climate change and energy security concerns. The energy system stays heavily dependent on fossil fuels, which meet a majority of additional demand. By 2050, fossil fuel use and CO
2 emissions are almost double those in
2009. Transport remains based almost exclusively on fossil fuels. Fuel economy improves slowly, but final energy use in the sector almost doubles by 2050. There is little penetration of plug-in electric vehicles and other alternative technologies and fuels.
▪ The 4°C Scenario (4DS) represents a concerted effort to move away from current trends and technolo-gies, with the goal of reducing both energy demand and emissions vis-à-vis the 6DS. The IEA indicates that the scenario is plausible given recent develop-ments, if governments play a leading role in imple-menting and delivering on policy commitments made to combat climate change. In transport, this scenario assumes that implementation of tighter fuel economy standards in all major economies (as already planned in European countries and the United States post-2015–16) results in the average fuel economy of passenger light-duty vehicles (LDVs) improving more than 30 percent compared to 2009. However, under this scenario policies to encourage the adoption of new fuels are weak, and penetration of alternative-fuel technologies (e.g., plug-in hybrid electric and battery electric vehicles) is slow. The only new alternative technology that gains significant market share is gasoline hybrid vehicles, reaching some 25 percent of sales in 2050.
▪ The 2°C Scenario (2DS) presents a vision of a sustainable energy system. Attaining it will require transformation of the energy system that cuts energy-related CO
2 emissions in half by 2050 compared to
2009. In the transport sector, oil must be replaced by a portfolio of three alternative fuels (or energy carriers): electricity, hydrogen, and biofuels. These will require a revolution in vehicle propulsion systems, particularly in the electrification of LDVs, where improved vehicle fuel efficiency will also play a major role. Still, emissions in transport decrease only approximately 25 percent compared to 2009, mainly because of the rapid increase in the number of cars in emerging economies.
Source: IEA 2012

4 |
EXISTING GLOBAL ESTIMATESIn this section, we will examine estimates from the IEA, OECD, McKinsey, WEF, NCE, and ITDP/UC Davis, respectively.
International Energy AgencyThe International Energy Agency (IEA) paper “Global Land Transport Infrastructure Requirements” (2013) estimates global investment needs in land transport, including roads, bus rapid transit (BRT), rail, high-speed rail (HSR), and parking facilities between 2010 and 2050. Figure 1 compares the investment needs in a 2DS and a 4DS and highlights key figures from the report.
This paper compares the IEA equivalent figures for new infrastructure, reconstruction, and associated operations and maintenance (O&M) not associated with vehicles. It concludes that under a business-as-usual 4DS, the transport sector will need investments of $118.2 trillion between 2010 and 2050. On average, this works out to $3 trillion annually. This is cumulative investment that consists of capital investment and O&M. The analysis for capital projects includes new construction as well as reconstruction of infrastructure, whereas O&M primarily consists of repair and upkeep of infrastructure. In a 4DS, investment required for the construction of new projects would be $43.4 trillion, whereas reconstruction projects will cost $47.4 trillion and O&M costs for infrastructure will be $27.6 trillion.
In a 2DS, which entails significant efforts to address climate change, $98.8 trillion will be needed between 2010 and 2050, or an average of $2.5 trillion annually. For construc-tion of new projects, the investment required would be $32 trillion, whereas reconstruction will cost $41.7 trillion and O&M costs for infrastructure will be $25 trillion.
As Figure 1 illustrates, the IEA estimates cumulative investment savings of around $20 trillion and annual sav-ings of around $500 billion in a 2DS compared to a 4DS between 2010 and 2050. These investment savings stem from a shift in priorities toward low-emission transport modes such as BRT, rail, and HSR and a reduction in funding for new roads and parking facilities.
Investment in construction and reconstruction of roads is projected to cost $55.3 trillion cumulatively in a 4DS and $42.6 trillion cumulatively in a 2DS. BRT capital invest-ment is expected to cost $38 billion cumulatively in a 4DS and $352 billion cumulatively in a 2DS. Constructing parking facilities will cost $28.5 trillion cumulatively in a 4DS and $20.1 trillion in a 2DS. The construction of tra-ditional rail in a 4DS will reach $5.7 trillion cumulatively, versus $6.9 trillion cumulatively in a 2DS. High-speed rail construction reaches $1.3 trillion cumulatively in a 4DS and $3.8 trillion cumulatively in a 2DS.
Table 1 | Summary of Assumptions for Global Projections
TIME HORIZON TRANSPORT SUBSECTORS CLIMATE SCENARIO SCOPE
SOURCES START END ROAD RAIL AIRPORTS PORTS O>&Da VEHICLE EFFICIENCY 6DS 4DS 2DS N/A OPEX CAPEX
IEA 2013 2010 2050 ✔ ✔ ✔ ✔ ✔ ✔
OECD 2012 2009 2030 ✔ ✔ ✔ ✔ ✔ ✔
OECD 2006 2005 2030 ✔ ✔ ✔ ✔
McKinsey 2013 2013 2030 ✔ ✔ ✔ ✔ ✔ ✔
WEF 2013 2010 2030 ✔ ✔ ✔ ✔ ✔ ✔ ✔ ✔
NCE 2014b 2015 2030 ✔ ✔ ✔ ✔ ✔ ✔ ✔ ✔
ITDP/UC Davis 2014
2010 2050 ✔ ✔ ✔ ✔ ✔ ✔
Source: Authors, based on IEA 2013; OECD 2006; OECD 2012; McKinsey 2013; WEF 2013; NCEb 2014; and ITDP/UC Davis 2014
Note: a. O&G = oil and gas; T&D = transmission and distribution.

WORKING PAPER | April 2016 | 5
The Trillion Dollar Question II: Tracking Investment Needs in Transport
Table 2 | Summary of IEA Capex/Opex Estimates
2DS (2010–50) 4DS (2010–50)
Construction investment $32.0tr $43.4tr
Reconstruction investment $41.7tr $47.4tr
O&M costs of infrastructure $25.0tr $27.6tr
Total investment need $98.8tr $118.2tr
Source: Authors, based on IEA 2013
Figure 1 | IEA Estimates for Transport Investments, Cumulative, 2010–50
30,000
25,000
20,000
15,000
10,000
5,000
2DS 4DS
Road BRT Pa rking Rail HSR Total Capital Recon-struction
O&M Total
Table 3 | Summary of IEA Estimates
2DS (2010–50) 4DS (2010–50)
Construction & reconstruction roads $42.6tr $55.3tr
BRT capital investment $352bn $38bn
Parking facilities construction $20.1tr $28.5tr
Traditional rail construction $6.9tr $5.7tr
High-speed rail construction $3.8tr $1.3tr
Source: Authors, based on IEA 2013
6 |
Organisation for Economic Co-operation and DevelopmentThe OECD has undertaken two significant initiatives to calculate the infrastructure needs for the transport sector. The first report, Infrastructure to 2030 (2006), covers road and rail infrastructure needs in addition to other major types of infrastructure, including telecom, water, and electricity. The road and rail projections in particular are also reflected in the estimates of the World Economic Forum (2012), the New Climate Economy (2014), and McKinsey (2013), all discussed in this section. The Infra-structure to 2030 report assesses the demand for road and rail transport infrastructure based on population growth, economic growth, and measures of transport demand. The report estimates road construction investment of between $220 billion and $290 billion per year between 2005 and 2030, with majority investment toward replacing deterio-rating paved road stock capital. The report also estimates investment needs for rail transport infrastructure.
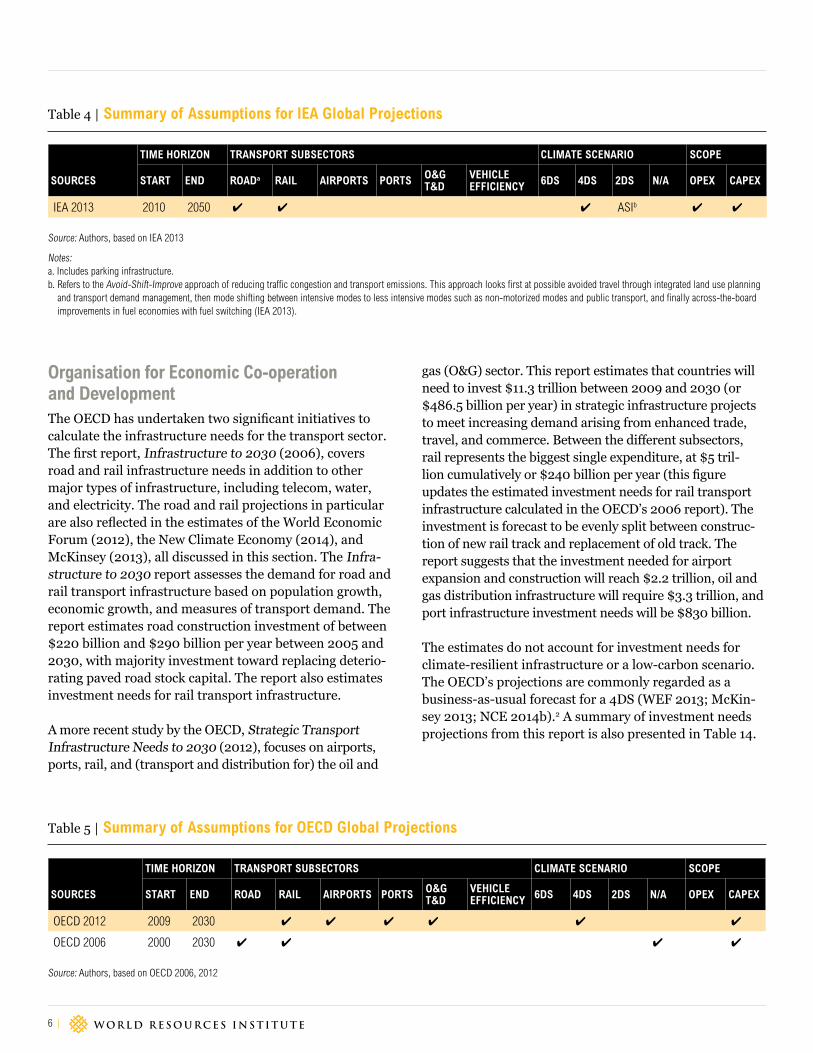
A more recent study by the OECD, Strategic Transport Infrastructure Needs to 2030 (2012), focuses on airports, ports, rail, and (transport and distribution for) the oil and
gas (O&G) sector. This report estimates that countries will need to invest $11.3 trillion between 2009 and 2030 (or $486.5 billion per year) in strategic infrastructure projects to meet increasing demand arising from enhanced trade, travel, and commerce. Between the different subsectors, rail represents the biggest single expenditure, at $5 tril-lion cumulatively or $240 billion per year (this figure updates the estimated investment needs for rail transport infrastructure calculated in the OECD’s 2006 report). The investment is forecast to be evenly split between construc-tion of new rail track and replacement of old track. The report suggests that the investment needed for airport expansion and construction will reach $2.2 trillion, oil and gas distribution infrastructure will require $3.3 trillion, and port infrastructure investment needs will be $830 billion.
The estimates do not account for investment needs for climate-resilient infrastructure or a low-carbon scenario. The OECD’s projections are commonly regarded as a business-as-usual forecast for a 4DS (WEF 2013; McKin-sey 2013; NCE 2014b).2 A summary of investment needs projections from this report is also presented in Table 14.
Table 4 | Summary of Assumptions for IEA Global Projections
TIME HORIZON TRANSPORT SUBSECTORS CLIMATE SCENARIO SCOPE
SOURCES START END ROADa RAIL AIRPORTS PORTS O&G T&D
VEHICLEEFFICIENCY 6DS 4DS 2DS N/A OPEX CAPEX
IEA 2013 2010 2050 ✔ ✔ ✔ ASIb ✔ ✔
Source: Authors, based on IEA 2013
Notes: a. Includes parking infrastructure. b. Refers to the Avoid-Shift-Improve approach of reducing traffic congestion and transport emissions. This approach looks first at possible avoided travel through integrated land use planning
and transport demand management, then mode shifting between intensive modes to less intensive modes such as non-motorized modes and public transport, and finally across-the-board improvements in fuel economies with fuel switching (IEA 2013).
Table 5 | Summary of Assumptions for OECD Global Projections
TIME HORIZON TRANSPORT SUBSECTORS CLIMATE SCENARIO SCOPE
SOURCES START END ROAD RAIL AIRPORTS PORTS O&G T&D
VEHICLEEFFICIENCY 6DS 4DS 2DS N/A OPEX CAPEX
OECD 2012 2009 2030 ✔ ✔ ✔ ✔ ✔ ✔
OECD 2006 2000 2030 ✔ ✔ ✔ ✔
Source: Authors, based on OECD 2006, 2012
WORKING PAPER | April 2016 | 7
The Trillion Dollar Question II: Tracking Investment Needs in Transport
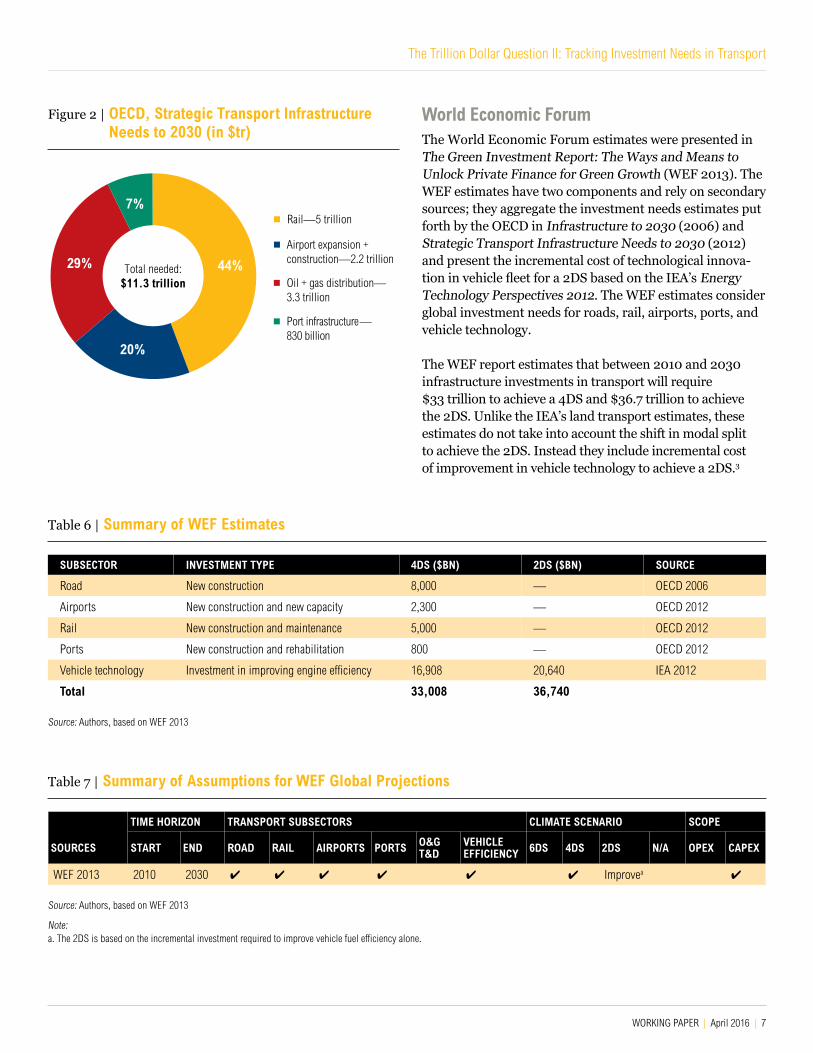
World Economic ForumThe World Economic Forum estimates were presented in The Green Investment Report: The Ways and Means to Unlock Private Finance for Green Growth (WEF 2013). The WEF estimates have two components and rely on secondary sources; they aggregate the investment needs estimates put forth by the OECD in Infrastructure to 2030 (2006) and Strategic Transport Infrastructure Needs to 2030 (2012) and present the incremental cost of technological innova-tion in vehicle fleet for a 2DS based on the IEA’s Energy Technology Perspectives 2012. The WEF estimates consider global investment needs for roads, rail, airports, ports, and vehicle technology.
The WEF report estimates that between 2010 and 2030 infrastructure investments in transport will require $33 trillion to achieve a 4DS and $36.7 trillion to achieve the 2DS. Unlike the IEA’s land transport estimates, these estimates do not take into account the shift in modal split to achieve the 2DS. Instead they include incremental cost of improvement in vehicle technology to achieve a 2DS.3
Figure 2 | OECD, Strategic Transport Infrastructure Needs to 2030 (in $tr)
Table 6 | Summary of WEF Estimates
SUBSECTOR INVESTMENT TYPE 4DS ($BN) 2DS ($BN) SOURCE
Road New construction 8,000 — OECD 2006
Airports New construction and new capacity 2,300 — OECD 2012
Rail New construction and maintenance 5,000 — OECD 2012
Ports New construction and rehabilitation 800 — OECD 2012
Vehicle technology Investment in improving engine efficiency 16,908 20,640 IEA 2012
Total 33,008 36,740
Source: Authors, based on WEF 2013
Table 7 | Summary of Assumptions for WEF Global Projections
TIME HORIZON TRANSPORT SUBSECTORS CLIMATE SCENARIO SCOPE
SOURCES START END ROAD RAIL AIRPORTS PORTS O&G T&D
VEHICLEEFFICIENCY 6DS 4DS 2DS N/A OPEX CAPEX
WEF 2013 2010 2030 ✔ ✔ ✔ ✔ ✔ ✔ Improvea ✔
Source: Authors, based on WEF 2013
Note: a. The 2DS is based on the incremental investment required to improve vehicle fuel efficiency alone.
Rail — 5 trillion
Airport expansion +construction—2.2 trillion
Oil + gas distribution—3.3 trillion
Port infrastructure —830 billion
29%
20%
44%
7%
Total needed:$11.3 trillion

8 |
According to this report, average transport investment required between 2010 and 2030 is about $1.8 trillion annually. This investment includes $845 billion in transport vehicles, $400 billion in road infrastructure, $250 billion in rail infrastructure, $40 billion in port infrastructure, and $115 billion in airport infrastructure. The additional annual investment needed in a 2DS is $187 billion through 2030 (to improve automotive vehicle efficiency). It is also impor-tant to note that the investment estimates for various subsectors may include different investment components, assumptions, and limits. For instance, the roads estimate includes only new construction, the airport investment estimate includes new airports as well as capacity enhance-ment of existing airports, the rail investment includes new construction as well as track maintenance, the estimate for ports covers construction of new ports and rehabilitation of current ports, and the investment in vehicle technology focuses on improving energy efficiency of vehicle engines.
McKinsey Global InstituteThe McKinsey Global Institute’s Infrastructure Produc-tivity: How to Save $1 Trillion a Year (2013) uses three approaches to estimate global infrastructure investment needs through 2030. It accounts for infrastructure invest-ment needs in roads, rails, ports, airports, power, water, and telecom. The estimated value of infrastructure invest-ment includes investment in new infrastructure stock as well as capitalized maintenance. The McKinsey projections do not take into account the costs of making infrastructure more resilient to the effects of climate change. Figure 3 below illustrates McKinsey’s estimates for infrastructure investment between 2013 and 2030, based on three different sets of assumptions:
1. Projections based on historic spending: McKinsey analyzes the historic infrastructure spending for 84 countries (accounting for 90 percent of global gross domestic product, or GDP). The analysis suggests that, historically, infrastructure spending has been 3.8 percent of GDP on average. Based on the global GDP growth estimate,4 this approach indicates total infrastructure investment needs to be around $62 tril-lion from 2013 through 2030. Transport infrastructure (road, rail, airports, and ports) investment needs are approximately $25 trillion, or $1.4 trillion per year.
2. Projection based on ratio of infrastructure stock to GDP: The second approach looks at financial value of infrastructure stock as a percentage of GDP5 in 12 countries6 and concludes that the value of infra-structure stock in most economies averages around 70 percent of GDP. According to this estimate future spending of infrastructure as a percentage of GDP will have to rise from 3.8 percent to 4.1 percent through 2030 to maintain an infrastructure stock of 70 percent of GDP. This amounts to $67 trillion in total infra-structure spending or $3.7 trillion annually. Transport infrastructure (road, rail, airports, and ports) invest-ment needs are approximately $23 trillion or $1.3 trillion per year.
3. Projection based on external estimates:7 Finally, the report aggregates infrastructure needs projections from various published sources, including ones from the African Development Bank, Asian Development Bank, GWI, IEA, OECD, and World Bank.8 Together, these estimates indicate the estimated need for infra-structure investment to be $57 trillion between 2013 and 2030. Transport infrastructure (road, rail, air-ports, and ports) investment needs are approximately $24 trillion or $1.3 trillion per year.
These estimates yield a range of between $57 trillion and $67 trillion in cumulative infrastructure spending needs between 2013 and 2030, or roughly $3.2 trillion to $3.7 trillion per year. Transport-specific spending (road, rail, airports, and ports) is estimated to be between $23 trillion to $25 trillion in cumulative terms, or $1.3 trillion to $1.4 trillion on an annual basis. On aver-age, the cumulative transport investment needs account for $16.6 trillion in roads, $4.5 trillion in rail, $2 trillion in airports, and $700 billion in ports. The report also explains that this estimate may undervalue the true future infrastructure needs, because of existing deferred main-tenance, new investment required to meet climate chal-lenges, and the existing infrastructure gaps that develop-ing countries need to overcome to reach higher levels of economic development.

WORKING PAPER | April 2016 | 9
The Trillion Dollar Question II: Tracking Investment Needs in Transport
The New Climate EconomyThe New Climate Economy (NCE) project published “Infrastructure Investment Needs of a Low-Carbon Sce-nario” (2014b) to consider incremental investment needs for a low-carbon 2DS. It shows a business-as-usual or base case investment need of $89 trillion in energy, transport, water and waste, and telecommunications in a 6DS. The report cites estimates for base case investment needs in transport at $13.67 trillion between 2015 and 2030 in roads, rail, airports, and ports. These estimates come from OECD reports mentioned earlier; the NCE report uses the road investment projections from OECD 2006 and remaining transport investment projections from OECD 2012. The main focus of this report is to assess the invest-
ment needs in technological improvements required to reduce greenhouse gas emissions.
The report estimates $8.8 trillion incremental investment to achieve a low-carbon scenario by improving energy effi-ciency in buildings, industry, and transport engines; out of this, $3.5 trillion is the estimated incremental investment for improving energy efficiency in the transport sector. The incremental investment amounts are based on the IEA’s Energy Technology Perspectives 2012. This estimate of incremental investment is also in line with the $3.7 bil-lion figure quoted by the WEF for improving automotive vehicle engine efficiency to achieve a 2DS. The analysis put forth by the NCE suggests that an incremental invest-ment in energy efficiency of infrastructure, coupled with
Figure 3 | McKinsey Estimates for Infrastructure Investment, 2013–30 (in $tr)
62
Roads
Rail
Ports
Airports
Power
Water
Telecom
Projection based on historical spending
Projection based on ratio of infrastructure
stock to GDP
Projection based on external estimates
10
0
20
30
40
50
60
70 67
57
Table 8 | Summary of Assumptions for McKinsey Global Projections
TIME HORIZON TRANSPORT SUBSECTORS CLIMATE SCENARIO SCOPE
SOURCE START END ROAD RAIL AIRPORTS PORTS O&G T&D
VEHICLEEFFICIENCY 6DS 4DS 2DS N/A OPEX CAPEX
McKinsey 2013 2013 2030 ✔ ✔ ✔ ✔ ✔ ? ✔
Source: Authors, based on McKinsey 2013
10 |
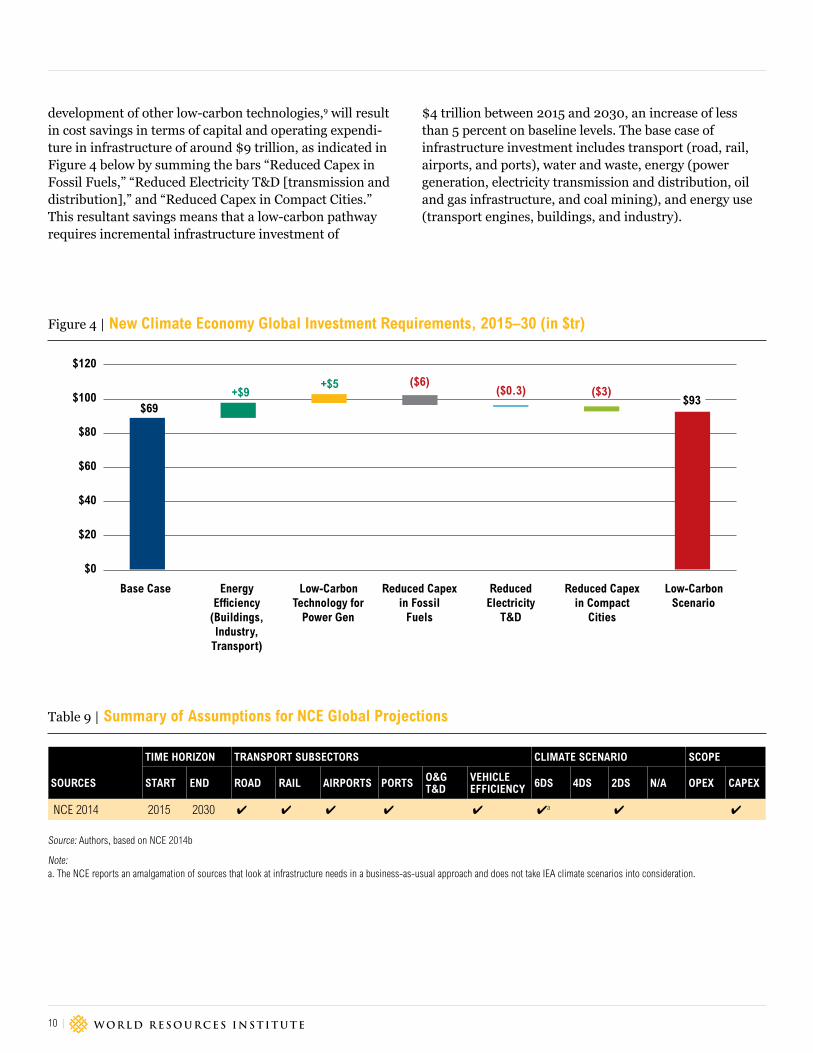
development of other low-carbon technologies,9 will result in cost savings in terms of capital and operating expendi-ture in infrastructure of around $9 trillion, as indicated in Figure 4 below by summing the bars “Reduced Capex in Fossil Fuels,” “Reduced Electricity T&D [transmission and distribution],” and “Reduced Capex in Compact Cities.” This resultant savings means that a low-carbon pathway requires incremental infrastructure investment of
$4 trillion between 2015 and 2030, an increase of less than 5 percent on baseline levels. The base case of infrastructure investment includes transport (road, rail, airports, and ports), water and waste, energy (power generation, electricity transmission and distribution, oil and gas infrastructure, and coal mining), and energy use (transport engines, buildings, and industry).
Table 9 | Summary of Assumptions for NCE Global Projections
TIME HORIZON TRANSPORT SUBSECTORS CLIMATE SCENARIO SCOPE
SOURCES START END ROAD RAIL AIRPORTS PORTS O&G T&D
VEHICLEEFFICIENCY 6DS 4DS 2DS N/A OPEX CAPEX
NCE 2014 2015 2030 ✔ ✔ ✔ ✔ ✔ ✔a ✔ ✔
Source: Authors, based on NCE 2014b
Note: a. The NCE reports an amalgamation of sources that look at infrastructure needs in a business-as-usual approach and does not take IEA climate scenarios into consideration.
Figure 4 | New Climate Economy Global Investment Requirements, 2015–30 (in $tr)
Base Case EnergyEfficiency
(Buildings,Industry,
Transport)
Low-CarbonTechnology for
Power Gen
Reduced Capexin Fossil
Fuels
ReducedElectricity
T&D
Reduced Capexin Compact
Cities
Low-CarbonScenario
$0
$20
$40
$60
$80
$100
$120
$69+$9
($6)+$5 ($0.3) ($3)$93

WORKING PAPER | April 2016 | 11
The Trillion Dollar Question II: Tracking Investment Needs in Transport
Institute for Transportation and Development Policy and University of California, Davis (ITDP/UC Davis)The Institute for Transportation and Development Policy (ITDP), in association with the University of California, Davis (UC Davis), published a paper titled “A Global High Shift Scenario: Impacts and Potential for More Public Transport, Walking, and Cycling with Lower Car Use” (2014) that examines the effect of major changes in urban transport investment on urban transport emissions and mobility for different income groups.10 To do this, it compares a baseline scenario based on the 4DS (IEA 2012) and creates a newly developed “high-shift” scenario char-acterized by far greater urban passenger travel by clean and non-motorized forms of transport, and a significant decrease in the rate of road construction, parking garages, and other types of infrastructure that encourage car own-ership. The baseline and high-shift scenarios both utilize the IEA’s Mobility Model (MoMo) and develop a detailed representation of travel, energy use, and CO2 emissions for the urban sector.
In analyzing transport system infrastructure requirements, the ITDP/UC Davis estimates total investment costs to be $500 trillion for a baseline scenario ($200 trillion for OECD countries and $300 trillion for non-OECD coun-tries), and $400 trillion ($160 trillion in OECD countries and $240 trillion in non-OECD countries) for a high-shift scenario. These estimates include vehicle purchase costs (for all types and all modes) and infrastructure capital costs to construct roads, sidewalks, parking lots and struc-tures, BRT, and rail and bus systems. Looking at Table 11 below, in a baseline scenario, this investment includes $4.9 trillion in rail infrastructure (which includes invest-ment in metro, tram, and commuter rail infrastructure), $178 billion in BRT, $19.2 trillion in parking infrastructure and $169 trillion in roads. Investment for roads includes the cost of roadways, bike lanes, and sidewalks.
However, in a high-shift scenario, this investment includes $18.6 trillion in rail infrastructure (which includes invest-ment in metro, tram, and commuter rail infrastructure), $816 billion in BRT, $7.2 trillion in parking infrastructure, and $110 trillion in roads. Investment for roads includes the cost of roadways, bike lanes, and sidewalks.
Table 10 | Summary of Assumptions for ITDP/ UC Davis Global Projections
TIME HORIZON TRANSPORT SUBSECTORS CLIMATE SCENARIO SCOPE
SOURCES START END ROAD RAIL AIRPORTS PORTS O&G T&D
VEHICLEEFFICIENCY 6DS 4DS 2DS N/A OPEX CAPEX
ITDP/UC Davis 2014
2010 2050 ✔ ✔Base-line
HS ✔ ✔
Source: ITDP/UC Davis 2014
Table 11 | Summary of ITDP Estimates
SUBSECTOR INVESTMENT TYPE BASELINE ($BN) HIGH-SHIFT ($BN) SOURCE
RoadInfrastructure costs for vehicle purchase and roadways, bike lanes, and sidewalks
168,912 109,704 ITDP 2014
BRT Infrastructure costs for BRT purchase and BRT 178 816 ITDP 2014
RailInfrastructure costs for rail purchase and metro lines, tram lines, commuter rail
4,905 18,606 ITDP 2014
Parking Infrastructure costs for parking 19,243 7,158 ITDP 2014
Total 193,238 136,285
Source: ITDP/UC Davis 2014

12 |
The total investment costs for a low-carbon “high-shift” scenario are 20 percent less than the baseline scenario. This cumulative savings amounts to roughly $100 tril-lion, or $2.5 trillion annually, in a 2DS compared to a 4DS between 2010 and 2050.
Unlike all estimates besides that of IEA 2013, the ITDP/UC Davis figure is a cumulative investment that consists of capital expenditure (capex) and operating expenditure (opex). The analysis for capex includes vehicle purchases and infrastructure, whereas opex primarily consists of fuel purchase and O&M expenses. As we see in Table 12, investment required for capex would be $203.7 trillion in a baseline scenario and $151.2 trillion in a 2DS. Invest-ment required for opex would be $309 trillion in a base-line scenario and $269.5 trillion in a 2DS.11
Breaking this down further (Table 13), the ITDP reports that vehicle purchase costs would be $117 trillion in a 4DS and $97 trillion in a 2DS, and would include the purchase of private vehicles, buses, BRT, and rail. Fuel purchase costs would be
Table 13 | Summary of ITDP Estimates (in $bn)
BASELINE HIGH-SHIFT
2010–50 2010–50
Purchase
Private vehicle 104,199 76,062
Bus 7,081 8,721
BRT 48 227
Rail 2,008 5,449
Cycle/e-bike 3,390 6,243
Total Purchase
116,727 96,701
Fuel
LDV-2W, liquid fuel
34,024 23,346
Bus, liquid fuel 4,311 5,097
BRT, liquid fuel 54 213
Electricity 534 1,180
Total Fuel
38,923 29,836
O&M
Road-related 151,317 118,634
Private vehicle 76,065 54,402
Bus 33,409 45,606
BRT 638 2,637
Rail 7,788 16,462
Cycle/e-bike 880 1,939
Total O&M
270,095 239,681
Infrastructure
Roadway 59,967 28,726
Parking 19,243 7,158
Bike lanes 160 1,172
Sidewalks 4,586 3,744
BRT 129 590
Metro lines 1,141 6,449
Tram lines 423 1,073
Commuter rail lines
1,333 5,636
Total infrastructure
86,983 54,547
Total costs 512,728 420,765
Source: ITDP/UC Davis 2014
Figure 5 | Capex versus Opex for Baseline and High-Shift Scenarios
High-shiftBaseline
$0
$50,000
$100,000
$150,000
$250,000
$200,000
$350,000
$300,000
Capex Opex
Table 12 | Capex versus Opex Split (in $tr)
CAPEX OPEX
Baseline 203.7 309.0
High-shift 151.2 269.5
Source: ITDP/UC Davis 2014

WORKING PAPER | April 2016 | 13
The Trillion Dollar Question II: Tracking Investment Needs in Transport
Table 14 | Summary of Global Investment Needs Estimates (in $bn)
SOURCES TIME PERIOD
CLIMATE SCENARIO TARGET ROAD PARKING RAIL BRT HSR AIRPORTS PORTS VEHICLE
TECH
O&G INTER-REGIONAL TRANSPORTA
TOTAL
IEA 2013 2010–50 2DS 2° $61,100 $24,000 $9,300 $406 $4,100 — — — — $98,906
IEA 2013 2010–50 4DS/6DS 4°/6° $75,400 $33,600 $7,800 $48 $1,400 — — — — $118,248
WEF 2013 2010–30 2DS 2° $8,000 — $5,000 — — $2,300 $800 $20,640 — $36,740
WEF 2013 2010–30 4DS/6DS 4°/6° $8,000 — $5,000 — — $2,300 $800 $16,908 — $33,008
OECD 2012 2009–30 — — — — $5,000 — — $2,200 $830 — $241 $8,271
NCE 2014b 2015–30 Basecase 6° $6,200 — $4,690 — — $2,080 $700 — — $13,670
McKinsey 2013
2013–30 — — $16,600 — $4,500 — — $2,000 $700 — — $23,800
ITDP/UC Davis 2014
2010–50 High-shift 2° $109,704 $7,158 $18,606 $816 — — — — — —
ITDP/UC Davis 2014
2010–50 Baseline 4° $168,912 19,243 $4,905 $178 — — — — — —
Source: Authors, based on IEA 2013; WEF 2013; OECD 2012; NCE 2014b; McKinsey 2013; and ITDP/UC Davis 2014
Notes: Actual figures as presented in the respective studies. a. OECD 2012 explains that its figure for world total investment needs in infrastructure (2009–30) includes $241 billion investment in interregional transport infrastructure for oil and gas
transportation and distribution (2010–35).
$39 trillion in a baseline scenario and $30 trillion in a 2DS, and include electricity and liquid fuel for long-distance vehicles (LDV), buses, and BRT. O&M expenses would be $270 trillion in a baseline scenario and $240 trillion in a 2DS, and include costs for roads, private vehicles, buses, BRT, and rail. Infra-structure construction costs would be $87 trillion in a baseline scenario and $55 trillion in a 2DS, and include roads, parking, bike lanes, sidewalks, BRT, metro lines, tram lines, and com-muter rail lines. In summary, vehicle purchase costs account for all types of vehicles and all modes; fuel costs account for all types of vehicles and all modes; vehicle and transit system operating and maintenance costs include daily O&M costs and infrastructure maintenance costs; and infrastructure capital costs include the one-time investment costs to construct roads, sidewalks, parking lots and structures, as well as BRT, rail, and bus systems.
SUMMARY OF GLOBAL INVESTMENT NEEDS In synthesizing these estimates, the IEA, OECD, McKinsey, and ITDP/UC Davis produced original esti-mates, whereas the WEF and NCE repackaged existing estimates based on OECD and IEA data.12 Only the IEA and ITDP/UC Davis reports integrate operating expen-ditures in their global investment needs estimates.
A summary of all global estimates surveyed in this paper is presented below in Table 14; each estimate is quoted directly from the corresponding source.
In developing a comprehensive investment needs estimate later in the paper we only use capex estimates.
DEVELOPING A CONSOLIDATED GLOBAL INVESTMENT NEEDS ESTIMATE
Based on the global investment needs estimates surveyed in Section 2, we developed a range of annual transport infrastructure needs up to 2030. We used the most up-to-date projections for every subsector for capital investment in order to build a consolidated estimate. We have only considered the investment required for construction of new projects or reconstruction and rehabilitation of old infrastructure. Our investment needs analysis does not take into account investment in rolling stock, operational costs, or repairs and maintenance of the infrastructure.
We use the land transport projections—covering roads, parking, BRT, rail, and HSR—from the IEA’s “Global Land Transport Infrastructure Requirements” (2013). These pro-jections constitute the most up-to-date and comprehensive

14 |
Table 15 | Transport Infrastructure Investment Needs Summary (in $bn)
SUBSECTOR 4DS % OF 4DS 2DS % OF 2DS 4DS TO 2DS SHIFT % SHIFT SOURCE
Road $1,375 58.7% $1,135 55.8% ($240) −17.5% IEA 2013
Parking $635 27.1% $505 24.8% ($130) −20.5% IEA 2013
Rail $130 5.5% $155 7.6% $25 19.2% IEA 2013
BRT $1 0.0% $9 0.4% $8 805.0% IEA 2013
HSR $47 2.0% $73 3.6% $26 54.0% IEA 2013
Airports $105 4.5% $105 5.2% n/a n/a OECD 2012
Ports $40 1.7% $40 1.9% n/a n/a OECD 2012
Interregional $11 0.5% $11 0.6% n/a n/a OECD 2012
Total $2,344 $2,033 ($311)
Source: Authors, based on IEA 2013, and OECD 2012
Notes: 1. O&M costs have been excluded from the investment estimates. 2. OECD 2012 does not account for climate impact of suggested investment needs.
Figure 6 | Summary of Global Investment Needs (in $bn)
1
11
1
1
IEA (2013)
IEA (2013)
WEF (2012)
WEF (2012)
OECD (2012)
NCE (2014)
McKinsey (2013)
ITDP/UC Davis (2014)
ITDP/UC Davis (2014)
$0
$20,000
$80,000
$60,000
$40,000
$120,000
$100,000
$160,000
$140,000
$180,000
Road BRTrPa king Rail HSR r rAi po ts rPo ts Vehicle cTe h
O+G Inter-Regional
Transport [I]

WORKING PAPER | April 2016 | 15
The Trillion Dollar Question II: Tracking Investment Needs in Transport
forecast of land infrastructure needs that takes into account data points for travel demand from 33 countries. The IEA projections are based on the travel demand projections of the IEA’s Mobility Model.13 Each transport subsector has been considered with regards to the 4DS and 2DS for trans-port sector growth. The projections distinguish between capital expenditure and spending needs for maintenance, which makes it easier to identify the investment needs for capital projects for these subsectors.
For strategic transport infrastructure such as airports, ports (seaports and dryports), and interregional infrastructure, we use the projections from Strategic Transport Infra-structure Needs to 2030 (OECD 2012) as this is the only global estimate covering these subsectors. From a climate scenario perspective on investment needs, this is not a perfect union, because the OECD does not specify a climate scenario, while IEA projections are based on the 2DS and 4DS. Cumulative investment in airports, ports, and inter-regional infrastructure is $156 billion; that amounts to 6.6 percent of the 4DS estimate and 7.7 percent of our 2DS estimate. Because insufficient data are available on invest-ment needs for these transport subsectors in the context of specific climate scenarios, we include these estimates as an
indicative figure to get an idea of the full range of transport investment needs.
This consolidation of estimates gives us two different esti-mates, one for a 4DS pathway for transport and another for a 2DS pathway, generated as savings from reduced spending on roads and parking (see Figure 7). The 4DS estimate of $2.3 trillion is 15 percent higher than the 2DS estimate of $2 trillion, which shows that a low-carbon investment pathway that prioritizes sustainable transport will cost less in the future. When compared to the global investment flows estimates of $1.4 trillion to $2.1 trillion (Lefevre and Leipziger 2014), the projected needs for a 4DS lie outside the range of current financial means and indicate an investment gap of between $244 billion and $944 billion per year. In contrast, projected investment needs to achieve a 2DS lie within the current flows range of $1.4 trillion to $2.1 trillion. Thus, on a global scale, cur-rent financial flows could be adequate to meet the future transport infrastructure needs under a 2DS pathway. If we assume that the financial flows lie at the lower end, that is, $1.4 trillion, the maximum shortfall for the 2DS is $633 billion, which is $311 billion less than the maximum shortfall under the 4DS.
Figure 7 | Transport Infrastructure Investment Needs Summary (in $bn)
Road BRTParking Rail HSR Airports Ports Interregional Total
2DS4DS
$0
$500
$1,000
$1,500
$2,000
$2,500

16 |
There is also a significant economic cost to pursuing a 4DS path of development. The IEA estimates that low-carbon transport in a 2DS can save $20 trillion in infrastructure expenditures; if vehicles and fuel are included, the total potential savings is $70 trillion. The New Climate Econ-omy report suggests that urban sprawl in the United States adds costs of around $400 billion per year, mostly result-ing from greater infrastructure, public service delivery, and transport costs. Similarly, the report indicates that congestion has been imposing high costs on several cities.
The World Bank estimates that congestion costs run up to 3.5 percent of the city’s GDP in Buenos Aires, 2.6 per-cent in Mexico City, and 4 percent in Cairo. The OECD estimates that the social costs of road transport in OECD countries, China, and India combined are $3.5 trillion per year, including the value of health impacts and lives lost (NCE 2014c). Therefore, a low-carbon 2DS pathway not only can serve as an instrument to save money for governments but also can help avoid enormous economic costs in the long term.
Figure 9 | Transport Infrastructure Investment: 4DS to 2DS Shift, 2010–30 (in $bn)
4DS Roads Parking Rail BRT HSR 2DS
$2,344 ($240)
+$25($130)+$8 +$26 $2,033
$0
$500
$1,000
$1,500
$2,000
$2,500
Figure 8 | A 2DS Pathway is Within Current Financial Flows
$0 0.5T 1T 1.5T
1.4T 2.1T
2T 2.5T
Current Financial Flows
Future Investment Needs 2DS 4DS
WORKING PAPER | April 2016 | 17
The Trillion Dollar Question II: Tracking Investment Needs in Transport
LIMITATIONS OF ANALYSISGiven the multiple efforts to date to quantify transport investment needs using different approaches, it is impor-tant to clarify and analyze the underlying assumptions of these estimates before developing a consolidated estimate.
None of the studies used for our consolidated estimate take into account the rebound effect (increased travel activity resulting from availability of infrastructure) or the impact on latent demand for each mode as we witness a modal shift in transport infrastructure investments. Therefore, the true scale of investment needs differs from these projections and will depend greatly on which path of development is pursued.
It is also possible that the 2DS may be cheaper than the consolidated estimate provided in this report, as the underlying estimates do not take into account the limiting effect of 2DS development on other modes, such as air travel, shipping/freight, and interregional infrastructure. If we pursue a 2DS investment pathway that relies less on road infrastructure and more on sustainable modes such as HSR/rail and BRT, we may also see less need to invest in smaller airports, expansion of existing ports, and inter-regional infrastructure, but these effects have not been studied by the OECD or IEA. According to OECD 2012, 35 percent of seaborne freight traffic consists of transport-ing fossil fuel; hence reducing dependence on fossil fuels will have an impact on future port infrastructure needs.
Another element worth considering is the impact of a low-carbon pathway on the financial capacity. Would the transition’s impact on the value of existing investments—that is, the assets it would strand—reduce the capacity of investors and governments to invest? The Climate Policy Initiative (CPI 2014) did a first evaluation of the impact on the global financial system of investment in a low-carbon economy, considering investment needs, operating expenses, use of capital stock (depreciation and amortiza-tion), financing costs, and the impact of stranded assets. Currently, not enough analysis and information is avail-able, but this is certainly a crucial next step to inform the debate and the policymaking.
We have already discussed the misalignment of climate scenarios and approaches between different studies. While the IEA clearly establishes the basis for 2DS and 4DS travel needs and investment estimates, the OECD, which serves as a base case for many estimates, does not clearly specify if the projected path will lead to a 6DS or a 4DS. The confusion is exacerbated by the fact that the WEF uses the OECD estimates as a base case for the 4DS and NCE uses the same estimates as a base case for the 6DS.
Another important point is that these estimates are restricted to global needs and flows and do not take into account the flows-versus-needs balance on a regional or country level. A similar exercise at regional and national levels is essential in order to assess the true flows-versus-needs equation in various regions. Similarly, we do not have a flows estimate disaggregated in terms of transport subsec-tors, which makes it impossible to compare subsector needs with investment flows in those particular subsectors.
Given the lack of uniformity of approach among these various estimates (and between regional and global esti-mates), the regional estimates may not be comparable to the global investment needs estimates in our paper.
18 |
CONCLUSIONThe synthesis of studies presented in this paper can be summarized in three main points:
▪ A low-carbon pathway for transport infrastructure development is likely to be more affordable than the current business-as-usual approach that prioritizes road infrastructure.
▪ A low-carbon 2DS pathway falls within the existing financial resources invested in transport.
▪ Realizing a low-carbon scenario in the transport sector will thus be a matter of shifting portfolios of investments, projects, and policies toward sustainable options. Policymakers have a critical role to play in this effort.
We base this conclusion on the consolidated estimate for transport infrastructure annual investment needs: $2 trillion to achieve the 2DS and $2.3 trillion to achieve the 4DS. Pursuing a 4DS will end up costing much more if we take into account the external costs resulting from congestion, air quality, and urban sprawl. The cost advan-tage of a low-carbon scenario is significant because of the already constrained fiscal resources in developing countries. The estimates presented in this paper reveal an emerging consensus that a low-carbon future of infrastructure devel-opment will cost less than current high-carbon patterns of development, and significantly less over the long term.
Moreover, our analysis demonstrates that a low-carbon scenario is within the current means. This opens up an array of new options for prioritizing sustainable trans-port investment. Hence, a greener path toward transport infrastructure is not only attractive as a climate change mitigation strategy, but it is also feasible, that is, within the current financial flows invested in the transport sec-tor. In addition, it has the potential to bring more overall prosperity through financial savings.
The allocation decision depends on the path of development pursued by different countries, which means that local and national policymakers are the strategic players in driving this shift toward sustainable transport modes. Their policy and public investment decisions will frame the market and drive private investment. On a domestic level, policy lead-ers such as ministers of finance, ministers of transport, or directors of national development banks need to shift their involvement and portfolios in transport to support a low-carbon pathway. Multilateral development banks can do the same, setting trends on low-carbon portfolio allocation, incentivizing and supporting more sustainable decisions by national and local decision makers.
In order to facilitate better decision-making that helps divert funds toward more sustainable modes of transport, there is still a need for more data inputs, data that are collected in a more systematic fashion and at the appro-priate level of analysis. Once there is similar analysis and improved data on investment flows and needs available on national and regional levels, policymakers, investors (private, public, domestic, and ODA), and researchers can direct their efforts in a more focused manner. Our review of regional needs estimates reveals that regional estimates do not adequately capture the needs of fast-growing developing countries, especially in Africa.

WORKING PAPER | April 2016 | 19
The Trillion Dollar Question II: Tracking Investment Needs in Transport
Latin America and the Caribbean will contribute the most to global population growth. Together these three regions will add around 1 billion people to the world population, accounting for 96 percent of population growth during this time period. Given the strong link between population growth and transport infrastructure investment needs, this section of the report focuses on invest-ment needs estimates for Asia, Africa, and Latin America and the Caribbean presented in various region-specific projections.
These regions will also experience the greatest growth in urbanization, with 1 billion additional urban residents expected in Asia, Africa, and Latin America and the Caribbean (see Table 17). This is another indicator that these three regions will experience great demand for new infrastructure.
APPENDIXRegional EstimatesWhile global estimates are generally more comprehensive than ones made on the regional level (given the different approaches and varying scope of studies from which the latter are derived), they often do not provide disaggre-gated regional data despite using regional data for estimating global demand. Although several independent regional estimates for investment needs are discussed in this section, information, data, and consistency needed to aggregate the estimates into a cohesive number is clearly lacking.
According to the UN Population Division, world population is projected to grow by 1.1 billion between 2015 and 2030 (see Table 16). Asia, Africa, and
Table 16 | World Population Projections (in thousands)
2010 2015 2030 2050 CHANGE 2015–30
CAGR 2015–30
World 6,916,183 7,324,782 8,424,937 9,550,945 1,100,155 0.94%
Africa 1,031,084 1,166,239 1,634,366 2,393,175 468,127 2.28%
Asia 4,165,440 4,384,844 4,886,846 5,164,061 502,002 0.73%
Europe 740,308 743,123 736,364 709,067 −6,759 −0.06%
Latin America and Caribbean 596,191 630,089 716,671 781,566 86,582 0.86%
Northern America 346,501 361,128 403,373 446,201 42,245 0.74%
Oceania 36,659 39,359 47,317 56,874 10,658 1.28%
Source: Authors, based on United Nations, Department of Economic and Social Affairs, Population Division, World Urbanization Prospects: The 2014 Revision
Table 17 | Urban Population Projections (in thousands)
2010 2015 2030 2050 CHANGE 2015–30
CAGR 2015–30
Africa 394,940 471,602 770,068 1,338,566 298,466 3.32%
Asia 1,864,836 2,113,137 2,752,457 3,313,424 639,320 1.78%
Europe 537,982 547,066 566,970 581,113 19,904 0.24%
Latin America and Caribbean 467,642 502,793 595,134 673,631 92,341 1.13%
Northern America 279,949 294,834 339,782 390,070 44,948 0.95%
Oceania 25,924 27,853 33,747 41,807 5,894 1.29%
Source: Authors, based on United Nations, Department of Economic and Social Affairs, Population Division, World Urbanization Prospects: The 2014 Revision

20 |
Asia-Pacific The Asian Development Bank’s working paper “Estimating Demand for Infra-structure in Energy, Transport, Telecommunications, Water and Sanitation in Asia and the Pacific: 2010–2020” (ADBI 2010) estimates total infrastructure investment needs in Asia between 2010 and 2020 at $8.33 trillion (in 2010 dollars; see Table 18). The report combines a top-down approach to estimate national investment needs with a bottom-up approach to estimate regional infrastructure needs. The top-down approach uses an econometric model developed by Fay (2001) to project the change in demand for infrastructure services.14 The bottom-up approach for estimation of regional infrastructure demand identifies infrastructure projects at a regional scale and estimates the cost of their construction.15
The estimate covers transport (airports, ports, railways, and roads), telecom-munications (landlines and mobile phones), energy (power), and water and sanitation for 32 developing countries in Asia. The infrastructure investment needs estimate does not specify a climate scenario and includes investment in new infrastructure as well as maintenance of infrastructure.
Of the total investment estimate for infrastructure, 35 percent, or $2.9 trillion, is needed for transport infrastructure, which translates to around $300 billion per year. Among the different subregions covered in this report, East and Southeast Asia’s annual needs are $161 billion, South Asia needs are $121 billion annually, Central Asia requires $11 billion, and the Pacific needs $450 million for transport infrastructure annually.
Table 19 | Summary of Assumptions for Asia
TIME HORIZON TRANSPORT SUBSECTORS CLIMATE SCENARIO SCOPE
SOURCES START END ROAD RAIL AIRPORTS PORTS O&G T&D
VEHICLEEFFICIENCY 6DS 4DS 2DS N/A OPEX CAPEX
ADBI 2010 2010 2020 ✔ ✔ ✔ ✔ ? ? ✔ ✔
Source: Authors, based on ADBI 2010
Table 18 | Transport Infrastructure Needs in Asia, 2010–20 ($bn/year)
SUBSECTOR EAST AND SOUTHEAST ASIAa SOUTH ASIAb CENTRAL ASIAC THE PACIFICd TOTAL
Airports 5.85 0.51 0.14 0.01 6.51
Ports 21.80 3.65 0.54 — 25.99
Rail 1.63 1.29 0.61 — 3.54
Roads 132.15 115.68 9.28 0.44 257.55
Total 161.42 121.14 10.58 0.45 293.59
Source: ADBI 2010
Notes: a. East and Southeast Asia: Cambodia, China, Indonesia, Laos, Malaysia, Mongolia, Myanmar, the Philippines, Thailand, and Vietnam b. South Asia: Bangladesh, Bhutan, India, Nepal, and Sri Lanka c. Central Asia: Afghanistan, Armenia, Azerbaijan, Georgia, Kazakhstan, the Kyrgyz Republic, Pakistan, Tajikistan, and Uzbekistan d. The Pacific: Fiji, Kiribati, Papua New Guinea, Samoa, the Solomon Islands, Timor-Leste, Tonga, and Vanuatu
Figure 10 | Transport Infrastructure Needs in Asia, 2010–20, in Percentage Terms
East and Southeast Asia
South Asia
Central Asia
The Pacific
55%44%
4%
0%

WORKING PAPER | April 2016 | 21
The Trillion Dollar Question II: Tracking Investment Needs in Transport
AfricaThe Africa Development Forum (created by the World Bank and the French Agency for Development) published Africa’s Infrastructure: A Time for Trans-formation (ADF/WB 2010), which estimates infrastructure investment needs for the continent for the period 2006–15. The report covers investment needs in power, transport, irrigation, water and sanitation, and information and com-munication technology. It estimates annual investment needs of $93 billion, of which $60.4 billion is capital expenditure and $33.0 billion is O&M.
The report projects transport investment needs at $18.2 billion annually. More than half of this investment (or $9.4 billion) will be spent on O&M, with the remaining $8.8 billion needed for capital expenditures. The transport investment needs in the report cover roads, rail, ports, and airports.
The projection for new road infrastructure is based on a set of connectivity goals. These goals include the following: “(a) connecting large cities and international frontiers with a good-quality, two-lane paved road; (b) connect-ing intermediate cities and the provincial capital with a good quality, one-lane paved road; (c) increasing to 100 percent the proportion of the rural popula-tion living within 2 kilometers of an all-season road in the agricultural areas
comprising the 80 percent highest production value within each country; and (d) putting the urban population within 500 meters of a road supporting all-season bus access” (ADF/WB 2010).
The projection for rail investment needs in sub-Saharan Africa (excluding South Africa) considers the amount of resources required to rehabilitate the existing rail infrastructure; long-term maintenance neglect has caused a significant backlog, and the report estimates that $3 billion is needed to reha-bilitate existing infrastructure. The sub-Saharan rail network (excluding South Africa) consists of 44,000 kilometers of track, of which only 34,000 kilometers are operational. Once the current network is fully operational, it is expected that $100 million will be required every year for track reconstruction and that $20 million a year will go toward O&M. An additional $80 million a year will be required to sustain an adequate rolling stock fleet. Thus, the combined annual investment for rail infrastructure is projected to be $500 million for 10 years. The projections do not include investment needs for construction of new rail infrastructure, but they give an estimated cost of $1.5 million per kilometer for flat terrain and $5 million for rugged terrain. The Organization of African Unity approved a plan for 26,000 kilometers of new rail infrastructure for a pan-African rail network. There has been limited progress on the initial
Table 20 | Summary of ADF/WB Africa Projected Needs ($bn/year)
INVESTMENT TYPE INFRASTRUCTURE TRANSPORT SOURCE
New construction and O&M 93.3 18.2 ADF/WB 2010
New construction and O&M 75.5 20.3 WB 2008
Source: Authors, based on ADF/WB 2010; and WB 2008
Table 21 | Summary of PIDA Projected Needs ($bn/year)
TIME HORIZON INVESTMENT TYPE INFRASTRUCTURE TRANSPORT PORTION OF INFRASTRUCTURE SOURCE
2012–20 New construction 8.5 3.2 PIDA 2011
2012–40 New construction 13+ 5+a PIDA 2011
Source: Authors, based on PIDA 2014
Notes: a. Prorated estimate on the basis of the transport investment share in the Priority Action Plan for 2012–20 as PIDA only quotes a consolidated figure for long-term infrastructure. Transport
portfolio is 37 percent ($25.4 billion/$67.9 billion) of the short-term investment plan.
Table 22 | Summary of Assumptions for Africa
TIME HORIZON TRANSPORT SUBSECTORS CLIMATE SCENARIO SCOPE
SOURCES START END ROAD RAIL AIRPORTS PORTS O&G T&D
VEHICLEEFFICIENCY 6DS 4DS 2DS N/A OPEX CAPEX
ADF/WB 2010 2006 2015 ✔ ✔ ? ? ✔ ✔
WB 2008 ? ? ✔ ✔ ? ?
PIDA 2011, 2014 2012 2020 ✔ ✔ ✔ ✔ ? ?
Source: Authors, based on PIDA 2014; WB 2008; and ADF/WB 2010

22 |
plan, but the Union of African Railways is now concentrating on a revised plan of 10 corridors (Bullock 2009).
Another report by the World Bank, Overhauling the Engine of Growth: Infrastructure in Africa (2008), presents a similar estimate of $20.3 billion in annual transport spending needs for sub-Saharan Africa, with $10.7 billion in capital expenditure needs and $9.6 billion for O&M. Table 20 captures the different estimates provided by the ADF/WB and WB reports.
The Programme for Infrastructure Development in Africa (PIDA)—a joint initiative of the African Union Commission, the New Partnership for Africa’s Development, and the African Development Bank to bridge the infrastructure deficit in Africa—has outlined a strategic infrastructure program known as the Priority Action Plan (PAP). The PAP details the immediate way forward by pre-senting an actionable set of short- and medium-term projects and programs, promoting sound regional integration between 2012 and 2020. The plan consists of 50 projects and programs grouped into four general categories: energy, transport, water, and information and communication technologies.
It is estimated that these projects will cost $67.9 billion between 2012 and 2020. An estimated $25.4 billion—37 percent of the total—will be needed for transport. Transport projects will focus on connectivity, corridor moderniza-tion, ports and railways modernization, and air transport modernization. The long-term infrastructure pipeline identified by PIDA will run through 2040 and has an estimated cost of more than $360 billion. The long-term goals set under the strategic framework of African integration call for an additional 37,300 kilometers of modern highways and 30,200 kilometers of railway lines (PIDA 2011).
The two estimates are based on a different set of objectives, with the estimates presented in Table 20 focusing on domestic infrastructure needs of the countries and the PIDA estimates presented in Table 21 focusing on regional connectivity and strategic infrastructure. It is possible that the two may overlap to some degree, but, if we assume that PIDA can be considered an addition to the World Bank/ADF estimates, we get a range of between $18 billion and $25 billion per year for transport infrastructure in Africa.
Table 23 | Summary of LAC Needs ($bn/year)
INVESTMENT GAP
TIME HORIZON INVESTMENT TYPE INFRASTRUCTURE TRANSPORT SOURCE
Vertical gap 2006–20 New construction and maintenance 216.4 47.1 PIDA 2011
Horizontal gap 2006–20 New construction 328.4 132.6 PIDA 2011
Source: IADB 2011
Note: Figures converted to 2010 dollars.
Table 24 | Summary of Assumptions for LAC
TIME HORIZON TRANSPORT SUBSECTORS CLIMATE SCENARIO SCOPE
SOURCES START END ROAD RAIL AIRPORTS PORTS O&G T&D
VEHICLEEFFICIENCY 6DS 4DS 2DS N/A OPEX CAPEX
IADB 2011 2010 2020 ✔ ✔ ? ? ✔ ✔
Source: Authors, based on IADB 2011

WORKING PAPER | April 2016 | 23
The Trillion Dollar Question II: Tracking Investment Needs in Transport
Latin AmericaThe Infrastructure Gap in Latin America and the Caribbean, a study authored by Daniel Perrotti and Ricardo Sánchez for the Economic Commission for Latin America and the Caribbean (IADB 2011), lists two approaches to quantify the infrastructure gap in Latin America and the Caribbean (LAC).16 They measure the gap using a vertical approach and a horizontal approach. The vertical approach has to do with the region’s internal factors and entails determining whether the infrastructure stock and investment match the demand generated by economic activity. The horizontal approach is based on achieving a certain level of development to meet the gap based on relative benchmarks. To determine the horizontal infrastructure gap in LAC, the authors compared the per capita infrastructure stock of LAC with a group of East Asian countries including Hong Kong, Malaysia, Singapore, and South Korea. The study includes the follow-ing infrastructure sectors: electricity, telecommunications (fixed lines, mobile phones, and fixed broadband access), surface transport (paved roads and rail-ways), and water and sanitation. The respective estimated infrastructure needs translate to $216 billion and $328 billion (in 2010 dollars) annually based on the vertical17 and horizontal18 gaps identified by IADB 2011.19
The study only includes paved roads and railroad investment needs for the transport sector. The vertical gap analysis suggests that paved roads require $42 billion annually, out of which $19 billion is for capital investment and the remaining $23 billion is for maintenance. It also quantifies investment needs for railroads at $6 billion, all of which will be spent on maintenance. The horizontal gap analysis suggests that in order to achieve the same provision of paved roads and railways per capita as the East Asian group of countries, LAC will need $124 billion and $9 billion for new roads and railways, respectively.
Way Forward for Regional NeedsAs we have noted, the disparate nature of regional studies makes it difficult to consolidate these estimates. If we put together the estimates discussed above, we get a consolidated number of approximately $450 billion. This estimate in-cludes both capital as well as O&M costs; hence, it is not comparable with our consolidated global needs estimate. The regional studies are also ambiguous about the climate impact of these investment estimates. This approximation of $450 billion per year also does not adequately capture the needs of Africa when compared to other regions. Africa is only 6 percent20 of this approxima-tion, while it represents nearly 20 percent of the combined population of the three regions. Africa is also expected to record the largest population growth over the next 40 years, and GDP growth is expected to stay between 5 and 6 percent per year until 2050 (African Development Bank 2011). Therefore, these regional estimates put together do not take into account the dramatic shift in world demographics anticipated in the next few decades.
Thus, there is a substantial need to gather and develop more information on regional infrastructure needs with consistent methodology and clearly stated assumptions. This will provide decision makers with better information on the financial flows within regions and subregions, and possibly at national levels. Similarly, the climate impact of transport infrastructure investment needs in developing countries should be incorporated in future efforts to estimate investment needs; this is particularly important in Asia and Africa, as the two regions will experience 88 percent of the world’s population growth between 2015 and 2030.
Table 25 | Summary of Assumptions for Asia, Africa, and Latin America and the Caribbean
TIME HORIZON TRANSPORT SUBSECTORS CLIMATE SCENARIO SCOPE
SOURCES START END ROAD RAIL AIRPORTS PORTS O&G T&D
VEHICLEEFFICIENCY 6DS 4DS 2DS N/A OPEX CAPEX
ADBI 2010 2010 2020 ✔ ✔ ✔ ✔ ? ? ✔ ✔
ADF/WB 2010 2006 2015 ✔ ✔ ? ? ✔ ✔
WB 2008 ? ? ✔ ✔ ? ?
PIDA 2011, 2014 2012 2020 ✔ ✔ ✔ ✔ ? ?
IADB 2011 2010 2020 ✔ ✔ ? ? ✔ ✔
Source: Authors, based on ADBI 2010; IADB 2011; PIDA 2014; WB 2008; and ADF/WB 2010

24 |
REFERENCES
Africa Development Forum/World Bank (ADF/WB). 2010. Africa’s Infrastructure: A Time for Transformation, edited by Vivien Foster and Cecilia Briceño-Garmendia. https://openknowledge.worldbank.org/handle/10986/2692.
Asian Development Bank Institute (ADBI). 2010. “Estimating Demand for Infrastructure in Energy, Transport, Telecommunications, Water and Sanitation in Asia and the Pacific: 2010–2020,” by Biswa Nath Bhattacharyay. Working paper. http://www.adb.org/sites/default/files/publication/156103/adbi-wp248.pdf.
Canning, David, and Marianne Fay. 1993. “The Effects of Transportation Networks on Economic Growth.” Columbia University Academic Commons. http://hdl.handle.net/10022/AC:P:15545.
Gwilliam, Ken M. 2002. Cities on the Move: A World Bank Urban Transport Strategy Review. Washington, DC: World Bank. http://siteresources.worldbank.org/INTURBANTRANSPORT/Resources/cities_on_the_move.pdf.
Institute for Transport and Development Policy (ITDP) and University of California, Davis. 2014. “A Global High Shift Scenario: Impacts and Potential for More Public Transport, Walking, and Cycling with Lower Car Use.” September. https://www.itdp.org/wp-content/uploads/2014/09/A-Global-High-Shift-Scenario_WEB.pdf.
Inter-American Development Bank (IADB). 2011. The Infrastructure Gap in Latin America and the Caribbean, by Daniel Perrotti and Ricardo Sánchez. Serie DRNI 153. Santiago de Chile: CEPAL.
International Energy Agency (IEA). 2012. Energy Technology Perspectives 2012: Pathways to Secure a Clean Energy System. Paris: IEA. https://www.iea.org/publications/freepublications/publication/ETP2012_free.pdf.
International Energy Agency (IEA). 2013. “Global Land Transport Infrastructure Requirements,” by John Dulac. Information paper. Paris: OECD/IEA. http://iea.org/publications/freepublications/publication/TransportInfrastructureInsights_FINAL_WEB.pdf.
McKinsey Global Institute. 2013. Infrastructure Productivity: How to Save $1 Trillion a Year, by Richard Dobbs, Herbert Pohl, Diann-Yi Lin, Jann Mischke, Nicklas Garemo, Jimmy Hexter, Stefan Matzinger, Robert Palet, and Rushad Nanavatty. http://www.mckinsey.com/insights/engineering_construction/infrastructure_productivity.
New Climate Economy (NCE). 2014a. “Accessibility in Cities: Transport and Urban Form,” by Philipp Rode, Graham Floater, Nikolas Thomopoulos, James Docherty, Peter Schwinger, Anjali Mahendra, and Wanli Fang. NCE Cities paper 03 (November). LSE Cities, London School of Economics and Political Science. http://newclimateeconomy.report/wp-content/uploads/2014/11/Transport-and-urban-form.pdf.
New Climate Economy (NCE). 2014b. “Infrastructure Investment Needs of a Low-Carbon Scenario.” Technical note, November. http://2014.newclimateeconomy.report/wp-content/uploads/2015/01/Infrastructure-investment-needs-of-a-low-carbon-scenario.pdf.
New Climate Economy (NCE). 2014c. “Steering Urban Growth: Governance, Policy and Finance,” by Graham Floater, Philipp Rode, Bruno Friedel, and Alexis Robert. NCE Cities paper 02 (November). LSE Cities, London School of Economics and Political Science. http://2014.newclimateeconomy.report/wp-content/uploads/2014/11/Steering-urban-growth.pdf.
Organisation for Economic Co-operation and Development (OECD). 2006. Infrastructure to 2030: Telecom, Land Transport, Water and Electricity. June. Paris: OECD.
Organisation for Economic Co-operation and Development (OECD). 2012. Strategic Transport Infrastructure Needs to 2030. http://www.oecd.org/futures/infrastructureto2030/49094448.pdf.
Organisation for Economic Co-operation and Development (OECD). 2014. The Cost of Air Pollution: Health Impacts of Road Transport. May 21. Paris: OECD.
Programme for Infrastructure Development in Africa (PIDA). 2011. Africa in 50 Years’ Time: The Road towards Inclusive Growth, by African Development Bank. Tunis: AfDB.
Programme for Infrastructure Development in Africa (PIDA). 2014. Seventh Conference of African Ministers in Charge of Integration. African Union.
World Bank (WB). 2008. Overhauling the Engine of Growth: Infrastructure in Africa, by Vivien Foster. Africa Infrastructure Country Diagnostic, September. http://siteresources.worldbank.org/INTAFRICA/Resources/AICD_exec_summ_9-30-08a.pdf.
World Economic Forum (WEF). 2013. The Green Investment Report: The Ways and Means to Unlock Private Finance for Green Growth. Report of the Green Growth Action Alliance. http://www3.weforum.org/docs/WEF_GreenInvestment_Report_2013.pdf.
World Resources Institute (WRI). 2014. “The Trillion Dollar Question: Tracking Public and Private Investment in Transport,” by Benoit Lefevre, David Leipziger, and Matthew Raifman. Working paper, January. Washington, DC: World Resources Institute. http://www.wri.org/publication/trillion-dollar-question-transport.

WORKING PAPER | April 2016 | 25
The Trillion Dollar Question II: Tracking Investment Needs in Transport
ENDNOTES
1. It is important to note that reliable data do not exist at the global scale for the transport subsectors that we are tracking.
2. The OECD report does not confirm this statement and makes no explicit reference to the GHG emission scenario.
3. The IEA estimates, although able to include similar numbers for vehicles, would significantly increase the costs in either the 4DS or 6DS. For accu-racy, we differentiate what is related to infrastructure from what is related to vehicles, ensuring that we are comparing “oranges with oranges.”
4. By HIS Global Insights.
5. Using a perpetual inventory stock model.
6. Countries with infrastructure stock as percent of GDP: Brazil (16%), United Kingdom (57%), Canada (58%), India (58%), United States (64%), Germany (71%), Spain (73%), China (76%), Poland (80%), Italy (82%), South Africa (87%), and Japan (179%). Analysis excludes Brazil (under investor with 16%) and Japan (over investor with 179%), as both are considered outliers.
7. We use a similar approach in developing a global estimate, but our estimate takes into account the cost of achieving the 2DS versus the 4DS through transport infrastructure investment. We also include the cost of parking infrastructure in our estimate and strictly account for capex needs only.
8. The methodology differs from our approach, as we try to differentiate the investment needs under the 2DS from those under the 4DS and include only capital investments in our analysis. We also take into account park-ing infrastructure linked with road development.
9. Deployment of renewable energies (including biofuels), carbon capture and storage, and nuclear.
10. ITDP/UC Davis takes a dedicated approach in only looking at urban transportation investment costs and does not consider elements such as high-speed rail, whose use goes beyond the metropolitan region.
11. ITDP/UC Davis does not explicitly differentiate capex from opex. WRI as-sumes this differentiation, categorizing capex as all purchase costs plus all infrastructure costs and opex as all fuel costs plus all O&M costs.
12. Despite using the same underlying data, the NCE and WEF reports pro-duced different numbers. The NCE was very conservative in the numbers that it drew, while the WEF aimed to establish a broader-based figure (interviews with main authors of the respective reports).
13. The Mobility Model is a spreadsheet model of global transport, energy use, emissions, safety, and materials use that is based on hypotheses of GDP and population growth, vehicle fuel economy, fuel costs, travel demand, and vehicle and fuel market shares.
14. The model estimates future demand for infrastructure based on the expected demand for infrastructure services as consumption goods and the demand for infrastructure in the production process by firms.
15. This approach does not include national projects with cross-border im-pacts, such as airports, seaports, roads connecting to national borders, and power projects that may supply power to neighboring countries.
16. Countries included were Argentina, Barbados, Belize, the Bolivarian Republic of Venezuela, Bolivia, Brazil, Chile, Colombia, Costa Rica, the Dominican Republic, Ecuador, El Salvador, Guatemala, Guyana, Haiti, Honduras, Jamaica, Mexico, Panama, Paraguay, Peru, Trinidad and Tobago, and Uruguay.
17. The findings suggest that the region would need to spend 5.2 percent of GDP annually in order to meet the demand for infrastructure, that is, the vertical gap.
18. In order for LAC to achieve the same level of infrastructure stock as the East Asian countries, spending would have to rise to 7.9 percent of GDP between 2006 and 2020. This estimate only considers investment in new infrastructure and spending on maintenance and does not include expenditures for rehabilitating or upgrading existing stock.
19. These estimates are based on the assumption that the region will experi-ence a 3.9 percent increase in GDP and 1 percent population growth between 2006 and 2020.
20. Africa needs assumed at $25 billion per year.

Copyright 2016 World Resources Institute. This work is licensed under the Creative Commons Attribution 4.0 International License. To view a copy of the license, visit http://creativecommons.org/licenses/by/4.0/
10 G Street, NE | Washington, DC 20002 | www.WRIRossCities.org
ABOUT WRI World Resources Institute is a global research organization that turns big ideas into action at the nexus of environment, economic opportunity and human well-being.
Our ChallengeNatural resources are at the foundation of economic opportunity and human well-being. But today, we are depleting Earth’s resources at rates that are not sustainable, endangering economies and people’s lives. People depend on clean water, fertile land, healthy forests, and a stable climate. Livable cities and clean energy are essential for a sustainable planet. We must address these urgent, global challenges this decade.
Our VisionWe envision an equitable and prosperous planet driven by the wise manage-ment of natural resources. We aspire to create a world where the actions of government, business, and communities combine to eliminate poverty and sustain the natural environment for all people.
Our ApproachCOUNT ITWe start with data. We conduct independent research and draw on the latest technology to develop new insights and recommendations. Our rigorous analysis identifies risks, unveils opportunities, and informs smart strategies. We focus our efforts on influential and emerging economies where the future of sustainability will be determined.
CHANGE ITWe use our research to influence government policies, business strategies, and civil society action. We test projects with communities, companies, and government agencies to build a strong evidence base. Then, we work with partners to deliver change on the ground that alleviates poverty and strength-ens society. We hold ourselves accountable to ensure our outcomes will be bold and enduring.
SCALE ITWe don’t think small. Once tested, we work with partners to adopt and expand our efforts regionally and globally. We engage with decision-makers to carry out our ideas and elevate our impact. We measure success through government and business actions that improve people’s lives and sustain a healthy environment.
ABOUT WRI ROSS CENTER FOR SUSTAINABLE CITIESWRI Ross Center for Sustainable Cities works to make urban sustainability a reality. Global research and on-the-ground experience in Brazil, China, India, Mexico, Turkey and the United States combine to spur action that improves life for millions of people.
Based on longstanding global and local experience in urban planning and mobility, WRI Sustainable Cities uses proven solutions and action-oriented tools to increase building and energy efficiency, manage water risk, encour-age effective governance and make the fast-growing urban environment more resilient to new challenges.
Aiming to influence 200 cities with unique research and tools, WRI Sustain-able Cities focuses on a deep cross-sector approach in four megacities on two continents, and targeted assistance to 30 more urban areas, bringing eco-nomic, environmental and social benefits to people in cities around the globe.
ACKNOWLEDGMENTSThe authors would like to acknowledge the following individuals for their valuable guidance and critical reviews. Our colleagues at WRI: Athena Ballesteros, Hyacinth Billings, Holger Dalkmann, Daryl Ditz, Angela Enriquez, Robin King, Carni Klirs, Anjali Mahendra, Allison Meyer, Helen Mountford, and Neha Yadav.
The following external experts provided invaluable guidance: David Leipziger, Michael A. Replogle (Institute for Transportation and Development Policy), Lewis M. Fulton (University of California, Davis – Institute for Transport Studies), Cornie Huizenga and Karl Peet (SloCaT Partnership), John Dulac and Pierpaolo Cazzola (International Energy Agency), Virginie Marchal and Geraldine Ang (OECD), Ko Sakomoto (ADB), Alexis Robert (The New Climate Economy).
ABOUT THE AUTHORSBenoit Lefevre, PhD is the Director of Energy, Climate and Finance at the WRI Ross Center for Sustainable Cities.
Contact: [email protected] Ahmad Iqbal Chaudhary was a Research Fellow with the Energy & Climate Team at the WRI Ross Center for Sustainable Cities. Deeba Yavrom was a Research Fellow with the Energy & Climate Team at the WRI Ross Center for Sustainable Cities. Aman Srivastava was an Associate working on climate finance within WRI’s Sustainable Finance Center.