the true impact of uk manufacturing mt… · oxford economics was founded in 1981 as a commercial...
TRANSCRIPT

The true impact of UK manufacturing
THE TRUE IMPACT OF UK MANUFACTURING APRIL 2018
The true impact of UK manufacturing
Oxford Economics
Oxford Economics was founded in 1981 as a commercial venture with Oxford University’s business
college to provide economic forecasting and modelling to UK companies and financial institutions
expanding abroad. Since then, we have become one of the world’s foremost independent global
advisory firms, providing reports, forecasts and analytical tools on more than 200 countries, over 100
industrial sectors and 4,000 cities and locations. Our best-of-class global economic and industry
models and analytical tools give us an unparalleled ability to forecast external market trends
and assess their economic, social and business impact.
Headquartered in Oxford, England, with regional centres in London, New York, and Singapore, Oxford
Economics has offices across the globe in Belfast, Chicago, Dubai, Miami, Milan, Paris, Philadelphia,
San Francisco, and Washington DC. We employ over 300 full-time people, including more than 200
professional economists, industry experts and business editors—one of the largest teams of
macroeconomists and thought leadership specialists. Our global team is highly skilled in a full range of
research techniques and thought leadership capabilities, from econometric modelling, scenario framing,
and economic impact analysis to market surveys, case studies, expert panels, and web analytics.
Underpinning our in-house expertise is a contributor network of over 500 economists, analysts and
journalists around the world.
Oxford Economics is a key adviser to corporate, financial and government decision-makers and
thought leaders. Our worldwide client base now comprises over 1,500 international organisations,
including leading multinational companies and financial institutions; key government bodies and trade
associations; and top universities, consultancies, and think tanks.
April 2018
All data shown in tables and charts are Oxford Economics’ own data, except where otherwise stated
and cited in footnotes, and are copyright © Oxford Economics Ltd.
This report is confidential to the Manufacturing Technologies Association and may not be
published or distributed without their prior written permission.
The modelling and results presented here are based on information provided by third parties, upon
which Oxford Economics has relied in producing its report and forecasts in good faith. Any
subsequent revision or update of those data will affect the assessments and projections shown.
To discuss the report further please contact:
Matthew Dass: [email protected]
Oxford Economics
Broadwall House, 21 Broadwall, London, SE1 9PL, UK
Tel: +44 203 910 8000
The true impact of UK manufacturing
TABLE OF CONTENTS
Foreword ............................................................................................................. 1
Executive summary ............................................................................................. 3
1. Introduction...................................................................................................... 4
2. The direct impact of the manufacturing sector ................................................ 7
2.1 Size and importance of manufacturing .................................................... 7
2.2 Productivity of the manufacturing sector ................................................ 10
2.3 Diversity of the manufacturing sector..................................................... 12
2.4 The geographic spread of UK manufacturing ........................................ 14
3. The supply chain impact of UK manufacturing ............................................. 17
3.1 Manufacturers’ purchases of goods and services ................................. 17
3.2 Activity supported by manufacturers’ supply chain purchases .............. 20
4. Worker spending impacts .............................................................................. 22
5. Total impact of the UK manufacturing sector ................................................ 24
6. The impact of the engineering sector ............................................................ 27
6.1 Direct impact of the engineering sub-sector .......................................... 27
6.2 Supply chain impacts ............................................................................. 31
6.3 Worker spending impacts ...................................................................... 34
6.4 Total impact of the engineering sector ................................................... 34
Appendix A: Definition of the manufacturing and engineering sectors ............. 36
Appendix B: Detailed results ............................................................................. 37
Appendix C: Methodology and data sources .................................................... 39
The true impact of UK manufacturing
1
FOREWORD If “we don’t make anything anymore”, then how does this sector account for
almost half of our exports? How is it that 70 percent of the UK’s Business R&D
is in manufacturing?
Because manufacturing is less obviously present in our communities—fewer
people work in the sector than in previous generations, and factories are
seldom located in town centres any more—there is a tendency to believe it is a
sector that has declined to the point of irrelevance. But nothing could be further
from the truth: in fact, manufacturing extends to about a quarter of the UK’s
economy. That means that the sector is essential to delivering an industrial
strategy that can work for the benefit of the country’s prosperity.
The oft repeated “fact” that manufacturing accounts for only a small proportion
of UK GDP tells you more about how GDP is calculated than it does about the
true impact of manufacturing within the UK economy. This report is an attempt
to tell that richer story.
There are three aspects to assessing the impact of manufacturing:
• The direct impact: the output of businesses that are traditionally
considered as manufacturers for the purposes of the GDP calculation;
• The indirect impact: the economic effect supported in the supply
chains of those businesses;
• The induced impact: the effect of the spending by people employed
directly and indirectly in manufacturing.
This report estimates all three of these impacts.
The first gives us the relatively familiar numbers; nine percent of GDP and
2.6 million jobs (still bigger than the UK’s financial services). However, the
second and third elements give us real food for thought. Including the indirect
impact, manufacturing accounts for 15 percent of the UK economy and over
five million jobs. When we incorporate the induced impact, the figures rise still
further to 23 percent and seven million jobs.
Those last two sets of numbers give a truer picture of the importance of
manufacturing to the UK economy than the first. The reasons are clear: over
the last 40 years, manufacturing has increasingly outsourced activities which
used to be done in-house—in areas as diverse as logistics and catering. There
are also companies, from design houses to accountancy practices, whose
activity, or at least a large part of it, is predicated on serving manufacturing
businesses. That output and those jobs are not normally considered as
manufacturing, but they would not exist if there was no manufacturing. Any
assessment of manufacturing’s importance to the UK economy must take those
indirect impacts into account—not to do so is to miss half the picture.
The induced impacts are also vital to understanding the full picture of the
sector. If manufacturing disappeared overnight, it would leave a huge hole in
the economy as the wages of manufacturers disappeared. Over time, other
industries might substitute for manufacturing, but simply buying everything from

The true impact of UK manufacturing
2
abroad would not replace the lost wealth that manufacturing creates. The
country would be much poorer as a result.
Today, there is an opportunity, through the Industrial Strategy, to help the UK
economy grow and boost our exports by fostering manufacturing investment to
take advantage of industrial digitalisation and new technologies such as Big
Data, AI and Additive Manufacturing. This report is, therefore, a timely one.
With the Government focused on delivering that Strategy and making the
changes wrought by Brexit work for, not against, the UK economy, it is vitally
important to understand the economic impacts of our industries in the real
world. By demonstrating the importance of manufacturing, this report does just
that.
James Selka
Chief Executive Officer
Manufacturing Technologies Association
April 2018
The true impact of UK manufacturing
3
EXECUTIVE SUMMARY Manufacturing is an important part of the UK economic landscape. As
conventionally measured in national accounts, the sector directly employs
2.6 million workers across the UK, who collectively generated an estimated
£177 billion in GDP during 2016. This means manufacturing companies directly
contributed nine percent of GDP and eight percent of employment in that year.
However, the sector’s impact on the UK economy extends far more widely
than manufacturing companies themselves. In particular, manufacturers rely
on a complex network of UK-based supply chains. Purchases from these
suppliers generate “indirect” impacts which ripple out across all sectors of the
economy. Once these indirect impacts are included within our calculations, we
find that manufacturing supported £301 billion of GDP (15 percent of the UK
economy) and five million jobs (15 percent of the UK total) in 2016.
There is also a third aspect to the contribution that manufacturing makes to the
UK economy. This is the “induced” impact, which arises when those employed
by manufacturers and their suppliers spend their wages in the wider economy.
Bringing together the direct, indirect and induced impacts of
manufacturing gives us a third way of estimating the impact of the sector.
On this basis, we estimate that the total impact of manufacturing on UK GDP
was £446 billion in 2016. For every £1 million that the manufacturing sector
contributes to UK GDP itself, a further £1.5 million is supported across the
wider economy through indirect and induced multiplier effects. On the same
basis, manufacturing supported a total of 7.4 million jobs in 2016. For each job
in the manufacturing sector itself, a further 1.8 are supported in other sectors of
the UK economy.
Over-and-above the GDP and employment it supports, the manufacturing
sector makes an important contribution to the UK economy in other ways.
Firstly, manufacturing accounts for a disproportionate share of R&D
expenditure: in 2016, more than two-thirds of business R&D investment was
made by manufacturers. And secondly, manufacturing is an important source of
export revenues: in 2016, manufacturing goods accounted for almost half of UK
goods and services exports.
This report also assesses the economic impact of the engineering sub-sector,
defined here to include the manufacture of metal products, electronics and
electrical equipment, machinery, equipment, vehicles and other transport
equipment.
In total, the engineering sub-sector contributed £188 billion to UK GDP
and supported 3.1 million jobs in 2016. The GDP figure includes the
£67 billion that engineering firms contributed directly, plus £121 billion in
indirect and induced multiplier effects. Just over one million people are
employed in the UK’s engineering firms, with a further two million jobs
sustained in the supply chain and as a result of workers’ spending.
The true impact of UK manufacturing
4
1. INTRODUCTION The size of the UK’s manufacturing sector is closely monitored in official
statistics which track the sector’s direct contribution to the economy, for
example in terms of GDP and employment. But such measures do not reflect
the full impact of manufacturing on the UK economy, which extends far beyond
these headline estimates.
The Manufacturing Technologies Association (MTA), representing companies
that design, manufacture and supply the advanced machinery, software and
knowhow that manufacturers deploy to create their products, asked Oxford
Economics to investigate this, and to estimate the true impact of UK
manufacturing. This request follows in the footsteps of the government’s 2016
Manufacturing Metrics Review, which highlighted the need for a more
comprehensive approach to measuring manufacturing activity.1
In response, this report uses an economic impact assessment to quantify the
full contribution that the manufacturing sector makes to employment and GDP.
Crucially, this includes the wider economic “footprint” supported by the
industry’s domestic supply chains, together with the wage-financed
consumption of its workers and those in its supply chain.
The analysis of manufacturers’ UK supply-chain purchases is particularly
important in understanding the sector’s true impact on the economy.
Increased outsourcing of support functions means many activities that were
traditionally carried out in-house by manufacturers are now classified as
“services activity” in national accounts.
Even when UK manufacturers import raw materials, components and
equipment from overseas, they may still be supporting activity within the UK—
for example, among UK-based distributors and logistics companies who
facilitate these imports.2 Our modelling accounts for these effects to the fullest
possible extent using official statistics.
We start our analysis by assessing the manufacturing sector itself, before
extending our focus to the supply chain impact, and then worker spending
effects.
In Section 6, we take a closer look at the engineering sub-sector, to ascertain
its impact on the UK economy, both directly and through supply chain and
worker spending multiplier effects. Technical details of our approach and data
sources are provided in the appendices.
1 Manufacturing Metrics Expert Group, "Manufacturing Metrics Review Report" (2016). 2 The extent to which such activity is captured within our estimates will depend on the structure of contracts and
the categorisation of firms. This is discussed further in the appendix.
The true impact of UK manufacturing
5
3 GVA measures the contribution to the economy of each individual producer, industry or sector. When
aggregated across all industries, GVA approximates to GDP. The latter represents the total value of all goods
and services produced in an economy and is the main measure of a country’s total economic activity. See
Appendix C for further details. 4 J Howse, "Office for National Statistics", in Input-output analytical tables: methods and application to UK
National Accounts
<https://www.ons.gov.uk/economy/nationalaccounts/supplyandusetables/articles/inputoutputanalyticaltables/meth
odsandapplicationtouknationalaccounts> [accessed 19 Mar 2018] 5 See, for example, Ronald E Miller and Peter D Blair, Input-Output Analysis: Foundations and Extensions, 2nd
ed. (Cambridge: Cambridge University Press, 2009). 6 The Scottish Government, "Multipliers - Definitions of Multipliers and Effects", in www.gov.scot
<http://www.gov.scot/Topics/Statistics/Browse/Economy/Input-Output/Mulitipliers> [accessed March 2018]
INTRODUCTION TO OUR ECONOMIC IMPACT ANALYSIS
The impact of manufacturing is assessed using a standard means of analysis called an
economic impact assessment. This involves quantifying the sector’s impact across three “core”
channels:
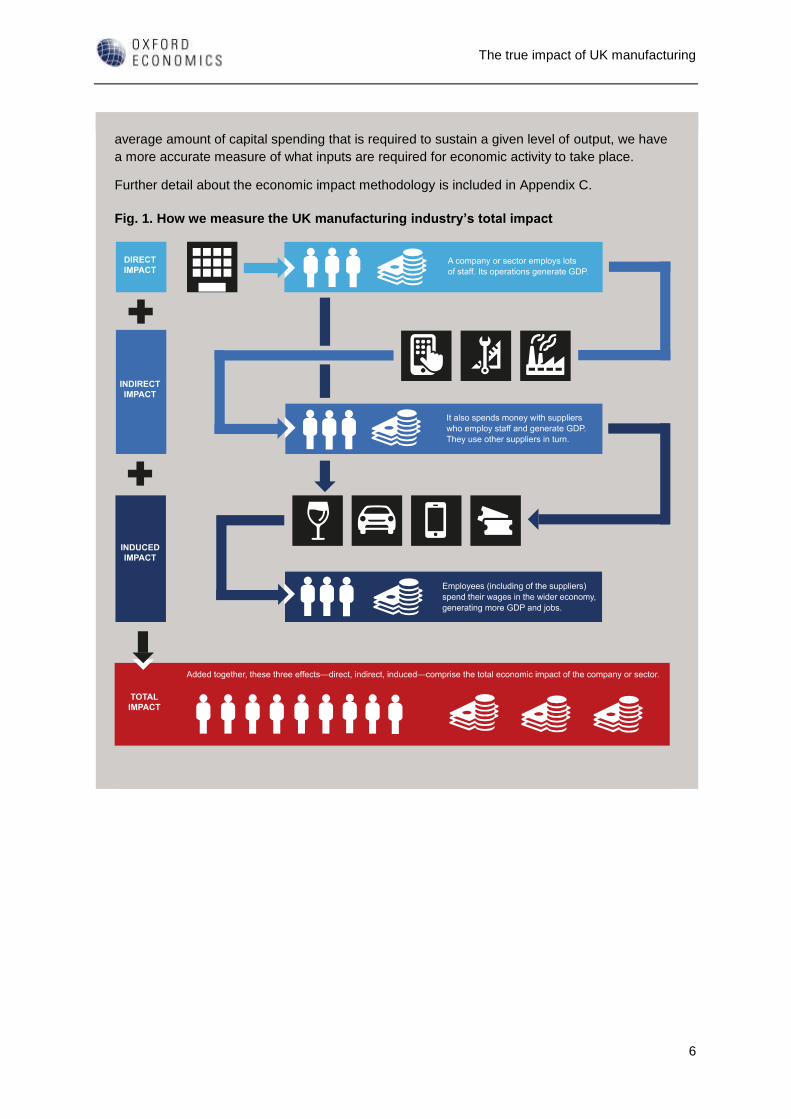
• Direct impact, which relates to the manufacturing sector’s own activities. It
encompasses the economic activity and employment supported directly by firms in the
manufacturing sector;
• Indirect impact, which encapsulates the economic activity and employment
supported in the supply chain of the manufacturing sector, as a result of its
procurement of goods and services from firms in other sectors. Our analysis estimates
the impact of manufacturers’ capital investments, as well as that of their day-to-day
purchases;
• Induced impact, which comprises the wider economic benefits that arise when
employees within the manufacturing sector, and its supply chain (including that for
capital purchases), spend their earnings— for example, in local retail and leisure
establishments.
The sum of these channels makes up the manufacturing sector’s total economic impact. Two
main metrics are used to present a picture of the sector’s economic contribution:
• GDP, or more specifically, the gross value added (GVA) contribution to GDP.3
• Employment, measured on a headcount basis.
The modelling is conducted using an Input-Output (I-O) based model of the UK economy. This
model was constructed by Oxford Economics, using data published by the ONS.
Note 1: Different studies take different approaches to estimating the total impact of a sector.
For example, multiplier estimates published by ONS include supply chain impacts but not
worker spending effects (although ONS is seeking to publish multipliers which include induced
impacts in future4). Induced impacts are, however, cited in academic literature5 and multiplier
values including induced effects are published by the Scottish government, among others.6
Note 2: A standard I-O based assessment of the manufacturing industry’s supply chain would
count its purchases of fuels, consumable parts, tools, utilities, professional services, etc, but
would miss out capital spending on machinery, vehicles, or the construction of facilities that
are crucial for its activities. Our approach also incorporates information on capital purchases
that are made as part of each industry’s gross fixed capital formation (GFCF). By including the
The true impact of UK manufacturing
6
average amount of capital spending that is required to sustain a given level of output, we have
a more accurate measure of what inputs are required for economic activity to take place.
Further detail about the economic impact methodology is included in Appendix C.
Fig. 1. How we measure the UK manufacturing industry’s total impact
The true impact of UK manufacturing
7
2. THE DIRECT IMPACT OF THE
MANUFACTURING SECTOR
2.1 SIZE AND IMPORTANCE OF MANUFACTURING
2.1.1 Sales: how much, and who to?
The manufacturing sector continues to play an important role in the UK
economy, selling products worth £546 billion at home and abroad in 2016. The
sources of demand for UK manufacturing outputs are shown in Fig. 2.
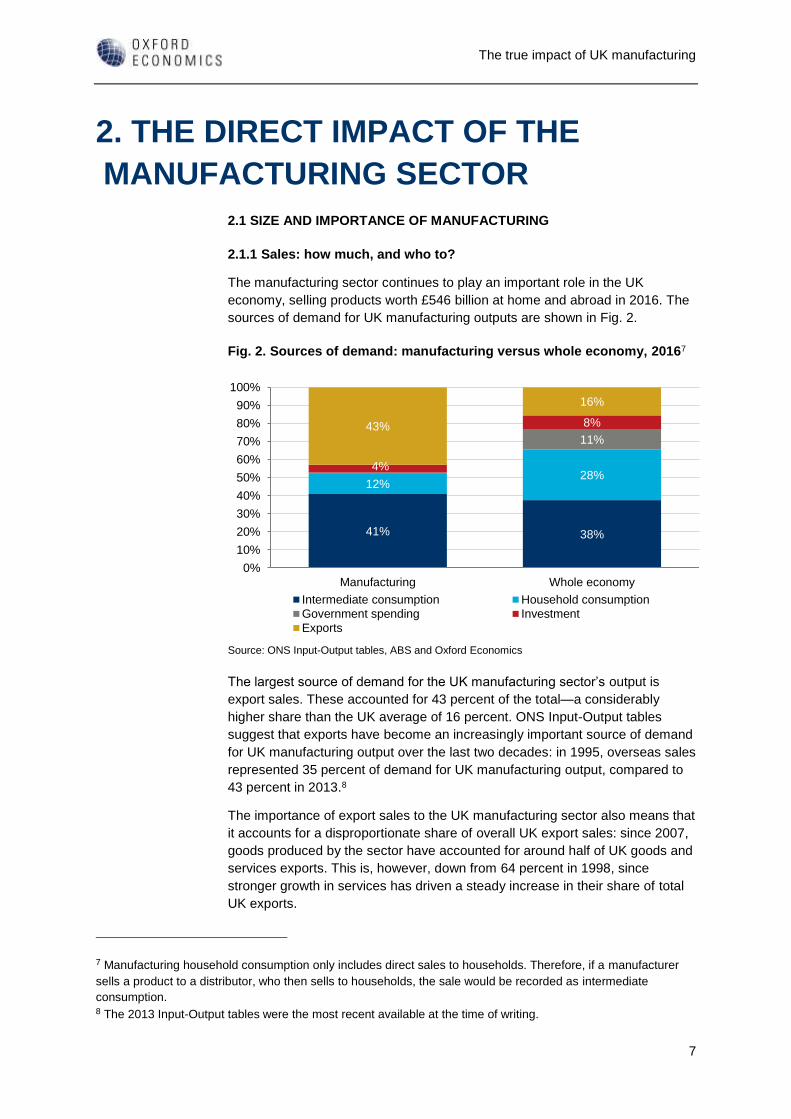
Fig. 2. Sources of demand: manufacturing versus whole economy, 20167
The largest source of demand for the UK manufacturing sector’s output is
export sales. These accounted for 43 percent of the total—a considerably
higher share than the UK average of 16 percent. ONS Input-Output tables
suggest that exports have become an increasingly important source of demand
for UK manufacturing output over the last two decades: in 1995, overseas sales
represented 35 percent of demand for UK manufacturing output, compared to
43 percent in 2013.8
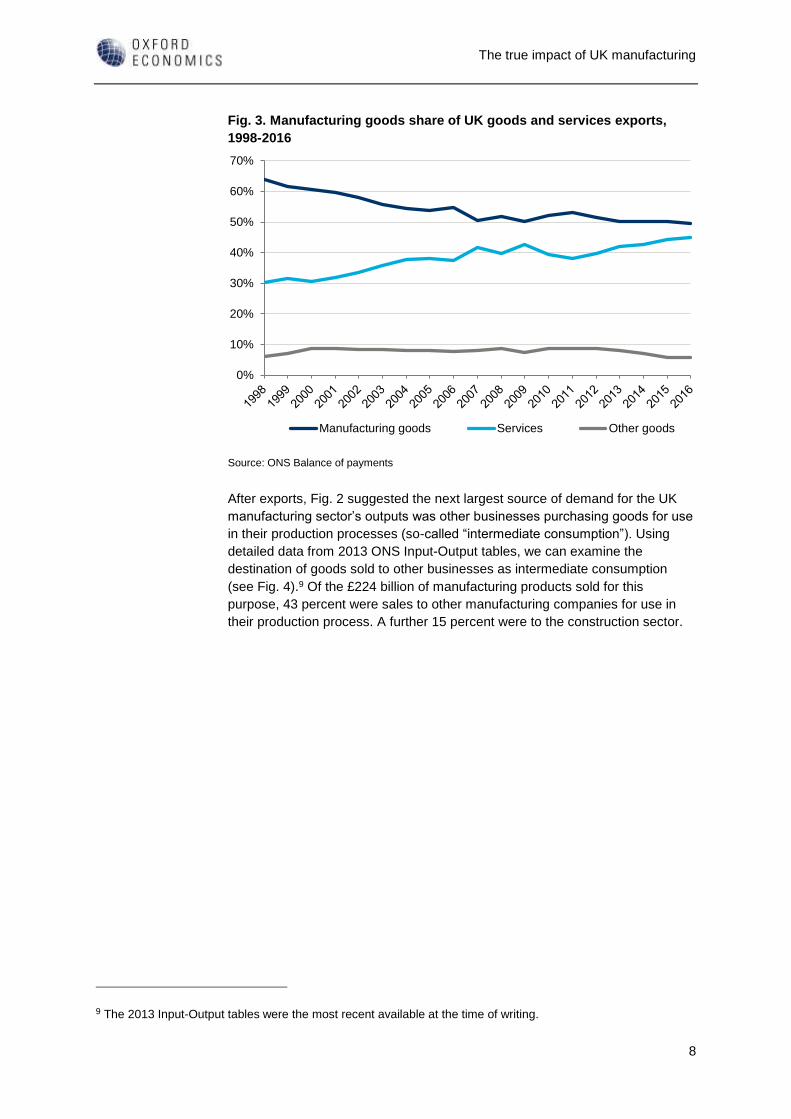
The importance of export sales to the UK manufacturing sector also means that
it accounts for a disproportionate share of overall UK export sales: since 2007,
goods produced by the sector have accounted for around half of UK goods and
services exports. This is, however, down from 64 percent in 1998, since
stronger growth in services has driven a steady increase in their share of total
UK exports.
7 Manufacturing household consumption only includes direct sales to households. Therefore, if a manufacturer
sells a product to a distributor, who then sells to households, the sale would be recorded as intermediate
consumption. 8 The 2013 Input-Output tables were the most recent available at the time of writing.
41% 38%
12%28%
11%
4%
8%43%
16%
Manufacturing Whole economy
0%
10%
20%
30%
40%
50%
60%
70%
80%
90%
100%
Intermediate consumption Household consumption
Government spending Investment
Exports
Source: ONS Input-Output tables, ABS and Oxford Economics
The true impact of UK manufacturing
8
Fig. 3. Manufacturing goods share of UK goods and services exports,
1998-2016
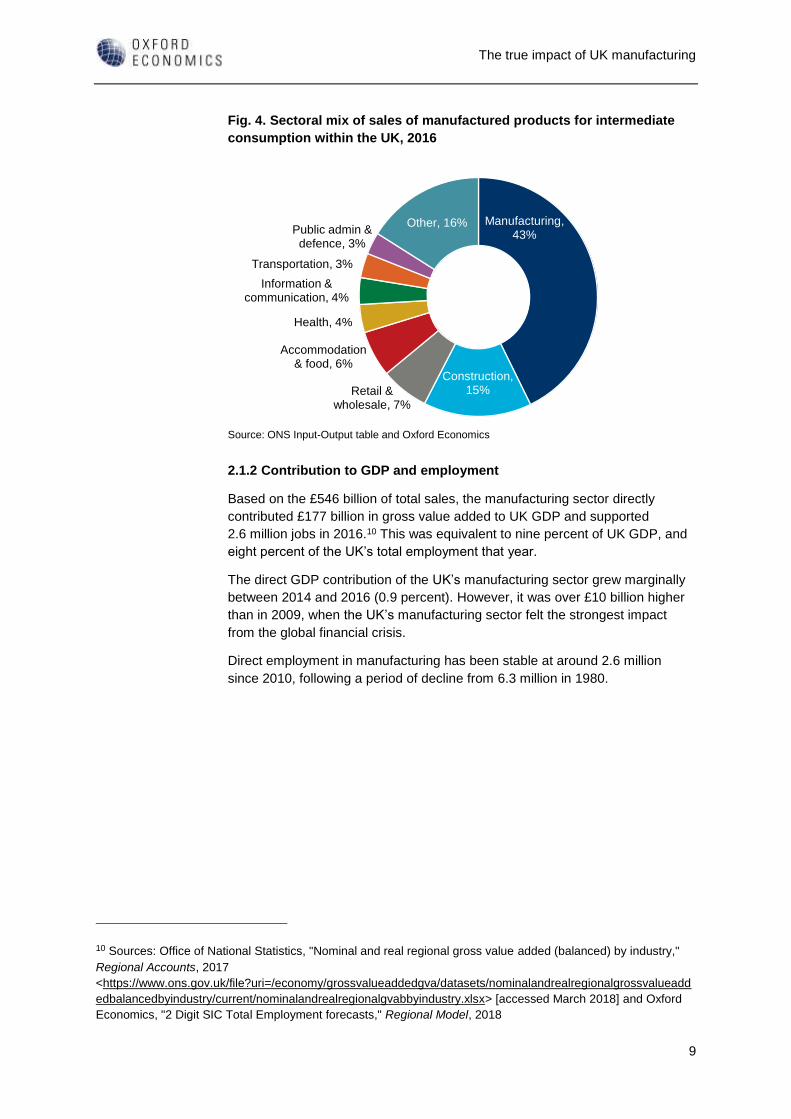
After exports, Fig. 2 suggested the next largest source of demand for the UK
manufacturing sector’s outputs was other businesses purchasing goods for use
in their production processes (so-called “intermediate consumption”). Using
detailed data from 2013 ONS Input-Output tables, we can examine the
destination of goods sold to other businesses as intermediate consumption
(see Fig. 4).9 Of the £224 billion of manufacturing products sold for this
purpose, 43 percent were sales to other manufacturing companies for use in
their production process. A further 15 percent were to the construction sector.
9 The 2013 Input-Output tables were the most recent available at the time of writing.
0%
10%
20%
30%
40%
50%
60%
70%
Manufacturing goods Services Other goods
Source: ONS Balance of payments
The true impact of UK manufacturing
9
Fig. 4. Sectoral mix of sales of manufactured products for intermediate
consumption within the UK, 2016
2.1.2 Contribution to GDP and employment
Based on the £546 billion of total sales, the manufacturing sector directly
contributed £177 billion in gross value added to UK GDP and supported
2.6 million jobs in 2016.10 This was equivalent to nine percent of UK GDP, and
eight percent of the UK’s total employment that year.
The direct GDP contribution of the UK’s manufacturing sector grew marginally
between 2014 and 2016 (0.9 percent). However, it was over £10 billion higher
than in 2009, when the UK’s manufacturing sector felt the strongest impact
from the global financial crisis.
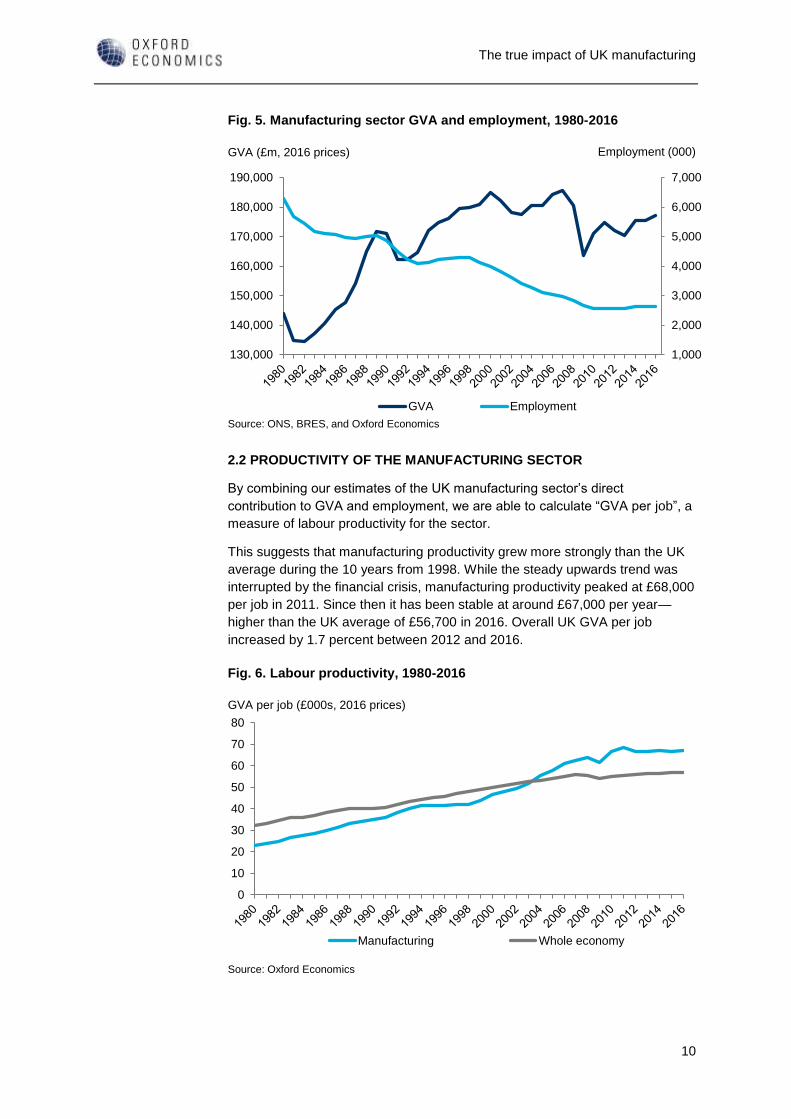
Direct employment in manufacturing has been stable at around 2.6 million
since 2010, following a period of decline from 6.3 million in 1980.
10 Sources: Office of National Statistics, "Nominal and real regional gross value added (balanced) by industry,"
Regional Accounts, 2017
<https://www.ons.gov.uk/file?uri=/economy/grossvalueaddedgva/datasets/nominalandrealregionalgrossvalueadd
edbalancedbyindustry/current/nominalandrealregionalgvabbyindustry.xlsx> [accessed March 2018] and Oxford
Economics, "2 Digit SIC Total Employment forecasts," Regional Model, 2018
Manufacturing, 43%
Construction, 15%Retail &
wholesale, 7%
Accommodation & food, 6%
Health, 4%
Information & communication, 4%
Transportation, 3%
Public admin & defence, 3%
Other, 16%
Source: ONS Input-Output table and Oxford Economics
The true impact of UK manufacturing
10
Fig. 5. Manufacturing sector GVA and employment, 1980-2016
2.2 PRODUCTIVITY OF THE MANUFACTURING SECTOR
By combining our estimates of the UK manufacturing sector’s direct
contribution to GVA and employment, we are able to calculate “GVA per job”, a
measure of labour productivity for the sector.
This suggests that manufacturing productivity grew more strongly than the UK
average during the 10 years from 1998. While the steady upwards trend was
interrupted by the financial crisis, manufacturing productivity peaked at £68,000
per job in 2011. Since then it has been stable at around £67,000 per year—
higher than the UK average of £56,700 in 2016. Overall UK GVA per job
increased by 1.7 percent between 2012 and 2016.
Fig. 6. Labour productivity, 1980-2016
1,000
2,000
3,000
4,000
5,000
6,000
7,000
130,000
140,000
150,000
160,000
170,000
180,000
190,000
GVA Employment
Source: ONS, BRES, and Oxford Economics
GVA (£m, 2016 prices) Employment (000)
0
10
20
30
40
50
60
70
80
Manufacturing Whole economy
Source: Oxford Economics
GVA per job (£000s, 2016 prices)
The true impact of UK manufacturing
11
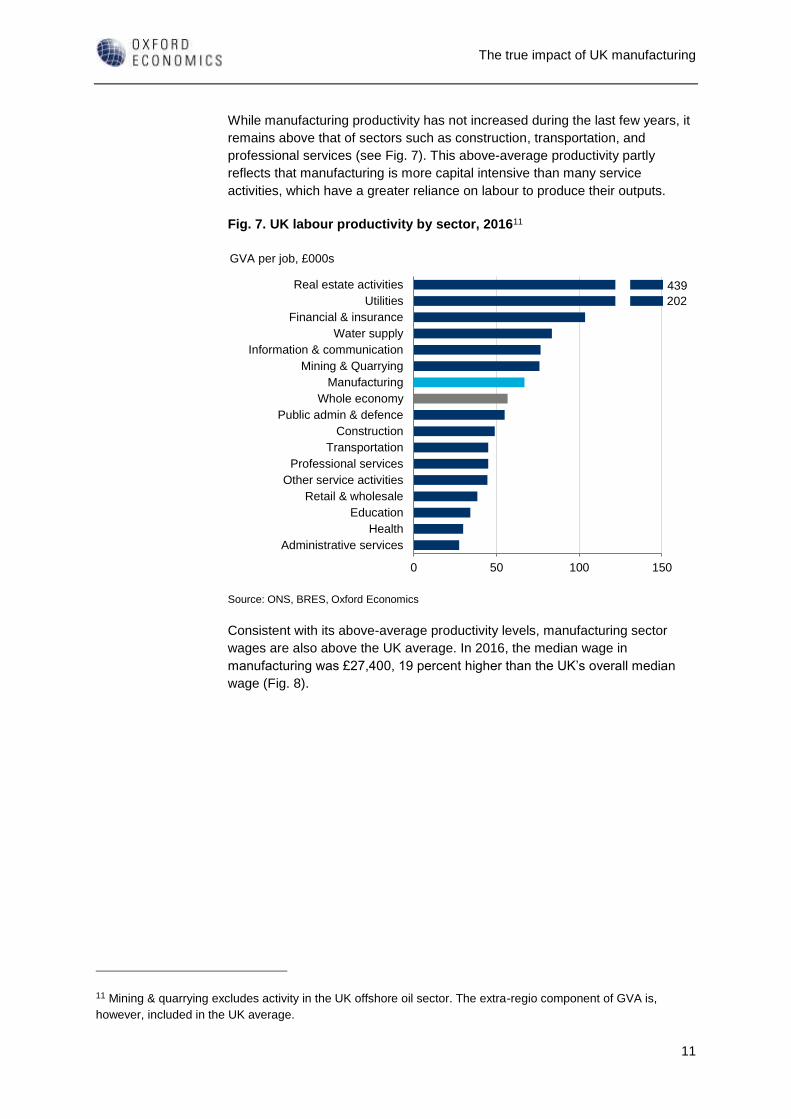
While manufacturing productivity has not increased during the last few years, it
remains above that of sectors such as construction, transportation, and
professional services (see Fig. 7). This above-average productivity partly
reflects that manufacturing is more capital intensive than many service
activities, which have a greater reliance on labour to produce their outputs.
Fig. 7. UK labour productivity by sector, 201611
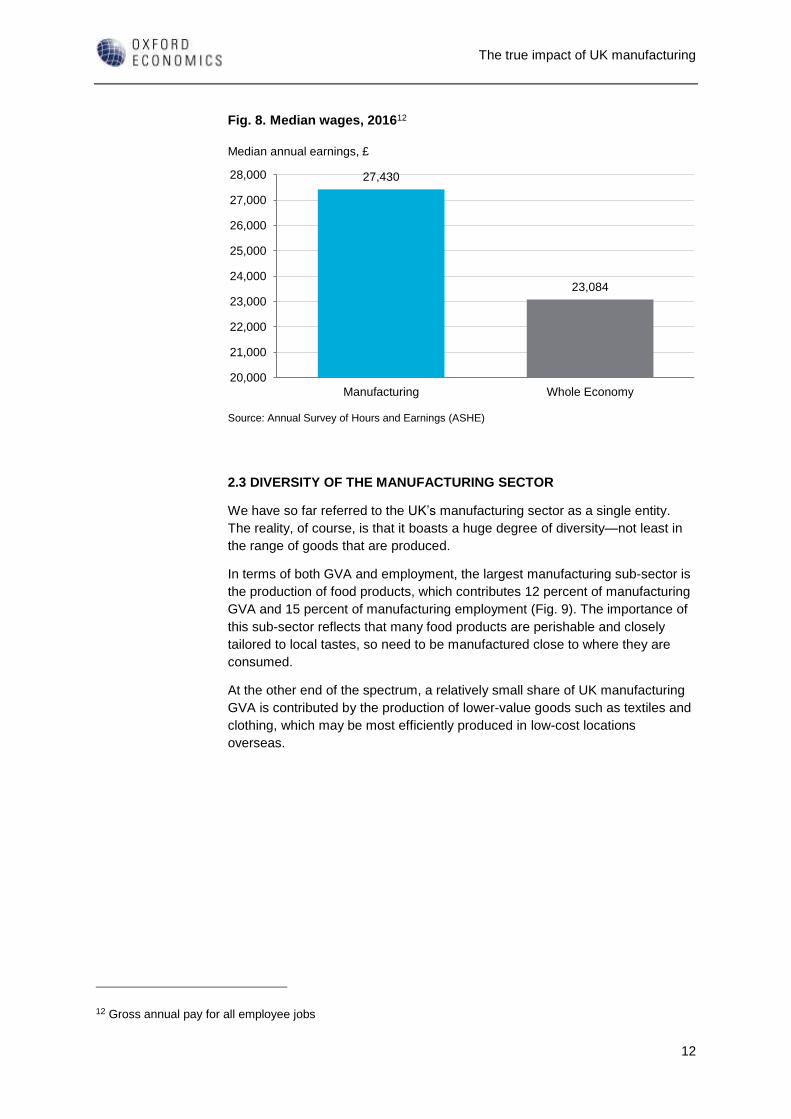
Consistent with its above-average productivity levels, manufacturing sector
wages are also above the UK average. In 2016, the median wage in
manufacturing was £27,400, 19 percent higher than the UK’s overall median
wage (Fig. 8).
11 Mining & quarrying excludes activity in the UK offshore oil sector. The extra-regio component of GVA is,
however, included in the UK average.
Real estate activities
Utilities
Financial & insurance
Water supply
Information & communication
Mining & Quarrying
Manufacturing
Whole economy
Public admin & defence
Construction
Transportation
Professional services
Other service activities
Retail & wholesale
Education
Health
Administrative services
0 50 100 150
Source: ONS, BRES, Oxford Economics
GVA per job, £000s
439
202
The true impact of UK manufacturing
12
Fig. 8. Median wages, 201612
2.3 DIVERSITY OF THE MANUFACTURING SECTOR
We have so far referred to the UK’s manufacturing sector as a single entity.
The reality, of course, is that it boasts a huge degree of diversity—not least in
the range of goods that are produced.
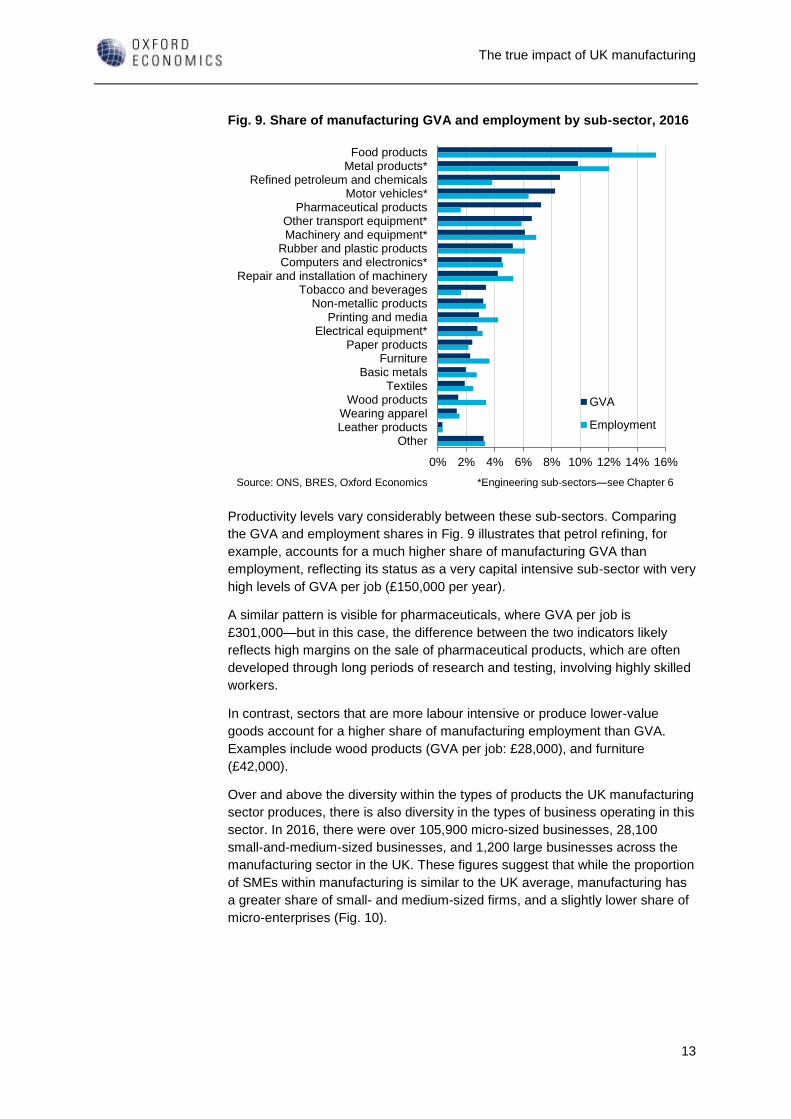
In terms of both GVA and employment, the largest manufacturing sub-sector is
the production of food products, which contributes 12 percent of manufacturing
GVA and 15 percent of manufacturing employment (Fig. 9). The importance of
this sub-sector reflects that many food products are perishable and closely
tailored to local tastes, so need to be manufactured close to where they are
consumed.
At the other end of the spectrum, a relatively small share of UK manufacturing
GVA is contributed by the production of lower-value goods such as textiles and
clothing, which may be most efficiently produced in low-cost locations
overseas.
12 Gross annual pay for all employee jobs
27,430
23,084
Manufacturing Whole Economy
20,000
21,000
22,000
23,000
24,000
25,000
26,000
27,000
28,000
Source: Annual Survey of Hours and Earnings (ASHE)
Median annual earnings, £
The true impact of UK manufacturing
13
Fig. 9. Share of manufacturing GVA and employment by sub-sector, 2016
Productivity levels vary considerably between these sub-sectors. Comparing
the GVA and employment shares in Fig. 9 illustrates that petrol refining, for
example, accounts for a much higher share of manufacturing GVA than
employment, reflecting its status as a very capital intensive sub-sector with very
high levels of GVA per job (£150,000 per year).
A similar pattern is visible for pharmaceuticals, where GVA per job is
£301,000—but in this case, the difference between the two indicators likely
reflects high margins on the sale of pharmaceutical products, which are often
developed through long periods of research and testing, involving highly skilled
workers.
In contrast, sectors that are more labour intensive or produce lower-value
goods account for a higher share of manufacturing employment than GVA.
Examples include wood products (GVA per job: £28,000), and furniture
(£42,000).
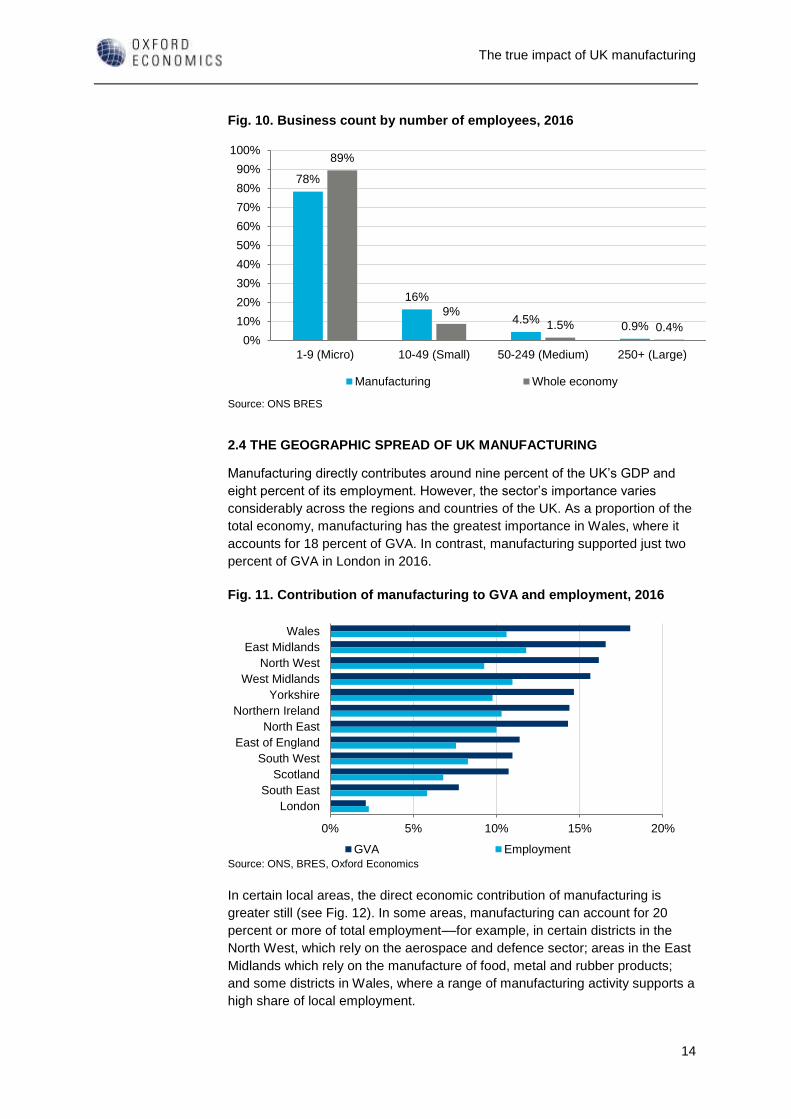
Over and above the diversity within the types of products the UK manufacturing
sector produces, there is also diversity in the types of business operating in this
sector. In 2016, there were over 105,900 micro-sized businesses, 28,100
small-and-medium-sized businesses, and 1,200 large businesses across the
manufacturing sector in the UK. These figures suggest that while the proportion
of SMEs within manufacturing is similar to the UK average, manufacturing has
a greater share of small- and medium-sized firms, and a slightly lower share of
micro-enterprises (Fig. 10).
Food productsMetal products*
Refined petroleum and chemicalsMotor vehicles*
Pharmaceutical productsOther transport equipment*Machinery and equipment*
Rubber and plastic productsComputers and electronics*
Repair and installation of machineryTobacco and beverages
Non-metallic productsPrinting and media
Electrical equipment*Paper products
FurnitureBasic metals
TextilesWood products
Wearing apparelLeather products
Other
0% 2% 4% 6% 8% 10% 12% 14% 16%
GVA
Employment
Source: ONS, BRES, Oxford Economics *Engineering sub-sectors—see Chapter 6
The true impact of UK manufacturing
14
Fig. 10. Business count by number of employees, 2016
2.4 THE GEOGRAPHIC SPREAD OF UK MANUFACTURING
Manufacturing directly contributes around nine percent of the UK’s GDP and
eight percent of its employment. However, the sector’s importance varies
considerably across the regions and countries of the UK. As a proportion of the
total economy, manufacturing has the greatest importance in Wales, where it
accounts for 18 percent of GVA. In contrast, manufacturing supported just two
percent of GVA in London in 2016.
Fig. 11. Contribution of manufacturing to GVA and employment, 2016
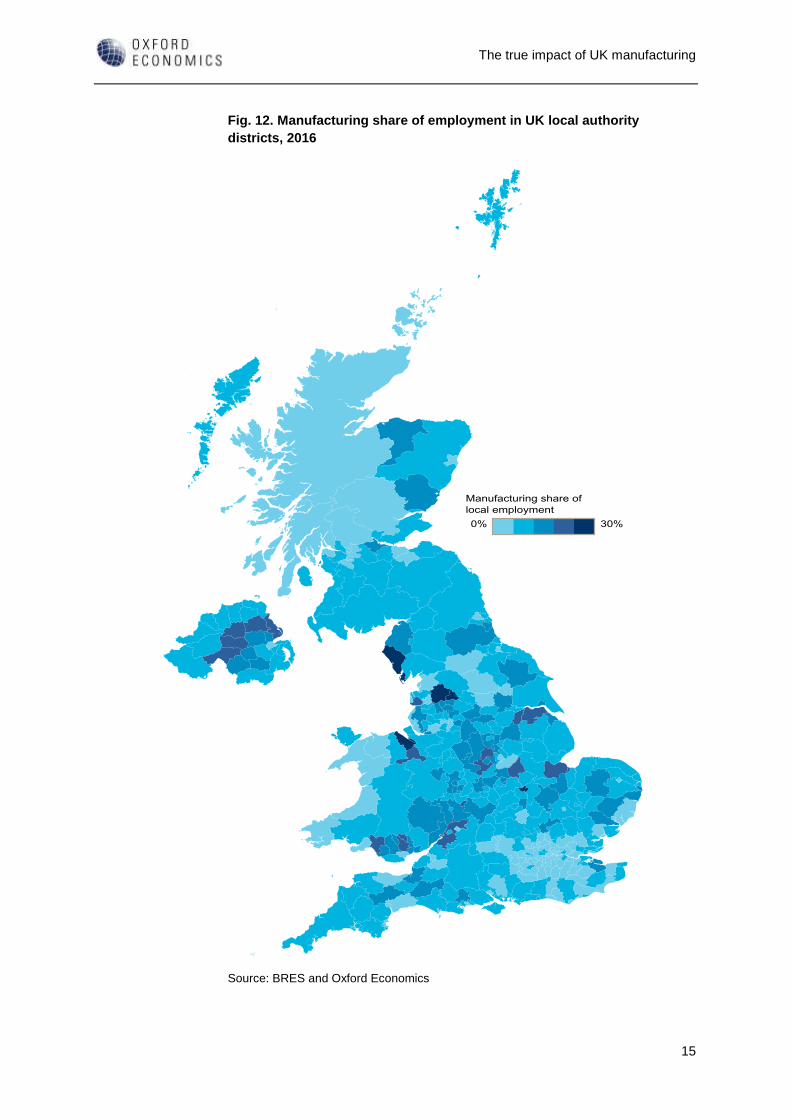
In certain local areas, the direct economic contribution of manufacturing is
greater still (see Fig. 12). In some areas, manufacturing can account for 20
percent or more of total employment––for example, in certain districts in the
North West, which rely on the aerospace and defence sector; areas in the East
Midlands which rely on the manufacture of food, metal and rubber products;
and some districts in Wales, where a range of manufacturing activity supports a
high share of local employment.
78%
16%
4.5%0.9%
89%
9%1.5% 0.4%
1-9 (Micro) 10-49 (Small) 50-249 (Medium) 250+ (Large)
0%
10%
20%
30%
40%
50%
60%
70%
80%
90%
100%
Manufacturing Whole economy
Source: ONS BRES
Wales
East Midlands
North West
West Midlands
Yorkshire
Northern Ireland
North East
East of England
South West
Scotland
South East
London
0% 5% 10% 15% 20%
GVA Employment
Source: ONS, BRES, Oxford Economics
The true impact of UK manufacturing
15
Fig. 12. Manufacturing share of employment in UK local authority
districts, 2016
Source: BRES and Oxford Economics

The true impact of UK manufacturing
16
In this chapter we have focused on the manufacturing sector itself, highlighting
its direct contribution to the economy, the diversity encompassed within it, and
its contribution to UK productivity. However, the sector’s impact on the UK
economy extends far beyond what it produces itself. We explore this further in
the next sections, starting with the activity supported within the supply chain.
The true impact of UK manufacturing
17
3. THE SUPPLY CHAIN IMPACT OF UK
MANUFACTURING
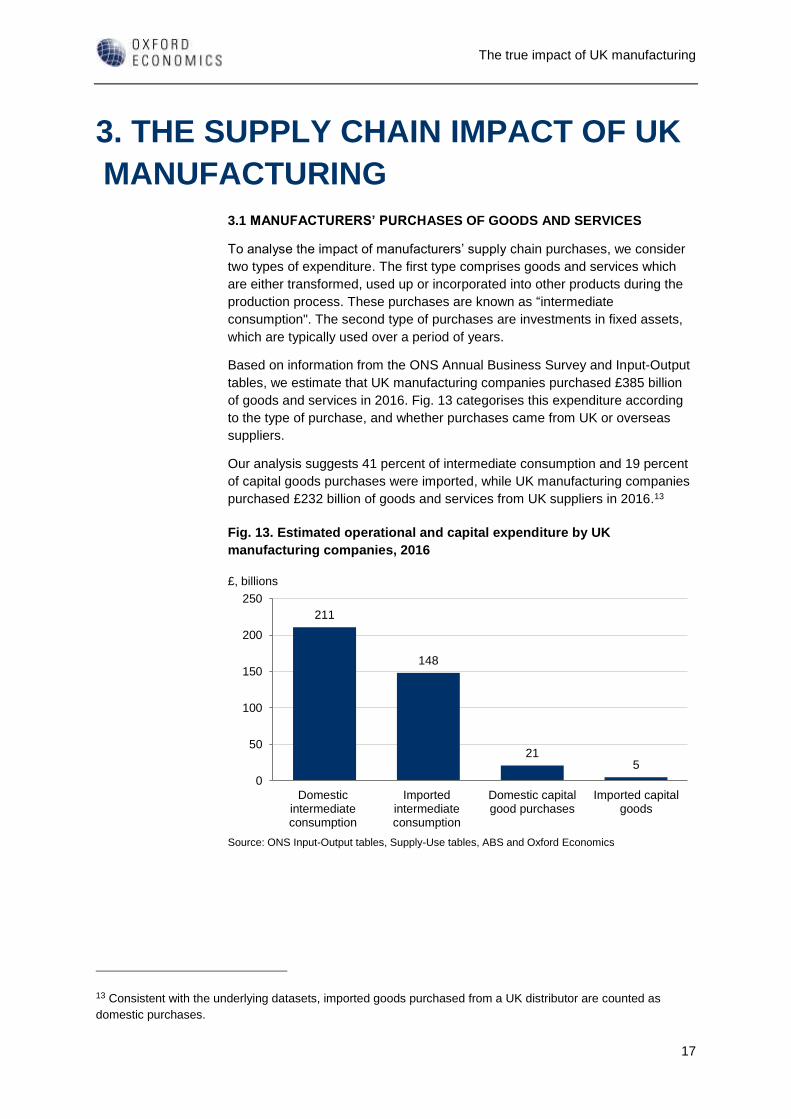
3.1 MANUFACTURERS’ PURCHASES OF GOODS AND SERVICES
To analyse the impact of manufacturers’ supply chain purchases, we consider
two types of expenditure. The first type comprises goods and services which
are either transformed, used up or incorporated into other products during the
production process. These purchases are known as “intermediate
consumption". The second type of purchases are investments in fixed assets,
which are typically used over a period of years.
Based on information from the ONS Annual Business Survey and Input-Output
tables, we estimate that UK manufacturing companies purchased £385 billion
of goods and services in 2016. Fig. 13 categorises this expenditure according
to the type of purchase, and whether purchases came from UK or overseas
suppliers.
Our analysis suggests 41 percent of intermediate consumption and 19 percent
of capital goods purchases were imported, while UK manufacturing companies
purchased £232 billion of goods and services from UK suppliers in 2016.13
Fig. 13. Estimated operational and capital expenditure by UK
manufacturing companies, 2016
13 Consistent with the underlying datasets, imported goods purchased from a UK distributor are counted as
domestic purchases.
211
148
215
Domesticintermediateconsumption
Importedintermediateconsumption
Domestic capitalgood purchases
Imported capitalgoods
0
50
100
150
200
250
Source: ONS Input-Output tables, Supply-Use tables, ABS and Oxford Economics
£, billions
The true impact of UK manufacturing
18
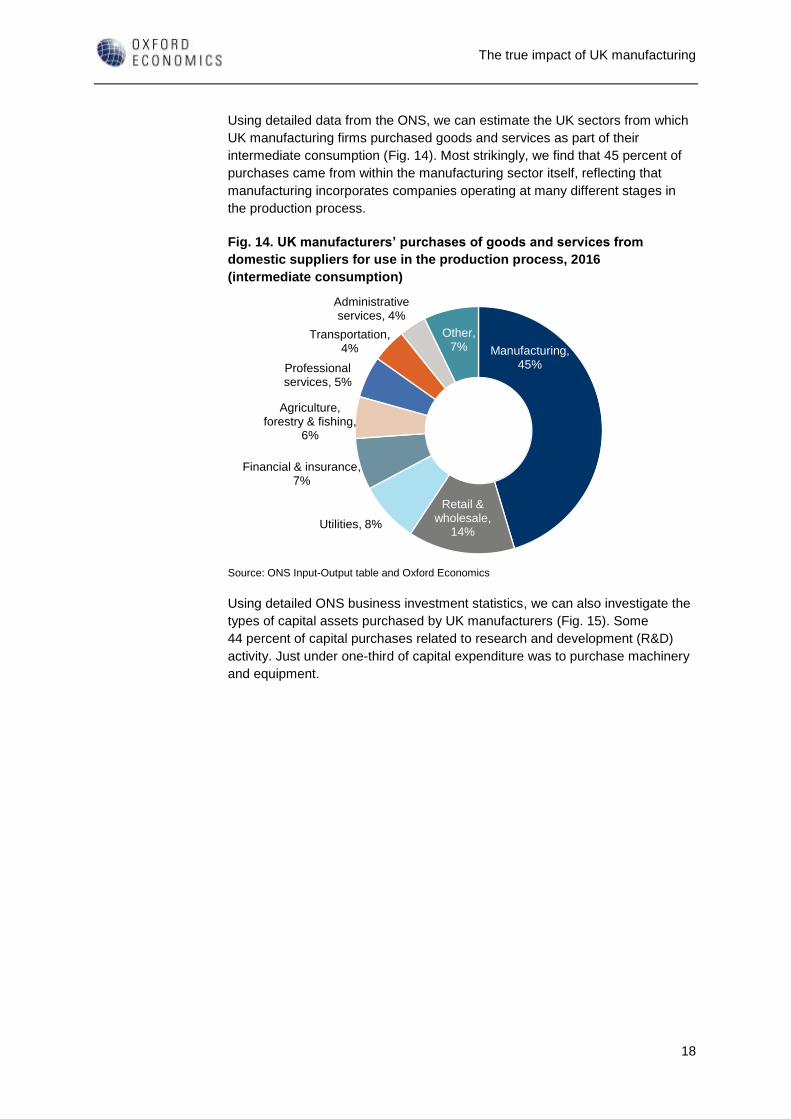
Using detailed data from the ONS, we can estimate the UK sectors from which
UK manufacturing firms purchased goods and services as part of their
intermediate consumption (Fig. 14). Most strikingly, we find that 45 percent of
purchases came from within the manufacturing sector itself, reflecting that
manufacturing incorporates companies operating at many different stages in
the production process.
Fig. 14. UK manufacturers’ purchases of goods and services from
domestic suppliers for use in the production process, 2016
(intermediate consumption)
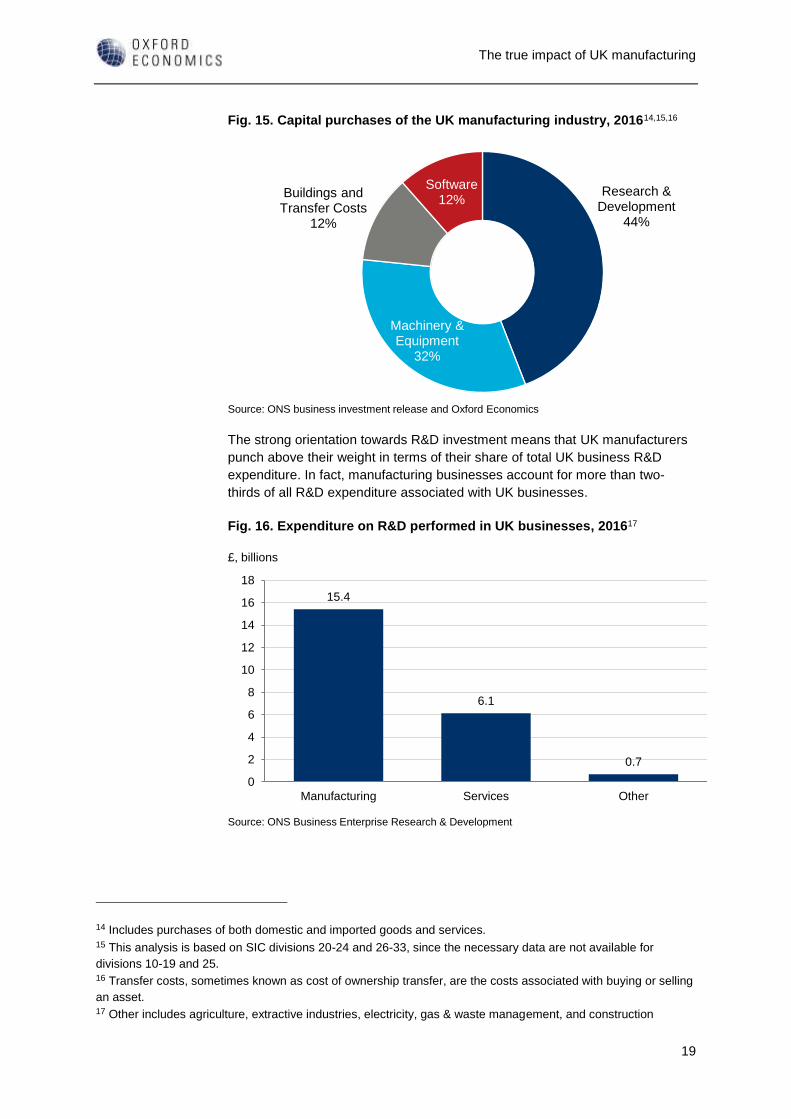
Using detailed ONS business investment statistics, we can also investigate the
types of capital assets purchased by UK manufacturers (Fig. 15). Some
44 percent of capital purchases related to research and development (R&D)
activity. Just under one-third of capital expenditure was to purchase machinery
and equipment.
Manufacturing, 45%
Retail & wholesale,
14%Utilities, 8%
Financial & insurance, 7%
Agriculture, forestry & fishing,
6%
Professional services, 5%
Transportation, 4%
Administrative services, 4%
Other, 7%
Source: ONS Input-Output table and Oxford Economics
The true impact of UK manufacturing
19
Fig. 15. Capital purchases of the UK manufacturing industry, 201614,15,16
The strong orientation towards R&D investment means that UK manufacturers
punch above their weight in terms of their share of total UK business R&D
expenditure. In fact, manufacturing businesses account for more than two-
thirds of all R&D expenditure associated with UK businesses.
Fig. 16. Expenditure on R&D performed in UK businesses, 201617
14 Includes purchases of both domestic and imported goods and services. 15 This analysis is based on SIC divisions 20-24 and 26-33, since the necessary data are not available for
divisions 10-19 and 25. 16 Transfer costs, sometimes known as cost of ownership transfer, are the costs associated with buying or selling
an asset. 17 Other includes agriculture, extractive industries, electricity, gas & waste management, and construction
Research & Development
44%
Machinery & Equipment
32%
Buildings and Transfer Costs
12%
Software12%
Source: ONS business investment release and Oxford Economics
15.4
6.1
0.7
Manufacturing Services Other
0
2
4
6
8
10
12
14
16
18
Source: ONS Business Enterprise Research & Development
£, billions
The true impact of UK manufacturing
20
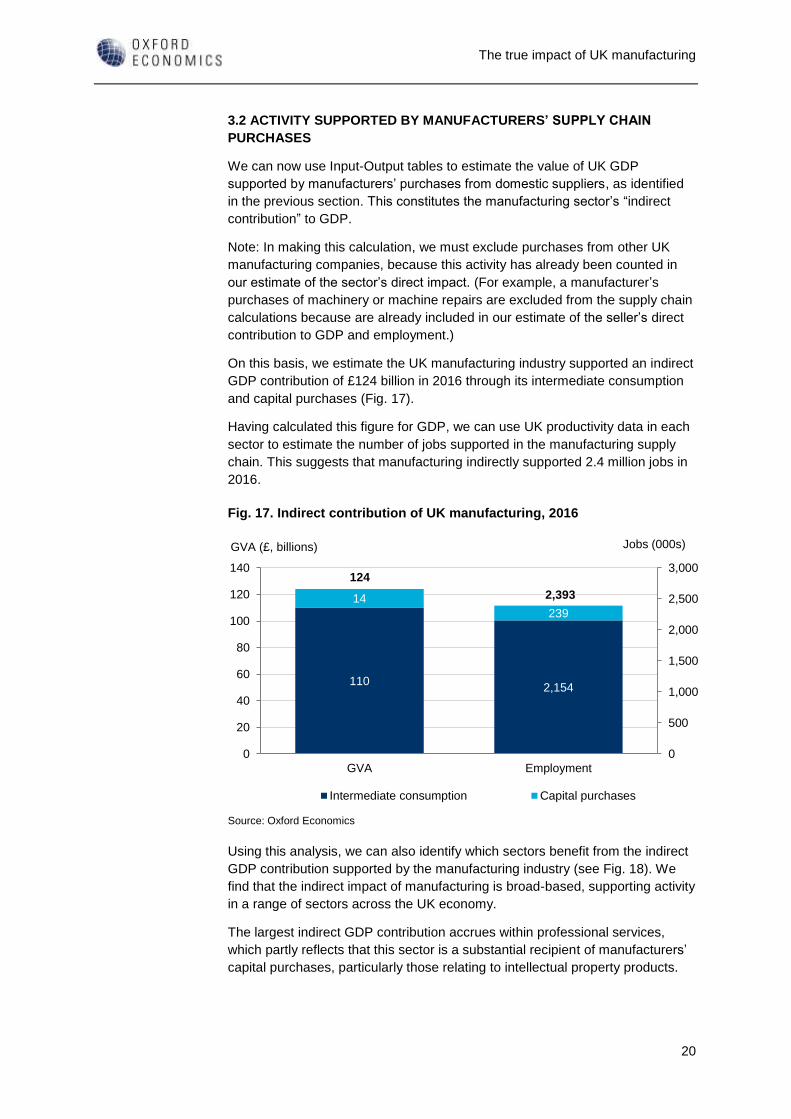
3.2 ACTIVITY SUPPORTED BY MANUFACTURERS’ SUPPLY CHAIN
PURCHASES
We can now use Input-Output tables to estimate the value of UK GDP
supported by manufacturers’ purchases from domestic suppliers, as identified
in the previous section. This constitutes the manufacturing sector’s “indirect
contribution” to GDP.
Note: In making this calculation, we must exclude purchases from other UK
manufacturing companies, because this activity has already been counted in
our estimate of the sector’s direct impact. (For example, a manufacturer’s
purchases of machinery or machine repairs are excluded from the supply chain
calculations because are already included in our estimate of the seller’s direct
contribution to GDP and employment.)
On this basis, we estimate the UK manufacturing industry supported an indirect
GDP contribution of £124 billion in 2016 through its intermediate consumption
and capital purchases (Fig. 17).
Having calculated this figure for GDP, we can use UK productivity data in each
sector to estimate the number of jobs supported in the manufacturing supply
chain. This suggests that manufacturing indirectly supported 2.4 million jobs in
2016.
Fig. 17. Indirect contribution of UK manufacturing, 2016
Using this analysis, we can also identify which sectors benefit from the indirect
GDP contribution supported by the manufacturing industry (see Fig. 18). We
find that the indirect impact of manufacturing is broad-based, supporting activity
in a range of sectors across the UK economy.
The largest indirect GDP contribution accrues within professional services,
which partly reflects that this sector is a substantial recipient of manufacturers’
capital purchases, particularly those relating to intellectual property products.
110
14
2,154
239
0
500
1,000
1,500
2,000
2,500
3,000
GVA Employment
0
20
40
60
80
100
120
140
Intermediate consumption Capital purchases
Source: Oxford Economics
GVA (£, billions) Jobs (000s)
124
2,393
The true impact of UK manufacturing
21
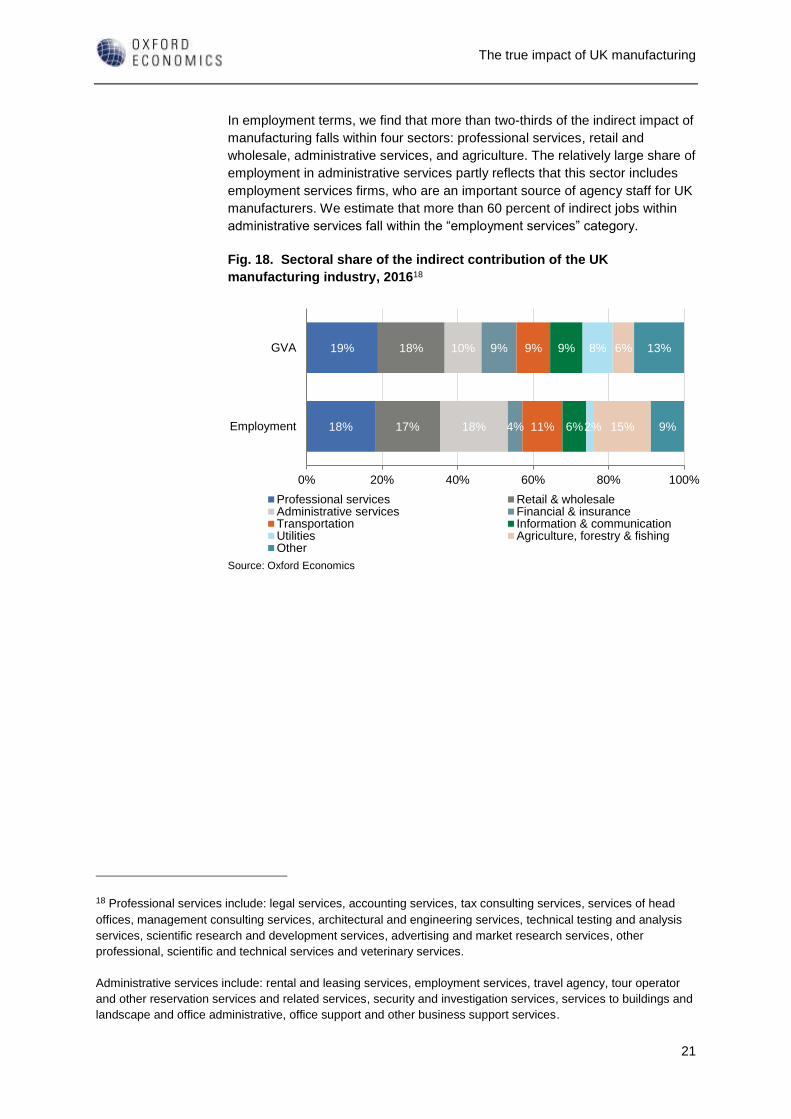
In employment terms, we find that more than two-thirds of the indirect impact of
manufacturing falls within four sectors: professional services, retail and
wholesale, administrative services, and agriculture. The relatively large share of
employment in administrative services partly reflects that this sector includes
employment services firms, who are an important source of agency staff for UK
manufacturers. We estimate that more than 60 percent of indirect jobs within
administrative services fall within the “employment services” category.
Fig. 18. Sectoral share of the indirect contribution of the UK
manufacturing industry, 201618
18 Professional services include: legal services, accounting services, tax consulting services, services of head
offices, management consulting services, architectural and engineering services, technical testing and analysis
services, scientific research and development services, advertising and market research services, other
professional, scientific and technical services and veterinary services.
Administrative services include: rental and leasing services, employment services, travel agency, tour operator
and other reservation services and related services, security and investigation services, services to buildings and
landscape and office administrative, office support and other business support services.
18%
19%
17%
18%
18%
10%
4%
9%
11%
9%
6%
9%
2%
8%
15%
6%
9%
13%
Employment
GVA
0% 20% 40% 60% 80% 100%
Professional services Retail & wholesaleAdministrative services Financial & insuranceTransportation Information & communicationUtilities Agriculture, forestry & fishingOther
Source: Oxford Economics
The true impact of UK manufacturing
22
4. WORKER SPENDING IMPACTS A second type of wider activity supported by manufacturing occurs as workers
employed in the manufacturing industry and its UK supply chain spend their
wages. These “induced impacts” are mainly felt in sectors serving households
such as hotels, restaurants and shops.
In Section 2.2, we highlighted that wage levels in manufacturing are greater
than the UK average. To assess the impact of these wage payments, along
with those to workers in the supply chain, we estimated the total value of wages
payable to workers in manufacturing and its supply chain using the Input-
Output model. We then estimated the value of consumer spending supported
by those wages, and finally the induced contribution to GDP associated with
this expenditure.19
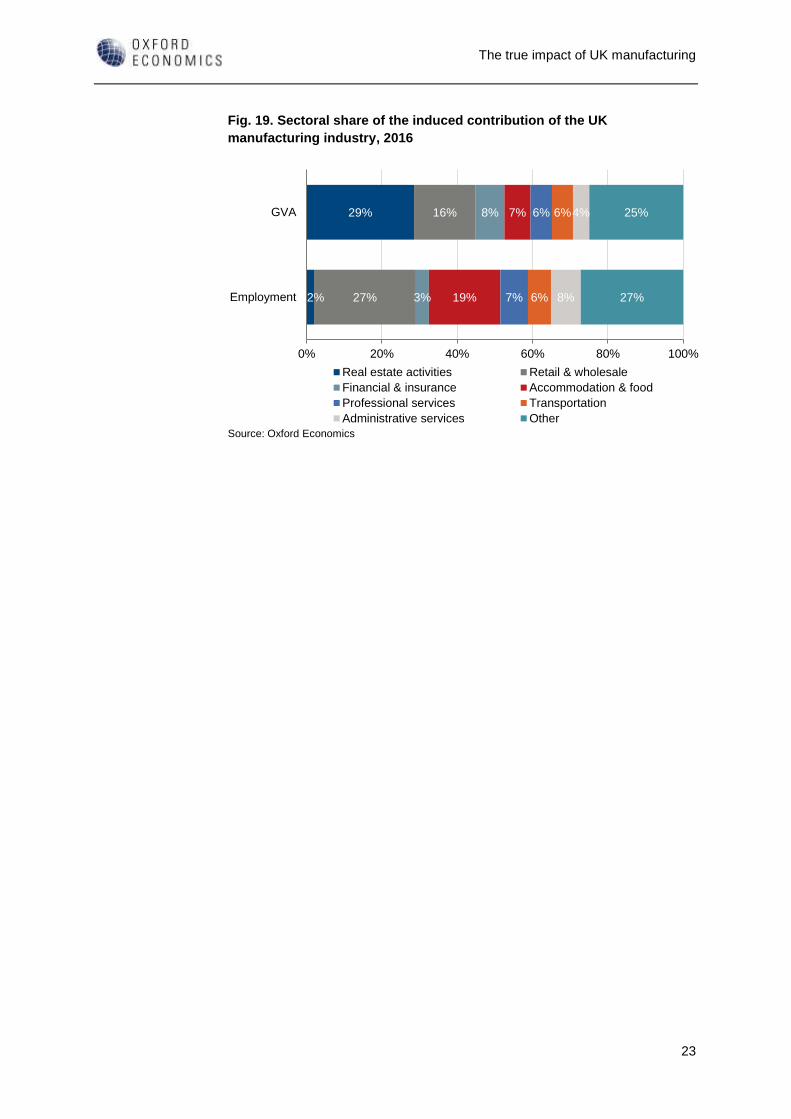
On this basis, we estimate that manufacturing supported a £144 billion
contribution to UK GDP through workers’ spending. The sectoral distribution of
this is shown in Fig. 19. Perhaps unsurprisingly, our analysis suggests the
largest beneficiaries of the worker spending impact are the real estate (in terms
of gross value added) and retail sectors.
By combining the induced GDP impact in each sector with productivity
estimates, we also estimate that manufacturing supported 2.3 million jobs
through worker spending multiplier effects in 2016. The breakdown of these
jobs by sector is also shown in Fig. 19.
Although real estate was a key contributor to the manufacturing industry’s
induced GDP contribution, it does not play a substantive role in employment
terms.20 In contrast, the induced impact of retail, and accommodation and food,
is much greater when measured in terms of employment than in terms of GDP.
19 In making these calculations we assume that the pattern of workers’ spending is in line with the UK average. 20 Real estate refers to the value to households of owning their residence, imputed as an equivalent rental value.
Within the modelling framework, this imputed spending flows to an ‘industry’—one that provides a service
(housing) and purchases some, comparatively limited inputs to provide this (e.g. maintenance and upkeep, fees
on mortgages). The difference between the output (equivalent to the imputed rent) and inputs means that value-
added is generated. However, no employment is associated with this. As such, induced activity in the real estate
sector can appear to give rise to lots of GVA and relatively few jobs.
The true impact of UK manufacturing
23
Fig. 19. Sectoral share of the induced contribution of the UK
manufacturing industry, 2016
2%
29%
27%
16%
3%
8%
19%
7%
7%
6%
6%
6%
8%
4%
27%
25%
Employment
GVA
0% 20% 40% 60% 80% 100%
Real estate activities Retail & wholesale
Financial & insurance Accommodation & food
Professional services Transportation
Administrative services Other
Source: Oxford Economics
The true impact of UK manufacturing
24
5. TOTAL IMPACT OF THE UK
MANUFACTURING SECTOR In this chapter, we bring together the findings of the previous sections to
present three estimates of how the manufacturing sector impacts on the UK
economy.
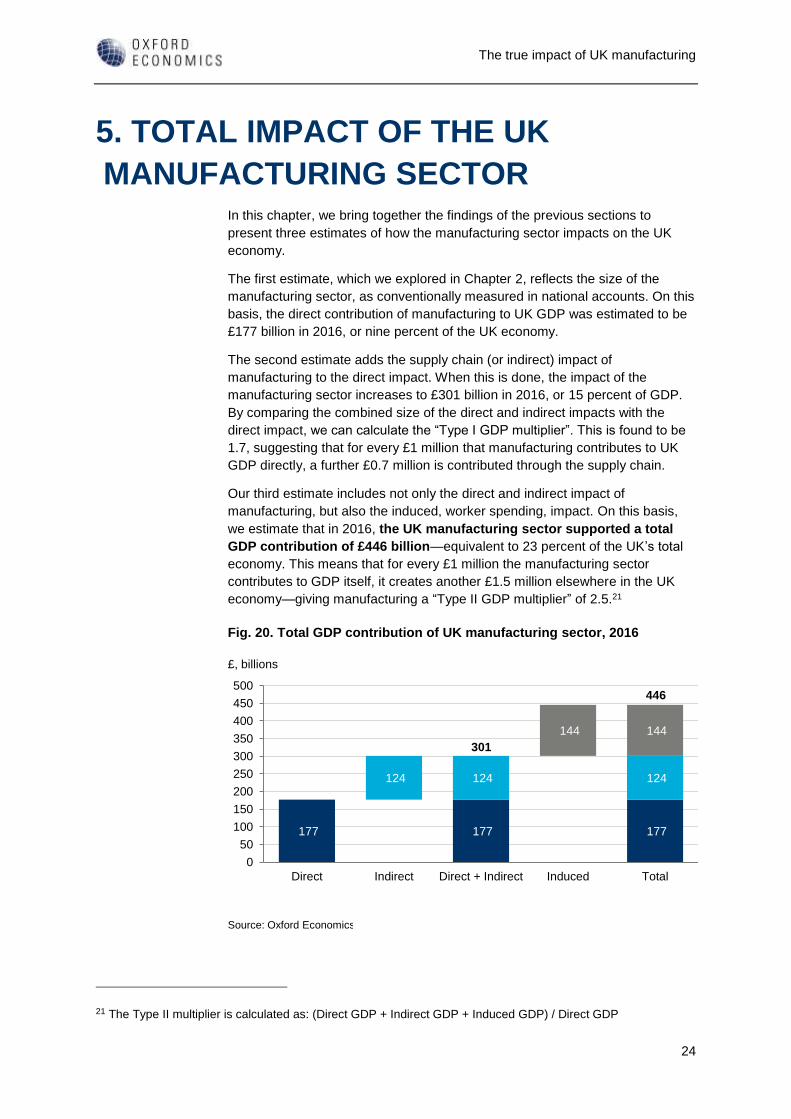
The first estimate, which we explored in Chapter 2, reflects the size of the
manufacturing sector, as conventionally measured in national accounts. On this
basis, the direct contribution of manufacturing to UK GDP was estimated to be
£177 billion in 2016, or nine percent of the UK economy.
The second estimate adds the supply chain (or indirect) impact of
manufacturing to the direct impact. When this is done, the impact of the
manufacturing sector increases to £301 billion in 2016, or 15 percent of GDP.
By comparing the combined size of the direct and indirect impacts with the
direct impact, we can calculate the “Type I GDP multiplier”. This is found to be
1.7, suggesting that for every £1 million that manufacturing contributes to UK
GDP directly, a further £0.7 million is contributed through the supply chain.
Our third estimate includes not only the direct and indirect impact of
manufacturing, but also the induced, worker spending, impact. On this basis,
we estimate that in 2016, the UK manufacturing sector supported a total
GDP contribution of £446 billion—equivalent to 23 percent of the UK’s total
economy. This means that for every £1 million the manufacturing sector
contributes to GDP itself, it creates another £1.5 million elsewhere in the UK
economy—giving manufacturing a “Type II GDP multiplier” of 2.5.21
Fig. 20. Total GDP contribution of UK manufacturing sector, 2016
21 The Type II multiplier is calculated as: (Direct GDP + Indirect GDP + Induced GDP) / Direct GDP
177 177 177
124 124 124
144 144
Direct Indirect Direct + Indirect Induced Total
0
50
100
150
200
250
300
350
400
450
500
Source: Oxford Economics
£, billions
446
301
The true impact of UK manufacturing
25
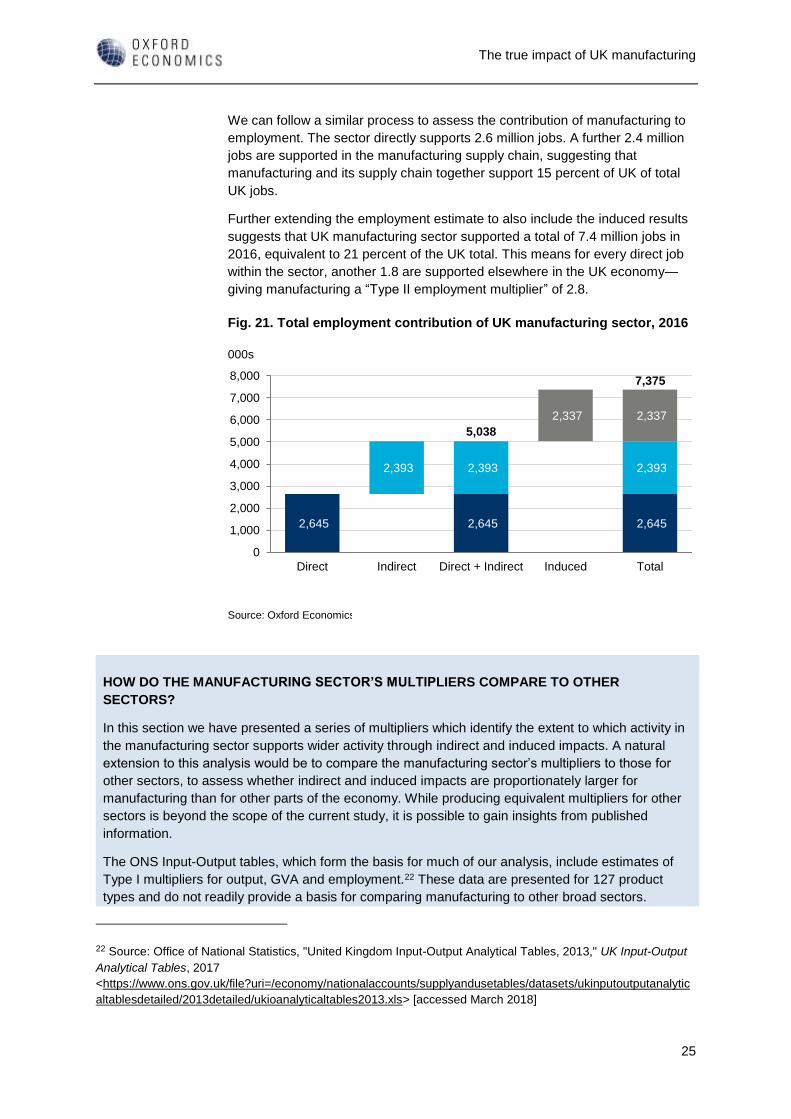
We can follow a similar process to assess the contribution of manufacturing to
employment. The sector directly supports 2.6 million jobs. A further 2.4 million
jobs are supported in the manufacturing supply chain, suggesting that
manufacturing and its supply chain together support 15 percent of UK of total
UK jobs.
Further extending the employment estimate to also include the induced results
suggests that UK manufacturing sector supported a total of 7.4 million jobs in
2016, equivalent to 21 percent of the UK total. This means for every direct job
within the sector, another 1.8 are supported elsewhere in the UK economy—
giving manufacturing a “Type II employment multiplier” of 2.8.
Fig. 21. Total employment contribution of UK manufacturing sector, 2016
HOW DO THE MANUFACTURING SECTOR’S MULTIPLIERS COMPARE TO OTHER
SECTORS?
In this section we have presented a series of multipliers which identify the extent to which activity in
the manufacturing sector supports wider activity through indirect and induced impacts. A natural
extension to this analysis would be to compare the manufacturing sector’s multipliers to those for
other sectors, to assess whether indirect and induced impacts are proportionately larger for
manufacturing than for other parts of the economy. While producing equivalent multipliers for other
sectors is beyond the scope of the current study, it is possible to gain insights from published
information.
The ONS Input-Output tables, which form the basis for much of our analysis, include estimates of
Type I multipliers for output, GVA and employment.22 These data are presented for 127 product
types and do not readily provide a basis for comparing manufacturing to other broad sectors.
22 Source: Office of National Statistics, "United Kingdom Input-Output Analytical Tables, 2013," UK Input-Output
Analytical Tables, 2017
<https://www.ons.gov.uk/file?uri=/economy/nationalaccounts/supplyandusetables/datasets/ukinputoutputanalytic
altablesdetailed/2013detailed/ukioanalyticaltables2013.xls> [accessed March 2018]
2,645 2,645 2,645
2,393 2,393 2,393
2,337 2,337
Direct Indirect Direct + Indirect Induced Total
0
1,000
2,000
3,000
4,000
5,000
6,000
7,000
8,000
Source: Oxford Economics
000s
7,375
5,038
The true impact of UK manufacturing
26
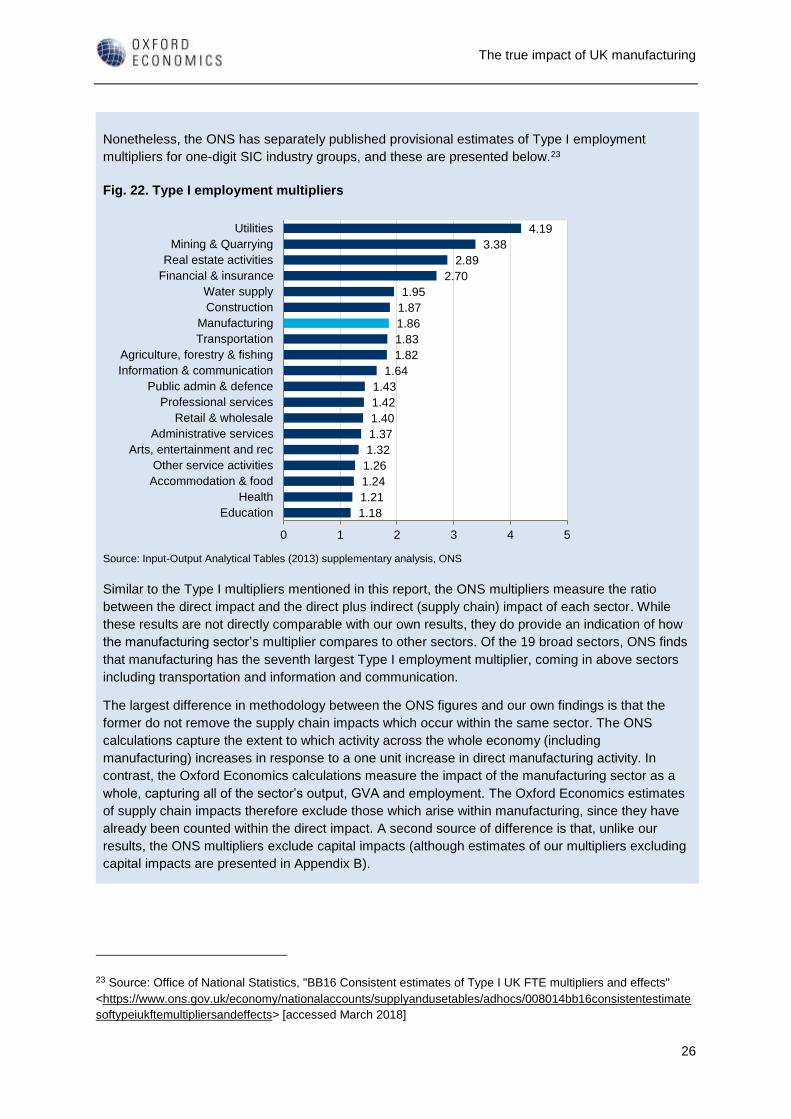
Nonetheless, the ONS has separately published provisional estimates of Type I employment
multipliers for one-digit SIC industry groups, and these are presented below.23
Fig. 22. Type I employment multipliers
Similar to the Type I multipliers mentioned in this report, the ONS multipliers measure the ratio
between the direct impact and the direct plus indirect (supply chain) impact of each sector. While
these results are not directly comparable with our own results, they do provide an indication of how
the manufacturing sector’s multiplier compares to other sectors. Of the 19 broad sectors, ONS finds
that manufacturing has the seventh largest Type I employment multiplier, coming in above sectors
including transportation and information and communication.
The largest difference in methodology between the ONS figures and our own findings is that the
former do not remove the supply chain impacts which occur within the same sector. The ONS
calculations capture the extent to which activity across the whole economy (including
manufacturing) increases in response to a one unit increase in direct manufacturing activity. In
contrast, the Oxford Economics calculations measure the impact of the manufacturing sector as a
whole, capturing all of the sector’s output, GVA and employment. The Oxford Economics estimates
of supply chain impacts therefore exclude those which arise within manufacturing, since they have
already been counted within the direct impact. A second source of difference is that, unlike our
results, the ONS multipliers exclude capital impacts (although estimates of our multipliers excluding
capital impacts are presented in Appendix B).
23 Source: Office of National Statistics, "BB16 Consistent estimates of Type I UK FTE multipliers and effects"
<https://www.ons.gov.uk/economy/nationalaccounts/supplyandusetables/adhocs/008014bb16consistentestimate
softypeiukftemultipliersandeffects> [accessed March 2018]
4.19
3.38
2.89
2.70
1.95
1.87
1.86
1.83
1.82
1.64
1.43
1.42
1.40
1.37
1.32
1.26
1.24
1.21
1.18
0 1 2 3 4 5
Utilities
Mining & Quarrying
Real estate activities
Financial & insurance
Water supply
Construction
Manufacturing
Transportation
Agriculture, forestry & fishing
Information & communication
Public admin & defence
Professional services
Retail & wholesale
Administrative services
Arts, entertainment and rec
Other service activities
Accommodation & food
Health
Education
Source: Input-Output Analytical Tables (2013) supplementary analysis, ONS
The true impact of UK manufacturing
27
6. THE IMPACT OF THE ENGINEERING
SECTOR As well as assessing the economic impact of UK manufacturing as a whole, the
MTA is also interested in exploring the impact of a sub-set of manufacturing
sectors which together constitute “engineering”. In this chapter, we use the
same techniques to estimate the full economic impact of those elements of
manufacturing which the MTA classes as engineering.
6.1 DIRECT IMPACT OF THE ENGINEERING SUB-SECTOR
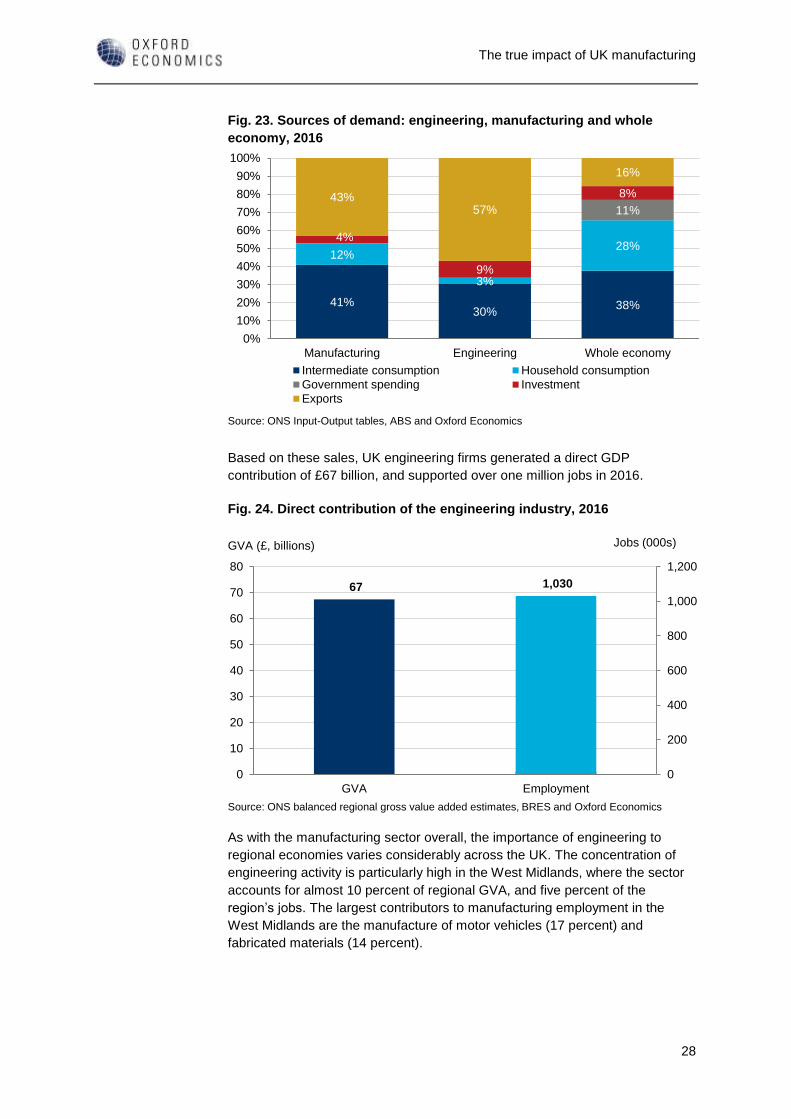
In 2016, the UK engineering sub-sector sold products worth £209 billion, or
38 percent of total manufacturing sales. Analysis of Input-Output tables
suggests that engineering sales are even more export-orientated than for the
manufacturing sector as a whole: some 57 percent of demand comes from
customers overseas (Fig. 23).
DEFINITION OF THE ENGINEERING SUB-SECTOR
The MTA defines “engineering” to include the following types of manufacturing activity:
• Fabricated metal products, except machinery and equipment (SIC division 25)
• Computer, electronic and optical products (26)
• Electrical equipment (27)
• Machinery and equipment not elsewhere classified (28)
• Motor vehicles, trailers and semi-trailers (29)
• Other transport equipment (30)
The MTA has noted that some UK companies engaged in the engineering sector may earn a
large share of their revenues from the provision of engineering services. However, there is no
separate SIC category for engineering services and hence there is no systematic way of
identifying such firms within official statistics. To the extent that engineering services firms are
assigned to the SIC codes identified above, they will be included in our analysis.
The true impact of UK manufacturing
28
Fig. 23. Sources of demand: engineering, manufacturing and whole
economy, 2016
Based on these sales, UK engineering firms generated a direct GDP
contribution of £67 billion, and supported over one million jobs in 2016.
Fig. 24. Direct contribution of the engineering industry, 2016
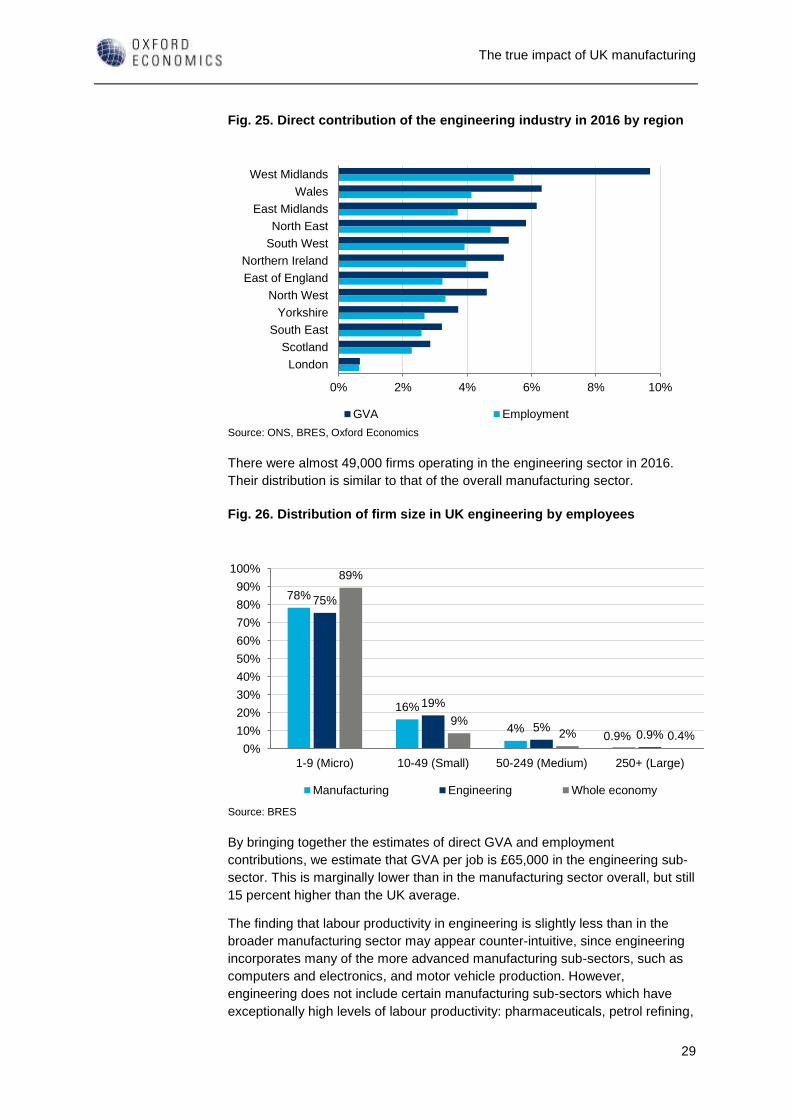
As with the manufacturing sector overall, the importance of engineering to
regional economies varies considerably across the UK. The concentration of
engineering activity is particularly high in the West Midlands, where the sector
accounts for almost 10 percent of regional GVA, and five percent of the
region’s jobs. The largest contributors to manufacturing employment in the
West Midlands are the manufacture of motor vehicles (17 percent) and
fabricated materials (14 percent).
41%30%
38%
12%
3%
28%
11%
4%
9%
8%43%57%
16%
Manufacturing Engineering Whole economy
0%
10%
20%
30%
40%
50%
60%
70%
80%
90%
100%
Intermediate consumption Household consumption
Government spending Investment
Exports
Source: ONS Input-Output tables, ABS and Oxford Economics
67 1,030
0
200
400
600
800
1,000
1,200
GVA Employment
0
10
20
30
40
50
60
70
80
Source: ONS balanced regional gross value added estimates, BRES and Oxford Economics
GVA (£, billions) Jobs (000s)
The true impact of UK manufacturing
29
Fig. 25. Direct contribution of the engineering industry in 2016 by region
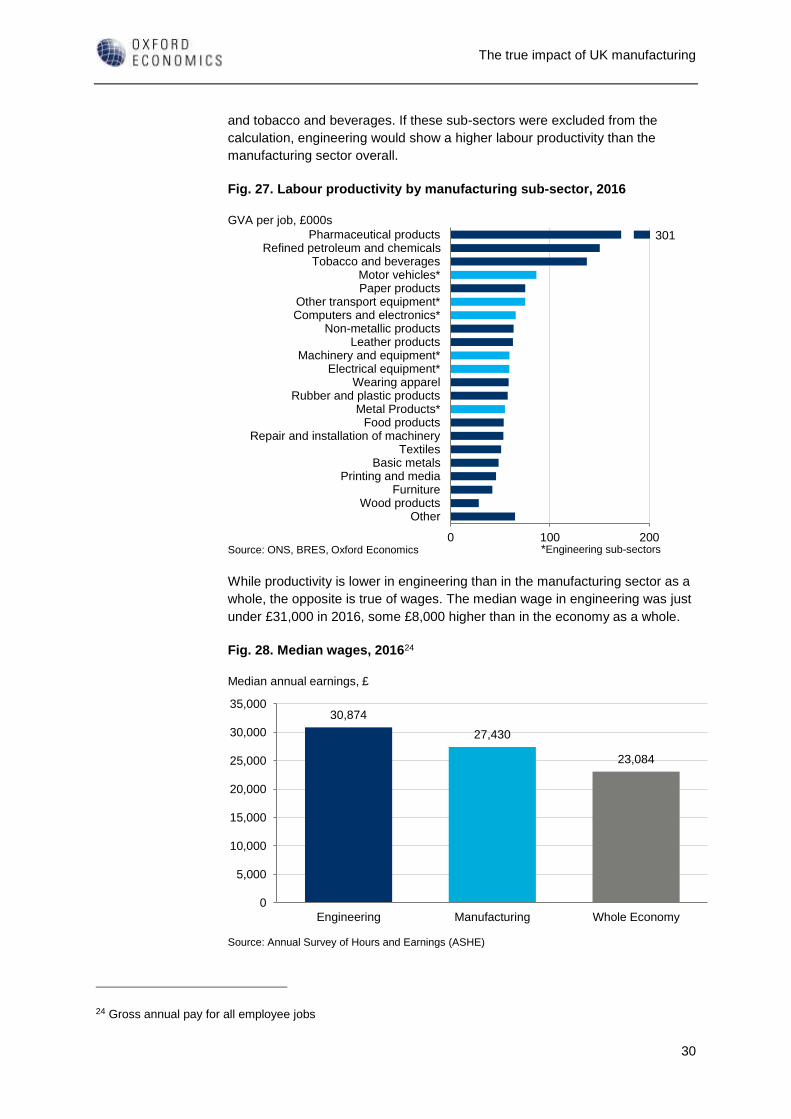
There were almost 49,000 firms operating in the engineering sector in 2016.
Their distribution is similar to that of the overall manufacturing sector.
Fig. 26. Distribution of firm size in UK engineering by employees
By bringing together the estimates of direct GVA and employment
contributions, we estimate that GVA per job is £65,000 in the engineering sub-
sector. This is marginally lower than in the manufacturing sector overall, but still
15 percent higher than the UK average.
The finding that labour productivity in engineering is slightly less than in the
broader manufacturing sector may appear counter-intuitive, since engineering
incorporates many of the more advanced manufacturing sub-sectors, such as
computers and electronics, and motor vehicle production. However,
engineering does not include certain manufacturing sub-sectors which have
exceptionally high levels of labour productivity: pharmaceuticals, petrol refining,
West Midlands
Wales
East Midlands
North East
South West
Northern Ireland
East of England
North West
Yorkshire
South East
Scotland
London
0% 2% 4% 6% 8% 10%
GVA Employment
Source: ONS, BRES, Oxford Economics
78%
16%
4%0.9%
75%
19%
5%0.9%
89%
9%2% 0.4%
1-9 (Micro) 10-49 (Small) 50-249 (Medium) 250+ (Large)
0%
10%
20%
30%
40%
50%
60%
70%
80%
90%
100%
Manufacturing Engineering Whole economy
Source: BRES
The true impact of UK manufacturing
30
and tobacco and beverages. If these sub-sectors were excluded from the
calculation, engineering would show a higher labour productivity than the
manufacturing sector overall.
Fig. 27. Labour productivity by manufacturing sub-sector, 2016
While productivity is lower in engineering than in the manufacturing sector as a
whole, the opposite is true of wages. The median wage in engineering was just
under £31,000 in 2016, some £8,000 higher than in the economy as a whole.
Fig. 28. Median wages, 201624
24 Gross annual pay for all employee jobs
Pharmaceutical productsRefined petroleum and chemicals
Tobacco and beveragesMotor vehicles*Paper products
Other transport equipment*Computers and electronics*
Non-metallic productsLeather products
Machinery and equipment*Electrical equipment*
Wearing apparelRubber and plastic products
Metal Products*Food products
Repair and installation of machineryTextiles
Basic metalsPrinting and media
FurnitureWood products
Other
0 100 200Source: ONS, BRES, Oxford Economics
GVA per job, £000s
301
*Engineering sub-sectors
30,874
27,430
23,084
Engineering Manufacturing Whole Economy
0
5,000
10,000
15,000
20,000
25,000
30,000
35,000
Source: Annual Survey of Hours and Earnings (ASHE)
Median annual earnings, £
The true impact of UK manufacturing
31
6.2 SUPPLY CHAIN IMPACTS
6.2.1 Engineering companies’ purchases of goods and services
As well as the employment and GDP it generates itself, the engineering sub-
sector supports further activity through its purchases from UK suppliers. As with
the manufacturing sector, we can estimate the value of expenditure that
engineering companies make through their intermediate consumption and
capital investments (Fig. 29).
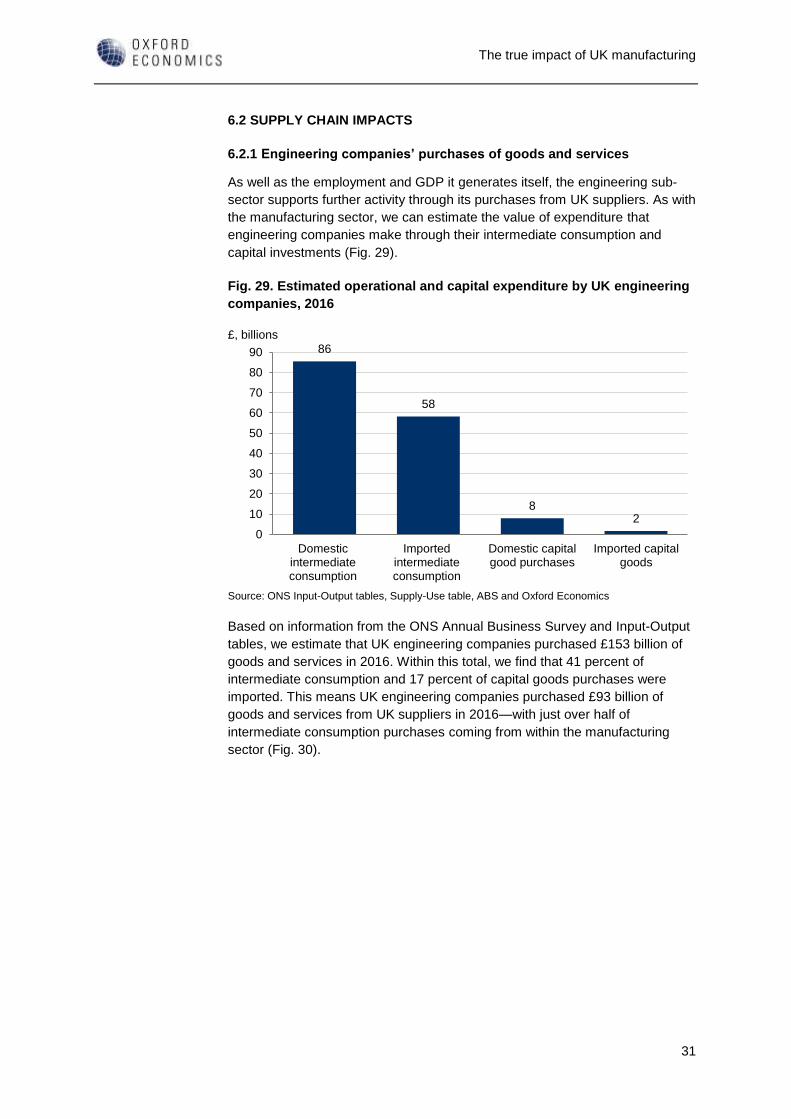
Fig. 29. Estimated operational and capital expenditure by UK engineering
companies, 2016
Based on information from the ONS Annual Business Survey and Input-Output
tables, we estimate that UK engineering companies purchased £153 billion of
goods and services in 2016. Within this total, we find that 41 percent of
intermediate consumption and 17 percent of capital goods purchases were
imported. This means UK engineering companies purchased £93 billion of
goods and services from UK suppliers in 2016—with just over half of
intermediate consumption purchases coming from within the manufacturing
sector (Fig. 30).
86
58
82
Domesticintermediateconsumption
Importedintermediateconsumption
Domestic capitalgood purchases
Imported capitalgoods
0
10
20
30
40
50
60
70
80
90
Source: ONS Input-Output tables, Supply-Use table, ABS and Oxford Economics
£, billions
The true impact of UK manufacturing
32
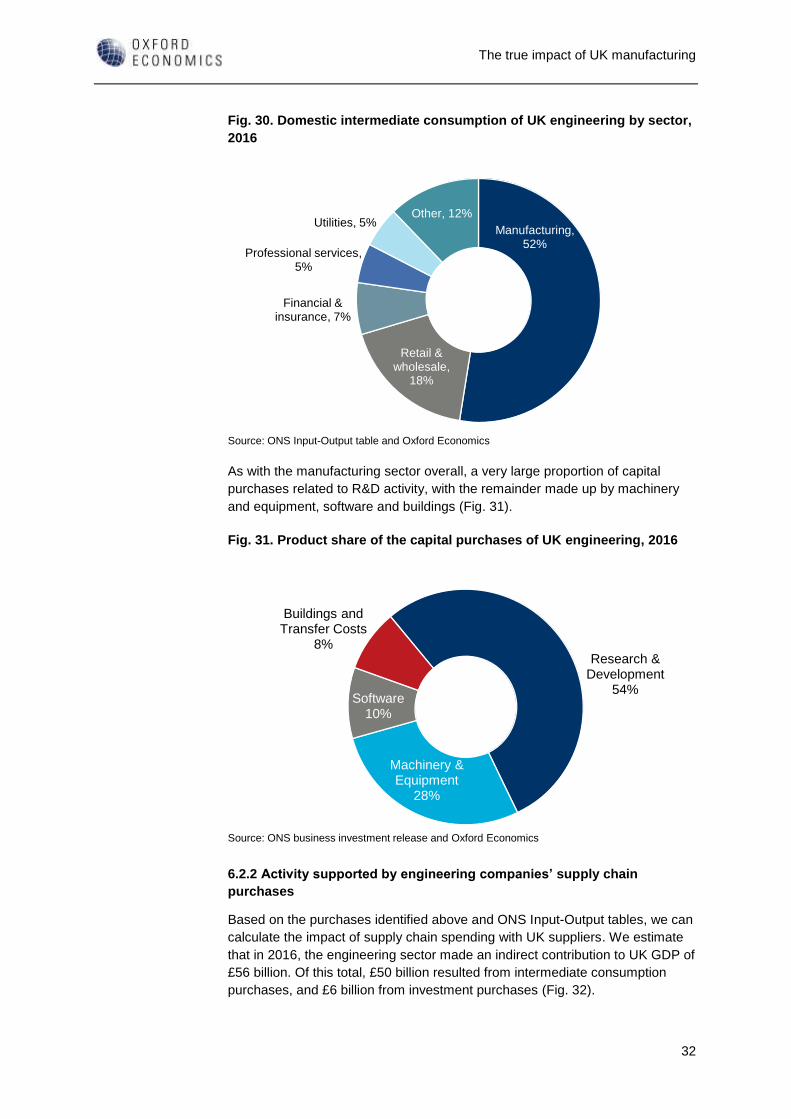
Fig. 30. Domestic intermediate consumption of UK engineering by sector,
2016
As with the manufacturing sector overall, a very large proportion of capital
purchases related to R&D activity, with the remainder made up by machinery
and equipment, software and buildings (Fig. 31).
Fig. 31. Product share of the capital purchases of UK engineering, 2016
6.2.2 Activity supported by engineering companies’ supply chain
purchases
Based on the purchases identified above and ONS Input-Output tables, we can
calculate the impact of supply chain spending with UK suppliers. We estimate
that in 2016, the engineering sector made an indirect contribution to UK GDP of
£56 billion. Of this total, £50 billion resulted from intermediate consumption
purchases, and £6 billion from investment purchases (Fig. 32).
Manufacturing, 52%
Retail & wholesale,
18%
Financial & insurance, 7%
Professional services, 5%
Utilities, 5%Other, 12%
Source: ONS Input-Output table and Oxford Economics
Research & Development
54%
Machinery & Equipment
28%
Software10%
Buildings and Transfer Costs
8%
Source: ONS business investment release and Oxford Economics
The true impact of UK manufacturing
33
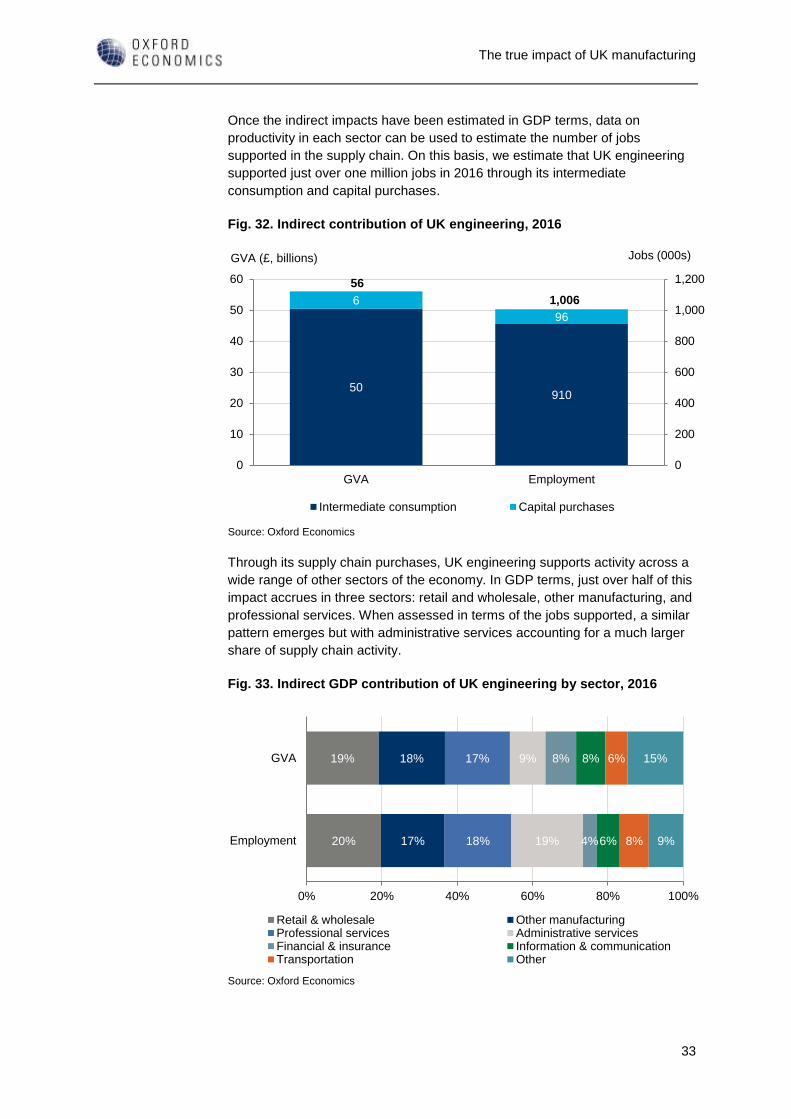
Once the indirect impacts have been estimated in GDP terms, data on
productivity in each sector can be used to estimate the number of jobs
supported in the supply chain. On this basis, we estimate that UK engineering
supported just over one million jobs in 2016 through its intermediate
consumption and capital purchases.
Fig. 32. Indirect contribution of UK engineering, 2016
Through its supply chain purchases, UK engineering supports activity across a
wide range of other sectors of the economy. In GDP terms, just over half of this
impact accrues in three sectors: retail and wholesale, other manufacturing, and
professional services. When assessed in terms of the jobs supported, a similar
pattern emerges but with administrative services accounting for a much larger
share of supply chain activity.
Fig. 33. Indirect GDP contribution of UK engineering by sector, 2016
50
6
910
96
0
200
400
600
800
1,000
1,200
GVA Employment
0
10
20
30
40
50
60
Intermediate consumption Capital purchases
Source: Oxford Economics
GVA (£, billions) Jobs (000s)
56
1,006
20%
19%
17%
18%
18%
17%
19%
9%
4%
8%
6%
8%
8%
6%
9%
15%
Employment
GVA
0% 20% 40% 60% 80% 100%
Retail & wholesale Other manufacturingProfessional services Administrative servicesFinancial & insurance Information & communicationTransportation Other
Source: Oxford Economics
The true impact of UK manufacturing
34
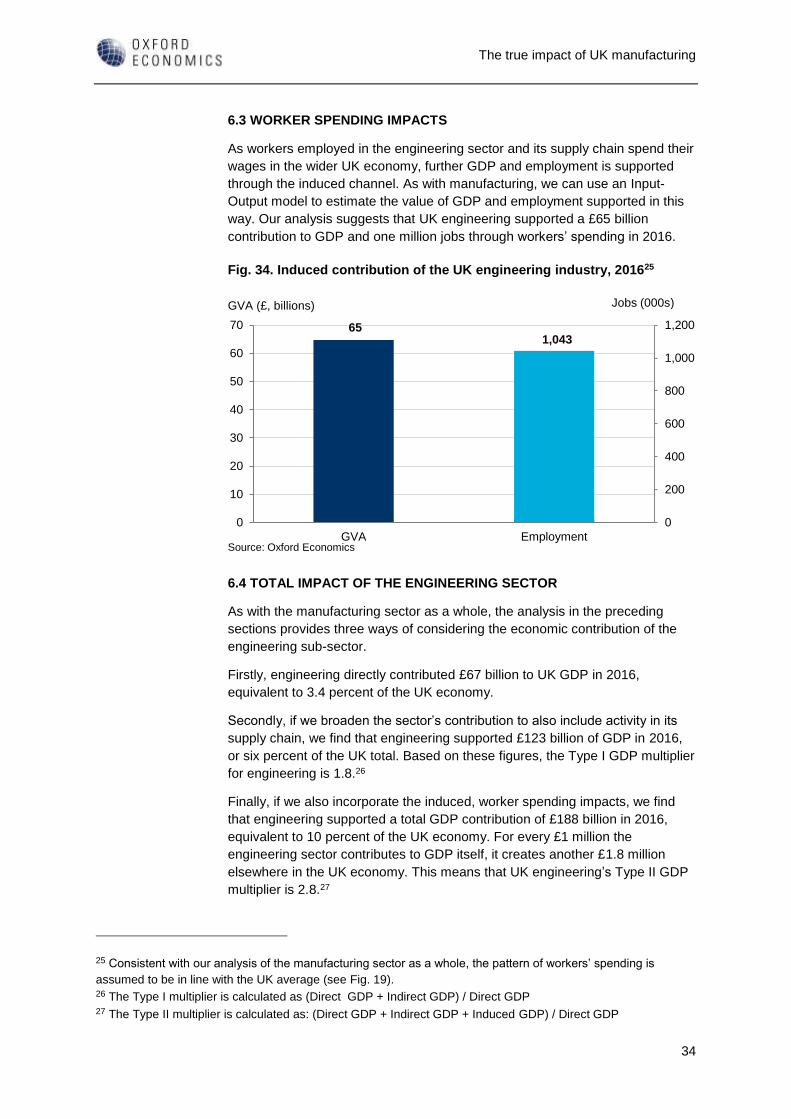
6.3 WORKER SPENDING IMPACTS
As workers employed in the engineering sector and its supply chain spend their
wages in the wider UK economy, further GDP and employment is supported
through the induced channel. As with manufacturing, we can use an Input-
Output model to estimate the value of GDP and employment supported in this
way. Our analysis suggests that UK engineering supported a £65 billion
contribution to GDP and one million jobs through workers’ spending in 2016.
Fig. 34. Induced contribution of the UK engineering industry, 201625
6.4 TOTAL IMPACT OF THE ENGINEERING SECTOR
As with the manufacturing sector as a whole, the analysis in the preceding
sections provides three ways of considering the economic contribution of the
engineering sub-sector.
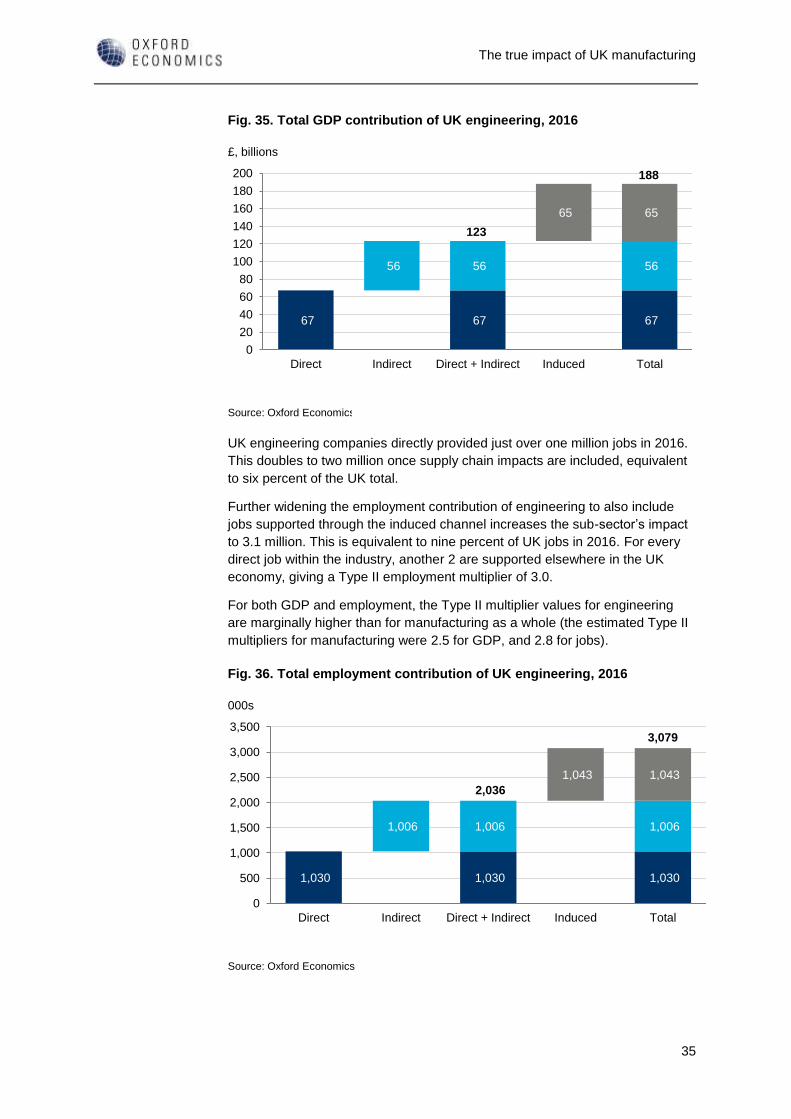
Firstly, engineering directly contributed £67 billion to UK GDP in 2016,
equivalent to 3.4 percent of the UK economy.
Secondly, if we broaden the sector’s contribution to also include activity in its
supply chain, we find that engineering supported £123 billion of GDP in 2016,
or six percent of the UK total. Based on these figures, the Type I GDP multiplier
for engineering is 1.8.26
Finally, if we also incorporate the induced, worker spending impacts, we find
that engineering supported a total GDP contribution of £188 billion in 2016,
equivalent to 10 percent of the UK economy. For every £1 million the
engineering sector contributes to GDP itself, it creates another £1.8 million
elsewhere in the UK economy. This means that UK engineering’s Type II GDP
multiplier is 2.8.27
25 Consistent with our analysis of the manufacturing sector as a whole, the pattern of workers’ spending is
assumed to be in line with the UK average (see Fig. 19). 26 The Type I multiplier is calculated as (Direct GDP + Indirect GDP) / Direct GDP 27 The Type II multiplier is calculated as: (Direct GDP + Indirect GDP + Induced GDP) / Direct GDP
65 1,043
0
200
400
600
800
1,000
1,200
GVA Employment
0
10
20
30
40
50
60
70
Source: Oxford Economics
GVA (£, billions) Jobs (000s)
The true impact of UK manufacturing
35
Fig. 35. Total GDP contribution of UK engineering, 2016
UK engineering companies directly provided just over one million jobs in 2016.
This doubles to two million once supply chain impacts are included, equivalent
to six percent of the UK total.
Further widening the employment contribution of engineering to also include
jobs supported through the induced channel increases the sub-sector’s impact
to 3.1 million. This is equivalent to nine percent of UK jobs in 2016. For every
direct job within the industry, another 2 are supported elsewhere in the UK
economy, giving a Type II employment multiplier of 3.0.
For both GDP and employment, the Type II multiplier values for engineering
are marginally higher than for manufacturing as a whole (the estimated Type II
multipliers for manufacturing were 2.5 for GDP, and 2.8 for jobs).
Fig. 36. Total employment contribution of UK engineering, 2016
67 67 67
56 56 56
65 65
Direct Indirect Direct + Indirect Induced Total
0
20
40
60
80
100
120
140
160
180
200
Source: Oxford Economics
£, billions
188
123
1,030 1,030 1,030
1,006 1,006 1,006
1,043 1,043
Direct Indirect Direct + Indirect Induced Total
0
500
1,000
1,500
2,000
2,500
3,000
3,500
Source: Oxford Economics
000s
3,079
2,036
The true impact of UK manufacturing
36
APPENDIX A: DEFINITION OF THE
MANUFACTURING AND
ENGINEERING SECTORS
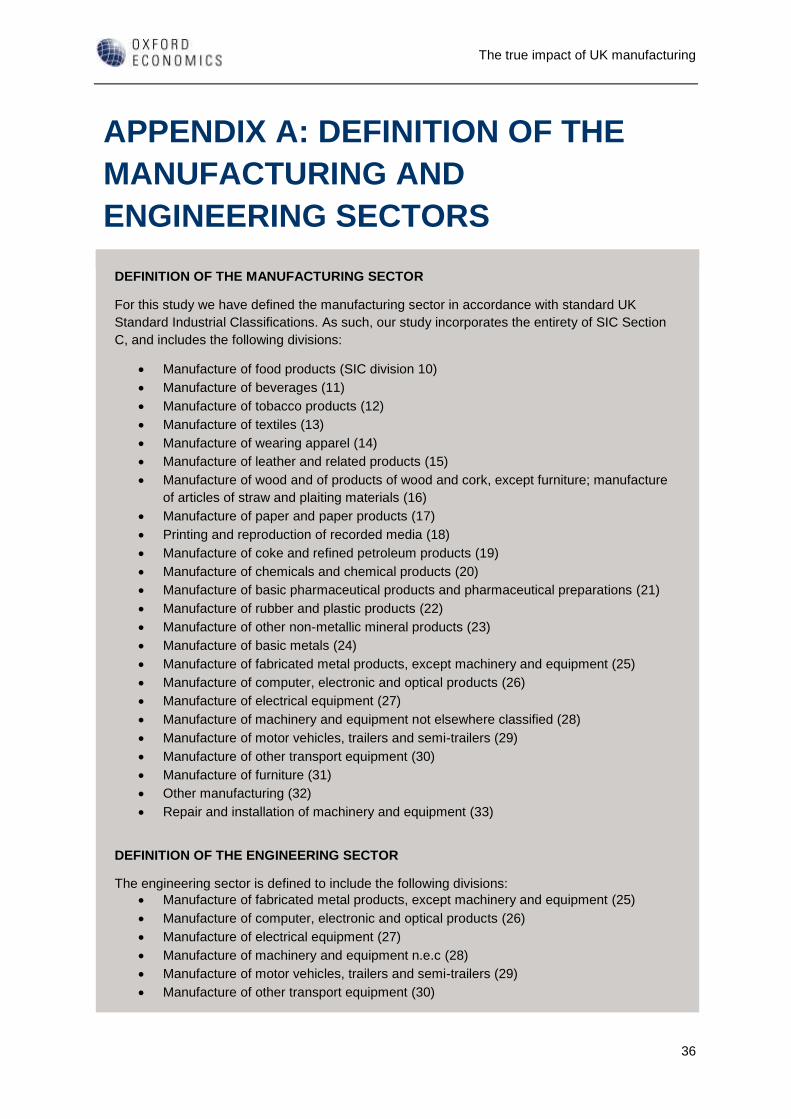
DEFINITION OF THE MANUFACTURING SECTOR
For this study we have defined the manufacturing sector in accordance with standard UK
Standard Industrial Classifications. As such, our study incorporates the entirety of SIC Section
C, and includes the following divisions:
• Manufacture of food products (SIC division 10)
• Manufacture of beverages (11)
• Manufacture of tobacco products (12)
• Manufacture of textiles (13)
• Manufacture of wearing apparel (14)
• Manufacture of leather and related products (15)
• Manufacture of wood and of products of wood and cork, except furniture; manufacture
of articles of straw and plaiting materials (16)
• Manufacture of paper and paper products (17)
• Printing and reproduction of recorded media (18)
• Manufacture of coke and refined petroleum products (19)
• Manufacture of chemicals and chemical products (20)
• Manufacture of basic pharmaceutical products and pharmaceutical preparations (21)
• Manufacture of rubber and plastic products (22)
• Manufacture of other non-metallic mineral products (23)
• Manufacture of basic metals (24)
• Manufacture of fabricated metal products, except machinery and equipment (25)
• Manufacture of computer, electronic and optical products (26)
• Manufacture of electrical equipment (27)
• Manufacture of machinery and equipment not elsewhere classified (28)
• Manufacture of motor vehicles, trailers and semi-trailers (29)
• Manufacture of other transport equipment (30)
• Manufacture of furniture (31)
• Other manufacturing (32)
• Repair and installation of machinery and equipment (33)
DEFINITION OF THE ENGINEERING SECTOR
The engineering sector is defined to include the following divisions:
• Manufacture of fabricated metal products, except machinery and equipment (25)
• Manufacture of computer, electronic and optical products (26)
• Manufacture of electrical equipment (27)
• Manufacture of machinery and equipment n.e.c (28)
• Manufacture of motor vehicles, trailers and semi-trailers (29)
• Manufacture of other transport equipment (30)
The true impact of UK manufacturing
37
APPENDIX B: DETAILED RESULTS
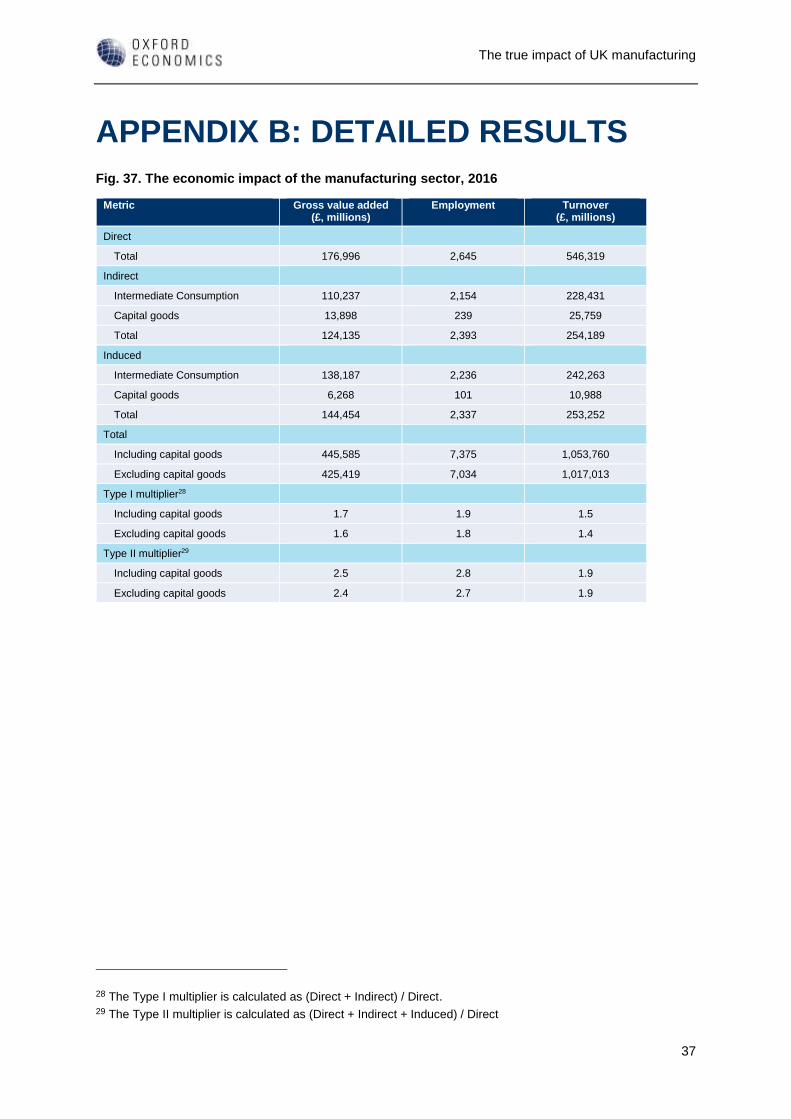
Fig. 37. The economic impact of the manufacturing sector, 2016
Metric Gross value added (£, millions)
Employment Turnover (£, millions)
Direct
Total 176,996 2,645 546,319
Indirect
Intermediate Consumption 110,237 2,154 228,431
Capital goods 13,898 239 25,759
Total 124,135 2,393 254,189
Induced
Intermediate Consumption 138,187 2,236 242,263
Capital goods 6,268 101 10,988
Total 144,454 2,337 253,252
Total
Including capital goods 445,585 7,375 1,053,760
Excluding capital goods 425,419 7,034 1,017,013
Type I multiplier28
Including capital goods 1.7 1.9 1.5
Excluding capital goods 1.6 1.8 1.4
Type II multiplier29
Including capital goods 2.5 2.8 1.9
Excluding capital goods 2.4 2.7 1.9
28 The Type I multiplier is calculated as (Direct + Indirect) / Direct. 29 The Type II multiplier is calculated as (Direct + Indirect + Induced) / Direct
The true impact of UK manufacturing
38
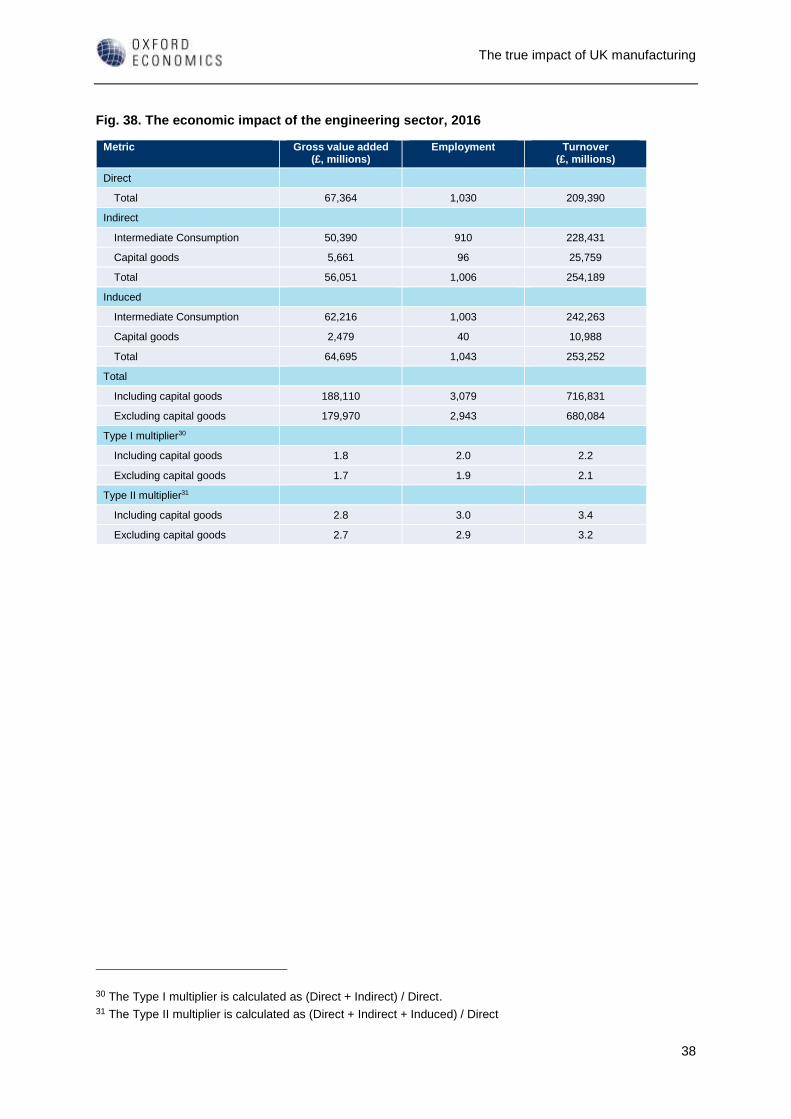
Fig. 38. The economic impact of the engineering sector, 2016
Metric Gross value added (£, millions)
Employment Turnover (£, millions)
Direct
Total 67,364 1,030 209,390
Indirect
Intermediate Consumption 50,390 910 228,431
Capital goods 5,661 96 25,759
Total 56,051 1,006 254,189
Induced
Intermediate Consumption 62,216 1,003 242,263
Capital goods 2,479 40 10,988
Total 64,695 1,043 253,252
Total
Including capital goods 188,110 3,079 716,831
Excluding capital goods 179,970 2,943 680,084
Type I multiplier30
Including capital goods 1.8 2.0 2.2
Excluding capital goods 1.7 1.9 2.1
Type II multiplier31
Including capital goods 2.8 3.0 3.4
Excluding capital goods 2.7 2.9 3.2
30 The Type I multiplier is calculated as (Direct + Indirect) / Direct. 31 The Type II multiplier is calculated as (Direct + Indirect + Induced) / Direct
The true impact of UK manufacturing
39
APPENDIX C: METHODOLOGY AND
DATA SOURCES
MAIN DATA SOURCES
1. Office for National Statistics, "Annual Business Survey - 2016 Provisional Results,"
Annual Business Survey, 9 November 2017
<https://www.ons.gov.uk/businessindustryandtrade/business/businessservices/dataset
s/uknonfinancialbusinesseconomyannualbusinesssurveysectionsas> [accessed March
2018]. Hereafter referred to as the ‘ABS’.
2. Office of National Statistics, "United Kingdom Input-Output Analytical Tables, 2013,"
UK Input-Output Analytical Tables, 2017
<https://www.ons.gov.uk/file?uri=/economy/nationalaccounts/supplyandusetables/data
sets/ukinputoutputanalyticaltablesdetailed/2013detailed/ukioanalyticaltables2013.xls>
[accessed March 2018]. Hereafter referred to as the ‘Input-Output tables’.
3. Office of National Statistics, "Supply and Use Tables, 1997 - 2015," Input-Output
Supply and Use Tables, 2017
<https://www.ons.gov.uk/file?uri=/economy/nationalaccounts/supplyandusetables/data
sets/inputoutputsupplyandusetables/current/tables14finalcorrection.xls> [accessed
March 2018]. Hereafter referred to as the ‘Supply and Use tables’.
4. Office of National Statistics, "Gross fixed capital formation - industry by asset,"
Business Investment Statistical Release, 2018
<https://www.ons.gov.uk/file?uri=/economy/grossdomesticproductgdp/datasets/grossfi
xedcapitalformationbysectorandasset/current/rftg1tog16from1997forpublication.xls>
[accessed March 2018]. Hereafter referred to as the ‘ONS business investment
release’.
5. Office of National Statistics, "Nominal and real regional gross value added (balanced)
by industry," Regional Accounts, 2017
<https://www.ons.gov.uk/file?uri=/economy/grossvalueaddedgva/datasets/nominaland
realregionalgrossvalueaddedbalancedbyindustry/current/nominalandrealregionalgvabb
yindustry.xlsx> [accessed March 2018]. Hereafter referred to as the ‘balanced regional
GVA dataset’.
6. Oxford Economics, "2 Digit SIC Total Employment forecasts," Regional Model, 2018.
Hereafter referred to as the ‘Oxford Economics’ regional forecasts’.
The true impact of UK manufacturing
40
HOW WE CALCULATED THE DIRECT IMPACT
Sources of demand
• Intermediate consumption includes demand from market organisations, non-market
organisations and non-profit institutions serving households. Market organisations
comprise all private sector activity including demand from retailers and wholesalers.
Non-market organisations refer to publicly funded activities delivered by public
services e.g. the National Health Service. Non-profit institutions serving households
(NPISH) are institutions that provide goods and services, either free or below the
market prices, mainly derive their income from grants and donations, and are not
controlled by government. Examples include charities, trade unions, and the majority
of universities.32
• Government includes demand from central government and local authorities.
• Household consumption includes demand from households.
• Investment includes the following sub-categories: gross fixed capital formation,
acquisitions less disposals of valuables, and changes in inventories.
• Exports includes all goods and services that are exported from the UK.
Gross value added
The gross value added (GVA) estimate for the manufacturing sector was taken from the
balanced regional GVA dataset published by the ONS on 20 December 2017. This provides
GVA estimates at 2-digit SIC level for the UK and its regions, derived by balancing the income
and production approaches to measuring GVA.
“The income approach sums the components of income (compensation of employees, mixed
income, rental income, gross trading profit and surplus, non‐market capital consumption,
holding gains, taxes less subsidies on production) to give a measure of GVA. In the production
approach, GVA is calculated as total output of goods and services less the value of goods and
services used up in the production process (intermediate consumption).”33
“Both income and production approaches seek to measure the same quantity, but using
different conceptual methods and different data sources. The balanced approach seeks to
make use of the relative strengths of the two measures to come up with the best possible
single estimate of GVA.”34
The measure of direct GVA forms the cornerstone of the analysis. All other variables (with the
exception of capital expenditure and employment) have been scaled to it. We chose this
approach because we consider the GVA estimate to be the most robust data point we use in
this analysis.
Employment
Taken from Oxford Economics’ regional forecasts. These are based on detailed UK Business
Register and Employment Survey (BRES) data which have been adjusted to align with the
four-quarter average of UK workforce employee jobs and to incorporate estimates of self-
employment.35
Turnover / total sales
To calculate turnover, we developed a turnover to GVA ratio from the ABS and applied it to our
estimate for GVA.
The true impact of UK manufacturing
41
We used Input-Output tables to estimate the destination of sales of manufacturing products, by
estimating the value of the various components of final demand (i.e. intermediate demand,
household consumption, investment and exports) of each manufacturing product produced in
the UK.
HOW WE CALCULATED THE INDIRECT IMPACT
We define the indirect impact to include the economic activity supported within the UK as a
result of the UK’s manufacturing industry’s purchases of goods and services from UK
suppliers.
To calculate the indirect impact of the manufacturing industry, it is necessary to identify the
value of intermediate consumption and capital expenditure of the companies within the
industry, and determine how these purchases stimulate further economic activity through the
UK supply chain.
Even when UK manufacturers import raw materials, components and equipment from
overseas, they may still support activity within the UK— for example, among UK-based
distributors and logistics companies who facilitate these imports. However, the extent to which
these effects are captured within our results will depend on the structure of contracts. For
example, where a UK manufacturer has a contract with a UK distribution company, the activity
supported in the distribution sector is likely to be captured in our supply chain analysis. If, on
the other hand, the UK manufacturer is purchasing from an overseas supplier and the
overseas supplier commissions the UK leg of distribution activity, the activity with the UK
distributor may not be captured in the supply chain.
A second example concerns the repair and maintenance of imported equipment by a UK-
based company. In this case the associated activity would be expected to fall within the direct
impact of the manufacturing sector, although whether this is the case will depend on the SIC
code assigned to the company undertaking the work.
Intermediate consumption
To calculate total intermediate consumption purchases, we developed an intermediate
consumption to GVA ratio from the ABS and applied to it our estimate for GVA.36 The sectors
where the manufacturing industry made its purchases and the value these purchases created
in the economy were estimated using ONS 2013 domestic Input-Output tables.
32 Source: Office of National Statistics, "Households and non-profit institutions serving households"
<https://www.ons.gov.uk/economy/grossdomesticproductgdp/compendium/unitedkingdomnationalaccountstheblu
ebook/2016edition/householdsandnonprofitinstitutionsservinghouseholds> [accessed March 2018] 33 Office of National Statistics, "Development of a balanced measure of regional gross value added", in
www.ons.gov.uk <https://consultations.ons.gov.uk/national-accounts/consultation-on-balanced-estimates-of-
regional-
gva/supporting_documents/Development%20of%20a%20balanced%20measure%20of%20regional%20gross%2
0value%20added.pdf> [accessed March 2018] 34 Ibid. 35 The use of this dataset is consistent with Oxford Economics’ approach for its Global and Industry models. 36 The metric name for intermediate consumption within the ABS is ‘total purchases of goods, materials and
services’
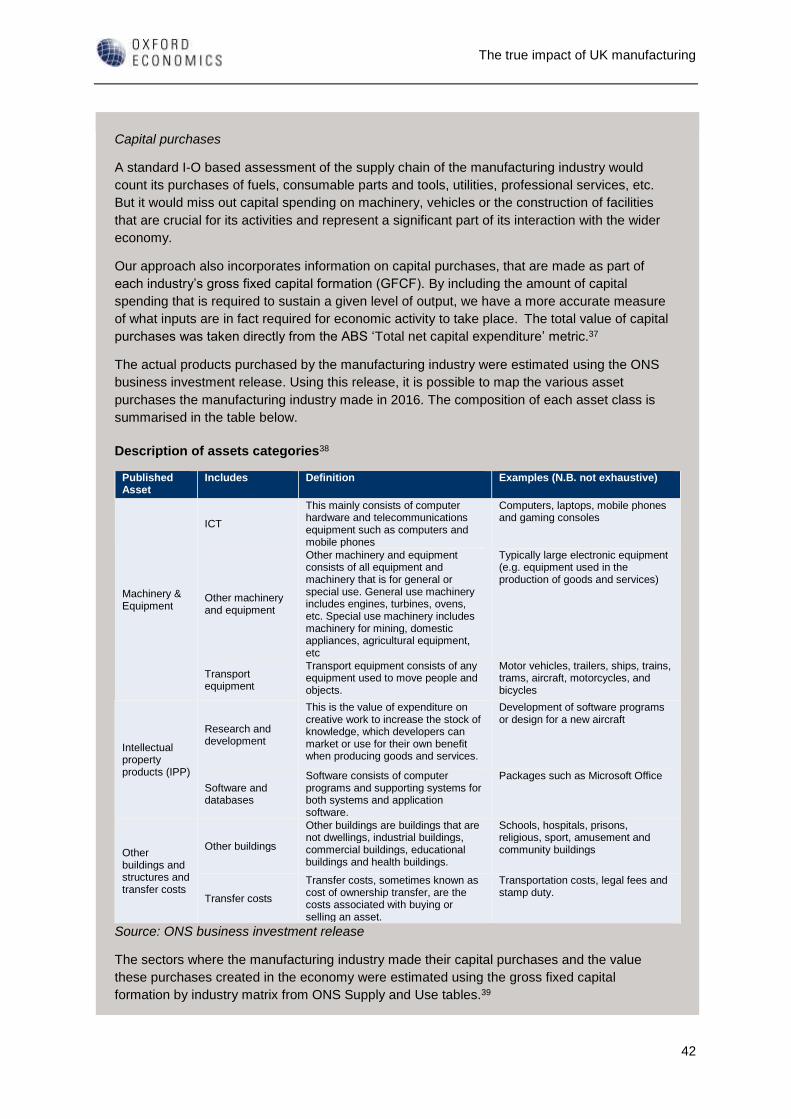
The true impact of UK manufacturing
42
Capital purchases
A standard I-O based assessment of the supply chain of the manufacturing industry would
count its purchases of fuels, consumable parts and tools, utilities, professional services, etc.
But it would miss out capital spending on machinery, vehicles or the construction of facilities
that are crucial for its activities and represent a significant part of its interaction with the wider
economy.
Our approach also incorporates information on capital purchases, that are made as part of
each industry’s gross fixed capital formation (GFCF). By including the amount of capital
spending that is required to sustain a given level of output, we have a more accurate measure
of what inputs are in fact required for economic activity to take place. The total value of capital
purchases was taken directly from the ABS ‘Total net capital expenditure’ metric.37
The actual products purchased by the manufacturing industry were estimated using the ONS
business investment release. Using this release, it is possible to map the various asset
purchases the manufacturing industry made in 2016. The composition of each asset class is
summarised in the table below.
Description of assets categories38
Published Asset
Includes Definition Examples (N.B. not exhaustive)
Machinery & Equipment
ICT
This mainly consists of computer hardware and telecommunications equipment such as computers and mobile phones
Computers, laptops, mobile phones and gaming consoles
Other machinery and equipment
Other machinery and equipment consists of all equipment and machinery that is for general or special use. General use machinery includes engines, turbines, ovens, etc. Special use machinery includes machinery for mining, domestic appliances, agricultural equipment, etc
Typically large electronic equipment (e.g. equipment used in the production of goods and services)
Transport equipment
Transport equipment consists of any equipment used to move people and objects.
Motor vehicles, trailers, ships, trains, trams, aircraft, motorcycles, and bicycles
Intellectual property products (IPP)
Research and development
This is the value of expenditure on creative work to increase the stock of knowledge, which developers can market or use for their own benefit when producing goods and services.
Development of software programs or design for a new aircraft
Software and databases
Software consists of computer programs and supporting systems for both systems and application software.
Packages such as Microsoft Office
Other buildings and structures and transfer costs
Other buildings
Other buildings are buildings that are not dwellings, industrial buildings, commercial buildings, educational buildings and health buildings.
Schools, hospitals, prisons, religious, sport, amusement and community buildings
Transfer costs
Transfer costs, sometimes known as cost of ownership transfer, are the costs associated with buying or selling an asset.
Transportation costs, legal fees and stamp duty.
Source: ONS business investment release
The sectors where the manufacturing industry made their capital purchases and the value
these purchases created in the economy were estimated using the gross fixed capital
formation by industry matrix from ONS Supply and Use tables.39
The true impact of UK manufacturing
43
Having identified the product categories where capital purchases were made, we also used
ONS Supply and Use tables to estimate what proportion of capital goods were imported. To do
this, we used the “supply of products” table to see what proportion of products were imported
within those product categories where capital goods were purchased. We then applied these
ratios to our estimates for capital purchases. Therefore, we have made the assumption that
the proportion of capital goods that were imported within each product category is the same as
all goods within that category.
Input-Output modelling
The modelling for this study was based on UK Input-Output tables published by the ONS (see
above). These set out the goods and services that UK industries purchase from one another in
order to produce their output (as well as their purchases from abroad). These tables also
provide detail on the spending patterns of UK households, and indicate whether this demand is
met by UK production, or imported products. In essence, the tables show who buys what from
whom. Using details of these linkages from the Input-Output tables, Oxford Economics
constructed a bespoke UK impact model, which traces the intermediate consumption and
capital good consumption impacts attributable to the manufacturing industry (this is known as
the Leontief manipulation).
Oxford Economics’ impact model quantifies all rounds of subsequent purchases along the
supply chain. These transactions are translated into GDP contributions, using UK-specific
ratios of GVA to gross output, sourced from the UK input-output table.
Once we have obtained results for output and GVA, we estimate employment using
productivity estimates.
37 Total net capital expenditure by businesses excludes expenditure on dwellings and the costs associated with
the transfer of ownership of non-produced assets, and capital expenditure by local and central government.
38 Office of National Statistics, "A short guide to gross fixed capital formation and business investment", in
www.ons.gov.uk
<https://www.ons.gov.uk/economy/grossdomesticproductgdp/articles/ashortguidetogrossfixedcapitalformationand
businessinvestment/2017-05-25> [accessed March 2018] 39 Both the supply and use tables and the ONS business investment release are consistent with the UK National
Accounts Blue Book 2016 & UK Balance of Payments Pink Book 2016.
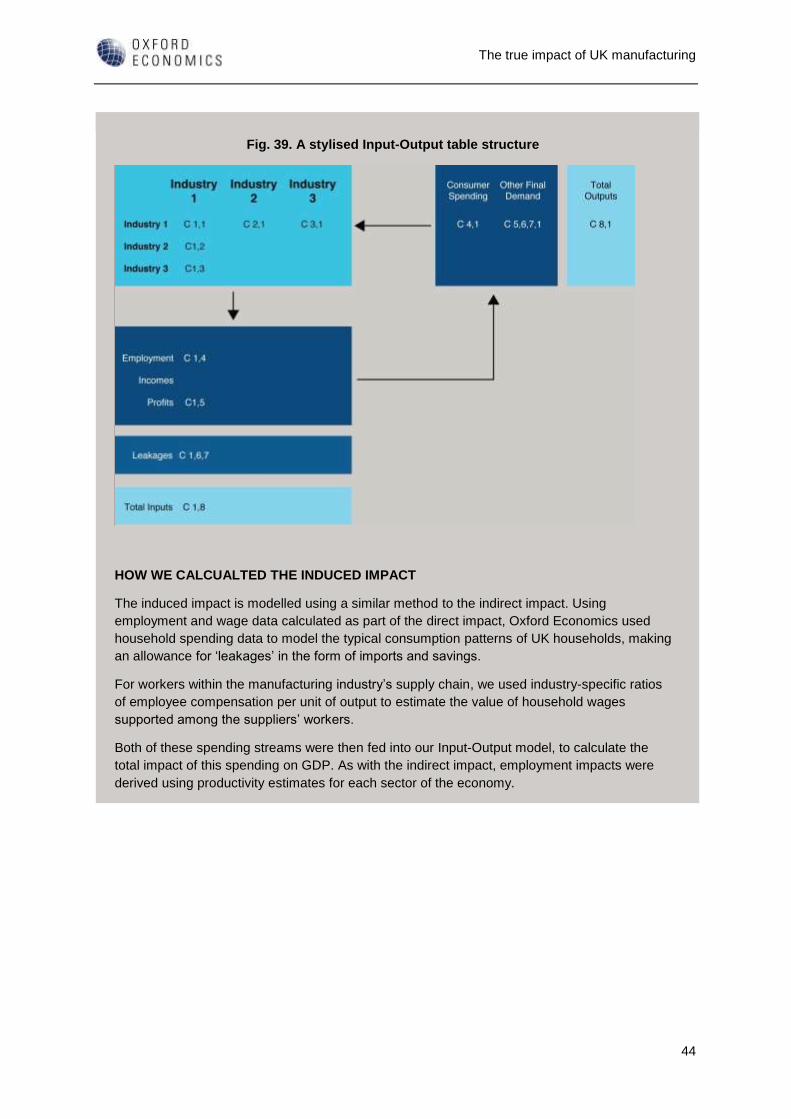
The true impact of UK manufacturing
44
Fig. 39. A stylised Input-Output table structure
HOW WE CALCUALTED THE INDUCED IMPACT
The induced impact is modelled using a similar method to the indirect impact. Using
employment and wage data calculated as part of the direct impact, Oxford Economics used
household spending data to model the typical consumption patterns of UK households, making
an allowance for ‘leakages’ in the form of imports and savings.
For workers within the manufacturing industry’s supply chain, we used industry-specific ratios
of employee compensation per unit of output to estimate the value of household wages
supported among the suppliers’ workers.
Both of these spending streams were then fed into our Input-Output model, to calculate the
total impact of this spending on GDP. As with the indirect impact, employment impacts were
derived using productivity estimates for each sector of the economy.

The true impact of UK manufacturing
45