the uh network - hawaii.edu · there is ipv6 traffic on your network anyway. ... using either ping...
TRANSCRIPT

The UH Network
Alan WhineryUH ITS
ACW 2105

Internet2/TR-CPS/CENIC/PNWGP
Internet2/TR-CPS/CENIC
AARNET
AARNET
AARNET

Connectivity Agreements
● Indefeasible Right of Use (IRU) – AKA “Condo” bandwidth
● Consortia/Parternships with others
● Franchise Agreements with cable providers (Hawaii DCCA)
● Some MRC “last mile” leased connectivity
● Peering agreements from memberships, partnerships, etc.
● Exchange agreements (Pacific Wave, HIX, HIC, WRN, DRF)
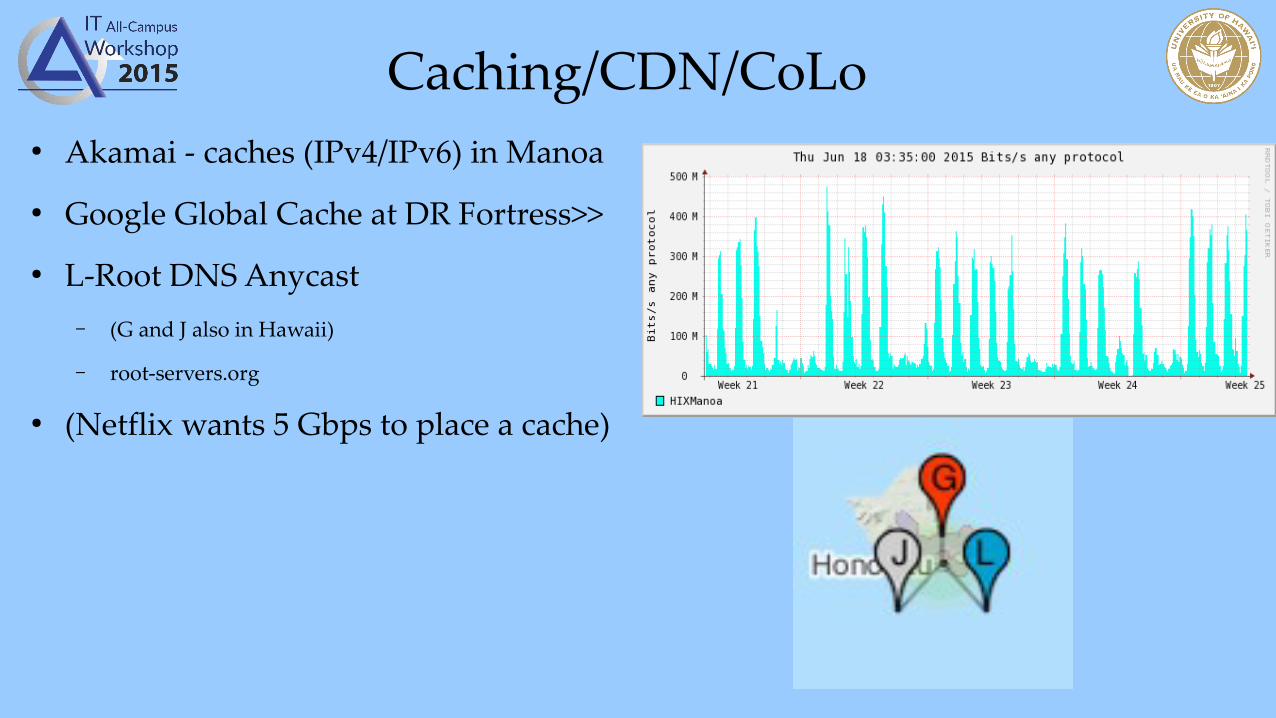
Caching/CDN/CoLo● Akamai - caches (IPv4/IPv6) in Manoa
● Google Global Cache at DR Fortress>>
● L-Root DNS Anycast – (G and J also in Hawaii)
– root-servers.org
● (Netflix wants 5 Gbps to place a cache)

Netflix via Pacific Wave


IPv6
● UH Net has been fully IPv6 capable since 2009
● A day is coming when you will suddenly want to do it.
● Having worked with it prior to that time is invaluable.
● In order for IPv6 to solve address depletion issues, a majority of networks and resources/services must deploy it.
● Notably, The GoogleSphere (including YouTube), Yahoo, Netflix, FaceBook currently provide IPv6 connectivity to content.

There is IPv6 traffic on your network anyway.
Stamping it out is less-well-defined and less desirable than embracing it.

IPv6● Running out of addresses, yada yada yada
– ARIN will reach first “cannot allocate IPv4” event in July 2015● Everyone is waiting until everyone else deploys it.● No one benefits until a majority deploy it● Starts with everybody deploying. ● Also – it's present on your network whether you deploy it or not. ● In 2015, it's pretty hard to find operational eqpt that isn't ready● Deploying and operating it is pretty painless.

Scale Comparison of IPv4 versus IPv6 TrafficUH System-wide (from Netflow)
Currently about 10:1 v4/v6

Allocated IPv6 prefixes – United States

Announced IPv6 prefixes – United States

Active IPv6 prefixes – United States

Eliminating Manoa SinglePoint-Of-Failure
● Up-coming second Commodity Link at DR Fortress
● Up-coming INET Link (which includes the inter-island connectivity) to DR Fortress
● Deploying DNS and NTP services to “anycast” nodes on each island.– Currently at Manoa, Maui, Kauai
– Soon -- UH Hilo

AnyCast
● For many UDP-based services, like DNS or NTP service presence can be duplicated in multiple places across the network
● Clients' requests will tend to reach the nearest instance of the service– Which works, as long as it reaches one
● Service responses route over the network back to the client.
● Since the service instances offer identical (or effectively similar) responses, it doesn't matter which one answers.

Anycast Explained
R = routerC = clientDNS = DNS server


Large Data Set Science
As large data science creates and archives large data sets, more and more research and instructional focus will shift to analyzing, mining, correlating, interpreting those data sets. Enabling future science is about enabling instant access to users world-wide.
This will directly impact the design of future networks.

Large Data Set Science
A “liquefaction” event is coming.
Being able to provide full-time access to the new world of detailed data sets for researchers, educators, and students (not to mention the public) will make or break an institution's reputation in the coming decade.

perfSONAR● Driven by Internet2 and the US Department of Energy's ESNet
● Provides distributed test infrastructure, data collection, and presentation
● Tools– Lookup service – locate test nodes around the world
– bwctl
● throughput testers – iperf/nuttcp● Ping – using either ping or owping● Traceroute – using either traceroute or tracepath ● Allows running tests to other organizations' nodes, or even between two nodes at two other
orgs. – owampd/powstream
● Allows full time 10 pps evaluation of latency, loss, reordering

Http://perfsonar.netHttp://software.internet2.eduHttp://fasterdata.es.net


NDT Graphical In-Browser Test

NDT Graphical In-Browser Test

NDT Graphical In-Browser Test

NDT Graphical In-Browser Test

UH perfSONAR fleet● UH Manoa – uhmanoa-tp.ps.uhnet.net, uhmanoa-dl.ps.uhnet.net
● CFHT Kamuela – cfhtwaimea.measurement.uhnet.net
● Mauna Lani – maunalani-tp.ps.uhnet.net, ifahilo-dl.ps.uhnet.net
● Hilo IfA - ifahilo-tp.ps.uhnet.net
● UH Hilo - uhhilo-tp.ps.uhnet.net
● MRTC – mrtckihei.measurement.uhnet.net, mrtckihei-ps.uhnet.net
● Kauai CC – 2 nodes (currently off-line)
● Also others.

perfSONAR● pS exposes one's unmentionables.
● Just because you identify symptoms, doesn't mean that you identify causes.
● New pS visualization needs to be explored.
● Although there are thousands of nodes world-wide, they are deployed relatively sparsely.
● PerfClub – con-call 3rd Monday, 2200 GMT (Noon HST).
The Swarm
● Wrote paragraph into our CC-NIE campus networking proposal about making use of the recent availability of ~$50 computers to “sense” the network, using elements of perfSONAR.
● Funded a project to deploy 100 nodes on one campus over 2 years, exploiting a ~$50 price point to deploy many nodes on campus as a dense mesh.

Goals/Challenges● Finding nodes to buy in the face of market exhaustion
● Getting node deployment work-flow down to nil
● Getting recoveries of off-line nodes to a minimum
● Tracking assets and reliability, generating metrics
● Evaluating capabilities of the whole set-up
● Developing a test program for many nodes
● Slicing/Dicing data to see what it has to tell us
● Developing visualizations and distillations to put tools in hands of network maintainers, merging into pS Toolkit

Devices We Have/Are Getting
● Raspberry Pi – famous, $50, med-perf, file system on SD card, 100 Mb Ethernet, USB 2.0
● BeagleBone Black – $50, more perf, FS on internal flash, and/or SD card, 100 Mb, USB 2.0
● Honorable mention:
● CuBox i4 – $147, more perf, FS on SD, GigE, WiFi, USB 2.0
● MiraBox $149 – most perf, FS on SD, dual GigE, WiFi, USB 3.0

Reliability● Raspberry Pi (July 2014)
● UH ITS owns 47 – 1 has failed
● 22 SD card hard failures
● 10 file-system failures
● BeagleBone Black Rev A. (December 2013)
● UH ITS owns 10 (+50 NIB), 1 has corrupted firmware
● 9 in production, one had to be power-cycled, once
● CuBox – one deployed 6 months of service zero problems. (using SD from OEM).

SD Cards● DANE ELEC 8 GB Class 4
● 10 cards, 2 failures in light duty
● SanDisk Ultra 8 GB Class 10
● 10 cards, 0 failures, 3 FS corrupted in 42k hours
● Kingston 8 GB Class 10
● 10 cards, 0 failures, 7 FS corrupted, in 42k hours
● Kingston 4 GB Class 4
● 20 hard failures in less than 20k hours
● (100% across 6 weeks, < 1000 Hr MTBF)
● SanDisk Ultra – 8GB Class 10 - Most recent batch of replacements

Year 1● Tried 10 BeagleBones, liked them - and a few Raspberries Pi● The market vacuum around the release of BBB Rev. C made BBB
impossible to obtain● Bought 43 Raspberries ● Although we are going with BeagleBone Black for the
completion, we could make Raspberries work if necessary.● Bought 2 Dell rack servers as test facilitators, data archives.

2nd Year Completion● 50 BeagleBone Black Rev. C
● (4 GB internal flash)
● BBB Internal flash is more reliable than SD
● Internal + SD card enables separating system/data partitions
● Better 100 Mb Ethernet performance
● 5 Raspberry Pi 2 Model B
● As number deployed approaches 100, we will be placing nodes in new/special roles.

Management● Puppet/The Foreman
– https://puppetlabs.com/
– http://theforeman.org/
● Easy to push changes, updates out to the swarm.
● Easy to push errors out to the swarm and require 50 SSH sessions.
● Work-flow
● Try to minimize per node actions and attended setup
● RPi – ua-netinstall with tweaks for Puppetization
● BBB – custom SD that auto-images the internal flash


Characteristics Of DenseSensor Deployment
● Typically, perfSONAR devices are placed 1 or 2 per site
● This project places 100 at a site
● Having many observations makes the loss of a single one less important.
● You can correlate topology and test results to “triangulate” on the source of a problem.
● You need to re-think visualization– In order to conceptualize effective visualization, you need to visualize.
– (Having a line-graph of each of 2450 connections is overwhelming, in a kind of can't-see-forest-for-trees kind of way)

Test Programs: powstream (owamp)
● powstream from pS Toolkit node to/from each sensor node– (10 packets-per-second UDP, reporting 1 minute samples for latency, loss, reordering, duplication)
● Really, really, really boring at first glance. All loss appears to be about zero. Always one or two losing a packet per day (1 in 864000)
● Standard deviation in latency groups somewhat interesting, may reflect queuing, flares in latency std dev may precede loss events
● Longitudinal analysis reveals damaging loss rates that would otherwise be invisible
● Higher packet rates might expose low loss probabilities in shorter time


Mathis, Semke, Mahdavi, "The Macroscopic Behavior of the TCP Congestion Avoidance Algorithm”,ACM SIGCOMM, Vol 27, Number 3, July 1997


Speed Limits You Can't See
Loss Rate 10 pps PowstreamPacketsLostPer day
TCP AIMD Coastal Limit@1460 MSS(Mbits/sec)
45 mS RTT
TCP AIMD Coastal Limit@8960 MSS(Mbits/sec)
45 mS RTT
1.82E-005 15.75 42.56 261.18
2.25E-006 1.94 121.11 743.23
1.87E-006 1.62 132.76 814.72
9.38E-007 0.81 187.58 1151.16
6.05E-007 0.52 233.55 1433.28
5.93E-007 0.51 236.03 1448.52
3.35E-007 0.29 314.03 1927.21
2.51E-007 0.22 362.49 2224.57
1.74E-007 0.15 435.64 2673.49
For 45 milliseconds RTT, typical minimum to get onto continental US from Hawaii

So, Forget ping● From “the old days” there's a persistent notion that packet loss is a
quantity that you can detect with a packet-per-second ping test. – To resolve a loss probability of 18 packets per million, ping would need to run for 11.57
days.
– This hard-to-see probability is crippling over longer paths.
● ping still has its uses, of course. ● One encounters loss-probabilities sooner with more packets
– And more packets have have more effect on user experience
● So how does one find dirty paths, if the loss numbers are so elusive?

Test Progams:50 Node Full Mesh TCP Throughput
● <= 100 Mbps RPi, BBB throughput tests resemble real-life user flows
● Unlike a high performance iperf tester which “punches the network in the face”
● I run a 50x50 full mesh iperf matrix (2450 tests) in about 7 hours, (5 second tests).
● Full-mesh traceroute is collected concurrently
● By scoring every hop encountered on the average peformance for paths it appears in, “per-hop confidence” can be derived.
● Using multi-rate UDP vs. TCP is worth investigating.

The Matrix

The Matrix
● Cut-out view of iperf3 tests to/from a chosen node...
● This row/column represents all tests to/from that chosen node.
● Leaves one wondering what the correlation is between the pink squares showing retransmissions

Correlating Full Mesh Throughput And Traceroute Results For
Fault Isolation ● First

● First Graph of per-hop “confidence” with colored links where retransmissions were observed(names/addresses obfuscated)
This graph shows hops involved in in-bound Throughput testing between a chosennode and all partners.
Each oval represents anIP interface as reported in Traceroute output.
Graph rendered fromtest data with GraphViz.(GraphViz.org)

Ongoing Swarm● perfSONAR toolkit integration
● Not so much new development as making some pieces fit together
● Correlation of other sources to zero in on a fault
● NetDot
● Flows/MRTG
● Ancillary programs
● Log collection (honeypot-ish info)
● Name resolution tests
● v6/v4 precedence

Other Projects
● Software defined networking– Router/switch virtualization– Packet handling in with programmatic control
● DDoS mitigation– Black hole routing– Dynamic ACL Mgmt– NIDS alerting

6/19/15
PerfClub
● http://perfclub.org– Come, blog.
– Anyone who wants to publish from blurb to novel on perf-stuff can put it here.
– If you contribute to our discussion today consider writing a summary to post.
● Monthly call 3rd Monday, 22:00 GMT


FIN

● First

● First

● First

● First

● First

● First