the uk balance of payments rgs newcastle economics department
TRANSCRIPT

The UK Balance of Payments
RGS Newcastle Economics Department
The Balance of Payments
• BOP records all financial transactions between the UK & the Rest of the World
• The UK is an open economy which – trades both goods and services – is open to inflows and outflows of financial
capital and fixed capital investment
• BOP measures the extent to which the UK is “paying its way” with other countries
Trade in goods (visible trade)
• Consumer durables
• Capital goods / techology /software
• Commodities (including mineral fuels)
• Components & basic raw materials
• Foodstuffs and Beverages
• Semi-finished manufactured products

International Trade in Services
• Tourism• Travel / Civil Aviation• Insurance• Consultancy• Banking services• Accountancy services
• Data processing• Information services• Music &
Entertainment• Shipping• Educational services
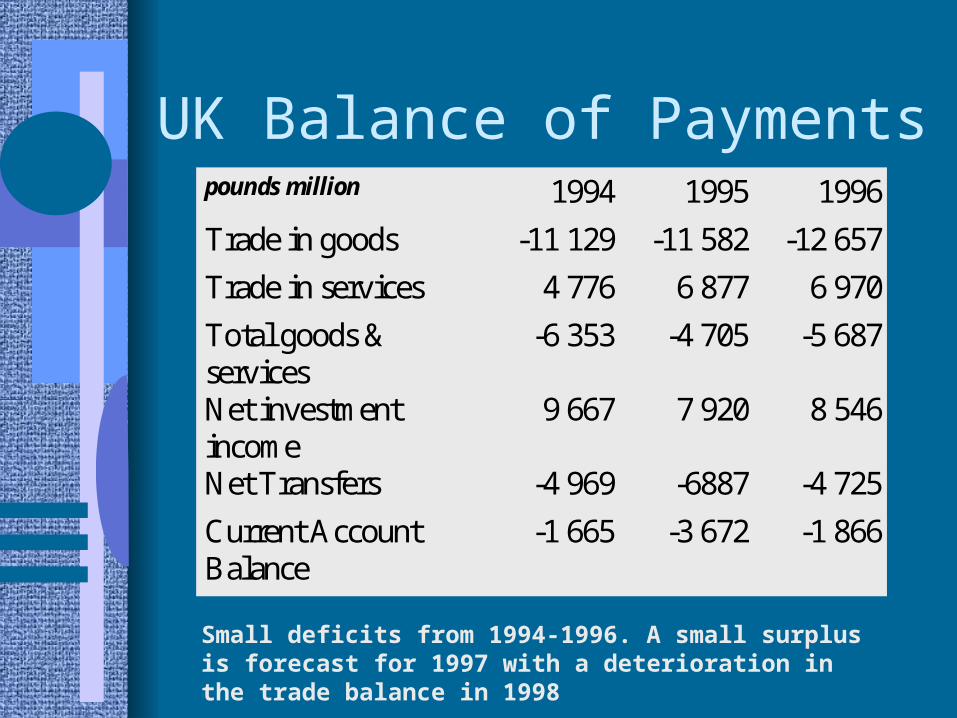
UK Balance of Paymentspounds million 1994 1995 1996
Trade in goods -11 129 -11 582 -12 657
Trade in services 4 776 6 877 6 970
Total goods &services
-6 353 -4 705 -5 687
Net investmentincome
9 667 7 920 8 546
Net Transfers -4 969 -6887 -4 725
Current AccountBalance
-1 665 -3 672 -1 866
Small deficits from 1994-1996. A small surplus is forecast for 1997 with a deterioration in the trade balance in 1998
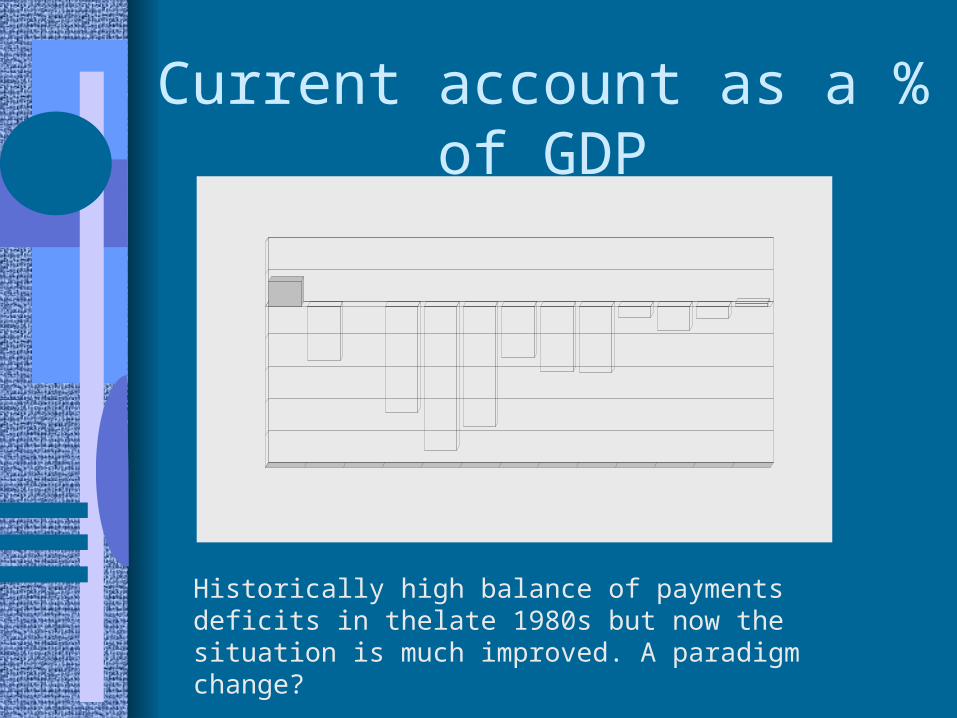
Current account as a % of GDP
80-84 av85-89 av 88
8990
9192
9394
9596
97
1997 figure is a third quarter forecast
-25
-20
-15
-10
-5
0
5
10
billi
on p
ound
sUK CURRENT ACCOUNT BALANCE
Historically high balance of payments deficits in thelate 1980s but now the situation is much improved. A paradigm change?
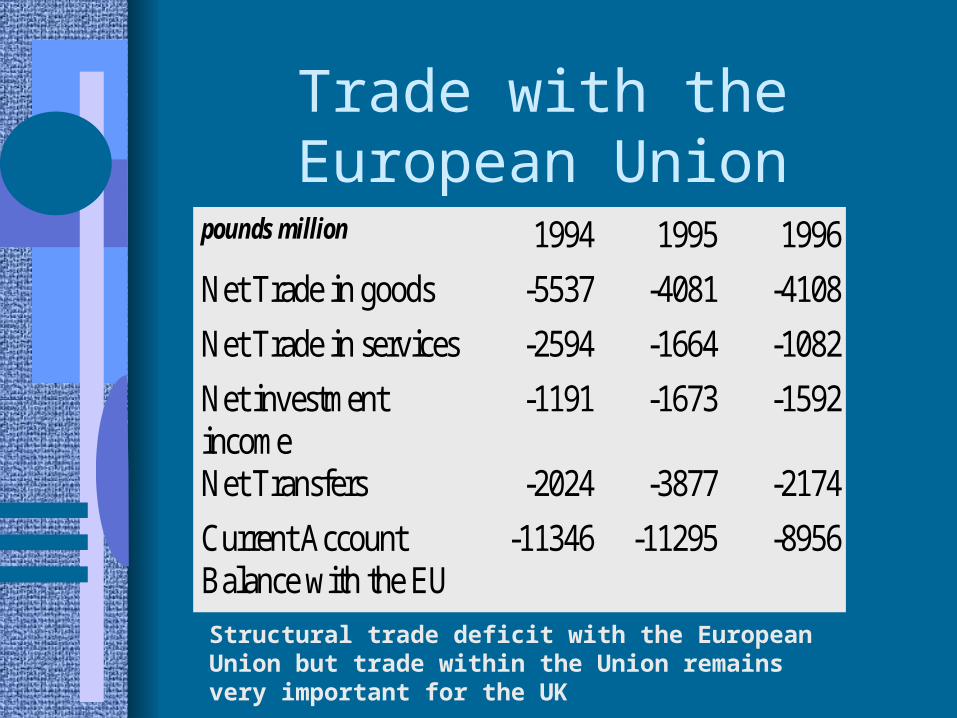
Trade with the European Union
pounds million 1994 1995 1996
Net Trade in goods -5537 -4081 -4108
Net Trade in services -2594 -1664 -1082
Net investmentincome
-1191 -1673 -1592
Net Transfers -2024 -3877 -2174
Current AccountBalance with the EU
-11346 -11295 -8956
Structural trade deficit with the European Union but trade within the Union remains very important for the UK
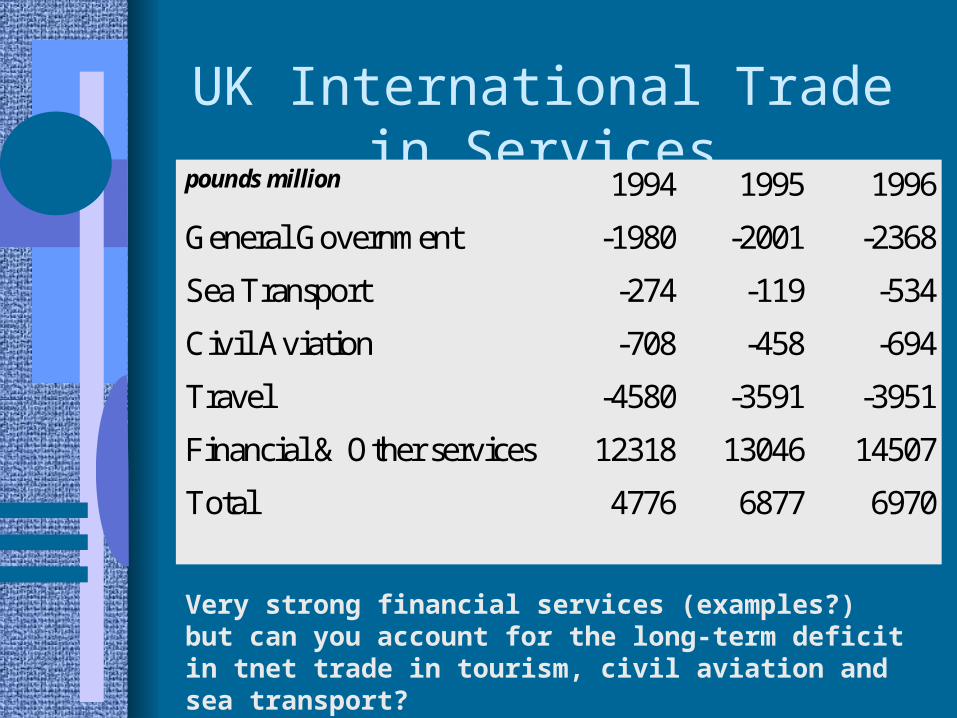
UK International Trade in Servicespounds million 1994 1995 1996
General Government -1980 -2001 -2368
Sea Transport -274 -119 -534
Civil Aviation -708 -458 -694
Travel -4580 -3591 -3951
Financial & Other services 12318 13046 14507
Total 4776 6877 6970
Very strong financial services (examples?) but can you account for the long-term deficit in tnet trade in tourism, civil aviation and sea transport?
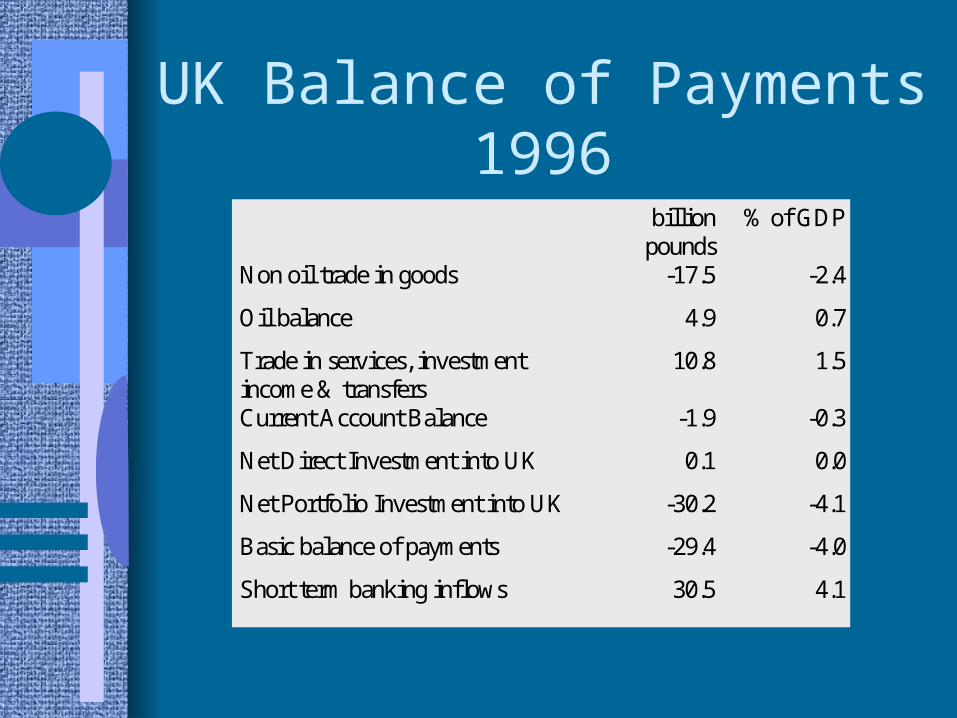
UK Balance of Payments 1996
billionpounds
% of GDP
Non oil trade in goods -17.5 -2.4
Oil balance 4.9 0.7
Trade in services, investmentincome & transfers
10.8 1.5
Current Account Balance -1.9 -0.3
Net Direct Investment into UK 0.1 0.0
Net Portfolio Investment into UK -30.2 -4.1
Basic balance of payments -29.4 -4.0
Short term banking inflows 30.5 4.1
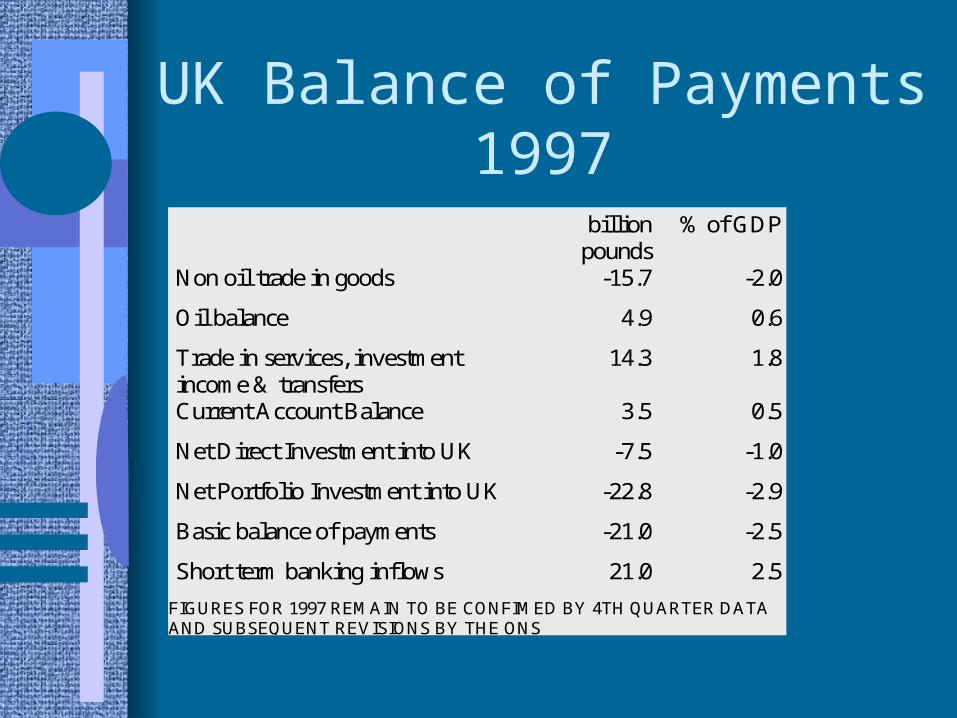
UK Balance of Payments 1997
billionpounds
% of GDP
Non oil trade in goods -15.7 -2.0
Oil balance 4.9 0.6
Trade in services, investmentincome & transfers
14.3 1.8
Current Account Balance 3.5 0.5
Net Direct Investment into UK -7.5 -1.0
Net Portfolio Investment into UK -22.8 -2.9
Basic balance of payments -21.0 -2.5
Short term banking inflows 21.0 2.5
FIGURES FOR 1997 REMAIN TO BE CONFIMED BY 4TH QUARTER DATAAND SUBSEQUENT REVISIONS BY THE ONS

Composition of UK exports of goods% of total exports 1960 1969 1979 1995
Food, beverages &tobacco
5 6 7 7
Basic materials 4 4 3 2
Mineral fuels 4 2 11 6
Manufactured goods 84 85 76 84
(Semi manufacturedgoods)
(36) (35) (31) (28)
(Finishedmanufactured goods)
(48) (50) (45) (55)
Note the importance of exporting finished manufacturing goods and the impact of north sea oil from the mid 1970s
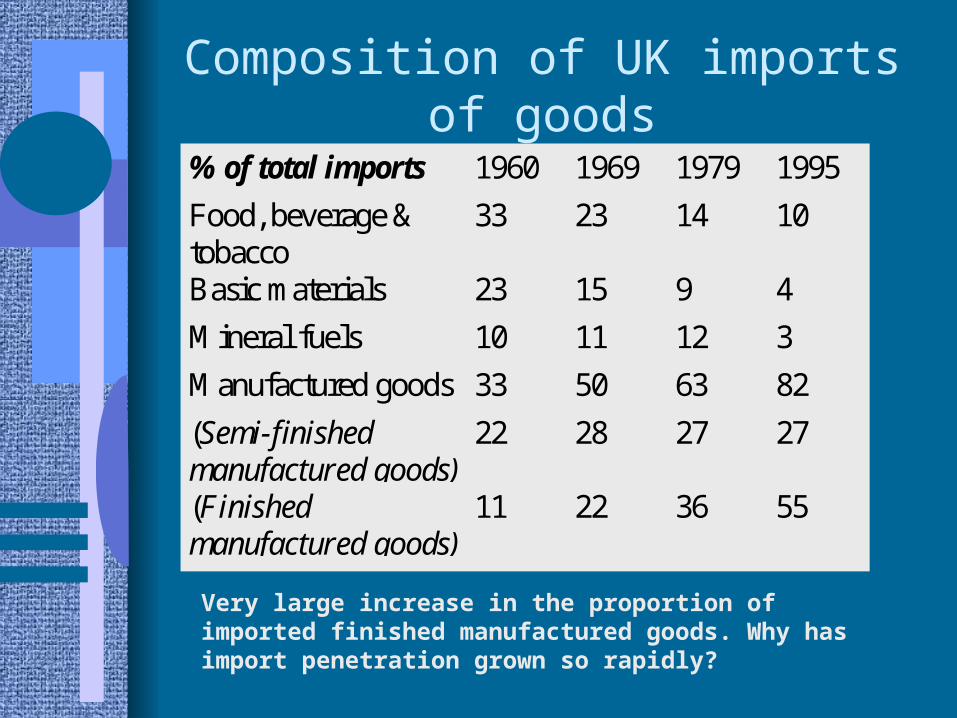
Composition of UK imports of goods
% of total imports 1960 1969 1979 1995
Food, beverage &tobacco
33 23 14 10
Basic materials 23 15 9 4
Mineral fuels 10 11 12 3
Manufactured goods 33 50 63 82
(Semi-finishedmanufactured goods)
22 28 27 27
(Finishedmanufactured goods)
11 22 36 55
Very large increase in the proportion of imported finished manufactured goods. Why has import penetration grown so rapidly?
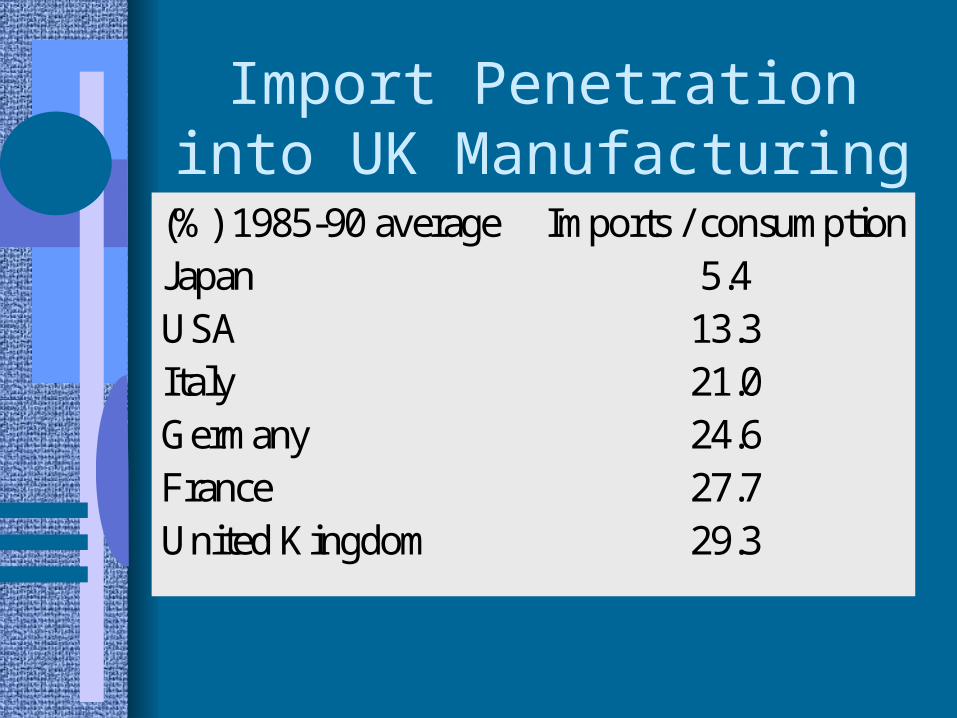
Import Penetration into UK Manufacturing
(%) 1985-90 average Imports / consumptionJapan 5.4USA 13.3Italy 21.0Germany 24.6France 27.7United Kingdom 29.3
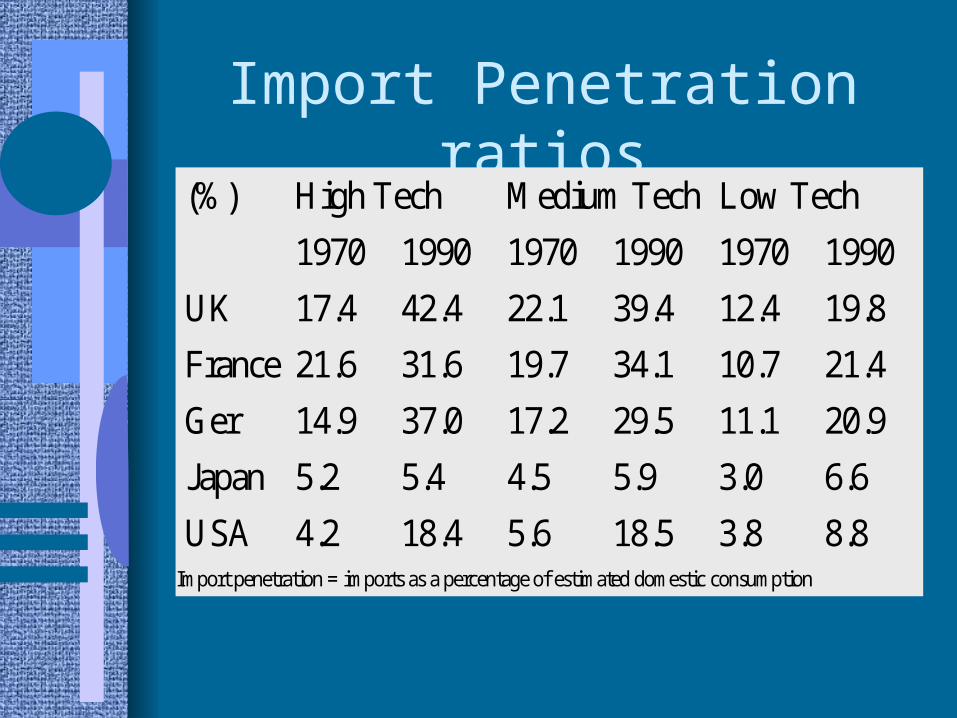
Import Penetration ratios(%) High Tech Medium Tech Low Tech
1970 1990 1970 1990 1970 1990
UK 17.4 42.4 22.1 39.4 12.4 19.8
France 21.6 31.6 19.7 34.1 10.7 21.4
Ger 14.9 37.0 17.2 29.5 11.1 20.9
Japan 5.2 5.4 4.5 5.9 3.0 6.6
USA 4.2 18.4 5.6 18.5 3.8 8.8Import penetration = imports as a percentage of estimated domestic consumption
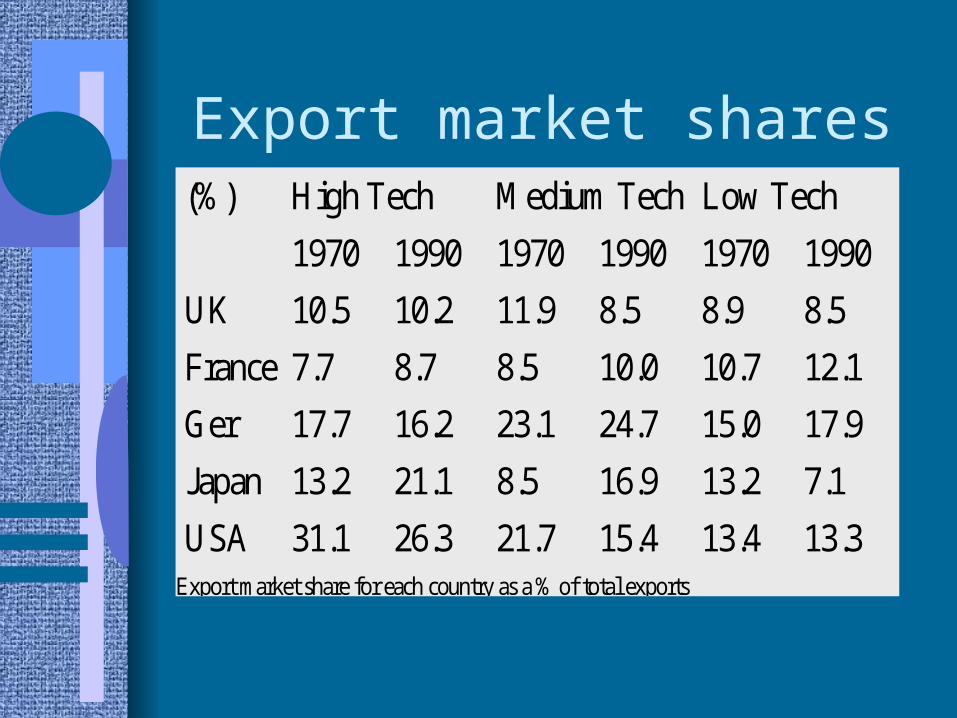
Export market shares(%) High Tech Medium Tech Low Tech
1970 1990 1970 1990 1970 1990
UK 10.5 10.2 11.9 8.5 8.9 8.5
France 7.7 8.7 8.5 10.0 10.7 12.1
Ger 17.7 16.2 23.1 24.7 15.0 17.9
Japan 13.2 21.1 8.5 16.9 13.2 7.1
USA 31.1 26.3 21.7 15.4 13.4 13.3Export market share for each country as a % of total exports
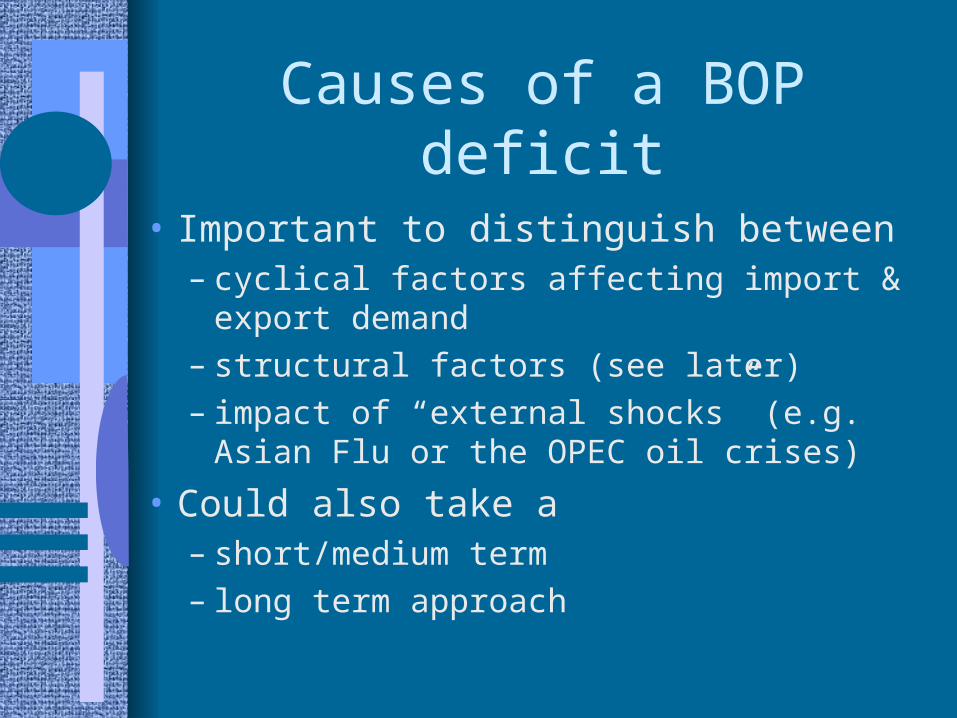
Causes of a BOP deficit
• Important to distinguish between – cyclical factors affecting import & export demand– structural factors (see later)– impact of “external shocks” (e.g. Asian Flu or the
OPEC oil crises)
• Could also take a– short/medium term– long term approach
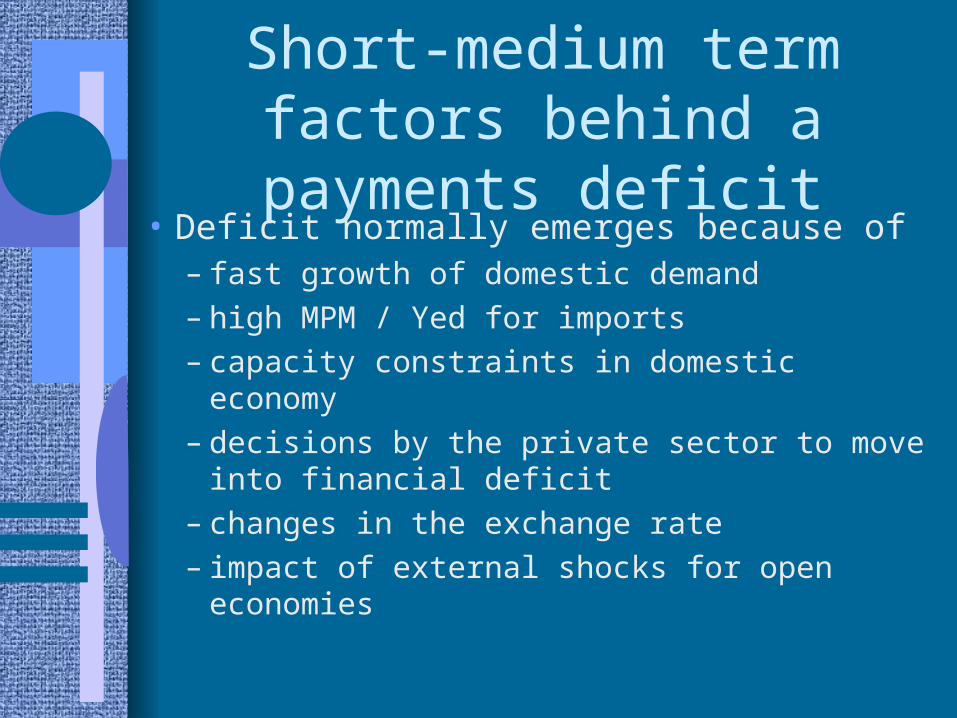
Short-medium term factors behind a payments deficit
• Deficit normally emerges because of– fast growth of domestic demand– high MPM / Yed for imports– capacity constraints in domestic economy– decisions by the private sector to move into
financial deficit– changes in the exchange rate– impact of external shocks for open economies
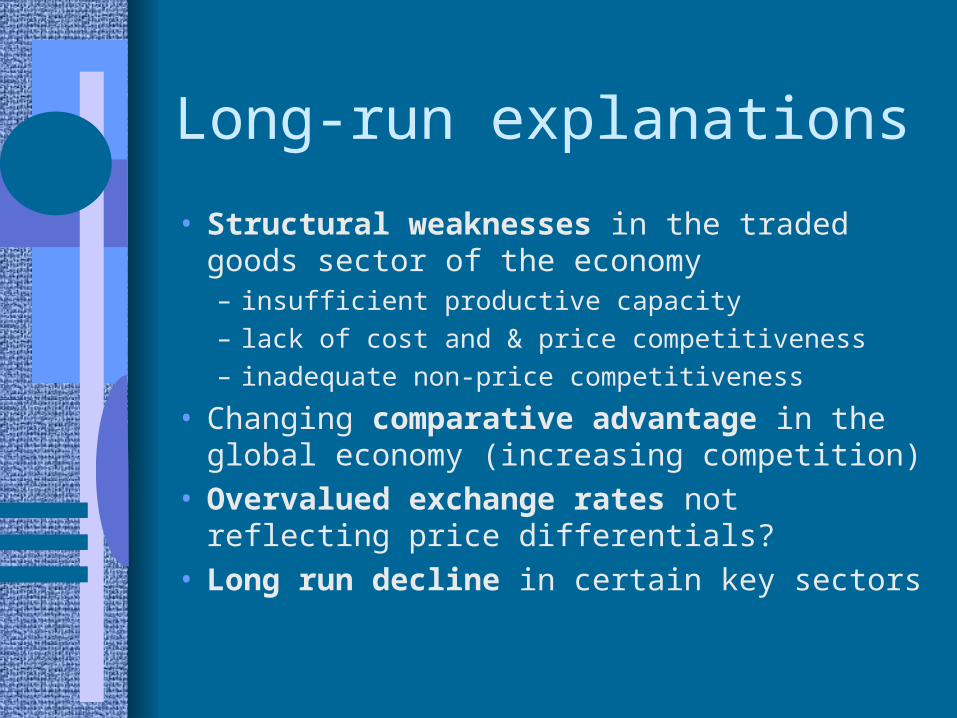
Long-run explanations
• Structural weaknesses in the traded goods sector of the economy– insufficient productive capacity– lack of cost and & price competitiveness– inadequate non-price competitiveness
• Changing comparative advantage in the global economy (increasing competition)
• Overvalued exchange rates not reflecting price differentials?
• Long run decline in certain key sectors

Policies to correct a BOP deficit
• Cyclical deficit tends to be self-correcting
• Lower exchange rate will also help to improve the trade balance
• Policies focus either on– expenditure-reduction
– expenditure-switching
• Structural trade deficits may take many years to eliminate
• Focus in long run needed on improving the supply-side performance of the economy
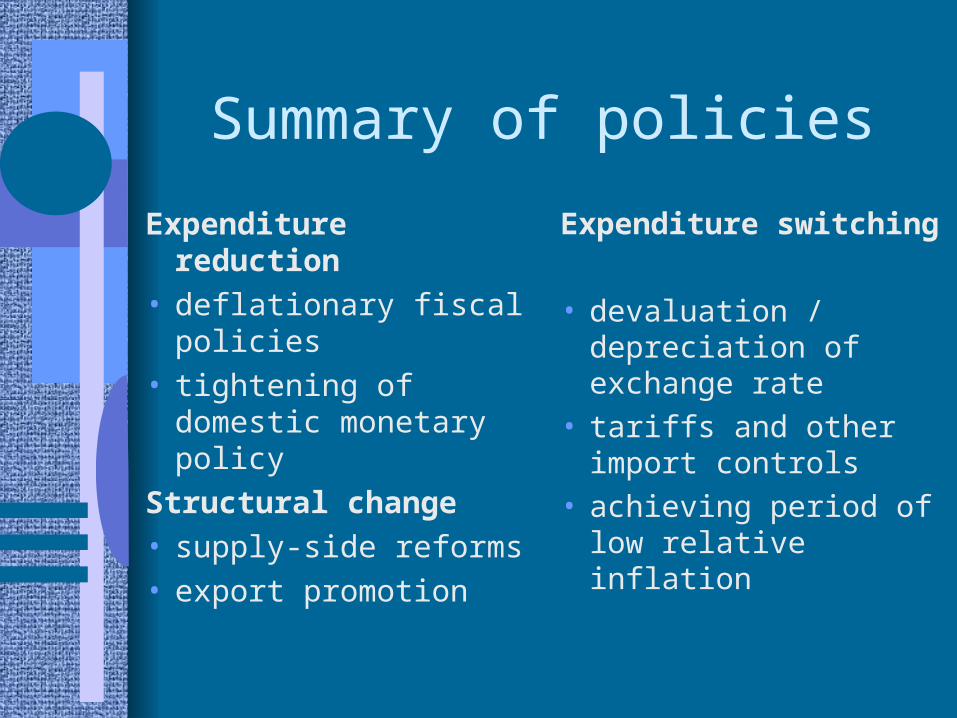
Summary of policies
Expenditure reduction
• deflationary fiscal policies
• tightening of domestic monetary policy
Structural change• supply-side reforms• export promotion
Expenditure switching
• devaluation / depreciation of exchange rate
• tariffs and other import controls
• achieving period of low relative inflation
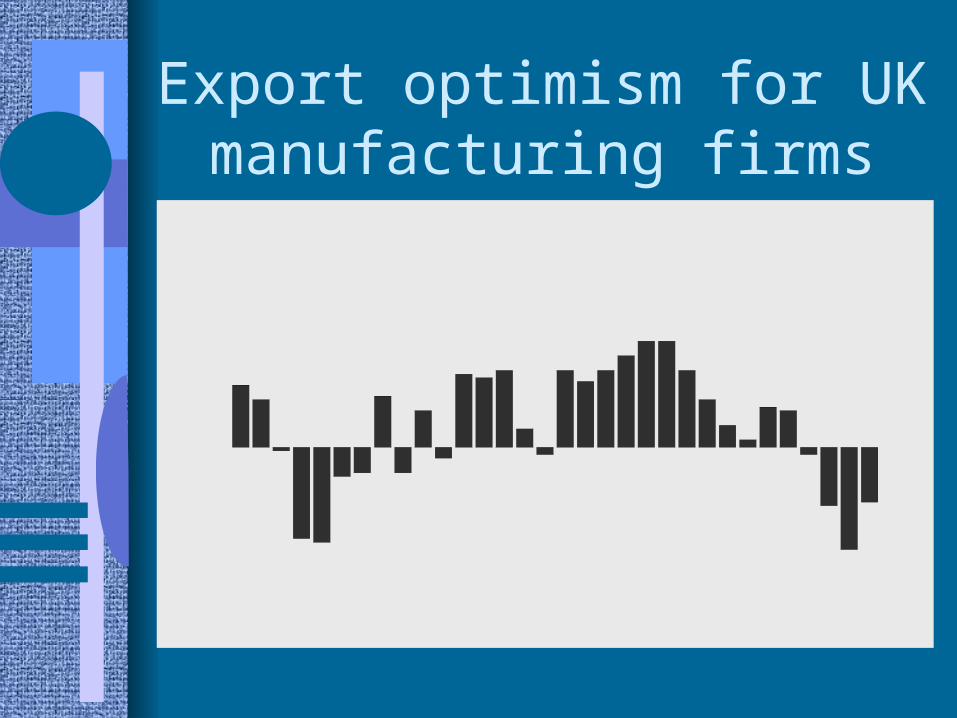
Export optimism for UK manufacturing firms
90Q13
91Q13
92Q13
93Q13
94Q13
95Q13
96Q13
97Q13
-40
-30
-20
-10
0
10
20
30
40
Net
Bal
ance
of
resp
on
den
ts
MANUFACTURING EXPORT OPTIMISMAre you more or less optimistic about export order books in the next six
months?

94Q
1 2 3 495
Q1 2 3 4
96Q
1 2 3 497
Q1 2 3 4
-4
-3
-2
-1
0
1T
hous
ands
TR
AD
E B
ALA
NC
E (
mill
ion
poun
ds)
80
85
90
95
100
105
EX
CH
AN
GE
RA
TE
IND
EX
(19
90=
100)
Trade Balance (LHS)
Sterling Index (RHS)
UK TRADE & THE STERLING EXCHANGE RATE
Exchange rate and trade balances