the uk m tgage m the uk mortgage market: taking a...
TRANSCRIPT
The U
K M
ortgage Market: T
aking a Longer-Term V
iewFinal R
eport & R
ecomm
endationsM
arch 2
004
David M
iles
Final Report and Recommendations
The UK Mortgage Market:
Taking a Longer-Term View
David Miles
March 2004


Final Report and Recommendations
The UK Mortgage Market:
Taking a Longer-Term View
David Miles
March 2004
For enquiries about obtaining this publication, contact:
Correspondence and Enquiry UnitHM Treasury 1 Horse Guards RoadLondonSW1A 2HQ
Tel: 020 7270 4558
Fax: 020 7270 4574
Email: [email protected]
ISBN: 1-84532-004-2
Printed by The Stationery Office 03/04 932563
© Crown copyright 2004
Published with the permission of HM Treasury on behalf of theController of Her Majesty’s Stationery Office.
The text in this document may be reproduced free of charge inany format or medium providing that it is reproduced accuratelyand not used in a misleading context. The material must beacknowledged as Crown copyright and the title of the documentspecified.
Any enquiries relating to the copyright in this document shouldbe sent to:
HMSOLicensing DivisionSt Clements House2-16 ColegateNorwichNR3 1BQ
Fax: 01603 723000
E-mail: [email protected]

Page
Foreword Letter to the Chancellor of the Exchequer 1
Section 1. Aim and scope of the Review 5
Section 2. Optimal mortgage choice 11
The model of optimal mortgage choice 12
Why is the take-up of longer-term fixed-rate mortgages so low? 17
Conclusions 21
Section 3. Macroeconomic implications of fixed and variable-rate mortgages 23
Section 4. Improving borrowers’ understanding 27
Evidence of misunderstanding 27
Improving the standard of advice 30
Improving pre-sale disclosure 38
Improving financial capability 41
Section 5. Fairer pricing in the UK 45
The current structure of pricing in the UK 45
Sustainability of the current pattern of mortgage pricing 48
Competition in markets with switching costs and imperfect information 52
Possible recommendations to promote fair pricing 57
Reducing switching costs 58
Comparative tables 62
Compliance costs and benefits 65
Section 6. Alternative protection from nominal payment uncertainty 67
Stand-alone protection against interest rate movements 70
Fixed-rate mortgages with stepped-up repayment schedules 73
Part-variable/Part-fixed mortgages 74
Conclusions 74
Contents

Contents
Page
Section 7. Enabling cost-effective long-term lending 75
Introduction 75
Dealing with obstacles to funding 76
Dealing with obstacles to managing pre-payment risk 79
Regulatory issues 90
Section 8. Recommendations and conclusions 97
Summary 97
Recommendations 98
Conclusions 102
Annex A Guide to giving advice 103
Analysis of base rates since 1950 109
Analysis of base rates since 1992 112
Annex B Statistical analysis of base rate changes 109
Annex C Consultation list 117
References 121
2 The Miles Review: Final Report
The Miles Review: Final Report 1
LETTER TO THE CHANCELLOR OF THE EXCHEQUER
The Rt Hon Gordon Brown MP
Chancellor of the Exchequer
A year ago you asked me to:
• undertake analysis of supply and demand side factors limiting the development of thefixed-rate mortgage market in the UK to establish why the share of fixed-rate mortgagesis so low compared to the United States and many other EU countries;
• consult with key stakeholders to establish views and inform analysis;
• examine whether there has been any market failure that has held back the market forlonger-term fixed-rate mortgages and consider associated opportunities, risks andpotential costs; and
• deliver an interim report by autumn and a comprehensive report and recommendationsby Budget 2004.
You received my Interim Report at the time of the Pre Budget Report in December of last year.I now attach my Final Report. In this Report I make recommendations that I believe will helpmake the UK mortgage market work better. There are good reasons to think that if the UKmarket did work better many more mortgages would be at rates that were fixed for periodslonger than is currently common, and those reasons are spelled out early in this Report. Moreborrowers would then be insulated from the impact of unexpected changes in interest rates attimes when the stock of their debt was large relative to their incomes and when the impact ofchanges in interest rates on the affordability of their mortgages is great. I believe that this wouldbe a consequence of the market working better – a consequence of people better understandingthe risk and cost characteristics of mortgages, of those mortgages being priced in a sustainable,transparent and fair way and of obstacles that might exist to the most efficient means of fundingsuch mortgages being removed. Making the market work better is the goal; more longer-termfixed-rate lending would be, I believe, a likely consequence of that.
None of this should be taken to imply that the way the UK mortgage market operates is deeplyflawed. I do not believe that this is so and in my Interim Report I described the strengths of theUK mortgage market. But I also outlined problems. I presented evidence in the Interim Reportthat:
• When choosing between mortgages a great many households attach enormous weightto the level of initial monthly repayments. Consideration of where short-term interestrates might move in the future, and of what this implies for affordability, seems to playa far smaller role than it would if households considered the likely overall costs ofborrowing over the life of a loan. Average loan to income ratios on new borrowing haverisen greatly in recent years; the dangers of more and more borrowers taking on debtthat may be manageable at current interest rates, but where affordability could becomea real problem should interest rates move up by even relatively modest amounts,are real.

LETTER TO THE CHANCELLOR OF THE EXCHEQUER
2 The Miles Review: Final Report
• The risk characteristics of mortgages are subtle and complex. Many households find itdifficult to assess these risks and may not be much helped by the kind of informationand advice they receive.
• The structure of mortgage pricing generates cross-subsidisation from many existingborrowers, a significant proportion of whom are paying standard variable rates (SVR),to new borrowers taking out discounted variable and short-term fixed-rate mortgages.This creates unfairness and makes the market less transparent than it could be. It playsto a tendency of many borrowers to focus on the initial monthly payments on amortgage and it makes medium–term and longer-term fixed-rates appear expensive.
• Many lenders feel that they are severely constrained in the type of charges they canmake for early repayment of fixed-rate mortgages; understanding of the nature of sometypes of charge amongst borrowers, and of the rationale for any charges, has not beenhigh and as a result types of mortgage that might be suitable for many households arenot offered.
There are also supply-side issues that could affect the ease with which some lenders are able touse certain types of funding. Some of the issues are particularly relevant for building societies(the so-called nature limits which place a ceiling on the use of wholesale funding) while others(for example uncertainty about the regulatory regime for covered bonds) will affect lenders ingeneral. The capital treatment of different sorts of loans also mean that decisions that will needto be made by regulators will affect the pricing of different sorts of mortgages. The depth ofmarkets in some forms of derivatives – swaps, swaptions and calls on underlying fixed incomesecurities – is currently limited at the longer maturities that are relevant for the funding oflonger-term fixed-rate mortgages. The recommendations in this Report address all of theseissues.
The responses to the Interim Report, and the ongoing consultation I have undertaken since itsappearance with a great many organisations and individuals, have informed therecommendations I present here (a list of those with whom I have had detailed discussions isgiven in Annex C). In the consultation process since the Interim Report I have received a greatmany suggestions on what changes need to be made in the UK – and a great many suggestionsabout why changes in certain areas are not needed. A great many lenders and other financialintermediaries have broadly agreed with the analysis of the market that I have summarisedabove. The most widely reported parts of the analysis in the Interim Report were aboutcross–subsidisation generated by the pricing structure adopted, often reluctantly, by manylenders. On this subject – as with the analysis in the Interim Report of the behaviour of manyhouseholds and with the wide range of funding issues – people who work in the mortgage sectorhave not fundamentally taken issue with the analysis. The Building Society Association, forexample, commented:
‘Building societies are sympathetic to the concern expressed by Miles that it is possiblethat the market is trapped in a bad equilibrium…Building societies support the viewthat cross-subsidisation of the type described in the report is likely to be occurring (inmany, but not all, lenders) and is undesirable.’ (BSA submission to the Miles Review,January 2004)
And the Council of Mortgage Lenders commented:
‘The fact is that many lenders are uncomfortable about the pricing strategies that thedemand-led market in the UK has created, although views amongst the industry aremixed’ (CML submission to the Miles Review, January 2004).

LETTER TO THE CHANCELLOR OF THE EXCHEQUER
3The Miles Review: Final Report
The structure of this Report
Section 1 of my Report sets out the aim and scope of the Review. Section 2 considers optimalmortgage choice. Section 3 summarises the potential macroeconomic implications of morelong-term fixed-rate lending. The recommendations for how the market can be made to workbetter are then presented in the main body of this report, in Sections 4 to 7. Recommendationsare summarised in Section 8. They cover a great many different topics. If acted upon, I believethese recommendations will:
• improve the information and advice households receive (Section 4);
• make the pricing of mortgages in the UK more transparent, fairer and sustainable(Section 5);
• remove some potential obstacles to the emergence of new types of contract to hedgeinterest rate risk (Section 6); and
• improve the ways in which fixed rate mortgages can be funded and the ways in whichrisks they generate can be hedged (Section 7).
The recommendations fall broadly into two groups: first, those that are aimed at improving theadvice and information that borrowers receive and at creating a fairer and more transparentpricing structure (recommendations 1 to 10); second, those that are aimed at helping lendersfund mortgages and handle risk in the most cost-effective way (recommendations 11 to 20).Many of the recommendations in the first group reflect the current best practice of lenders andfinancial advisors. The second group of recommendations have the potential to reduce the costto lenders of offering several different types of mortgage.
It has never been the purpose of this Review to make a series of recommendations with the aimof forcing or bribing households to take out long-term fixed-rate mortgages. It has been the aimto analyse how the market works, to assess whether there are parts of it that do not work as wellas they might, and to make recommendations that will make the market work better. I believethat the recommendations I make in this report will help to do that and that this will be to theadvantage of all borrowers. The benefits of greater understanding of risk and increased scope todeal with it are particularly great for new borrowers.
Households that want to become homeowners in the UK face difficulties – house prices haverisen greatly relative to incomes over the past ten years, though nominal interest rates have fallento, historically, low levels which has, in itself, boosted affordability. Some view with scepticismthe idea that more long-term lending can help households – particularly younger households.They argue that the structure of lending and pricing of mortgages that we have in the UK –with little longer term fixed rate lending and a great many new borrowers taking out discountedvariable rate mortgages – works to the benefit of borrowers.
It is important to be absolutely clear about what is, and what is not, problematic with thepattern of pricing we have in the UK. Mortgages whose initial monthly payments are lower thanthey later become are not undesirable. Far from it. In an environment where many people arecredit constrained and where many hope - but cannot be sure - that their incomes will be higherin the future then there are advantages in having the profile of payments gently rise. But howthe profile of payments can rise needs to be transparent. How such mortgages are madecommercially viable should not rely on price discrimination and cross-subsidisation. And ifthose low initial payments can rise both as a result of a planned rise in the mortgage interest ratemargin over market rates and because of a rise in the general level of market rates then the risksneed to be well understood.
It is clear that these conditions do not generally exist now in the UK mortgage market.

LETTER TO THE CHANCELLOR OF THE EXCHEQUER
4 The Miles Review: Final Report
It is also clear that fixed-rate mortgages are not inconsistent with a profile of repayments whichstarts at a lower level than it later becomes. It is profoundly mistaken to believe that the onlyway that new borrowers can have a profile of payments that matches their likely income is onethat also exposes them to substantial interest rate risk. This is why the notion that any shift awayfrom the type of lending that has been common in the past few years will be bad for newborrowers is mistaken. In fact the advantages of the insurance given by fixing the interest rateon borrowing for several years are likely to be greatest for those that borrow a great deal and forwhom income risks are large – a group likely to contain a high proportion of first-time buyers.
If borrowers were encouraged and helped to take a more forward-looking approach in decidinghow much to borrow and which type of mortgage to choose this would also make monetarypolicy easier to operate. Monetary policy will be easier to manage if households make well-informed decisions about mortgage products that are priced in a transparent and sustainableway and where the risks of different types of mortgage are well-understood. The risks of over-indebtedness, the scale of problems of debt affordability triggered by interest rate rises, and thedegree of excess volatility in the housing market will be reduced. Those problems have mademonetary policy more difficult to operate. Reducing them is desirable, whether or not the UKadopts the euro.
In very many ways the UK mortgage market works well. It is a dynamic and innovative market.Competition is intense for new business; new products emerge at regular intervals. Because ofthis the market can change quickly; changes do not happen overnight but on many occasionsin the recent past the market has evolved significantly in the space of a few years. I believe therecommendations I make in this report have the potential to change the UK mortgage marketand make it work better. This will be to the benefit of borrowers, lenders, other financialintermediaries and the savers whose funds are intermediated through the market.
Acknowledgements: This Review has benefited enormously from discussions with lenders,regulators, financial advisors, central banks, investors, academics, investment banks and tradeassociations. All those consulted have been enormously generous in giving their time, sharingtheir knowledge of the mortgage market and providing detailed information and data on a hugerange of issues. The discussions I have had with all those consulted have been completely openand I thank all those who have willingly shared information – much of which has beencommercially sensitive.
The team which worked with me on the Interim Report have continued to play a major role inthis Review. Ana Lasaosa, Andrew McKay and Adrian Richards have consistently worked withskill and dedication to tight deadlines. Tim Riddington made a major contribution since hejoined my Review team after the Interim Report. I have been fortunate to work with suchenthusiastic, determined and insightful colleagues. They have helped make the Review arewarding experience and I am glad to have been given the opportunity to undertake it.
March 2004.

1.1 This Final Report makes recommendations on how the mortgage market in the UK canbe helped to work better. It builds on the Interim Report that was published at the time of the Pre-Budget Report in December 2003. Reactions to that Interim Report and continuing consultationhave had a significant impact on the recommendations made in this Final Report.
1.2 It has been the aim of this Review to analyse how the UK mortgage market functions andto assess whether parts of it do not work as well as they might, potentially to the detriment ofhouseholds, lenders, other financial intermediaries and savers whose funds are channelled toborrowers. To understand the market one needs to analyse the mechanisms that link a borrowerwanting to raise money to buy a house to a saver wanting to earn a return. These links are manyare varied. They are illustrated in Figure 1.1
1.3 The way in which this market has worked in the UK has generated a stock of mortgageswhere interest rates are either variable or, for the minority of mortgages where rates are fixed,typically become variable usually within a year or so. Chart 1.1 shows the type of mortgages in theUK at December 2003.
The Miles Review: Final Report 5
1 Aim and scope of the Review
Figure 1.1: The mortgage market
Consumers Lenders & Financial Advisors
SaversIntermediaries
Household Borrower
Financial Advisor/ Mortgage Broker
Global Capital and Money Markets
SecuritisationVehicle selling
Mortgage BackedSecurities
Overseas Savers
Domestic Savers
Other Retail Savings
Retail Deposits with a Mortgage Lender
Pension Funds Life Insurance
Companies Unit Trusts
Lending Institution
Flow of savings/fund
Flow of information and advice
Flow of securities/claims

Aim and scope of the Review1
1.4 This Review did not presuppose that problems existed in the way the UK mortgage marketworks. Nor did it take as its goal that it should make recommendations with the aim that the vastmajority of households in the UK should borrow with mortgages where the interest rates are fixedfor 25 years. There are two reasons why that would not have been appropriate. First, longer-termfixed-rate mortgages do not just include debt contracts where the fixed period coincides with theperiod over which the loan is repaid (which is often 25 years or 30 years). Second, and morefundamentally, the fact that few people take out longer-term fixed rate mortgages now does not initself show there is a problem. If informed consumers made choices based on a good understandingof the characteristics of a wide range of products which are transparently priced and fundedefficiently there would be few reasons to worry about the outcomes.
1.5 But there is strong evidence that there are problems in the UK market and these generateobstacles to the emergence of forms of lending that could benefit all.
1.6 There is clear evidence that:
• A great many households – particularly amongst first-time buyers – attachoverwhelming weight to the initial monthly repayment on mortgages. They focusmuch less on where the burden of debt repayments might be some way ahead, eventhough mortgage debt is long-lived. And where debt is at variable rates there isgreat uncertainty about how affordability will evolve.
• Many borrowers have a poor understanding of the risks involved with differentmortgages. The risk issues are subtle and complex, so it is no easy task to assessthem. Since mortgage debt is long-term the risks come from unexpectedmovements in incomes, in interest rates and in house prices over an extendedperiod – a period that most definitely extends beyond a year or so ahead. Theinformation people receive on mortgage products often does not help them greatlyin assessing whether the risks they are taking are really acceptable to them.
6 The Miles Review: Final Report
Chart 1.1: Proportion of mortgages fixed or variable- by number
Tracker17 per cent
Other3 per cent
Capped2 per cent
Discounted variable18 per cent
Variable35 per cent
Fixed25 per cent
Stock – 2003
Source: CACI. Within the stock of fixed-rate mortgages the majority have rates fixed for between 2 and 3 years.

Aim and scope of the Review 1• Many short-term fixed and discounted variable-rate mortgage deals are cross-
subsidised by other variable-rate mortgages paying much higher interest rates.Cross subsidisation from established borrowers, for example those paying standardvariable rates that could be as much as 200 basis points above the lowest rates, isintrinsically undesirable and unfair. The pricing structure it supports plays to atendency for many borrowers to focus on the lowest initial monthly payments. Italso makes medium and longer-term fixed-rate deals that have a flat pricingstructure, with level payments over the period for which rates are fixed, lookexpensive.
• There are also a number of detailed funding issues which while unlikely yet to haveheld back a deeper market in longer-term fixed-rate mortgages could do so if thedemand for such products were to rise. These include difficulties in hedging pre-payment risk, limits on the use of wholesale funds by building societies and issuesrelated to capital requirements on lenders.
1.7 The recommendations in this Report aim to make these problems less significant. If theseproblems were reduced the market will work better. As a result of the market working better thereare strong reasons to believe that more longer-term fixed-rate borrowing would emerge. More fixedrate borrowing is not an end in itself. It will – however – be a consequence of the market workingbetter. Making the market work better is the real aim.
1.8 What do we mean by making the market work better and why should one expect that ifthe market did work better more lending would be at rates which are fixed for a significant period?To gauge that we need to consider what an ideal market would look like. In such a market:
• there would be a range of mortgage products, with various risk/returncharacteristics and various profiles of repayment;
• borrowers would understand the overall characteristics of various mortgageproducts and make decisions in an informed, forward-looking way. Borrowerswould not just focus on “the best deal” by looking at one characteristic of amortgage (for example the initial monthly payment) and without looking at costsand risks in the future;
• products would be funded efficiently and risk parcelled out (or removed) in a waythat makes the cost minimal while generating acceptable returns for providers offinancing and those that accept risk; and
• costs of intermediation would be minimized – there would be no unnecessaryswitching of mortgages, which generates costs, if there are better ways to achievethe same ends.
7The Miles Review: Final Report

Aim and scope of the Review11.9 The UK market has some of these characteristics but it does not have them all. Whyshould one believe that if the market worked like this we would see substantially more borrowingwith rates fixed for a substantial period – and for more than the two to five years that is commonwith most fixed-rate mortgages currently sold in the UK?1 One possible answer is that in manydeveloped countries where there are a range of products with different degrees of fixity of themortgage rate on offer a very substantial proportion of people take out longer-term fixed-ratemortgages. But this is not really a convincing argument, since there could be national differencesthat account for this and in some countries government subsidies may have favoured suchproducts. (Nonetheless it does prompt a set of questions about whether the volatility of short-terminterest rates in those countries is higher than in the UK and about whether borrowers there aremore averse to taking risk – neither of which seems very plausible). A much more convincing wayto answer the question is to set up an idealised experiment – one in which households have perfectknowledge of products and of the risks they face and where people make informed, forward-looking decisions. If in such a world it seems likely that longer-term fixed-rate mortgages simplyare not desirable for the great majority of households then one would not expect that much morelong term lending would be done even if the UK market were to work better. But if it appears likelythat many informed, forward-looking households choosing between products priced in atransparent and sustainable way would favour longer-term fixed-rate mortgages then it follows thata move towards that kind of market – which would surely be desirable in itself – would bring withit more longer-term fixed-rate mortgages.
1.10 Section 2 of this Report begins with an analysis of how decisions might be made byborrowers in an ideal world of perfect understanding and efficient pricing. It extends the briefdiscussion in the Interim Report of results based on a model of what optimal choices made byinformed, but risk averse, households would be. The main message of this section is that one canexpect a significant proportion of borrowers to find longer-term fixed rate mortgages attractive ifthe market works with transparent pricing and well-informed households. Section 3 then considerswhat the macroeconomic impacts of there being more long-term fixed rate mortgages would be.
8 The Miles Review: Final Report
1 As was stressed in the Interim Report there is a continuum of mortgages in terms of the degree of fixity ofrepayments. Mortgages where the rate is fixed for two or three years expose borrowers to risks that rates will havemoved by the time the fixed-rate period ends and at that point the outstanding balance on the mortgage will belittle changed from the original loan so that the exposure to rate rises is great. For that reason we do not think ofa two or three year fixed-rate mortgage as a longer-term fixed-rate mortgage. But with a ten year fixed rate on a25 year repayment mortgage the balance outstanding at the end of the fixed period is likely to be very muchsmaller relative to the borrower’s income, and relative to the value of a home, and so the risk characteristics arevery different. For that reason we consider a ten-year fixed-rate mortgage to be a long-term fix. If rates were fixedfor longer than ten years the outstanding balance at the end of the fixed period – relative to incomes and housevalues – is likely to be lower again than at the end of ten years.

Aim and scope of the Review 11.11 The analysis in Section 2 suggests that decisions made by households in the UK - in thelight of the range of products offered, the information they receive on such products, and the pricesof those products - are different from what we might expect if the market worked in an ideal way.This reflects a wide range of factors that we consider in the main part of the Report, where we makerecommendations on how the market can be made to work better. That analysis begins in Section4 by focusing on the information and advice households receive when they make decisions onmortgages and their understanding of products on offer. Improving information, advice andunderstanding is central to making the market work better. When households do not have a goodunderstanding of the characteristics of products – in terms of cost and risk – then everyone loses.Households themselves lose out. Lenders, other financial intermediaries and advisors also lose outbecause poor understanding of products generates risks of mis-selling. A compensation culturewith profound long-term costs for everyone can thrive in an environment where customers have alimited understanding of risk issues.
1.12 How mortgages are priced clearly has a major impact on the types of debt people use. Thestructure of pricing reflects the costs of funds and how risks to providers of mortgages can behandled; it also reflects the incentives that lenders have to structure the terms of different types ofmortgages to reflect the behaviour of new and existing borrowers. There are reasons to believe thatin this area there are problems in the UK. In Section 5 the structure of pricing of mortgages andproblems with it are analysed. Recommendations are presented which will help make pricing moretransparent, fairer and sustainable.
1.13 In Section 6 the potential for new sorts of product that help households handle risks aredescribed and some obstacles to their being sold are considered.
1.14 The funding issues are addressed in Section 7. The way in which mortgages are fundedand risks hedged plays a major role in determining the pricing and attractiveness of products. Thereare issues with how covered bonds might be used in the UK, how redemption charges can bestructured, how early repayment risked hedged and how derivatives can be used to that end. Thereare also issues specific to building societies. Recommendations are made in all these areas. Thepotential for the Government to affect some of the funding issues through the design of its ownfunding strategies is also considered.
1.15 Section 8 summarises all the recommendations.
1.16 Annex A is an outline of how people might be provided with information to better helpunderstand risk and cost issues with different types of mortgage. Annex B presents a statisticalanalysis of interest rate variability in the UK since 1950. Annex C is a list of those consulted overthe course of this Review.
9The Miles Review: Final Report

10 The Miles Review: Final Report

The Miles Review: Final Report 11
2 Optimal mortgage choice
2.1 The question of which types of mortgage are suited to people’s needs is central to anyanalysis of the market. This section considers what types of mortgage might be chosen by differenttypes of borrower in an idealised world where prices and risk characteristics of different mortgagesare well understood and where pricing is transparent and sustainable. It analyses the types ofmortgage well-informed, forward-looking borrowers might chose if faced with a simple choicebetween a mortgage consisting of a series of short-term fixed periods and a mortgage with apermanently fixed rate. This is an extreme experiment in two senses. First, because it assumes ahuge degree of knowledge and calculating ability on the part of households, far beyond what existsin any market. Second, because only two sorts of mortgage are available. In practice a much widerrange of mortgages is available in the UK – and that is a source of great benefit; but it is still usefulto assess which types of borrower might, in a well functioning market, find the advantages of beingtowards one end of a spectrum of contracts with varying degrees of certainty over the nominalrepayment profile attractive.
2.2 An important recent paper by John Campbell and Joao Cocco (2003), discussed in Section2 of the Interim Report, provides the framework for assessing that choice. In that model it isassumed that households own a home and they need to decide which type of debt to hold againstthe collateral of their house. They care about the level of consumption they can achieve today andinto the future. Consumption has to be financed from current income and past savings and afterany payments on a mortgage are made. Households may have the scope to switch mortgage andalso to borrow more if the value of their house exceeds the outstanding mortgage. However, theycannot switch between the two types of loans analysed here. There is uncertainty about futureincomes, the level of future interest rates and the future values of houses. People are assumed todiscount the future to some extent and attach more value to consumption today than toconsumption some years ahead. But households are also risk averse so that, other things equal, theyprefer a more certain stream of consumption to a less certain one.
2.3 This section begins by describing the results of using a version of this model of householdchoice that is calibrated to economic conditions in the UK.1 It then considers why the proportionof households that take out longer-term fixed-rate mortgages in the UK is, in the light of thoseresults, lower than may be expected.
2.4 The central question addressed here is whether few or many would choose a long-termfixed-rate mortgage in an idealised world with perfect understanding about the types of risk peopleface, where people are forward-looking and where the relevant economic environment is similar torecent UK experience. If it turns out that in this idealised world a significant proportion ofborrowers look like they might be better off with a permanently fixed-rate mortgage, then thissuggests that if conditions in the UK market were to move towards the ideal there would be morelonger-term fixed-rate borrowing. The next subsections describe the structure of the model. Thedescription of the results begins at paragraph 2.17.
1 Economists at the Bank of England have done much of the work in calibrating and running this model.

Optimal mortgage choice2THE MODEL OF OPTIMAL MORTGAGE CHOICE
What borrowers know in this model
2.5 It is assumed that households make decisions by taking into account the levels ofconsumption they might expect to afford over their whole life cycle. They make estimates of futureincomes and take into account the uncertainty both about those incomes and about future interestrates. House prices are also volatile and uncertain. Borrowers are aware of the degree of volatilityin all these factors. Households do not know what the future will be like – it is intrinsicallyuncertain – but they are aware of the type and degree of that uncertainty, and of how uncertaintiesabout inflation, interest rates, house values and future incomes interact with one another.
2.6 Ideally, households would assess all these sources of uncertainty in making their mortgagechoices because how inflation and interest-rates evolve can have very significant effects on theprofile of real mortgage payments. The Interim Report presented several scenarios illustrating thispoint.
2.7 Borrowers in this model are assumed to be risk averse, and therefore dislike volatility intheir payment schedule. But if removing volatility of mortgage repayments is too expensive,households would prefer to accept the risks. An assumption is made in the simulations reportedhere that households are averse to taking risks but not overwhelmingly so.2 There are severalrelevant risks.
• Inflation volatility creates real capital risk; borrowers do not know what the realcost of mortgage repayments will be even if the nominal value of payments can beknown when a permanently fixed-rate mortgage is taken. If inflation is uncertain,the real interest rate on a fixed nominal rate mortgage will be uncertain as well.
• Volatile nominal interest rates make the profile of payments on a series of short-term fixed-rate mortgages volatile. Since nominal rates are approximately equal tothe real interest rate plus inflation, the volatility can be due to either component.Other things equal, the more uncertain real rates are, the bigger the relative appealof longer-term fixed-rate mortgages.
2.8 It is assumed that long-term fixed-rate mortgages are, on average, more expensive thanshorter-term – more variable – mortgages. What this implies is that the interest rate on a longer-term fixed-rate mortgage is, usually, above the average of the short-term rates that a household willpay on a more variable mortgage over its life (assumed to be 30 years). But of course the degree ofuncertainty over the nominal rate is lower with the longer-term fixed rate. (In fact since we focushere on the extreme case where the fixed rate is set for the whole life of the mortgage theuncertainty over the nominal rate is zero). Borrowers realise that the yield curve, on average, slopesupwards. The choice of optimal mortgage is sensitive to this slope.
12 The Miles Review: Final Report
2 The coefficient of relative risk aversion (CRRA) is set equal to three. It may be helpful to put this intoperspective. Someone with a coefficient of risk aversion of three and for whom income is the only means offinancing consumption would be roughly indifferent between accepting a certain income of £30,000 a year andan income that could be £24,000 with probability one half and £44,000 with probability one half. Someonemore risk averse would prefer the certainty of a constant £30,000 income. With a CRRA of three someonejudges that the certainty of an income of £30,000 a year is worth about the same as a risky income which onaverage is £34,000 but with equal probability will be £10,000 less or £10,000 more than that.

Optimal mortgage choice 22.9 It is assumed that household income evolves in a way that depends on several factors:
• how the earnings profile changes with age;
• the scale of permanent income shocks (unexpected events that are not reversed,such as a one-off pay rise that stays); and
• transitory income shocks (random events that do not have any impact on theearnings in subsequent periods, such as a one-off bonus).
2.10 Borrowers know the average real growth rate of house prices and the volatility of thegrowth rate. The model assumes a fixed house size. In other words, households choose a house firstand then take account of all the features of mortgages on offer, and of all sources of uncertainty, inchoosing the right mortgage.
B) The mortgages on offer
2.11 In this stylised model, borrowers have available only two types of mortgage to choosefrom. One is a 30-year fixed-rate mortgage. Households can refinance this mortgage early, but thisis not costless. The cost of refinancing is a fixed percentage of the original loan, which is known.This pre-payment option is paid for partly in the form of a higher spread of the long-term fixedrate over the expected average shorter-term interest rate over the life of the mortgage. But if ahousehold does re-mortgage it also pays a cost of around one per cent of the original balance. Thesecond type of mortgage is a succession of two-year fixed-rate contracts with no possibility torefinance during the period of the fixed rate. In the US this type of mortgage would be called anadjustable-rate mortgage (ARM). Every two years the rate is fixed to the then prevailing level ofshort-term (that is, two-year) interest rates. There are no limits to how much rates can vary fromone fixed-rate period to the next.
2.12 The model compares a product that is not common in the UK – a 30-year fixed-ratemortgage – with a product that is – the two-year fixed-rate mortgage. It does not include the mostpopular mortgage in the UK: a completely variable mortgage whose rate can change at any time.The two-year adjustable–rate mortgage gives the greatest degree of variability that keeps thecomputational algorithm solving the optimisation problem manageable. (Even changing thenumber of possible interest rate changes from 15 to 30, equivalent to a succession of one-yearfixed-rate mortgages, increases the calculation time exponentially). This is very much a stylised andsimplified model of choice where the longer-term fixed-rate product on offer is a very long-termfix. It is obvious that in practice there are a range of products with different degrees of fixityavailable to households – and that with a wider choice the majority of informed households wouldprobably not chose mortgages at one end of the spectrum in terms of the horizon over which theinterest rate is fixed. This stylised model is really meant to shed light on whether one might expectmany households – and which type - to favour a long-term fix if the choice was fairly stark andsimple.
C) Assumptions about the preferences of borrowers
2.13 The model assumes that consumption of all goods yields utility to borrowers, as does thefinal wealth at the end of the 30-year comparison period. People discount the future to some extentand prefer things in the near future relative to the long-term future. Borrowers choose the mortgagethat yields the highest average expected utility.
13The Miles Review: Final Report

Optimal mortgage choice2
14 The Miles Review: Final Report
Box 2.1: Model parameters
Real interest rates are assumed to be variable and serially uncorrelated. They vary around a meanof 3.4 per cent with a normally distributed white noise shock with zero mean and standarddeviation of 1.29 per cent. The inflation rate follows an autoregressive AR(1) process with acoefficient of 0.75. The mean of the inflation rate is assumed to be 2.5 per cent with a standarddeviation of 0.83 per cent.
When the model assumes that there is correlation between inflation and real interest rates, it setsthe correlation coefficient at 0.6 when thetransitory income and the real interest rate arecorrelated, the correlation coefficient is –0.06. House prices grow by 5.1 per cent every yearwith a standard deviation of 12.5 per cent.
Earnings follow a typical time profile that at the start increases quickly with age, then theincrease slows down and it decreases in the final years. The following chart depicts this typicalincome profile as a percentage of the maximum yearly income (achieved in year 23). Once couldthink of time 1 corresponding to about age 30 so income typically peaks in the early 50s.
On top of this profile, households have two types of income shocks: permanent income shockswith a mean of zero and a standard deviation of 0.05 and transitory shocks with a standarddeviation of either 0.11 or 0.14. Income is taxed at a rate of 30 per cent.
Households are assumed to have a relative risk aversion parameter of three and a discount rateof 0.02 a year. The cost of refinancing a fixed-rate mortgage is one per cent of the original loan.Three different loan-to-income ratios are used: 2.25, 3 and 3.75.
Mortgages consisting of a series of two-year fixed rates are assumed to be priced at a spread of100 basis points over the short-term rate, while permanently fixed-rate mortgages are priced 130basis points over the average of expected future rates. In a variation of the model, the differencein the spread between the two mortgages is reduced from 30 to 15 basis points.
Percentage of maximum yearly income in each period
75
80
85
90
95
100
75
80
85
90
95
100
1 3 5 7 9 11 13 15 17 19 21 23 25 27 29 31
Time (in years)
Per cent

Optimal mortgage choice 2Model results
2.14 The model allows us to work out which mortgage people facing different types of risk andborrowing alternative amounts would choose. By changing some features of the model, one canassess how the different factors affect the choice of type of mortgage. It is possible to allow forvarious correlations between transitory income and real interest rates, and different correlationsbetween inflation and interest rates. The value of risk aversion, of loan-to-income ratios, of theaverage extra cost of fixed-rate mortgages and of income risks can all be varied. Box 2.1 describesthe values of the parameters in some of the different cases analysed.
2.15 The choice of mortgage turns out to be sensitive to assumptions made about how muchpeople borrow and what the correlations between different sources of uncertainty are. The mainresults that emerge from using the model are:
• when there is a significant positive correlation between inflation shocks and realinterest rates then households would prefer the very long-term fixed-rate mortgageat any loan-to-income ratio above about three, and the fixed-rate mortgage resultsin a very substantial gain for those with ratios much above 3.75. We believe thispositive correlation of inflation shocks and real interest rates is the most relevantcase. It is plausible in an environment where the central bank uses the short-termrate to bring inflation back towards a target level by raising interest rates wheninflation is above target. Both the Bank of England and the European CentralBank use an inflation target.
• in other specifications, where the income risks are less extreme and where inflationand real interest rates are not positively correlated, mortgages with a series of shortfixed-rate periods are (marginally) more favourable contracts for those who borrowup to about 3.75 times their income. However, this result is very sensitive to thecost of a permanently fixed-rate mortgage over one with a succession of two-yearfixed-rate periods. When the average cost difference is assumed to go down from30 to 15 basis points, households with loan-to-income ratios slightly above threewould prefer permanently fixed-rate mortgages to a succession of two-year fixed-rate mortgages in all cases.
• somebody with an age-earning profile that grew more slowly at the beginning oftheir career, and dipped less from its peak when they reached middle age, wouldtend to find the fixed-rate mortgage relatively more attractive.
• when households have a substantial risk of unemployment – or of a big fall inincome – a long-term fixed-rate mortgage looks preferable.3
• the long-term fixed-rate contract becomes more attractive as people start to borrowa lot. In almost all cases it is preferable at a loan-to-income ratio of 3.75 or above,though in the most relevant scenarios the long-term fix becomes more attractive atlower loan-to-income ratios.
15The Miles Review: Final Report
3 The model is used to generate a high unemployment risk by making the transitory income shock componenttake three values: +1 standard deviation with a probability of 0.5 each year, –1 standard deviation with aprobability of 0.47 and –2 standard deviations (unemployment) with a probability of 0.03.

Optimal mortgage choice22.16 In brief, results show that a significant proportion of households – though probably not amajority – might be expected to find that the advantages of very long-term fixed-rate mortgagesmake them attractive. This fraction would be a majority if, on average over the interest rate cycle,long-term mortgages cost substantially less than 30 basis points above the average cost of a variable-rate mortgage or very short-term fixed-rate mortgages. Note that this spread of long-term fixed-rate mortgages over a series of two-year fixed-rate mortgages is on average over the interest rate cycle.
2.17 The comparison being made in the Campbell and Cocco work, and the version of itapplied to the UK that we have described here, is not between a fully variable-rate mortgage, (forexample a standard variable-rate mortgage in the UK or a tracker mortgage) and a long-term fixed-rate mortgage. Rather it is between a mortgage where the interest rate is fixed for two years andone where the rate is fixed for the full maturity of the loan. In those cases where between thesetwo contracts, the longer-term fixed-rate mortgage is preferable to the shorter-term fixed-ratemortgage it would almost certainly be even more favourable when assessed against a fully variablemortgage. And if a 25 or 30 year fixed-rate mortgage is preferable to a two-year fixed it is highlylikely that a ten-year fix is preferable to a fully variable-rate mortgage.
2.18 All of this suggests that mortgages with interest rates fixed for substantially longer than fiveyears might be expected to be attractive to a substantial proportion of households that makedecisions in an informed, forward-looking way and where the prices of mortgages are transparentand sustainable. First-time buyers – whose loan-to-income ratios are high and whose future incomeis often very uncertain – would be expected to value the risk reduction of fixing the interest ratefor several years. Chart 1.1 showed that around one quarter of the stock of mortgages has fixedrates. But the great majority of these mortgages have rates fixed for only two or three years, withmost of the remainder fixed for no more than five years. Chart 2.1 shows the proportion of all newmortgages taken over the past two years at fixed rates and the proportion at rates fixed for longerthan five years. The proportion of new mortgage lending fixed for longer than five years has notreached five per cent in recent times. It has averaged about two per cent.
16 The Miles Review: Final Report
Chart 2.1: New mortgages: fixed-rate share
Source: Survey of Mortgage Lenders
0
5
10
15
20
25
30
35
40
45
0
5
10
15
20
25
30
35
40
45
2004SepMay2003SepMay2002
Fixed >5 years
All fixed borrowing
Per cent
Optimal mortgage choice 2WHY IS THE TAKE-UP OF LONGER-TERM FIXED-RATEMORTGAGES SO LOW? THREE POSSIBLE ANSWERS
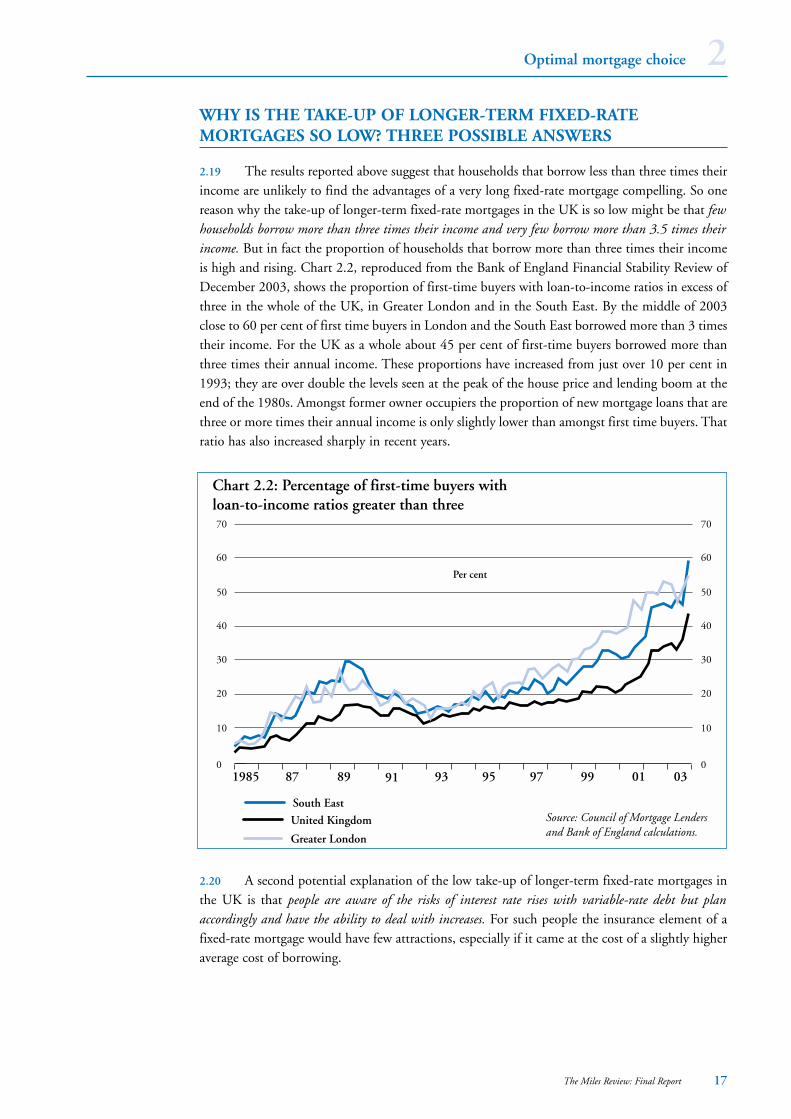
2.19 The results reported above suggest that households that borrow less than three times theirincome are unlikely to find the advantages of a very long fixed-rate mortgage compelling. So onereason why the take-up of longer-term fixed-rate mortgages in the UK is so low might be that fewhouseholds borrow more than three times their income and very few borrow more than 3.5 times theirincome. But in fact the proportion of households that borrow more than three times their incomeis high and rising. Chart 2.2, reproduced from the Bank of England Financial Stability Review ofDecember 2003, shows the proportion of first-time buyers with loan-to-income ratios in excess ofthree in the whole of the UK, in Greater London and in the South East. By the middle of 2003close to 60 per cent of first time buyers in London and the South East borrowed more than 3 timestheir income. For the UK as a whole about 45 per cent of first-time buyers borrowed more thanthree times their annual income. These proportions have increased from just over 10 per cent in1993; they are over double the levels seen at the peak of the house price and lending boom at theend of the 1980s. Amongst former owner occupiers the proportion of new mortgage loans that arethree or more times their annual income is only slightly lower than amongst first time buyers. Thatratio has also increased sharply in recent years.
2.20 A second potential explanation of the low take-up of longer-term fixed-rate mortgages inthe UK is that people are aware of the risks of interest rate rises with variable-rate debt but planaccordingly and have the ability to deal with increases. For such people the insurance element of afixed-rate mortgage would have few attractions, especially if it came at the cost of a slightly higheraverage cost of borrowing.
17The Miles Review: Final Report
Chart 2.2: Percentage of first-time buyers with loan-to-income ratios greater than three
0
10
20
40
30
50
60
70
0
10
20
40
30
50
60
70
1985 87 89 91 93 95 97 99 01 03
Per cent
Source: Council of Mortgage Lenders and Bank of England calculations.
United Kingdom
Greater London
South East

Optimal mortgage choice22.21 Results from a large-scale survey commissioned by the Financial Services Authority andundertaken as part of the National Statistics Omnibus Survey suggest this is not a very convincingexplanation (FSA, 2004). A large sample of households was asked how they would cope with a risein interest rates of one per cent, two and a half per cent and five per cent (from the base rate levelof September 2003 of three and a half per cent - since when base rates have already risen 50 basispoints). The FSA found that:
‘The one per cent rise has little impact on the proportion of people who said they wouldfall behind with at least one of their borrowing commitments, but significantly morepeople would begin to struggle. An estimated one million more families reported asignificant deterioration in their position as a consequence.
With a two and a half per cent increase in interest rates, less than half of people with amortgage said they would be able to cope with all of their borrowing commitmentswithout any difficulty, and nearly one in ten said they would fall behind with at least onecommitment.
A family is considered to be over-indebted if it spends more than one half of its grossincome on all debt-servicing costs including a mortgage. In the survey, this coveredapproximately 1.8 million families. Three fifths of these over indebted families have somedifficulty with making these payments at present (that is, September 2003). With a oneper cent rise in interest rates the proportion of over-indebted families saying they wouldhave some difficulty rises to three quarters’
It would appear from these results that many households in the UK would be significantly affectedby increases in interest rates of much more than one per cent from current (February 2004) levels.The evidence included in the Interim Report (see box 2.1) showed the great sensitivity of arrearsand repossessions to changes in interest rates.
2.22 A third potential explanation of why so few people take out longer-term fixed-ratemortgages is that many may pay a great deal more attention to the initial monthly cost of therepayments than in the idealised model described above. In that model people do discount thefuture and are likely to have higher incomes in the future – and for both of those reasons they willpay a great deal of attention to the profile of payments and would tend to favour deals where initialmonthly payments are lower. But in the model described above, households are still forward-looking and do also pay attention to the risks that come from the uncertainty over future interestrates so the initial cost, while important, is not of overwhelming importance. The model outlinedabove also assumes that the variable-rate mortgage is offered at an equilibrium spread over the costof funds (set at one per cent for the calculations). In practice there are many discounted variabledeals available. For households attaching great weight to the initial monthly payments this discountcould be the decisive factor. Most longer-term fixed-rate deals in the UK give a flat (nominal)repayment profile and so many variable-rate mortgages can have very much lower initial paymentsthan typical fixed-rate deals.
2.23 It is very likely that this is a crucial factor in accounting for the take–up of different sortsof mortgages in the UK. In part it may reflect less than prefect understanding of risks, a difficultyin interpreting that when the yield curve slopes up sharply it reflects market expectations that short-term rates are likely to rise and also a pricing structure that plays to a tendency of some householdsto focus excessively on initial costs. We return to these important issues in later sections. But animportant point to stress here is that there is considerable scope to give households the benefit of
18 The Miles Review: Final Report

Optimal mortgage choice 2certainty over the level of repayments in the future and to offer the kind of low initial costsgenerally only found amongst variable-rate mortgages in the UK. There is not necessarily a conflictbetween having a mortgage with certainty over the level of payments and a mortgage that makespayments lower in the first few years than later. The results described above show that those peoplewith high loan-to-income ratios are precisely those for whom certainty is most valuable. Thatpeople do not have to take on uncertainty over future payments in exchange for lower initialmonthly payments is important.4
2.24 Rising monthly re-payment profiles on a fixed-rate mortgage do not require thatredemption penalties need to be higher. Neither do they require the outstanding balance on themortgage to rise over time (negative amortisation). The scope for the level of repayments on afixed-rate mortgage to rise gradually for some years, while the stock of outstanding debt does notincrease, is very substantial. It means that the benefits to some households of a lower start in theprofile on repayments need not require that they also take on interest rate uncertainty, nor thattheir outstanding balance rises.
2.25 Table 2.1 illustrates this with a simple example. Here we compare three 25-year repaymentmortgages of £100,000:
• a fixed-rate mortgage where for the first two years payments are interest-only (M1in the table);
• a discounted variable-rate mortgage where the initial rate is set at a discount of overtwo per cent from a standard variable rate (SVR) but then switches on to the SVRafter two years (M2); and
• a fixed-rate mortgage where payments are initially interest-only but they thengradually move up over a five-year horizon to a level that then remains constant(M3).
We assume the fixed rate is six per cent the standard variable rate is 5.9% and that the initialdiscount on the SVR means that a rate of 3.75% is paid for two years on the variable-rate deal.These are figures typical for discounted, SVR and longer-term fixed-rate deals in February 2004.We abstract from uncertainty so as to focus simply on the issue of the profile of repayments andwe assume there is no subsequent change in variable rates.
2.26 For each mortgage we show the annual and monthly level of repayment over time, themortgage balance outstanding and also show how much the weekly repayment changes from oneyear to the next when the payment profile changes. Changes in repayments only happen at mostonce a year.
2.27 Even with a very substantial discount on the variable-rate deal – generating a 3.75 per centrate for two years in an environment where fixed rates are six per cent – initial payments can belower on a fixed-rate deal. The last block of figures (for M3) show how this can be achieved eventhough the outstanding balance on the mortgage with a fixed-rate always falls and there is nosudden dramatic jump in the scale of repayments. Payments on this fixed-rate mortgage rise atseven per cent each year over the first five years of the mortgage; over this period the weekly costof the mortgage never rises from one year to the next by more than £10.
19The Miles Review: Final Report
4 On 2 February 2004, 13 out of 358 fixed-rate mortgages (most fixed for a very short-term period) that wereavailable in the UK had stepped rates (Source: FSA comparative tables).

Optimal mortgage choice2Table 2.1: Stepped-up payment profiles on fixed and variable-rate mortgages (£)
M1 – Interest only for two years M2 – discounted variable-rate M3 – gradually rising payment on
on a fixed-rate mortgage mortgage fixed-rate debt
Outstanding Monthly Weekly Outstanding Monthly Weekly Outstanding Monthly Weekly
balance Payments rise balance Payments rise balance Payments rise
year (start year) (start year) (start year)
1 100,000 500 – 100,000 519 – 100,000 500 –
2 100,000 500 0 97,517 519 0 100,000 535 8
3 100,000 677 41 94,941 637 28 99,580 572 9
4 97,872 677 0 92,895 637 0 98,685 613 9
5 95,617 677 – 90,728 637 – 97,256 655 10
6 93,226 677 – 88,433 637 – 95,227 692 9
7 90,691 677 – 86,003 637 – 92,638 692 0
8 88,005 677 – 83,430 637 – 89,894 692 –
9 85,158 677 – 80,705 637 – 86,985 692 –
10 82,139 677 – 77,819 637 – 83,902 692 –
11 78,940 677 – 74,762 637 – 80,634 692 –
12 75,548 677 – 71,526 637 – 77,170 692 –
13 71,953 677 – 68,098 637 – 73,498 692 –
14 68,143 677 – 64,469 637 – 69,605 692 –
15 64,103 677 – 60,625 637 – 65,479 692 –
16 59,822 677 – 56,554 637 – 61,106 692 –
17 55,283 677 – 52,243 637 – 56,470 692 –
18 50,472 677 – 47,678 637 – 51,556 692 –
19 45,373 677 – 42,844 637 – 46,347 692 –
20 39,967 677 – 37,724 637 – 40,825 692 –
21 34,237 677 – 32,302 637 – 34,972 692 –
22 28,164 677 – 26,560 637 – 28,768 692 –
23 21,726 677 – 20,480 637 – 22,192 692 –
24 14,902 677 – 14,041 637 – 15,221 692 –
25 7,668 677 – 7,221 637 – 7,832 692 –
M1 M2 M3
Total Payments Over:
1 year 6,000 6,233 6,000
2 years 12,000 12,466 12,420
3 years 20,127 20,114 19,289
5 years 36,383 35,408 34,504
M1 is a mortgage with a fixed rate at six per cent where for the first two years payments are interest-only. M2 is a discounted variable-ratemortgage where the initial rate is set at a discount of over two per cent from the standard variable rate (SVR) but then switches on to the SVRafter two years (5.9 per cent). This initial rate is 3.75 per cent for two years. We assume that there is no change in the SVR over the whole 25years. M3 is a fixed-rate mortgage where payments are initially interest-only but they then gradually move up over a five-year horizon to a levelthat then remains constant. The focus of this table is purely on the profile of payments so we abstract from risk.Source: Miles Review calculations.
20 The Miles Review: Final Report
Optimal mortgage choice 2CONCLUSIONS:
2.28 The take-up of longer-term fixed-rate mortgages in the UK is at a much lower level thatone might expect based on a model of optimal mortgage choice. That model assumes householdsare well informed and able to understand and assess risks. It also assumes mortgages are priced ina transparent and sustainable way. There are many potential reasons why the take-up of suchmortgages in the UK may have been so low. They include imperfect understanding of risks and ofthe likely profile of future interest rates, a tendency to focus on initial payments on mortgages, anda pricing structure that plays to that tendency.
2.29 We take these issues up and make recommendations in the following sections.
2.30 In the light of the results described in the main part of this section it is reasonable to expectthat if consumers in the UK were helped to understand better the risk and cost profiles of differenttypes of mortgage there would be more longer-term fixed-rate lending. This would be a by-productof the mortgage market working better, rather than an end in itself. How better understanding andbetter information can be given to households is the focus of Section 4. But first, in the nextsection, we consider the macroeconomic implications of there being more long-term fixed-ratelending in the UK.
21The Miles Review: Final Report

22 The Miles Review: Final Report

The Miles Review: Final Report 23
3 Macroeconomic implications of fixed andvariable-rate mortgages
3.1 If a significantly greater proportion of mortgage debt in the UK were at longer-term fixedrates the way in which monetary policy affects the economy would be different. It is plausible thatthe impact of a given change in short-term interest rates upon the aggregate economy would belower. Oxford Economic Forecasting (OEF) estimated that around a third of the impact of shortrates on Gross Domestic Product (GDP) operates through the effect on house prices and anothersixth operates via the impact of changes in short rates on consumption. Assuming the underlyingstructures of the rest of the economy remained the same, base rates would have to move by moreto have the same impact on the UK aggregate economy. But there may be substantial advantagesin reducing the extent to which the housing market and household finances are affected by changesin short-term interest rates. The impact of monetary policy would be less unbalanced.
3.2 UK monetary policy has been successful in recent years. There are concerns that a moveto more longer-term fixed-rate lending will make monetary policy harder to operate. But thosecountries where mortgage lending has been at predominantly longer-term fixed rates do not seemto have found monetary policy harder to implement. For example, Germany and the United Stateshave operated a monetary policy that, on average, has delivered less variable and lower inflation –and a much less volatile housing market – than in the UK over the past 50 years. In those countriesmortgages have been predominantly long-term fixed rate. There are of course many reasons whyinflation performance has been different. But history does not support the notion that countrieswhere the mortgage stock is large and predominantly at variable rates are those where monetarypolicy is more successful.
3.3 Changes in interest rates currently have two effects in the UK that are linked to thehousing market. First, there is a direct effect through the impact of interest rate changes on the costof existing variable-rate debt: this has a very substantial impact on many households’ discretionaryincome. Many homeowners initially have debt servicing costs of around a quarter of their income;for such households the ratio of mortgage costs to income can be extremely sensitive to interest ratechanges.1 Second, changes in the demand for housing appear to be responsive to even temporarychanges in short-term interest rates which can have a powerful impact on the initial debt servicingcosts of buying a house. Reductions in short-term interest rates both increase the discretionaryincome of people with an existing variable-rate mortgage and generate an increase in demand forhousing which is likely to be stronger in an environment where many people view the current levelof payments on a mortgage as the cost of debt. As the quantity of housing is fixed in the short run(and only responds slowly even in the longer run), rises and falls in demand tend to generatesignificant house price changes. Real house prices in the UK have been exceptionally volatile overthe last 20 years with pronounced cycles. Aggregate house prices have risen by over 20 per cent intwo years (1989 and 2002) and have fallen by around 10 per cent in two others (1990 and 1993).While such volatility has partly been driven by wider economic conditions it has also contributedto macroeconomic fluctuations.
1 Households also have savings deposits that pay a higher nominal return when interest rates rise. Given that atthe aggregate level the size of deposits and debts are similar, the aggregate effect on households’ expenditure ofinterest rate changes, in principle, might be small. However if borrowers have higher marginal propensities toconsume than savers then changes in short-term interest rates can have effects on the macroeconomy. Suchdifferences in propensities to consume are very likely.

Macroeconomic implications of fixed and variable-rate mortgages33.4 The Interim Report presented evidence showing that many households in the UK attachgreat weight to the level of current, short-term interest rates when they decide how much to borrowand what type of mortgage to take out. Less weight seems to be placed upon the likely path ofinterest rates some years ahead, even though the great majority of households with mortgages willstill have substantial amounts of variable-rate debt for many years. Evidence from the InterimReport also showed that short-term interest rates are more volatile than longer-term rates. AnnexB shows the extent to which base rates have changed over different time horizons over the past fiftyyears.
3.5 The impact of a change in short rates on house prices is likely to be substantially lower ifthere were to be much more longer-term fixed-rate borrowing. The Interim Report showed resultsusing the OEF model which estimated that around a third of the impact of short-rates on GDPoperates through the effect on house prices and another sixth operates via the impact of changes ofshort rates on consumption. This still leaves a significant proportion of the effect of short rates onthe wider economy via their effect on, amongst other things, investment and the exchange rate.With many more longer-term fixed-rate mortgages house prices would still be affected bymovements in short rates through their influence on longer rates and through the influence ofshort rates on other determinants of housing demand, particularly household income. The neteffect, however, is likely to be substantially smaller.
3.6 It is clear that the monetary transmission mechanism would be different if a substantialproportion of mortgages were to have interest rates fixed for ten or more years. The simulations inthe Interim Report provide broad indications of the possible magnitudes. While the simulationsonly give a rough idea of the potential effects it is possible to draw the following conclusions:
1. With fixed-rate mortgage lending the impact of a given change in short rates onhouse values and probably on consumption expenditure will be lower.
2. With more fixed-rate mortgage lending a greater proportion of the overall impact ofa change in short rates upon aggregate demand will stem from the effect on the costof borrowing to companies and via induced impacts upon the exchange rate.
3. The impact of a change in short rates will depend to a greater extent than at presentupon the induced impact on longer-term bond yields and swap rates.
3.7 It might appear that both 2 and 3 are in themselves undesirable because they makemonetary policy less effective, even if that might be a price worth paying for greater stability inhousing values and less variability and uncertainty in mortgage holders’ spending power. But thisis far from obvious. A situation where one of the main ways in which a cut in interest rates boostsdemand is via its impact on house values and, partly as a result, its impact on consumer spendingboth of which can create problems. When the housing market is booming, consumer debt risingrapidly and the personal sector savings rate is very low – while at the same time other sectors of theeconomy face falling demand and spare capacity – it is not helpful to a central bank to have somuch mortgage debt at variable rates. The Bank of England has faced a difficult situation for muchof the past three years when the manufacturing sector has been weak and investment expendituremuch weaker than consumption while house prices have risen sharply and mortgage borrowing hasbeen exceptionally high. If a temporary cut in interest rates in the UK had its major effect on theeconomy because of a reduction in the cost of borrowing for companies and its impact on theexchange rate, and had limited effect on the housing market because longer rates would not changemuch, then it is at least plausible that interest rates in recent years in the UK would have beenlower. More important imbalances in the economy would have been reduced.
24 The Miles Review: Final Report

Macroeconomic implications of fixed and variable-rate mortgages 33.8 Monetary policy will be easier to manage if households make well-informed decisionsabout mortgage products that are priced in a transparent and sustainable way and where the risksof different types of mortgage are well understood. If that is how the mortgage market worked itwould work better. Section 2 presented some evidence that if the market worked better there wouldbe more longer-term fixed rate lending. The risks of over-indebtedness, of problems of debtaffordability triggered by interest rate rises, and of excess volatility in the housing market would bereduced. Those risks can make monetary policy more difficult to operate.
25The Miles Review: Final Report

26 The Miles Review: Final Report

The Miles Review: Final Report 27
4 Improving borrowers’ understanding
4.1 Section 2 assessed which types of mortgage contract might be attractive to different types ofborrower in a world with transparent pricing, where households are well informed and are able tojudge which risks are acceptable, based on a realistic assessment of the degree of uncertainty overtheir own incomes and over rates of interest. It found that a substantial proportion of borrowers,particularly among those borrowing more than three times their income, are likely to find thenominal payment certainty of a longer-term fixed-rate mortgage attractive. In the UK few peoplehave such mortgages. The information people have on mortgages, the structure of pricing ofmortgages and the nature of advice play a major role in accounting for this. Those forces helpmould decisions and are a key factor behind the dominance of variable and short-term fixed-ratemortgages in the UK. This section focuses on advice, information and understanding. The nextsection analyses the structure of pricing. Pricing depends upon the sources and costs of fundingand these are considered in Sections 6 and 7.
4.2 Section 3 of the Interim Report presented a wide range of different types of evidence thatsuggests that borrowers tend to focus excessively on the initial monthly cost of the mortgage anddo not have a good understanding of interest rate risk. That evidence comes from academic andmarket consumer research, from analysis of the relative take up of fixed and variable-ratemortgages, from econometric models of house prices in the UK and from discussions with manylenders and mortgage intermediaries. A short summary of the evidence is included here.
EVIDENCE OF MISUNDERSTANDING
4.3 In the run-up to designing their mortgage regulation regime, the Financial ServicesAuthority (FSA) undertook substantial consumer research into how people make decisions aboutmortgages. In summarising both a review of existing academic and market research on the subjectand a bespoke survey, the FSA states:
‘… studies highlight that the information that consumers say they need is predominantlyfocused on the immediate monthly mortgage costs in order to assess initial affordability, andthat they do not have longer-term horizons’ (FSA, 2001b).
4.4 The historic take-up of (largely short-term) fixed and variable-rate mortgages in the UK alsosuggests that borrowers tend to focus on initial cost. Over the last decade the take up of fixed-ratemortgages has been very sensitive to the initial rate differential, i.e. the relative size of the firstmonthly payment on a mortgage. At times when the initial cost of short-term fixed-rate mortgagesrelative to variable-rate mortgages has been low, the proportion of fixed rates in new lending hasbeen high, and vice versa. Because the interest paid on a variable-rate contract will vary over thelife of the contract, expectations of future variable-rates should be a factor in determining take-up.Forward-looking borrowers would respond to the likely future cost of different mortgages. Butthere seems to be no relationship between the take up of fixed-rate mortgages and the differentialbetween the fixed rate and the expected variable rate over the length of the fixed period (whereexpectations are based on bond prices). This suggests that many borrowers do not pay muchattention to the likely level of future interest rates in choosing between variable and short-termfixed rates.

Improving borrowers’ understanding44.5 Evidence from models of house prices also supports the idea that a great many borrowerspay overwhelming attention to the current variable interest rate. If households take into accountthe likely future path of interest rates in deciding how much to borrow and which type of mortgageto choose then house prices would depend more on longer interest rates than on short rates. Longerrates embody expectations about the future path of short rates. In fact, econometric models of UKhouse prices – for example those built by the Bank of England, the National Institute of Economicand Social Research, Oxford Economic Forecasting and HM Treasury – nearly always reflect thefinding that in the UK the short-term variable mortgage rate is a much more powerful explanatoryfactor than longer rates.
4.6 The many mortgage lenders and intermediaries that the Review has consulted have, almostwithout exception, confirmed that their customers tend to focus on the initial interest rate. Theirviews are based on an enormous wealth of experience of the way the UK market operates.
4.7 There is also more limited evidence that some borrowers perceive longer-term fixed-ratemortgages as giving little or no flexibility in payment profiles and that many may not appreciatethat fixed-rate mortgages tend to be portable, leading them to see longer-term fixed-rate mortgagesas inherently unsuitable since they expect to move house within a few years. In practice many fixed-rate products offer degrees of flexibility (the option to overpay up to 10 per cent of the outstandingbalance per year and draw-down overpayments is common in products with rates fixed for 10 to25 years) and on moving house borrowers often need not incur redemption penalties (lendersgenerally make fixed-rate mortgages portable and generally offer competitive terms for top-uploans where the new property is more expensive).
4.8 Further evidence concerning borrowers’ understanding of interest rate risk has come to lightsince publication of the Interim Report. In order to assess the effects on consumers of interest raterises, the FSA made use of the September 2003 National Statistics Omnibus Survey to assess howmortgage holders would cope with 1 percentage, 2.5 percentage and 5 percentage point increasesin interest rates (the results were reported in the FSA’s Financial Risk Outlook 2004).1 Thoseborrowers who said that they would struggle or fall behind on their debt payments, for these givenincreases in rates, were asked what action they would take to cope with the increased cost of debt.Chart 4.1 shows the results. The popularity of re-mortgaging as a strategy to deal with a generalincrease in interest rates, and the fact that the popularity of this strategy increases with larger raterises, may reflect some misunderstanding of interest rate risk. Many respondents may not haverealised that other mortgage lenders will also have raised their interest rates by similar amountswhen the cost of their own variable-rate mortgage goes up and that re-mortgaging is unlikely toresult in a saving.
28 The Miles Review: Final Report
1 The Office of National Statistics omnibus survey had an overall sample size of 1,832 respondents. Interviewswere conducted face to face – between 15th September and 3rd October. The data reported here summariseresponses from all families who owned their own home with a mortgage who said they would struggle or fallbehind with mortgage payments for each of the three scenarios.

Improving borrowers’ understanding 4
4.9 Other recent survey data have found that once prompted to think about the level of currentinterest rates, and their own view as to the likelihood of future changes in rates, many respondentsexpress an interest in fixing their mortgage payments for more than a few years. The Council ofMortgage Lenders’ (CML) latest survey of mortgage borrowers, conducted in November/December 2003, asked households which type of interest rate they would prefer if re-mortgagingtomorrow: variable; fixed for less than 5 years; or fixed for more than 5 years. 26 per cent ofrespondents preferred to fix their mortgage interest rate for more than 5 years.2 A surveycommissioned by the Cheshire Building Society, carried out in November 2003, found that 49 percent of respondents would consider taking out a mortgage fixed for 5 years or more.3 The contrastwith the numbers of borrowers actually taking out such products is striking. This apparent desirefrom a high proportion of households for a substantial degree of nominal payment certainty is notreflected in the take up of longer-term fixed-rate mortgages – only around 4 per cent of newadvances in December 2003 were fixed for more than 5 years (CML, Survey of Mortgage Lenders).All of this suggests that how mortgages are sold is central.
4.10 There are three broad routes through which to improve borrowers’ understanding and helpthem to make better-informed decisions: (i) improving the standard of verbal advice given toborrowers during the sales process; (ii) improving the standard of documentation that lenders arerequired to provide during the sales process; and (iii) improving the decision-making capability ofthe borrowers themselves. Each is considered in turn.
29The Miles Review: Final Report
2 The CML survey, carried out by MORI, had a sample size of 2525. Interviews were conducted face to face inNovember/December 2003. Results are weighted to be representative of all UK mortgage borrowers.3 The UK wide survey was conducted by YouGov on 12-14 November 2003. The sample size was 1939.
Chart 4.1: Mitigating actions to cover an interest rate rise
Source: National Statistics Omnibus Survey, September 2003.
0
5
10
15
20
25
30
0
5
10
15
20
25
30
5% point rate rise
2.5% point rate rise
1% point rate rise
OtherSell homeand move
Use savings /investments
Talk to lenderto rearrangepayments
RemortgageCut backon spending
Per cent

Improving borrowers’ understanding4IMPROVING THE STANDARD OF ADVICE
4.11 The Interim Report presented evidence, from research by the FSA, Financial ServicesConsumer Panel and others, showing that professional advice is very influential on borrowers’decision-making. In some cases consumers effectively delegate the choice of product to the advisor(FSA, 2001b; FSCP 1999). Mortgage choice is a complex issue. Professional advice has a key roleto play in encouraging and helping borrowers to consider the characteristics of different mortgageproducts.
4.12 The way in which most advice is given is currently subject to voluntary regulation underthe Mortgage Code, to which 98 per cent of lenders and most intermediaries have signed up. TheCode sets out three levels of service and requires firms to be clear to the customer about whichlevel(s) they offer. The three levels are:
(a) advice and a recommendation;
(b) information on different mortgage products; and
(c) information on a single mortgage product.
4.13 A recent survey by the Mortgage Code Compliance Board (MCCB) suggests that 35 percent of the market currently receives advice and a recommendation.4 Table 4.1 shows levels ofservice broken down by type of buyer and by distribution channel.
Table 4.1: Advice by type of buyer and distribution channel (per cent)
Type of buyer ChannelTotal
First-time Mover Remortgager Lender Intemediariesbuyer
Advice and a recommendation as towhich mortgage was most suitable for me 35 49 33 29 23 48
Information on different types ofmortgage product but I made the choice 52 41 58 53 59 45
Information on a single product only 11 6 9 17 17 5
Don’t know/not sure 2 4 – 1 1 1
Source: Mortgage Code Compliance Board, Consumer Research Report 2003.
Figures may not sum due to rounding.
FSA Regulation of Advice
4.14 The Government has extended the FSA’s remit to include regulation of mortgage sales from31st October 2004. Following a number of consultations the FSA rules governing the sales processwere published on 15th October 2003. Under the new regime firms can offer consumers tworoutes through the sales process: advised or non-advised. For the purpose of their cost benefitanalysis of mortgage regulation, the FSA assume that 56 per cent of new advances will receiveadvice under the new regime (NERA, 2003, Appendix A).5
30 The Miles Review: Final Report
4 The survey asked borrowers, who had taken out a mortgage in the last 6 months, to identify which level ofservice they had received. Despite a fairly small sample size of 629 respondents, the MCCB considers the resultsto be an accurate reflection of the market.5 The FSA may be taking a cautious approach here and using a figure slightly higher than a central estimate so asnot to underestimate the costs of compliance.

Improving borrowers’ understanding 44.15 The key section covering required conduct for advised sales in the FSA’s rules is the“suitability assessment”. Before recommending a particular mortgage to a customer, firms will berequired to take reasonable steps to ensure that the mortgage is suitable. This section of the rulesis of critical importance not only because it will govern advice that evidence suggests is veryinfluential in borrowers’ decision-making, but it will also be a benchmark in subsequentconsideration of complaints about mis-selling by the Ombudsman.6
4.16 There are three key suitability criteria for a mortgage: (i) that the customer can afford themortgage; (ii) that the mortgage is appropriate to the needs and circumstances of the customer;and (iii) that the mortgage is the most suitable of those that the firm has available.
4.17 To assess the first of these, affordability, a firm should give due regard to;
‘(a) information that the customer provides about his income and expenditure, and anyother resources that he has available;
(b) any likely change to the customer’s income, expenditure or resources; and
(c) the costs that the customer will be required to meet once any discount period in relationto the regulated mortgage contract comes to an end (on the assumption that interest ratesremain unchanged).’7
4.18 And a firm;
‘must explain to the customer that the assessment of whether he can afford to enter into aregulated mortgage contract is based on:
(1) current interest rates, which might rise in the future; and
(2) the customers current circumstances, which might change in the future.’8
4.19 While there is a requirement to consider likely (i.e. predictable) changes in a borrower’sincome in assessing affordability (see (b)), there is no specific requirement to take account ofinterest rate risk in assessing affordability. This seems strange given that interest rate risk is a keyfeature of a mortgage. The rules explicitly state that the assessment of affordability is made atcurrent interest rates (see (c) and (1)).9 There is only the requirement to tell the customer that ratesmight rise. Explicitly stating that the use of current interest rates achieves compliance does notseem consistent with the desirable outcome that advisor and borrower make a measured assessmentof ongoing affordability.
31The Miles Review: Final Report
6 FSA Handbook, DISP 3.8.1 sets out what the Financial Ombudsman Service will take into account inconsidering complaints.7 FSA Handbook, MCOB 4.7.7 E (1).8 FSA Handbook, MCOB 4.7.5 R.9 The FSA’s responsible lending rules cover all sales and require that, before lending, a firm must take account ofa customer’s ability to repay. Guidance on complying with this rule is again explicit that firms should use currentinterest rates in assessing ability to repay. FSA Handbook, MCOB 11.3.5 G (2) (a).
Improving borrowers’ understanding44.20 However, some assessment of risk is a required part of the advice on a suitable mortgage. Inassessing whether the mortgage is appropriate to the needs and circumstances of the customer afirm should, among other things, give due regard to;
‘whether the customer has a preference or need for stability in the amount of requiredpayments, especially having regard to the impact on the customer of significant interest ratechanges in the future;’10
4.21 The interpretation of this rule is central to the effectiveness of the suitability assessment. Akey question is what would count as taking reasonable steps to assess a customer’s preferences orneeds in this regard? Customers need to have some idea of the chances that interest rates mightmove by small or relatively large amounts; many need guidance on what “small” and “large” meanwhen thinking about possible movements in interest rates. It is hard to see how an advisor canassess ‘whether the customer has a preference or need for stability in the amount of requiredpayments, especially having regard to the impact on the customer of significant interest ratechanges in the future’, without giving the customer at least some idea about the risks of interestrates moving by certain amounts over the next few years. Without this customers are not in a goodposition to express an informed preference for, or place a value on, the payment stability offeredby a fixed-rate contract. If the advisor simply tells the customer that interest rates can changesignificantly, both going up and down, most customers would be left little better informed and theadvisor hardly able to judge whether they have a meaningful preference for stability in the profileof mortgage payments.
4.22 Ideally advisors should explain what would happen to the monthly payments of themortgage product for a range of possible interest rate movements, as this would give some ideaabout the scale of risks. Explaining about market expectations of future rate movements and thedegree of uncertainty around such expectations is not easy. There is no single or definitive way ofdoing this. But to make no effort to do so is not desirable. Annex A sets out questions and the sortof illustrative future interest rate scenarios that could be used in assessing borrowers attitudes to therisk of different mortgage products. The projections of the cost of mortgages shown use variouspaths for interest rates: no change; movements in short-term interest rates that are in line withcurrent market expectations and alternative paths based on rate increases and decreases relative tothe central path. The nature of those illustrative paths where rates rise by more or less than expectedare guided by the actual volatility in changes in interest rates over the past fifty years.11 Much of theinformation contained in Annex A would require professional explanation as many consumerscould find some of this information difficult to interpret without help from an advisor. It isimportant that the discussion of uncertainty over interest rates should cover a period considerablylonger than one or two years, the typical length of short-term fixed and discounted variable-ratedeals. Significant interest rate risk will persist until a substantial proportion of the mortgagebalance has been repaid and that will be well beyond two or three years after most mortgages aretaken out.
32 The Miles Review: Final Report
10 FSA Handbook, MCOB 4.7.11 E (1) (d).11 Annex B presents some data on that volatility which is helpful in assessing the sort of alternative paths thatmight be used to illustrate to consumers the scale of interest rate variability.

Improving borrowers’ understanding 44.23 While the FSA’s regulations governing the sale of investment products are generally lessprescriptive than the new mortgage regime, they make understanding of risk absolutely central.Under the investment regime a firm may not recommend a particular transaction;
‘unless it has taken reasonable steps to ensure that the private customer understands thenature of the risks involved.’12
4.24 The final stage of the suitability assessment requires that of all the mortgages identified asbeing appropriate the firm should;
‘recommend the one that is the least expensive for that customer taking into account thosepricing elements identified by the customer as being most important to him.’13
4.25 While this price criterion should only be applied following the steps discussed above, thereis a danger of a simpler interpretation. In the FSA’s final consultation paper on the rules the pricecriterion is described as ‘the default option’ that will ‘allow the advisor to demonstrate compliance’(FSA 2003a, p. 20). Firms will be required to make the case for recommending anything otherthan the cheapest mortgage. In an environment in which some firms may be concerned thatrecommending anything other than a discounted short-term deal with no redemption penaltieslays them open to charges of mis-selling, it is critical that this price criterion is understood as thelikely overall cost, and not simply the lowest cost at current interest rates. A simple price criterioncould only make sense within categories of products – e.g. between different five-year fixed-ratemortgages or between different capped-rate mortgages or between different discounted variable-rate deals that revert to standard variable rate at a given point. But borrowers will naturally wantto trade-off different degrees of nominal payment certainty against initial price.
4.26 Greater clarity in what is required to comply with aspects of the suitability assessment isneeded. Amending the rules so as to make what counts as complying with the suitability assessmentclearer – or issuing guidance upon how the current rules should be interpreted – would bebeneficial for both borrowers and the mortgage industry. Borrowers would benefit from betteradvice on critical aspects of suitability and the industry would gain from the greater certainty overcompliance and less risk of subsequent allegations of mis-selling. A number of lenders andintermediaries recently consulted by the Review have expressed support for guidance on thesuitability assessment.
4.27 There is potentially a danger in overly prescriptive regulation of advice but the issuance ofguidance rather than detailed rules could avoid this. Nonetheless there would be some costs to this.There would be ongoing compliance costs to the industry if the guidance required them to devotemore advisors’ time to the suitability assessment than they otherwise would. The FSA’s cost/benefitanalysis of all the rules governing advice suggests that they will cost the industry around £3.4million annually (NERA, 2003). This assumed that the requirements would add an additional fiveminutes per advised sale by small and medium sized lenders and intermediaries and an additionalthree minutes per advised sale by large lenders and intermediaries. Requiring firms to discussinformation of the sort set out in Annex A could be expected to add an additional few minutes peradvised sale. There could be significant one-off systems costs depending on the precise design of
33The Miles Review: Final Report
12 FSA Handbook, COB 5.4.3.13 FSA Handbook, MCOB 4.7.13 E (1).

Improving borrowers’ understanding4FSA guidance for advising on the impact of possible future changes in interest rates on monthlyrepayments, e.g. whether they should be product specific, frequency for updating forward rates etc.Any changes to the Handbook would be subject to the FSA’s own cost/benefit analysis.14
4.28 Recommendation: that the FSA requires that, to discover consumer attitudes to risk andhence assess a customer’s preferences, it is essential for mortgage advisors to cover personalised“what if” scenarios, of the sort illustrated in Annex A of this Report.
Qualifications for advisors
4.29 It is important that advisors are required to give good advice but also that they have thecompetence to do so. It is critical that advisors themselves understand the risk characteristics of thedifferent products they are recommending. The Mortgage Code Compliance Board (MCCB)currently requires all individuals giving advice to have an accredited professional qualification.Advisors must either hold the Certificate in Mortgage Advice and Practice (CeMAP) or,alternatively, the Financial Planning Certificate (FPC) or Certificate for Financial Advisors (CeFA)and have passed the CeMAP bridge paper or the Mortgage Advice Qualification (MAQ). Thereare approximately 60,000 qualified mortgage advisors in the UK (MCCB, Annual Report 2003).It is a major achievement of the voluntary code that has been in place that so many advisors nowhave accredited professional qualifications.
4.30 The FSA currently maintains a list of “approved qualifications” in its Training andCompetence Sourcebook. The FSA is in the process of changing its rules so that it no longer tellsfirms which examinations advisors must pass; instead a firm must decide for itself whichexamination is appropriate based on the business it undertakes and the needs of its customers. Themost common way that firms will do this is by reference to a list of “appropriate examinations” tobe maintained by the Financial Services Skills Council. The Skills Council sets the NationalOccupational Standard (NOS) for mortgages and lending, which identifies the key areas ofcompetence that advisors need to have; examination providers set the detailed syllabus andstructure of the examinations.15 The Skills Council is currently reviewing both the NOS and theexisting qualifications for mortgage advice. The Skills Council will decide whether the currentqualifications meet the new National Occupational Standard and will produce a list of ‘appropriatequalifications’, which advisors can take to demonstrate competence. The review is scheduled forcompletion in April 2004.16
4.31 Under the ‘provision of the personal mortgage advice’ section of the current NOS one ofthe competence criteria requires that practicioners must:
‘Explain the implications of fixed and variable mortgage repayments so that you canestablish which your customer might prefer’17
34 The Miles Review: Final Report
14 The Financial Services and Markets Act 2000 requires that any guidance on the FSA’s rules must be consultedupon and be subject to cost benefit analysis in a similar way to the rules, FSMA 2000, Section 157.15 The examination providers for these qualifications are: the Institute of Financial Services, the CharteredInsurance Institute and the Chartered Institute of Bankers in Scotland.16 The Qualifications and Curriculum Authority formerly sign off the qualification as being sufficient todemonstrate that the NOS is met. 17 Skills Council For Financial Services National Standards: Mortgages and Lending.
Improving borrowers’ understanding 44.32 However the syllabuses for CeMAP and MAQ pay little attention either to the termstructure of interest rates or to interest rate risk issues. Mortgage advisors need to have anunderstanding of the role of expectations in determining the term structure of interest rates if theyare to advise on the relative value of fixed and variable-rate contracts. They also need to have someknowledge of the potential variability in interest rates and how such variability can affect the futureaffordability of different types of debt.
4.33 As shown in Chart 4.1, one reason why many consumers may underestimate the risk ofvariable-rate mortgages is that they believe that they can switch to a cheaper mortgage, perhaps afixed-rate mortgage, if and when short-term rates start to rise. In order for this strategy to workmovements in long-term rates must lag behind movements in short-term rates or else individualborrowers must have an understanding of the yield curve that allows them to beat the market.Neither condition is likely to be met. Some mortgage advice can be read as advocating the strategyof sticking with variable-rate mortgages and only switching to a fixed rate once variable rates havemoved up. On 8th February, following a rise in the base rate to 4 per cent, a large firm ofintermediaries offered the following comment on the relative value of fixed and variable rates:
“Fixed rates below 5% offer decent value, but are about one point higher than the bestdiscounts. The base rate would have to go to 5% before you’d be better off with a fix.”
4.34 The implication is ambiguous but could be read as saying that the best strategy is to waituntil the base rate is 5 per cent and then switch to a fixed rate. On the same day another prominentfirm advised:
“Even after the rise, the best value mortgages are still trackers and discounted deals. Despitethe likelihood of rates rising further in coming months, most fixed rates look expensive asthey are already priced to reflect the City’s expectations of base rate rising to 4.75 to 5 percent over the next year.”
4.35 Fixed rates on mortgages are always going to reflect yields on bonds and swap rates and sowill invariably reflect the City’s expectations. The quote reflects a particular view about what is“best value”, one which implicitly attaches relatively little weight to the certainty of a paymentprofile. This Review is not suggesting that advisors should try to predict future interest ratemovements. But they should be able to interpret the information that the market provides andexplain to borrowers what is implied by the yield curve (and by forward rates and by futurescontracts) and, as well as giving some notion of market expectations, also give them some ideaabout the scale of the unpredictability of future interest rates.
4.36 Advisors should also understand that a borrower’s ability to service mortgage debt over thelife of the contract is a crucial factor in determining suitability. An important aim of the adviceprocess should be to help consumers assess affordability in an uncertain world; that might usefullybe done by showing how debt servicing burdens could evolve under different interest ratescenarios. Mortgage advice qualifications should require an understanding of how debt servicingburdens could evolve for a typical borrower taking out different types of mortgage contract indifferent interest rate environments, using typical profiles for income growth and loan to incomeratios. The scenarios described in Section 2 of the Interim Report could provide a useful guide forexamining bodies.
4.37 Given that the Skills Council is currently conducting a review of mortgage adviceexaminations and is expected to require a number of more general changes, the additional cost ofincluding these specific topics in the syllabus is likely to be low.
35The Miles Review: Final Report
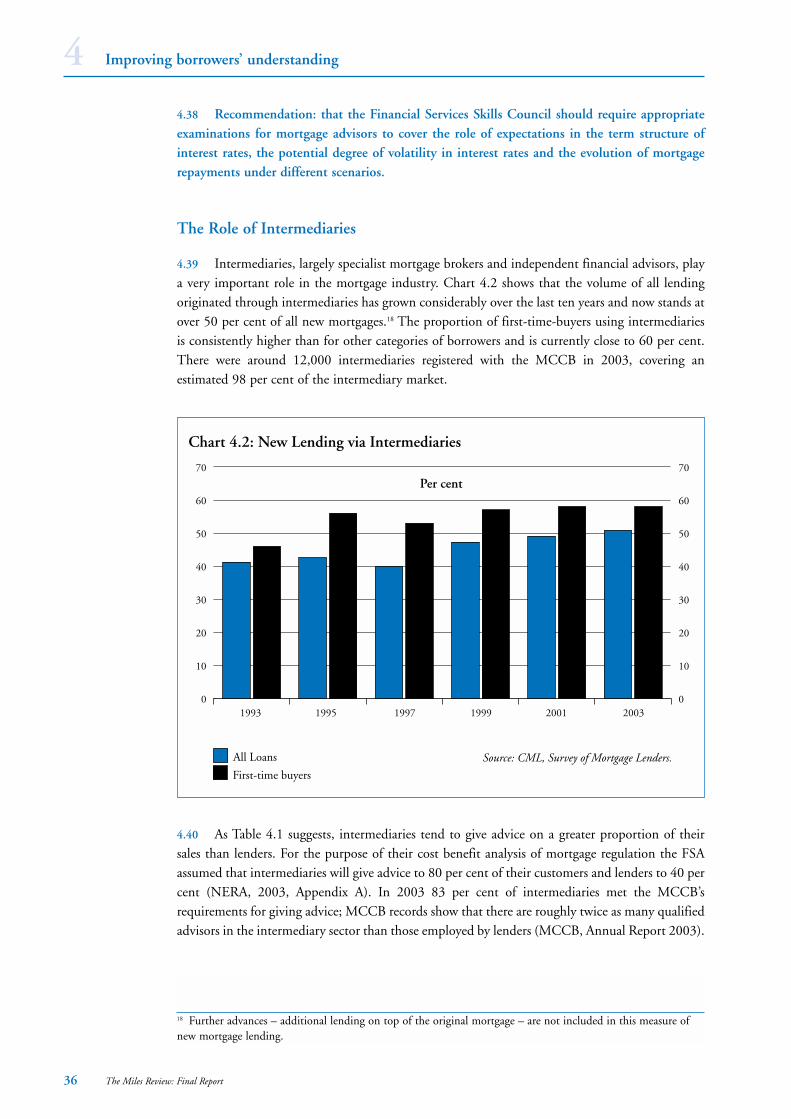
Improving borrowers’ understanding44.38 Recommendation: that the Financial Services Skills Council should require appropriateexaminations for mortgage advisors to cover the role of expectations in the term structure ofinterest rates, the potential degree of volatility in interest rates and the evolution of mortgagerepayments under different scenarios.
The Role of Intermediaries
4.39 Intermediaries, largely specialist mortgage brokers and independent financial advisors, playa very important role in the mortgage industry. Chart 4.2 shows that the volume of all lendingoriginated through intermediaries has grown considerably over the last ten years and now stands atover 50 per cent of all new mortgages.18 The proportion of first-time-buyers using intermediariesis consistently higher than for other categories of borrowers and is currently close to 60 per cent.There were around 12,000 intermediaries registered with the MCCB in 2003, covering anestimated 98 per cent of the intermediary market.
4.40 As Table 4.1 suggests, intermediaries tend to give advice on a greater proportion of theirsales than lenders. For the purpose of their cost benefit analysis of mortgage regulation the FSAassumed that intermediaries will give advice to 80 per cent of their customers and lenders to 40 percent (NERA, 2003, Appendix A). In 2003 83 per cent of intermediaries met the MCCB’srequirements for giving advice; MCCB records show that there are roughly twice as many qualifiedadvisors in the intermediary sector than those employed by lenders (MCCB, Annual Report 2003).
36 The Miles Review: Final Report
18 Further advances – additional lending on top of the original mortgage – are not included in this measure ofnew mortgage lending.
Chart 4.2: New Lending via Intermediaries
Source: CML, Survey of Mortgage Lenders.
0
10
20
30
40
50
60
70
0
10
20
30
40
50
60
70
First-time buyers
All Loans
1993 1995 1997 1999 2001 2003
Per cent

Improving borrowers’ understanding 44.41 The great majority of mortgage intermediaries’ remuneration is paid in the form ofcommission from the lenders to which they refer business. Some intermediaries charge theircustomers a fee in addition or as an alternative. There is little public data on commissions but thosedisclosed in trade publications suggest that commissions tend to take the form of one-off paymentsat the point of sale, typically a proportion of the mortgage advanced, though there is some use offlat fees. There are fairly small differences between commissions for prime market mainstreamproducts. Higher commissions tend to be paid for speciality and sub-prime products. As discussedin the Interim Report, intermediaries have some financial incentive to sell short-term discountedproducts with the prospect of a resale in the near future. Many intermediaries sell other financialproducts to customers at the time when the mortgage is taken out and the sale of the mortgage isseen by some intermediaries as pivotal in the earning of commissions on other products. Many ofthe lenders consulted by the Review believe this incentive to be a key factor in explaining the lackof longer-term fixed-rate lending in the UK. Rejecting this view, some intermediaries consulted bythe Review say that the practice of advisors regularly prompting customers to consider re-mortgaging is not widespread and that high levels of “churn” are customer driven.
4.42 It has been suggested that the use of alternative commission structures could, to somedegree, mitigate problems. Commission that is paid to the intermediary per period that theborrower remains with the lender – so called “trail fees” – could help align intermediaries’incentives with the longer-term interests of both borrowers and lenders. Lenders’ experience is thatintermediaries are often reluctant to accept trail fees, though in present value terms they may beequal in value to up-front fees. Such commission structures have a serious draw back as there isscope for abuse in a market where borrowers are not well informed. Unscrupulous lenders andintermediaries could contract to keep customers on uncompetitive products.
4.43 It has also been suggested that lenders could pay higher levels of commission on longer-termfixed-rate mortgages to overcome this short-term financial incentive faced by intermediaries.However, in a properly functioning market, commission should reflect the cost of services providedby the intermediary – i.e. the cost of advising and selling – and differences in the profitability orexpected profitability to the lender of certain products (taking into account the expected period forwhich the borrower will keep the mortgage) should be reflected in the price of the product to theborrower. Given that the costs of selling a longer-term fixed-rate mortgage are unlikely to be higherthan those for other mainstream prime market products, differences in levels of commission seemunwarranted. Indeed large and unjustified differences in commissions across products could fallfoul of the FSA’s prohibition of inducements rules.19
4.44 Under the FSA’s new regime firms will be required to disclose the level of commissionpayable in the pre-sale disclosure document which sets out the details of the particular product thatthe customer is taking.20 This is helpful though it may not allow the customer to compare theincentive to sell that particular product relative to other products.
37The Miles Review: Final Report
19 FSA Handbook, MCOB 2.3.20 FSA Handbook, MCOB 5.6.113-9.

Improving borrowers’ understanding44.45 The most effective way to overcome the potential financial incentive on intermediaries tosell short-term deals where these would not be most appropriate (discounted variable or short-term fixed) is to issue clear regulations in respect of advising on the likely overall cost and therelative risks of different mortgage products. Guidance on complying with this aspect of theFSA’s suitability assessment would help achieve that (see recommendation in paragraph 4.38).
IMPROVING PRE-SALE DISCLOSURE
4.46 The FSA’s pre-sale disclosure requirements cover all sales, both advised and non-advised.There is a difficult balance to strike in disclosure requirements. There is a need to enhancetransparency, provide written personalised product information, and explain key elements of themortgage product. The difficulty is that consumers, understandably, tend to have a limited appetitefor such information. The FSA has extensively researched the presentation of disclosure forms toensure that information is given in a digestible and concise manner. The pre-sale disclosure formis the key disclosure document that firms must send to customers once a particular product(s) hasbeen selected. It sets out the principal terms of that mortgage(s).
4.47 Figure 4.1 reproduces sections from an FSA illustration of the pre-sale disclosure form fora variable-rate, interest-only mortgage. The form highlights the annual percentage rate (APR) as asummary measure of the overall cost of a mortgage of £90,000. Related pieces of information oncost, the total amount you must pay back over the life of a mortgage and the amount repaid perpound borrowed, are shown. For variable-rate mortgages all these calculations are made using thecurrent interest rate.21 Borrowers are encouraged to use the APR as the relevant number forcomparison of the cost of mortgages. Warnings that these numbers will change following interestrate changes and that comparison should only be made with other repayment or interest-onlymortgages are given (see box 5). The number of payments and the amount to be paid each monthis also presented (see box 6).
Figure 4.1 Extract from FSA pre-sale disclosure form
5. Overall cost of this mortgage
The overall cost takes into account the payments in Sections 6 and 8 below. However, it excludes any payments that youmay need to make into a separate savings plan, to build up a lump sum to repay the amount borrowed, but assumes thatyou pay off the amount borrowed as a lump sum at the end of the mortgage.
The total amount you must pay back, including the amount borrowed is £207,534
This means you pay back £2.30 for every £1 borrowed
The overall cost for comparison is 5.4% APR
The figures in this section will vary following interest rate changes and if you do not keep the mortgage for 25 years.
Only use the figures in this section to compare the cost with another interest-only mortgage.
38 The Miles Review: Final Report
21 If it is a discounted product where the level of mortgage payments is calculated from a standard variable-rateafter the initial discount, the APR and other calculations are based on the current SVR.

Improving borrowers’ understanding 46. What you will need to pay each month Monthly payments
This illustration is based on a loan amount of £90,300, and includes the fees that are shown in Section 8 as being added toyour mortgage, and assumes that the mortgage will start on 31st January 2004.
60 payments at a variable rate currently 3.99% £300.25
Followed by:
240 payments at a variable rate currently 5.49% £413.12
Cost of repaying the capitalYou will still owe £90,300 at the end of the mortgage term. You will need to make separate arrangements to repay this.When comparing the payments on this mortgage with a repayment mortgage, remember to add any money that you mayneed to pay into a separate savings plan to build up a lump sum to repay this amount.
Savings plan that you do not have to take out through [this particular lender/broker] Monthly payments
(see separate key features document) £120.00
What you will need to pay each month including the cost of a savings planto repay the capital
60 payments at a variable rate currently 3.99% £420.25
Followed by:
240 payments at a variable rate currently 5.49%. £533.12
Reproduced from FSA illustration.
4.48 It would be natural for borrowers to focus on APR and the related calculations in comparingfixed and variable-rate mortgages. The APR figure is described as a measure of ‘the overall cost forcomparison’ of different mortgages. The APR figures are helpful in showing the impact of fees andother costs on the overall cost of debt. But they are not helpful in assessing the relative merits ofmortgages with very different risk characteristics. It is understandable that the FSA places emphasison such calculations, though they may encourage people to think of the cost of variable-ratemortgages based on unchanged short-term interest rates as a reasonable measure of the overalllikely cost of a mortgage. This is a further reason why the suitability assessment should ensure thatborrowers understand the sort of uncertainty over re-payment profiles they may be facing.
4.49 The FSA has adopted a standardised measure of APR, adapted from that defined in theConsumer Credit Regulations 1980, to be used in mortgage promotions, comparative tables etc.as well as in the pre-sale disclosure form.22 While APR calculations for products within the scopeof the Consumer Credit Directive have been standardised by an APR directive,23 the FSA is free toadopt a measure suitable for mortgage products and it consulted on the calculation of APR formortgages in 2001 (FSA, 2001a).
4.50 A potentially more informative measure of APR could be calculated based on expectedinterest rates over the life of the debt. This would provide a better figure for comparing the likelycost of variable-rate mortgages with fixed-rate mortgages; it could be used instead of, or in additionto, the standard APR. Such a figure could be based on the forward rates implied by the yield curve.The Bank of England publishes implied forward rates on a daily basis and these could be used as
39The Miles Review: Final Report
22 FSA Handbook, MCOB 10.23 Council Directive 90/88/EEC.

Improving borrowers’ understanding4a standardised source for calculating expected APR.24 Of course focusing on a single number forthe comparison of mortgages with different risk characteristics is always unsatisfactory and there isno substitute for looking at different possible scenarios.
4.51 The systems costs to firms in having to make a calculation based on forward rates on a dailybasis to include in all mortgage material would be significant. Borrowers may find the numberdifficult to understand. There is considerable evidence of borrowers misunderstanding APRcurrently (FSA 2001a, Annex A). Complicating the calculation further could lead to greaterconfusion.
4.52 It may be preferable to balance the information contained in the APR with separateinformation about interest rate changes. The FSA goes some way towards this in the pre-saledisclosure form by stating in cash terms the effect of a 1 percentage point rise in interest rates onthe monthly payment, see Figure 4.2. This is helpful. But there is no indication of how likely it isthat rates could move by one percentage point or by two percentage points or more. The FSA’sconsumer research which tested how borrowers would interpret this 1 percentage point warningfound that some respondents, ‘could not imagine that an increase of 2 % or more could ever occur’(FSA, 2002b). Given the strong evidence from many sources of a lack of understanding of interestrate risk, and the emphasis on APR calculations based on current interest rates in the pre-saledisclosure document, it would be helpful to strengthen the interest rate risk warning by givingsome indication of the possible magnitude of change.
Figure 4.2 Extract from FSA pre-sale disclosure form
7. Are you comfortable with the risks?
What if interest rates go up?The monthly payments shown in this illustration could be considerably different if interest rates change.■ For example, for one percentage point increase in [Lender’s] standard variable rate, your monthly payment will increase
by around £75.
RATES MAY INCREASE BY MUCH MORE THAN THIS SO MAKE SURE YOU CAN AFFORD THEMONTHLY PAYMENT
Reproduced from FSA illustration.
4.53 Over the last 50 years the standard deviation of the change in base rates over a two-yearhorizon is around 3 percentage points; over the last 10 years that standard deviation is 1.7percentage points (see Annex B). Given that a large proportion of mortgage debt will still beoutstanding after two years it may be sensible to show the typical variability in base rates over alonger period. The precise wording and design of the warning is a matter for the FSA and shouldbe informed by their consumer research work. There is evidence that showing the impact of achange on the specific product’s monthly payment is an effective way to deliver the message (FSA,2000a).
40 The Miles Review: Final Report
24 The Bank of England’s government liability nominal yield curves are derived from UK gilt prices and GeneralCollateral (GC) repo rates. Forward rates are the interest rates for future periods that are implicitly incorporatedwithin today’s spot interest rates for instruments of different maturities. For products where the rate of interest isat the lender’s discretion the calculation would need to assume a spread over the forward rate, the current spreadover the base rate would seem to be the most sensible assumption.

Improving borrowers’ understanding 44.54 The FSA has produced a generic consumer information sheet on mortgage risks, which isavailable on the FSA website. Among other things this short leaflet gives a clear explanation of theimpact of a range of changes in interest rates on mortgage payments and draws attention to historicvolatility in rates. It is to be expected that this leaflet will have a low circulation among borrowers.If this type of valuable information was included in the pre-sale disclosure form, and hence waspersonalized, it would be more likely to be read.
4.55 The compliance costs of making this change to the pre-sale disclosure form would likely below but not insignificant. While firms’ systems are likely to be able to cope with such minorchanges to text, undertaking an additional simple calculation will create additional cost.
4.56 Recommendation: that the FSA requires that, in addition to the current warning, a clearindication of variability in rates over the past, and the impact of such variability on mortgagemonthly repayment, is shown in the pre-sale disclosure form.
4.57 Recommendation: that the FSA revises its mortgage information leaflet to include, in aconsumer friendly style, the type of information contained in Annex A and that it engages withthe Council of Mortgage Lenders, the Association of Mortgage Intermediaries and otherstakeholders to identify the most effective distribution method. It may be that the most effectivetime and method of distribution is along side the Initial Disclosure Document which firms will berequired to send to customers before they apply for a mortgage. If customers receive the leaflet earlyin the sales process there is a greater chance of it informing their decision-making.
IMPROVING FINANCIAL CAPABILITY
4.58 The most effective way to improve households’ understanding of mortgages, and financialproducts in general, is to improve their own ability to make informed financial decisions. Researchby the Financial Services Consumer Panel reveals a low level of financial literacy in the UK: twothirds of consumers think that financial matters are ‘too complicated for them’ and that they donot know enough to choose suitable financial products (FSA, 2002). Addressing low levels offinancial literacy is made more difficult by low levels of numeracy in the UK. Research carried outby the Office of National Statistics found that half the adult population in the UK had anunderstanding of numerical concepts that did not go beyond simple addition and subtraction,meaning that they were unable to understand percentages and other concepts vital for financialliteracy (ONS, 1997). Lack of financial literacy is a problem across all of the retail financial servicesindustry. It is very relevant in the mortgage market due to the scale and longevity of thecommitment borrowers are typically taking on. There is much evidence of short-termism and alack of consumer understanding of the risk characteristics of different mortgage products.
4.59 There are a large number of organisations, including some from the mortgage industry,involved in initiatives to improve financial literacy in the UK. The FSA has recently taken the leadin developing a national strategy for financial capability and has set up a steering group comprisingsenior representatives from the financial services industry, consumer bodies and the Government.The Financial Capability Steering Group is expected to publish its strategic priorities in Spring2004. The scope of this FSA led strategy covers the delivery of financial education to consumersto help them identify and address their financial needs; the provision of targeted, digestible, printedinformation delivered at the appropriate time and place; and whether, and if so how, a genericadvice service could be provided (FSA, 2003b).
41The Miles Review: Final Report

Improving borrowers’ understanding44.60 Much of the research on, and discussion of, the level of financial literacy in the UK hasfocused on the implications for savings, pensions and unsecured debt markets. Implications for themortgage market have received relatively little attention. The lack of longer–term financialplanning and provisioning has been considered in some detail in the context of savings andpensions markets. The tendency for consumers to focus on the initial cost of debt has beenconsidered with respect to unsecured borrowing. But the lack of consumer understanding of therisk characteristics of different mortgage products has received little attention. If consumersunderstood the concept of risk and return better, benefits would accrue across a wide range of retailfinancial markets, and that would most certainly include the mortgage market.
4.61 The Citizens Advice Bureau puts the ability to, ‘choose between types of mortgage’ and ‘theability to look ahead and take account of whether future interest rate changes make a fixed ratesavings or borrowing product a better option than a variable rate alternative’ among its keyrequirements for financial literacy (NACAB, 2001). In setting out its 2004-05 priorities forfinancial capability the FSA draws attention to a lack of consumer understanding of the risks ofmortgage borrowing (FSA, 2004-05 Business Plan).
4.62 Recommendation: that the Financial Capability Steering Group includes improvingconsumers’ understanding of the risks of mortgage borrowing among its strategic priorities.
4.63 The Financial Capability Steering Group is also considering how its strategy can best befunded. Funding will need to come from a number of sources, and is likely to include an increasedcontribution from the FSA’s budget.
4.64 In contemplating the scale of funding required, a comparison can be made betweenresources for enhancing financial capability and recent trends in advertising by financial servicesfirms – some of which the FSA believes could be adding to the challenge of promoting consumerunderstanding (FSA, 2004). In the 2004 Financial Risk Outlook the FSA points out that firmsadvertising ways in which households can access credit tends to ‘highlight how cheap andaffordable the debt is in the short term’, and that this is ‘unlikely to help consumers understandissues such as the long-term affordability of debt’ (FSA, 2004). Chart 4.3 shows the growth inadvertising spend in recent years by the UK financial services industry.
42 The Miles Review: Final Report

Improving borrowers’ understanding 4
4.65 Total spend on advertising was around £1.8 billion in 2002. The most significant growthover the last two years has been in advertising of mortgages, credit cards and personal loans(spending was around £1 billion in 2003). The FSA’s total budget for consumer relations work in2003-04 was less than £10 million.
4.66 Recommendation: that the Financial Capability Steering Group seeks to increase thefinancial resources dedicated to improving financial capability and that part of that fundingcomes from a levy on the financial services industry.
43The Miles Review: Final Report
Chart 4.3: Financial services advertising expenditure in the UK
1 Including life assurance, deposit accounts and pensions.2 Including current accounts and debit cards.Source: Thompson Intermedia.
0
100
200
300
400
500
600
700
800
900
1000
0
100
200
300
400
500
600
700
800
900
1000
Financial advice
Banking services and general advertising2
General insuranceSavings & investments1
Mortgages, credit cards and personal loans
Sept03
June03
March03
Dec02
Sept02
June02
March02
Dec01
Sept01
June01
March01
Dec00
Sept00
£ million, 12-month running total

44 The Miles Review: Final Report

The Miles Review: Final Report 45
5 Fairer pricing in the UK
5.1 Competitive pressures on lenders shape both the pattern of pricing in the UK mortgagemarket and the nature of products offered. Lenders in the UK face intense competition for newbusiness and are under pressure to create products that match the perceived needs of borrowers –even when those perceptions may not always fully reflect people’s real interests. The structure ofpricing and the range of products reflects this competition – which in itself is desirable – but it mayalso reflect the tendency of many borrowers to focus excessively on the level of the initial paymentsand insufficiently on the range of possible repayment costs some years ahead. This section re-examines the evidence presented in the Interim Report and it reflects the considerable consultationthat followed it. This section describes recommendations for how some of the undesirable featuresof pricing in the mortgage market may be removed, or at least reduced.
THE CURRENT STRUCTURE OF PRICING IN THE UK
5.2 Table 5.1 gives an indication of the pricing of a range of mortgage products in the UKmarket in February 2004 (figures for October 2003 are shown in Table 5.1 of the Interim Report).The underlying data are from the Financial Services Authority (FSA) comparative tables whereproducts offered by most UK lenders are listed. The first row shows the average rate charged ondiscounted variable-rate mortgages. These are mortgages with no overhanging redemption charges– borrowers can remortgage without any redemption charge at the end of the discount period. Thediscounts are available for two years after which borrowers would usually move onto the StandardVariable Rate (SVR) of the lender. These are mortgage products that have become increasinglypopular in recent years. The second row shows pricing of variable-rate mortgages where there is noinitial discount; here borrowers would not move onto the SVR after an initial period. Just over halfof these mortgages were tracker mortgages where the rate charged is at a fixed margin over areference rate, usually the base rate.
Table 5.1: Pricing of mortgages – February 2004
Mortgage LIBOR/Swap Difference Arrangement Number of Number below Cheapest deal
rates (%) rates (%) (%) fees (£) products LIBOR/Swap rate per product (%)
Discounted Variable 3.96 3.92 0.04 322 39 21 3.39
Variable-rates for term 4.64 3.92 0.72 160 44 0 4.05
Standard Variable-rate 5.58 3.92 1.66 – 79 0 4.30
2 year fixed 4.97 4.77 0.20 325 43 19 4.24
5 year fixed1 5.34 5.01 0.33 327 41 8 4.80
10 year fixed2 5.65 5.11 0.54 357 13 0 5.19
25 year fixed3 5.89 5.14 0.75 397 2 0 5.781 spread over four year swap – chosen because amortisation makes the 5 year swap somewhat too long for a benchmark maturity.2 spread over seven year swap – chosen because amortisation makes the 10 year swap substantially too long for a benchmark maturity.3 spread over ten year swap – in the US thirty year fix rate amortising mortgages are generally priced off 10 year swap rates.
Source: FSA comparative tables – 3/2/2004, Bank of England.

Fairer pricing in the UK55.3 The third row shows the Standard Variable Rate of a sample of over 70 lenders. The finalrows show data on fixed-rate deals of various lengths: two, five, ten and 25 years. As with thevariable-rate mortgages described above these products do not have overhanging redemptioncharges.
5.4 Table 5.1 presents a snapshot picture of pricing in the UK market; the figures reflect ratesreported on the FSA comparative tables on 2nd February 2004. In February new borrowers couldchoose from a great many discounted variable-rate deals that offered them mortgages with sub-LIBOR initial rates of interest. Over half of the discounted deals had interest rates under the one-month LIBOR rate of 3.9 per cent. Several deals were at initial rates well under 3.75. The averageof the rates charged on these discounted deals was close to LIBOR. Two-year fixed-rate deals werealso priced a little over two-year swap rates. If we take money market rates of interest as anindication of the marginal cost of funds, these discounted and two-year fixed-rate deals seem tooffer lenders little in the way of a profit margin. Lenders could earn almost the same rate of interestas they were receiving on discounted and two-year fixed-rate mortgages by lending in the moneymarkets – without the costs associated with marketing and administering mortgages.1 It is plausiblethat a majority of lenders whose rates are reported in the FSA tables were making a loss on theirdiscounted and two-year fixes over the periods of the discounts and the fixed rates.
5.5 European Economics (1999), in a report for the FSA on the compliance cost of extendingfinancial regulation to mortgage advice, found that ‘one industry source estimated margins on newmortgage advances to be typically around 0.4 per cent too low to cover costs.’ Margins below costhad been supported by ‘a proliferation of upfront charges and redemption penalties’ and a ‘cross-subsidy from existing borrowers, who may face rates one percentage point higher than newborrowers.’ Both the two-year fixed-rate mortgages and the discounted variable-rate mortgagesreported in Table 5.1 have no overhanging redemption penalties; both products generally switchedonto the lender’s Standard Variable Rate after two-years. At this time the spread of the averageStandard Variable Rate over one-month LIBOR was 166 basis points, though the majority ofSVR’s were closer to 200 basis points over LIBOR.
5.6 It is hard to escape the conclusion that many lenders are continuing to offer new borrowersmoney at rates that could only make commercial sense if they were either subsidised by existingcustomers already paying the Standard Variable Rate (SVR) or if there was an expectation that asubstantial proportion of those taking the low initial rates would subsequently switch onto theSVR, despite there being no overhanging redemption charges.
5.7 Variable-rate mortgage products where there was no switch onto a Standard Variable Ratewere, on average, priced at around 72 basis points over one-month LIBOR. No lender offered arate below LIBOR on such deals.
5.8 Long-term fixed-rate deals, where the prospect of a borrower switching onto a StandardVariable Rate is remote, were priced at a margin over comparable swap rates of between 54 basispoints (for 10 year fixes) and 75 basis points (for 25 year fixes). These spreads are higher than thosereported in the Interim Report for October 2003 when spreads were 32 basis points and 46 basispoints respectively. But the margin on ten-year fixed-rate products remains less than that on thevariable rate for term. This margin on ten-year fixed-rate deals – of just over 50 basis points – needsto cover the costs of administering loans over a sustained period and generate a profit margin. Since
46 The Miles Review: Final Report
1 Lenders tend to charge arrangement fees to borrowers on mortgages and so might create a small margin overthe marginal cost of funds in that way. Arrangement fees also need to pay towards the costs of marketing,arranging and servicing mortgages.

Fairer pricing in the UK 5the longer-term fixes typically had early redemption charges the value of the option to prepay themortgages – which is expected to be reflected in the margin over swap rates – may have been fairlysmall. But it was not zero and still had to be covered by a spread of between 50 and 75 basis points.
5.9 The implications of the figures in Table 5.1 is that even though some lenders were settingthin margins on some longer-term fixed-rate deals, the margins on discounted deals and on two-year fixes (which for many lenders are effectively a form of discounted lending with the prospectof borrowers moving on to SVR in two years) were very much lower. The two-year discounteddeals are likely to be very attractive to borrowers focusing on the scale of their initial repaymentson mortgages. The two-year discounted deals are probably only feasible because a substantial gapexists between such rates and the Standard Variable Rate – a gap of over 180 basis points for manylenders. The substantial number of borrowers paying Standard Variable Rates – a group that maycurrently constitute more than a third of all borrowers and a little over 20 per cent of all mortgageloans outstanding – allows pricing of this sort to be feasible. Not all of those paying SVR will havereceived a discount in the past and many of those that did will not have received a discount (relativeto SVR) as large as that which current new borrowers can get. So there is an element of cross-subsidisation from some (and probably the majority) of existing payers of SVR to new borrowers.Within a particular group of new borrowers with discounted variable-rate mortgages there will alsobe an element of cross-subsidisation from those who remain on the SVR after the discount periodis over and to those that are quick to move to another product paying less than SVR. So there aredifferent types of cross-subsidisation going on. But what is not in any doubt is that we have astructure of pricing in the UK where it is common for two borrowers with the same lender to endup paying substantially different prices for essentially the same commodity – an amount borrowedagainst the collateral of a residential property. In fact the degree of difference is underestimated bya simple focus on the mortgage interest rate since those paying SVR tend to have lower loan-to-value and lower loan-to-income ratios that those on discounted variable rates and so on a risk-adjusted basis the price difference is higher than suggested by Table 5.1.
5.10 The Building Societies Association as part of their submission to the Final Report makethe following observations on the structure of pricing and of the analysis of it in the InterimReport:
‘It is of course possible that there is no, or little, cross-subsidisation between new andexisting customers and that, rather, cross-subsidisation takes place within an individualmortgage account. It could be argued that most customers of building societies and otherlenders who are currently on a standard variable rate (SVR) previously obtained adiscount, the discounts merely representing a shift, within the mortgage repaymentperiod, of interest payments. Clearly, such arrangements would reflect the income profileof some borrowers. However, the Association can offer no evidence that those currentlypaying the SVR enjoyed a discount broadly equivalent to the ‘excess’ they are currentlypaying and in any case there are no arrangements in place in any building society – or anyother lender – to ensure that once a discount has been ‘repaid’ the borrower is moved onto a lower rate. Accordingly, building societies support the view that cross-subsidisationof the type described in the report is likely to be occurring (in many but not all lenders)and is undesirable.’
5.11 This apparent cross-subsidisation, which in itself is undesirable, has as a side effect thatlonger-term fixed-rate mortgages with flat repayment schedules – where sustainable margins overthe marginal cost of funds are unlikely to be under 50 basis – appear expensive.
47The Miles Review: Final Report

5.12 It is important to be absolutely clear about what is, and what is not, problematic with thepattern of pricing in the UK. Mortgages whose initial monthly payments are lower than they laterbecome are not undesirable. Far from it. In an environment where many people are creditconstrained and where many hope – but cannot be sure – that their incomes will be higher in thefuture then there are advantages in having the profile of payments gently rise. But how the profileof payments can rise needs to be transparent. How such mortgages are made commercially viableshould not rely on price discrimination and cross-subsidisation. If those low initial payments canrise both as a result of a planned rise in the margin over money market rates and because of a risein the general level of market rates then the risks need to be well understood. It is very clear thatthese conditions do not generally exist now in the UK mortgage market.
SUSTAINABILITY OF THE CURRENT PATTERN OF MORTGAGEPRICING
5.13 The aggregate amount of cross-subsidisation depends on the relative prices of differenttypes of debt and on the number of borrowers on the different mortgage deals. If the number ofpeople on SVR is insignificant, or is likely to fall rapidly, then the aggregate impact of cross-subsidisation is likely to be small or at least become so. In that case there would be more limitedscope for lenders to offer large “upfront” discounts to attract new borrowers. Alternatively, if theproportion of borrowers on SVRs was large, and the stock of their debt was significant and likelyto remain so, the pattern of pricing, with high margins on SVR, could continue to have a sizeableimpact on the market.
5.14 An important aspect of the mortgage market in recent years has been the substantialgrowth in remortgaging (see Chart 5.1). The chart underestimates the extent of people switchingtheir mortgage as the figures do not include cases where the borrower moves to a new deal withtheir existing lender. The number of borrowers remortgaging has increased for a number of reasons.First, the margin of SVR over LIBOR has risen over recent years from around 100 basis points inSeptember 1996 to an average of around 170 basis points in February 2004. Over half of lendershad SVRs in excess of 180 basis points over LIBOR (the median was 182 basis points) in February2004. This compares with a substantial number of short-term deals where the interest rate is close
Fairer pricing in the UK5
48 The Miles Review: Final Report
Chart 5.1: Remortgaging as a proportion of mortgage stock
Source: Council for Mortgage Lenders, Bank of England
0
2
4
6
8
10
12
14
16
Per cent
1993 1994 1995 1996 1997 1998 1999 2000 2001 2002 2003
0
2
4
6
8
10
12
14
16

Fairer pricing in the UK 5to LIBOR or to the relevant swap rate and where there are no redemption charges at the end ofthe deal. Borrowers paying SVR therefore have significant financial incentives to remortgage –though some may face considerable costs in doing so. Second, remortgaging has been encouragedby the fall in base rates since 2001 that has enabled a number of borrowers to increase their debtwhile reducing or maintaining the level of their current monthly payments. Third, the rise in houseprices has substantially increased existing borrowers’ equity in their houses. A significant numberof borrowers have sought to extract some of their housing equity gains.2 Finally, the sharp growthin the use of intermediaries has facilitated the growth in remortgaging.
5.15 Despite the growth in remortgaging the proportion of loans on SVR remains significant.Data from CACI presented in Tables 5.2 and 5.3 show that just under 35% by number and 21%by value of the mortgage book were on SVR in December 2003. (These numbers are lower thanthose reported in the Interim Report since when CACI have reclassified some mortgages afterconsultation with lenders. There remains considerable uncertainty about the proportion ofmortgages paying Standard Variable Rates or close to it).
Table 5.2: Proportion of mortgage stock by category of mortgage product – number
1998 1999 2000 2001 2002 2003
per cent per cent per cent per cent per cent per cent
Variable1 64 61 52 44 39 35
Discounted 12 14 15 18 21 18
Capped 4 5 6 6 3 2
Fixed 19 20 20 21 20 25
Tracker 0 0 7 9 14 17
Other 1 0 0 1 2 3 1 Includes premuim rate mortgages (which do not include sub-prime or buy-to-let mortgages) that pay higher rates than Standard Variable Rates.
Source: CACI Mortgage Market Database.
Table 5.3: Proportion of mortgage stock by category of mortgage product – value
1998 1999 2000 2001 2002 2003
per cent per cent per cent per cent per cent per cent
Variable1 52 48 40 32 27 21
Discounted 16 18 19 23 26 22
Capped 4 6 7 7 4 2
Fixed 26 27 26 27 25 32
Tracker 0 1 9 10 16 20
Other 1 1 0 1 2 3 1 Includes premuim rate mortgages (which do not include sub-prime or buy-to-let mortgages) that have higher interest rates than Standard Variable Rates.
Source: CACI Mortgage Market Database.
5.16 The “back book” of borrowers paying SVR has halved by number and more than halvedby value over the last six years. But although a smaller proportion of borrowers are paying SVRthan before, the funds generated by each SVR mortgage – over and above money market rates(LIBOR) – are greater as the margin has risen over time. Chart 5.2, using data from the Bank ofEngland, shows how the margin on SVR mortgages over LIBOR has widened since 1995.
49The Miles Review: Final Report
2 Mortgage equity withdrawal has risen from £0.2 billion in 1998 to a little under £50 billion in 2003.
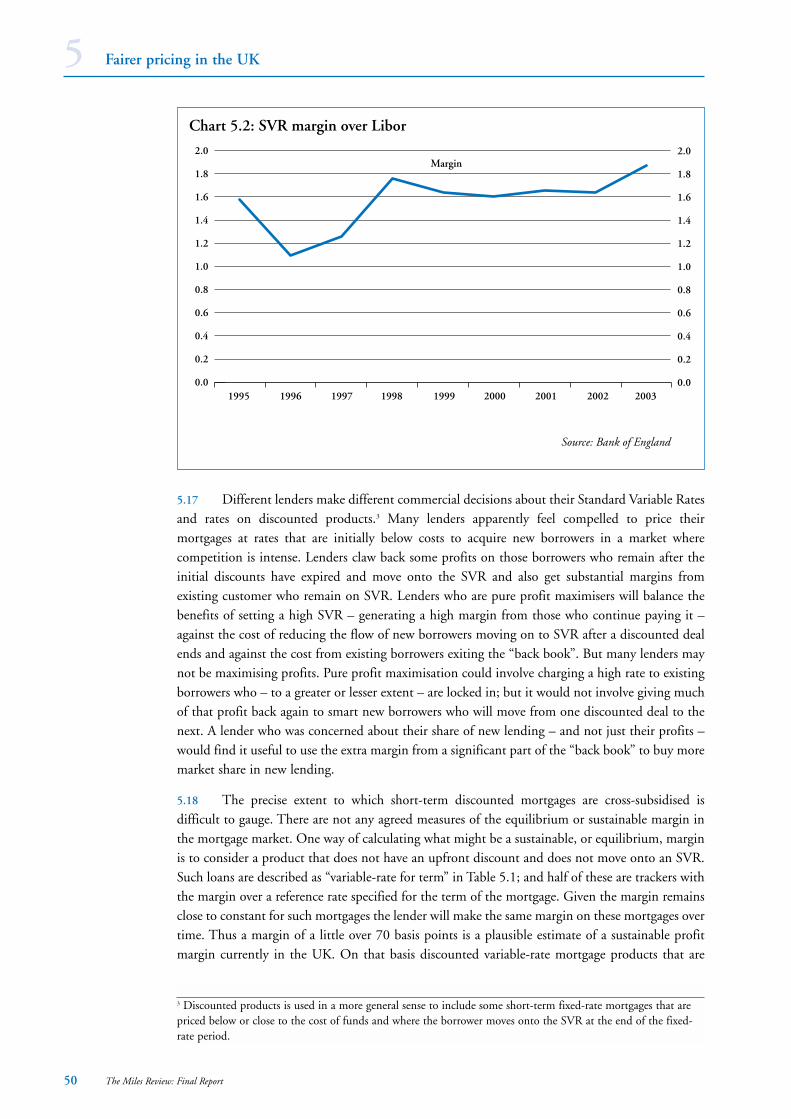
5.17 Different lenders make different commercial decisions about their Standard Variable Ratesand rates on discounted products.3 Many lenders apparently feel compelled to price theirmortgages at rates that are initially below costs to acquire new borrowers in a market wherecompetition is intense. Lenders claw back some profits on those borrowers who remain after theinitial discounts have expired and move onto the SVR and also get substantial margins fromexisting customer who remain on SVR. Lenders who are pure profit maximisers will balance thebenefits of setting a high SVR – generating a high margin from those who continue paying it –against the cost of reducing the flow of new borrowers moving on to SVR after a discounted dealends and against the cost from existing borrowers exiting the “back book”. But many lenders maynot be maximising profits. Pure profit maximisation could involve charging a high rate to existingborrowers who – to a greater or lesser extent – are locked in; but it would not involve giving muchof that profit back again to smart new borrowers who will move from one discounted deal to thenext. A lender who was concerned about their share of new lending – and not just their profits –would find it useful to use the extra margin from a significant part of the “back book” to buy moremarket share in new lending.
5.18 The precise extent to which short-term discounted mortgages are cross-subsidised isdifficult to gauge. There are not any agreed measures of the equilibrium or sustainable margin inthe mortgage market. One way of calculating what might be a sustainable, or equilibrium, marginis to consider a product that does not have an upfront discount and does not move onto an SVR.Such loans are described as “variable-rate for term” in Table 5.1; and half of these are trackers withthe margin over a reference rate specified for the term of the mortgage. Given the margin remainsclose to constant for such mortgages the lender will make the same margin on these mortgages overtime. Thus a margin of a little over 70 basis points is a plausible estimate of a sustainable profitmargin currently in the UK. On that basis discounted variable-rate mortgage products that are
Fairer pricing in the UK5
50 The Miles Review: Final Report
Chart 5.2: SVR margin over Libor
Source: Bank of England
0.0
0.2
0.4
0.6
0.8
1.0
1.2
1.4
1.6
1.8
2.0
1995 1996 1997 1998 1999 2000 2001 2002 2003
Margin
0.0
0.2
0.4
0.6
0.8
1.0
1.2
1.4
1.6
1.8
2.0
3 Discounted products is used in a more general sense to include some short-term fixed-rate mortgages that arepriced below or close to the cost of funds and where the borrower moves onto the SVR at the end of the fixed-rate period.

Fairer pricing in the UK 5priced at close to the cost of funds appear to be priced initially at around 70 basis points below asustainable margin. Those paying SVR are paying, on average, about 100 basis point above anequilibrium price, though in many cases it is 130 basis points.
5.19 Lenders have increasingly marketed tracker mortgages, where the rate of interest is set at amargin over a reference rate (usually the base rate), to compete for new borrowers. There isconsiderable variation in the margin of trackers over the reference rate. Tables 5.2 and 5.3 showthat the number of tracker mortgages has risen rapidly from close to zero in December 1999 toaround 20 per cent in December 2003. Trackers are a mixture of ‘stepped-rate’ products withoverhanging redemption penalties, trackers that run for a period of between two to five years beforethe borrowers moves onto the SVR of the lender and trackers for the term of the mortgage.Ignoring “stepped trackers”, which have low initial rates followed by a period of higher rates, 10per cent of trackers were priced below the money market cost of funds and none were availablebelow base rates. A little under half of these mortgages offer flexible features including the abilityto make over and under-payments and take payment holidays.
5.20 Despite the rapid growth in remortgaging the proportion of borrowers on discounteddeals has actually fallen between December 2002 and December 2003. This is partly explained bythe growth of fixed-rate lending, the vast majority of which is short-term deals. There has been aslight narrowing in the margin between LIBOR and discounts offered on short-term variable andfixed-rate deals since October 2000. Table 5.4 shows the pricing of mortgages for the ten largestlenders at October 2000 and February 2004. Over this period the average margin below LIBORfor discounted variable-rate deals, shown in the first two rows, fell from 25 basis points in October2000 to zero. The average margin on short-term fixed-rate deals over the two-year swap rate, shownin the third and fourth rows, has risen from around three basis points to around 18 basis points.The reduction in discounts may reflect both the slight increase in the take up of discounted dealsbetween 2000 and 2003 and the significant fall in the amount of the mortgage book that remainson the SVR – both factors may have reduced the scope to offer initial discounts. But the impactof falling numbers on SVR has been partially offset by a rise in the average margin of SVR overLIBOR over the same period – from about 150 to about 170 basis points.
Table 5.4: A comparison of changing mortgage pricing for the ten largest lenders
Mortgage LIBOR/Swap Difference Number of Number below Cheapest deal
rates (%) rates (%) (%) products LIBOR/Swap rate per product (%)
Discounted Variable
October 2000 5.85 6.10 -0.25 8 6 5.55
February 2004 3.91 3.92 -0.01 8 5 3.64
Standard Variable Rate
October 2000 7.59 6.10 1.49 10 0 6.75
February 2004 5.58 3.92 1.66 10 0 4.89
2 year fixed
October 2000 6.25 6.20 0.03 7 3 5.54
February 2004 4.93 4.75 0.18 10 3 4.68
Source: FSA comparative tables – 3/2/2004, Bank of England; Moneyfacts October 2000
51The Miles Review: Final Report

Fairer pricing in the UK5COMPETITION IN MARKETS WITH SWITCHING COSTS ANDIMPERFECT INFORMATION
5.21 The current structure of pricing of many lenders depends on the extent to whichhouseholds face switching costs and the degree to which borrowers are informed when makingdecisions. Where switching costs are significant, firms have incentives to use loss-leading discountsto gain market share. Lenders make profits on those borrowers who automatically move on tohigher rates after the discount period is over and stay there, either due to switching costs orimperfect information. Although most discounted deals offered by lenders no longer haveredemption charges that overhang the discount period, a number of borrowers will not move theirloan and consequently pay a relatively high mortgage rate that is now typically around 180 basispoints over LIBOR. The existence of switching costs or imperfect information therefore enablesmany lenders to offer extremely fine margins on short-term deals with higher prices later on forborrowers who do not switch to another deal. Lenders who deviate from this pattern of pricingmay face difficulty attracting new customers since their ability to offer discounts is reduced.
Switching Costs
5.22 A recent Office of Fair Trading report (OFT, 2003) defined switching costs as ‘a costincurred by changing supplier that is not incurred by remaining with the current provider’. Theremay also be significant switching costs in changing products with the same supplier. The effect ofswitching costs is to allow lenders to charge a higher interest rate to existing borrowers; whetherlenders use that ability is a separate issue. The existence of switching costs does not necessarilymean that average prices are higher. Lenders anticipate the higher profits to be made on existingborrowers on SVR and therefore offer low priced deals, such as two year discounted deals, to gainnew borrowers. Once the initial discount is over, lenders then make a profit on the loans thatremain on the SVR.
5.23 Switching costs can be broken down into:
• contract costs – such as redemption charges, or the inability of existing customers toswitch to deals that are only available to new customers;
• transaction costs – such as legal and valuation fees, form filling; and
• search costs – time taken to find the right product in the market.
5.24 Here we assess the extent to which each of these categories of switching costs affectspricing in the mortgage market.
5.25 Redemption charges are not likely to be a significant barrier to switching for most of thoseborrowers paying SVR. Most of the existing short-term deals on the market do not haveoverhanging redemption charges.4 Most borrowers who remain on the SVR are therefore unlikelyto be required to pay a redemption charge should they move their mortgage to a new deal or lender.The distinction made by some lenders between mortgage products available to new and existingcustomers allows some lenders to price discriminate between borrowers based on their differing
52 The Miles Review: Final Report
4 13 per cent of the variable-rate mortgages (they are all “stepped-rate” mortgages with a low initial rate followedby higher interest rates) on the FSA comparative tables had overhanging redemption penalties.

Fairer pricing in the UK 5switching cost rather than the risk associated with the mortgage.5 The extent of pricediscrimination available to a lender will be linked to the degree of other switching costs. The factthat some lenders do not make all deals available to all borrowers adds an extra level of complexity,as borrowers have to find which products are available to them. More importantly they willtypically incur significant costs in switching lenders if that is the only way to get the mostcompetitively priced products.
5.26 There are a number of costs that a borrower has to pay to remortgage with a new lender.Table 5.1 showed that the average arrangement fee was around £320 and the valuation fee averaged£150. In addition the borrower needs a solicitor to act on their behalf in transferring the mortgagedeed to a new lender, which may typically add an extra £350 to the cost of switching. There maybe a number of fees from the existing lender such as exit fees, administration fees, deed fees etcwhich typically amount to around £806 (although exit fees can go as high as £200). Thesecombined costs typically adds up to around £900 which is equivalent to about 50 basis points onthe interest rate on a £100,000 mortgage over two years. Fixed-rate mortgages of ten years and overhave slightly higher arrangement and valuation fees with the overall fees closer to £1,000. However,because borrowers are expected to stay on a longer-term fixed-rate mortgage for longer thetransaction fees are usually spread over more years. Transaction fees on a £100,000 mortgage aretherefore likely to add between ten and twenty basis points to the interest payment over the life ofthe loan.7
5.27 These costs largely reflect the real economic costs of transferring a mortgage to anotherlender. Unless the process is made more efficient, such costs are likely to persist. However a numberof mortgage lenders offer to waive the arrangement fee and pay the cost of the valuation and legalfees for borrowers switching from another lender. But of the 1808 deals shown in Table 5.1, onlyfour explicitly offered to waive an arrangement fee and to pay for the valuation.9
5.28 The other main transaction cost involved in remortgaging is form filling. It is essential forthe mortgage lender to ensure that the borrower is the legal owner of the property and to establishthe degree of risk associated with the mortgage. The lender needs to assess the risk of default andthe extent to which they would be exposed to a loss should a default occur. The mortgageapplication form typically requires the borrower to provide information on their:
• personal details to verify the identity of the borrower;
• previous accommodation;
• occupation and income;
• credit history;
53The Miles Review: Final Report
5 Of the twenty largest lenders one half provide information on the range of mortgage deals available for newborrowers on their websites but do not supply any information for existing customers who are instead providedwith a contact number. The approach of many lenders therefore lacks transparency. Of the websites that showdeals available for existing and new borrowers (ten of the largest twenty lenders), there is an even split betweenthose who allow all customers to take advantage of all their deals and those who make distinctions betweenexisting and new customers.6 Estimate by the Consumers Association.7 Loans are assumed to last 7 years for a 10-year fixed-rate mortgage and 10 years for a 25-year fixed-ratemortgage. 8 Not including SVR mortgages.9 Less than 10 per cent of the variable-rate mortgages on the FSA comparative tables do not charge either anarrangement fee or a valuation fee. Lenders may also be willing to waive fees on some mortgages arrangedthrough intermediaries or for individuals who negotiate.

Fairer pricing in the UK5• personal finances including other loan commitments;
• property details;
• mortgage loan details;
• solicitor details;
• bank account details;
• other information such as criminal record, insurance claims and property use.
5.29 A typical application form amounts to approximately nine pages. In addition, theborrower also has to provide proof of their residence and income.10 This generates substantialadditional switching costs. To some people these costs are very significant. Once againremortgaging with the same lender does not require the borrower to provide such information.
5.30 Transaction costs are therefore likely to be a significant deterrent to borrowers switchinglender. Such transaction fees have the potential to provide lenders with some power over pricing ofmortgages to existing borrowers. The scale of the difference between SVR and rates available tonew borrowers suggests that this power has been widely used, albeit in an environment where thenumber of those who have been willing to remortgage has been growing and the number payingSVR falling. The borrower may avoid paying most of the transaction fees if they can stay with theexisting lender and switch to a new loan.
5.31 Although contract and transaction costs can be a significant barrier to switching, what hasbeen termed “search costs” are potentially as great a deterrent to remortgaging. Although there canbe costs associated with remortgaging with a new lender, existing borrowers paying SVR usuallyhave the potential to switch to a lower rate deal with their existing lender – albeit at a highermortgage rate or arrangement fee than may be available to new customers. This suggests that theinertia of many borrowers who remain on SVR is likely to be related to the lack of awareness oftheir ability to reduce their outgoings by remortgaging. This raises a series of issues aboutinformation.
Imperfect information
5.32 The Office of Fair Trading research paper 11 (OFT, 1997) defines three categories ofinformation that consumers require to make informed decisions:
• the price of the product and of other products (complements and substitutes);
• the quality of the product (relative to substitutes);
• the terms of trade (location of supplier, date of delivery etc).
5.33 Shortfalls of information in any of the categories make consumers decisions increasinglydifficult and may lead to consumer detriment in that the consumer may not buy:
• the cheapest product available (allowing firms to maintain dispersions in price);
• the most appropriate product (particularly in the case of complex problems).
54 The Miles Review: Final Report
10 Unless the application is a self-certification mortgage
Fairer pricing in the UK 55.34 There are two main reasons why consumers may have imperfect information:
• Learning costs are high. Where information is difficult for households to process,and they purchase a good infrequently, a consumer may invent simple rules onwhich to base decisions.
• Search costs are high. In such instances households require a large expected gain tocontinue searching.
5.35 Firms are likely to use the way consumers process information when deciding whatinformation to disclose on a product. Information is likely to be supplied where it is expected toboost sales by more than the cost of producing and disseminating the material. The OFT reportsuggests that firms may not disclose all the relevant information in order to:
• ‘... withhold information about price dispersions’ (possibly in an attempt to pricediscriminate).
• ‘... price discriminate between consumers, charging customers for whom search isexpensive a higher price than consumers who are willing to search more’.
5.36 This suggests that borrowers who remain on high SVR may have high search costs. TheOFT report notes ‘... although better educated consumers face a higher opportunity cost of time,they require less time to arrive at a fairly accurate picture of all the facts relevant to a particularpurchase decision. If this is the case, then lower income consumers tend to pay higher prices thanhigh income households.’ FSA (2001b) finds ‘Those with higher incomes are more likely to makea change [remortgage].’ This suggests that on average low-income households may pay a highermortgage rate than other households.
5.37 Furthermore the OFT report states ‘Once this behaviour begins [discriminatory pricing],it can easily result in a Nash equilibrium in the sense that the outcome is stable because no firmhas the incentive to return to the fully transparent pricing model’.
The rationale for intervention in the mortgage market
5.38 The current structure of pricing in the UK mortgage market has several unfortunateimplications:
• Many existing borrowers are unfairly treated, paying a higher price than others foressentially the same product. The cost of supplying funds to an existing borrower isno different from the cost of supplying funds to a new borrower. Indeed, if pricingdifferentials were based solely on the risk to the lender, existing borrowers would onaverage have lower mortgage rates than new borrowers. The current pricingstructure works against a substantial proportion of existing borrowers – perhaps overone third of borrowers are paying SVR. This depends upon a combination of theirlack of information and non-trivial switching costs. The fact that many suchborrowers will put up with paying higher rates than others does not mean it is fairthat they do.
• Discounts on mortgages by some lenders differ from special deals (loss leaders)offered on products such as baked beans. Special offers on baked beans are availableto all; discounts on mortgages offered by some lenders are available to one group ofconsumers, new borrowers, while another group of consumers, existing borrowers,are excluded.
55The Miles Review: Final Report

Fairer pricing in the UK5• Borrowers’ choice between mortgage products is affected by a distorted structure of
pricing. Longer-term fixed-rate mortgages appear expensive relative to short-termdeals that are priced below or close to the marginal cost of funds and where theheadline rate up front is the focus of marketing.
• The initial cross-subsidy to short-term mortgage deals plays to the tendency forborrowers’ to focus on upfront deals rather than focusing on the cost over the termof the mortgage and associated risks.
• Resources are wasted as borrowers are encouraged by the pricing structure to movefrom one short-term deal to the next. Remortgaging to a new lender, which formany borrowers is the only means to get the most discounted deals, creates realeconomic costs (including borrowers’ time, administrative, valuation and legalcosts).
5.39 In summarising the structure of pricing the FSA (2000b) concluded:
‘Research showed that products from some new entrants to the markets and someproducts offered by the main lenders to new borrowers and remortgagers were cheaperthan those offered to long-standing borrowers. This suggests that mortgage rates offeredon some products do not reflect the efficient cost of providing mortgages and that someconsumers may therefore be paying more than they would in an effectively competitivemarket. The range and complexity of mortgage products available and the problems ofpoor information also made it hard for consumers to compare value’.
5.40 The size of the mortgage market implies that the total amount of consumer detriment maybe significant. There were around 11.5 million mortgages at the end of 2003 with a total stock ofdebt of over £740 billion. Given that just over a third of borrowers and over 20 per cent of the debtremains on SVRs, the costs involved are substantial.
5.41 A number of commentators have suggested that intervention is not required to tacklecross-subsidisation. They predict that the proportion of borrowers paying SVR will becomeinsignificant in a few years. Nevertheless, action may be justified as:
• There is no certainty that the proportion of mortgages that will remain on SVR willnow fall sharply and quickly;
• Any fall in the proportion of mortgages on SVR will take time. In the meantime alarge number of borrowers will pay higher mortgage rates and the distortions topricing in the mortgage market will continue;
• Borrowers who remain on SVR are likely to be those with higher switching costs orwho lack information that would allow them to shop around;
• Action to hasten the fall in the proportion of borrowers who are on SVR is notopposed by anyone who has a good argument that the current structure of pricinggenerates real advantages. The strongest argument they have is that the currentpricing structure will not last long. If so there are no arguments against hastening itsdemise.
56 The Miles Review: Final Report

Fairer pricing in the UK 5Regulation of the mortgage market
5.42 The review consulted with the Office for Fair Trading (OFT) and the Financial ServicesAuthority (FSA) to find out which organisation had the powers to implement therecommendations of the review. The FSA’s powers that enable them to implement the Review’srecommendations are described below.
5.43 Following consultation by HM Treasury, the FSA was given responsibility for regulatingthe mortgage market under the Financial Services and Markets Act (FSMA) (2000). The Act setout the following statutory objectives:
• maintain financial market confidence;
• increase public awareness of financial matters;
• protect consumers;
• reduce financial crime.
5.44 In regulating mortgages the FSA chiefly aims to meet their statutory objectives of securingappropriate consumer protection and promoting public awareness. In this context public awarenessrelates to the disclosure of material that will among other things enable consumers to take informeddecisions when shopping around. In order to meet these statutory objectives the FSA have drafteda set of rules, the Mortgage Conduct of Business Sourcebook, which lenders and otherintermediaries in the mortgage market are required to abide by from October 31st 2004. Theregulatory framework focuses on product features, contract terms and providing information toconsumers.
5.45 As background to setting out the rules on disclosure the FSA ranked categories ofinformation in terms of its importance to meeting their statutory objectives. Information thatassists consumers shopping around and switching products was given the joint highest ranking –‘very important’ (FSA, 2001a).
5.46 In addition to FSMA, the FSA also has power under the Unfair Terms in ConsumerContracts Regulation.11 When launching an investigation under the unfair contract terms the FSAhas to notify the Director General of the OFT. The general test of whether a term is unfair is basedon whether, contrary to good faith, it could give a significant advantage to the firm that could causedetriment to the consumer.
POSSIBLE RECOMMENDATIONS TO PROMOTE FAIR PRICING
Ban pricing structure of discounts then SVR?
5.47 Table 5.1 showed that long-term fixed-rate mortgages appear expensive relative tomortgages with upfront discounts. Lenders are unlikely to earn a sustainable margin on theseproducts during the discount phase and will instead rely on making a profit on a number ofborrowers remaining inert and moving onto the more profitable SVR.
57The Miles Review: Final Report
11 In general the OFT deals with unfair terms, but the FSA is termed a “qualifying body” with powers tointervene where it deems practices undertaken by companies involved in financial services are unfair onconsumers.

Fairer pricing in the UK55.48 One option would be to make it illegal to have an interest rate structured in a way that hasan initial discount followed by a higher interest rate such as the SVR. Imposing such a ban has thepotential to dramatically reduce consumer choice. For variable-rate products the only productsthat would be available would be those that are called “variable rate for term” or SVR mortgages.If such a rule was also applied to fixed-rate products the only product that would comply wouldbe a fixed rate for the term of the mortgage – in most cases a 25 year fixed-rate mortgage. Reducingthe market to a few simple products would substantially reduce the ability of lenders to match theterms of the mortgage to the characteristics of borrowers.12 Yet if fixed rates were excluded from theregulation lenders could continue to focus on offering cross-subsidised short-term deals with theprospect of making profits on such mortgages when the short-term deal ended. Difficulties intackling the pricing problem with a simple ban highlight the need for any intervention to becarefully targeted to avoid increasing consumer detriment.
5.49 Discounts do not necessarily have to be at the expense of existing borrowers. Mortgageswhich offer borrowers a lower payment at the beginning followed by a higher payment later canbe useful as long as the borrower fully understands the implications of the profile of futurepayments. So for many reasons the strategy of trying to ban discounts is undesirable. Banningdiscounts on mortgage deals would only address the symptoms of the pricing problem and not theroot cause. Discounts are not the problem; differential pricing between new and existing borrowersreflects switching costs of moving a mortgage and a shortfall in information on different prices across themortgage market. Recommendations should address these issues directly. The Review does notrecommend that the pricing structure of initial discounts followed by higher interest rates isbanned.
REDUCING SWITCHING COSTS
Deals for all
5.50 Many lenders discriminate between customers on the basis of whether they are a first-timebuyer, someone who is remortgaging from another lender or an existing customer.13 Differences inmortgage rates offered to these different groups do not reflect differences in risk for the lender.14
Rather, differential pricing appears to reflect the fact that for many existing borrowers switchingcosts are high enough to deter them from moving their mortgage to another lender despite thesignificant difference between discounted deals and SVR. Fees can often add around a thousandpounds to the other costs of switching a mortgage to another lender. Households are also likely toface higher search costs and a greater administrative burden if they move their mortgage to analternative provider. The easiest and cheapest way for a borrower to move from a relativelyexpensive SVR mortgage to a cheaper deal would be to move to a new deal with the existing lender.
58 The Miles Review: Final Report
12 A further effect could be to make it difficult for lenders to offer what are termed “stepped-rate” products wherethe profile of the payments is tilted so that the borrower pays less at the start and more towards the end of themortgage. Such products are useful for consumers who face substantial upfront costs and whose income isexpected to rise rapidly over time.13 In February 2004 a quarter of the twenty largest lenders explicitly adopted differential pricing between existingand new borrowers. Half of the lenders did not have a transparent policy with existing borrowers recommendedto consult the lender to clarify the products available to them. The remaining quarter did not differentiatebetween new and existing customers. 14 Risk-based pricing suggests that differences in mortgage rates should reflect the probability of default (linked toloan-to-income ratio) and the expected loss in the case of default (linked to the loan-to-value ratio). Existingcustomers on average have lower loan-to-income and loan-to-value ratios than new customers and under risk-based pricing should pay a lower mortgage rate.

Fairer pricing in the UK 5Existing lenders already hold information on the borrower and their property which makes the taskof switching mortgage much more straightforward. Excluding existing customers from dealsavailable to new customers prevents them from taking advantage of the best deals on offer, raisestheir incentive to move lenders, results in some borrowers incurring greater costs when they changemortgage, and increases the difficulty to the existing borrower of finding a deal that is available tothem.
5.51 In a submission to the Review the Council of Mortgage Lenders discussed the option ofmaking all deals available to all borrowers:
‘Require all lenders to offer all products both to new and existing customers. A number oflenders already do this, and the practice could be extended to all lenders. This mightaccelerate the existing trend for cross subsidies to be removed from the market due tosubstantial remortgaging levels. But it also cuts across competitive and regulatory pressureson lenders, under Basel 2, to introduce more risked-based pricing in the future.’
5.52 It is indeed likely, as the CML suggests, that making products available to all customerswill accelerate the trend for cross-subsidisation to be removed from the market. But making alldeals available to all customers is not inconsistent with risk-based pricing. There are many differentrisk characteristics which a lender would legitimately wish to charge a different price for. Forinstance differences in the amount put down as a deposit on the property, variations in themortgage relative to a borrower’s income and differences in their credit history are all legitimatereasons for differences in mortgage rates. While these are legitimate reasons for mortgages to havedifferent prices, differences in price based simply on whether a borrower is a new or existingcustomer has no link to risk at all.
5.53 Recommendation: that the FSA requires that lenders make their full range of mortgageproducts available to all borrowers.15
5.54 If the FSA implements this recommendation they may need to pre-announce a date fromwhich deals would be available to all. Some lenders currently base their pricing of the mortgagebook on the profits they expect to make on existing customers. By removing a barrier to existingcustomers switching, the validity of these pricing assumptions could be undermined. The FSAwould need to assess a timescale for implementing this recommendation so that it did not lead tosignificant market disruption. A typical discount lasts for around two years. Two years wouldtherefore be a plausible upper bound on the timescale for the market to adjust to a new regimewhere all deals need to be available to all customers without undermining lenders’ profitability.
5.55 The removal of any barriers to existing borrowers taking advantage of the best-priced dealsis likely to have significant effects on the pricing of mortgages. Removing a significant barrier tosome existing customers switching to the best priced deals is likely to lead to a fall in the numberof borrowers paying SVR over time. As the funds generated by existing borrowers paying SVR fallsso there would be less scope to offer large initial discounts on variable and short-term fixed-ratemortgages. The price of discounted mortgages could therefore rise while the average interest ratepaid on existing mortgages falls. There is little evidence of monopoly profits being earned bylenders in the UK. This suggests that the extra margin currently earned from existing borrowerspaying SVR is largely channelled to other borrowers. The scale of that cross-subsidisation wouldbe lower if deals were available to all customers.
59The Miles Review: Final Report
15 Lenders must of course be free to vary the price of a mortgage to reflect differences in risk between borrowers.

Fairer pricing in the UK55.56 Some commentators have suggested that the current pricing structure is helpful in that itprovides support to new buyers at the point when the cost of servicing their debt is likely to behigh relative to their income. Removing the amount of cross-subsidisation in the market, andthereby potentially raising the cost of the cheapest upfront mortgages for new buyers, might havea negative effect on the demand for housing. However the advantage to borrowers of having lowerpayments at the beginning of the mortgage need not depend on cross-subsidisation. Section 2highlighted a number of alternative ways that borrowers could have a low upfront payment withoutgenerating sharply rising monthly payments over the lifetime of the mortgage, without negativeamortisation, and without any cross-subsidisation. Mortgages that are “stepped-rate”16 allowborrowers to have a lower payment in the early years that is compensated by higher payments later.Such profiles of repayment do not require explicit early repayment fees – they simply mean thatthe mortgage balance outstanding after the initial low start payments end is higher than itotherwise would be. Measures that may lead to the removal of the cross-subsidy from existing tonew borrowers do not have to imply that demand for housing will be adversely affected. Lendershave the ability to create “upfront discounts” for new borrowers by restructuring their mortgagepayments. This is fairer and more transparent than the pricing structure many lenders adopt.
5.57 There is a risk that some lenders could re-establish price discrimination and comply withthe recommendation that all deals be available to all customers. They could create a new subsidiarythat focused on acquiring new mortgages. The current established lender would then concentrateon maximising profits from existing borrowers, some of which could be used to cross-subsidiseinitial losses from the new subsidiary. The pricing in the new subsidiary could gradually becomeless competitive over time and profits used to finance the next generation of subsidiaries. However,following such an approach would have a number of potential drawbacks to any lender:
• setting up a subsidiary solely to acquire new mortgages would involve significant set-up costs;
• lenders may be cautious about risking their established brand name byconcentrating on maximising profits from existing customers. Research (CML,2003) suggests that lender reputation is a key influence on borrowers’ mortgagedecisions;
• a subsidiary would take time to establish a reputation and could therefore be lesssuccessful at attracting new customers than the existing lender.
5.58 The recommendation that lenders have to make all their deals available to existingcustomers could be insufficient on its own to tackle distortions and discriminatory pricing. Othermeasures that target information disclosure to reduce switching costs are also required. Theeffectiveness of establishing a subsidiary to acquire customers would be less successful the moreexisting borrowers are aware of the pricing of mortgages across the market. The recommendationsbelow are aimed at improving borrowers’ information on the mortgages they have and the onesthey could have.
Ban redemption penalties on variable-rate mortgages?
5.59 Laws prevent lenders from combining redemption charges with variable-rate mortgages inboth Belgium and the Republic of Ireland. Irish legislation restricts the use of redemption chargesto cases where the lender has to cover potential funding gaps which can arise when the borrower
60 The Miles Review: Final Report
16 Stepped-rate mortgages can be on fixed or variable-rate terms.

Fairer pricing in the UK 5redeems the loan. In the case of a fixed-rate mortgage redeeming the mortgage early when interestrate have changed can result in a funding gap. In the case of a variable-rate loan no such fundinggap occurs. While discounts on variable-rate mortgages for new borrowers exist in Ireland theytend to be lower than in the UK, ranging from 35 basis points to 100 basis points, and for shorterperiods of between six months to one year.17 These differences in the pricing of variable-ratemortgages in the UK and Ireland are likely to reflect a range of factors including the ability oflenders to use redemption charges.
5.60 Evidence from the Irish mortgage market does not point to significant gains from banningredemption charges on variable-rate mortgages. Indeed such a restriction on the use of redemptioncharges could prevent lenders from offering certain sorts of variable-rate products that attempt tomatch payments to expected income growth. Mortgages which offer low initial payments based ona low initial interest rate require redemption charges to ensure that the mortgage is self-financing.After the initial discount, the rate of interest has to be higher to recoup the funds used to offer theinitial discount. Tilting the profile of payments in this way combined with a redemption charge isfair as long as these features are clear to the borrower in advance. Without a redemption chargeborrowers would have an incentive to move to another deal once the initial discount is over.Lenders would be reluctant to offer this form of discounted variable-rate product if borrowerscould switch the mortgage without the lender recouping the funds used to offer the discount eitherthrough higher interest rate payments or a redemption charge.18 The review does not recommendthat redemption charges on variable-rate mortgages be banned.
Simplifying the process of switching
5.61 The process of switching a mortgage to a new lender involves an application to the newlender, a valuation of the property and requires a solicitor to ensure that due legal process isfollowed. Although the process results in switching costs, the information gathered is essential tothe new lender. There is little available evidence on the extent to which the process of switching amortgage acts as a deterrent to moving to a better deal, but the costs are not trivial.
5.62 There are a number of ways in which the burden of form filling may be reduced in thefuture. Lenders and intermediaries are increasingly offering mortgage applications online which islikely to speed up a remortgage. Proposals to introduce e-conveyancing are also expected to increasethe ease of remortgaging, as the timescale involved in transferring details between solicitors shouldbe reduced.
5.63 While there is little evidence on the extent to which the process acts as barrier to switchinglender, a survey shows that some borrowers perceive the process to be a barrier.19
Recommendation: that the FSA creates a short user-friendly guide on the process ofremortgaging to aid borrowers. This guide should be available through the FSA’s consumerhelpline and its website.
61The Miles Review: Final Report
17 Source www.finfacts.com on 27th January 2004.18 There are two alternative strategies lenders could follow to offer borrowers low initial payments. They couldeither a) let the interest rate on the debt vary in a predictable way over time or b) tilt the proportion of interestand capital payments away from that with a level repayment mortgage. The second strategy does not requireredemption charges but the first strategy does even though it is really equivalent. 19 Nationwide (2004) state ‘Many people mistakenly believe that switching their mortgage to another provider isa complex process.’

Fairer pricing in the UK5Improved information disclosure
5.64 Borrowers who remain on SVR may do so because they do not have the information toenable them to shop around. To make informed decisions consumers need information on therelative prices of mortgages and the terms (such as redemption charges) attached to them. Thefollowing recommendations focus on providing existing borrowers with better information.
COMPARATIVE TABLES
5.65 FSA (2001b) found that for the bulk of consumers shopping around was relativelyrestricted. Very many consumers were confused by financial products, lacked the required skills forfinancial planning and wrongly believed that there was little dispersion in the price of mortgages.The research focused on consumers actively seeking a mortgage. The information shortfall ofexisting borrowers paying SVR may be greater, with many borrowers unaware of the potential gainsthey could make from switching their mortgage.
5.66 One possible solution is to let the market fill the information gap. Newspapers regularlyprovide “best buy” tables that show some information on a few of the lowest priced products, oftenthose with the cheapest upfront deal, on the market. “Best buy” tables may be useful inhighlighting to new and existing borrowers some of the prices on the market. However they canonly show a very limited selection of the thousands of mortgages available. While other privatesector firms provide helpful comparative information, the lack of knowledge of the mortgagemarket across borrowers justifies the continued dissemination of comparative information by theFSA.
5.67 The FSA aims to reduce information asymmetries between mortgage buyers and suppliersby showing comparative tables on their website. The aim of the tables, among other things, is toenable consumers to make informed decisions when they shop around. The tables help existingborrowers to compare their current mortgage rate with what is available in the market.
5.68 The tables have information on:
• the provider;
• rate type (e.g. variable, fixed);
• initial rate (%);
• monthly cost (£s per month);
• the date that the deal ends;
• tie-in period (date redemption charges end);
• Standard Variable Rate (SVR) (%);
• monthly cost (£s per month); and
• 25-year APR (%).
62 The Miles Review: Final Report

Fairer pricing in the UK 55.69 Information is provided on the initial price, the length of any initial deal, the SVR whichdeals move onto after the end of a discount or fixed-rate period and the APR. The rational for usingthe APR appears to be that it is used widely to compare the cost of other borrowing such asconsumer credit. The APR has a number of difficulties when comparing different mortgageproducts that were discussed in Section 4. A secondary table provides the costs of setting up amortgage including valuation fees and arrangement fees.
5.70 The website also offers the potential to filter the range of products to the top 25 per centor 50 per cent of mortgages based on a number of categories including the lowest initial price andthe APR. These tools are powerful and enable consumers to quickly sift through the huge numberof products to produce a more manageable group. However filtering in this way may have the sideeffect of reinforcing consumers’ focus on one particular aspect of a mortgage, for example theinitial cost. Information on the risks associated with short-term discounted deals may be betterhandled through other material.
5.71 Overall, the tables provide an extremely valuable resource for consumers. The maindifficulty would appear to be in raising their profile with consumers, particularly amongst existingborrowers who may be unaware of the potential gains they could make by remortgaging. At thetime of their launch there were around 7,000 visitors to the mortgage tables a month but this hasfallen to around 1,000. Given that the number of mortgages taken out each month has recentlybeen running at between 200,000 and 300,000,20 and that there are a stock of about 11.5 millionmortgages, the comparative tables would appear to be little used.
5.72 Recommendation: that the FSA requires firms to include the exact website address forthe comparative tables (www.fsa.gov.uk/tables) and a short description of their purpose in allmandatory disclosure documentation.
Pre and post-sale disclosure
5.73 The FSA propose to increase and standardise the information at the pre-sale stage byrequiring lenders to provide information in the form of a pre-sale disclosure form. This form willprovide the consumer with information on which to base their decision. The main drawback forexisting borrowers is that the information is provided far in advance of when the borrower is likelyto remortgage. The post-sale disclosure documents (annual statements and statements driven bychanges in interest rates) would appear to be a better place to give information allowing householdsto assess the benefits of remortgaging.
5.74 The FSA regulations will improve information disclosure post-sale in two ways: throughannual statements and through what is termed “event driven disclosure” – a statement that is sentto the borrower when the interest rate changes. Both forms of disclosure have the potential toincrease existing borrowers scope to find the best mortgage.
Annual statement
5.75 The FSA (FSA, 2001a) aims to achieve two things through the provision of annualstatements:
• ‘to allow borrowers to check their mortgage is correct’;
• ‘to allow borrowers to check that they are still getting the best deal’.
63The Miles Review: Final Report
20 These numbers ignore borrowers who switch mortgage products with the same lender.

Fairer pricing in the UK55.76 To achieve these aims the FSA requires the following information to be included in theannual statement:
• the type of mortgage;
• details of transactions during the year including interest payments (and interestrates) and fees;
• amount of outstanding debt;
• repayment and other charges should the borrower wish to repay at the time of thestatement;
• when the early repayment charge ceases to apply;
• details of any tied products (such as a requirement to buy insurance through thelender) including when the requirement to buy a tied product ends.
5.77 Annual statements have the potential to improve the information available to consumersand thereby enable them to make better-informed decisions. While many lenders currently provideannual statements they generally do not provide the total cost of repaying the mortgage. Suchinformation should make borrowers on SVR aware of their ability to move their mortgage withoutincurring significant costs from the existing lenders. Annual statements can act as a prompt toborrowers to shop around to improve their deal. Borrowers currently on SVR or those about tomove onto SVR may be unaware of the alternative options available to them. It would help greatlyif borrowers were better able to assess the relative price of their mortgage.
5.78 There are two ways disclosure could be improved at limited cost to lenders. First, thestatements could include a reference to the FSA comparative tables. Second, the lender couldinclude a leaflet of the current mortgage rates across all their product range with the annualstatement. The Banking Code (BBA, 2003) sets a precedent with respect to informing consumersabout the range of interest rates available on savings account. The Code states ‘To help youcompare interest rates on all our savings accounts more easily, at least once a year we will send youa summary of these products and their current interest rates’. Recommendation: that the FSArequires that lenders include, with Annual Statements, a leaflet setting out the current mortgagerates on all their products.
Force lenders to help borrowers to switch?
5.79 The success of increased disclosure depends on the extent to which the information isunderstood and acted on. An alternative approach could be to change the decision to move ontothe SVR from a passive one to an active one. The FSA could amend their conduct of business rulesto require that lenders have to actively offer all their mortgage products to a borrower once theydo not face a significant redemption charge. Under the Banking Code, when the rate of interest ona savings account falls significantly, defined as a change of 50 basis points relative to the Bank ofEngland base rate, the bank has to tell savers about other savings accounts and offer to help themswitch to one of these accounts if they wish to.
5.80 Making lenders actively offer their mortgage products to existing customers who no longerface significant redemption charges would have to be justified on the basis that consumers wereunable to understand the choices they face. Only if there were grounds for believing that borrowerswere unable to understand the extra information on mortgages available from a lender that other
64 The Miles Review: Final Report

Fairer pricing in the UK 5recommendations will generate would there be grounds for forcing lenders to actively helpconsumers to move between products. The Review does not recommend that lenders be forcedto offer to help customers switch mortgage deals where they no longer face significantredemption charges.
COMPLIANCE COSTS AND BENEFITS
5.81 The recommendations focusing on increased disclosure will add to the cost of lenders.Measures that are likely to result in increased cost include:
• Making deals available to all would require changing descriptions of product details.Changes are likely to involve the rewriting and reformatting of material. Costswould be lower the longer the lead-time as lenders have to change their promotionalmaterial over time anyway. A number of lenders would not bear any cost as theyalready offer all deals to all customers. There would not be any ongoing costs toimplementing this measure after the initial one-off costs.
• The addition of a reference to the FSA comparative tables on pre- and post-saledisclosure forms is likely to require limited reprogramming of lenders’ software.Costs will be one-off and will tend to be lower where lenders are already updatingtheir software.
• The inclusion of a leaflet containing the current range of mortgage rates availablefrom the existing lender along with annual statements will add a minor ongoingcost.
5.82 The precise costs of these measures are difficult to gauge. NERA (2003) produced a finalreport for the FSA on the economic costs of mortgage regulation. The overall one-off systems costsfor FSA regulation were expected to be of the order of £36.4 million for lenders. However NERAnoted that costs were ‘difficult to allocate to individual proposals’. The system changes required bythe Review’s recommendations are small relative to those assessed by NERA and would thereforeadd a fraction of the cost.
5.83 NERA calculated the cost of extra disclosure at between three and six pence per item. Onthe basis of that calculation, and assuming a leaflet can be costed in this way, the recommendationof sending a leaflet once a year to each borrower (of which there are currently 11.5 million) couldcost around £0.5 million.
5.84 The increased costs due to the recommendations have to be weighed against the benefitsof fairer pricing. The recommendations will provide customers with information that shouldenable them to choose better value products. Although the overall benefits are difficult to gaugethe FSA (1999) estimated that if 20 per cent of consumers took a better value mortgage thenoverall savings could be of the order of £30 million a year for every 10 basis point reduction inrates paid.21
65The Miles Review: Final Report
21 Calculation based on a £60,000 mortgage.

66 The Miles Review: Final Report

The Miles Review: Final Report 67
6 Alternative protection from nominalpayment uncertainty
6.1 Fixed-rate mortgages provide certainty over the profile of nominal payments over somehorizon and give insurance against the risk of rising interest rates. If there is some flexibility in theprofile of repayments they can also allow borrowers to take advantage of falling rates, thoughredemption charges can limit the scope to do this. There is evidence that some borrowers value ahigh degree of flexibility in repayment profiles and that this discourages them from borrowing atlonger-term fixed rates. But there are alternative ways in which borrowers can choose to protectthemselves against interest rate fluctuations while maintaining significant flexibility. In this sectionwe consider them and assess potential obstacles to their emergence.
CAPPED MORTGAGES
6.2 Capped mortgages, which put an upper limit on the interest rate paid, are an alternativemeans by which borrowers can remove some risks about the level of future repayments. Cappedmortgages shield borrowers from rate rises above the level of the cap while allowing them to benefitfrom rate falls automatically.1 Lending at variable rate in the US takes the form of adjustable-ratemortgages, also known as ARMS. They are typically capped mortgages, often with both lifetimeand annual caps.
6.3 Capped mortgages are not very popular in the UK. Table 5.2 (page 49), using CACI data,shows that they made up only about two per cent of the mortgage stock, both by value and bynumber, at the end of 2003. In 2000 capped mortgages made up a significantly higher proportionof the market representing about seven per cent of the stock.
6.4 One plausible reason for the low take-up of capped mortgages is that they typically havesignificantly higher initial monthly payment rates than discounted variable-rate mortgages. Thelender needs to hedge the risk that interest rates will rise above the cap, often through takingpositions in financial derivatives, or else bear the loss when the cap is breached. This extra cost, orthe extra risk to the lender, is reflected in the higher spread over the level of short-term rates (e.g.over base rates) that is found in most capped mortgages. Table 6.1 shows the results of a search forcapped mortgages in the FSA comparative tables on 20th February 2004. The lowest initial ratefor a capped mortgage was 4.49%. Less than half of the mortgages on offer had initial rates underfive per cent. On that date, the same tables yielded dozens of discounted variable-rate mortgageswith no extended tie-in periods with initial rates under four per cent.
1 Collared mortgages have both a cap and a floor. Like capped mortgages, they protect borrowers from rate risesabove the cap. But collared mortgages do not allow borrowers to automatically benefit from rate falls beneath thelevel of the floor. They are equivalent to the borrowers buying a cap and selling a floor. By adjusting the floorand cap levels, it is always possible to make the price of both options the same. When the mortgage is devised insuch a way, the interest rate can be the same as that of an ordinary variable-rate mortgage. The borrower pays forthe cap protection by forfeiting his right to benefit from rate reductions below the floor level.

Alternative protection from nominal payment uncertainty6Table 6.1 Capped mortgages
Initial Tie-in Redemption Duration Then 25-year Flexible
Provider rate (%) Until period penalties (%)Cap level (%) of cap moves on to APR (%) features
Abbey 5.49 5/2/09 5/2/09 5 5.49 5/2/09 SVR 6.20 no
Beverley 4.49 2/28/06 2/29/08 4 5.99 2/29/08 tracker 5.70 no
Bristol & West 4.89 term 3/31/06 5 5.99 3/31/06 tracker 5.20 yes
Bristol & West 4.99 term 3/31/06 5 6.15 3/31/06 tracker 5.30 yes
Cheltenham & Gloucester 5.24 3/31/08 3/31/08 4-3-2-1 5.24 3/31/08 SVR 5.80 no
Cheltenham & Gloucester 5.49 3/31/08 3/31/08 4-3-2-1 5.49 3/31/08 SVR 5.90 no
Co-operative Bank 4.84 1/31/09 1/31/09 1 5.99 1/31/09 tracker 5.10 no
Coventry 4.80 3/31/09 none none 5.99 3/31/09 SVR 5.30 yes
Lloyds TSB Scotland 5.24 3/31/08 3/31/08 4-3-2-1 5.24 3/31/08 SVR 5.80 yes
Lloyds TSB Scotland 5.49 3/31/08 3/31/08 4-3-2-1 5.49 3/31/08 SVR 5.90 yes
Norwich & Peterborough 5.14 1/5/07 1/5/07 3 5.14 1/5/07 SVR 5.70 no
Norwich & Peterborough 5.29 1/5/07 1/5/07 3 5.29 1/5/07 SVR 5.70 no
Source: FSA comparative tables, 20/02/04.
6.5 How great the cost of a cap on a variable-rate mortgage is depends on:
• the level at which the cap is set. In Table 6.1 cap levels vary from 5.14% to 6.15%.Mortgages with higher cap levels tend to have lower initial rates;
• the duration of the cap;
• the likely path of future interest rates; and
• the uncertainty in future interest rates around the central path.
6.6 In an environment where the nature of interest risk may not be well understood by manyborrowers, where for many the initial cost is an overriding concern when choosing a mortgage andwhere many initial variable mortgage rates have been heavily discounted, it is understandable thatcapped mortgages are not very popular. Flow data available from the Council of Mortgage Lenders(CML) show that since the start of 2002 capped mortgages have never made up more than five percent of new mortgages advanced (Chart 6.1). The data show a downward trend from themaximum of just under five per cent in the first quarter of 2002 to the current level of two percent.
68 The Miles Review: Final Report

Alternative protection from nominal payment uncertainty 6
6.7 A second possible reason why the take-up of capped mortgages is low is that the range ofcapped mortgages on offer is somewhat limited. Table 6.1 contains just 12 products from eightdifferent lenders. Some of the major lenders do not offer capped mortgages. If some intermediariestend to work with a subsample of all lenders, this may limit the range of products that they offerto their clients. Table 6.1 shows that the longest capped period among the mortgages reported onthe FSA website was just over five years. Out of the 12 mortgages available, 11 had substantialredemption penalties during the duration of the cap. Compared to the wide range of characteristicsto choose from amongst discounted variable-rate and short-term fixed-rate mortgages, the choiceof capped mortgage types is more limited. This is reflected in the opinion expressed in the personalfinance pages of a newspaper in March 2002:
‘The cap sets an upper limit on the rate you will pay but if rates drop yourrepayments will fall. However, capped-rate mortgages are thin on the ground…’2
6.8 The range of capped rate mortgages reflects limited demand. The next section examinesthe possibility of a stand-alone retail financial products emerging that could overcome a potentiallack of flexibility. Stand-alone interest protection insurance has the potential to be tailored tomatch a borrower’s preferences.
69The Miles Review: Final Report
Chart 6.1: Capped mortgages as a proportion of new lending
0.0
0.5
1.0
1.5
2.0
2.5
3.0
3.5
4.0
4.5
5.0
0.0
0.5
1.0
1.5
2.0
2.5
3.0
3.5
4.0
4.5
5.0Per cent
Jan Mar May Jul Sep Nov Jan Mar May Jul Sep Nov Jan
Source: CML
2002 2003
2 The Guardian, 21/03/2002.

Alternative protection from nominal payment uncertainty6STAND-ALONE PROTECTION AGAINST INTEREST RATEMOVEMENTS
6.9 One way for borrowers to protect themselves against interest rate rises beyond a certainlevel is to buy interest-rate insurance. This protection could be sold separately from a mortgage,although it might be linked to it. In exchange for an insurance premium, the insurer would havethe obligation (for some specified interval) to pay the borrower the difference between the level ofa reference rate and a cap (for as long as that difference is positive) multiplied by the sum assured.For some period t the payoff is given by:
Max[(sum assured * (rt–cap level)), 0] (1)
where rt is the prevailing variable reference rate at time t specified in the contract. If the interestrate goes above the cap level, the payoff is calculated as the difference between the interest rate andthe cap multiplied by the sum assured. If the interest rate is at the cap level or lower, there is nopayoff. The maximum sum assured could be linked to the outstanding balance on the variable-ratemortgage – though it need not be. Whether it is or not should affect the appropriate tax andregulatory treatment of the product. In the case of a repayment mortgage, the amount assuredmight need to be adjusted after each mortgage payment to reflect capital amortisation.
6.10 As an example, take a protection contract that sets the cap at 6 per cent. Suppose that theassured amount is half of the outstanding balance on a mortgage. We assume that the repaymentson the mortgage follow the contractual schedule. If the reference rate is the mortgage rate3 and thatrate rises above 6 per cent lifting mortgage repayments by say £100 a month above what theywould be at six 6 cent rates, the insurer pays £50 a month to the borrower. This is equivalent tothe borrower buying a separate cap on interest rates.
6.11 A separate insurance product held alongside the mortgage has the potential to be moreflexible than a capped mortgage. The buyer can choose the term of the insurance, the proportionof the mortgage insured, the level of the cap and can even combine it with a succession of differentvariable-rate mortgages. This product could be provided by either the mortgage lender or byanother insurance provider.
6.12 Borrowers in the UK already choose to protect themselves against different types of risksthat affect their ability to make mortgage payments, such as unemployment or ill health. Duringthe second half of 2003, 38 per cent of new mortgages and 24 per cent of all mortgages hadMortgage Payment Protection Insurance (MPPI).4 This kind of general insurance pays theborrower’s monthly mortgage payments for a specified period if the borrower suffers accident,sickness, or unemployment.
6.13 There are some potential difficulties with the development of a market in stand-aloneinterest rate insurance products: these relate to the uncertainty about their tax treatment andregulation of sales.
70 The Miles Review: Final Report
3 If the borrower’s mortgage were a tracker mortgage referenced to the Bank of England’s policy rate (base rate),the contract rate would naturally be the base rate and the match with the rate on the mortgage would be perfect.If the mortgage interest rate was the lender’s SVR, the reference might be an index constructed with a group oflenders’ SVRS. In this case, the match between the increase in mortgage payments and the mortgage protectionpayout could not be perfect.4 CML data. 88 per cent of new policies were for accident, sickness and unemployment, 4 per cent for accidentand sickness only and 8 per cent for unemployment only.
Alternative protection from nominal payment uncertainty 6Possible obstacles to the sale of stand-alone interest rate insurance.
Tax treatment
6.14 If interest rate protection were classified as insurance for tax purposes, the money receivedif a payout was made would not be subject to tax, just as with any other insurance payouts. Thepremium paid would in principle be subject to Insurance Premium Tax (IPT). The general rate isfive per cent, going down to zero per cent for products classified as long-term insurance. For IPTpurposes, HM Customs and Excise follow the FSA’s lead in terms of whether they would classifya product as general or long-term insurance.
6.15 Were the interest rate insurance product described above (the stand-alone cap) to beclassified as an investment by the Inland Revenue, the compensation received when the cap isbreached could be subject to Capital Gains Tax (CGT). Gains and losses from it could be treatedin the same way as gains and losses from a derivatives position. The current annual CGT allowancefor the year 2003-2004 is £7,900. Capital losses can be offset against gains, and capital losses canbe carried forward indefinitely for offsetting purposes, so the premium could be offset against this£7,900. Assuming a taxpayer had no other capital gains in a fiscal year, only interest protectionpayments of over £7,900 in any one year would be taxable – and only payable on the part thatexceeded £7,900. The CGT allowance could mean that relatively few people would in practicehave to pay tax. But the tax treatment of derivatives seems unsuited to individuals, and it wouldbe difficult to work out the yearly changes in the position. Borrowers would need to keep recordsnecessary to work out the capital gain, such as the premium paid up front (considered a loss) andthe yearly payments received.
6.16 If interest rate protection were considered as an investment but the government wanted toachieve tax neutrality with respect to capped mortgages, legislation in the annual Finance Billwould probably be necessary to alter its tax treatment. The concession could be limited to a sumassured not in excess of the size of the outstanding mortgage. While a tax concession could begranted to exempt payouts from CGT, buyers of this interest rate protection would still have tokeep records of premiums paid for a long time. The reason is that a concession could not removethe right for taxpayers to be able to offset the initial premium against potential future capital gainsfrom any of the taxpayer’s other investments.
6.17 A key consideration for the Inland Revenue when deciding on the treatment of the incomegenerated from interest rate protection would be whether the product allows the borrower tospeculate and benefit from movements in the market or whether it only offers compensation foran adverse event. If the insurance could be sold on to the market when it was no longer wantedand could therefore generate a profit in favourable market conditions, it would be more likely tobe treated as an investment.
71The Miles Review: Final Report

Alternative protection from nominal payment uncertainty6Regulation of sales
6.18 A product classified as insurance by the FSA is subject to lighter regulation of sales thanone classified as an investment. While the definition of an insurance contract is a matter of law, theFSA can issue guidance interpreting the law. The sale of investment products is regulated by theFSA’s conduct of business rules as set out in the FSA handbook. The new FSA regulation of theconduct of business in insurance will come into force on 14 January 2005. The new regime willimplement the European Insurance Mediation Directive (IMD) requirements. The maindifference between the investment and the insurance regimes is that an insurance product has tobe deemed as “suitable” rather than “most suitable” as is the case for an investment product. Therequirements for registration are also stricter in the case of investment sales.
6.19 Recommendation: that the Government treat interest payment protection as insurancefor tax purposes, provided that the sum assured is no greater than that part of a mortgage witha variable interest rate. The income received as compensation should not be subject to tax. Forneutrality with the treatment of capped rate mortgages, the premium on stand alone interest ratepayment protection should pay a zero rate of insurance premium tax.
6.20 Recommendation: that the FSA treat such a product as insurance for regulation of salepurposes.
6.21 Although the treatment for tax and regulation are independent decisions it would bedesirable to treat consistently the product as an insurance contract. For that to be the case the sellerwill need to show that the buyer has a variable-rate mortgage with a balance no smaller than thesum assured.
6.22 The classification of interest payment protection as insurance is natural; the productprotects borrowers from an adverse event that results in a quantifiable financial loss and over whichthey have no control. Interest payment protection of the sort described above – limited to themortgage balance, not allowing the borrower to speculate, and that triggers compensation in thecase of an adverse event – is insurance. Interest payment protection is not dissimilar to other typesof insurance associated with a mortgage that people buy, such as MPPI. The event that triggerscompensation (a rise in interest rates) is an adverse event from the point of view of the borrowerand an event defined in a clearer way than loss of income due to unemployment.5 An additionalreason to justify the tax treatment of interest payment protection as insurance is that the paymentprotection afforded by a capped mortgage when rates are above the level of the cap is tax-free tothe borrower. A capped mortgage is equivalent to a variable-rate mortgage plus an interest paymentprotection policy. It would be desirable to treat the two products sold separately in the same way.
6.23 Capped mortgages and stand-alone interest payment protection are an alternative tostandard fixed-rate mortgages which also afford borrowers some certainty about future nominalinterest payments. They allow consumers to enjoy some of the features of mortgages that havetended only to be available with variable-rate deals – initial discounts and flexibility in paymentsprofiles – while gaining the insurance element of a fixed-rate mortgage. But fixed-rate mortgagesthat give borrowers flexibility in payments profiles and low initial payments are also feasible andsome have been offered. Fixed-rate mortgages with stepped-up payment profiles and part-fixed/part-variable mortgages have characteristics that can make them attractive to borrowers whovalue flexibility or are particularly concerned about initial monthly payments. In the next sectionthe design of such products is considered.
72 The Miles Review: Final Report
5 The CML has published a “MPPI Baseline Cover Specification” – the minimum cover that should be offeredto borrowers– that features exclusions to cover if, for instance, work is temporary, unemployment is seasonal, orthe illness is caused by alcohol abuse.

Alternative protection from nominal payment uncertainty 6FIXED-RATE MORTGAGES WITH STEPPED-UP REPAYMENTSCHEDULES
6.24 A fixed-rate mortgage with a stepped-up repayment profile is an alternative product thatallows borrowers to get the low start payments usually associated with discounted variable rates butwithout having to take on any uncertainty about the profile of repayments. This was illustrated inSection 2 of this Report. In its simplest form, a stepped fixed-rate mortgage has increasing monthlypayments over some part of the fixed period. The borrower’s payments are initially lower than thoseon a comparable level-repayment mortgage. Such a product could generate negative amortizationif the initial payment is set at a very low level. The loan balance could actually increase during thefirst few years if the payment is less than the fixed rate times the mortgage balance.
6.25 In principle there is nothing intrinsically bad about negative amortisation – though manylenders may be wary of allowing mortgage balances to increase. But the scope to offer low initialpayments without generating negative amortisation is substantial. One way to avoid negativeamortisation is to have a mortgage that during the initial years is an interest-only mortgage. As anexample, a borrower with a 25-year repayment mortgage could only pay interest on his or herbalance for the first 2 years, and then would move on to payments that repay the balance over theremaining 23 years. The drawback is that with only one “step” in the profile of payments the sizeof the increase would be large (as illustrated in Table 2.1). But as the example illustrated in Table2.1 showed there is enormous potential to design fixed-rate mortgages that have low initialpayments, repay over 25 years, do not have negative amortisation and never have payments thatrise more than a relatively small amount from one year to the next and then only rise for a fewyears. Table 6.2 reproduces some of the information in Table 2.1 to illustrate the scope for lowstart payments with fixed rate mortgages. Here we take three mortgages – two fixed-rate and onewith a discounted variable rate – and just focus on repayments over the first six years.
Table 6.2 Stepped-up payment profiles on fixed and variable-rate mortgages (£)
M1-Interest only for two years M2-Discounted variable M3-Gradually rising payment
on a fixed-rate mortgage of fixed-rate debt
Outstanding Monthly Weekly Outstanding Monthly Weekly Outstanding Monthly Weekly
year capital Payments rise capital Payments rise capital Payments rise
1 100,000 500 - 100,000 519 - 100,000 500 -
2 100,000 500 0 97,517 519 0 100,000 535 8
3 100,000 677 41 94,941 637 28 99,580 572 9
4 97,872 677 0 92,895 637 0 98,685 613 9
5 95,617 677 - 90,728 637 - 97,256 655 10
6 93,226 677 - 88,433 637 - 95,227 692 9
Total Payments Over: M1 M2 M3
1 year 6,000 6,233 6,000
2 years 12,000 14,466 12,420
3 years 20,127 20,114 19,289
5 years 36,383 35,408 34,504
6 years 44,512 43,058 42,801
M1 is a mortgage with a fixed rate at 6 per cent where for the first two years payments are interest-only. M2 is a discounted variable-rate mortgage where the
initial rate is set at a discount of over 2 per cent from the standard variable rate (SVR) but then switches on to the SVR after two years (5.9 per cent). The initial
rate is 3.75 per cent for two years. We assume that there is no change in the SVR over the whole 25 years. M3 is a fixed-rate mortgage where payments are initially
interest-only but they then move up over a five-year horizon to a level that then remains constant. The focus of this table is purely on the profile of payments so we
abstract from risk.
Source: Miles Review calculations
73The Miles Review: Final Report

Alternative protection from nominal payment uncertainty6PART-VARIABLE/PART-FIXED MORTGAGES
6.26 Borrowers could divide their mortgages so that different portions are on different rates, forinstance, a mortgage that includes a tracker element and a fixed rate. It would also be possible tomix two different fixed rates, such as a two-year fixed rate and a ten-year fixed rate, in anyproportion.
6.27 There are several advantages of a mortgage combining fixed and variable rates. Borrowerscan decide the level of nominal payment risk they are willing to take on, and choose the proportionof their mortgage on a variable rate accordingly. The variable-rate part of their mortgage canprovide an element of flexibility; borrowers could have the option to overpay or – possibly –underpay at no charge.
6.28 A single mortgage allowing borrowers to mix variable and longer-term fixed rates fordifferent proportions of their mortgage debt is a potentially useful product. Such mortgages haverecently been offered in the UK.
CONCLUSION
6.29 The UK is a very innovative market, with a long record of creating new types of mortgage.It is plausible to think that deals like the ones discussed here would become more attractive ifborrowers’ awareness and understanding of risk and return improves.
74 The Miles Review: Final Report

The Miles Review: Final Report 75
7 Enabling cost-effective long-term lending
INTRODUCTION
7.1 Section 5 of the Interim Report examined how fixed-rate mortgages are funded andpriced. How mortgages are funded is a key factor behind the relative prices of different sorts ofmortgage; and price is central to the attractiveness of different types of mortgage to households.
7.2 Section 5 of the Interim Report analysed different means by which lenders can handle tworisks associated with fixed-rate mortgages: interest rate risk and pre-payment risk. It outlined waysin which lenders with fixed-rate lending can avoid interest rate mismatch. Three different strategies(though not exhaustive of those that can be used) are: (A) using the swaps market; (B) using fixed-rate funding raised in the form of fixed-interest bonds (which might have call features); or (C)selling their mortgages on to the capital markets as mortgage-backed securities (MBS). The threedifferent strategies are illustrated in Figure 7.1.
7.3 Pre-payment risk, in turn, can be held by borrowers, by lenders or by investors in eitherMBS or in bonds with some form of call provision to issuers. Investors will require compensationfor holding callable assets. Lenders can also take on pre-payment risk themselves and hedge it withswaptions or other derivatives (either held explicitly or created synthetically). Borrowers who havesome form of option to pre-pay a fixed rate mortgage ultimately have to pay for the ability to pre-pay their mortgage early. They can pay either at the point of “breaking” the contract (through“mark-to-market” or pre-determined charges) or pay in the form of a higher interest rate chargedover the life of the mortgage. The Interim Report did not attempt to single out a preferred fundingor hedging route, and it noted that many of these routes were already being used in the UK.Instead, the Interim Report examined whether obstacles existed to using some of these fundingstrategies that could hinder the development of more widespread long-term fixed-rate lending.
Figure 7.1: fixed-rate lending – strategies to avoid interest rate mismatch
Borrowers with fixed-rate mortgages
Variable-rate depositors
Bond buyers
MBS buyers
Swap counterparty
Lender
SPVC
B
A
Fixed-rate interest paymentsVariable-rate interest rates
SPV = Special Purchase VehicleMBS = Mortgage Backed Security

Enabling cost-effective long-term lending77.4 The Interim Report identified several potential obstacles that lenders may encounter whenfunding fixed-rate mortgages in a way that avoids interest rate mismatch and which efficientlyallocates pre-payment risks. In this section we consider those obstacles and make recommendationson how they can be overcome or lessened.
7.5 Two of the potential obstacles identified in the Interim Report are:
• the absence of specific covered bond legislation in the UK; and
• the possible lack of liquidity at the long end of the swaps market.
7.6 Potential problems stemming from difficulties in managing pre-payment risk were:
• the enforceability of mark-to-market redemption charges;
• possible lack of liquidity in the market for fixed income derivatives;
• the accounting treatment of gains and losses on derivatives and the implications ofInternational Accounting Standard 39 (IAS 39); and
• limited data on prepayment behaviour.
7.7 Section 5 of the Interim Report went on to examine regulatory issues that could affect thefunding of long-term fixed-rate mortgages. These were:
• changes to prudential regulations about capital adequacy due to theimplementation of the new Basle Accord; and
• legislative limits imposed upon building societies’ funding.
7.8 Finally, the Interim Report made a distinction between factors that may ultimately provetransitory, such as the absence of pre-payment data and the lack of liquidity in long-dated swapsand swaptions, and those that might present permanent obstacles to certain funding strategiesbeing used. Here we will consider the obstacles, exploring possible courses of action to removethem and make policy recommendations where appropriate.
DEALING WITH OBSTACLES TO FUNDING
Covered bonds
7.9 Longer-term fixed-rate mortgages in the UK could be financed through the issuance offixed-rate debt by UK lenders. This would be one way in which interest rate risk for lenders couldbe avoided. Issuance of fixed-rate debt would allow the lender to match fixed-rate cash flows onthe assets side of the balance sheet (fixed-rate mortgage interest payments made by the borrower)with fixed-rate liabilities (cash-flows to holders of fixed-rate debt issued by the lender).
7.10 Covered bonds are one form of fixed-rate debt where the securities that are issued arecollateralised by a specific pool of mortgages. Unlike MBSs, covered bonds remain on the lender’sbalance sheet. In many European countries covered bonds are already an important source offinance for fixed-rate mortgages. In the UK there is no specific covered bond legislation. However,most European countries have legislation that defines what can be classed as a covered bond. Lawsset out how security is enhanced for investors in covered bonds in the case of bankruptcy. In thecase of default of the issuer, the assets backing covered bonds are ring-fenced. This enhances thecredit of covered bonds. The Interim Report highlighted potential obstacles to the development of
76 The Miles Review: Final Report

Enabling cost-effective long-term lending 7a liquid and efficient covered bond market in the UK and outlined the rules and procedures thatcurrently govern the issuance of these bonds across Europe.
7.11 The key issue is the impact of the lack of specific covered bond legislation in the UK onthe development of a UK covered bond market. This lack of legislation could affect thedevelopment of a longer-term fixed-rate mortgage market by restricting one potential routethrough which lenders could fund longer-term fixed-rate mortgage lending.
7.12 The Interim Report raised two particular concerns about the lack of specific covered bondlegislation in the UK:
• costs could be increased. Due to uncertainties surrounding some aspects of UKcovered bonds, the lack of legislation could lead to a cost premium if investorsbelieve these bonds are higher risk. The cost to issuers of convincing potentialinvestors that a particular issue was a covered bond could be higher in the absenceof specific covered bond legislation; and
• the lack of specific legislation could be an obstacle to recognition of covered bondsby the UK authorities, under the Co-ordination Directive on Undertakings forCollective Investments in Transferable Securities (UCITS). A lack of recognitionfor covered bonds under UCITS would affect the extent to which European fundscould invest in them. A lack of specific covered bond legislation could also preventUK issued covered bonds benefiting from any lower risk-weighting for coveredbonds resulting from EU proposals for a new Capital Adequacy Directive (CAD3).
7.13 Although there is no specific covered bond legislation in the UK, HBOS issued the UK’sfirst covered bonds during 2003.1 The structure of this issue relied on the legal underpinnings ofEnglish contract law. The success of the HBOS covered bond issuance (in terms of how it has beenreceived by investors) suggests the lack of specific covered bond legislation in the UK may not havea significant impact on the cost of longer-term fixed-rate mortgages.
7.14 Currently, covered bonds in the UK do not qualify for favourable treatment under theUCITS Directive. Article 22(4) of UCITS allows European investment funds to invest up to 25per cent of their funds in covered bonds that meet the UCITS criteria. Without UCITSrecognition, the maximum is 5 per cent. A list of the bonds that meet the criteria set out in Article22(4) of UCITS can be found on the European Commission website.2 Article 22(4) requires thatsuch bonds need to be recognised in law before a Member State can grant UCITS recognition. Inparticular, Article 22(4) of UCITS provides that:
“Member States may [increase the extent to which UCITS can invest in covered bonds]when these [bonds] are issued by a credit institution which…is subject by law to specialpublic supervision designed to protect bond-holders. In particular, sums deriving from theissue of these bonds must be invested in conformity with the law in assets which, duringthe whole period of validity of the bonds, are capable of covering claims attaching to thebonds and which, in the event of failure of the issuer, would be used on a priority basis forthe reimbursement of the principal and payment of the accrued interest.”
77The Miles Review: Final Report
1 HBOS issued two covered bonds during 2003, selling €3 billion in July of a bond maturing in 2010 and €2billion in October of a bond maturing in 2013. These issues are part of a €14 billion programme.2 The European Commission website sets out information on which Member States have implementedregulations allowing for the issue of bonds meeting the requirements of Article 22 (4) and, as far as possible,information on the eligible individual instruments. This information can be found at:http://europa.eu.int/comm/internal_market/en/finances/mobil/ucits/instruments_en.htm

Enabling cost-effective long-term lending77.15 European Mortgage Federation (EMF, 2003), presents a detailed analysis of Article 22(4)of UCITS. It states that the criterion requiring covered bonds to be recognised in law is met if therules on the issuing of the bonds are enshrined in a formal law. However, it also states that “If theprovisions governing the issuing of mortgage bonds have, on the basis of an authorisation, asprovided for in the Constitution of the Member State, been issued in a form other than an expresslaw, this will be considered to be sufficient. Likewise the regulations or statutes of a bank, wherethese have been adopted by the competent legislators, is to be considered sufficient.”
7.16 This suggests that the requirement in Article 22(4) that covered bonds need to berecognised in law before a Member State can grant UCITS recognition could be met with anamendment to the FSA’s rules, without the passage of primary legislation. Discussions of theseissues with the FSA have proceeded since publication of the Interim Report. The FSA’s opinion hasbeen sought on whether or not primary legislation would be needed both to allow recognition ofUK covered bonds under the UCITS Directive and to facilitate the development of a UK coveredbond market more generally.
7.17 It is the responsibility of the FSA to decide whether to grant recognition, for the purposesof the UCITS Directive, to covered bonds issued under UK law. The FSA has given us apreliminary assessment that current UK insolvency law may be sufficient to allow recognition ofcovered bonds for the purposes of the UCITS Directive and to facilitate development of a UKcovered bond market. The FSA has not yet given a definitive view on these legal questions.However, if its final view is in line with its preliminary assessment, this would mean that theconcerns set out above could be met without the need for primary legislation in the UK.
7.18 Recommendation: that the FSA should provide a definitive view on whether or notcurrent UK insolvency law is sufficient to allow for the recognition of covered bonds underthe UCITS Directive.
Capital risk weighting for covered bonds under the new Capital AdequacyDirective (CAD3)
7.19 Covered bonds issued in a number of countries, including Germany, carry a capital riskweighting of 10 per cent, whereas in the UK the risk weighting is 20 per cent or more dependingon the structure of the issue. The 10 per cent preferential risk weight is not currently available inthe UK because the transitional provision set out in Directive 2000/12/EC that allowed this wasnot taken up by the UK and has now expired.
7.20 The new Capital Adequacy Directive (commonly referred to as CAD3) will revisit thedefinition of covered bonds as part of its more general review of the capital treatment of thesebonds. If a requirement for specific covered bond legislation were to be included in any newdefinition of covered bonds under CAD3, this would mean covered bond legislation in the UKwould be needed if UK lenders were to get the more favourable capital weight.
7.21 Covered bonds have certain characteristics on which there is already general agreement. Itappears possible to ensure that a bond issued by a UK lender has these characteristics without theneed for new legislation.
7.22 Recommendation: that the UK Government should aim to ensure that CAD3 does notrequire specific UK covered bond legislation.
78 The Miles Review: Final Report

Enabling cost-effective long-term lending 7DEALING WITH OBSTACLES TO MANAGING PRE-PAYMENT RISK
Mark-to-market pre-payment charges
7.23 Section 5 of the Interim Report identified the uncertainties surrounding the use of mark-to-market redemption charges as one hurdle facing lenders that choose this option to manage pre-payment risk.
7.24 The option to pre-pay a fixed-rate mortgage is valuable to the borrower but it is not free.Lenders need to be compensated for the risk that they will not be able to reinvest the pre-paidfunds at the contractual rate. Borrowers can pay for the option to pay off their mortgage early inthree basic ways: (i) payments at the point of pre-payment; (ii) a higher interest rate over the lifeof the mortgage; or (iii) a charge up front. In the first approach, only those borrowers who actuallyredeem their mortgage early pay for the pre-payment option. Most fixed rate mortgages offered inthe UK now have some form of early redemption charge. This is often set at a declining rate andis generally unrelated (or only weakly related) to the level of future interest rates (i.e. mark-to-market charges are very rare). Charges are usually in the form of pre-determined fees unrelated tointerest rates at the time of pre-payment (either as a fixed amount, as a number of months ofinterest rate payments, or as a percentage of the outstanding loan). Pre-determined fees only hedgethe lender partially, since the actual cost of breaking the contract depends on the differencebetween the contractual rate and the level of interest rates for the remaining duration of themortgage at the point of pre-payment.
7.25 Mark-to-market redemption charges are equal to the market cost of breaking the mortgagecontract. This is the difference between the present value of the mortgage discounted at marketinterest rates (for the remaining maturity) at the time of pre-payment and the present value of themortgage discounted at the original contractual fixed rate. If charges are symmetric then they couldresult in a refund: a mortgage pre-paid at a time when interest rates are higher than when themortgage was taken out could come with a refund. The value of the refund would exactly offsetthe higher repayments that would need to be made if a new mortgage was taken out for the samevalue and with the same residual maturity. If a fixed-rate mortgage is pre-paid when interest rateshave fallen, the mark-to-market redemption charge is equal to the saving that would be made bytaking out a new mortgage at a lower fixed rate.
7.26 There is nothing intrinsically unfair about mark-to-market pre-payment charges. They aredesigned so that the gain to a borrower from repaying a fixed-rate mortgage early and replacing itwith debt paying a lower interest rate is exactly matched by the charge for repayment. The amountsto be paid are potentially high (though if charges are symmetric so are the potential repayments),so borrowers need to understand how mark-to-market charges work. Borrowers need to have itexplained clearly.
7.27 Mark-to-market charges have advantages for some borrowers. First, the amount to be paidis determined by the level of market interest rates and cannot be changed arbitrarily. Second, whilepre-payment with pre-determined charges always results in an amount having to be paid (either asseveral months’ interest or a percentage of the original loan or of the outstanding amount), ifborrowers pre-pay their loan when there are mark-to-market charges at times when rates have notfallen, they will either pay nothing or may receive compensation (if these were to be symmetriccharges).
79The Miles Review: Final Report

Enabling cost-effective long-term lending77.28 Mark-to-market charges provide lenders with the most complete hedge against pre-payment risk. Pre-determined redemption charges do not cover lenders against a possible mismatchbetween the penalty paid and the market price of breaking the contract. The potential mismatchbetween the true cost of pre-paying the mortgage and a pre-determined penalty increases with thelength of the fixed-rate period. This mismatch may be negligible when, as currently, most lendersoffering short-term fixed-rate mortgages have to hedge pre-payment risk that usually extends onlyfor two or three years. That risk can be substantial in the case of ten or 15-year fixed-ratemortgages. It is greatest with 25-year fixed-rate mortgages.
7.29 Two obstacles – which are linked - may prevent the use of mark-to-market charges: (i) theyare not well understood and are popularly considered to be intrinsically unfair; and (ii) there isuncertainty about their enforceability.
7.30 The first obstacle to the use of mark-to-market redemption charges is that they do notseem to be well understood. The cases brought to the Banking Ombudsman in the late 1990sindicate that borrowers did not grasp how the charges worked. Understanding is not helped by thefact that they are often portrayed as a penalty that the lender levies on the borrower at a time whenthey are already overcharging them because the contractual interest rate remains high while thegeneral level of rates have come down. This reveals a misunderstanding of how mortgages arefunded. When a lender lends long term, the relevant rate for pricing the mortgage is not the short-term rate, but the prevailing rate for the expected maturity of the loan. With a ten-year fixed-ratemortgage the borrower has effectively issued a ten-year bond to the lender at the then current ten-year rate. If the issuer has an option to redeem a bond before maturity, this is valuable, and theissuer should expect to pay for it. A non-prepayable fixed-rate mortgage is similar to a non-callablefixed-rate bond. Assume that five years down the line, interest rates are lower and the issuer(borrower) wants to call the bond. An issuer of non-callable debt would have to buy back that bondat the market price of that bond at the time he wanted to buy it back.3 If interest rates for theremaining five years are lower than at the time of issuance, and assuming the bond was issued atpar, the market price of that bond will be above par. The issuer (borrower) would not pay the parprice to buy back their debt. The difference between the market price of the bond and its face (orpar) value is equivalent to the mark-to-market pre-payment charge. The relevant rates for thecalculation of the bond prices are the rates for the remaining maturity. These rates reflectexpectations of future short-term interest rates.
7.31 There is clearly nothing intrinsically unfair about mark-to-market pre-payment charges.They are designed so that the gain to a borrower from repaying a fixed-rate mortgage early andreplacing it with a lower rate loan is matched by the charge for repayment.
7.32 An obstacle to the use of mark-to-market redemption charges is the uncertainty abouttheir enforceability. This is unfortunate. Some borrowers may prefer to have the option to pre-payat a cost unrelated to the subsequent level of rates, or pay for the option as a higher spread over thelife of the mortgage. But some may prefer mark-to-market penalties – they are a contract thatwould allow a borrower to ensure that the overall value of their payments over a given horizon forborrowing a certain amount are of a known value independently of whether they pay off an initialcontract for that debt and then re-borrow the funds again in a new contract with a different lender.
7.33 Ideally a range of options would be available for fixed-rate mortgages with different typesof redemption charges, but it could usefully include mortgages with mark-to-market charges. TheOffice of Fair Trading (OFT) judgement in the NatWest case and the subsequent Consumers’
80 The Miles Review: Final Report
3 Alternatively, the issuer can issue a callable bond where the price at the time of issuance reflects this option.The principle is the same.

Enabling cost-effective long-term lending 7Association guidance has led many lenders to believe that only pre-set charges would be upheld ifa claim against the lender was made by the borrower in the future. The FSA regulation of themortgage sales process will require maximum redemption charges to be quoted in cash amounts inthe pre-sale disclosure form; while this has some benefits it does not seem likely to help make mark-to-market charges become better understood.4 The CML submission to the Review of 23 January2004 (para 38) states that:
‘In the consumerist environment in the UK, no lender foresees offering products withsuch charges, even if they may be "fair" from an economic perspective. They would bedifficult to explain in a way that consumers could understand, and may appear to show avery high potential early repayment charge. This would appear unattractive to consumers,compared to variable or shorter-term fixed rates’.
7.34 In the 1998-99 Annual Report of the Banking Ombudsman (1999) (whose work wassubsumed by the Financial Ombudsman Service from 1 December 2001), the Ombudsman set outsuggestions for good practice concerning early repayment charges:
‘Advertising and marketing material should be clear, fair and reasonable (as required by theBanking Code and Mortgage Code). The early repayment charge should not be hidden inthe small print.
• Where the bank assists the borrower in choosing the type of loan, it shouldremember that the borrower may be forced into early repayment by an unexpectedchange in circumstances, such as redundancy or divorce.
• The mortgage offer should explain the mechanism by which the charge iscalculated in a way which is understandable to an ordinary borrower who has noidea how money markets work. This may require quite a lengthy explanation.
• There should be a clear warning of how large the early repayment charge mightturn out to be. Examples help, but only if they are representative - explainingclearly the relationship between the example and the actual loan.
• There should be a cap on the amount which the early repayment charge will reach.A statement that the charge might be as much as, but will not exceed, X% of theloan will bring home to the borrower the extent of the risk.
• The bank should not seek to recover the whole of its mark-up for the entire fixedrate term, however quickly the mortgage is redeemed, without regard to any mark-up it is likely to recover if it re-lends the money to someone else.
• There should be a justifiable link between the likely amounts of the charge and thebank’s loss. Where the charge is to compensate the bank for loss it will incur inthe future, there should be an appropriate discount for early payment.
• The bank should act sympathetically where the borrower is not seeking to redeemin order to strike a better deal elsewhere, but is genuinely forced into earlyrepayment by an unexpected change in personal circumstances.
I appreciate that some of these suggestions, particularly the cap, may affect the cost ofproviding funds for fixed rate mortgages - with consequent effect on the interest rates
81The Miles Review: Final Report
4 The rules allow firms to put in the KFI a basic explanation of the basis of the charge (see MCOB 5.6.84R(1)(e))and they can refer to a separate document for fuller details.

Enabling cost-effective long-term lending7payable by borrowers. Better that than a superficially cheap mortgage with unquantifiablepitfalls.
The future trend of interest rates is uncertain, and may be affected substantially bywhether or not the UK joins the European single currency. The future personalcircumstances of individual borrowers are made uncertain by reduced job security andincreased divorce.
Accordingly, banks may wish to reflect on how far it is prudent for a lender to offer a fixedinterest rate period of more than 5 years if it is coupled with an early repayment chargewhich is potentially crippling to a borrower’s finances. Others will no doubt be reflectingon the same issue.’ (Banking Ombudsman, 1999)
7.35 No-one can argue against the need for mark-to-market penalties to be properly explained,and with representative examples that are prominent in the accompanying literature. But thesuggestion that lenders need to act sympathetically ‘where the borrower is not seeking to redeemin order to strike a better deal elsewhere, but is genuinely forced into early repayment by anunexpected change in personal circumstances’ may itself rule out mark-to-market redemptioncharges in practice. Almost anyone could claim that a decision to repay a mortgage is triggered byan unexpected change in personal circumstances. There is no obvious reason why this is arequirement of a fair contract. The dividing line between being forced into early repayment by anunexpected change in personal circumstances and a calculated decision is not straightforward.Examples of grey areas can be moving to a different town to take up a different job, or coming intosome money that enables a borrower to pre-pay the mortgage. Lenders are not encouraged to waivepre-determined charges when borrowers pre-pay due to a change in their personal circumstances.
7.36 Lenders’ fear of litigation costs that could be incurred when deciding whether in such casesborrowers were genuinely “forced into early repayment” or not is understandable. Nor is it clearwhy the lenders should bear the financial loss of the change in the borrower’s personalcircumstances, such as divorce, when no other commercial organisations make allowances for suchchanges. Waiving a mark-to-market penalty means taking a financial loss. Finally, the warningagainst mark-to-market penalties for mortgages with terms longer than five years seems to rule outa contract that has nothing intrinsically unfair about it.
Symmetric mark-to-market pre-payment charges
7.37 If mark-to-market charges were symmetric, when borrowers pre-paid their mortgage at atime of higher market rates (of the relevant maturity) than those in their contract, they would becompensated with a lump sum equal to the market gain to the lender of breaking the contract.There are advantages in such a deal and, more importantly, the advantages benefit both lenders andborrowers. From the borrower’s point of view, it makes the issue of portability irrelevant. Ifborrowers want to carry the amount borrowed forward and be certain about nominal payments inthe future, a fixed-rate mortgage with symmetric mark-to-market redemption charges has the rightcharacteristics. Borrowers would not be stuck in a house that was no longer desired at a time ofhigh interest rates because they wanted to keep their lower fixed rate deal. With symmetric mark-to-market charges, the refund obtained in that situation would offset exactly the increased cost offuture payments on a new mortgage of equal value.
7.38 From October 2004, the FSA regulations of the mortgage sales process will require thedisclosure of maximum redemption charges in the pre-sale disclosure form (the “key facts”illustration). The maximum possible mark-to-market charge would need to be calculated either
82 The Miles Review: Final Report

Enabling cost-effective long-term lending 7assuming that interest rates go down to zero or with a cap on the maximum charge. A completeillustration of symmetric mark-to-market charges would, arguably, need to show the maximumpossible lump sum that the borrower would receive in the case of interest rates being higher thanthe contractual rate at the time of redemption. Since there is no upper limit for interest rates, thisillustration is not feasible.
7.39 Recommendation: that the FSA allow in the pre-sale disclosure form illustration of thepotential gain of early repayment of a mortgage with symmetric mark-to-market charges, as wellas requiring disclosure of the maximum charge.
7.40 Recommendation: that the Government exempts compensation from symmetric mark-to-market charges from tax.
Hedging pre-payment risk with call options
7.41 Pre-payment risk arises in the case of fixed-rate mortgages because they can be, and oftenare, paid off before the scheduled date. When pre-payment occurs, lenders cannot expect toreinvest the pre-paid funds at the contractual rate because interest rates are likely to have moved bythe time the pre-payment option is exercised. Borrowers’ ability to pre-pay at a time whenprevailing interest rates are lower than the contractual rate of the mortgage represents a valuablecall option on the underlying debt.
7.42 One means by which lenders can hedge pre-payment risk is by purchasing call optionswhose value moves in line with that of the borrower’s option to pre-pay the loan. However, theremay not be enough natural writers of longer-term call options in the private sector to create a liquidand efficient market in which options could be bought at a cost which makes this strategy feasible.The question arises as to who might be natural writers of longer-term call options.
7.43 One natural writer of call options is someone that has funding costs that might be hedgedby writing calls. This might include regular issuers of long-term fixed-rate bonds, where there isuncertainty about what coupons will need to be offered on such bonds (due to uncertainty aboutthe future path of interest rates).
7.44 Writing call options could potentially provide a partial hedge against this uncertaintyabout interest rates. But writing calls is risky and whether it does reduce the risk in funding costswill depend on the particular sources of uncertainty and the correlations between them. If thefuture issuer of bonds writes a call option it generates revenues now. Subsequently, the writer of theoption needs to issue a new bond. If interest rates at the relevant maturity have risen (unexpectedly)since the call option was written, the cost of issuing the new bond is higher than had beenanticipated. However, due to the interest rate rise, the call options previously sold to the marketare now more likely to be “out of the money” and so the option would be more likely to expireunexercised. The gain on the option position to the writer offsets the loss from having to issue newbonds with higher yields. Conversely, when interest rates fall unexpectedly the call would be worthmore but the loss on the option position to the writer is offset by the gain from issuing new debtat lower yields. This (overly) simplified example illustrates how call options could potentiallybenefit the writer by providing a hedge against interest rate risk.
83The Miles Review: Final Report

Enabling cost-effective long-term lending77.45 The UK Government has some of the characteristics of the issuer described above. TheGovernment conducts its debt management operations in an environment where there isuncertainty about the general level of interest rates, and the Government cannot controlfluctuations in the sterling yield curve. Some of the volatility in nominal and real interest ratescomes from economic and other shocks originating outside the UK, which increases the variabilityin the cost to Government of debt servicing. There may be some advantages to the UKGovernment in writing call options.
7.46 Whether or not writing calls actually helps smooth debt costs depends on why interestrates are lower or higher than anticipated. There are times when interest rates are low because theeconomy is operating below trend. In these cases, Government writing call options could increasedebt servicing costs, because call options would be exercised at times of rising debt. How great thecorrelation between low interest rates and poor economic performance then becomes relevant.
7.47 So it is not clear whether the UK government writing call options would provide anybenefits in smoothing debt service costs or in reducing uncertainty about the overall cost of thenational debt. And there remains the broader question of whether smoothing debt service costsshould itself be a significant concern of the government. Two key considerations are; (i) the remitof the UK Debt Management Office (DMO); and (ii) the extent to which debt interest costs arepositively correlated with longer-term interest rates. These issues are discussed below.
7.48 Debt Management Office Remit. The Government’s overall debt management policyobjective as published in the Debt and Reserves Management Report 2003-04 (DRMR)5 is:
‘to minimise over the long-term, the costs of meeting the Government’s financing needs,taking into account risk, while ensuring that debt management policy is consistent withthe aims of monetary policy.’
7.49 The DMO Remit for 2003-04 is also published in the DRMR and includes therequirements that put the overall debt management policy objective into effect. In particular theRemit includes requirements:
• ‘to meet the annual remit set by HM Treasury Ministers for the sale of gilts, withhigh regard to long-term cost minimisation taking account of risk; [and]
• to develop policy on and promote advances in new instruments, issuancetechniques and structural changes to the debt markets that will help to lower thecost of debt financing…’.
7.50 The DMO has undertaken research involving quantitative modelling of the characteristicsof the debt portfolio under different issuance strategies over the long-term. Part of this work hassought to quantify the dynamic relationships between the evolution of the debt portfolio, debtinterest charges and the associated risks to the Government.
7.51 Results from the DMO’s modelling work presented in the DRMR include considerationof the extent to which different possible future debt portfolios might affect both the volatility andthe average level of coupon costs as proportions of Gross Domestic Product (GDP).
84 The Miles Review: Final Report
5 The Debt and Reserves Management Report is published by HM Treasury and can be found at:http://www.hm-treasury.gov.uk/documents/uk_economy/debt_management_report/ukecon_dmr_03to04.cfm

Enabling cost-effective long-term lending 77.52 In terms of the criteria for success in debt management used by the DMO, there is at leasta case for considering the merits of the Government writing call options because call options couldpotentially have a beneficial impact both on the average cost, and particularly on the variability ofthe cost, of servicing the Government’s debt. The Government is concerned about the average costof debt and about the risks of debt servicing costs. The relative weights to be attached tominimising likely cost and to minimising risk are not explicit and are also hard to quantify. If thecorrelation between the net value of writing calls and the cost of issuing new debt is positive thenin principle there may be scope to use calls to reduce risk. If there were to be a shortage of naturalwriters of calls then the terms on which calls could be written might be favourable so that as wellas the potential to hedge risk they might also reduce costs. The scope for either potential benefitto exist is very uncertain but is at least worth considering. But writing calls very definitely carrieswith it risks and the case for doing so would need to be carefully evaluated.
7.53 Correlation between debt interest costs and longer-term interest rates. A key consideration iswhether the cost of servicing the national debt is positively or negatively correlated with longer-term interest rates. More relevant (though certainly related) is the correlation between debtservicing costs and the net value of a written call position (i.e. the value of the premium chargedfor the call option less the expiry value of the option written on a longer-term bond). If thecorrelations were positive, writing call options would have potential merit because the premiumreceived from selling call options might partially offset the increased costs of issuing new debt at atime of higher interest rates. But if debt servicing costs and longer-term rates are negativelycorrelated, then Government writing calls would more likely exacerbate volatility and increase risk.
7.54 Chart 7.1 shows central government gross debt interest costs as a proportion of GDP,together with 10-year nominal gilt yields (on the last day of each quarter) for the period 1979Q1to 2003Q4. The correlation coefficient is 0.69; there is a positive relationship between movementsin the two series.
7.55 Chart 7.2 plots the quarter-on-quarter rate of change in the two series. The correlationcoefficient for these series is –0.15 which suggests there is little relationship between the rates ofchange in these series. The correlation coefficient is not statistically significant at the 5 per centlevel.
7.56 The relationship between the fiscal deficit and the net value of a written call position maybe relevant to assessing the desirability of the Government writing call options. Chart 7.3 belowplots public sector net borrowing (PSNB) as a proportion of GDP, together with the ten-yearnominal gilt yield. The correlation coefficient for these series is 0.25, which suggests a weakerpositive relationship than between yields and debt servicing costs. But in both cases the correlationsare positive which is at least consistent with there being a potential hedging role in writing calloptions. These correlations do not show that writing calls should be part of funding strategy; butthey do suggest the question is worth more serious analysis.
85The Miles Review: Final Report

Enabling cost-effective long-term lending7
7.57 It might be argued that the Government writing call options could have a distortionaryimpact via the effect on expectations about yields. In a situation where the Government haseffectively pre-committed to a particular coupon (through writing an option allowing the holderto buy a gilt at par), there could be an impact on market expectations.
86 The Miles Review: Final Report
Chart 7.1: Debt interest costs and 10-year nominal gilt yields 1979Q1 to 2003Q4
Source: National Statistics, Bank of England
0
1
2
3
4
5
6
2
4
6
8
10
12
14
16
1979 1981 1983 1985 1987 1989 1991 1993 1995 1997 1999 2001 2003
10-year gilt yield end-quarter values (lhs)Debt interest cost to nominal GDP ratio (rhs)
Per cent
Chart 7.2: Rate of change in debt interest costs and rate of change in 10-year nominal gilt yields 1979Q2 to 2003Q4
Source: National Statistics, Bank of England
-30
-20
-10
0
10
20
30
40
50
-30
-20
-10
0
10
20
30
40
50
1979 1981 1983 1985 1987 1989 1991 1993 1995 1997 1999 2001 2003
Quarterly rate of change in debt interest cost to GDP ratioQuarterly rate of change in 10-year gilt yield
Per cent

Enabling cost-effective long-term lending 7
7.58 If the Government were to write call options as part of its fiscal/ debt management policy,then adherence to the principle of Transparency as set out in the Code for Fiscal Stability6 wouldrequire publication of information sufficient to allow public scrutiny of the impact of call optionson policy.
7.59 Whilst there could be benefits to the longer-term fixed-rate mortgage market fromGovernment writing options, the potential positive and negative impacts on Government’s widermanagement of the economy and the public finances would need to be carefully considered. Thepotential difficulties of the Government entering an illiquid market are not trivial. The case for theGovernment writing options is that it could be hedging against a rise in long yields and there mightbe a significant demand for such instruments. If the Government is able to influence long yieldsdirectly (through decisions on policy issues such as the inflation target, the fiscal framework,adoption of the Euro and pension fund regulation) this could create a conflict between policydecisions in these areas and the effect on the Government’s finances of writing calls. However, ina world of global capital markets, the extent to which Government policy can impact on long-endyields is not clear. If the UK were to join the euro the impact of UK government policy decisionson the euro yield curve would be small.
7.60 Recommendation: that Government should give further consideration to the potentialcosts and benefits of Government issuing interest rate derivatives.
87The Miles Review: Final Report
6 The Code for Fiscal Stability sets out the key principles that the Government adheres to in its fiscal and debtmanagement policies. These principles are transparency, stability, responsibility, fairness and efficiency. TheCode and further explanation of its contents can be found at: http://www.hm-treasury.gov.uk/documents/uk_economy/fiscal_policy/ukecon_fisc_code98.cfm
Chart 7.3: Public Sector Net Borrowing (PSNB) and 10-year nominal gilt yields 1979Q1 to 2003Q4
2
4
6
8
10
12
14
16
-8
-6
-4
-2
0
2
4
6
8
10
12
1979 1981 1983 1985 1987 1989 1991 1993 1995 1997 1999 2001 2003
Source: National Statistics, Bank of England
10-year gilt yield end-quarter values (lhs)PSNB to nominal GDP ratio (rhs)
Per cent

Enabling cost-effective long-term lending7International Accounting Standard 39
7.61 The Interim Report discussed proposed changes to accounting requirements, which are tobe effected through the adoption of International Accounting Standard 39 (IAS 39). Proposedchanges to IAS 39 could affect the attractiveness of using derivatives to manage pre-payment risk.IAS 39 mandates that all financial instruments held for trading, including derivatives, are reportedon balance sheet at “fair value”.7 In an active market, market price is the best evidence of fair value.Common UK practice (as required by the Statement of Recommended Practice on Derivativespublished by the British Bankers Association) is to measure financial instruments that are held fortrading at fair value, with derivatives held for hedging purposes measured at cost. Under IAS 39,there is a requirement that derivatives held for hedging purposes are to be reported at fair value.
7.62 The European Commission has proposed that all listed companies in the EU should besubject to International Accounting Standards in their group accounts by January 2005. TheInternational Accounting Standards Board (IASB) has embarked on a project to revise IAS 39, inorder to make it easier to implement. The majority of revisions are due to be published in early-2004, in line with this EU deadline.
7.63 A key issue regarding the implementation of IAS 39 is whether it will allow a lender toreport fair values for both the derivatives used in hedging positions and the underlying mortgages.Specific issues (discussed below) were set out in the Interim Report:
• the potential practical difficulties in identifying individual hedging relationshipsbetween a swaption that the lender takes out and the specific mortgage loan thatthe swaption is hedging; and
• the extent to which lenders can accurately value the option to pre-pay a mortgage(particularly where the option is “closely related” to the mortgage contract).
7.64 The Interim Report discussed proposed simplifications in the IASB’s exposure draft of July2003 (to allow for portfolio hedging) that appeared not to be applicable to hedging with swaptions.This suggested that lenders would have had to identify individual hedging relationships betweeneach swaption they take out and the specific mortgage loan the swaption is hedging. Where largevolumes of transactions are involved this could be practically difficult. However, it may not alwaysbe necessary for lenders to account “line-by-line” for each hedging relationship under IAS 39. Forexample, if a group of loans are similar in that they were all of the same type and were taken outat approximately the same time, they could be accounted for together.
88 The Miles Review: Final Report
7 ‘Fair value’ is defined in IAS32 ‘Financial Instruments: Disclosure and Presentation’ as ‘the amount for which anasset could be exchanged, or a liability settled, between knowledgeable, willing parties in an arm’s lengthtransaction’. In an active market, the market price is the best evidence of the fair value of a financial instrument.But this may not be the case when, for example, there is infrequent activity in a market or an instrument is nottraded in an organised financial market. In such circumstances, it may be necessary to use a different basis toestimate fair value e.g. by using a valuation technique.

Enabling cost-effective long-term lending 77.65 One of the criteria in accounting, under IAS 39, for the pre-payment option in a mortgageis whether or not the economic characteristics of the option are deemed to be “closely related” tothe mortgage contract. Where the pre-payment option is not “closely related” to the contract, thepre-payment option is required to be separated from the mortgage and the derivative used to hedgeit is measured at fair value. To the extent that the hedge is effective (that is, changes in the value ofthe pre-payment option are equal and opposite to changes in the value of the derivatives) there willbe a zero effect on reported profit and loss. Therefore, it is possible for lenders to obtain a matchbetween the fair value of the pre-payment option and the fair value of the derivative used to hedgeit without the need for hedge accounting. Where the pre-payment option is “closely related”, it isnot separated from the loan which is accounted for at cost, although the pre-payment option canbe reported at fair value if the change in fair value is hedged and the effectiveness of the hedge canbe measured.
7.66 The IASB has indicated in its January 2004 “Update” (which sets out IASB decisions oninternational financial reporting standards), that assessment of the effectiveness of a hedge may bebased on measuring the change in the value of the entire mortgage (including the pre-paymentoption embedded in it). This form of assessment would allow a financial entity to qualify formacro-hedge accounting.8 The IASB’s decision clarifies that macro-hedges using derivatives canqualify for hedge accounting and that effectiveness can be assessed based on the change in the valueof the mortgage including the embedded option, thus removing any accounting obstacle to thiskind of hedging strategy. Furthermore, the loans included in a macro-hedge do not need to be“similar”, rather they need only to share the risk for which they are being hedged.
7.67 This Review has considered the potential impact of IAS 39 on accounting for fixed-ratepre-payable debt and associated derivatives in the context of its remit to look at factors limiting thedevelopment of the longer-term fixed-rate mortgage market in the UK. Clarifications made by theIASB since publication of the Interim Report are likely to ease any difficulties lenders might facein valuing the option to pre-pay a mortgage (including where the option is “closely related” to themortgage contract). Moreover, the potential practical difficulties in matching individual hedgingrelationships with specific mortgage loans will be eased to the extent that groups of loans share therisk for which they are hedged and qualify for macro-hedge accounting. These clarifications addressthe issues raised in the Interim Report regarding whether IAS 39 will allow a lender to report fairvalues for both the derivatives used in hedging positions and the underlying mortgages.
Data necessary to estimate pre-payment
7.68 The Interim Report identified the limited amount of data available to estimate pre-payment rates as one obstacle that could hinder the efficient funding and hedging of fixed-ratemortgages. Lack of pre-payment data makes hedging pre-payment risk more difficult. Pass-throughmortgage-backed securities or callable bonds are likely to be more expensive as a funding option.The only hedging alternative where the lender can be fully protected from pre-payment risk thatdoes not need pre-payment data is mark-to-market redemption charges.
7.69 As the Interim Report stated, there is no easy way to solve this start-up problem of limiteddata. Enough data may in time be accumulated to make pricing more efficient, and a trade bodysuch as the CML could play an important role in pooling data across lenders.
89The Miles Review: Final Report
8 Macro-hedging is the hedging of a portfolio of assets and liabilities for the same type of risk. A macro-hedge isdesigned to reduce or eliminate risk resulting from the entire portfolio rather than the risk arising from aparticular asset or liability within the portfolio. Macro-hedging would enable fair value hedge accounting to beused more readily for a portfolio hedge of interest rate risk.

REGULATORY ISSUES
The new capital adequacy regime
7.70 Current capital adequacy requirements stem largely from the first Basle Accord, agreed in1988, and its transposition into EU legislation. The Accord sets a minimum capital adequacy ratioof capital to risk weighted credit exposures at 8 per cent (of which core capital must account for atleast half ). The current risk weight for residential mortgage lending held on balance sheet is 50 percent.
7.71 Development of the new Basle Accord has the aim of setting out a more comprehensiveand accurate approach to risk. Following closure of the third Basle consultation exercise on 31 July2003, the Basle Committee intends to ratify a final version of the new Accord by mid-2004. TheAccord is due to take effect in all G10 countries from 31 December 2006. The EuropeanCommission is expected to publish proposals for a new Capital Adequacy Directive (commonlyreferred to as CAD3) in Summer 2004. This directive will be the means by which the new BasleAccord will be transposed into EU legislation. Once the CAD3 proposals have been formallymade, both the European Council and European Parliamentary processes will begin, with Councilworking groups expected to begin during 2004.
7.72 The minimum requirement of capital to risk weighted exposures remains at 8 per cent inthe proposed new Accord. Three options are proposed for firms in calculating the credit riskelement of their capital requirements; (i) the Standardised Approach (SA); (ii) the FoundationInternal Ratings Based Approach (FIRB); and (iii) the Advanced Internal Ratings Based Approach(AIRB). A stringent set of systems and data requirements will have to be met in order for lendersto qualify for the IRB approaches. For retail lending, including residential mortgage lending,lenders will only be able to choose between the SA and AIRB approaches. It is uncertain how manylenders will qualify for the AIRB approach and much depends on systems work undertaken bylenders before implementation.
7.73 The CAD3 proposals could have an impact on the capital treatment of fixed-ratecompared with variable-rate mortgages. The FSA’s initial proposals for implementation of CAD3in the UK suggest that where firms can provide sufficient evidence to demonstrate that there is adifferent risk profile for particular mortgage products then different capital treatments will beaccepted. Most (and perhaps all) UK mortgage lenders have little historic data that reflects thedifferent credit risks of longer-term fixed and variable-rate mortgages. Where firms use estimatesof credit risk which are not the same as historic experience, the FSA has said firms must explicitlyjustify why the estimates are not the same as historic experience. Evidence has to be sufficient todemonstrate why lower risk weights for certain mortgage products are justified.
90 The Miles Review: Final Report
Enabling cost-effective long-term lending7

Enabling cost-effective long-term lending 77.74 There are several sources of evidence on differences in risk characteristics of fixed- andvariable-rate mortgages. Much of the academic literature in this area focuses on the US mortgagemarket, analysing mortgage contracts which have embedded options for the borrower either todefault or to pre-pay the loan.9 Empirical studies based on US data do suggest there are differencesbetween the default behaviour of fixed and variable-rate mortgages. US variable-rate mortgages(known as adjustable-rate mortgages or ARMs) are more likely to default than fixed-rate mortgages(FRMs), although this is partly explained by the fact that ARMs tend to be taken out by sub-primeborrowers (rather than because of inherent differences between ARM and FRM contracts). Forexample, Vanderhoff (1996) compared default probabilities of ARMs and FRMs using US data atmetropolitan area level for loans originated in the 1980s and 1990s. Results suggested ARMs havea higher default rate than FRMs. Calhoun and Deng (2002) analysed US data for around 1.3million loans originated between 1979 and 1993. They found that average rates of default bymortgage age were initially higher for ARMs than for FRMs, although there was a more rapidimprovement in the ARM risk profile than the FRM risk profile as mortgage age rose. Studies alsoshow that changes to factors such as payment to income ratios affect the probabilities of default onARMs to a greater extent that default probabilities on FRMs. For example, Cunningham andCapone (1990) present simulations which show ARM default probabilities are more sensitive thanFRM default probabilities to changes in payment to income ratios.
7.75 In the UK, default generally occurs because the borrower is no longer making thepayments due to the lender. The result can be repossession of the property, but withoutcancellation of the outstanding amount owed by the borrower, unlike in the US. This suggests thatthe cost of defaulting on a mortgage will be much greater for the UK borrower than for the USborrower. However, it does not imply that US mortgage default is costless. For example, costs ofexercising the option to default on a US mortgage may include loss of access to credit (at least fora period after default), higher costs of credit in future and reduction in employment opportunities.
7.76 Although most UK mortgage lenders have little historic data that reflects the differentcredit risks of longer-term fixed and variable-rate mortgages, there remains the potential for datato be compiled by UK lenders in future which could better help to distinguish the riskcharacteristics of fixed and variable-rate mortgages in the UK.
7.77 Recommendation: that the FSA should allow a broad range of different types ofevidence (in addition to UK historic data) to be part of an assessment of the default risk ofdifferent mortgage contracts. Relevant evidence might include simulation results (for example,based on Monte Carlo simulations10) as well as simulations of the kind set out Section 2 of theInterim Report. These simulations looked at the relative risk characteristics of fixed and variable-rate mortgages. A set of common assumptions were used, including assumptions about the rate ofreal income growth and the ratio of loan to gross income. Simulations showed the evolution of therepayment burden under different assumptions about what happens to inflation and interest rates.
91The Miles Review: Final Report
9 Options theory views mortgages as bonds issued by borrowers who retain embedded call (pre-payment) and put(default) options. The borrower will exercise the call (put) option and pre-pay (default on) the mortgage if this isfinancially advantageous. For example, the borrower might exercise the option to default if the presentdiscounted value of future mortgage payments were higher than the market value of the house.10 Monte Carlo simulations are an analytical technique where a large number of simulations are run usingrandom quantities for uncertain variables. A distribution of results is then created from which inferences aredrawn.

Enabling cost-effective long-term lending7Updating the calculation of building society funding limits
7.78 Legislative limits imposed upon building societies’ funding structure could act as anobstacle to their involvement in the development of long-term fixed-rate lending (paragraphs 5.88to 5.91 of the Interim Report set out the details). The Building Societies Act 1986 sets fundingand lending limits, or “nature limits”, on building societies. Following the amendment to the Actthat took place in 1997,11 at least 50 per cent of the funds raised by a building society must be inthe form of members’ funds. If there were a significant increase in long-term, fixed-rate lending,this requirement could place building societies at a disadvantage to other mortgage lenders iftapping wholesale markets turned out to be the most effective way of funding fixed-rate lending.Another potential hurdle stems from the new rules on international accounting standards. Atpresent, securitised assets do not count towards the funding limits of building societies. Once theinternational accounting standards come into force, securitised assets will have to be reported insocieties’ accounts and, under the current arrangements, will count towards the funding limit. Thissection considers both issues.
Funding limits constraints
7.79 About 24 per cent of outstanding funds invested with building societies were from non-members at the end of 2002. Among the ten biggest building societies, the lowest ratio of non-member funds was just over 9 per cent, and the highest was 39 per cent. Overall, five buildingsocieties reported non-member funding ratios above 30 per cent. By 2003, 30 per cent of alloutstanding funds were from non-members12,13. This rapid change in the stock figure reflected asharp decrease in the flow of new funds into building societies accounted for by members.
7.80 If this decline continues, some building societies may be close to the 50 per cent limit offunding by non-members in the near future. A potential shift in the UK mortgage market towardssubstantial longer-term fixed-rate lending could intensify this trend. The current funding limits donot generate significant constraints on building societies. It is possible that even in the event of verymuch more long-term fixed-rate lending in the UK, building societies would find that continuingto be funded largely by variable-rate deposits and using swaps and swaptions markets to get rid ofinterest and pre-payment risk would turn out to be the most efficient route. But, in the case thatthe use of wholesale funding turned out to be the most effective funding source, building societiescould struggle to compete.
7.81 The possible relaxation of the funding limits of building societies raises two importantissues: the nature of building societies, and the protection of their members’ deposits in case ofinsolvency.
92 The Miles Review: Final Report
11 The 1997 amendment was in itself a liberalisation that relaxed the funding limits.12 Not all non-member funding is wholesale. Much is invested through societies’ offshore subsidiaries and hasretail characteristics.13 KPMG, “Building Societies Database”, 2003 and Building Societies Association’s submission to the Review,23/01/2004.

Enabling cost-effective long-term lending 77.82 The aim of the funding – and lending – limits placed on building societies is to ensurethat they retain their specific purpose. If how the building societies’ assets are funded is whatdefines a building society, then any change to the funding limits is potentially problematic. But theessential characteristic of building societies is that they are mutuals that take funds from membersand that make mortgage lending on residential properties their primary business. Building societiesare set up and owned by members with the aim of providing lending to finance house purchases.To fulfil their aims they need to raise funds in the most efficient way. If the key characteristic ofbuilding societies is that they are run in the interest of members and a 50 per cent funding limitprevents them from offering their members competitive mortgages, then there is a prima facie casefor reviewing the funding limit. In principle, building societies can continue to fulfil one of theirroles of accepting funds from members even if a majority of funds do not come from members.
7.83 A second important implication of any change to the nature limits is the protectionawarded to depositors in the event of a building society’s insolvency. Members' funds rank behindwholesale funds in the event of liquidation.14 Holders of the debt of a building society have priorityover members with regard to its assets. In some ways members would find themselves in a similarposition to that of shareholders if a society is liquidated. If the limit on retail funds from memberscame down from the current 50 per cent to a lower level such as 30 per cent or 20 per cent, thenin some sense the gearing of members’ funds would increase. If a society being liquidated had 70per cent of its funding from non-members, its assets would need to cover a higher volume of claimsby creditors than if only 50 per cent of its funding were from non-members. A smaller number ofmembers’ funds would have to make up for the shortage of assets, increasing the risk to members’deposits.
7.84 Protecting members’ deposit is important. Funding limits may in fact weaken buildingsocieties’ positions by not allowing them to compete for efficient funding if long-term fixed-ratelending becomes more prevalent in the UK. Members’ interests are not protected if the societiescannot lend efficiently.
7.85 The risk to members’ funds is monitored by the regulator and affected by the capitaladequacy regime to which building societies are subject. An additional – and substantial – line ofprotection for members who have provided funds is afforded by the Financial ServicesCompensation Scheme. The scheme is triggered when an authorised firm goes out of business. TheScheme may also be triggered when the FSA considers that an authorised firm is unable to repayits depositors, or is likely to be unable to do so. The maximum level of compensation that adepositor can receive from the Scheme for a deposit claim is £31,700 (100 per cent of £2,000 and90 per cent of the next £33,000). The compensation limit applies to each depositor and covers thetotal of all their deposits held with that firm.15 The five biggest building societies have the followingdistribution of member funds: 62 per cent of members have less than £2,000, 33 per cent ofmembers have between £2,000 and £35,000 and five per cent have more than £35,000.16
93The Miles Review: Final Report
14 Building societies raise two types of funds on a subordinated basis - term subordinated debt and permanentinterest bearing shares (PIBS -essentially a perpetual instrument). These funds are intended to (and usually do)qualify as capital resources for regulatory purposes, and so are specifically excluded from the member/wholesaledeposit ratio calculation. However, in 2002 the amount of subordinated funds was just 1 per cent ofunsubordinated shares and deposits. Other capital - retained profits (reserves) was then 5.8 per cent ofunsubordinated shares and deposits (BSA data).15 Each individual in a joint account is eligible to receive compensation up to the maximum limit in respect oftheir share of the deposits (it will assumed that the split is 50/50 unless evidence shows otherwise).16 These figures do not adjust for people being members of more than one building society.
Enabling cost-effective long-term lending77.86 With regard to the funding limits there are three options; (i) to do nothing; (ii) to useprimary legislation to change the limits affecting building societies; or (iii) to change the fundinglimits with secondary legislation.
7.87 Option (i): Building societies could continue to operate within the current limits. If a largeproportion of UK mortgage lending were fixed for a longer period, they could use the swaps andswaptions markets. New legislation could be passed in the future if the limits proved to be aconstraint.
7.88 Option (ii): The second alternative is to change the Building Societies Act 1986 throughprimary legislation. Section 5 (1) of the Act states that the “purpose or principal purpose is that ofmaking loans which are secured on residential property and are funded substantially by itsmembers”. The requirement of “substantially funded by members” can be modified with primarylegislation. Primary legislation is a very costly option since there is a premium on parliamentarytime.
7.89 Option (iii): The final option is to use secondary legislation to modify the funding limit.The Building Societies Act 1986 provides a secondary legislation route for altering the lendinglimit17 which is at Section 6 of the Act, not for altering the funding limit at Section 7 of the Act.However, there is the option of using a Regulatory Reform Order to amend the funding limit. Thisis a type of secondary legislation which enables the government to amend legislation by Ordermade under the Regulatory Reform Act 2001. This route can be used where an amendment is toreform legislation which has the effect of imposing burdens affecting persons in the carrying outof any activity. The funding limit may be a burden of the type meant by the Regulatory ReformAct. The funding limit imposed by Section 7 of the Building Societies Act could be amended byRegulatory Reform Order (RRO). An RRO takes longer than other types of secondary legislation– between nine months and a year.18 This route would not modify the requirement that buildingsocieties be substantially funded by members.
7.90 Recommendation: that Government consider lowering the minimum funding limit bynon-members from the current 50 per cent. 25 or 30 per cent of building societies’ funds comingfrom members would still represent a substantial source of funding.
International Accounting Standard 39 and securitised assets
7.91 This section considers the second potential hurdle for effective funding of long-term fixed-rate mortgages by building societies: the possible inclusion of securitised assets in the calculationof wholesale funding used in assessing the funding limits.
94 The Miles Review: Final Report
17 Section 6 of the Building Societies Act 1986 states that no more than 25 per cent of business assets (total assetsminus liquidity, fixed assets and long-term insurance funds) can comprise assets other than loans fully secured onresidential property.18 The reason it takes so much longer is that the order has to be cleared by Cabinet Office Legal Advisers, theRegulatory Impact Unit and Parliamentary Counsel. The order has to be made available for consultation for atleast 12 weeks. Then there is first stage scrutiny by a Commons Committee and a report on the draft RRO froma committee of each house. 60 days after that stage the RRO can be laid for second stage scrutiny and if bothHouses of Parliament approve the Order then the Minister can make the RRO.

Enabling cost-effective long-term lending 77.92 The introduction of international accounting standards and, in particular, IAS39, willmean that securitised assets will have to be reported in societies’ accounts. Under the currentarrangements, the funding limit would be calculated on the basis of the accounts, including thenon-recourse funding raised through securitisation. Some building societies currently securitise asubstantial proportion of their mortgages, and this change could hinder the ability to continueusing this route. If long-term fixed-rate mortgage lending became more popular in the future, andsecuritisation were a more efficient funding route, this would place a constraint on buildingsocieties. The inclusion of securitised assets in the calculation of the funding limits is anunintended consequence of the introduction of the international accounting standards that in factchanges the rules within which building societies operate.
7.93 Recommendation: that the Government change the way in which wholesale funds aremeasured for assessing nature limits to enable building societies to continue to excludesecuritised assets if IAS39 is adopted.
95The Miles Review: Final Report

96 The Miles Review: Final Report

The Miles Review: Final Report 97
8 RECOMMENDATIONS ANDCONCLUSIONS
SUMMARY
8.1 There are great strengths in the UK housing finance system. Lenders compete in a marketwhere innovation in products has been impressive; loans are available to a high proportion of thepopulation; homeownership has risen steadily for decades and has risen greatly amongsthouseholds at the lower end of the income distribution. But there are problems and some of theseexplain why so few mortgages in the UK are at longer-term rates of interest.
8.2 Evidence presented in Section 2 of this Report suggests that a substantial proportion ofhouseholds – particularly those borrowing more than average relative to their income and thosewhose incomes are uncertain – can get benefits from fixing the level of nominal repayments forseveral years. Yet few of such borrowers take out longer-term fixed-rate mortgages. Thesehouseholds are taking on substantial risk by borrowing a large amount relative to their incomes atinterest rates that are variable or only fixed for a year or so.
8.3 Several factors play a role in accounting for this, in particular:
• When choosing between mortgages, many borrowers attach great weight to thelevel of initial monthly repayments and too little to the likely overall cost ofborrowing over the life of the loan.
• Many borrowers’ understanding of interest rate risk is poor. The type of advice andinformation many people receive does not help them as much as it could inunderstanding these risks.
• The structure of mortgage pricing generates cross-subsidisation from manyexisting borrowers, a significant proportion of whom are paying standard variablerates (SVR), to new borrowers taking out discounted variable and short-termfixed-rate mortgages. This creates unfairness and makes the market less transparentthan it could be. It plays to a tendency of many borrowers to focus on the initialmonthly payments on a mortgage and it makes medium-term and longer-termfixed-rates appear expensive.
• There are also a number of potential legislative and regulatory barriers to the costeffective funding of longer-term fixed-rate lending and the way in which earlyredemption charges are structured.
8.4 Monetary policy will be easier to manage if households make well-informed decisionsabout mortgage products that are priced in a transparent and sustainable way and where the risks of different types of mortgage are well-understood. Risks of over-indebtedness, debtaffordability and excess volatility in the housing market – problems that can make monetary policymore difficult to operate – would be reduced. This is desirable whether or not the UK adoptsthe euro.

RECOMMENDATIONS AND CONCLUSIONS88.5 This Final Report makes recommendations on how the mortgage market in the UK canbe helped to work better. The recommendations are based on the analysis of problem areas onwhich evidence is presented both in the Interim Report and in this Report. If acted upon theserecommendations will:
• improve the information and advice households receive;
• make the pricing of mortgages in the UK more transparent, fairer and sustainable;
• remove some potential obstacles to the emergence of new types of contract whichallow borrowers to hedge interest rate risk; and
• improve the ways in which fixed-rate mortgages can be funded and the ways inwhich the risks they generate can be hedged.
8.6 The recommendations fall broadly into two groups: first, those that are aimed atimproving the advice and information that borrowers receive and at creating a fairer and moretransparent pricing structure (recommendations 1 to 10); second, those that are aimed at helpinglenders fund mortgages and handle risk in the most cost-effective way (recommendations 11 to20). Many of the recommendations in the first group reflect the current best practice of lendersand financial advisors. The second group of recommendations have the potential to reduce the costto lenders of offering several different types of mortgage. The issues which promptedrecommendations, and the recommendations themselves, are summarised below.
RECOMMENDATIONS
Improving borrowers’ understanding
8.7 The information people have on mortgages and the nature of advice they receive play amajor role in their choices over mortgage products. Issues discussed in Section 4 of the FinalReport focus on advice, information and borrowers’ understanding.
Issue: There is strong evidence that suggests that many borrowers tend to focus excessively on theinitial monthly cost of a mortgage and do not have a good understanding of the interest rate riskassociated with different mortgage products. The advice that borrowers receive often does not helpas much as it could in explaining these risks.
Recommendation 1: that the FSA requires that, to discover consumer attitudes to risk and henceassess a customer’s preferences, it is essential for mortgage advisors to cover personalised “whatif” scenarios, of the sort illustrated in Annex A of this Report.
Issue: If mortgage advisors are to give good advice they need to understand the risk characteristicsof the different products they are recommending and the way in which their cost to borrowersmight evolve.
Recommendation 2: that the Financial Services Skills Council should require appropriateexaminations for mortgage advisors to cover the role of expectations in the term structure ofinterest rates, the potential degree of volatility in interest rates and the evolution of mortgagerepayments under different scenarios.
98 The Miles Review: Final Report
Improving thestandard of advice

RECOMMENDATIONS AND CONCLUSIONS 8Issue: There is evidence that many consumers have a poor understanding of the interest rate riskof different types of mortgage. It is important that borrowers have an indication of the potentialvariability in interest rates.
Recommendation 3: that the FSA requires that, in addition to the current warning, a clearindication of variability in rates over the past, and the impact of such variability on mortgagemonthly repayment, is shown in the pre-sale disclosure form.
Recommendation 4: that the FSA revises its mortgage information leaflet to include, in aconsumer friendly style, the type of information contained in Annex A and that it engages withthe Council of Mortgage Lenders, the Association of Mortgage Intermediaries and otherstakeholders to identify the most effective distribution method.
Issue: There is a low level of financial literacy in the UK. Lack of financial literacy has seriousimplications in the mortgage market due to the scale and longevity of the commitment borrowersare typically taking on.
Recommendation 5: that the Financial Capability Steering Group includes improvingconsumers’ understanding of the risks of mortgage borrowing among its strategic priorities.
Recommendation 6: that the Financial Capability Steering Group seeks to increase the financialresources dedicated to improving financial capability and that part of that funding comes froma levy on the financial services industry.
Fairer pricing in the UK
8.8 Competitive pressures on lenders shape both the pattern of pricing in the UK mortgagemarket and the nature of products offered. The structure of pricing and the range of productsreflects competition in the mortgage market – which in itself is desirable – but it may also reflectthe tendency of many borrowers to focus excessively on the level of the initial payments andinsufficiently on the range of possible repayment costs some years ahead.
Issue: Some mortgage lenders distinguish between customers on the basis of whether they are afirst-time buyer, someone who is re-mortgaging from another lender or an existing customer.Where there are differences in mortgage rates offered to these different groups they do not reflectdifferences in risk for the lender. They also create a barrier to some borrowers getting bettermortgages and can mean that switching to another lender – which is costly – is the only way to getthe best deals.
Recommendation 7: that the FSA requires that lenders make their full range of mortgageproducts available to all borrowers.
Issue: The process of switching a mortgage can act as a barrier to borrowers re-mortgaging, surveyevidence shows that some borrowers perceive the process to be costly.
Recommendation 8: that the FSA creates a short user-friendly guide on the process ofremortgaging to aid borrowers. This guide should be available through the FSA’s consumerhelpline and its website.
99The Miles Review: Final Report
Improving pre-saledisclosure
Reducingswitching costs
Improving post-sale disclosure
Increasingfinancial
capability

RECOMMENDATIONS AND CONCLUSIONS8Issue: Borrowers should be aware of sources of comparative information. The FSA maintainsextensive mortgage comparative tables on its website. The aim of the tables is to enable consumersto make informed decisions when they shop around and compare mortgages, and to helpconsumers focus on the longer-term costs of a mortgage.
Recommendation 9: that the FSA requires firms to include the exact website address for thecomparative tables (www.fsa.gov.uk/tables) and a short description of their purpose in allmandatory disclosure documentation.
Issue: Borrowers should be aware of all of the mortgage products that their lender offers.
Recommendation 10: that the FSA requires that lenders include, with Annual Statements, aleaflet setting out the current mortgage rates on all their products.
Alternative protection from nominal payment uncertainty
8.9 Fixed-rate mortgages provide certainty over the profile of nominal payments over a givenhorizon and give insurance against the risk of rising interest rates. There are alternative ways inwhich borrowers can protect themselves against interest rate fluctuations. These include cappedmortgages, stepped fixed rates and part variable/part fixed-rate mortgages. If interest rate capscould be sold separately from the mortgage this would protect against interest rate movementswhile offering greater flexibility.
Issue: There is uncertainty about the tax and regulatory treatment of stand-alone interest rateinsurance and this could be an obstacle to the development of such products.
Recommendation 11: that the Government treat interest payment protection as insurance fortax purposes, provided that the sum assured is no greater than that part of a mortgage with avariable interest rate. The income received as compensation should not be subject to tax. Forneutrality with the treatment of capped rate mortgages, the premium on stand alone interest ratepayment protection should pay a zero rate of insurance premium tax.
Recommendation 12: that the FSA treat such a product as insurance for regulation of salepurposes.
Enabling cost effective long-term lending
8.10 There are supply side factors affecting how mortgage lending is funded that might inhibitthe emergence of a more substantial market in longer-term fixed-rate mortgages. How mortgagesare funded is a crucial factor behind the cost of making different types of loans. That in turn playsa role in determining the relative prices of different sorts of mortgage.
Issue: One route by which lenders could fund longer-term fixed-rate mortgages would be byissuing bonds (in particular, covered bonds). However, the lack of specific covered bond legislationin the UK could be an obstacle to the development of a UK covered bond market.
A lack of specific legislation could prevent recognition of these bonds for the purposes of the Co-ordination Directive on Undertakings for Collective Investments in Transferable Securities(UCITS). This would reduce the extent to which European investment funds can invest in UKissued covered bonds. However, current UK insolvency law may be sufficient to allow recognitionfor the purposes of UCITS.
100 The Miles Review: Final Report
Covered bonds
RECOMMENDATIONS AND CONCLUSIONS 8Recommendation 13: that the FSA should provide a definitive view on whether or not currentUK insolvency law is sufficient to allow for the recognition of covered bonds under the UCITSDirective.
Issue: If a requirement for specific covered bond legislation were to be included in any newdefinition of covered bonds under the new Capital Adequacy Directive (CAD3), this would meanlegislation in the UK would be needed in order to allow UK lenders to get more favourable capitalweightings for these bonds than is currently possible.
Recommendation 14: that the Government should aim to ensure that CAD3 does not requirespecific UK covered bond legislation.
Issue: Mark-to-market redemption charges for pre-paying fixed-rate mortgages appear to beunenforceable in the UK. This may mean that the range of fixed-rate products offered tohouseholds is restricted and types of mortgage with desirable features are not offered. Symmetricmark-to-market charges – where a payment can be made to the borrower on redemption – couldbe particularly attractive to some borrowers.
Recommendation 15: that the FSA allow in the pre-sale disclosure form illustration of thepotential gain of early repayment of a mortgage with symmetric mark-to-market charges, as wellas requiring disclosure of the maximum charge.
Recommendation 16: that the Government exempts compensation from symmetric mark-to-market charges from tax.
Issue: Interest rate derivatives – including call options – can provide a hedge against uncertaintyabout pre-payment rates on fixed rate mortgages. Call options could help mortgage lenders managepre-payment risk. Writing call options could have the potential to help reduce volatility for regularissuers of long-term fixed-rate bonds, when there is uncertainty about future interest rates. TheGovernment is one such issuer.
Recommendation 17: that Government should give further consideration to the potential costsand benefits of Government issuing interest rate derivatives.
Issue: The CAD3 proposals are likely to have an impact on the capital treatment of fixed-ratecompared with variable-rate mortgages. The FSA’s initial proposals for implementation of CAD3in the UK suggest that, where firms can provide sufficient evidence to demonstrate that there is adifferent default risk profile for particular mortgage products then different capital treatments willbe accepted.
Recommendation 18: that the FSA should allow a broad range of different types of evidence (inaddition to UK historic data) to be part of an assessment of the default risk of different mortgagecontracts.
Issue: Building societies may run up against legislative limits on the proportion of funding thatmust come from members if wholesale funding or securitisation of mortgages emerged as the mosteffective means to fund fixed-rate mortgages.
Recommendation 19: that Government consider lowering the minimum funding limit by non-members from the current 50 per cent. 25 or 30 per cent of building societies’ funds comingfrom members would still represent a substantial source of funding.
101The Miles Review: Final Report
Mark-to-marketcharges
Call options
Capital adequacy
Nature limits
Recommendation 20: that Government change the way in which wholesale funds are measuredfor assessing nature limits to enable building societies to continue to exclude securitised assets ifIAS 39 is adopted.
CONCLUSIONS
8.11 Changes to the mortgage finance system in the UK will not come overnight. But themortgage market has the potential to change rapidly. Over 16 per cent of borrowers moved theirmortgage to a new lender in 2003 (in addition, a number of borrowers will have changed theirmortgage product with their existing lender). With this scale of remortgaging the nature of thestock of mortgages can change rapidly.
8.12 Between 1993 and 2003 the proportion of new lending for house purchases in the formof endowment mortgages fell from 64 per cent to 4 per cent, with falls of up to 13 percentagepoints in one year. More recently, the proportion of different types of mortgage has also changedrelatively quickly. The numbers of tracker mortgages rose from close to zero to about 20 per centof the mortgage stock between December 1999 and December 2003. The proportion of (largelyshort-term) fixed-rate products rose by seven percentage points between December 2002 andDecember 2003. Recent history suggests that the mortgage market can change rapidly.
8.13 If acted upon the recommendations in this Report have the potential to change the UKmortgage market and make it work better. This will be to the benefit of borrowers, lenders, otherfinancial intermediaries and the savers whose funds are channelled through the market.
102 The Miles Review: Final Report
RECOMMENDATIONS AND CONCLUSIONS8

The Miles Review: Final Report 103
A Guide to giving advice
This Annex is an outline of how some of the risk and cost issues could be explained to borrowersand some relevant information presented. It is intended as a guide to how some important aspectsof advice could be given. It is aimed at those giving advice on mortgages.
CHOOSING A MORTGAGE
How much you borrow to buy a house or flat and what type of mortgage you take out are long-term decisions. Most mortgages have a repayment period of between 25 and 30 years – 25 years istypical. While you will probably move house and change mortgage several times over this period,your mortgage debt is likely be there for a long time. So it is particularly important that you don’ttake a decision on the amount and type of your mortgage just on the basis of what might happenover the next year or so.
Some Points to Consider
• If your income drops, how will this affect your ability to meet the interest and loanrepayments on your mortgage?
• If you choose later on to get out of your present mortgage because it becomesexpensive, don’t expect to replace it with another at similar or better terms to thoseavailable today.
• What looks like a more expensive mortgage today because it has a higher monthlyrepayment may end up being a better one. For example, it might have a long termfixed rate providing insurance against interest rate rises. Or it might provide a capor ceiling on monthly repayments even if interest rates rise unexpectedly. Or itmight provide lower penalties if you choose to repay the mortgage early.
• Have you taken a serious look at what might happen to the cost of borrowing inthe future?
What if?
Mortgages differ depending on what happens to the cost of borrowing. On a variable ratemortgage, you will be exposed to higher monthly payments if interest rates rise. On a fixed ratemortgage, you could miss out on a better deal if the cost of borrowing falls.
Predicting the future of interest rates is no science. However, a useful pointer to what the costof borrowing might be over the next five years can be found in how the financial markets viewthe future. The following chart reflects how those who trade in financial markets see howinterest rates might move in the future. The figures are taken from Bank of England estimatesof forward rates in the money markets and can be found on the websitewww.bankofengland.co.uk/statistics/yieldcurve.1
1 The figures illustrated in these tables are only a rough estimate of forward rates.

Guide to giving adviceA
Let us assume you take out a mortgage of £75,000 repayable in 25 years. How would a fixed-ratemortgage of 5.5 per cent (1.5 per cent above the Bank of England’s Base Rate) compare over, say,six years with a variable interest rate which tracks Base Rate?
The following tables compare the two mortgages under these different scenarios. They are basedon a 25 year repayment mortgage but focus on payments over the first six years of the mortgage.
Interest rate movements are uncertain. So it is useful to show what happens if rates move up bymore than people think or turn out lower than general expectations. The degree of uncertaintyillustrated in these tables reflects the kind of volatility we have seen in interest rates over the last 50years.
If rates are unchanged over this period, then over the first six years you would be about £1,390better off with a variable rate mortgage. However, if rates move up according to City forecasts, youwould be about £845 worse off with a variable rate mortgage.
And if rates moved much higher than City forecasts and increased gradually to 8.5 per cent in sixyears time, the variable rate mortgage would cost you over £9,000 more than a fixed rate at 5.5 percent over the next six years.
On the other hand, a sharp unexpected downward movement in interest rates taking them downto 1.5 per cent by the sixth year would mean that a variable rate mortgage would be over £6,000cheaper than the fixed-rate deal over a six year period.
Your assessment of the risks of changes in the cost of borrowing also needs to take account ofmovements in house prices. If interest rates rise sharply, the price of your house may fall and thiswill affect your ability to pay off the mortgage by selling and moving to another property. Interestrates and house prices are more likely to move in opposite directions than go the same way.
104 The Miles Review: Final Report
Chart A1: Bank of England’s forward rates on 12/02/04
Source: Bank of England
4.1
4.2
4.3
4.4
4.5
4.6
4.7
4.8
4.9
5.0
4.1
4.2
4.3
4.4
4.5
4.6
4.7
4.8
4.9
5.0
876543210
Per cent
Years ahead

Guide to giving advice ASo the questions you need to ask yourself include:
• How far do interest rates have to rise to make a variable rate mortgage moreexpensive than a fixed rate one?
• How would I cope if interest rates move up more than most people think likely?
• If I decide to sell and move house, is a fixed rate mortgage transferable to my newproperty? Will I incur a penalty if I repay part of my loan?
Mortgages differ by risk. Some will expose you to the risk that interest rates rise; others that youmay miss out on a good deal later if interest rates fall. Which risk really hurts you most?
25 Year Repayment Mortgage of £75,000
Base rate tracker mortgage and 10-year fixed-rate mortgage compared. Base rate mortgage has aninterest rate of base rate plus one per cent; fixed rate is 5.5 per cent. Base rate tracker pays5 per cent initially.
Unchanged Rates:
Tracker monthly Change from Ten-year fixed-rate Base ratepayments initial monthly mortgage monthly (start year)
payments payments(£) (£) (£)
Year 1 422 442 4%
Year 2 422 0 442 4%
Year 3 422 0 442 4%
Year 4 422 0 442 4%
Year 5 422 0 442 4%
Year 6 422 0 442 4%
Total paymentsover 6 years 30,408 31,798
Tracker vs Fixed Tracker isover 6 years £1,390 cheaper
Market forecast for interest rates:
Tracker monthly Change from Ten-year fixed-rate Base ratepayments initial monthly mortgage monthly (start year)
payments payments(£) (£) (£)
Year 1 422 442 4%
Year 2 443 21 442 4.5%
Year 3 464 41 442 5%
Year 4 464 41 442 5%
Year 5 464 41 442 5%
Year 6 464 41 442 5%
Total paymentsover 6 years 32,643 31,798
Tracker vs Fixed Tracker is over 6 years £845 more expensive
105The Miles Review: Final Report

Guide to giving adviceAMarket forecast for interest rates with significant upward surprise:
Tracker monthly Change from Ten-year fixed-rate Base ratepayments initial monthly mortgage monthly (start year)
payments payments(£) (£) (£)
Year 1 422 442 4%
Year 2 545 123 442 6.8%
Year 3 601 179 442 8.0%
Year 4 610 188 442 8.2%
Year 5 623 201 442 8.5%
Year 6 621 199 442 8.5%
Total paymentsover 6 years 41,075 31,798
Tracker vs Fixed Tracker isover 6 years £9,277 more expensive
Market forecast for interest rates with significant downward surprise:
Tracker monthly Change from Ten-year fixed-rate Base ratepayments initial monthly mortgage monthly (start year)
payments payments(£) (£) (£)
Year 1 422 442 4%
Year 2 351 –71 442 2.2%
Year 3 343 –80 442 1.9%
Year 4 336 –86 442 1.8%
Year 5 326 –96 442 1.5%
Year 6 328 –95 442 1.5%
Total paymentsover 6 years 25,272 31,798
Tracker vs Fixed Tracker is over 6 years £6,526 cheaper
106 The Miles Review: Final Report

Guide to giving advice ANotes:
Market forecasts are from Bank of England estimated forward rates (available at web linkwww.bankofengland.co.uk/statistics/yieldcurve) as at 12th February 2004. The size of the upwardand downward surprises to interest rates for each year are plus or minus one standard deviation ofthe change in base rates over 1 to 5 year horizons based on 55 years of history from January 1950to January 2004. Details of the variability of base rate movements over that period are summarisedbelow:
UK Base Rate 1950-2004
Standard deviations of changes in base rate
Over 1 year horizons 2.3%
Over 2 year horizons 3.0%
Over 3 year horizons 3.2%
Over 4 year horizons 3.5%
Over 5 year horizons 3.5%
107The Miles Review: Final Report

108 The Miles Review: Final Report

The Miles Review: Final Report 109
B Statistical analysis of base rate changes
B.1 The risks associated with a variable-rate mortgage depend on the probability distributionof future interest rate changes. Mortgage debt is only gradually paid off over time, so the risk tohousehold finances remains significant for a number of years – at 5 per cent interest rates around90 per cent of the nominal capital amount borrowed on a 25 year repayment mortgage will remainafter five years. A borrower therefore needs to consider potential interest rate changes for a numberof years ahead. While it is difficult to predict future interest rates it is possible to consider pastperformance to give some indications of the scale of changes.
ANALYSIS OF BASE RATES SINCE 1950
B.2 This Annex looks at base rates over the past 50 years – the monetary and fiscal policyenvironment is different now from the past; the scale of inflationary shocks from outside has beenvery different at different times. These numbers therefore need to be treated with caution. Changessince 1992 are considered later in the Annex.
B.3 Chart B1 shows a histogram of the level of base rates in each month since 1950. Over thepast 50 years base rates have varied greatly from a low of 2 per cent in 1950 to a peak of 17 percent in 1979. Episodes of high inflation at various times from the early 1970s up to the early 1990shave generated a distribution with a long tail.
B.4 Table B1 shows the standard deviation of the change, and the average absolute change, inbase rates over different time horizons.
Chart B1: Histogram of monthly base rates January 1950 – December 2003
Base rates
Frequency
Source: Bank of England, Miles Review calculations
0
20
40
60
80
100
120
140
0
20
40
60
80
100
120
140
More15141312111098765432

Statistical analysis of base rate changesBTable B1: Analysis of base rate changes over different time horizons
Base rate
Standard Deviation Average absolute change
1 year change 2.34 1.72
2 year change 3.84 2.87
3 year change 2.94 2.18
4 year change 3.96 2.98
5 year change 3.84 2.81
Source: Bank of England, Miles Review calculations
The table shows the standard deviation and average absolute change in base rates over all non-overlapping periods since 1950.
B.5 Chart B2 shows a histogram of annual base rate changes over the past 50 years. This andsubsequent charts use non-overlapping periods. For over half of this period base rates have movedby 100 basis points or less over one year horizons, but base rates have frequently changed by 200basis points in a year and there have been exceptional periods where changes have been very muchgreater.
B.6 Chart B3 shows that over a two-year horizon the distribution of interest rate changes was,not surprisingly, wider than over one year with a substantial proportion of interest rate increases ofbetween 2 and 4 per cent.
110 The Miles Review: Final Report
Chart B2: Histogram of annual base rate changes 1950–2003
0
3
6
9
12
15
0
3
6
9
12
15
Annual change in base rates
Frequency
–8 –4 –3 –2 –1 0 1 2 3 4 8 More
Source: Bank of England, Miles Review calculations
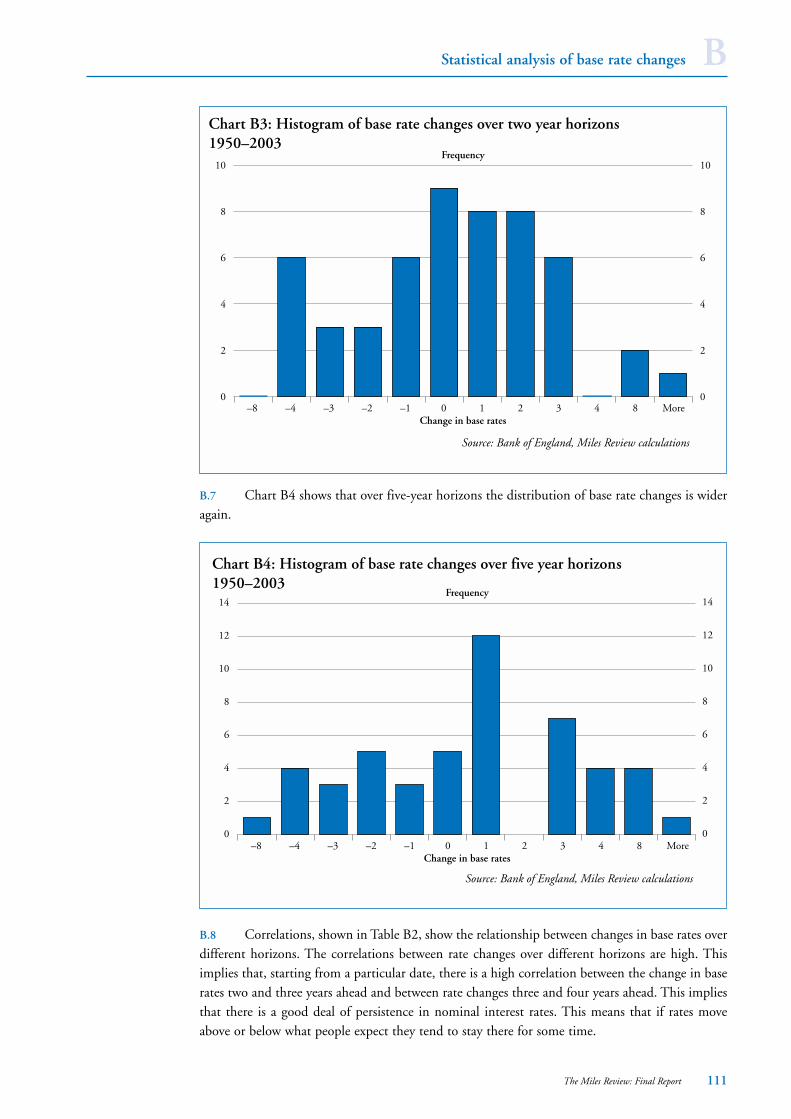
Statistical analysis of base rate changes B
B.7 Chart B4 shows that over five-year horizons the distribution of base rate changes is wideragain.
B.8 Correlations, shown in Table B2, show the relationship between changes in base rates overdifferent horizons. The correlations between rate changes over different horizons are high. Thisimplies that, starting from a particular date, there is a high correlation between the change in baserates two and three years ahead and between rate changes three and four years ahead. This impliesthat there is a good deal of persistence in nominal interest rates. This means that if rates moveabove or below what people expect they tend to stay there for some time.
111The Miles Review: Final Report
Chart B3: Histogram of base rate changes over two year horizons1950–2003
0
2
4
6
8
10
0
2
4
6
8
10
Change in base rates
Frequency
–8 –4 –3 –2 –1 0 1 2 3 4 8 More
Source: Bank of England, Miles Review calculations
Chart B4: Histogram of base rate changes over five year horizons1950–2003
0
2
4
6
8
10
12
14
0
2
4
6
8
10
12
14
Change in base rates
Frequency
–8 –4 –3 –2 –1 0 1 2 3 4 8 More
Source: Bank of England, Miles Review calculations

Statistical analysis of base rate changesBTable B2: Cross correlations of changes in base rates over different horizons
1 year 2 year 3 year 4 year 5 year
1 year X
2 year 0.80 X
3 year 0.77 0.84 X
4 year 0.42 0.55 0.84 X
5 year 0.47 0.90 0.93 0.84 X
Source: Bank of England, Miles Review calculations
ANALYSIS OF BASE RATES SINCE 1992
B.9 The advent of inflation targeting in 1992, followed by the granting of operationalindependence to the Bank of England in 1997, has enhanced the credibility of UK monetarypolicy. Movements in base rates have been less extreme since 1992 than they have been at mosttimes over the past 50 years. Interest rate changes since 1992 may give a better guide to potentialinterest rate movements under the new monetary policy regime. However, there are relatively fewobservation points on which to base such a judgement.
B.10 Chart B5 shows a histogram of the level of base rates since 1992. All the observations of4 per cent base rates or lower have occurred since 2001.
B.11 Chart B6 shows the distribution of annual changes in base rates since 1992.
112 The Miles Review: Final Report
Chart B5: Histogram of monthly base rates since 1992
Level of base rates
Frequency
4 5 6 7 More
Source: Bank of England, Miles Review calculations
0
10
20
30
40
50
60
70
0
10
20
30
40
50
60
70

Statistical analysis of base rate changes B
B.12 Chart B7 shows a histogram of base rate changes over two-year horizons between 1992and 2003. The histogram is very similar to that for one year.
B.13 Looking at base rate changes over a longer time horizon than two years quickly reduces thenumber of observations. Given these significant limitations no histograms are included.
B.14 The lack of data since the adoption of inflation targeting and Bank of Englandindependence makes it difficult to draw any firm conclusions on the probability distribution offuture interest rate changes. One way of attempting to gauge this is to consider earlier periodswhere inflation and interest rates have been stable. The following histograms look at interest ratesand interest rate changes in the 1950s and 1960s – an era of generally low inflation and more stableinterest rates than the period between 1970 and 1992.
113The Miles Review: Final Report
Chart B6: Histogram of annual base rate changes1992–2003
0
1
2
3
4
5
0
1
2
3
4
5
Change in base rates
Frequency
–2 –1 0 1 2 More
Source: Bank of England, Miles Review calculations
Chart B7: Histogram of base rate changes over two year horizons1992–2003
0
1
2
3
4
5
0
1
2
3
4
5
Change in base rates
Frequency
–2 –1 0 1 More
Source: Bank of England, Miles Review calculations

Statistical analysis of base rate changesBB.15 Chart B8 shows a histogram of the level of base rates from January 1950 to December1969. Charts B9 and B10 show changes in base rates over one and two-year horizons.
114 The Miles Review: Final Report
Chart B8: Histogram of monthly base ratesJanuary 1950 – December 1969
0
10
20
30
40
50
60
70
80
0
10
20
30
40
50
60
70
80
87654
Frequency
Monthly base rates
Chart B9: Histogram of annual base rate changes1950–1969
0
2
4
6
8
0
2
4
6
8
More210-1-2-3
Frequency
Change in base rates

Statistical analysis of base rate changes B
115The Miles Review: Final Report
Chart B10: Histogram of base rates changes over a two year horizon 1950–1969
0
1
2
3
4
5
0
1
2
3
4
5
3210-1-2-3
Frequency
Change in base rates

116 The Miles Review: Final Report

The Miles Review: Final Report 117
C Consultation list
Many individuals and organisations were consulted during the course of this Review. Thanks aredue to:
Abbey National Group
AGUS
John Arrowsmith, FCO
Asset and Liabilities Management Association
Association of Danish Mortgage Banks
Association of Independent Financial Advisers
Association of Mortgage Intermediaries
Jane Ball, Sheffield University
Bank of England
Banquo Management Limited
Barclays
Barclays Capital
Bear Stearns
Board of Governors of the Federal Reserve System
Mark Boleat
Britannia Building Society
Building Societies Association
Professor John Campbell, Harvard
Cardew Chancery
John Charcol Ltd.
Charles River Associates
Cheltenham & Gloucester
Cheshire Building Society
Citadel Investment Group
Congress Committee on Financial Services (US)

Consultation listCCongressional Research Service (US)
Consumers’ Association
Corporate Training Partnerships Limited
Council of Mortgage Lenders
Countrywide Plc.
Credit Suisse First Boston
Danica Pension
Danish National Bank
Danske Bank
Department of Housing & Urban Development (US)
Deutsche Bank AG London
Deutsche Bundesbank
Dresdner Kleinwort Wasserstein
Egg Banking plc
Dr. Don Egginton
Dr Lina El-Jahel
Euro Hypo AG
European Central Bank
European Commission
European Mortgage Federation
European Mortgage Finance Agency
FannieMae
Federal Reserve
Finance Development Centre Limited
Financial Ombudsman Service
Financial Services Authority
Fitch Ratings Ltd
Freddie Mac
GMAC-RFC Limited
Goldman, Sachs & Co
HBOS plc
118 The Miles Review: Final Report

Consultation list CHewitt Bacon & Woodrow
HM Customs and Excise
HM Treasury
Inland Revenue
Intelligent Risk Limited
International Accounting Standards Board
International Union for Housing Finance
Professor John Kay
Professor Paul Klemperer
Professor David Leece
Leeds & Holbeck Building Society
Lehman Bros
Lloyds Bank plc
M&G Investment Management Limited
Mckinsey’s
Kevin McMillan (Republican researcher on Congress)
Professor Geoffrey Meen
Merrill Lynch International
Moody’s
Moody’s Investors Service
Morgan Stanley & Co. International Limited
Mortgage Bankers Association of America
Mortgage Code Compliance Board
Mortgage Strategy
Professor John Muellbauer, Oxford
Paul Munin, LLP Prime Lending
Nationale Hypotheek Garantie (Dutch Mortgage Guarantee Fund)
Nationwide Building Society
Northern Rock
Norwich Union Personal Finance
Nykredit
119The Miles Review: Final Report

Consultation listCOffice of Fair Trading
PMI Group, Inc
PricewaterhouseCoopers
Prime Minister’s Office
Prudential M&G
Realkredit Danmark (Association of Danish Mortgage Banks)
Nick Retsinas, Harvard’s Joint Center for Housing Studies
N M Rothschild & Sons
Royal Bank of Scotland Group
Skills Council for Financial Services
Dr. Frank Skinner, University of Reading
Standard Life Bank
Standard & Poor’s
Tillinghast-Towers Perrin
Mark Tinker
UBS
UK Accounting Standards Board
Woolwich
120 The Miles Review: Final Report

The Miles Review: Final Report 121
References
Banking Ombudsman (1999), Annual Report, 1998-1999.
British Bankers Association (2003), The Banking Code, March 2003.
Calhoun, C. A. and Deng, Y. (2002), ‘A dynamic analysis of fixed and adjustable-rate mortgageterminations’, Journal of Real Estate Finance and Economics, 2002, 24: 1/2, p9-33.
Campbell, J. and Cocco, J. (2003), ‘Household Risk Management and Optimal Mortgage Choice’,Quarterly Journal of Economics, 118, pp 1449-1494, November 2003.
Council of Mortgage Lenders (2004), Annual Mortgage Surveys, carried out for CML byNOP/MINTEL, February 2004.
Cunningham, D. and Capone, C. (1990), ‘The relative termination experience of adjustable tofixed-rate mortgages’, Journal of Finance, 1990, 45(5), pp 1687-1703.
Europe Economics (1999), The compliance costs of extending financial regulation to mortgage advice:A report for the Financial Services Authority, October 1999.
European Mortgage Federation (2003), Mortgage Banks and the Mortgage Bond in Europe - 4thEdition, November 2003.
Financial Services Consumer Panel Research Report (2003). Understanding Financial Needs. Spring2003.
Financial Services Consumer Panel (1999), Mortgage Research Study, August 1999.
Financial Services Authority (1999), A Cost Benefit Analysis of Statutory Regulation of MortgageAdvice, October 1999.
FSA (2000a), Informed Decisions? How Consumers Use Key Features: a synthesis of research on the useof product information at the point of sale. Consumer Research 5. November 2000.
FSA (2000b) Consultation Paper 70: Mortgage Regulation – The FSA's high level approach.November 2000.
FSA (2001a) Consultation Paper 98: The Draft Mortgage Sourcebook, including Policy Statement onCP70. June 2001.
FSA (2001b), Choosing a Mortgage: Report of a research review and qualitative research on themortgage buying process. Consumer Research 8. June 2001.
FSA (2002a), Feedback on CP98 (the Draft Mortgage Sourcebook). August 2002.
FSA (2002b), Better Informed Mortgage Customers: Research on financial promotions and productdisclosure in the mortgage market. Consumer Research 14. August 2002.
FSA (2003a), Mortgage Regulation: Draft conduct of business rules and feedback on CP146.Consultation Paper 186. May 2003.

References
FSA (2003b). Towards a national strategy for financial capability. November 2003.
FSA (2004). Financial Services Authority, Financial Risk Outlook. 2004.
FSA (2004-05). Financial Services Authority Business Plan. 2004-05.
National Association of Citizens Advice Bureaux (2001). Summing up: bridging the financialliteracy divide. November 2001.
National Economic Research Associates (2003). The economic costs of the proposed regulation ofmortgage sales: A final report for the Financial Services Authority, May 2003.
Office of Fair Trading (1997) Consumer Detriment under Conditions of Imperfect Information, OFTresearch paper number 11, prepared for the OFT by London Economics, August 1997.
OFT (2003) Switching Costs - Part One: Economic Models and Policy Implications, OFT discussionpaper number 5, prepared for the OFT by London Economics, April 2003.
The Mortgage Code Compliance Board (2003). Annual Report, September 2003.
The Mortgage Code Compliance Board (2003). Consumer Research Report, October 2003.
VanderHoff, J. (1996), ‘Adjustable and fixed-rate mortgage termination, option values and localmarket conditions: an empirical analysis’, Real Estate Economics, 1996, Vol. 24(3), pp379-406.
122 The Miles Review: Final Report


The U
K M
ortgage Market: T
aking a Longer-Term V
iewFinal R
eport & R
ecomm
endationsM
arch 2
004
David M
iles
Final Report and Recommendations
The UK Mortgage Market:
Taking a Longer-Term View
David Miles
March 2004