the united republic of tanzania - unfccc · 2017-01-03 · according to decision 12/cp.17, this...
TRANSCRIPT
THE UNITED REPUBLIC OF TANZANIA
TANZANIA’S FOREST REFERENCE EMISSION LEVEL SUBMISSION
TO THE UNFCCC
DECEMBER 2016
i
SUMMARY
Approach Historical average of emissions associated with gross-
deforestation between the years 2002-2013
Scale National: As a sum of two sub-national FRELs: Main
land Tanzania and Zanzibar covers 94.76 million ha
Reserved Area Strata covers 26,580,970 ha
Scope REDD+ activities: Deforestation
Carbon pools: Above-ground biomass, Below-ground
biomass and Dead wood
Gases: CO2
Data sets used for
Activity data
Landsat 7 ETM+, Landsat 8 OLI; Landcover maps; Ortho-
photographs; RapidEye
Emissions Factor (EF)
Tier
Based on National Forest Inventory (NFI) (NAFORMA,
ZWBS)
Three (Based on NFI and local Allometric Equations)
Reference period Mainland: 11 years, two data points (2002–2013)
Zanzibar: 8 years, two data points ( 2004–2012)
Forest definition Crown cover (%): ≥10
Tree height (m): ≥3
Area (ha): ≥0.5
Adjustment for national
policy or economic growth
None
National FREL 58,462,472.67 t CO2e
Reserved Area FREL 32,220,890.17 t CO2e
Areas for improvement Additional REDD+ activities: Degradation,
Enhancement of carbon stock, Sustainable
Management of Forest and Forest Conservation
More data points
Additional carbon pools: Litter and Soil Carbon
Technical capacity
ii
ACKNOWLEDGEMENTS
The Government of the United Republic of Tanzania acknowledges the technical
contributions from the Division of the Environment-Vice President’s Office, National
Carbon Monitoring Centre (NCMC), Norwegian Institute of Bioeconomy Research
(NIBIO) and Sokoine University of Agriculture (SUA). Experts from the Department of
Forestry and Non-Renewable Natural Resources (DFNR) in the Ministry of
Agriculture Natural Resources Livestock and Fisheries in Zanzibar (MANRLF);
Forest and Beekeeping Division (FBD), Tanzania Forest Services (TFS) Agency,
and Tanzania Forestry Research Institute (TAFORI) all in the Ministry of Natural
Resources and Tourism; Tanzania Forest Conservation Group (TFCG), and Carbon
Tanzania are also acknowledged. The Royal Norwegian Embassy in Dar es Salaam,
Tanzania is acknowledged for the provision of financial support for the preparation of
Forest Reference Emission Level (FREL) for this submission.

iii
TABLE OF CONTENTS
SUMMARY ------------------------------------------------------------------------------------------------- i
ACKNOWLEDGEMENTS ----------------------------------------------------------------------------- ii
1. INTRODUCTION ------------------------------------------------------------------------------------- 1
1.1 Background ----------------------------------------------------------------------------------------------------------- 1
1.2 Forest Reference Emission Level development process for Tanzania ---------------------------------- 1
1.3. Consistency with GHGs Inventory reporting ----------------------------------------------------------------- 5
2. SCALE: AREA COVERED BY THE FOREST REFERENCE EMISSION LEVEL
(FREL) ------------------------------------------------------------------------------------------------------ 6
2.1 National FREL --------------------------------------------------------------------------------------------------------- 6
2.2 FREL for Reserved Areas ------------------------------------------------------------------------------------------- 8
3. SCOPE: ACTIVITIES, POOLS AND GASES INCLUDED IN THE
CONSTRUCTION OF THE FREL ------------------------------------------------------------------ 9
3.1. REDD+ Activities ---------------------------------------------------------------------------------------------------- 9
3.2 Carbon pools -------------------------------------------------------------------------------------------------------- 10
3.3 Gases ------------------------------------------------------------------------------------------------------------------ 11
4. INFORMATION USED AND METHODS FOR FREL CONSTRUCTION ----------- 12
4.1 Forest definition ---------------------------------------------------------------------------------------------------- 12
4.2. The Reference Period -------------------------------------------------------------------------------------------- 12
4.3 Activity Data --------------------------------------------------------------------------------------------------------- 13
4.3.1 Mainland Tanzania and Zanzibar ------------------------------------------------------------------------- 13
4.3.2 Reserved areas ------------------------------------------------------------------------------------------------ 21
4.4 Emissions factors --------------------------------------------------------------------------------------------------- 21
5. THE FREL CALCULATION AND RESULTS ----------------------------------------------- 26
6. EXPECTED IMPROVEMENTS ---------------------------------------------------------------- 27
REFERENCES ----------------------------------------------------------------------------------------- 28
APPENDICES ------------------------------------------------------------------------------------------ 32
iv
ACRONYMS/ABBREVIATIONS
AD Activity Data
AGB Above-ground biomass
BGB Below-ground biomass
CDM Clean Development Mechanism
CO2e Carbon Dioxide equivalent
CoP Conference of the Parties
DFNR Department of Forestry and Non-Renewable Natural Resources
DW Deadwood biomass
EF Emission Factor
ETM+ Enhanced Thematic Mapper Plus
FBD Forestry and Beekeeping Division
FREL Forest Reference Emission Level
FRL Forest Reference Level
GHG Green House Gas
GFC Global Forest Change
ha hectare
IPCC Intergovernmental Panel on Climate Change
IUCN International Union for Conservation of Nature and Natural
Resources.
INC Initial National Communication
LEDAPS Landsat Ecosystem Disturbance Adaptive Processing System
LULUCF Land Use- Land Use Change and Forestry
LULC Land Use-Land Cover
MANR Ministry of Agriculture and Natural Resources
MRV Measuring, Reporting and Verification
MtCO2e Million tonnes of CO2 equivalent
MNRT Ministry of Natural Resources and Tourism
NAFORMA National Forest Resources Monitoring and Assessment
NCMC National Carbon Monitoring Center
NFI National Forest Inventory
NIBIO Norwegian Institute of Bioeconomy Research

v
REDD+ Reducing Emissions from Deforestation and forest Degradation
in developing countries; and the role of conservation,
sustainable management of forests, and enhancement of forest
carbon stocks in developing countries.
RCMRD Regional Centre for Mapping and Resource Development
RGoZ Revolutionary Government of Zanzibar
SUA Sokoine University of Agriculture
SNC Second National Communication
TFS Tanzania Forest Services Agency
TFCG Tanzania Forest Conservation Group
TNC Third National Communication
tC Tonnes of Carbon
tCO2e Tonnes of CO2 equivalent
UNFCCC United Nations Framework Convention on Climate Change
UN-REDD The United Nations Collaborative Programme on Reducing
Emissions from Deforestation and Forest Degradation
VPO Vice President’s Office
ZWBS Zanzibar Woody Biomass Survey

1
1. INTRODUCTION
1.1 Background
The United Nations Framework Convention on Climate Change (UNFCCC), invited
developing country Parties to submit voluntarily Forest Reference Emissions Level
(FREL) for a technical assessment (Decisions 12/CP.17 and 13/CP.19). This is in
the context of results-based payments for reducing emissions from deforestation and
forest degradation in developing countries; and the role of conservation, sustainable
management of forests, and enhancement of forest carbon stocks in developing
countries (REDD+).
Tanzania has been a part to the UNFCCC since 1996 and accordingly, presents a
proposal of her national FREL for her possible participation in the REDD+ activities
(Paragraph 70, Decision 1/CP.16, paragraph 71(b) (UNFCCC, 2011). The purpose
of the proposed Tanzania FREL is to facilitate access to international and regional
funding, expand the forest resources base for domestic and export needs under
public, private partnerships, to meet sustainable development goal and to assess
achievement in forest resource management. This submission entails the FREL
technical assessment in accordance with the guidelines and procedures adopted in
decision 13/CP.19 (UNFCCC, 2014). Further, the information regarding
methodologies used in constructing the FREL, that is, activities, pools, gases and
the forest definition are provided following the guidelines of the Inter governmental
Panel on Climate Change (IPCC) (IPCC, 2003: 2006). The proposed FREL is
voluntary and it is mainly for the purpose of benefiting from the results-based
payment, as per Decisions 9/CP.19, 13/CP.19 and 14/CP.19 (UNFCCC, 2014).
According to Decision 12/CP.17, this submission will follow a stepwise approach,
which allows incorporating better data, improved methodologies and adding more
pools, where appropriate overtime.
1.2 Forest Reference Emission Level development process for Tanzania
Tanzania started REDD+ readiness process in 2008. This was possible through a
generous support of the Government of the Kingdom of Norway among others,
where the two countries agreed to cooperate for five years (2008-2013) on climate
2
change issues. During the REDD+ readiness phase, Tanzania undertook the
following activities:
Prepared the National Framework for REDD+;
Prepared the National REDD+ Strategy and Action Plan;
Conducted research and capacity building in support of REDD+;
Carried out nine REDD+ pilot projects;
Prepared draft of REDD+ Social and Environmental Safeguards and
Standard; and
Raised awareness on REDD+ among different stakeholders.
Moreover, Tanzania is in the process of establishing a National Carbon Monitoring
Centre (NCMC). The NCMC is currently operating at a transitional phase and
expects to be operational by 2019. This is a strategy of preparing the country for a
result based payment mechanism under REDD+. In the result based payment
mechanism, countries are required to quantify their achievements by establishing a
robust and transparent forest carbon Measurement, Reporting and Verification
(MRV) system. MRV provides a system on how to account for forest carbon,
including changes over time. This system establishes the FREL against which the
REDD+ achievements will be determined over time. NCMC started its activities in
January 2016 where one of its initial tasks was to establish the MRV system for the
estimation of FREL for the country. The first technical meeting on FREL for Tanzania
was held at NCMC on 12th April 2016 and attended by experts from the Government,
higher learning and research institutions, and the private sector. The meeting
reached a common understanding and a way forward on the national forest
definition; the scale; scope; activities, and data points for the REDD+ FREL of
Tanzania. The following technical working groups were established to take up the
process of FREL development:
Technical working group on forest definition: This group worked on forest
definition and came up with a proposed forest definition to be used in FREL
process;
Technical working group on activity data: This group worked on issues related
to historical data, reference year for land cover- land use changes, and
suggested future projections;
3
Technical working group on emission factors: This group worked on possible
emission factors to be included in the FREL process, taking into consideration
the country circumstances;
Technical working group on FREL: This working group reviewed other
countries’ FREL submissions to UNFCCC for drawing experiences, and
practices relevant to Tanzania. The group suggested the content and layout of
the FREL document, compiled activity data and emission factors and finally
computed FREL.
The working groups were facilitated by NCMC to undertake their tasks. The groups
presented their findings and suggestions to the second technical meeting held on 5th
May 2016. This technical meeting reached a consensus on the proposed forest
definition, proposed data and methodological approaches for estimating emission
factors, activity data and the choice of REDD+ activity to be used for the FREL
process. Having these deliverables from the technical meetings, NCMC organized a
first FREL multi-stakeholder consultation meeting, which was held on 19th - 20th May
2016. The stakeholders who attended the meeting were from the Government,
Government agencies, Universities, research institutions, NGOs and the private
sector.
The outcomes of the four-national technical working groups and workshops/meetings
included:
A proposed forest definition for the REDD+ and CDM processes, which was later
endorsed by the Government;
Consensus on the use of the National Forest Resource Monitoring and
Assessment (NAFORMA) data for Mainland Tanzania and Zanzibar Wood
Biomass Survey (ZWBS) data for Zanzibar in estimating emission factors. The
NAFORMA and ZWBS are comprehensive national forest inventories, which
were conducted recently in Tanzania. NAFORMA was carried out from 2009 to
2013 (MNRT, 2015) while ZWBS was carried out in 2012 (RGoZ, 2013). While
NAFORMA was the first NFI for mainland Tanzania, ZWBS of 2012 was
preceded by ZWBS of 1997;
4
Consensus on the adoption of Approach 3 of the IPCC Good Practice
Guidelines (spatially explicitly) in the development of activity data for
deforestation based on the available data and country circumstance;
and
Consensus on the inclusion of a stratum for reserved areas1.
The preliminary results from this national process were then presented to the side
meeting at the Oslo REDD+ exchange workshop held on 16th to 17th June 2016 in
Ås, Norway. The team from Tanzania presented the country’s expert views on how
the FREL for the country would be developed. This was followed by presentations
and discussions from and among international experts including Land Use Land Use
Changes and Forestry (LULUCF) experts who had revised the previously submitted
FREL from other countries, methodological experts in forest carbon monitoring and
change estimations, and experts who had been involved in the development of other
countries’ FREL. The main goal of the side meeting was to share experiences with
other experts on FREL development. Recommendations from the meeting were as
follows:
Based on the assessment of the available data, expertise and capacity, it is
possible for Tanzania to submit her FREL in early December 2016, and have it
reviewed by the UNFCCC technical assessment experts in March 2017.
Accordingly, Tanzania should target to have the FREL document ready by
October 2016, scrutinized by stakeholders in November 2016 and ready for
submission by early December 2016. For this to be practical, it was advised that
the FREL technical group should start working on the draft document, which
would have details of all the procedures, processes and methodologies followed
and plans for the future. Thus, each technical working group on FREL should
clearly document all the procedure and methods used in detail to ensure
transparency, accuracy, consistency and compatibility and that it is confined with
the UNFCCC guidelines on the development of FREL; and
1 Reserved areas are: Conservation Areas i.e. National Parks, Game Reserves, and Nature Forest Reserves
(protective) and National Forest Reserves/forest reserves (Protective and/ Productive).

5
Develop the Emission factor from the NAFORMA and ZWBS classification of
forest types. The historical activity data for forest change detections used the
2002 Landsat 7 and the 2013 Landsat 8 data. This was based on the availability
of both Landsat 7-year 2002 and Landsat 8 year 2013. Data collection for
NAFORMA and ZWBS was finalized in 2013 and 2012, respectively; thus, it
would be appropriate to link NAFORMA and ZWBS data with the remote sensing
data (see section 4.3 for details on the choice of data and years of data
collection).
The second and final formal stakeholder consultation and validation workshop was
held on 20th December 2016 at NCMC, SUA - Morogoro. The workshop was
officiated by the Permanent Secretary, Vice President’s Office and attended by
participants representing Government institutions, Government Agencies, NGOs and
the private sector. The workshop participants reviewed and discussed the FREL
document and provided comments and inputs aiming at improving the FREL
document.
1.3. Consistency with GHGs Inventory reporting
The United Republic of Tanzania has been reporting on the GHGs inventory through
her national communication reports submitted to the UNFCCC. The Initial National
Communication (INC) was submitted in 2003 based on the GHGs inventory carried
out in 1993. The Second National Communication (SNC) submitted in 2014 was
based on the GHGs inventory carried out between 1995 and 2005, using 2000 as
the base year. Both national communications used IPCC 2006 guidelines` Tier 1
approach.
These previous GHGs inventories employed outdated data, which were collected
between 1993 and 2005, and since data for some sectors were missing, in such
cases default global values were applied. This FREL used emission factors based on
the recent data from the National Forest Inventories (NFI) in Mainland Tanzania and
Zanzibar. The emission factors, which were derived from the NFI data in this
submission, are therefore, considered as up-to-date and more detailed (Tier 3)
compared to the previous GHGs inventories. Hence, data generated in the FREL
development process will benefit the Third National Communication (TNC).
6
2. SCALE: AREA COVERED BY THE FOREST REFERENCE
EMISSION LEVEL (FREL)
2.1 National FREL
This FREL submission considered country circumstance, that Tanzania is a Union of
Mainland Tanzania and Zanzibar. A national FREL for gross deforestation was
developed as a sum of FREL for Mainland Tanzania and that of Zanzibar as per
UNFCCC Decision 12/CP.17. The national FREL therefore, covers a total area of
94.76 million ha of the United Republic of Tanzania (Figure 1) that is, 94.51 million
ha in Mainland Tanzania and 250,000 ha of surface land in Zanzibar.
Tanzania is located between 1° 00' S and 12° 00' S and between 30° 00' E and 41°00'
E at an altitude between 358 m a.s.l. and 5950 m a.s.l. Mainland Tanzania is
characterized by tropical climate, which can be divided into four distinct climatic
zones, namely, the hot humid coastal plain, the semi-arid zone of the central plateau,
the high-moist lake regions, and the temperate highland areas. The country has the
mean maximum daytime temperatures ranging from 10°C to 31°C and the mean
annual rainfall ranging from 500 to 2500 mm across the four zones. Zanzibar is
characterized by tropical and humid climate with mild temperatures, with the average
annual temperature of 31.5°C, and the mean annual rainfall ranging from 1000 to
2500 mm.
The total forested land in Mainland Tanzania is 48.1 million ha, which is equivalent to
54.4% of the total land area of 88.3 million ha. Broadly, forested land in the country
is comprised of forest and woodlands. Forests include montane, lowland, mangrove,
and plantation forests, while woodlands include open and closed woodlands, and
thickets. Woodlands occupy 44.7 million ha (~93.0% of the total forested land and
50.6% of Mainland Tanzania), followed by cultivated land (25.2%), bushland and
grassland (16.6%) and forests (3.5%). In Zanzibar, forest cover is about 106,458 ha,
which is equivalent to 40% of the total land area. This include bush and tall trees in
coral rag areas (81%), mangroves (15%), and forest plantations (4%). Other land
cover types are a mixture of trees and agricultural crops, clove plantation, coconut
plantation, and mixed wood vegetation (RGoZ, 2013).

7
Figure 1: Area covered by the FREL: Mainland Tanzania and Zanzibar and
Reserved Areas.
Forests in Tanzania play an important role in the daily livelihoods. They are an
important source of energy for cooking, building timber, traditional medicine, tourism,
fodder, water catchments, shelter for wildlife and estuaries for fish breeding areas.
Furthermore, these forests also have high biodiversity, containing over 10,000 plant
species, hundreds of which are nationally endemic, 724 species of flora and fauna
identified as threatened in the IUCN Red List, and 276 species of flora and fauna
classified as endangered (IUCN, 2013).
8
2.2 FREL for Reserved Areas
Reserved areas in Tanzania (Mainland and Zanzibar) include Conservation Areas,
namely, National Parks, Game Reserves, and Nature Forest Reserves (Protective);
and Forest Reserves (Protected and Production). These nature forest reserves and
forest reserves are managed by either the Central Government or the Local
Government Authorities. All reserved areas are included in this submission except
the village land forest reserves and Wildlife Management Areas (WMA), due to
inadequate spatial coverage data. The combined size of the considered reserved
areas is 26,580,970 ha, that means, 26,425,806 ha are in mainland Tanzania and
155,164 ha are in Zanzibar.
The reserved area occupies almost 50% of the forested area in Tanzania. These
reserved areas are legally protected, and therefore, it is possible to reverse the
current forest losses with interventions.
9
3. SCOPE: ACTIVITIES, POOLS AND GASES INCLUDED IN THE
CONSTRUCTION OF THE FREL
3.1. REDD+ Activities
REDD+ activities, which are referred to in the Decision 1/CP.16, paragraph 70 of the
UNFCCC, include reducing emissions from deforestation and forest degradation in
developing countries; and the role of conservation, sustainable management of
forests, and enhancement of forest carbon stocks in developing countries.
Deforestation is the only REDD+ activity considered in this submission; this is
because of the availability of deforestation data and inadequate data for the other
REDD+ components. Deforestation in this submission is defined as a change of
forest cover to non-forest covers.
The total forest area under conservation in Tanzania is ca 14 million ha. Apart from
their high carbon storage capacity, these forests have a unique biodiversity potential.
In this submission, conservation of carbon stock is not included due to lack of past
continuous forest inventory data for the conserved forest to depict both area and
carbon stock changes. The presence of NAFORMA and ZWBS will largely mitigate
this challenge and allow inclusion of conservation of forest carbon stock in the future
submissions. The emphasis will be on the managed forest areas that include
national parks, game reserves, nature forest reserves, local Government authority
forest reserves, national forest reserves, community conserved forest areas, private,
sacred forests and Wildlife Management Areas (WMA).
Forest degradation is not included in this submission although it is considered as a
significant source of emission. The main drivers of forest degradation are extraction
of wood fuel (charcoal and firewood), logging, grazing and wild fire. Forest
degradation is taking place all over the country in a fragmented manner and
degraded forests frequently maintain a closed canopy. This poses a significant
challenge to the assessment and monitoring of forest degradation by means of
remote sense techniques. However, NAFORMA and ZWBS have included
assessment of harvesting or natural mortality through stumps measurements, which
can be used to determine forest degradation. Moreover, there have been national
10
wild fires monitoring projects, which have been coordinated by Tanzania Forest
Services (TFS) Agency and Tanzania Forestry Research Institute (TAFORI); these
can also be used to determine forest degradation. However, these datasets are
inadequate and have not been analyzed.
The enhancement of carbon stock has not been included in this submission. The
assessment of enhancement of carbon stock should consider forest growth and area
gain. Tanzania has a potential to include the enhancement of carbon stock in the
future as one of the activities since there is a good number of afforestation,
reforestation, and natural-regeneration programmes by the Government and the
private sector, including smallholders’ tree growers. However, accurate national data
on the past reforested and afforested areas and the annual tree survival rate are
missing. Future monitoring of afforestation and reforestation programmes through
institutions such as NCMC will provide data for the enhancement of carbon stock.
Sustainable management of forest has also not been included in this submission
despite the efforts on implementing sustainable forest management in Tanzania and
different policy reforms, which go back to the colonial eras. However, the inclusion of
sustainable management of forest in this submission is limited by inadequate data on
the following, and which should be addressed in the future:
Removals and emissions from forest management;
Growing stock under different forest management regimes;
Relevant historical data on forest management and governance at national
level;
The existing forest areas set for sustainable forest management and their
monitoring plans;
New areas subjected to sustainable forest management; and
Inadequate and outdated forest management plans.
3.2 Carbon pools
The carbon pools included in this FREL submission are:
Above-ground biomass (AGB);
Below-ground biomass (BGB); and
Deadwood biomass (DW).

11
These pools are included because of their significant size in Tanzania, the expected
high rate of change, and most importantly, the availability of appropriate and
accurate methods of estimation.
Soils and litter carbon pools are not included in this submission. Soil data were
partially collected by NAFORMA and ZWBS but they could not be used due to
uncertainties in monitoring changes. Data on litter were not collected by NAFORMA
and ZWBS because of frequent fires that burnt the litter layer in the woodlands,
which is the most dominant forest type in Tanzania.
3.3 Gases
This FREL submission considered carbon dioxide (CO2) gas only. In this submission,
the focus is more on reducing emission from forest related activities whereby CO2 is
the most emitted gas. Other GHGs may be considered in the future when accurate
methods and reliable data become available.
12
4. INFORMATION USED AND METHODS FOR FREL
CONSTRUCTION
4.1 Forest definition
In defining forest, this submission considered internationally agreed parameters
(height, crown cover, and area) and technological capability of the country to monitor
change in the forest area/carbon stocks and ensure social, economic and cultural
aspects. Based on the national circumstance, that Tanzania is a Union of Mainland
Tanzania and Zanzibar with different forest types and conditions, local policy and
legal frameworks, the following definition is adopted;
‘Forest’ means an area of land with at least 0.5 ha, with a minimum tree crown
cover of 10% or with existing tree species planted or natural having the
potential of attaining more than 10% crown cover, and with trees which have
the potential or have reached a minimum height of 3m at maturity in situ.
This definition is meant to cater for REDD+ and Clean Development Mechanism
(CDM) programmes under UNFCCC. This definition was developed through a
stakeholder’s consultative process as shown in Section 1.2.
4.2. The Reference Period
The historical reference period is defined as the period from which the data for
estimating past changes in forest areas are obtained. Both the initial and the last
data point of the reference period for the current FREL are largely dictated by the
availability of activity data and additional data for comparison.
For Mainland Tanzania, the reference period is 2002-2013. Year 2002 was chosen
as the start of the reference period because of the availability of Landsat 7 ETM+
prior to the failure in line scanner of Landsat 7 Satellite in 2003. The year 2013 was
selected because Landsat 8 OLI is available, with an improved image quality, and
the year coincides with the period of NAFORMA measurements that are used as a
background for forest classification or activity data stratification.
13
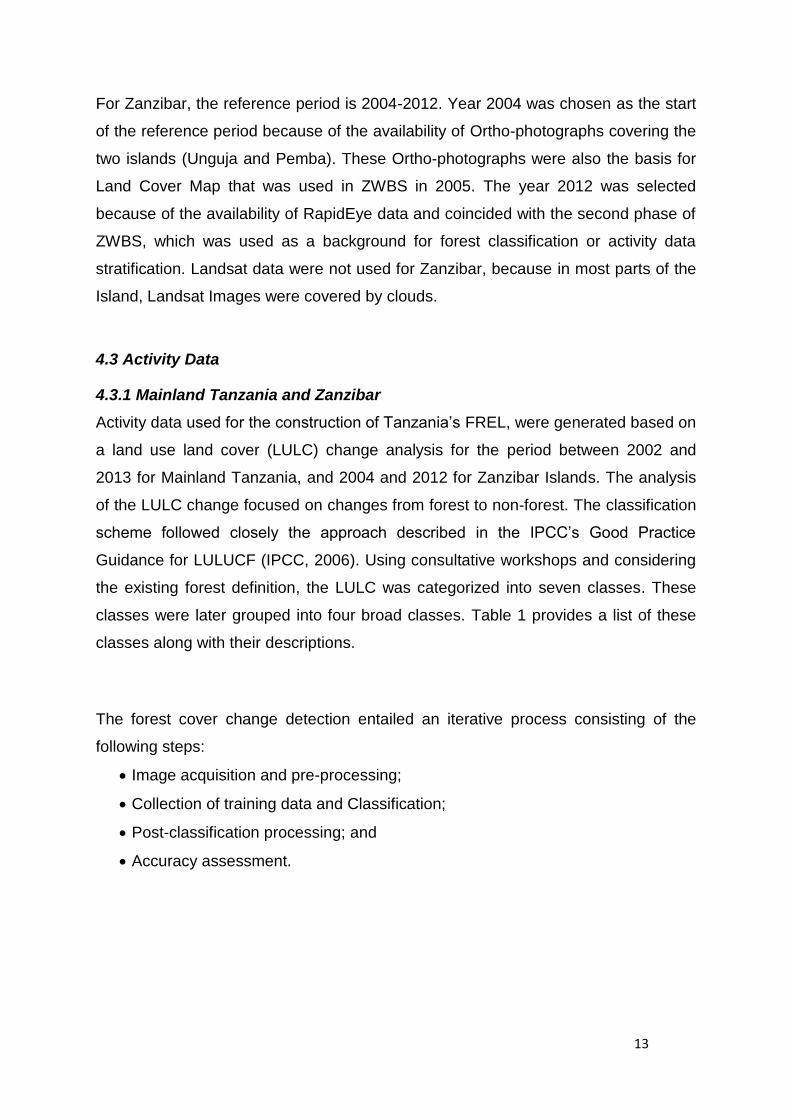
For Zanzibar, the reference period is 2004-2012. Year 2004 was chosen as the start
of the reference period because of the availability of Ortho-photographs covering the
two islands (Unguja and Pemba). These Ortho-photographs were also the basis for
Land Cover Map that was used in ZWBS in 2005. The year 2012 was selected
because of the availability of RapidEye data and coincided with the second phase of
ZWBS, which was used as a background for forest classification or activity data
stratification. Landsat data were not used for Zanzibar, because in most parts of the
Island, Landsat Images were covered by clouds.
4.3 Activity Data
4.3.1 Mainland Tanzania and Zanzibar
Activity data used for the construction of Tanzania’s FREL, were generated based on
a land use land cover (LULC) change analysis for the period between 2002 and
2013 for Mainland Tanzania, and 2004 and 2012 for Zanzibar Islands. The analysis
of the LULC change focused on changes from forest to non-forest. The classification
scheme followed closely the approach described in the IPCC’s Good Practice
Guidance for LULUCF (IPCC, 2006). Using consultative workshops and considering
the existing forest definition, the LULC was categorized into seven classes. These
classes were later grouped into four broad classes. Table 1 provides a list of these
classes along with their descriptions.
The forest cover change detection entailed an iterative process consisting of the
following steps:
Image acquisition and pre-processing;
Collection of training data and Classification;
Post-classification processing; and
Accuracy assessment.

14
Table 1 Land Use Land Cover classes used in the activity data
LULC Classes LULC Classes
for mapping
National Land Cover Description
Forest Land Forest An area of land with at least 0.5 ha, with a
minimum tree crown cover of 10% or with the
existing tree species planted or natural having the
potential of attaining more than 10% crown cover,
and with trees which have the potential or have
reached a minimum height of 3 m at maturity in
situ. It includes montane, lowland, mangrove and
plantation forests, woodlands and thickets.
Bushland Non Forest Bushland predominantly comprises of plants, which
are multi-stemmed from a single root base. It
includes dense and open bushland
Grassland For the most part, grassland occurs in combination
with either limited wooded or bushed component,
or with scattered subsistence cultivation.
Cultivated Land The land, which is actively used, and grows
agriculture crops including agroforestry systems,
wooded crops, herbaceous crops and grain crops
Other Lands The land that includes settlement, bare land and
rock outcrop, Costal bare lands, Ice cap / snow
Wetland Wetland The land which is water logged, may be wooded
such as marshland, perennial flooded plains and
swampy areas.
Water Water Includes inland water and Indian Ocean
Image acquisition and pre-processing
Bi-temporal analyses of LULC change require an extensive data selection and
preparation to ensure comparability of the imagery. Appropriate selection of imagery
acquisition dates is as crucial to the change detection method as is the choice of the
sensor(s), change categories, and change detection algorithms. In consideration of
cloud cover, the seasonality and phenological effects, better Landsat 7 and 8 images
were selected for image processing from a large number of images. The images
targeted were those acquired during the dry seasons (July-November) of the years
15
2002 and 2013 with minimum cloud cover (≤ 10%). However, getting all the images
conforming to the criteria proved to be problematic in some areas. Owing to this
constraint, for some places, the images acquired in the wet season were used.
Landsat 7 and 8 OLI images were the major source of data for forest change
assessment in Tanzania Mainland. The images were downloaded from freely
available USGS and Earth Explorer websites (http://earthexplorer.usgs.gov/ and
http://glovis.usgs.gov/). More than 50 Landsat 7 ETM+ (for 2002) and Landsat 8 (for
2013) images were downloaded. The Landsat 7 ETM+ scenes were pre-processed
to surface reflectance level using the Landsat Ecosystem Disturbance Adaptive
Processing System (LEDAPS) atmospheric and topographic correction algorithm.
The Landsat 8 OLI scenes had already been processed to surface reflectance level
by the USGS internal L8SR algorithm. Details of the pre-processing approach used
by the USGS are provided in:
http://landsat.usgs.gov/documents/cdr_sr_product_guide_ee.pdf and
http://landsat.usgs.gov/documents/Provisional_Landsat_8_SURFACE_REFLECTAN
CE_EE.pdf.).
It was difficult to find cloud free images for Zanzibar Islands, since most of the year is
covered with clouds. As a result, the processed Ortho-photographs of 2004 at a
scale of 1: 10,000 and images from the RapidEye satellite of the year 2012 were
used. Details of the Ortho-Photographs and the RapidEye images used are
described in the ZWBS of 2005 and 2012 (RGoZ, 2013).
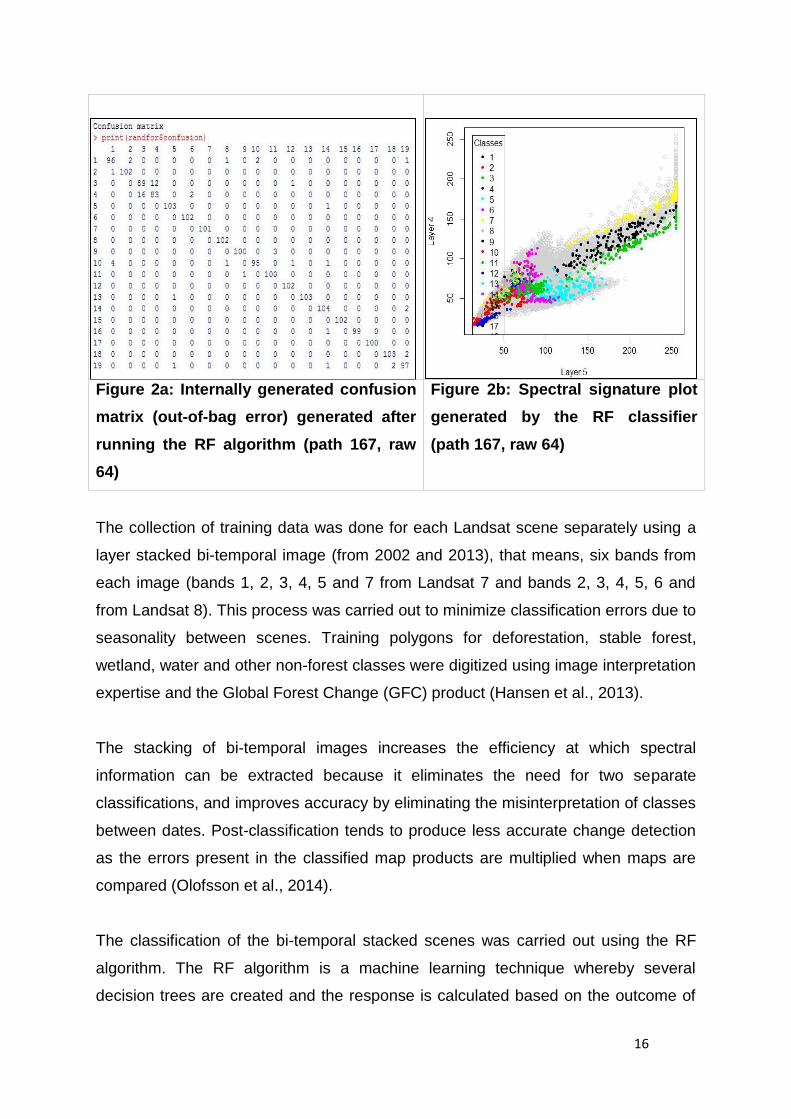
Collection of training data and Classification
The collection of training data and classification were the iterative processes
whereby each training data were evaluated using generated variables from the
Random Forest (RF) (Figure 2a and 2b) and adjusted accordingly to produce better
results.
16
Figure 2a: Internally generated confusion
matrix (out-of-bag error) generated after
running the RF algorithm (path 167, raw
64)
Figure 2b: Spectral signature plot
generated by the RF classifier
(path 167, raw 64)
The collection of training data was done for each Landsat scene separately using a
layer stacked bi-temporal image (from 2002 and 2013), that means, six bands from
each image (bands 1, 2, 3, 4, 5 and 7 from Landsat 7 and bands 2, 3, 4, 5, 6 and
from Landsat 8). This process was carried out to minimize classification errors due to
seasonality between scenes. Training polygons for deforestation, stable forest,
wetland, water and other non-forest classes were digitized using image interpretation
expertise and the Global Forest Change (GFC) product (Hansen et al., 2013).
The stacking of bi-temporal images increases the efficiency at which spectral
information can be extracted because it eliminates the need for two separate
classifications, and improves accuracy by eliminating the misinterpretation of classes
between dates. Post-classification tends to produce less accurate change detection
as the errors present in the classified map products are multiplied when maps are
compared (Olofsson et al., 2014).
The classification of the bi-temporal stacked scenes was carried out using the RF
algorithm. The RF algorithm is a machine learning technique whereby several
decision trees are created and the response is calculated based on the outcome of

17
all the decision trees. According to Ned (2010), RF has several advantages when
compared with other image classification methods: it is non-parametric, it is easy to
parameterize, it is not sensitive to over-fitting; it is good at dealing with outliers in
training data, and it is able to calculate useful information about errors, variable
importance, and data outliers. This information can be used to evaluate the
performance of the model and make changes to the training data if necessary. The
RF model, which was developed using the training data, was then applied to the
layer stacked images to generate forest change map for each scene. The initial
assessment of the classification output was done by overlaying the output on the
color composite and was visually checked for classification accuracy.
Post-classification processing
Post-classification processing included recoding, majority filtering, clumping,
elimination, and mosaicking. The classified images were recoded to the five classes
namely, stable forest, deforestation, non-forest, wetland, and water. Then, a 3 by 3
majority filter was employed to the recoded image to reduce the salt and paper
effect; and lastly, the classes were filtered to a minimum mapping unit of about 0.5
ha to conform to the forest definition, that is, the minimum size is 0.5 ha.
Final interpretations from all scenes were mosaicked to produce a wall-to-wall forest
change map for the entire country (Figure 3a and 3b). This was the basis for
extracting statistics such as the total and annual rates of deforestation (Table 2a and
2b). The annual deforestation rate in Mainland Tanzania is estimated to be 580,000
ha while that of Zanzibar is 7,100 ha, making deforestation the most significant
REDD+ activity. The main drivers of deforestation are establishment of settlement,
extraction of wood for energy and expansion of agriculture. The observed rate of
deforestation in this submission is comparable with that of NAFORMA which
reported an annual deforestation rate of 372,816 ha for forest and 248,871 ha for
woodlands between 1995 and 2010 (MNRT, 2015). With the current forest definition,
most of the woodlands are categorised as forests.

18
Figure 3a: Forest change maps for the Mainland Tanzania.
Figure 3b: Forest change maps for the Unguja (left) and Pemba (right) islands.

19
Table 2a: Forest change statistics (2002 – 2013) for the Tanzania Mainland
No. Change class Area (x 1,000 ha) Annual loss (ha/yr)
1 Forest 32,000.9
2 Deforestation 6,406.7 582,427.27
3 Non forest 47,595.3
4 Wetland 4,506.9
5 Water 1,697.3
6 No data (clouds/shadow) 304.9
Table 2b: Forest change statistics (2004 – 2012) for the Zanzibar Island
No. Change
class
Area (x 1,000 ha) Annual loss (ha/yr)
Unguja Pemba Total Unguja Pemba Total
1 Forest 84,048.50 56,837.00 140,885.50
2 Deforestation 36,092.70 20,651.20 56,743.90 4,511.59 2,581.40 7,092.99
3 Non forest 30,192.80 19,754.50 49,947.30
4 Wetland 184.93 48.47 433.39
5 No data) 7,819.97 3,670.91 11,490.88
Accuracy assessment
Accuracy was evaluated against two external datasets: NAFORMA and the RMRC
LULC map. The NAFORMA sampling design followed a stratified systematic cluster
sampling, taking into account cost and error estimations (Tomppo et al., 2010; URT,
2010). Three variables were used to compose the strata (18 in total) namely; time to
measure a cluster; the mean volume of the growing stock on land on a cluster; and
slope. This resulted in a total of 3,419 clusters and 32,660 plots. The 2000 Regional
Centre for Mapping and Resource Development (RCMRD) LULC map was
developed from Landsat Imagery (30m by 30m) resolution using supervised
classification
[http://geoportal.rcmrd.org/layers/servir%3Atanzania_landcover_2000_scheme_ii]
The 2000 RCMRD map was determined to have an overall accuracy of about 86%
(RCMRD, 2012) and was found to represent the LULC classes in Tanzania.
The two datasets, namely, NAFORMA (points) and RCMRD (raster layer) were
combined using ArcGIS spatial analyst tool “extract value to points” to produce a

20
LULC change reference data. The results of Land Cover Change Accuracy
Assessment for Mainland Tanzania are shown in Table 4.
Table 4: Land cover Change Accuracy Assessment for Mainland Tanzania
No. Change class Reference
Totals
Classified
Totals
Number
Correct
Producers
Accuracy
(%)
Users
Accuracy
(%)
1 Forest - forest 18,215 13,601 12,774 70 94
2 Forest - non 1,402 1,453 1,102 79 76
3 Non - non 7,147 11,692 6,331 89 54
4 Water - water 96 44 24 25 55
5 Wetland - wetland 231 301 97 42 32
Total 27,091 27,091 20,226 75 75
For the Zanzibar Island, a combination of datasets from the Zanzibar Woody
Biomass Survey (ZWBS), which were conducted between 2012 and 2013, and the
random validation points obtained from a visual interpretation of the 2004 aerial
photographs by a remote sensing expert, were used to produce a LULC change
reference dataset. The ZWBS sampling design was based on stratified sampling
(RGZ, 2013). The sample plots were distributed within the initial LULC classes
according to their expected variance. The final number of sample plots was 571, of
which 267 were in Pemba and 304 were in Unguja. The strata (18) are the LULC
classes, which were visually delineated from 2012 RapidEye imagery.
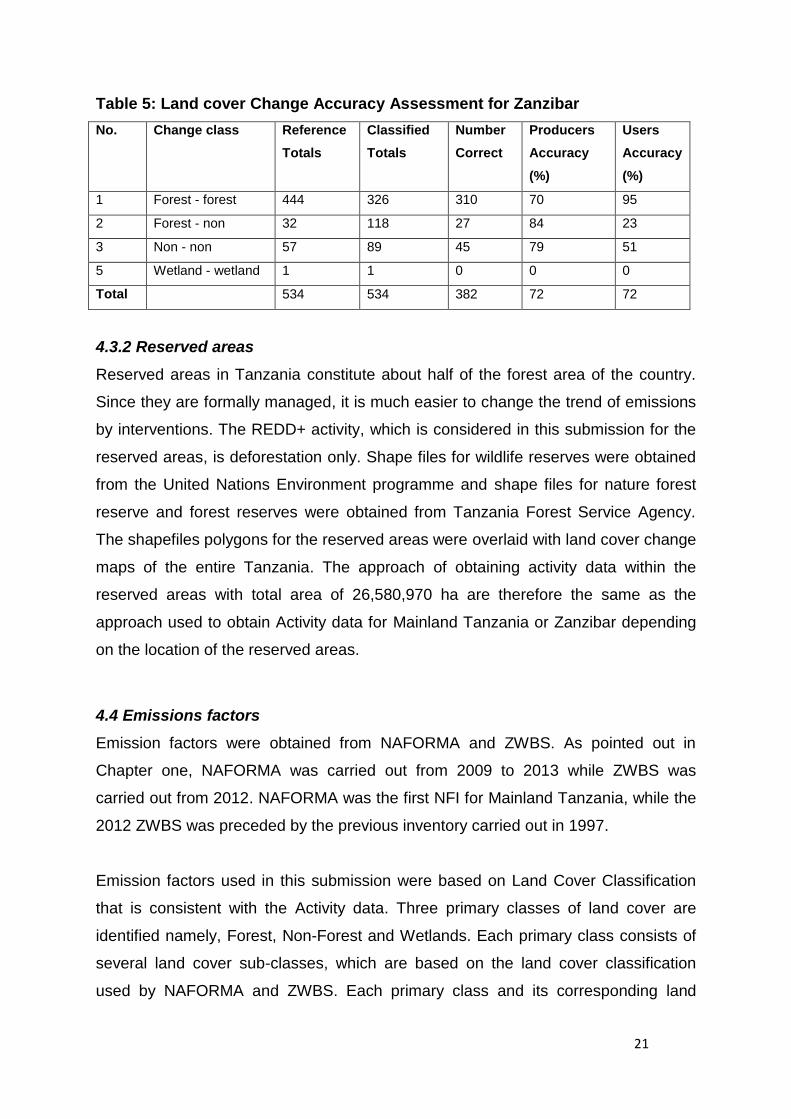
The accuracy assessment not only provided a quantification of the map accuracy
through the creation of error matrices but also it provided error-adjusted area
estimates for the forest and deforestation classes. The results of land cover change
accuracy assessment for Zanzibar are shown in Table 5.
21
Table 5: Land cover Change Accuracy Assessment for Zanzibar
No. Change class Reference
Totals
Classified
Totals
Number
Correct
Producers
Accuracy
(%)
Users
Accuracy
(%)
1 Forest - forest 444 326 310 70 95
2 Forest - non 32 118 27 84 23
3 Non - non 57 89 45 79 51
5 Wetland - wetland 1 1 0 0 0
Total 534 534 382 72 72
4.3.2 Reserved areas
Reserved areas in Tanzania constitute about half of the forest area of the country.
Since they are formally managed, it is much easier to change the trend of emissions
by interventions. The REDD+ activity, which is considered in this submission for the
reserved areas, is deforestation only. Shape files for wildlife reserves were obtained
from the United Nations Environment programme and shape files for nature forest
reserve and forest reserves were obtained from Tanzania Forest Service Agency.
The shapefiles polygons for the reserved areas were overlaid with land cover change
maps of the entire Tanzania. The approach of obtaining activity data within the
reserved areas with total area of 26,580,970 ha are therefore the same as the
approach used to obtain Activity data for Mainland Tanzania or Zanzibar depending
on the location of the reserved areas.
4.4 Emissions factors
Emission factors were obtained from NAFORMA and ZWBS. As pointed out in
Chapter one, NAFORMA was carried out from 2009 to 2013 while ZWBS was
carried out from 2012. NAFORMA was the first NFI for Mainland Tanzania, while the
2012 ZWBS was preceded by the previous inventory carried out in 1997.
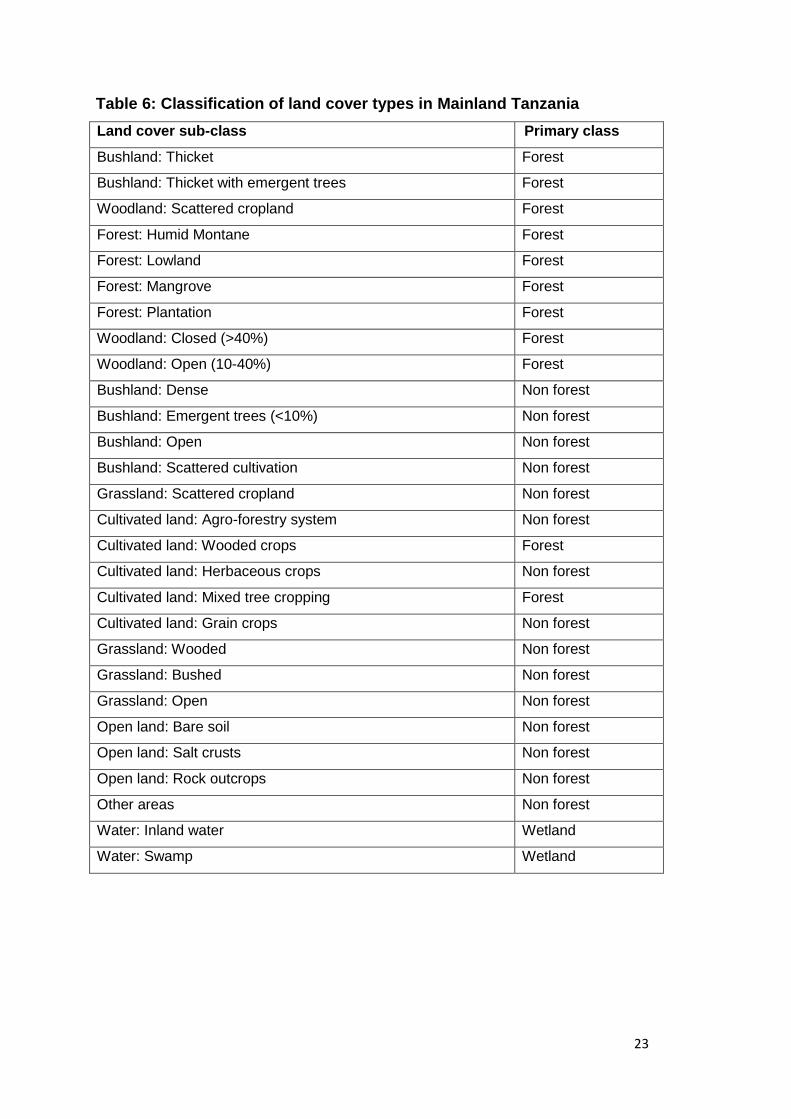
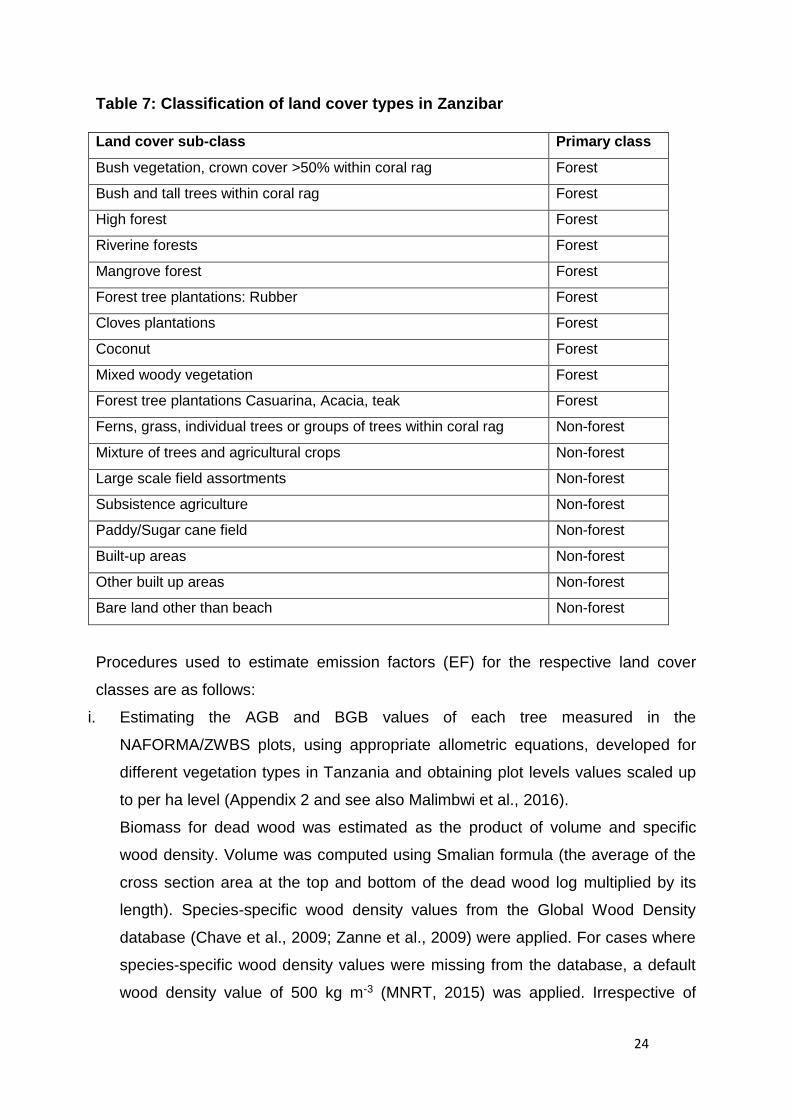
Emission factors used in this submission were based on Land Cover Classification
that is consistent with the Activity data. Three primary classes of land cover are
identified namely, Forest, Non-Forest and Wetlands. Each primary class consists of
several land cover sub-classes, which are based on the land cover classification
used by NAFORMA and ZWBS. Each primary class and its corresponding land
22
cover sub-class for Mainland Tanzania and Zanzibar are presented in Tables 6 and
7 respectively.
Emission factors for the current FREL is defined as the difference between the total
carbon densities (t/ha) before and after deforestation. The total carbon stock density
(t/ha) is the sum of the carbon in the AGB, BGB and DW pools associated with the
land cover primary classes from NAFORMA and ZWBS. It was assumed that the
carbon density after deforestation would not be zero. Accordingly, after
deforestation, carbon density was derived from non-forest land cover primary
classes using NAFORMA and ZWBS data. Details of the NAFORMA are presented
in MNRT (2015), available at http://www.tfs.go.tz/resources/view/naforma-report-
2015 and those for ZWBS are presented in RGoZ (2013) available at
http://www.indufor.fi/zanzibar-woody-biomass-survey-tanzania-2012-2013).
23
Table 6: Classification of land cover types in Mainland Tanzania
Land cover sub-class Primary class
Bushland: Thicket Forest
Bushland: Thicket with emergent trees Forest
Woodland: Scattered cropland Forest
Forest: Humid Montane Forest
Forest: Lowland Forest
Forest: Mangrove Forest
Forest: Plantation Forest
Woodland: Closed (>40%) Forest
Woodland: Open (10-40%) Forest
Bushland: Dense Non forest
Bushland: Emergent trees (<10%) Non forest
Bushland: Open Non forest
Bushland: Scattered cultivation Non forest
Grassland: Scattered cropland Non forest
Cultivated land: Agro-forestry system Non forest
Cultivated land: Wooded crops Forest
Cultivated land: Herbaceous crops Non forest
Cultivated land: Mixed tree cropping Forest
Cultivated land: Grain crops Non forest
Grassland: Wooded Non forest
Grassland: Bushed Non forest
Grassland: Open Non forest
Open land: Bare soil Non forest
Open land: Salt crusts Non forest
Open land: Rock outcrops Non forest
Other areas Non forest
Water: Inland water Wetland
Water: Swamp Wetland
24
Table 7: Classification of land cover types in Zanzibar
Land cover sub-class Primary class
Bush vegetation, crown cover >50% within coral rag Forest
Bush and tall trees within coral rag Forest
High forest Forest
Riverine forests Forest
Mangrove forest Forest
Forest tree plantations: Rubber Forest
Cloves plantations Forest
Coconut Forest
Mixed woody vegetation Forest
Forest tree plantations Casuarina, Acacia, teak Forest
Ferns, grass, individual trees or groups of trees within coral rag Non-forest
Mixture of trees and agricultural crops Non-forest
Large scale field assortments Non-forest
Subsistence agriculture Non-forest
Paddy/Sugar cane field Non-forest
Built-up areas Non-forest
Other built up areas Non-forest
Bare land other than beach Non-forest
Procedures used to estimate emission factors (EF) for the respective land cover
classes are as follows:
i. Estimating the AGB and BGB values of each tree measured in the
NAFORMA/ZWBS plots, using appropriate allometric equations, developed for
different vegetation types in Tanzania and obtaining plot levels values scaled up
to per ha level (Appendix 2 and see also Malimbwi et al., 2016).
Biomass for dead wood was estimated as the product of volume and specific
wood density. Volume was computed using Smalian formula (the average of the
cross section area at the top and bottom of the dead wood log multiplied by its
length). Species-specific wood density values from the Global Wood Density
database (Chave et al., 2009; Zanne et al., 2009) were applied. For cases where
species-specific wood density values were missing from the database, a default
wood density value of 500 kg m-3 (MNRT, 2015) was applied. Irrespective of

25
species, a wood density reduction factor of 0.97 was used for solid woods and
0.45 was used for the more decayed wood (Harmon and Sexton, 1996 in IPCC,
2006);
ii. Stratifying the NAFORMA/ZWBS plots into appropriate land cover sub-classes
which were further aggregated into primary land cover classes (Tables 1 and 2)
that are consistent with activity data classification;
iii. Estimating the average biomass stock per unit area and the associated
uncertainties for each of the land cover sub-class; and
iv. Estimating emission factors of each primary land cover class as a mean of the
land cover sub-class estimates, which were weighted by their corresponding
areas. The emission factor of a given primary land cover class was therefore
computed using equation (1).
………………………………………………………………………… (1)
Where Y is the weighted estimate of AGB, BGB or DW per ha, a is the area of
land cover sub-class i, X is AGB, BGB or DW per ha of the land cover sub-class
and n is the number of land cover sub-classes in the primary land cover class.
v. Calculating Emission Factors for each primary land cover class as the sum of AGB,
BGB and DW, and then multiplied by a factor of 0.47 to convert the biomass to
carbon (IPCC, 2006). In this case, the quality of data and the method, which were
used to obtain EF is high and correspond to Tier 3 (for details see Table 8).
Table 8: Emission factor for each primary land cover classes
Location Primary Land Cover Class Carbon (t/ha)
Mainland Tanzania Forest 33.35
Non forest 5.86
Wetland 4.28
Zanzibar Forest 12.26
Non-forest 8.48
n
i
i
n
i
ii
i
a
aX
Y
1
1

26
5. THE FREL CALCULATION AND RESULTS
The national FREL consists of two sub-national FRELs namely, Mainland Tanzania
and Zanzibar (Fig. 1). Each sub-national FREL was computed as shown in Equation
2.
ForestNonForestActivity EFEFxAreaFREL ……………………………………………… (2)
For reserved areas, Activity data were obtained as shown in section 4.3.4 and for the
emission factor as shown in the procedure under section 4.4, and were estimated by
applying Equation 2 for Mainland Tanzania or Zanzibar (See Tables 9 and 10). To
obtain the carbon dioxide equivalent (tCO2e) the activity data generated from FREL
(Equation 2) was multiplied by a factor of 3.667.
Table 9: The Tanzanian Forest Reference Emission Level
Scope Annual Activity
Data (ha/year)
Forest EF
(t/ha)
Non-Forest EF
(t/ha)
FREL
(tCO2e/year)
Mainland Tanzania
(Sub-National 1)
580,000 33.35 5.86 58,462,066.67
Zanzibar (Sub-National 2) 7,100 12.26 8.48 406.00
Total National FREL 58,462,472.67
Table 10: Activity data, Emission Factors and FREL for Reserved Areas
Scope Annual Activity
Data (ha/year)
Forest EF (t/ha) Non-Forest EF
(t/ha)
FREL
(tCO2e/year)
Mainland Tanzania
(Sub-National 1)
319, 390.00 33.35 5.86 32,193,447.37
Zanzibar
(Sub-National 2)
1,980.00 12.26 8.48 27,442.80
Total FREL 32,220,890.17
The current FREL for Tanzania is therefore estimated at 58,462,472 tCO2e/year.
This is about 0.92% of the total amount of 6,327,717,997 tCO2 stock in the forested
land of Tanzania (MNRT, 2015).
27
6. EXPECTED IMPROVEMENTS
Tanzania will take advantage of stepwise approach to improve the current FREL
overtime by incorporating more REDD+ activities, better data, improved
methodologies and, where appropriate, additional pools. Furthermore, Tanzania will
update her FREL periodically incorporating new knowledge, trends, or any
modification of scope and methodologies.
Repeated measurements from NAFORMA and ZWBS will provide data for forest
degradation, enhancement and conservation of carbon stocks. These inventory data
together with decreasing costs and availability of remote sensing data of higher
spatial and temporal resolution will allow inclusion of the remaining REDD+ activities
in future FREL. However, availability of data for sustainable forest management is
still a challenge, which may be addressed in the distant future.
Soil data were partially collected and analyzed by NAFORMA and ZWBS and thus,
they could not be used. Monitoring of soil organic carbon will be possible in the
future when the analysis of soil data is completed and repeated measurement from
NAFORMA and ZWBS made available.
Ideally, the number of data points should be sufficient to understand the dynamics
and possible trends in historical emissions. This would enhance a country’s capacity
in identifying key national circumstances to be considered, and choose the most
appropriate FREL/FRL construction approach. However, the choice of data points in
this submission was constrained by availability of historical data. In the future, with
availability of promising remote sensing sensors and ground re-measurement more
data point will be included.
Tanzania has started the process of establishing her National Carbon Monitoring
Centre (NCMC). This centre will harness human and technical capacity that will
improve and implement a robust MRV system in order to improve the future FREL.

28
REFERENCES
Breiman, L., (2002). “Manual on Setting Up, Using, And Understanding Random
ForestsV3.1”,
https://www.stat.berkeley.edu/~breiman/Using_random_forests_V3.1.pdf.
Hansen, M. C., Potapov, P. V., Moore, R., Hancher, M., Turubanova, S. A.,
Tyukavina, A., Thau, D., Stehman, S. V., Goetz, S. J., Loveland, T. R.,
Kommareddy, A., Egorov, A., Chini, L. C., Justice, O., and Townshend, J. R. G.,
(2013). High-resolution global maps of 21st-century forest cover change.
Science, 342(6160):850–853.
Haule, E. F. and Munyuku, F. C., (1994). National Forest Inventory in Tanzania. In:
R. E. Malimbwi and E. J. Luoga (Eds), Proceedings of the workshop on
Information Acquisition for Sustainable Natural Forest Resources of Eastern,
Central and Southern Africa, Faculty of Forestry, SUA, Morogoro. 99-113.
Henry, M., Tittonell, P., Manlay, R., Bernoux, M., Albrecht, A., and Vanlauwe, B.,
(2009). Biodiversity, carbon stocks and sequestration potential in aboveground
biomass in smallholder farming systems of western Kenya. Agriculture,
Ecosystems and Environment, 129 (1), 238-252.
IPCC., (2003). Good Practice Guidance for Land Use, Land-Use Change and
Forestry. Institute for Global Environmental Strategies, Japan.
IPCC., (2006). Guidelines for National Greenhouse Gas Inventories – Volume 4 –
Agriculture, Forestry and other Land Use. Institute for Global Environmental
Strategies, Japan.
Liaw, A. and Wiener, M., (2002). Classification and regression by random Forest. R
news 2(3):18-22.
Makero, J. S., Malimbwi, R. E., Eid, T. and Zahabu, E., (2016). Allometric biomass
and volume models for itigi thicket. In Malimbwi, R., Eid, T. and Chamshama,
S.A.O. (eds) Allometric tree biomass and volume models in Tanzania,
Department of Forest Mensuration and Management, Sokoine University of
Agriculture, Morogoro, Tanzania., pp. 85.
Malimbwi R. E., Mugasha W.A.; Mauya, E.W., (2016). Development of Yield Tables
for Seven Tanzania Forest Service Agency Forest Plantations in Tanzania.
Consultancy report. Tanzania Forest Agency. 39 pp.

29
Masota, A. M., Zahabu, E., Malimbwi, R. E., Bollandsås, O. M. and Eid, T., (2015).
Tree allometric models for predicting above- and belowground biomass of
tropical rainforests in Tanzania. XIV World Forestry Congress, Durban, South
Africa, 7-11 September 2015. 12 pp.
Mauya, E. W., Mugasha, W. A., Zahabu, E., Bollandsås, O. M. and Eid, T., (2014)
Models for estimation of tree volume in the miombo woodlands of Tanzania.
Southern Forests: a Journal of Forest Science 76 (4): 209-219.
MNRT., (2015). National Forest Resources Monitoring and Assessment (NAFORMA)
main results. Tanzania Forest Services, Ministry of Natural Resources and
Tourism, Dar es Salaam, Tanzania. 106 pp.
Mugasha, W. A., Zahabu, E., Maguta, M. P., Mshana, J. S., Katani, J. Z. and
Chamshama, S. A. O., (2016b). Allometric biomass models for Pinus patula
plantations. In Malimbwi, R., Eid, T. and Chamshama, S. A. O. (eds). Allometric
tree biomass and volume models in Tanzania. Department of Forest
Mensuration and Management, Sokoine University of Agriculture, Morogoro,
Tanzania. 129 pp. ISBN: 978-9976-9930-1-1.
Mugasha, W. A., Zahabu, E., Mathias, A., Luganga, H., Maliondo, S. M. S. and
Malimbwi, R. E., (2016c). Allometric biomass and volume models for Acacia-
commiphora woodlands. In Malimbwi, R., Eid, T. and Chamshama, S.A.O. (eds)
Allometric tree biomass and volume models in Tanzania. Department of Forest
Mensuration and Management, Sokoine University of Agriculture, Morogoro,
Tanzania. 129 pp. ISBN: 978-9976-9930-1-1.
Mugasha, W. A., Eid, T., Bollandsås, O. M., Malimbwi, R. E., Chamshama, S. A. O.,
Zahabu, E., (2013). Allometric models for prediction of above-and belowground
biomass of trees in the miombo woodlands of Tanzania. Forest Ecology and
Management 310: 87-101.
Mugasha, W. A., Mwakalukwa, E. E., Luoga, E., Malimbwi, R. E., Zahabu, E., Silayo,
D. S., ... & Kashindye, A. (2016a). Allometric models for estimating tree volume
and aboveground biomass in lowland forests of Tanzania. International Journal
of Forestry Research, 2016.
Ned, H., (2010). Random Forests: An algorithm for image classification and
generation of continuous fields data sets International Conference on
Geoinformatics for Spatial Infrastructure Development in Earth and Allied
Sciences 2010.

30
Njana, M. A., (2016). Indirect methods of tree biomass estimation and their
uncertainties. Southern Forests: A Journal of Forest
Science DOI:10.2989/20702620.2016.1233753.
Njana, M. A., Bollandsås, O. M., Eid, T., Zahabu, E. and Malimbwi, R. E. (2015).
Above- and belowground tree biomass models for three mangrove species in
Tanzania: a non-linear mixed-effects modelling approach. Annals of Forest
Science. DOI 10.1007/s13595-015-0524-3.
Olofsson, P., Foody, G. M., Herold, M., Stehman, S. V., Woodcock, C. E., Wulder,
M. A., (2014). Good practices for estimating area and assessing accuracy of
land change. Remote Sensing of Environment 148: 42–57.
Petro, R., Laswai, F., Mijai, M., Nyaradani, G. and Balama, C., (2015). A review on
tree species suitability for wood fuel in Kilimanjaro region. Journal of
Environment and Earth Science 5 (7): 23-27.
Pye S., Hendriksen, G., Watkiss, P., Savage, M. and Maclean, A., (2012). The
Economics of Climate Change in Zanzibar: Assessing the Benefits of a Lower
Carbon Development Pathway for Zanzibar. Technical Report. Final Version,
July 2012.
RGZ., (2013). Zanzibar Wood Biomass Survey. Biophysical Inventory Report.
Revolutionary Government of Zanzibar (RGZ), pp 134.
Tomppo, E., Katila, M., Makisara, K., Perasaari, J., Malimbwi, R., Chamuya, N.,
Otieno, J., Dalsgaard, S., Leppanen., M., (2010). A Report to FAO in support of
Sampling Study for National Forestry Resources Monitoring and Assessment in
Tanzania. Forestry and Beekeeping Division, Ministry of Natural Resources and
Tourism, Dar es Salaam.
UNFCCC., (2014). Report of the conference of the parties on its nineteenth session,
held in Warsaw from 11 to 23 November 2013 Bonn: Germany.
URT., (2014). Second National Communication to the United Nations Framework
Convention on Climate Change. Vice President’s Office, September 201.
Zahabu, E., Mugasha, W., Katani, J., Malimbwi, R., Mwangi, J. and Chamshama, S.,
(2016a). Allometric biomass and volume models for Tectona grandis
plantations. In Malimbwi, R., Eid, T. and Chamshama, S.A.O. (eds) Allometric
tree biomass and volume models in Tanzania, Department of Forest
Mensuration and Management, Sokoine University of Agriculture, Morogoro,
Tanzania., pp. 85.

31
Zahabu, E., Mugasha, A.W., Malimbwi, R.E. and Katani, J.Z., (2016b). Allometric
biomass and volume models for coconut trees. In Malimbwi, R., Eid, T. and
Chamshama, S.A.O. (eds) Allometric tree biomass and volume models in
Tanzania, Department of Forest Mensuration and Management, Sokoine
University of Agriculture, Morogoro, Tanzania., pp. 93
Zahabu, E., Mlagalila, H., & Katani, J. Z. (2016c). Allometric biomass and volume
models for cashewnut trees. In Malimbwi, R., Eid, T. and Chamshama, S.A.O.
(eds) Allometric tree biomass and volume models in Tanzania, Department of
Forest Mensuration and Management, Sokoine University of Agriculture,
Morogoro, Tanzania., pp. 103
32
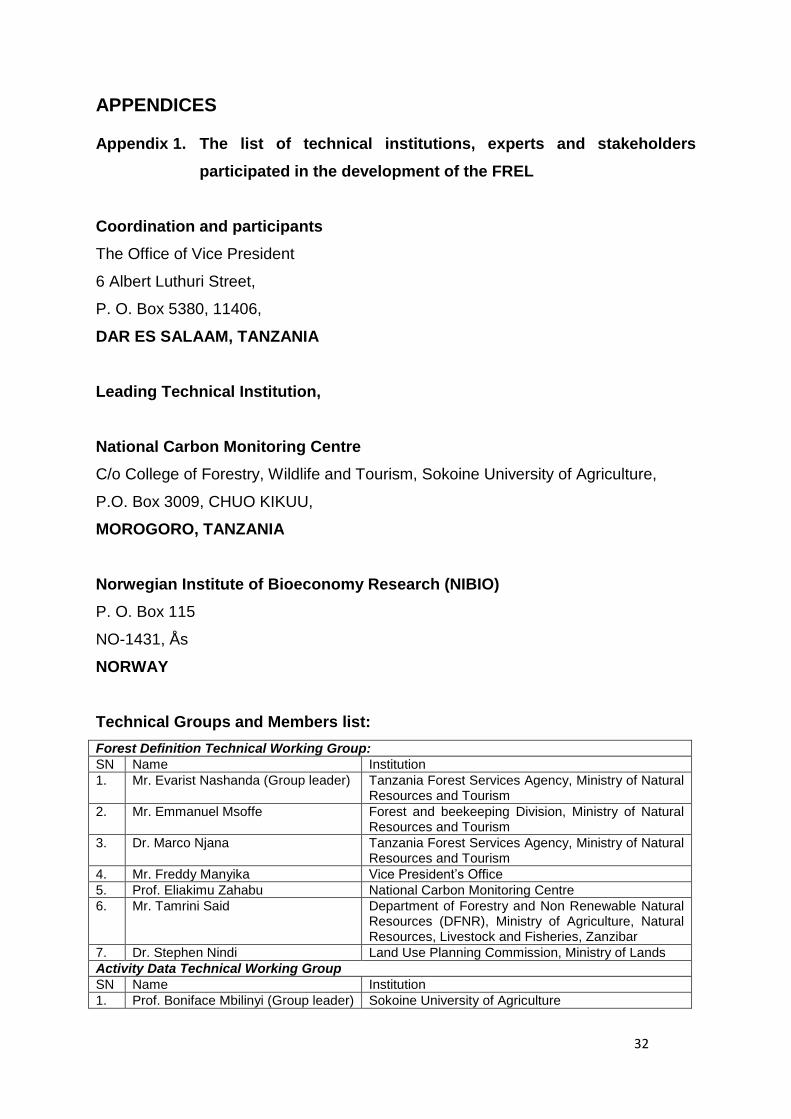
APPENDICES
Appendix 1. The list of technical institutions, experts and stakeholders
participated in the development of the FREL
Coordination and participants
The Office of Vice President
6 Albert Luthuri Street,
P. O. Box 5380, 11406,
DAR ES SALAAM, TANZANIA
Leading Technical Institution,
National Carbon Monitoring Centre
C/o College of Forestry, Wildlife and Tourism, Sokoine University of Agriculture,
P.O. Box 3009, CHUO KIKUU,
MOROGORO, TANZANIA
Norwegian Institute of Bioeconomy Research (NIBIO)
P. O. Box 115
NO-1431, Ås
NORWAY
Technical Groups and Members list:
Forest Definition Technical Working Group:
SN Name Institution
1. Mr. Evarist Nashanda (Group leader) Tanzania Forest Services Agency, Ministry of Natural Resources and Tourism
2. Mr. Emmanuel Msoffe Forest and beekeeping Division, Ministry of Natural Resources and Tourism
3. Dr. Marco Njana Tanzania Forest Services Agency, Ministry of Natural Resources and Tourism
4. Mr. Freddy Manyika Vice President’s Office
5. Prof. Eliakimu Zahabu National Carbon Monitoring Centre
6. Mr. Tamrini Said Department of Forestry and Non Renewable Natural Resources (DFNR), Ministry of Agriculture, Natural Resources, Livestock and Fisheries, Zanzibar
7. Dr. Stephen Nindi Land Use Planning Commission, Ministry of Lands
Activity Data Technical Working Group
SN Name Institution
1. Prof. Boniface Mbilinyi (Group leader) Sokoine University of Agriculture

33
2. Mr. Elikana John Tanzania Forest Services Agency, Ministry of Natural Resources and Tourism
3. Ms. Olipa Simon Institute of Resources Assessment, University of Dar es Salaam
4. Miss. Maria Kapina Tanzania Forest Services Agency, Ministry of Natural Resources and Tourism
5. Mr. Edson Ruhasha Tanzania Forest Services Agency, Ministry of Natural Resources and Tourism
6. Ms. Kekilia Kabalimu Tanzania Forest Services Agency, Ministry of Natural Resources and Tourism
7. Ms. Miza Khamisi Department of Forestry and Non Renewable Natural Resources Zanzibar, Ministry of Agriculture, Natural Resources, Livestock and Fisheries
8. Mr. Abbas Mzee Department of Forestry and Non Renewable Natural Resources Zanzibar, Ministry of Agriculture, Natural Resources, Livestock and Fisheries
9. Ms. Endesh Malikiti Survey and Mapping Division, Ministry of Lands
10. Mr. Johannes May Norwegian Institute of Bioeconomy Research
11. Dr. Misganu Debella-Gilo Norwegian Institute of Bioeconomy Research
Emission Factors Technical Working Group
SN Name Institution
1. Prof. Pantaleo Munishi (Group leader)
Sokoine University of Agriculture
2. Dr. Able Masota Tanzania Forest Services Agency, Ministry of Natural Resources and Tourism
3. Mr. Nurdin Chamuya Tanzania Forest Services Agency, Ministry of Natural Resources and Tourism
4. Prof. Rogers Malimbwi Sokoine University of Agriculture
5. Prof. Salim Maliondo Sokoine University of Agriculture
6. Mr. Charles Kilawe Sokoine University of Agriculture
7. Dr. Josiah Z. Katani Sokoine University of Agriculture
8. Mr. Edson Ruhasha Tanzania Forest Services Agency, Ministry of Natural Resources and Tourism
Forest Reference Emission Level Technical Working Group
SN Name Institution
1. Prof. Japhet Kashaigili (Group leader)
Sokoine University of Agriculture
2. Dr. Marco Njana Tanzania Forest Services Agency, Ministry of Natural Resources and Tourism
3. Dr. Deo Shirima Sokoine University of Agriculture
4. Dr. Wilson Mugasha Tanzania Forest Research Institute
5. Dr. Ernest Mauya Sokoine University of Agriculture
6. Mr. Tamrini Said Department of Forestry and Non Renewable Natural Resources Zanzibar, Ministry of Agriculture, Natural Resources, Livestock and Fisheries
7. Mr. Freddy Manyika Vice President’s Office
8. Mr. George Kafumu Vice President’s Office
9. Ms. Miza Khamisi Department of Forestry and Non Renewable Resources Zanzibar, Ministry of Agriculture and Natural Resources
10. Prof. Eliakimu Zahabu National Carbon Monitoring Centre
11. Mr. Evarist Nashanda Tanzania Forest Services Agency, Ministry of Natural Resources and Tourism
12. Ms. Namkunda Johnson National Carbon Monitoring Centre
13. Dr. Belachew G. Zeleke Norwegian Institute of Bioeconomy Research

34
Appendix 2: Allometric biomass and volume equations for different vegetation types in Tanzania
Veg Type Species AGB Source BGB Source Volume (m3) Source
Forest: Humid Montane
All 0.3571×dbh1.744×ht0.
4713 Mugasha et al., 2016a
AGB×0.25 MNRT, 2015 0.000076xdbh2.3488xht0.3848 Mugasha et al., 2016a
Forest: Lowland All 0.3571×dbh1.744×ht0.
4713 Mugasha et al., 2016a
AGB×0.25 MNRT, 2015 0.000076xdbh2.3488xht0.3848 Mugasha et al., 2016a
Forest: Mangrove Avicenia marina
0.25128×dbh2.24351 Njana et al., 2016
1.42040×dbh1.44260 Njana et al., 2016 0.000202×dbh2.361854 Njana .2016
Soneratia alba
0.25128×dbh2.21727 Njana et al., 2016
1.42040×dbh1.65760 Njana et al., 2016 0.000202×dbh2.361854 Njana. 2016
Rhizophora mucronata
0.25128×dbh2.26026 Njana et al., 2016
1.42040×dbh1.68979 Njana et al., 2016 0.000202×dbh2.361854 Njana. 2016
Others 0.19633×dbh2.010853×ht0.29654
Njana et al., 2016
1.42040×dbh1.59666 Njana et al., 2016 0.000202×dbh2.361854 Njana. 2016
Forest: Plantation Tectona grandis
0.1711×dbh2.0047×ht0.3767
Zahabu et al., 2016a
0.0279×dbh1.7430×ht0.7689
Zahabu et al., 2016a 0.00014×(ht×dbh2)0.8793 Zahabu et al., 2016a
Pinus patula
0.0550×dbh2.5968 Mugasha et al., 2016b
0.0027×dbh3.0579 Mugasha et al., 2016b
exp(-9.10398+2.106032xln(Dbh)+0.521077xln(Ht))
Malimbwi et al., 2016
Eucalyptus spp
volume×843×1.4 IPCC, 2006; MNRT, 2015
AGB×0.25 MNRT, 2015 0.000065×dbh1.633ht1.137 Malimbwi and Mbwambo, 1990
Grevillea robusta
volume×609×1.4 IPCC, 2006; MNRT, 2015
AGB×0.25 MNRT, 2015 0.000065×dbh1.633ht1.137 Malimbwi and Mbwambo, 1990
Others volume×500×1.4 IPCC, 2006; MNRT, 2015
AGB×0.25 MNRT, 2015 0.5×3.14×(0.01×dbh/2)2
×ht Haule and Munyuku, 1994
Woodland: Closed (>40%)
All 0.0763×dbh2.2046×ht0.4918
Mugasha et al., 2013
0.1766×dbh1.7844ht0.
3434 Mugasha et al., 2013 0.00011×dbh2.133ht0.5758 Mauya et al., 2014
Baobab 2.234966×dbh1.43543 Masota et al., 2016
AGB×0.25 MNRT, 2015 0.005804×dbh1.507423 Masota et al., 2016
Dalbergia melanoxylon
Volume×1060×1.4 IPCC, 2006; MNRT, 2015
AGB×0.25 MNRT, 2015 0.00023×dbh2.231 Malimbwi, 2000
Woodland: Open (10-40%)
All 0.0763×dbh2.2046×ht0.4918
Mugasha et al., 2013
0.1766×dbh1.7844ht0.
3434 Mugasha et al., 2013 0.00011×dbh2.133ht0.5758 Mauya et al., 2014
Baobab 2.234966×dbh1.43543 Masota et al., 2016
AGB×0.25 Masota et al., 2016 0.005804×dbh1.507423 Masota et al., 2016
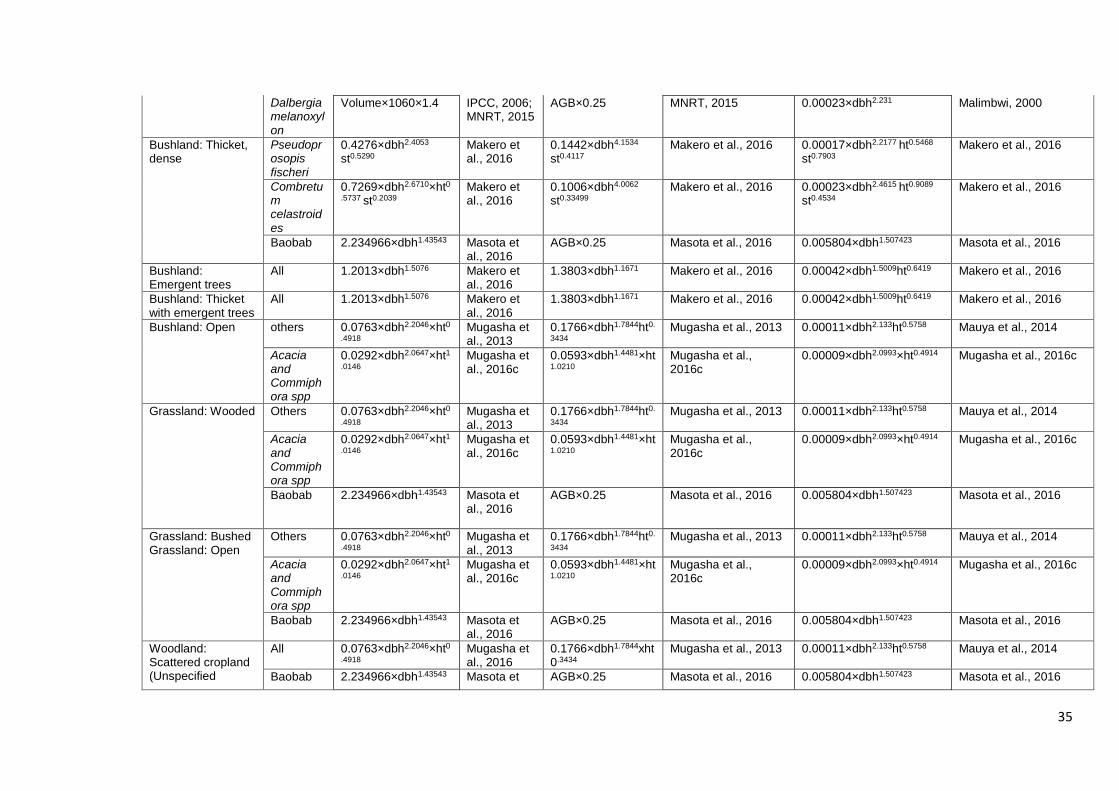
35
Dalbergia melanoxylon
Volume×1060×1.4 IPCC, 2006; MNRT, 2015
AGB×0.25 MNRT, 2015 0.00023×dbh2.231 Malimbwi, 2000
Bushland: Thicket, dense
Pseudoprosopis fischeri
0.4276×dbh2.4053
st0.5290
Makero et al., 2016
0.1442×dbh4.1534
st0.4117 Makero et al., 2016 0.00017×dbh2.2177 ht0.5468
st0.7903 Makero et al., 2016
Combretum celastroides
0.7269×dbh2.6710×ht0.5737 st0.2039
Makero et al., 2016
0.1006×dbh4.0062
st0.33499 Makero et al., 2016 0.00023×dbh2.4615 ht0.9089
st0.4534 Makero et al., 2016
Baobab 2.234966×dbh1.43543 Masota et al., 2016
AGB×0.25 Masota et al., 2016 0.005804×dbh1.507423 Masota et al., 2016
Bushland: Emergent trees
All 1.2013×dbh1.5076 Makero et al., 2016
1.3803×dbh1.1671 Makero et al., 2016 0.00042×dbh1.5009ht0.6419 Makero et al., 2016
Bushland: Thicket with emergent trees
All 1.2013×dbh1.5076 Makero et al., 2016
1.3803×dbh1.1671 Makero et al., 2016 0.00042×dbh1.5009ht0.6419 Makero et al., 2016
Bushland: Open others 0.0763×dbh2.2046×ht0.4918
Mugasha et al., 2013
0.1766×dbh1.7844ht0.
3434 Mugasha et al., 2013 0.00011×dbh2.133ht0.5758 Mauya et al., 2014
Acacia and Commiphora spp
0.0292×dbh2.0647×ht1.0146
Mugasha et al., 2016c
0.0593×dbh1.4481×ht1.0210
Mugasha et al., 2016c
0.00009×dbh2.0993×ht0.4914 Mugasha et al., 2016c
Grassland: Wooded Others 0.0763×dbh2.2046×ht0.4918
Mugasha et al., 2013
0.1766×dbh1.7844ht0.
3434 Mugasha et al., 2013 0.00011×dbh2.133ht0.5758 Mauya et al., 2014
Acacia and Commiphora spp
0.0292×dbh2.0647×ht1.0146
Mugasha et al., 2016c
0.0593×dbh1.4481×ht1.0210
Mugasha et al., 2016c
0.00009×dbh2.0993×ht0.4914 Mugasha et al., 2016c
Baobab 2.234966×dbh1.43543 Masota et al., 2016
AGB×0.25 Masota et al., 2016 0.005804×dbh1.507423 Masota et al., 2016
Grassland: Bushed Grassland: Open
Others 0.0763×dbh2.2046×ht0.4918
Mugasha et al., 2013
0.1766×dbh1.7844ht0.
3434 Mugasha et al., 2013 0.00011×dbh2.133ht0.5758 Mauya et al., 2014
Acacia and Commiphora spp
0.0292×dbh2.0647×ht1.0146
Mugasha et al., 2016c
0.0593×dbh1.4481×ht1.0210
Mugasha et al., 2016c
0.00009×dbh2.0993×ht0.4914 Mugasha et al., 2016c
Baobab 2.234966×dbh1.43543 Masota et al., 2016
AGB×0.25 Masota et al., 2016 0.005804×dbh1.507423 Masota et al., 2016
Woodland: Scattered cropland (Unspecified
All 0.0763×dbh2.2046×ht0.4918
Mugasha et al., 2016
0.1766×dbh1.7844xht0.3434
Mugasha et al., 2013 0.00011×dbh2.133ht0.5758 Mauya et al., 2014
Baobab 2.234966×dbh1.43543 Masota et AGB×0.25 Masota et al., 2016 0.005804×dbh1.507423 Masota et al., 2016

36
density) al., 2016
Bushland: Scattered cultivation
All 1.2013×dbh1.5076 Makero et al., 2016
1.3803×dbh1.1671 Makero et al., 2016 0.00042×dbh1.5009ht0.6419 Makero et al., 2016
Baobab 2.234966×dbh1.43543 Masota et al., 2016
AGB×0.25 Masota et al., 2016 0.005804×dbh1.507423 Masota et al., 2016
Grassland: Scattered cropland
All 1.2013×dbh1.5076 Makero et al., 2016
1.3803×dbh1.1671 Makero et al., 2016 0.00042×dbh1.5009ht0.6419 Makero et al., 2016
Cultivated land: Agro-forestry system
All 0.051x(dbh2xht)0.93 Henry et al., 2009
AGB×0.25 MNRT, 2015 (0.051x(dbh2xht)0.93)/(1.4x500)
MNRT, 2015
Cultivated land: Wooded crops
Coconuts trees
3.7964×ht1.8130 Zahabu et al., 2016b
13.5961×ht0.6635 Zahabu et al., 2016b 0.03470×ht1.1873 Zahabu et al., 2016b
Cashewnuts
0.3152×dbh1.7722ht0.5
003 Zahabu et al., 2016c
AGB×0.25 MNRT, 2015 0.0000001×dbh 2.6044 Zahabu et al., 2016c
Others 0.0763×dbh2.2046×ht0.4918
Mugasha et al., 2013
0.1766×dbh1.7844xht0.3434
Mugasha et al., 2013 0.00011×dbh2.133ht0.5758 Mauya et al., 2014
Cultivated land: Herbaceous crops
All 0.051x(dbh2xht)0.93 Henry et al., 2009
AGB×0.25 MNRT, 2015 (0.051x(dbh2xht)0.93)/(1.4x500)
MNRT, 2015
Cultivated land: Mixed tree cropping
All 0.051x(dbh2xht)0.93 Henry et al., 2009
AGB×0.25 MNRT, 2015 (0.051x(dbh2xht)0.93)/(1.4x500)
MNRT, 2015
Cultivated land: Grain crops
All 0.051x(dbh2xht)0.93 Henry et al., 2009
AGB×0.25 MNRT, 2015 (0.051x(dbh2xht)0.93)/(1.4x500)
MNRT, 2015
Open land: Bare soil
All volume×500×1.4 IPCC, 2006; MNRT, 2015
AGB×0.25 MNRT, 2015 0.5×3.14×(0.01×dbh/2)2
×ht Haule and Munyuku, 1994
Open land: Salt crusts
All volume×500×1.4 IPCC, 2006; MNRT, 2015
AGB×0.25 MNRT, 2015 0.5×3.14×(0.01×dbh/2)2
×ht Haule and Munyuku, 1994
Open land: Rock outcrops
All volume×500×1.4 IPCC, 2006; MNRT, 2015
AGB×0.25 MNRT, 2015 0.5×3.14×(0.01×dbh/2)2
×ht Haule and Munyuku, 1994
Water: Inland water All volume×500×1.4 IPCC, 2006; MNRT, 2015
AGB×0.25 MNRT, 2015 0.5×3.14×(0.01×dbh/2)2
×ht Haule and Munyuku, 1994
Water: Swamp All volume×500×1.4 IPCC, 2006; MNRT, 2015
AGB×0.25 MNRT, 2015 0.5×3.14×(0.01×dbh/2)2
×ht Haule and Munyuku, 1994
Other areas All volume×500×1.4 IPCC, 2006; MNRT, 2015
AGB×0.25 MNRT, 2015 0.5×3.14×(0.01×dbh/2)2
×ht Haule and Munyuku, 1994
Remarks:
For Thicket and dense bushland, the variable ST stands for number of stems in a clump. This variable should be “1”.