the united states: 2. 2. evidence of relative economic failure and decline in economic...
Post on 21-Dec-2015
213 views
TRANSCRIPT

THE UNITED STATES: 2THE UNITED STATES: 2

2. evidence of relative economic failure and decline in economic
competitiveness Example
– John Agnew, 1987. The United States in the World Economy. Chapter 4.


Bluestone and Harrison, 1988. The
Great U-Turn.

Element 1: U.S.-based corporations went from a period of unparalleled growth to one of unprecedented global competition.
05
1015202530354045
1929* 1939 1949 1959 1969 1979 1986
Imports as % of GNP
Imported Merchandise as% of GNP originating inmanufacturing

Element 2: Significant profit squeeze for American corporations
U.S. corporate profitability, 1963-80 (net after tax rate of return)

Net pre-tax profit rates in selected industries
1963-68 1969-75rubber product 9.1 6.1glass products 12.0 7.9steel industry 7.3 4.4fab. metal products 8.0 6.4radio, TV equipment 12.2 3.8electrical equip, heavy 13.2 7.7motor vehicles 16.3 6.7RR equipment 7.8 3.4

Element 3: How those corporations responded
Abandoned core businesses invested offshore shifted capital to speculative ventures subcontracted work to low-wage
contractors demanded wage concessions from workers substituted contingent labor for full-time
workers

Example of General Electric Through 1970s a traditional large U.S.
mfg. Firm shift in 1980s to service and high-tech
– bought RCA, NBC, investment banking, financial services firms. ($10 B. acquisition spree)
eliminated housewares division & sold off 190 subsidiaries for $6 B.
eliminated >100,000 jobs (>1/4 of 1981 employment) including RCA domestic TV production--> Asia.

Dertouzos, 1989. Made in America.
Springboard is trends in productivity
0
0.5
1
1.5
2
2.5
3
Labor productivity Multifactorproductivity
1948-73
1973-79
1979-86
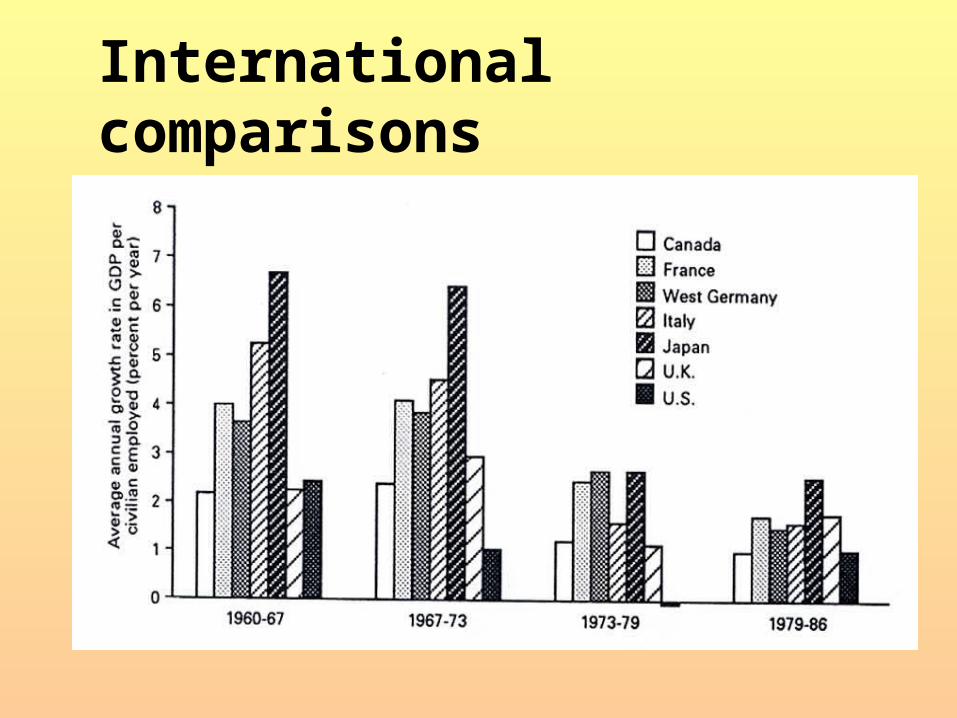
International comparisons

Manufacturing???
0
0.5
1
1.5
2
2.5
3
3.5
Labor productivity Multifactorproductivity
1948-73
1973-79
1979-86
BUT due in part to: DOWNSIZING--10% employment decline 1979-86 accounted for 36% of productivity growth--- and to rebound from recession.

Factors responsible for performance erosion Outdated strategies (Fordist) short time horizons
– role of cost of capital due to low savings rate (< 4% of GDP)
technological weaknesses neglect of human resources failures of cooperation within and
between firms government-industry relationships

Industrial Productivity
Van Ark and Pilat, 1993. Productivity levels in Germany, Japan and the U.S. Brookings Papers.

0
20
40
60
80
100
Germany/U.S Japan/U.S.
1950
1965
1973
1979
1990
Comparisons of Value Added in Manufacturing per hour worked
0
20
40
60
80
100
120
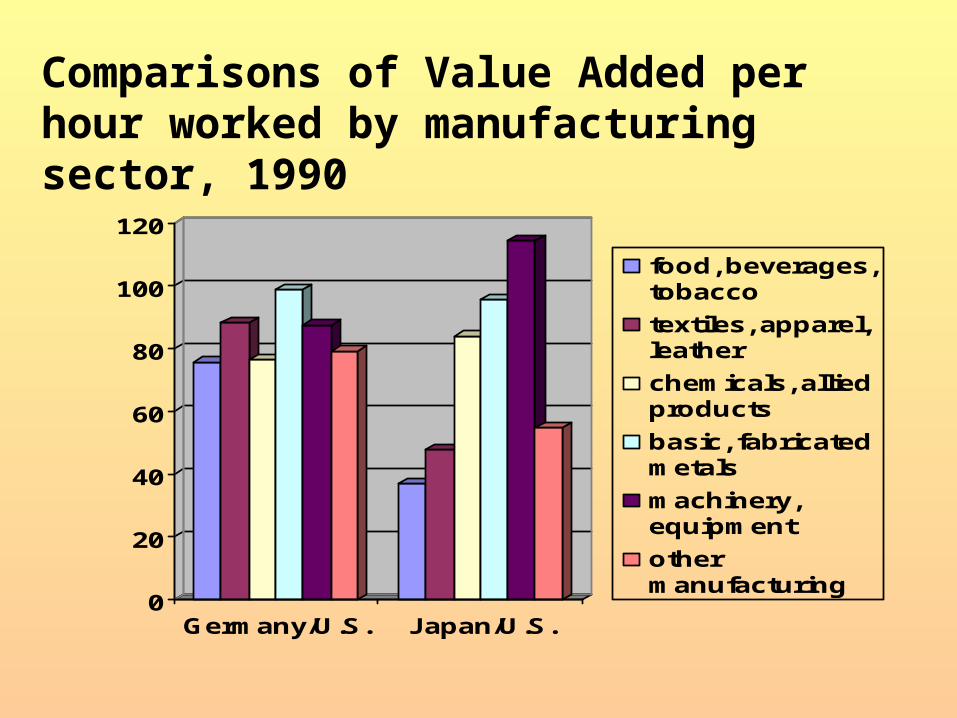
Germany/U.S. Japan/U.S.
food, beverages,tobacco
textiles, apparel,leather
chemicals, alliedproducts
basic, fabricatedmetals
machinery,equipment
othermanufacturing
Comparisons of Value Added per hour worked by manufacturing sector, 1990
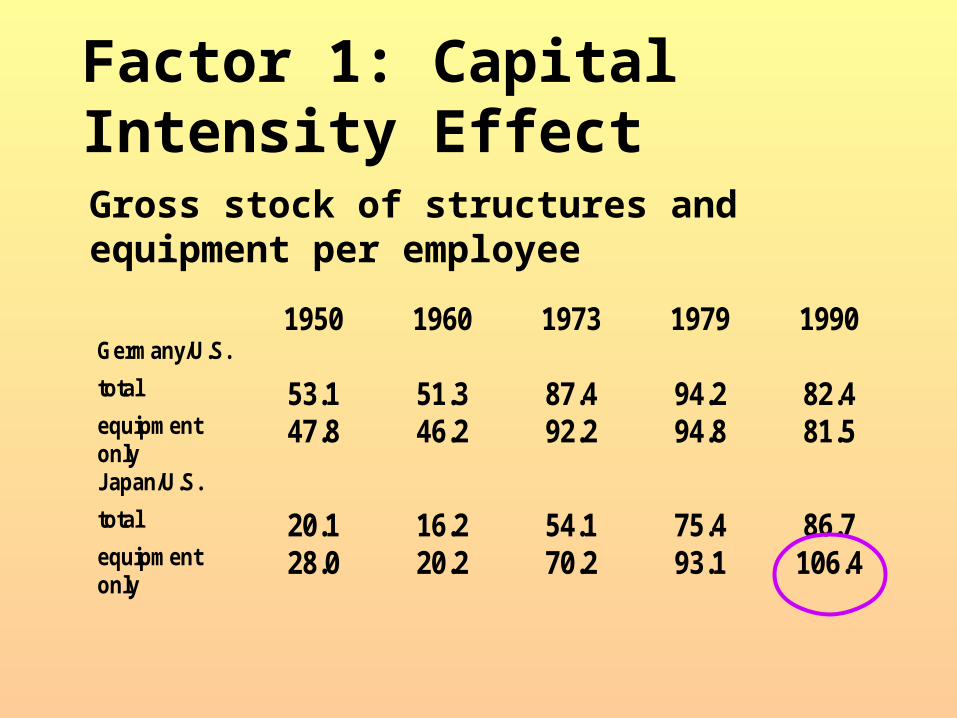
Factor 1: Capital Intensity Effect
1950 1960 1973 1979 1990Germany/U.S.
total 53.1 51.3 87.4 94.2 82.4equipmentonly
47.8 46.2 92.2 94.8 81.5
Japan/U.S.
total 20.1 16.2 54.1 75.4 86.7equipmentonly
28.0 20.2 70.2 93.1 106.4
Gross stock of structures and equipment per employee

Factor 2. Structural Effect Adjusting for relative size of
different sectors lowers German productivity levels relative to the U.S.

Technological leadership.

Lester Thurow, 1992. Head to Head. Distinction between new PROCESS
and PRODUCT technologies U.S. firms make heavier
commitment to new product technology; Japanese to new process technology
Why are U.S. firms reluctant?– Managerial backgrounds in marketing
and finances– skill level of bottom 2/3 of labor force

Florida and Kenney, 1990. The Breakthrough Illusion