the university of arizona college of medicine tucson...
TRANSCRIPT

The University of Arizona College of Medicine
Tucson Program
Clinical Vision and Strategic Priorities 2005-2010
Appendices
April 26, 2005

4-26-2005 1
Table of Contents
Page
Volume I Introduction 2 Principles and Assumptions 2 Mission Statement 5 Five-Year Vision 5 Opportunities for Excellence 6 COM Clinical Strategic Priorities 2005-2010 8 Mechanisms for Growth 11 Volume II: Appendices Appendix A: Planning Process 2 Appendix B: Arizona’s Health Care Needs and the Case for Growth 6 Appendix C: The Path to “Greatness” 25 Appendix D: Clinical and Research Benchmarking 27 Appendix E: A Commitment to Retaining Excellent People and to Diversity 33 Appendix F: Background on Priority National Leadership Programs 38 Appendix G: Clinical Department Heads Survey Results 40

4-26-2005 2
Appendix A Planning Process
This COM planning effort consists of three phases. Phase I is the development of a statement of the COM’s broad vision and strategic priorities for clinical services (this planning document). Phase II is the development of joint COM, UMC, UPI agreements about how to harmonize and implement the strategic plans of all the partners, recognizing that there will be areas of common overlap as well as individual requirements for each of the entities. Phase III is the integration of the results of this clinical planning with parallel efforts occurring in the COM dealing with the research and education missions. Phase I The planning process used to develop this plan is outlined below. Strategic priorities for COM clinical programs will be established by the COM clinical leadership (Dean, Associate Dean for Clinical Affairs, Clinical Department Heads) in consultation with the CEOs of our clinical partners (UMC, SAVAHCS, and UPH,) and input from the COM faculty, clinical section chiefs, and center directors. The foundation for the plan’s development were discussions held during 2004 at the COM Clinical Steering Committee, the Dean’s Cabinet, the Dean’s Clinical Issues group, Council of Clinical Department Heads discussions regarding the Clinical Excellence Initiative, UMC planning, UPH planning (including UPH Hospital at Kino [UPH Hospital]). The formal planning process resulting in this planning document commenced at a joint retreat between COM, UMC, and UPH leadership and board members in October 2004. At the retreat we made the case for the need for clinical growth (See Appendix B) and the concomitant need to engage in strategic planning and budgeting between the COM and its clinical partners. Following the joint retreat, the principles and assumptions were drafted and the COM clinical department heads held a retreat in early December 2004 to adopt the principles and set the stage for a COM strategic plan. In the spirit of transparency, the meeting was attended by leaders from UMC, UPH, and SAVAHCS. Subsequently, in early December 2004 the COM clinical department heads were asked to detail their departmental growth plans over the next five years. The results are contained in Appendix G. The first draft of this document was shared with the clinical department heads at their February 17, 2005 meeting. This was followed by individual meeting with clinical

4-26-2005 3
sections and the COM centers and a clinical faculty town hall to gather broad input from the faculty (see Table A-1). The final document will be adopted in late April 2005.
Table A-1.
Meetings with Departments, Sections, and Centers
Department/Section/Center Date Anesthesiology March 23, 2005 Arizona Cancer Center March 21, 2005 Arizona Respiratory Center March 3, 2005 Dermatology April 13, 2005 Emergency Medicine March 1, 2005 Family and Community Medicine March 24, 2005 Gastroenterology April 13, 2005 Medicine March 29, 2005 Nephrology February 28, 2005 Neurology April 15, 2005 Ob-Gyn February 28, 2005 Ophthalmology March 21, 2005 Orthopaedics April 12, 2005 Pathology March 7, 2005 Pediatrics February 21, 2005 Psychiatry February 28, 2005 Radiation Oncology February 28, 2005 Radiology March 8, 2005 Sarver Heart Center April 21, 2005 Surgery March 9, 2005 SAVAHCS May 3, 2005
Phase II Once this plan is adopted by the COM leadership, it will represent the College’s priorities for program growth in discussions with the Joint Strategic Planning Group, comprised of leaders from UMC, COM, and UPH. Likewise, UMC and UPH will bring their respective strategic plans to the table for discussion. Phase II is a transparent effort by the COM and its clinical partners, UMC, SAVAHCS, and UPH, to arrive at mutual agreements about implementation details including:
Clinical program objectives and benchmarks Geographic location (AHSC, UMC North, SAVAHCS, UPH Hospital campuses) Priorities and timetables for implementation Joint financial planning and support from incremental revenues Accountabilities and incentives

4-26-2005 4
Phase III The Dean’s Research Council is conducting an overall strategic planning process, addressing the research needs and growth in the COM. Separate groups are generating strategic plans for research growth in cancer, cardiovascular disease, diabetes, and human neurological diseases. Additional working groups are developing plans to facilitate interdisciplinary research, to create salary incentive schemes for research-intensive faculty, and to configure core facilities in optimum fashion. Likewise, the Curriculum Committee is engaged in a major redesign of the medical school curriculum. Part of this process involves new mechanisms to catalogue and reward effort and excellence in teaching. Once the basic planning has been completed, the results of all planning efforts will be harmonized in a single summary document. Timeline Phase I
Joint UMC/UPH/COM Retreat October 27-29 2004 Clinical Department Heads Retreat December 4, 2004 Clinical Department Draft Plans December 15, 2004 – February 1,
2005 Council of Clinical Department Heads Review February 17, 2005 Meetings with Departments/Sections/ Centers February 21, 2005 – April 21, 2005 Clinical Faculty Town Hall April 19, 2005 Plan Adopted April 26, 2005
Phase II
Joint Strategic Planning Group February 11, 2005 – weekly/ongoing
Phase III
Integration of Clinical, Research, and Education Plans Fall 2005

4-26-2005 5
Figure A-1. Phase I Planning Timeline

4-26-2005 6
Appendix B Arizona’s Health Care Needs and the Case for Growth
Introduction Arizona is the second fastest growing state in the nation yet has only one allopathic medical school (granting MD degrees) and cannot begin to produce the number of physicians needed for the future. To continue to thrive and to serve its citizens, the UA will expand its medical school into the Phoenix metro area, where the largest population of the state exists. However, at the same time, the COM in Tucson must double the size of its clinical programs (and related educational and research domains) and its faculty in order to accommodate the needs of the burgeoning population of the southern half of the state. The State is Growing Rapidly, and Aging Between 1990 and 2000, Arizona was the fastest growing state in the nation. Table B-1 shows the 1990, 2000, estimated 2004 and projected 2010 population for Arizona and Pima County. During the 1990s, Arizona grew by 40 percent and Pima County by over 25 percent. Pima County will reach 1 million persons, most in the Tucson metro area, by 2008. Growth over the first decade of the 21st century is expected to be almost as great.
Table B-1 Historic and Projected Population Growth, Tucson and Arizona: 1990-2010.
Source: City of Tucson Planning Department, 2005, available at: http://www.cityoftucson.org/planning/; US Census, 2005, available at http://www.census.gov/population/projections
The population of the state is also aging, especially among the baby boomers. That generation born between 1946 and 1965 comprises almost one quarter of Arizona’s population and begins retiring in 2008 (the oldest will be age 62 in that year). The fastest growing component of Arizona’s population consists of those persons 85 years and older, which increased by 82 percent between 1990 and 2000. This is due in large
1990 2000 Percent 2004 Percent 2010 Percent 2000-2010 Growth Area
Census Census Change Estimate Change Projected Change Number Percent Pima County 666,880 843,746 26.5 931,210 10.4 1,037,750 11.4 194,004 23.0
Arizona 3,665,228 5,130,632 40.0 5,723,060 11.5 6,637,381 16.0 1,506,749 29.4

4-26-2005 7
part to the increased longevity of persons over the age of 65. These “oldest old” persons also use health care services at a much higher rate than the rest of the population.1 Table B-2 shows the proportion of those persons over the age 65 and 85 in the US, Arizona, and Pima County in 2000. Both Arizona and Pima County had a geater percentage of those people over the age of 65 than the nation as a whole, not counting the substantial seasonal immigration of “snow birds” during the winter months.2
Table B-2 Population by Age Group in 2000
65 and Older 85 and Older
All Ages Number Percent Number Percent United States 275,130,000 34,817,000 12.7 4,312,000 1.6 State of Arizona 4,961,953 700,461 14.1 83,381 1.7 Pima County 867,363 124,900 14.4 13,010 1.5
Source: U.S. Census Bureau, Population Estimates Program; Arizona Department of Economic Security; American Community Survey, City of Tucson Planning Department3
Table B-3 shows that the projected number and percentage of persons over 65 in both Arizona and Pima County is expected to rise substantially, even over the five-year time frame of this plan (2010).
Table B-3 1990 and Projected Population Age 65 and Older
for Arizona and Pima County
Arizona Pima County Year Number % of Total
Population Number % of Total
Population 1990 480,587 13.1 91,971 13.8 2000 700,461 14.1 124,900 14.4 2010 908,554 14.8 167,412 16.2
Source: U.S. Bureau of the Census, Population Estimates Program, 1990; Arizona Department of
Economic Security; American Community Survey; City of Tucson Planning Department.4
1 Carol Long, The Coming of Age: Meeting Community-based Care Needs in Arizona, (Phoenix: St. Luke’s Health Initiatives, 2002). 2 University of Arizona, Office of Economic Development, New Aging, New Generations: Positioning Pima County in the 21st Century, (Tucson: University of Arizona, 2001). 3 Ibid. 4 Ibid.

4-26-2005 8
The State Needs More Physicians Physician Supply After several decades, the debate regarding whether our nation has a physician surplus largely is settled — a substantial shortage exists. Based on a recently released document from the Council on Graduate Medical Education (a congressionally mandated national physician workforce planning entity), the AAMC now estimates that 15-20 percent more physicians must be trained per year to meet the nation’s health care needs5 and has called for the nation’s medical schools to increase enrollment by 15 percent by 2015.6
An even greater need exists in the state of Arizona. In 2004, 10,072 licensed physicians (MDs and DOs) practiced in Arizona. With a 2004 population of 5.8 million, Arizona had 183.5 physicians per 100,000 population,7 compared to a national average of 229 per 100,000 population. The Bureau of Health Professions in the US Department of Health and Human Services recommends a rate of 230.9.8 The shortage is particularly acute in rural areas and for subspecialty practice.
To reach the national average for physicians per capita, 2,500 more physicians are needed immediately in the state. Compounding the problem is the projected growth in the state’s population, particularly among the elderly, and current trends in physician practice patterns (Arizona ranks 5th and 2nd respectively among states in percent of active physicians 55 and older and 65 and older). Some specialties are already in short supply and others are expected to be once the baby boomers begin retiring in 2009.
Many of our current health workers, including physicians, also fall in the baby boomer age group. Figure B-1 shows the age distribution of active Arizona physicians (MDs and DOs) in 2004. The dark (green) sections include all physicians over the age of 46 (including the baby boomers born after 1958), which comprise 60 percent of active physicians. The average retirement age of Arizona physicians is 63, and by 2010, 28 percent of Arizona physicians will be over the age of 61.9 Statewide, at least 350 new physicians per year would be needed each year to replace those retiring or leaving the state. 5 http://www.aamc.org/newsroom/reporter/nov04/cogme.htm 6 Press release February 22, 2005 at http://www.aamc.org/newsroom/pressrel/2005/050222.htm 7 Physician data from: William Johnson, Tony Garcy, and Michael Grossman, Arizona Physician Workforce Study: Six Month Progress Report, June 30, 2004 to October 1, 2004, (Phoenix: Arizona Medical Education Consortium [AzMEC], 2004). Population date from: Arizona Department of Economic Security, Research Administration, Population Statistics Unit. 8 Cited in Jeffrey Singer and Craig Cantoni, Keeping the Doctor Away: What Makes Arizona Unattractive to Physicians, Goldwater Institute, Arizona Issue Analysis, 165 (Phoenix, 2001). 9 Data from Johnson et al., Ibid.

4-26-2005 9
56-6519%
>65 9% < 36
12%
36-4528%
46-5532%
Figure B-1. Arizona Physician Age Distribution, 2004 In Southern Arizona there were 2,169 active physicians in 2004,10 for a rate of 205.1 per 100,000 people. While greater than the state average, this is still substantially below the national average and includes physicians on the faculty of the COM who are not clinically active full time. Assuming current ratios, the number of additional physicians needed southern Arizona by 2010 could range between 207 (using the 2004 rate) and 737 (using the BHP recommended standard).11 Assuming a similar age distribution in southern Arizona as for the state as a whole, means that almost 660 current physicians will be of retirement age in 2010 in the five southern counties of the state. Arizona also has a lower percentage of primary care physicians than the national average, ranking 42nd. In even shorter supply are specialists, since the state has only 71 percent as many specialists per capita as the national average.12
Medical Student Supply: Our Education Imperative
According to the US Bureau of Health Professions medical schools in Arizona (including the UA COM and two osteopathic medical schools in the Phoenix metro 10 Data from Johnson et al., Ibid. 11 While the general conclusion is that a physician shortage will exist in Arizona by 2010, there are a number of cautions with these data. State data include all active physicians, including those who, for example are in administrative positions, not just those in clinical practice. Ratios do not account for aging of the population, and the above numbers do not reflect the in migration of physicians from other states. AzMEC plans to release a more comprehensive cohort survival projection model of Arizona physician supply needs in late 2005. 12 Data from Mary Jo Waits, Center for the Study of the Future of Arizona

4-26-2005 10
area) graduated 196 physicians in 2000. “On a per capita basis, Arizona graduated far fewer new physicians per 100,000 population (3.9) than did the entire United States (6.4) and ranked 38th among the 46 states with a medical school in medical school graduates per capita.” 13
When comparing only allopathic medical schools, on a per capita basis in 2004 Arizona ranked 46th in the nation with 7.4 allopathic medical students per 100,000 population, compared to the national rate of 23.0/100,000 (Table B-4). For states with medical schools this put us in last place, as the 47th through 52nd ranked states (including Puerto Rico and the District of Columbia) had no allopathic medical schools.
Table B-4 Allopathic Medical Students and Medical Residents per 100,000 by State
Including District of Columbia and Puerto Rico: 2004
Geographic Area Population Total Students/ Total Residents/ As of July 1, 2004 Students 100,000 Residents 100,000 Population Population United States 293,655,404 67,656 23.0 100,176 34.1 Alabama 4,530,182 903 19.9 1,087 24.0 Alaska 655,435 0 0.0 23 3.5 Arizona 5,743,834 425 7.4 1,076 18.7 Arkansas 2,752,629 557 20.2 618 22.5 California 35,893,799 4,388 12.2 9,117 25.4 Colorado 4,601,403 537 11.7 1,058 23.0 Connecticut 3,503,604 805 23.0 1,877 53.6 Delaware 830,364 0 0.0 260 31.3 District of Columbia 553,523 1,830 330.6 1,728 312.2 Florida 17,397,161 1,663 9.6 2,852 16.4 Georgia 8,829,383 1,591 18.0 1,888 21.4 Hawaii 1,262,840 253 20.0 394 31.2 Idaho 1,393,262 0 0.0 43 3.1 Illinois 12,713,634 4,566 35.9 5,435 42.7 Indiana 6,237,569 1,137 18.2 1,197 19.2 Iowa 2,954,451 579 19.6 743 25.1 Kansas 2,735,502 708 25.9 612 22.4 Kentucky 4,145,922 970 23.4 966 23.3 Louisiana 4,515,770 1,727 38.2 1,658 36.7 Maine 1,317,253 0 0.0 260 19.7 Maryland 5,558,058 1,756 31.6 2,568 46.2 Massachusetts 6,416,505 2,493 38.9 4,704 73.3
13 State Health Workforce Profiles Highlights: Arizona, US Department of Health and Human Services, Health Resources and Services Administration, Bureau of Health Professions, available at http://bhpr.hrsa.gov/healthworkforce/reports/statesummaries/arizona.htm

4-26-2005 11
Geographic Area Population Total Students/ Total Residents/ As of July 1, 2004 Students 100,000 Residents 100,000 Population Population Michigan 10,112,620 2,223 22.0 4,086 40.4 Minnesota 5,100,958 1,074 21.1 1,958 38.4 Mississippi 2,902,966 408 14.1 489 16.8 Missouri 5,754,618 1,820 31.6 2,311 40.2 Montana 926,865 0 0.0 17 1.8 Nebraska 1,747,214 938 53.7 540 30.9 Nevada 2,334,771 216 9.3 187 8.0 New Hampshire 1,299,500 303 23.3 315 24.2 New Jersey 8,698,879 1,313 15.1 2,425 27.9 New Mexico 1,903,289 306 16.1 472 24.8 New York 19,227,088 6,988 36.3 14,941 77.7 North Carolina 8,541,221 1,815 21.2 2,551 29.9 North Dakota 634,366 228 35.9 103 16.2 Ohio 11,459,011 3,472 30.3 4,631 40.4 Oklahoma 3,523,553 585 16.6 632 17.9 Oregon 3,594,586 446 12.4 682 19.0 Pennsylvania 12,406,292 4,491 36.2 6,803 54.8 Puerto Rico 3,894,855 968 24.9 779 20.0 Rhode Island 1,080,632 328 30.4 683 63.2 South Carolina 4,198,068 879 20.9 968 23.1 South Dakota 770,883 204 26.5 89 11.5 Tennessee 5,900,962 1,635 27.7 1,802 30.5 Texas 22,490,022 4,837 21.5 6,261 27.8 Utah 2,389,039 415 17.4 568 23.8 Vermont 621,394 403 64.9 247 39.7 Virginia 7,459,827 1,691 22.7 1,990 26.7 Washington 6,203,788 782 12.6 1,485 23.9 West Virginia 1,815,354 1,415 77.9 512 28.2 Wisconsin 5,509,026 585 10.6 1,451 26.3 Wyoming 506,529 0 0.0 34 6.7 Note: States in italics have no medical school. Sources: US Census, Table 1: Annual Estimates of the Population for the United States and states, and for Puerto Rico: April 1, 2000 to July 1 ,2004, Geographic Area Population Estimates, Population Division, U.S. Census Bureau, Release Date December 22, 2004, Available from: http://www.census.gov/popest/states/tables/NST-EST2004-01.xls; ACGME Resident Physician Population by Specialty and State - Academic Year 2003-2004; Available from:http://www.acgme.org/acWebsite/CMS/cms_index.asp; AAMC Medical Student enrollment by state, 2004, availabe from: http://www.aamc.org/data/facts/2004/factsenrl.htm

4-26-2005 12
The UA COM currently enrolls 110 medical students per year, but only 48 percent ultimately end up practicing within Arizona. Every year between one quarter and one third of the medical students do their clinical rotations in Phoenix metro area hospitals, partly because there are not sufficient clinical training opportunities in Tucson. To meet the need for increasing the number of medical students, the COM is expanding its program in Phoenix; however, this in turn may mean that we will need to expand clinical education opportunities in Tucson, as the Phoenix medical students will require an expanding number of clinical rotation placements as the class size increases. Medical Residents An even greater predictor of the future supply of practicing physicians in the state is the number of residents trained here. Currently the COM in Tucson trains 460 residents in 38 specialties and subspecialties, many of whom come from outside Arizona, but only approximately 50 percent remain to practice here. Another 762 residents are trained at the teaching hospitals in the Phoenix metro area.14 As seen in Table B-4, Arizona had 18.7 residents per 100,000 population, compared to the national rate of 34.1. Similarly to its medical student ranking, Arizona ranked 42nd out of the 52 states and the District of Columbia and Puerto Rico in number of residents per 100,000 populations. In 1998 (the most recent year for which data are available), 35 percent of those enrolled in residency programs in Arizona completed their training in that year.15 Applying this number to the total number of residents, yields 388 graduating residents per year, of which only one half (approximately 194) will enter practice in the state—substantially less than the 350 new physicians needed per year.16 We simply must provide more training opportunities, particularly for residents, in southern Arizona. The 80 hour resident work week has decreased the amount of time residents can practice, and in addition to providing patient care, residents are also heavily involved in the teaching of medical students.17 The potential for adding many more residents at UPH Hospital gives us a unique opportunity to expand resident training in southern Arizona. Additional ways must be found to increase the number of residents at UMC as well, particularly for specialties that have strict patient volume requirements, e.g., Anesthesiology, Pathology, and Radiology, that may not be met in the early years of UPH Hospital. Of particular importance will be expanding the pool of physicians from minority and underserved populations.
14 Data from UA College of Medicine and Arizona Medical Education Consortium (AzMEC) 15 Arizona Council for Graduate Medical Education, State of the State: Graduate Medical Education in Arizona, Vol. I of III, (Phoenix, 2000). 16 More detailed projections of physician need in the state under differing growth scenarios will be produced by AzMEC in 2005. 17 Arizona Council for Graduate Medical Education, Ibid.

4-26-2005 13
The COM Needs More Physicians to Provide Clinical Care The physician shortage has also affected the COM, which often competes with the community when doctors wish to relocate to Tucson. Many clinical departments and sections within the COM are too small to provide the tertiary/quaternary levels of service (what we are calling the regional leadership level of care) that are expected by patients and referring physicians seeking services from an academic medical center. Because of the small number of faculty members it is often difficult to provide clinical coverage, and in some cases, entire disciplines are lacking (e.g., ENT). Patients often cannot get appointments for months, and payers, while wishing to send enrollees to us because of the quality of care we can provide, tell us that they are developing contracts with other providers because we have insufficient physician availability to meet their needs. In 2004 we examined the relative size of the faculties of the departments of medicine and surgery at 14 peer medical schools across the country, including:
Oregon Health Sciences Center University of Alabama UCLA-Geffen UC San Francisco University of Colorado University of Maryland University of Michigan University of Minnesota University of North Carolina University of Utah University of Virginia University of Washington University of Wisconsin Virginia Commonwealth University
These institutions were chosen because they were public medical schools, many of which were located in the western US, and because they were peers to whom we could aspire. The departments of medicine and surgery were chosen because they typically are the largest clinical departments in medical schools. For each institution the number of faculty members in each department or section was tabulated from the institutions’ websites (including the UA and/or UMC websites for consistency. (UA numbers of clinical faculty who received at least part of their salary from UPH were updated by departmental survey in March 2005.) While websites are not an exact count of the current faculty, and some schools categorize their clinical disciplines differently from the UA, the results were sufficiently robust to give a sense how the UA compares with its peers. Tables B-5 through B-8 show the results of comparing the selected institutions to the COM.

4-26-2005 14
Department of Surgery The UA Department of Surgery had 60 fewer physicians than the mean of the comparison group and each of its sections had fewer faculty members than the average for all groups. In all but two categories (CT surgery and urology), the UA ranked lower than the smallest of the peer departments/sections.
Table B-5 Size of the Surgery Clinical Faculty at Selected Schools of Medicine
Compared with the UA College of Medicine, 2004
Specialty Largest Faculty
Smallest Faculty
Average Size
UACOM/ UPH
Cardiac & Thoracic Surgery 12 5 8 8 General Surgery 37 16 25 9 Neurosurgery 19 6 11 4 Orthopaedic Surgery 26 11 19 6 Otolaryngology 21 7 13 0 Pediatrics 8 3 4 0 Plastic & Reconstructive 10 3 4 2 Urology 16 3 9 5 Vascular 9 2 5 2
Source: Institutional websites and COM department survey, March 2005
Table B-6 Analysis of the Size of the Surgery Clinical Faculty at Selected Schools of Medicine
Compared with the UA College of Medicine, 2004
Specialty Peer Average
UACOM/ UPH Difference Lowest
Peer Difference
Cardiac & Thoracic Surgery 8 8 0 5 +3 General Surgery 25 9 -16 16 -7 Neurosurgery 11 4 -7 6 -2 Orthopaedic Surgery 19 6 -13 11 -5 Otolaryngology 13 0 -13 7 -7 Pediatrics 4 0 -4 3 -3 Plastic & Reconstructive 6 2 -4 3 -1 Urology 9 5 -4 3 +2 Vascular 5 2 -3 2 0 TOTAL 100 36 -64 56 -20
Source: Institutional websites and COM department survey, March 2005

4-26-2005 15
Department of Medicine The UA Department of Medicine had 230 fewer physicians than the mean of the comparison group, and each of its sections had fewer faculty members than the average for all groups. In all but one category (hematology/oncology), the UA ranked lower than the smallest of the peer departments/sections.
Table B-7 Size of the Medicine Clinical Faculty at Selected Schools of Medicine
Compared with the UA College of Medicine, 2004
Specialty Largest Faculty
Smallest Faculty
Average Size
UACOM/ UPH
Cardiology 54 17 32 16 Dermatology 43 5 20 5 Endocrinology 51 11 21 1 Gastroenterology 38 7 22 6 General Medicine 91 25 51 5 Geriatrics 27 6 15 2 Hematology & Oncology 77 6 34 18 Infectious Disease 39 8 20 4 Inpatient Medicine 22 10 15 3 Nephrology 47 11 20 5 Pulmonary & Critical Care 74 9 29 4 Rheumatology & Immunology 45 12 25 5
Source: Institutional websites and COM department survey, March 2005
Table B-8 Analysis of the Size of the Medicine Clinical Faculty at Selected Schools of Medicine
Compared with the UA College of Medicine, 2004
Specialty Peer Average
UACOM/ UPH Difference Lowest
Peer Difference
Cardiology 32 16 -16 17 -1 Dermatology 20 5 -15 5 0 Endocrinology 21 1 -20 11 -10 Gastroenterology 22 6 -16 7 -1 General Medicine 51 5 -46 25 -15 Geriatrics 15 2 -13 6 -4 Hematology & Oncology 34 18 -16 6 +12 Infectious Disease 20 4 -16 8 -4 Inpatient Medicine 15 3 -12 10 -7 Nephrology 20 5 -15 11 -6 Pulmonary & Critical Care 29 4 -25 9 -5 Rheumatology & Immunology 25 5 -20 12 -7 TOTAL 304 16 -230 127 -53
Source: Institutional websites and COM department survey, March 2005

4-26-2005 16
Lack of Hospital Resources in Tucson and at the AHSC Southern Arizona and the Tucson metro area have a large number of clinical competitors. Fortunately, compared to the previous decades of the COM’s history, local health care resources have not been able to keep up with the area’s growth and aging population. This means that because of the shortage of many physician specialties (see previous discussion) and a current lack of hospital resources (see below), there exist a number of opportunities to grow clinical programs. It is important to note that this opportunity to grow has a small window, as local competitors are expanding to meet these needs as well. In October 2004 we examined the local health care market place in order to identify opportunities for COM/UMC/UPI to grow, as well as where there might be potential conflicts with other health care providers.
Community Hospitals and the Future Demand and Supply of Beds18 The number of current and projected beds (expected to be built by 2010) by hospital and system is shown in Table B-9.
Table B-9
Current and Projected Beds and Population Based Need for Tucson Hospitals and Systems, 2005 to 2010.
Hospital/ Current Licensed Beds Projected Beds (2010) Population Based Need
System Number Percent Number Percent Unadjusted Adjusted St. Joseph's 301 13.8% 405 14.4% 329 349 St. Mary's 400 18.3% 400 14.2% 437 464 Carondelet 701 32.0% 805 28.6% 765 812 TMC 457 20.9% 450 16.0% 499 530 Palo Verde 62 2.8% 62 2.2% 68 72 El Dorado 166 7.6% 166 5.9% 181 192 Rincon Community 0 0.0% 90 3.2% 0 0 TMC Healthcare 685 31.3% 768 27.3% 748 794 UMC 355 16.2% 499 17.7% 387 411 UPH 144 6.6% 200 7.1% 157 167 UPH Psych 0 0.0% 60 2.1% 0 0 AHSC 499 22.8% 759 27.0% 545 578 Northwest 244 11.1% 244 8.7% 266 283 Oro Valley/Marana 0 0.0% 180 6.4% 0 0 Northwest 244 11.1% 424 15.1% 266 283 Tucson Heart 60 2.7% 60 2.1% 65 70 TOTAL 2,189 100.0% 2,816 100.0% 2,389 2,537
Source: Arizona Department of Health Services; Jane Erikson, Arizona Daily Star, Sept. 12, 2004; Jane Erikson, Arizona Daily Star, April 1, 2005.
18 A version of this material was presented to the joint COM/UPH/UMC leadership retreat in October 2004.

4-26-2005 17
Table B-9 also shows the projected number of beds needed in 2010, based on population growth (unadjusted), as well as the need taking into account the aging of the population (adjusted). A projected occupancy rate of 70 percent was used to account for the seasonal swings in hospital bed use. The total projected number of beds needed in 2010 is approximately 2,537, while the number projected to be available in that year is 2,816. In addition to planned expansions at UPH Hospital and UMC, Carondelet plans to add 104 beds at St. Joseph’s; Northwest may build another 90 bed facility in Marana; and, TMC is building 90-bed Rincon Community Hospital in the southeast part of the valley. While the 2010 projected number represents almost a 300 bed surplus, how many are actually constructed by that time is uncertain. However, as the population of Pima County is projected to increase by almost 300,000 people between 2010 and 2020,19 Tucson will easily “grow” into any surplus hospital beds. The challenge will be to staff them. In an independent estimate of bed need for UMC, the McManis Consulting organization projected that the hospital would need between 350 and 500 beds by 2010. This is in line with the above projections for the hospital (Figure B-2). Adding UPH Hospital to the mix offers the COM increased opportunities to grow clinical programs.
Figure B-2. Projected UMC Bed Need, 2003-2010 (Source: McManus Consulting).
19 Population projects from the City of Tucson Department of Urban Planning and Design, available at: http://www.cityoftucson.org/planning/histpop2004.pdf

4-26-2005 18
The bed market share information for 2005 and projected to 2010 in Table B-9 is graphically represented in Figures B-3 and B-4.
Carondelet32%
TMC31%
AHSC23%
Northwest11%
Tucson Heart3%
Figure B-3. Hospital System Bed Share, 2005 (Source: Table B-9)
Carondelet30%
TMC28%
AHSC28%
Northwest12%
Tucson Heart2%
Figure B-4. Projected Hospital System Bed Share, 2010 Source: Table B-9)
Assuming that all institutions, including UMC and UPH Hospital build according to their announced plans, by 2010 UMC and UPH Hospital will be tied in size with TMC and slightly smaller than the Tucson Carondelet hospitals. Expectations That Our Academic Medical Center Lead in Economic Development
Overall Contributions to the Economy The primary benefit of the COM is in contributing to the overall improved health of the population of southern Arizona. As a simultaneous benefit, the COM and its clinical

4-26-2005 19
partners are an enormous economic engine, contributing heavily to the economy by the existing health care, education, and research activities. Nationwide, American Association of Medical Colleges (AAMC) hospitals – of which AMCs are central elements - contribute $326 billion annually to the economy.20 This is greater than the volume of e-commerce on the Internet! These centers are responsible for 2.7 million jobs, or 1 out of every 54 wage earners. In Arizona, according to the AAMC report, the whole AHSC in Tucson has an annual economic impact of $2.5 billion. Among the COM’s clinical partners, in 2004 UMC was the 14th largest employer in southern Arizona with annual revenues of $350.0 million. In the same year, including UPH Hospital, UPH was the 33rd largest regional employer, with annual revenues of $190.5 million. If one were to combine the number of FTEs at the COM (2,044), UPH (1,460), and UMC (2,918), the combined enterprise would be the ninth largest employer in Southern Arizona. Adding the SAVAHCS (1,648 FTE and the 28th largest employer in 2004) would make it the sixth largest employer.21 While medical colleges and teaching hospitals are generally not-for-profit, state governments receive substantial revenues as a result of the direct and indirect impact of these entities:
State income taxes paid by staff, employed physicians, and medical residents Sales tax revenues paid by businesses providing goods and services to medical
schools and hospitals Corporate net income taxes paid by businesses providing goods and services to
hospitals Other taxes such as gross receipts taxes, public utility realty taxes, insurance
premium taxes, motor vehicle taxes and financial institution taxes It is clear from research completed by the AAMC that communities in all regions of the country rely on medical colleges and teaching hospitals for “unique and specialized healthcare services, advanced research, education of healthcare professionals, job creation and new business development.”
In 2004, MEDTAP International conducted a study22 on the value of investment in health care, and concluded that health benefits have clear, quantifiable, economic value. This study addressed the benefits of improved health that health care spending has 20 Tripp Umbach Healthcare Consulting, Inc. The Economic Impact of Medical College and Teaching Hospital Members of the Associaion of American Medical Colleges. 2002. 21 Data from:Arizona Daily Star, Star 200: The Major Employers of Southern Arizona, 2004. March, 13, 2005. Available at: http://regulus.azstarnet.com/star200/; COM Human Resources for COM data. 22 MEDTAP International, The Value of Investment in Health Care, (Bethesda, 2004).

4-26-2005 20
brought since the 1970s. The study concludes that the value of improved health care in the US population over 20 years significantly outweighs the additional health care expenditures that accompanied the improvements. Major findings from the MEDTAP study show:
In the past 20 years, each additional dollar spent on health care services has produced health gains valued at $2.40 to $3. This value can be measured by health benefits such as life-years gained and deaths avoided; indirect benefits such as productivity; and monetized health benefits – applying dollar value to life-years gained or deaths avoided.
Annual death rates declined 16 percent. Life expectancy from birth increased 4 percent. Disability rates for people over the age of 65 declined 25 percent. The number of days in the hospital, a measure of population health, fell 56
percent. Without these improvements in health and the associated investment, the US would have spent $634 billion less on health care in 2000, but would have experienced 470,000 more deaths, 2.3 million more people with disabilities and 206 million more days spent in the hospital. Despite the clear economic and health-related benefits of AMCs, Arizona lags behind other states in the nation. As outlined in the Flinn-Battelle Arizona’s Bioscience Roadmap,23 Arizona must play catch-up. Although Arizona currently ranks 18th overall in state population, our state ranks 27th in terms of economic impact of AAMC hospitals.
New Treatments Brought to Market and Economic Development through Research
While scientific discovery is noble in its own right, the public expectations of the COM, particularly in its role as part of a Land Grant University, are that its research will also lead to new treatments that can improve the health status of the residents of the state. Policy makers and Arizona citizens further hold out great hope that the college’s research can be a catalyst for growth in the state’s economy through stimulation of its budding biomedical industry. In 2003, the COM had $73 million of NIH funding and total research grant funding of $122 million. Nevertheless, the College is one of the nation’s smaller AMCs in NIH funding. The COM is 55th in overall NIH research funding among the nation’s 125
23 Technology Partnership Practice, Battelle Memorial Institute, (Prepared for Flinn Foundation), Platform for Progress: Arizona’s Bioscience Roadmap, (Cleveland, 2002).

4-26-2005 21
medical schools, reflecting predominantly the small size of the medical school rather than the success of investigators in obtaining funding.24 Among smaller medical schools the COM has been quire successful in obtaining NIH funding. While the UA COM ranked 87th in total faculty size (422) in 2003, among medical schools with less than 500 faculty members (Table B-9) the UA COM ranked second in NIH funding. Among medical school with less than 600 faculty members, the UA COM ranked third, and with less than 700 faculty members, the UA COM ranked ninth in total NIH funding in 2003.25
Table B-10 NIH Total Dollars and Ranking of UA College of Medicine
Compared to Other Medical Schools by Faculty Size
Medical School Faculty Size NIH Ranking Total NIH Funding ($ in millions)
Stanford University 681 12 235.5 University of Texas Galveston 655 25 202.9 University of Chicago 677 31 153.8 University of Massachusetts 627 41 95.1 Dartmouth 641 49 75.4 UC Davis 387 52 70.5 Ohio State University 562 53 68.3 UC Irvine 611 54 68.1 University of Arizona 422 55 $66.2
Source: National Institutes of Health and AAMC The effects of the small number of faculty members on total NIH funding at the COM is reflected in Tables B-11 through B-13, which document for the same institutions cited earlier, the NIH ranking for the medical schools and their departments of medicine and surgery. The COM ranks second to last as an institution, with its departments of medicine and surgery ranking last in NIH funding (Table B-11). The departments of Surgery and Medicine at the UA also rank lowest among the comparison schools in their percentage contribution to the overall NIH research awards received by the medical schools.
24 Keith A. Joiner and Steven Wormsley, “Strategies for Defining Financial Benchmarks for the Research Mission in Academic Health Centers,” Academic Medicine, 80 (2005): 211-217. 25 NIH data at http://grants1.nih.gov/grants/award/rank/medttl03.htm and AAMC data at http://www.aamc.org.

4-26-2005 22
Table B-11 NIH Rankings of Selected Schools of Medicine and the Departments of Medicine
and Surgery, Compared to the UA College of Medicine, 2003.
Medical School NIH Rank Medicine Surgery UCSF 4 2 10 U Washington 6 4 12 UCLA 9 8 7 Michigan 11 10 2 North Carolina 14 13 19 Alabama 17 7 4 Colorado 20 14 23 Wisconsin 27 18 16 Minnesota 29 33 31 Oregon 30 38 52 Virginia 31 28 39 Maryland 32 30 11 Utah 38 23 57 Arizona 51 58 58 Virginia Commonwealth 60 50 36
Source: National Institutes of Health
Table B-12 Department of Medicine Percentage of Total NIH Award Dollars, UA College of
Medicine and Comparison Medical Schools, 2003.
Medical School NIH Rank Medicine Percent UCSF 4 2 43.0 U Washington 6 4 33.1 UCLA 9 8 29.7 Michigan 11 10 29.6 North Carolina 14 13 31.1 Alabama 17 7 41.2 Colorado 20 14 37.2 Wisconsin 27 18 36.5 Minnesota 29 33 23.8 Oregon 30 38 19.6 Virginia 31 28 30.8 Maryland 32 30 29.2 Utah 38 23 42.9 Arizona 51 58 17.6 Virginia Commonwealth 60 50 26.2
Source: National Institutes of Health

4-26-2005 23
Table B-13 Department of Surgery Percentage of Total NIH Award Dollars, UA College
of Medicine and Comparison Medical Schools, 2003.
Source: National Institutes of Health Nationally, the biosciences comprise an average of 57 percent of total university research. In Arizona, the figure is just 44 percent ($229 million in 2000). From 1996 to 2000, the state's total biosciences research funding grew 27 percent, compared to a 36 percent gain for the nation.26 Thus, Arizona is losing its market share of the national research budget and will need to gain lost ground to become competitive. The Milken Institute’s 2004 study, America’s Biotech and Life Science Clusters: San Diego’s Position and Economic Contributions, says regional leaders across the United States are “fighting hard to lure what they believe is the economic growth industry of the 21st century – biotechnology.” 27 Arizona has a significant role to play in this emerging high-tech economy. “Hospitals and clinics are the primary sources of clinical trials and much innovation. However, there is an important race underway – the one to determine where the dominant health care centers will be located.”28 As noted earlier, in 2003 the COM generated $73 million in NIH funding. Each dollar invested in research returns $4.11 versus all healthcare expenditures, which returned $2.30.29
26 Data from Mary Jo Waits, Center for the Study of the Future of Arizona 27 Ross DeVol, Perry Wong, Junghoon Ki, Armen Bedroussian and Rob Koepp, America’s Biotech and Life Science Clusters: San Diego’s Position and Economic Contributions, (Santa Monica: Milken Institute, 2004). 28 Ross DeVol and Rob Koepp, America’s Healthcare Economy, (Santa Monica: Milken Institute, 2003). 29 MEDTAP International, The Value of Investment in Health Care, (Bethesda, 2004).
Medical School NIH Rank Medicine Percent UCSF 4 10 4.7 U Washington 6 12 4.0 UCLA 9 7 7.8 Michigan 11 2 7.7 North Carolina 14 19 2.5 Alabama 17 4 3.4 Colorado 20 23 1.5 Wisconsin 27 16 7.3 Minnesota 29 31 1.4 Oregon 30 52 0.9 Virginia 31 39 2.1 Maryland 32 11 2.3 Utah 38 57 0.8 Arizona 51 58 0.3 Virginia Commonwealth 60 36 3.3

4-26-2005 24
A variety of planning processes have coalesced in the last three years to produce a clear roadmap for development of biomedical research in Arizona. The Flinn-Battelle Arizona’s Bioscience Roadmap has identified three areas of short-term focus (cancer therapeutics, neurosciences and biomedical engineering) and four areas of longer-term focus, including diabetes. This has been further refined for the UA through the Focused Excellence initiative and subsequently in strategic planning for the COM. Accordingly, research growth in the COM statewide will be focused in three major areas: cancer, diabetes and human neurosciences.30 Additional emphasis will be placed on enabling technologies for the rapidly growing biomedical imaging and telemedicine programs.
30 Dean’s Research Council, UA College of Medicine, Strategic Plan for Research at the College of Medicine, (Tucson: UA College of Medicine, January 21, 2005 Draft).

4-26-2005 25
Appendix C The Path to “Greatness”31
Jim Collins, author of the landmark comparative study of high performing organizations, Good to Great,32 defined how good organizations, like the COM, can become great. The path to greatness (modified for a not-for-profit organization), as seen in Figure C-1, is the simultaneous deep understanding of four intersecting imperatives:
1) Doing what contributes most to your mission 2) Engaging in that what you are most passionate about 3) Focusing on what you can be best in the world at 4) Paying attention to what contributes most to net revenue
Figure C-1. Collins’s Model for Not-for-Profit Organizations
Collins calls his model the “Hedgehog Concept.” “A Hedgehog Concept is not a goal to be the best, a strategy to be the best, an intention to be the best, a plan to be the best. It is an understanding of what you can be the best at. The distinction is absolutely
31 Adapted from presentation by Dean Keith Joiner to the UA COM faculty on May 25, 2004. 32 Jim Collins, Good to Great, (New York: HarperCollins, 2001).
What are you deeply
passionate about?
What you can be best in the
world at?
What contributes most to
your mission?
Path to Greatness
What contributes mostto net revenue?
Modified from Collins, Good to Great, 2001

4-26-2005 26
critical.”33 Collins further states: it is not “let’s get passionate about what we do. Rather, we should only do those things we can get passionate about.”34 The evolution from good to great means changing the culture of the organization. “Enduring greatness is not based on strategy or on any single individual but rather on the culture of the institution.”35 Collins says that great organizations have a culture of discipline:
Expect and reward a culture of discipline and rigor. Do not focus primarily on what has been accomplished. Instead, focus on
performance relative to a clearly elucidated goal. Be just as willing to contract or stop a program as to expand it. Set goals using external benchmarks, and using appropriate size independent
measures. Collins points out that greatness doesn’t come from an event. Rather it is an iterative process. When you get it right, “it has the quiet ping of truth.”36 For COM programs aspiring to greatness, i.e., to be included among national leadership programs, they will need to define how they could become "great" among AMCs and nationally known for the clinical care and associated research that they deliver. The fundamental question to answer is, what is the breadth and depth that needs to be developed that would put the program on the map in the next five to ten years—that would make others say: “the UA is the leader in this arena?”
33 Ibid., 98. 34 Ibid., 95 35 Ibid., 109 36 Ibid., 116.

4-26-2005 27
Appendix D Clinical and Research Benchmarking
A number of private and governmental organizations publish health care performance indicators, sometimes grouped into a single index, which purport to measure clinical and/or related research excellence. Some are used to rank hospitals, clinical departments, or organizational units. In other cases they have been developed to rate individuals, for example the leading clinicians in a specialty. Health care organizations often adopt these external measures as internal metrics to evaluate their own performance and/or to benchmark against those groups that are ranked highest, i.e., those at the top of the rankings are assumed to be the excellent clinical/research leaders and their performance on the metrics (for example being in “the top ten”) becomes the benchmark for those who are not. Because clinical excellence and recognition of that excellence in an AMC is so research dependent, the COM leadership considered indicators, or a combination of indicators, that ostensibly measure excellence in both domains.37 There is considerable debate about the validity of these metrics,38 and the methodology used by some of them is a proprietary “black box,” meaning that it is impossible to understand exactly how their authors arrived at their conclusions about performance or excellence. Nevertheless, these evaluation systems are commonly used by governmental units, businesses, and payers to evaluate the quality of health care institutions and physicians. Apart from the methodological issues that can be raised about the validity of the measures themselves, there are additional difficulties in using many of these potential metrics for comparing the COM and its clinical partners’ clinical units to national or regional high performers. For example, some national indicators may refer to outcomes among groups of patients in hospitals, which may or may not correspond to COM organizational units, i.e., departments, sections or centers. Others may aggregate scores for a given measure by department in medical schools, but some of these organizational units may not correspond to UA COM departments, sections or centers. With these caveats in mind, two of the more reputable and widely accepted indicators were used as metrics for this planning exercise and to establish benchmarks for the National Leadership Programs described in this planning document. Specifically, the U.S. News and World Reports Best Hospitals (U.S. News)39 and NIH departmental research
37 The Dean’s Research Council is developing metrics and benchmarks for research. 38 e.g., William McGaghie and Jason Thompson, “American’s Best Medical Schools: A Critique of the US News & World Report Rankings, Academic Medicine 76 No. 10 (2001): 985-92. 39 Available at: http://www.usnews.com/usnews/health/hosptl/tophosp.htm

4-26-2005 28
rankings (based on total NIH dollars) 40 were considered as part of the determination of which COM programs should be included in the Priority National Leadership group (see Appendix F). These two ranking systems are described below. U.S. News The U.S. News rankings are for hospitals, but several components are physician specialty dependent as well, e.g., cancer outcomes will be dependent in large part upon the actions of hematologist/oncologists, radiation oncologists, and oncology surgeons, as well as other personnel in the hospital. U.S. News scores are derived from a number of sources that are combined to form a summary index developed by the National Opinion Research Center at the University of Chicago.41 The methodology, using Donabedian’s structure, process, and outcome evaluation model, 42 is completely open and available for public scrutiny.
Out of all 6,012 medical centers in the US, all ranked hospitals were Council of Teaching Hospitals members, medical school affiliated, or met high level technology criteria (structural measures). Only 177 hospitals (including UMC) were ranked for one or more (out of 17) specialties. Hospitals also had to meet volume targets for each of the specialties. Hospitals then were scored on three equally weighted variables: 1) reputation among randomly selected, board certified physicians (a surrogate process measure), 2) mortality ratios derived from Medicare data from 2000, 2001, and 2002 (outcome measures), and 3) other care-related factors, appropriate to the programmatic area, e.g., NCI-designated cancer centers, magnet hospital status, certified trauma programs, level 4 epilepsy centers (structure measures). Several programs, including ophthalmology, pediatrics, psychiatry, rehabilitation, and rheumatology were ranked on their reputation only, as there were insufficient patient data to yield meaningful results for the outcome measures. The most recent results for UMC are shown in Table D-1.
Table D-1 U.S. News Best Hospitals, UMC Programs: 2004
Clinical Program U.S. News Ranking
Cancer 20 Ear, Nose & Throat 34 Geriatrics 31 Gynecology 48
40 http://grants.nih.gov/grants/award/rank/medindp03.htm 41 Colm O’Muircheartaigh, Anne Burke, and Whitney Murphy, The 2004 Index of Hospital Quality (Chicago; IL: National Opinion Research Corporation, University of Chicago, 2004). Available at: http://www.usnews.com/usenew/health/hosptl/methodology.htm. 42 Avedis Donabedian, Rashid Bashshur, ed., An Introduction to Quality Assurance in Health Care, (New York: Oxford University Press, 2003).
4-26-2005 29
Clinical Program U.S. News Ranking Heart & Heart Surgery 22 Kidney Disease 46 Neurology & Neurosurgery 22 Respiratory Disorders 26 Orthopedics 35
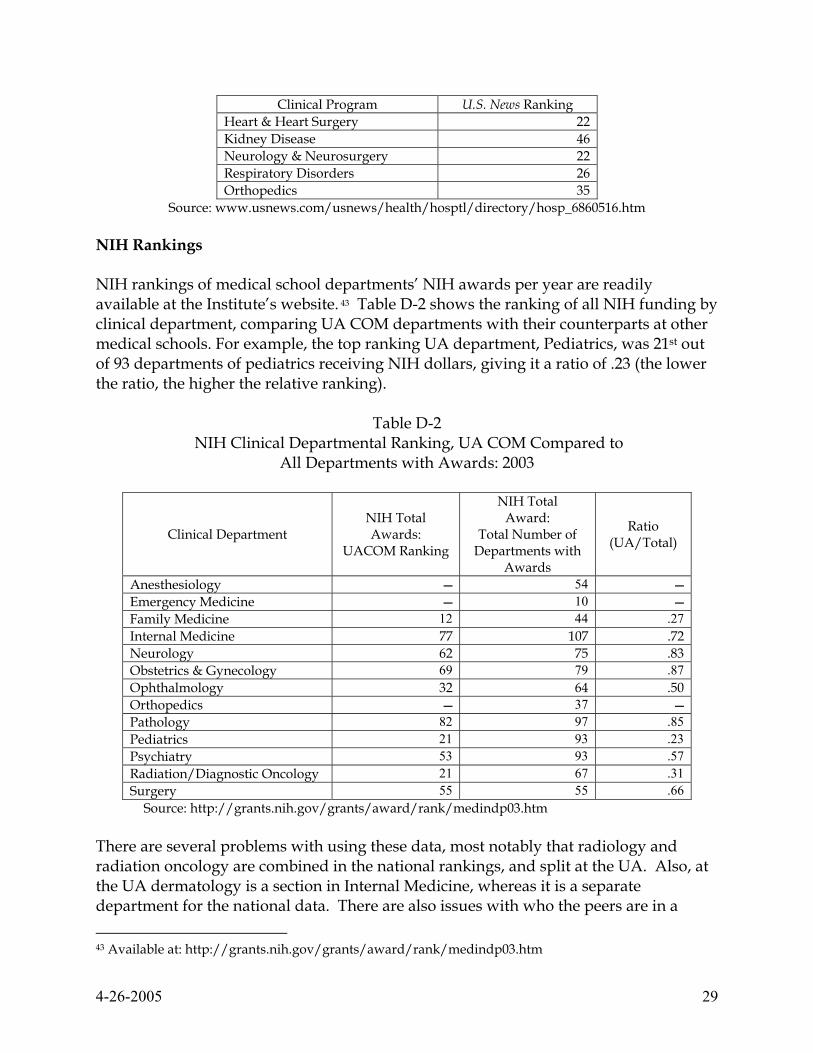
Source: www.usnews.com/usnews/health/hosptl/directory/hosp_6860516.htm NIH Rankings NIH rankings of medical school departments’ NIH awards per year are readily available at the Institute’s website. 43 Table D-2 shows the ranking of all NIH funding by clinical department, comparing UA COM departments with their counterparts at other medical schools. For example, the top ranking UA department, Pediatrics, was 21st out of 93 departments of pediatrics receiving NIH dollars, giving it a ratio of .23 (the lower the ratio, the higher the relative ranking).
Table D-2 NIH Clinical Departmental Ranking, UA COM Compared to
All Departments with Awards: 2003
Clinical Department NIH Total Awards:
UACOM Ranking
NIH Total Award:
Total Number of Departments with
Awards
Ratio (UA/Total)
Anesthesiology 54 Emergency Medicine 10 Family Medicine 12 44 .27 Internal Medicine 77 107 .72 Neurology 62 75 .83 Obstetrics & Gynecology 69 79 .87 Ophthalmology 32 64 .50 Orthopedics 37 Pathology 82 97 .85 Pediatrics 21 93 .23 Psychiatry 53 93 .57 Radiation/Diagnostic Oncology 21 67 .31 Surgery 55 55 .66
Source: http://grants.nih.gov/grants/award/rank/medindp03.htm There are several problems with using these data, most notably that radiology and radiation oncology are combined in the national rankings, and split at the UA. Also, at the UA dermatology is a section in Internal Medicine, whereas it is a separate department for the national data. There are also issues with who the peers are in a 43 Available at: http://grants.nih.gov/grants/award/rank/medindp03.htm

4-26-2005 30
specialty. For example, while Family Medicine is ranked 12th in the country—a commendable position—there are relatively few departments of family medicine that have NIH funding, and these data do not include in the denominator medical school departments without NIH funding. The Need for Size-Independent Measures44 Because rank in the “NIH derby” (or many other national indicators) is based on absolute numbers for funding, it is directly dependent on size. While potentially useful for some purposes, comparing institutions (or other clinical units) of vastly different sizes with one another through a ranking list obscures many of the important differences or similarities (see discussion of UA COM small faculty size in Appendix B). It will not usually provide the individual institutions an accurate reflection of their relative performance, either in aggregate funding or in the performance of individual faculty. It does not permit accurate comparison of institutional performance relative to the “funding market.” An institution’s goal to make it in to the “top 25” in funding can be more detrimental than beneficial if not accompanied by additional benchmarks which are less dependent on size and performance of peer organizations. As planning at the UA COM becomes more refined over time, departments, sections, and centers may develop these additional benchmarks. What benchmarks can be used? Each department, section or center can, does, and should devise parameters to assess the status of their clinical and research enterprise over time. Such “internal benchmarking” is necessary and appropriate. In research arguably the most important parameter is scientific productivity. National and international recognition of faculty is highly valued. Patents and royalties provide another comparator. Since the “currency” for these comparisons is not uniform across institutions, and/or the data are not publicly available, these criteria cannot be used for valid cross-institutional comparisons. . Generic and conceptually simple alternatives based on ratios can be used. Such ratio analysis allows comparison of institutional performance relative to a common standard, and independent of size. Based on the straightforward principles, individual AMCs (or departments, section or centers) can develop the optimal benchmarks for their own planning purposes. It is difficult, in the absence of direct comparative testing, to prove that external benchmarks which are size independent are preferable to those which depend upon 44 The following section was adapted (with references deleted) from Keith A. Joiner and Steven Wormsley, “Strategies for Defining Financial Benchmarks for the Research Mission in Academic Health Centers,” Academic Medicine, 80 (2005): 211-217. Please see the original article for additional details.

4-26-2005 31
AMC size. What is unambiguous is that ratio analysis is more useful than rankings as a planning and evaluation tool. An Example One example of using a ratio based approach is comparing AMCs on the annual growth rate in NIH funding, expressed as rate of return (Rf), where:
Rf = 100 x [(value in year t + 1) – (value in year t)]/value in year t For example, suppose both institution A, with 100 research grants at baseline, and institution B, with 500 research grants at baseline, both propose to increase the number of research grants by 10% (Rf = 10.0) over the following year. Assume both institutions actually acquire 20 new research grants. As expected from ratio analysis, the smaller the denominator, the larger the impact from a given absolute change in the numerator. For institution A, they will have doubled their growth in comparison to the initial goal (Rf = 20.0) while institution B will have achieved less than half of theirs (Rf = 4.0). These relative performances may or may not result in a change in national ranking, because rankings are completely dependent on performance of other institutions ranked above and below A and B, factors over which institutions A and B have no control. On the other hand, performances relative to the projections, and relative to the funding climate, do provide critical insights into the effectiveness of institutional strategies for growth. Hence, they are useful as planning and evaluation tools. Other Potential Sources for National/Regional Metrics and Benchmarks There are a number of other national and regional sources of clinical metrics and benchmarks, including:
Centers for Medicare and Medicaid Services (CMS) Quality Initiative45 Health Services Advisory Group (HSAG)46 University Health System Consortium (UHC) benchmarking data47 Leapfrog Group48 Solucient 100 Top Hospitals49 The Best Doctors in America 50 Castle Connolly’s America’s Top Doctors 51
45 Available at: http://www.cms.hhs.gov/quality/ 46 Available at: http://www.hsag.com/index.htm 47 Available at: http://www.uhc.edu/results_list.asp?folder=WEB/IE/BenchNew/ 48 Available at: http://www.leapfroggroup.org/home 49Available at: http://www.solucient.com/ 50 Available at: http://www.bestdoctors.com/en/default.htm 51Available at: http://www.americastopdoctors.com/index.cfm?aw=best+doctor

4-26-2005 32
HealthGrades52 Some of these evaluation schemes have more utility than others, but with caution they might be used to benchmark against national leaders. A COM working group will be established to develop recommendations on college-wide clinical metrics and benchmarks.53 In addition, COM clinical departments, sections, and centers may wish to use the above indices, as well as others as metrics to define clinical success for individual faculty members as well as for an entire clinical group. They also may wish to develop their own appropriate metrics and benchmarks to measure progress in achieving national prominence and/or regional excellence.
52 Available at: http://healthgrades.com/ 53 While NIH rankings were used in the deliberations during this planning process, subsequent research measures will be developed by a specific COM working group charged with establishing research metrics and benchmarks for the COM. A similar working group has been established for teaching.

4-26-2005 33
Appendix E A Commitment to Retaining Excellent People and to Diversity
Retaining Excellent People Medical schools nationwide are grappling with how to retain excellent clinical/teaching faculty in an ever-increasingly competitive environment, particularly with community practice.54 The majority of the faculty members in clinical departments are clinician-teachers and/or clinically oriented physician scientists, and it is they who are the backbone of the clinical programs at the COM and its clinical partners. The fact that almost 100 out of approximately 330 clinical faculty members are recognized in national indices like Best Doctors in America (see Appendix D) attests to their value to the clinical enterprise. UPH salaries overall are close to the median of AAMC salaries for faculty in the western region of the US, and UPH has developed an incentive system to reward faculty members providing clinical care. The challenge for the COM and its clinical partners is to further incentivize, recognize, and reward clinical faculty in ways which appeal to the inherent reasons why they chose academic medicine, rather than trying to compete head-to-head with community practices, i.e., it will take more than higher salaries to retain excellent faculty members.55 A priority activity of the COM and its clinical partners over the coming year will be to study the recruitment and retention best practices of successful AMCs and other organizations, and develop innovative models to address this need. Ethnic Diversity Demographics and Health Status56 Table C-1 shows the ethnic composition of Pima County based on the 2000 Census. Hispanics comprise one third of the population, and they are the population group expected to continue growing the fastest in the Tucson metropolitan area. Native
54 e.g., Roy Meals, “Why Orthopaedic Surgeons Leave Full-Time Academic Positions for Private Practice,” The Journal of Bone and Joint Surgery, 83-A, No. 3 (2001): 456-460; Klara Papp, John Aucoott, and David Aron, “The Problem of Retaining Clinical Teachers in Academic Medicine, Perspectives in Biology and Medicine, 44 No. 3 (2001):402-413. 55 David Longnecker, “Recruiting and Retaining Anesthesiology Faculty in 2001,” (paper presented at Society of Academic Anesthesiology Chairs/Association of Anesthesiology Program Directors Annual Meeting, Washington, DC, November 3, 2001), available at http://www.aapd-saac.org/meetingpapers2001.php. 56 This description of demographics and health status comes from an analysis prepared for UPH Hospital at Kino Campus

4-26-2005 34
Americans, while comprising only 3 percent of the population of Pima County, comprise 5 percent of the Arizona population.
Table C-1 Pima County Percent Distribution by Race/Ethnicity
Pima County Population Ethnicity
Number Percent White 571,982 61.4 Hispanic 247,861 29.4 African American 23,047 2.7 Native American 22,640 2.7 Asian 16375 1.9 2+Rraces 13,851 1.6 Other 1,990 0.2 Total 843,746 100.0
Source: U.S. Census Bureau, Census 2000 Health status indicators for Pima County are comparable to overall Arizona levels. Distinct disparities exist, however, with minority populations at great risk for a number of problems, as reflected in life expectancy (see Figure C-1.)
LIFE EXPECTANCY: Distribution by Race / Ethnicity; FY 2002.
77.371.2
66.0 63.4 63.2 61.6 60.055.6 54.8
50.1
0
10
20
30
40
50
60
70
80
90
White Female
White M
ale
As ian Female
Hispanic Female
Black Female
As ian Male
Native Amer F
emale
Black Male
Hispanic Male
Native Amer M
a le
Year
s of
Life
Figure C-1. Life Expectancy by Ethnicity in Pima County (Source: Department of FCM and Pima County Health Department)

4-26-2005 35
Table C-2 shows those causes of mortality that are of particular importance to African-Americans, Native Americans, and Hispanics in Pima County.
Table C-2
Ranking of Causes of Mortality by Ethnicity in Pima County
Cause of Mortality African Americans*
Native Americans* Hispanics**
Cardiovascular Disease x x Cerebrovascular Disease x x Lung Cancer x Breast Cancer x Cervical Cancer x x Colorectal Cancer x Prostate Cancer x x HIV Disease x Essential Hypertension x Diabetes x Chronic Liver Disease & Cirrhosis x x Influenza and Pneumonia x x Kidney Disease x Homicide x Injury from Firearms x x Motor Vehicle Injuries Fall-related Injuries x Unintentional Injuries x Drug-induced Deaths x Alcohol-induced Deaths x x Suicide x
*Ranked worse in **Ranked second worse in
Source: Pima County Vital Statistics, Department of Family & Community Medicine One of the truly unique COM opportunities is to coalesce and maximize our expertise in border health and health care for Hispanic populations. The UA Hispanic Center of Excellence (HCOE) has received more than $3.0 million in funding since 1999, and there are a number of COM investigators, e.g., in the cancer and respiratory centers and immunology, that are doing funded work related to Hispanic health. The opportunities and challenges in providing care to underserved and minority populations, particularly Hispanics, have been increased through the lease of UPH Hospital at Kino. As can be seen in Figure C-2, the Hispanic population of UPH Hospital’s primary service area is approximately 52 percent, compared to almost 30 percent for Pima County as a whole.

4-26-2005 36
Comparison: UPH Kino Primary Service Area Population
and Pima County Population; Percent Distribution by Race / Ethnicity; U.S. Census 2000.
53.1%
1.4%
61.4%
2.7%0.2%1.3%2.3%3.7%
38.0%
0.2%1.6%1.9%2.7%
29.4%
0%
10%
20%
30%
40%
50%
60%
70%
Caucasian Hispanic Afr Amer Amer Indian Asian 2 + Races Other Race
UPH Kino Service AreaPopulation
Pima County TotalPopulation
Figure C-2. UPH Hospital Primary Service Area Population by Race/Ethnicity Compared to Pima County: 2000. (Source: US Census, 2000; Department of Family and Community Medicine)
Medical Students During the last ten years, the average percentages of Hispanic, Native American, and African American students admitted to the UA College of Medicine have been 13, 2, and 2 percent, respectively, or about 17 percent of the class. Of particular impact for increasing these percentages are recent expansions of the pre and post-baccalaureate programs organized by the UA Office of Educational Development Programs, with input from the Hispanic Center of Excellence and the Office of Minority Affairs. Other programs include an Arizona-wide program is for disadvantaged high school students and K-12 teachers, called the "Summer Institute on Medical Ignorance" and the Q-cubed program (Questions, Questioning, and Questioners), supported by NIH funds. The UA College of Medicine is committed to participating in new and bold strategies for expanding the pipeline of under-represented minorities. These include alliances with community groups, and potentially even bolder state-wide programs that admit gifted high school students to the UA undergraduate college with a simultaneous commitment for admission to medical school, as is currently is being done at the University of New Mexico.

4-26-2005 37
Faculty Just as is the case for students, a mandate exists for recruiting, supporting, and retaining faculty from under-represented minorities. Currently, 18 percent of UA College of Medicine faculty are non-white, including 9 percent Asian/Pacific Islander, 6 percent Hispanic, 2 percent African American, and 1 percent Native American and Alaskan. Expanding representation from the latter groups is a challenging task and requires aggressive and bold approaches. At the university level there are set-aside funds to support such recruitments. At the national level, new funding mechanisms contribute to this initiative, including the National Center on Minority Health and Health Disparities within the National Institutes of Health. This Center provided $190 million in 2004, including loan-repayment, research endowment and centers of excellence programs.
Faculty Gender Inequities The GRACE project of the COM developed findings and recommendations in 2001 to end gender inequities between female and male faculty members.57 Efforts are ongoing to address the issues raised by the report and subsequent progress reports.
57 Dean’s Committee on Women Faculty, The GRACE Project: Generating Respect for All in a climate of Academic Excellence, (Tucson: UA College of Medicine, 2001).

4-26-2005 38
Appendix F Background on Priority National Leadership Programs
There are two clinical and two enabling technology programmatic areas in the COM poised to achieve and/or expand their national greatness in their education, research and clinical domains over the next five years. While building on current strengths and providing the additional impetus to grow, the following programs could help put the UA COM on the national and international map, thereby bringing greater competitiveness to the entire College. Accordingly, they are the COM’s top clinical priorities at this time.
Cancer The Arizona Cancer Center’s (ACC) NCI designation as a comprehensive cancer center already places it within the top 17 of cancer programs within the US and it is ranked 20th in the US News and World Reports (Table D-1). The Arizona Cancer Center also has nine Program Project Grants from NIH, more than any other cancer center in the nation. In addition, cancer is designated as one of the Arizona Bioscience Roadmap priorities (see Appendix D). One problem of particular importance to Arizona is skin cancer, especially melanoma. The amount of sunlight, the public awareness of skin cancer, and the prevalence of melanoma in Pima County (the highest in the nation) all attest to the magnitude of this problem. The ACC has received an $18 million NIH grant to study skin cancer. The cancer clinical programs need to expand, however, and the construction of a new, state-of-the-art cancer facility on the UMC North campus will provide our clinical cancer programs with the critical mass of clinical space to take the next step of leadership development.
Pediatrics Pediatrics in the COM is recognized nationally for its research (see Table D-5), including that conducted in both the Steele Children’s Research Center and the Arizona Respiratory Center. However, the pediatrics clinical programs at the AHSC are limited by a lack of facilities. Tucson is the second largest metropolitan area in the US without a dedicated children’s hospital (either free-standing or as a hospital-within-a-hospital).58 Without additional appropriate facilities the pediatric programs are hampered in their ability to expand the faculty and residency programs to meet clinical, educational, and research needs. During interviews with potential residents and faculty members who
58 San Jose, CA is larger, but it is only 20 miles from the nearest children’s hospital in Palo Alto (Lucile Packard Children’s Hospital at Stanford University Medical Center).

4-26-2005 39
have declined positions in the department, they consistently cite the lack of a dedicated children’s hospital as one of their primary reasons for not coming to the COM.59 Other clinical programs suffer as well, as other disciplines’ residency review committees (RRCs) require a pediatric clinical experience for non pediatric residents.
Enabling Technologies Telemedicine and Telehealth
While the Arizona Telemedicine and Telehealth Program is already a national and international leader in its field, it is poised to provide a critical technology foundation for all other clinical, teaching, and research programs at the COM. While there are no broad national indices that include telemedicine, the program has won national and international awards between 1998 and 2002 from the following organizations: American Telemedicine Association, TeleCon, US Distance Learning Association, and Telehealth Magazine. 60
Medical Imaging The UA has achieved international recognition for its optical sciences programs, leading to the Business Week designation of Tucson as the “optics valley.”61 There is a critical mass of basic and clinical researchers in the optical and health sciences working together to create the imaging technologies of the future. Providing this group with support will allow them to coalesce into a nationally and internationally recognized center of excellence. This is another key component of the Arizona Bioscience Roadmap.
59 Department of Pediatrics interview results 60 From website: http://www.telemedicine.arizona.edu/awards.html 61 Kevin Kelly, Joseph Weber, Janin Friend, Sandra Atchison, Gail DeGeorge, and William Holstein, Cover Story, Business Week, October 19, 1992.

4-26-2005 40
Appendix G Clinical Department Heads Survey Results
In mid December 2004 the clinical departments were asked to respond to how they were to grow their clinical programs by 50 percent over the next five years by answering two general questions:
1. Building the Foundation:62 Define how over the next five years you plan to increase the size of your faculty and grow your clinical programs where necessary in order to provide the excellent clinical care, teaching, clinical research, and service that is expected of us as the state’s only academic health center.
2. Raising the Pillars: Define one or two priority clinical areas you wish to develop over the next five years, which will help fulfill the overall vision and strategic directions for the College of Medicine, while meeting your own growth goals as well. For each priority area, assume that you have chosen it because you can be world class in that area. For each area, answering some or all of the following questions can help define how you would grow these pillars:
General statement of need and uniqueness of the program
o Why can you achieve greatness (or further greatness) in this area? o What are your external benchmarks for a) above? o That are your specific, measurable objectives and milestones for the
next two years
Projected current and future demand for services o What are the geographic area/communities to be served? o Does this serve any special underserved or otherwise unique
populations? o Does this address conditions or problems that are unique to, or
especially relevant for Arizona? o What are future trends and growth potential for this service?
Linkages/synergies with others o In order to be successful, what support do you need from other
programs, services or departments? o What impact (if any) will this have on UMC, UPH and/or other AHSC
entities? o What opportunities exist for synergy with others in the community?
A summary of results is shown in Table G-1. 62 Since this survey, “foundation” has been changed to “regional leadership program” and “pillar” is now termed “national leadership program.”

4-26-2005 41
Table G-1
COM Five-Year Plan 2005-2010, Proposed Incremental (New) Projected Faculty and Programs.
Regional National Department Additional Faculty Programs Additional Faculty Programs
Anesthesiology ▪ 7-12 faculty members (30-50% increase)
▪ Simulators for training ▪ Management of Pain
Emergency Medicine
▪ 9 faculty members ▪ Pediatric ER ▪ Clinical Decision Unit
▪ Clinical Studies: Cardiac, Neurologic, Trauma, Resuscitation, Toxicology/Envenomation/Bioterrorism ▪ Translational research: Therapeutics, Techniques, Drug evaluation, Device evaluation ▪ Health Policy - Chronic and Prevention: Injury prevention, Provider wellness, Diabetes, Bioterrorism ▪ Education and Training: Teletraining, Internet based education, Training - paramedicine
Family & Community Medicine
UPH Hospital: ▪ 2 residency faculty ▪ 1 Inpatient faculty ▪ 2-4 Faculty for clinical growth
▪ 3 faculty for clinical priority areas ▪ 3 faculty for research
▪ Center of Excellence in Women's Health ▪ (Research): Obesity and diabetes, Tobacco cessation and prevention, Cultural competence and health literacy, Women's health, Integrative medicine

4-26-2005 42
Table G-1 (cont.)
COM Five-Year Plan 2005-2010, Proposed Incremental (New) Projected Faculty and Programs.
Regional National
Department Additional Faculty Programs Additional Faculty Programs
Medicine
UPH Hospital: ▪ 4-5 Hospitalists ▪ 1 Nephrologist ▪ 3 Cardiologists ▪ 0.5-1 Pulmonologists ▪ 0.1 Infectious disease ▪ 1 Diabetologist ▪ 1 Gastroenterologist ▪ 1 Gerontologist ▪ +? General internists (depending on demand)
▪ Sleep disorders and medical aspects of lung transplantation ▪ Subspecialty services to Native American tribes ▪ HIV ▪ Peripheral vascular intervention ▪ BMT ▪ Endoscopic GI ▪ Dermatology and dermatologic surgery ▪ Hospital in-patient attending coverage
UPH Hospital: ▪ 1-2 Nephrologists ▪ 2-3 Pulmonary/Critical Care Physicians ▪ 0.9 Infectious disease
(Research): ▪ Endocrinology/diabetes ▪ Expand clinical research program of ACC in Phoenix ▪ Immune-mediated Inflammatory Disease Treatment and Research Center UPH Hospital: ▪ Chronic Kidney Disease Center ▪ Southwest Ventilation Program
Neurology
▪ 5 general neurologists at UPH Hospital ▪ Subspecialists at UPH Hospital to complement women’s health and diabetes programs ▪ 4-6 academic faculty in neurogenerative diseases, dementias, CV disease, neurobehavioral, neuromuscular, neuroimmunology, neuroimaging
▪ General neurology and subspecialty programs to complement women’s and diabetes programs at UPH Hospital
▪ Research faculty to remain at AHSC, plus 2 new academic faculty ▪ Linkages with others in Phoenix
▪ Neurology of Aging (Alzheimer’s, Parkinson’s, Stroke) ▪ Center for Human Neuroscience and Department of Clinical Neurosciences (UPH Hospital—including Psychiatry, Neurology, Neuroimaging, Neurosurgery, Neurorehabilitation)

4-26-2005 43
Table G-1 (cont.)
COM Five-Year Plan 2005-2010, Proposed Incremental (New) Projected Faculty and Programs.
Regional National Department Additional Faculty Programs Additional Faculty Programs
Obstetrics & Gynecology
▪ 3 General OB/Gyn ▪ 1.4 Maternal-fetal medicine ▪ 1 Gyn oncology ▪ 2 Reproductive endocrinology ▪ 2 Pelvic and reconstructive surgery
▪ Prevention, detection, and treatment of (research in) gynecologic cancers ▪ Innovation in delivery of women's health care Support from: ▪ Prenatal diagnosis and high risk pregnancy ▪ Pelvic and reconstructive surgery
Ophthalmology
▪ 1 new faculty member from clinical income ▪ (Need 12 faculty, 2 @ in cornea, retina, glaucoma, pediatrics, oculoplastics, comprehensive ophth)
▪ Substantial presence at UPH Hospital ▪ Translational research in retinal disease and glaucoma
▪ (Will take 7 years to develop junior faculty into nationally known faculty) ▪ Need basic scientist in angiogenisis (for diabetes and macular degeneration)
Macular degeneration (7 years)
Orthopaedic Surgery
▪ 5-6 faculty members 9-10 faculty to allow coverage each of the nine subspecialty areas with 2 physicians
▪ Sports Medicine ▪ Spine Center or Institute▪ Trauma ▪ Hand Surgery
Pathology
▪ Need for additional faculty members will be dependent upon the growth of the rest of the faculty (need for subspecialists in pediatric, orthopedic, endocrine, urogenital pathology, and cytopathology.
▪ Molecular pathology services

4-26-2005 44
Table G-1 (cont.)
COM Five-Year Plan 2005-2010, Proposed Incremental (New) Projected Faculty and Programs.
Regional National Department Additional Faculty Programs Additional Faculty Programs
Pediatrics
▪ 15-20 subspecialists (i.e., nephrology, hem/onc, hepatology, cardiology, critical care, neonatology) ▪ 5-10 surgical subspecialists
(see foundation) ▪ Substantially upgrade the outpatient and inpatient clinical pediatric programs.
Psychiatry
▪ 4 at UPH Hospital (6/2005) ▪ 2 child psychiatrists ▪ 1 child psychologist
▪ 3-5 researchers for neuropsychiatric institute
▪ Depression Research Program ▪ Program in Women's Children's and Family Mental Health UPH Hospital: ▪ Neuropsychiatric Institute, including 100 bed inpatient unit
Radiation Oncology
▪ 1 clinician ▪ New facility for main department ▪ 2 satellite facilities (NW and SE) ▪ Image-guided capable linear accelerators
3 basic scientists (to replace those who left)
▪ Image-guided radiation therapy

4-26-2005 45
Table G-1 (cont.)
COM Five-Year Plan 2005-2010, Proposed Incremental (New) Projected Faculty and Programs.
Regional National Department Additional Faculty Programs Additional Faculty Programs
Radiology
▪ Need for additional faculty members will be dependent upon the growth of the rest of the faculty (add radiologist for every additional 7-10 thousand exams)
▪ Tucson Breast Center expansion to include DEXA and varicose vein clinic ▪ Potential to contract with other institutions in Tucson area ▪ Joint UMC/UPH Imaging Center ▪ Biomedical Imaging - molecular imaging for cancer and cancer response to chemotherapy
Surgery
▪ 5 ENT ▪ 2 Neurosurgery ▪ 1 MIS/robotics ▪ 1 Vascular/ endovascular
▪ ENT at UPH Hospital ▪ Neurosurgery – Complex spine ▪ MIS/robotics ▪ Vascular/endovascular
▪ 2 CT surgery ▪ 1 Trauma ▪ 1 Neuro-trauma ▪ 1 Surgical oncology
▪ Cardiovascular (cardiac assist devices and transplantation) ▪ Trauma ▪ Neurosurgery - trauma ▪ Surgical oncology