the university of wisconsin - aisc home · in the united states, ... oriented toward plastic...
TRANSCRIPT

I I I "'-~-e~ ~~
.Q -
..J l;J
I $=" w= bl -~~ < -
I I I I I I I I I I I I I RR1082
I 7203
I
/ THE
UNIVERSITY OF WISCONSIN
MILWAUKEE
COLLEGE OF ENGINEERING AND
APPLIED SCIENCE

I I I I I I I I I I I I I I I I I I I
Report on
COMPARA1IVE STUDY OF FLEXURAL CAPACITY OF PIPES
Harch 1984
by
Donald R. Sherman and Anand S. Tanavde Department of Civil Engineering
University of Wisconsin --Hilwaukee

I I I I I I I I I I I I I I I I I I I
TABLE OF CONTENTS
EXECUTIVE SUMMARY . . . . . . . . . . . . . . . . . . . . . . . . . . . .
INTROOUCTIOM .............. .. ...........
DESCRIPTIOM OF TEST PROGRAMS
Tests by Schilling (19&5) Tests by Jirsa et al. (1972) Tests by Korol (1974) Tests by Sherman (1976) Tests by Stephens et al . (1982) Tes ts on Fabricated lubes by Sherman (1982)
BASIS FOR COMPARISOMS ..........................
COMPARISOMS OF DATA .
Identification of Key Parameters Ultimate Moment Predictions Current Design Specifications
RESULTS AMD CONCLUSIOMS ..... . .. . .... . ...........
RECOMMEMDATIOMS . . . . . . . . . . . . . . . . . . . . . . . . . . . . .
REFEREMCES ... . .. . .............. .. .......
MOMEMCLATURE . . . . . . . . . . . . . . . . . . . . . . . . . . . . . .
TABLE 1 . . ....... . . ... .. .. .. .. . ... ..
1
3
5
5 & 7 8
10 11
12
14
14 17 20
24
25
27
29
30
FIGURES 1 - 14 31-4"
APPEMOIX A - Tables of Experimental Data ... . . . . . . . . . . . . . 46
APPEMDIX B - Statistical Definitions . . . . . . . . . . . . . . . . . . 49
I I I I I I I I I I I I I I I I I I I
EXECUTIVE SUMMARY
This report compares the data on the flexural capacity of tubes and pipes
that have been obtained in six programs conducted since 1964 in North Amer-
ica. In all but three of the fifty- two tests, the diameter to thickness ratio
was less than one hundred. The data has been restricted to unstiffened speci -
mens loaded in a manner to produce a region of constant moment.
Three basic types of comparisons are included. The first separates the
data according to yield strength, test program, type of pipe and size. The
conclusions of this analysis are that lower strength pipe have higher normal -
ized capacities than high strength pipe and that hot formed pipe have slightly
higher capacities than either Electric Resistance Welded (ERW) or fabricated
pipe. Size does appear to be a major factor.
In the second comparison the correlation between the flexural data and
six different predictor equations was studied. The forms of the equations and
the associated slenderness parameters (e.g. Oft, F Oft, etc.) were adopted y
from equations used for critical stresses under axial loads.
coefficients did not vary substantially among the equations.
Correlation
Although a
quadratic equation with a complex slenderness parameter gave the best corre-
lation, the most satisfactory equation of a simpler form is a linear expres
sion with (EfFy)f(Oft) as the slenderness parameter.
The final comparison is with seven current design standards. All of
these standards yield conservative predictions of strength. Allowable stress
standards are very conservative in predicting the strength of pipes with low
Oft but are quite reasonable for larger values. Newer Load and Resistance
Factor Design (LRFO) specifications are not as conservative for low Oft values.
The report concludes by recommending the following expression for pre
dicting the flexural capacity of pipe with a 95% confidence level that the
real strength will exceed the predicted strength
where
and
MR z 0.90Mu
Mu/Mp = (0.175 + 0.01&~)
~ • (E/Fy)/(D/t)
This expression implies that for E = 29000 ksi. the full plastic moment can be
achieved when
D/t ~ 20&0/Fy
and that the buckling will be elastic when
D/t ~ B970/Fy
- 2 -
I I I I I I I I I I I I I I I I I I I
I I I I I I I I I I I I I I I I I I I
INTRODUCTION
Since the 1960's, a number of experimental projects have been undertaken
to investigate the bending capacity of circular tubes with diameter to thick -
ness ratios of 100 and les s. Tubes with these proportions are typical of
those that would be used as structural members in offshore construction. In
order to develop design s tandards that reflect the true behavior of tubes
rather than wide flange shapes, it was necessary to determine the moment
capacity as a function of wall slenderness and to establish the slenderness
limits at which yield or fully plastic moments could be achieved . The wall -
slenderness parameters that have historically been used are the diameter to
thickness ratio (O/t) or a modification that includes the yield strength,
F O/t . y
The most recent project (23) involved the testing of pipe fabricated in a
series of short cans formed from structural plates as is typical in offshore
construction. This project was undertaken because all of the previous tests
involved hot formed seamless or ERW manufactured pipes usually in diameters of
12 inches or less. Not only were there significant inconsistencies in the
previous data, but there was also an uncertainty as to whether the results
could be applied to fabricated pipe with its weld seams and different imper-
fection and material characteristics .
The primary purposes of this report are to compare and analyze the data
obtained in the various experimental programs. The analysis consists of
identifying the parameters that significantly affect the moment capacity and
to determine the appropriate wall - slenderness parameter that best expresses
the strength. The test results are also compared with existing North American
- 3 -

design specifications (e.g. API, AISI, AISC, etc.) in order to determine the
degree of conservatism in current practice.
In the United States, present provisions for bending capacities of circu
lar tubes are based primarily on the data obtained in two studies. In 1965
[20] Schilling published the results of tests on manufactured (hot-formed
seamless) tubes, establishing the limit below which local buckling would not
occur for tubes in bending as (Fy/E)(R/t) of 0.06. Based on his study the
AISI code [3] recommended a O/t limit of 3300/Fy as a compact section cri
terion. This limit subsequently carried over into other AISI [21] and AISC
[1] codes and was in the early versions of API RP2A [5]. In 1974, Sherman
[22] tested hot formed seamless (HFS) and electric resistance welded tubes.
Based on these tests, the AISI Criteria [21] recommended a much more
restrictive limit of l300/Fy for moment redistribution. Since Schilling's
report, two other investigations in the U.S. [7,8] and one Japanese project
[13] were oriented toward buckling of pipelines during laying. Some of the
data in these studies can be compared to tests of structural members. CIO[CT
sponsored research in Canada [14 -16], oriented toward plastic design, has also
provided data on the bending of pipe. Another recent Canadian project [24]
included the bending of two thin pipes with O/t ratios well beyond the range
that historically has been used for structural members but still not as great
as that encountered in storage tank or aircraft construction. As mentioned
previously, the most recent project studying bending capacity of fabricated
tubes was jointly sponsored at the University of Wisconsin --Mi1waukee by
fourteen organizations [23].
The test results included in this report have been restricted to those
which can be directly compared to the fabricated pipe bending project [22] .
Therefore, the results are limited to the following:
- 4 -
I I I I I I I I I I I I I I I I I I I
I ~ n
I I I I I I I I I I I I I I I I I I
1. Recent experimental investigations dealing only with
flexural -buckling behavior of unstiffened tubes subjected to
a constant moment region.
2. Olt ratios less than 400. However, most of the tests
concern Olt less than 100.
3. Test results in which the strength and material yield data
is clearly reported or can be easily deduced from the
information in the report .
DESCRIPTION OF TEST PROGRAMS
The tables in Appendix A list the results of the six test programs
included in this report . The following is a brief description of each
program, identifying various important features such as the type of pipe and
the method of testing. Important conclusions contained in the reports are
also summarized.
Jests by Schilling (19&4)
Schilling's landmark paper (20], published in 19&5, summarized the avail-
able information on the buckling of circular steel tubes in axial compression,
flexure and torsion. Sizes and loading conditions were limited to tubes that
could be used as structural members and various design methods and formulas
were compared. A brief review of the shape of the stress-strain curves and
magnitudes of imperfections that can be expected in tubes produced by differ-
ent methods was also presented.
The paper graphically presented the results of ten flexural tests that
had been conducted by Schilling and his co-workers the previous year. These
- 5 -

apparently were the only flexural tests available at the time . Little des
cription of the tests was provided in the paper. However, an in - house report
[12] provided the following details.
The test specimens were 4-1/2 inch diameter hot formed seamless pipe .
The specimens were cut from two pieces of longer pipe with yield strengths
equal to 39 and 52 psi . Both had sharp yielding stress-strain curves. A
series of diameter/thickness ratios were obtained by machining a six inch
length of the pipe to a reduced thickness. A two point loading system on a
simple span was used so that the constant moment length was one foot in
length. Consequently, the test data was based on a relatively short unstif
fened length which was part of the constant moment length. The report indi
cates that variation in the wall thicknesses were as much as 25% in some
specimens.
The published paper contains a plot of (MUlt/Mp) vs. (Fy/E)(R/t)
and recommends that for a value of 0.06 for the slenderness parameter, it is
reasonable to assume that cylindrical tubes of yield point steels will reach
the full plastic moment without premature local bu ckling . It was also
observed that the test points indicated a tendency to group according to yield
strength . Schilling therefore concludes that there may be a more appropriate
slenderness parameter using Fy to other than the first power .
Tests by Jirsa et al. (1972)
In this investigation [7] the influence of ovaling on the flexural beha
vior of pipelines stressed beyond the elastic limit wa s considered. The
testing program consisted of four tests on bare pipes and on two coated
pipes . The report does not state how the pipe was produced and the investl -
- 6 -
I I I I I I I I I I I I I I I I I I I

I ~
I I I I I I I I I I I I I I I I I I
gators can no longer recall. Therefore, for this report it has been that the
pipe was hot formed seamless.
Each pipe was tested as a simple beam and loads were applied to produce a
region of pure flexure. Both the loading frame and the supports were
assembled to enable the frame to rotate freely as deflections and rotations of
the pipe increased. Since both the loading and supporting rods were pinned at
each end, there was no restraint to lateral movement at the supports or the
load points and the Introduction of axial forces in the pipe was avoided. In
order to hold the pipe in place and to distribute load over the surface of the
pipe, a high strength gypsum mortar was cast between the pipes and the support
and loading frames .
Each specimen was instrumented with strain gages at a number of locations
(over the constant moment span) at both the top and the bottom surfaces.
These were used to determine curvatures. Deflections of the pipe in the pure
flexure span were also measured to calculate curvatures. To determine the
ovalization of the pipe, changes In horizontal and vertical diameters were
measured at a number of locations with large micrometers. Load was applied in
small increments and after each load increment, diameter change, strain-gage,
and deflection readings were taken.
It was concluded that ovaling did not significantly reduce the moment
capacity of the pipes until strains well into the plastic region were
reached. The data given in Table A2 of the Appendix was determined from
stress strain and moment-curvature plots.
Tests by Korol (1914)
Korol's report [17] deals with the experimental Investigation of the
strength of circular tubular beams in bending. Tubes having Dlt ratios from
- 1 -

28 to 80 were used with the higher Olt having larger diameters. The specimens
were cold formed ERW pipes without the benefit of stress relieving.
A symmetrical two point loading was applied on a simple span with the
help of a centrally located hydraulic jack and spreader beam. Inverted
V- shaped blocks were used to distribute the load to the tube at the support
and load points. In some cases a circular curved plate, b" in length and con
forming to the outer profile of the section was placed between the block and
the specimen (ref. 1b, Table 3-1), in order to further cushion the effects of
concentrated loads and insure that the local buckle occurred near the center
of the constant moment length. There was, however, one test in which the
local buckle did develop at the load point. Although the resulting low
capacity is reported in the Appendix, it has not been included in the compari-
sons in this report, because, as Korol states, it is a premature failure
condition resulting from the nature of loading.
Electric resistance strain gages were placed at midspan, mounted on the
top and bottom fibers of the test specimen. At load points strain gages were
located only on the underside of the section.
It was observed that the load distribution at the support plate had an
effect on the post buckling behavior of the tube and that geometrical
imperfections reduced the moment capacity of the section as the slenderness
ratio increased. Reasonable agreement was found between the strength results
of tests and the theoretical prediction [lb,17].
Tests by Sherman (197b)
Sherma n's paper [22] deals with the flexural behavior up to and beyond
the ultimate moment of tubes with proportions often encountered in bracing
- 8 -
I I I I I I I I I I I I I I I I I I I I
I I I I I I I I I I I I I I I I I I I
members. It presents the moment redistribution capabilities of round tubes
and applicability of plastic design principles to tubes subjected to flexure .
Six specimens with a 10.75 inch 0.0. and Olt ranging from 18 to 102 were
tested as simple beams subjected to constant bending moment. Hot formed
seamless pipes were used for the two heaviest specimens and ERW for the
remainder.
Loads were applied through stiffening plates, which spread the concen
trated loads and stiffened the section sufficiently to prevent premature local
failure even in the thinnest tube. The applied load s were meas ured with
standard strain gage load cells. Curvatures were deduced from the measure
ments of top and bottom surface strains with electric resistance stra in
gages. To determine the degree of ovalization, changes in horizontal and
vertical diameters were measured with a micrometer at the same locations as
the curvature measurements. Maximum deflections were measured with a
0 .001 inch dial indicator. Data readings were taken at load intervals of
about 0.1 times the expected ultimate load. Tests were terminated when large
deflections of the beam mechanism caused significant side forces on loading
jacks .
It was observed that the plastic moment capacity was not quite attained
at Olt of 3300/F as would be implied from Schilling's conclusions. Re -y
strained beams with this Olt exceeded the full plastic capacity (including
effects of moment redistribution) but this may have been due to the develop-
ment of axial tensions at the large deflections corresponding to the ultimate
load . From the simple span tests, it was concluded that a Olt limit of
1540/F would be required to develop a full plastic moment. y
- 9 -

Tests by Stephens et al. (1982)
This report [24] deals in part with the local elastic buckling strength
of thin-walled unstiffened cylinders subjected to flexural loads. The type of
members tested are used extensively in the materials handling operations of
industrial plants. The two fabricated circular steel cylinders used in the
flexural tests had 60 inch diameters and O/t ratios of 300 and 450.
The specimens were fabricated with two relatively thick end sections that
acted as stiffeners to the central test section . All welds, both circumferen
tial and longitudinal, were full penetration groove welded butt joints . The
cylinder was attached to end frames which provided an additional length for
the simply supported beam . One end of the system was free to translate hori
zontally so as not to induce axial restraint. The two symmetric loads were
applied to the thicker end sections of the cylinder so that the entire test
section was in a region of constant moment.
Longitudinal strains were measured with electric resistance gages mounted
on the outer top and bottom surfaces of the central test section . Rotation
meters were attached at the neutral axi s of the tube to permit indirect
measurement of the curvature during the loading. Transducers were placed
inside the central test section to measure flattening of the cross - section and
dial gages were posit i oned at the level of the neutral axis to measure the
vertical deflection at various locations.
The flexural test results along with the results of axial tests are
reported as critical elastic stresses due to the large O/t ratio . Failures in
the flexural specimens were in the form of a diamond shaped buckle pattern in
the extreme compression region of the central test sections adjacent to the
circumferential groove welds joining them to the end sections. Pretest
- 10 -
I I I I I I I I I I I I I I I I I I I

I I I I I I I I I I I I I I I I I I I
imperfection measurements indicated that the presence of the circumferential
weld had introduced a greater degree of imperfection in the cylinder.
Comparisons of critical stresses were made with theoretical predictions
and with previously obtained test results for axially loaded cylinders.
Alternate ultimate strength equations suitable for design purposes were also
developed.
Tests on Fabricated Pipes by Sherman (1982)
This extensive program [23] consisted of sixteen specimens with Olt
ratios ranging from 18 to 9& and was subsequently supplemented with five
additional tests. The specimens were fabricated in accordance with offshore
design standards and practice. The objectives of this investigation were to
study the strength and behavior of members that reach the full plastic moment
or fail by inelastic local buckling prior to achieving the plastic moment. In
addition to Olt, the other major variables were two nominal yield strengths
and two diameters.
The test specimens consisted of two cans welded together with full pene
tration girtll weldS so that the longitudinal welds were staggered by at least
90 degrees. These cans were welded to two heavier end pieces to obtain the
full length of the simply supported beam. Two symmetric loads were applied on
the center cans at a spacing of four pipe diameters. Therefore, the entire
constant moment region was in the test cans and contained a girth weld. The
load system was carefully designed not to develop secondary axial forces even
at large deflections. Loads were applied through rotationally free plates
that acted as stiffeners and prevented local buckling from occurring at the
point of application.
- 11 -

Pretest measurements Included out-of-roundness measurements by Kendrick's
method [11) and straightness profiles. Longitudinal and circumferential
strain gages were on the top and bottom surfaces of the two test cans. Five
deflection measurements were made In the constant moment region to permit the
calculations of curvatures and total rotations even after a local buckle
formed . Changes in vertical diameters were also measured.
Size and out-of -roundness did not appear to be significant factors
affecting the strength of the members. It was noted that the presence of the
girth weld tended to Influence the moment capacity and that the absence of
good strain hardening characteristics in the pipe material could inhibit the
ability of pipe with small Oft ratios to achieve the plastic moment.
BASIS FOR COMPARISONS
In evaluating and comparing the strength results from the various test
programs, it Is necessary to deal with them in nondimenslonal form. There
fore, the ultimate experimental moments are normalized by the theoretical
plastic moment calculated from the true diameter, thickness and yield strength
of the test piece. Ideally, the yield strength should be obtained from a
coupon removed from the specimen and tested at a strain rate that corresponds
to that used to obtain the reported ultimate moment. The surest way to do
this is to use static values [19), which are those observed when the coupon or
specimen has been held at a constant deformation for several minutes. Dynamic
yield stresses (those obtained at a constant strain rate typically used in
ASTM A307 tests) are about 4 to 10 percent higher. Therefore, strain rate can
affect both the ultimate test moment and the yield value used to calculate the
plastic moment. In the reports presented in this study, it is not always
- 12 -
I I I I I I I I I I I I I I I I I I I

II I I I I I I I I I I I I I I I I I I
clear whether static or dynamic values have been reported. It Is assumed,
however, that the strain rates for the reported ultimate moment, Hu1t and
the computed plastic moment, Hp' correspond.
The relatively large number of variables and few test results precludes
the use of sophisticated statistical theory to determine whether a particular
parameter has a significant effect. Therefore, a simpler basis for comparison
has been used In this report. A regression curve (second degree polynomial)
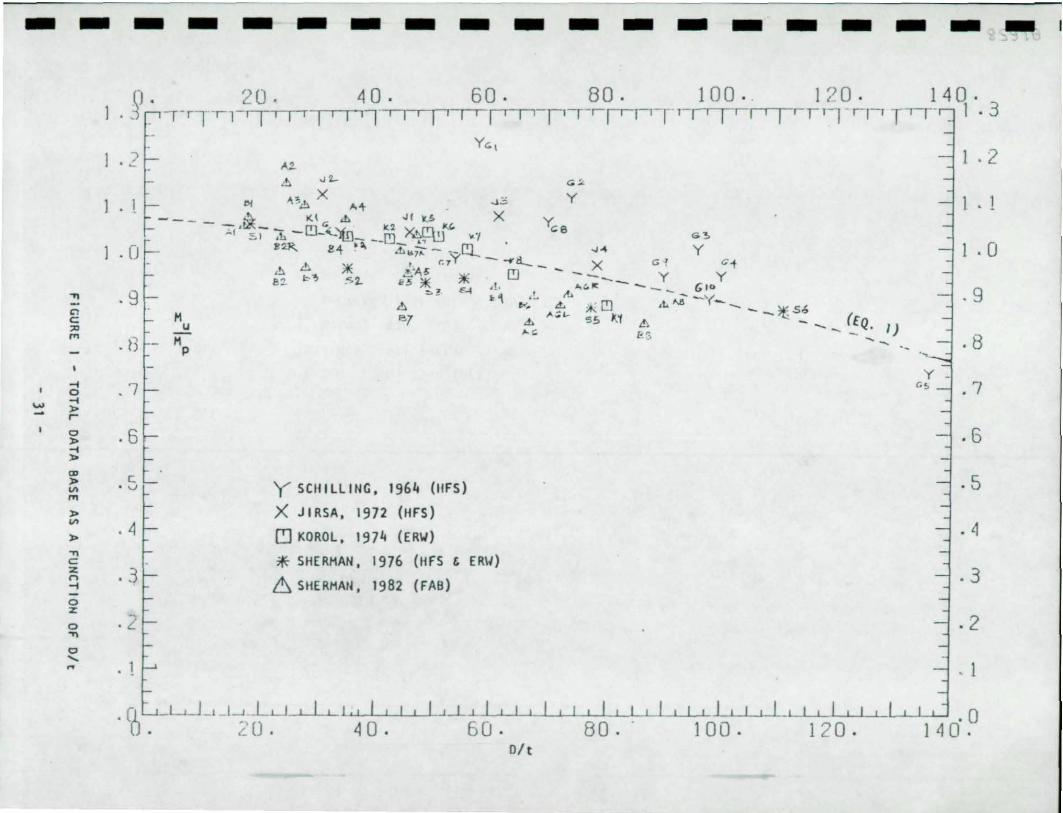
Is fitted to the data in the plot of (Hu1t/Hp) vs. (O/t). This curve Is
shown In Fig. 1 by a dotted line. The equation for the curve Is as shown
below:
(HuH/Hp) = 1.074 - 9.84 x 1O-4(O/t) - 9.15 x 1O-6(O/t)2
A similar curve is fitted through the data points in the plot of (Hu1t/Hp)
vs. (FyO/t) as shown by a dotted line in Fig. 2. The equation of this curve
Is as follows:
(Hu1t/Hp) : 1.089 - 2.14 x 10⁻⁵(~) - 4.42 x 10⁻⁹(~2)
~ : (FyO/t)
( 1 )
(2)
The percent deviation of each test point from one of the regression curves Is
calculated. The data is then grouped according to various parameters so that
the maximum, minimum and mean deviations can be obtained to provide a
quantitative Indication of where a particular group of data lies.
The regression curves have been developed solely as a basis for compari
son and their form Is somewhat arbitrary. The slenderness parameters of O/t
and FyO/t were chosen because they are the ones typically used In the
reports and specifications dealing with circular tubes. Second degree
polynomials are used because curves with that shape generally fit the trend of
- 13 -

the data and third order polynomials only increased the correlation
coefficient from 0.636 to 0.641. A further explanation of the statistical
terminology is given in Appendix B.
A second part of the data analysis concerns an investigation of various
slenderness parameters and equations used to predict the moment capacity. A
number of different suggestions appear in the literature for the related topic
of critical stress for local buckling under axial load. The numerical
constants in these equations have been adjusted to provide a reasonable fit to
the bending data and comparisons have been made on the basis of correlation
coefficients and deviations.
The final comparison is with existing North American specifications. In
this case deviations provide a better basis for comparison than correlation
coefficients because these specifications tend to be based on lower bounds
rather than best fits. Direct comparisons can be made with ultimate strength
specifications but allowable stress provisions must be increased by the
inherent safety factor. Since this value is not specifically stated in the
specifications, a value of 1.67, as is used for members in the AISC and AISI
specifications, has been assummed.
COMPARISONS Of DATA
Identification of Key Parameters
The parameters that were investigated to determine if they produced
significant differences in deviations from the regression curve are:
1. Minimum Specified Yield Strength. Two groups are
considered; one has specified yield strengths less than 50
ksi and the other has specified yield strength equal to 50
- 14 -
I I I I I I I I I I I I I I I I I I I

I 1
I I I I I I I I I I I I I I I I I I
ksi. No tests involved material with a specified yield
strength greater than 50 ksi, although actual yield
strengths did exceed this value.
2. Test Program. The data is further grouped according to the
five test programs to determine if there is any indication
that the method of testing used by the various investigators
biased the results . The two tests on pipe w1th Olt of 350
and 400 are not included in this part of the study since
they represent elastic buckling and are well outside the
range of the slenderness parameters of the other tests.
3. Type of Pipe. The results are divided according to whether
the specimens were hot- formed seamless, electric resistance
welded or fabricated pipes. This division reflects differ-
ences in residual stresses and the amount of cold working .
4. Size . There has been a question as to whether there is a
scale effect that prevents the direct application of tests
of small diameter tubes to the larger sizes used in offshore
construction. Therefore, the results have been grouped by
diameters less than 10 inches, between 10 and 13 1nches and
greater than 13 inches.
The results of the comparisons are presented in a series of bar graphs with
the mean and range of the percent deviation from one of the regression curves
plotted as ordinates.
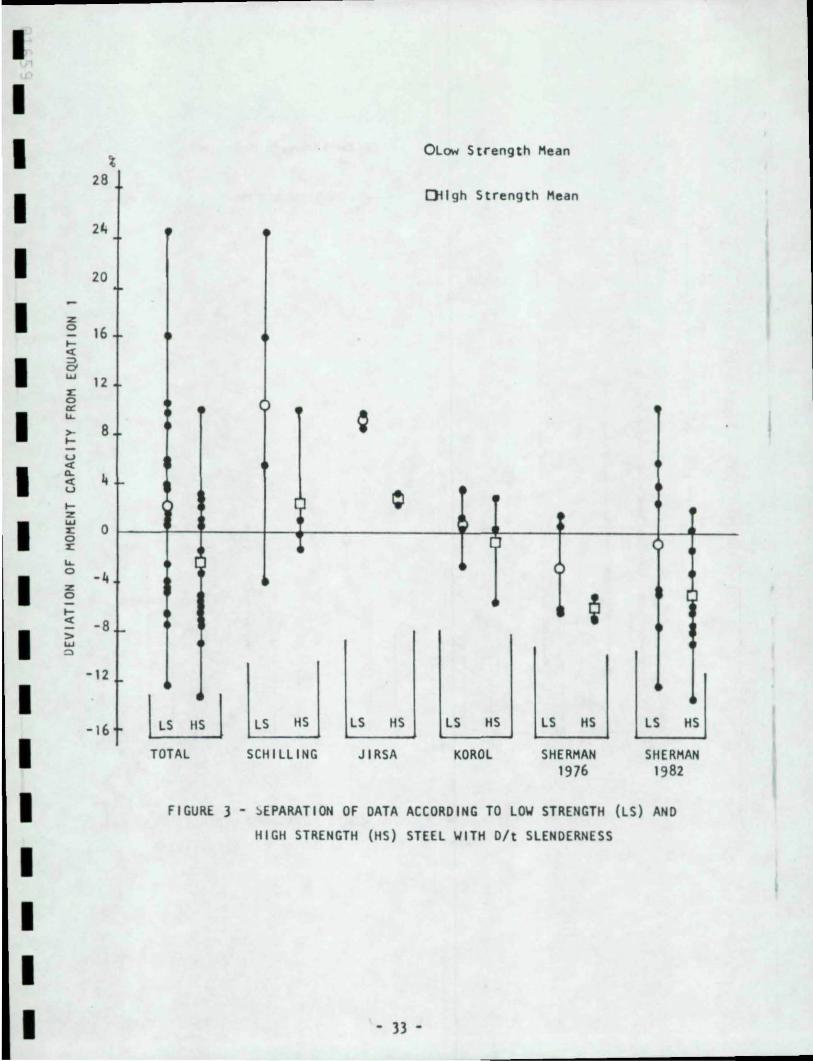
Figures 3 and 4 are the bar graphs for separating specified yield
strengths . The former graph 1s based on regression equation 1 that uses the
slenderness parameter Olt while the latter is based on equation 2 with FyO/t
- 15 -

as the parameter. The bars separate the two yield strength groups for the
total data base and for the five individual studies. In Figure 3, it is
evident that the high strength grouping always has a lower mean deviation than
the low strength group. From this it can be concluded that the yield strength
is an important parameter affecting the normalized moment capacity that should
be included in the slenderness parameter.
In Figure 4 where the regression curve i s based on FyOlt, the overall
range in the deviation is not significantly reduced, but the differences
between the means of the high strength and lower strength materials is reduced
in the total and in the individual studies. Since this parameter is better
than Olt in reducing the influence of the yield stress parameter, the remain
ing bar graphs are based on deviations from equation 2 only.
The separation on the basis of the type of pipe is shown in Figure 5.
It would appear from the total data base that hot- formed pipe tends to have
higher normalized capacities than ERW or fabricated pipe which have essen
tially the same mean deviation .
The final grouping shown in Figure 6 is on the basis of size. There is a
tendency for the sma l l diameter specimens to yield higher test data but size
does not appear to be a factor in pipe larger than 10 inches in diameter.
It should be reemphas ized that due to interrelations of parameters and
lack of a large data base, these conclusions cannot be ba sed on a more firm
statistical evaluation . Although there is considerable scatter in the data,
with deviations from -14% to +21%, mean deviations i n the various programs
range from about -4% to +6%. Probably the most significant conclusions
pertinent to offshore structures are :
1. Yield strength is a parameter that influences the normalized
bending capacity of pipes .
- 16 -
I I I I I I I I I I I I I I I I I I I

I I I I I I I I I I I I I I I I I I I
2. The test data on hot formed pipe produces higher nonmalized
capacities than fabricated pipe.
3. The mean strength levels of fabricated pipes do not vary
significantly from tests of smaller £RW pipes. However,
there is a tendency for greater scatter in the fabricated
pipe data.
Ultimate Moment Predictions
The topics of local buckling due to flexure and due to axial loads are
closely related. Many allowable stress specifications use the same critical
stress in thin cylinders for both situations. While this may be true for
elastic buckling, the situation is different for inelastic buckling . Under
axial load, the maximum capacity of a section occurs when it is fully
yielded . Therefore, inelastic local buckling will occur at strains near the
yield strain. In flexure, on the other hand, the maximum capacity is the
plastic moment which requires that strains several times the yield strain must
develop. Therefore, the wall slenderness limits for achieving the full
capacity in flexure are more severe than that for axial loads and as a
consequence, the relation for predicting the capacity near the ultimate will
also differ.
Historically, tubes loaded in axial compression have been under investi
gation for a longer period than tubes in flexure. All of the variables that
affect flexure also influence axial capacity and the axial test data also show
considerable scatter. As a result, a number of expressions have been proposed
for predicting the axial capacity. In some cases, the wall slenderness
parameter takes different forms. In this section of the report, several
different expressions for predicting flexural capacity will be examined. Some
- 11 -

of them will have the general form of equations for axial capacity but with
modification to account for the different limits for achieving the full
flexural capacity. A comparison is based on mean deviations of the data and
on statistical correlation coefficients. However, since it was shown earlier
that the data for hot formed pipe is higher than fabricated or ERW pipe date,
it has been excluded i n the comparisons of Figures 7-11 .
In addition to the slenderness parameters of Olt and FyOlt which are
used in the plots of Figures 1 and 2, one parameter frequently encountered for
axial loads is ~ equal to (E/Fy)/(O/t). This is essentially the inverse
of FyOlt but as can be seen in Figure 7, the elastic buckling region is
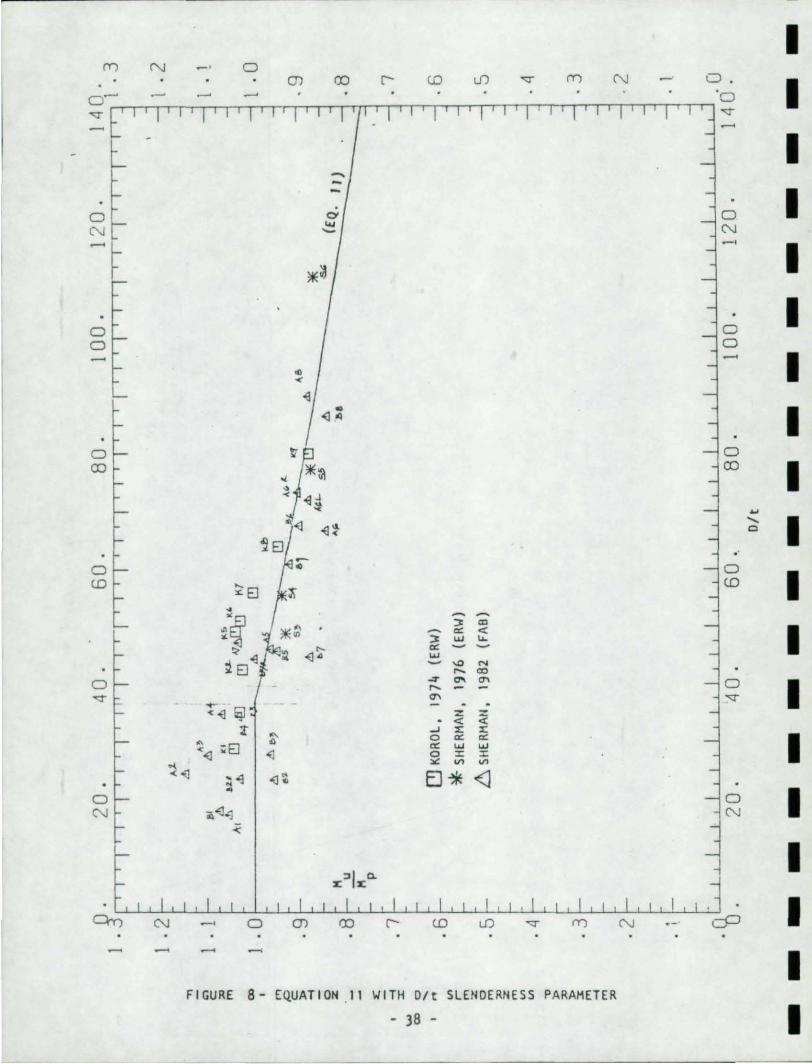
included. In Figure 8, Olt is the slenderness parameter (Figure 8 is similar
to Figure 1). Another slenderness parameter is similar to the one used for
sections made with plate elements, B = (O/t){Fy/E, and the data is plotted
in Figure 9 on this basis. A more complex parameter ~(Fy/E)2/3 provided
the best correlation for recent tests of axially loaded fabricated cylinders
(19), and the bending data is plotted against this parameter in Figure 10.
Finally, a good fit can be obtained if the moment capacities are normalized on
the yield moment and Olt is used as the slenderness parameter . This plot is
shown in Figure 11.
The objective of the following analysis is to determine the best inelas-
tic buckling expression for the flexural data . In order to establish limits
for the inelastic equations, it is assumed that the predicted capacity cannot
exceed the plastic moment nor the elastic buckling moment given by .33SE/(0/t )
where S is the elastic section modulus . The critical elastic stress of
.33[/(0/t), suggested by Plantema for axial loads on manufactured tubes, is
only slightly conservative when compared to the two flexural tests on
- 18 -
I I I I I I I I I I I I I I I I I I I

I I I I I I I I I I I I I I I I I I I
fabricated tubes with high D/t. Its limit of applicability has been extended
from Plantema's suggestion to the points where it intersects the various
inelastic equations. The inelastic expressions that have been considered are
the following :
A. Plantema's linear expression in terms of a
MU/Mp = A + Sa
S. The American Water Works Association's quadratic equation in
terms of a that includes both the inelastic and ela sti c
regions
MU/Mp = Aa + Sa2
C. The API equation that is a function of O/t
( 3 )
( 4)
(Sa)
which can be converted to
Mu/Mp = A - C(Fya)N
D. Ostapenko's [19] more complex equation in terms of
a and Fy
Mu/Mp = A(Fy/E)2/3a - S(Fy/E)4/3a 2 + C(Fy/E)2a 3
E. A linear expression for the parameter involving Fy
Mu/Mp = A + S Fy/E O/t
F. For the data expressed in terms of yield moment and O/t, a
form similar to API,
Mu/My = A - S(O/t)N
- 19 -
(Sb)
(6)
(1)
(8)

With E taken equal to 29,000 ksi, the coefficients for each equation were
determined by a regression analysis considering the data base excluding the
hot formed seamless pipe. The resulting constants, correlation coefficients
and deviations are given in Table 1.
Current Design Specifications
The specific inclusion of pipes as structural members in design standards
is a relatively recent occurrence . The flexural requirements are based on a
mix of allowable stresses established for wide flange shapes and critical
buckling stresses for cylinders loaded in axial compression. Some modifica
tions have been made as flexural test data became available. It is now
possible to compare existing standards with a substantial body of test data in
order to determine the state of current practice .
The standards considered in this report are summarized in the following .
The formulas that are listed for each standard are taken from the specifica
tion but have been converted to give moments instead of stresses. For ulti
mate strength specifications, these moments are predicted capacities of the
sections and can be compared directly with the data. The moments in allowable
stress standards are design moments and contain an implied safety factor. A
safety factor of 1 . &1 has been assumed and ha s been i ncluded in the equations
plotted for comparison with the data . Since the various s tandards are
inconsistent in the wall slenderness parameter, it is difficult to compare
them on a s ingle plot . 1herefore, they are compared with the data on the most
appropriate plot.
1) API RP2A. 1his is an allowable stress specification for
fixed offshore platforms that uses D/t as the s l enderness
ratio .
- 20 -
I I I I I I I I I I I I I I I I I I I

I I I I I I I I I I I I I I I I I I I
HO r .66Fxc S
Fxc = Fy for Olt < 60
Fxc = (1 . &4 - . 23(0/t)·25)Fy for &0 < Olt < 300 but not to exceed .&£/(O/t) .
See Figure 12 for 1.&7HO'
2) AISC. This familiar allowable stress specification is
intended for building construction.
s lenderness parameter .
HO = .6&FyS
662 (F Olt +
y
See Figure 14 for 1 .67HO'
It uses F Olt as the y
for FyO/t < 3300
for 3300 < FyO/t < 13000
3) AISI Cold Formed . This allowable stress specification was
written for thin walled sections where plastic conditions
are seldom achieved. Its provisions are similar to AISC
except that no allowance is made for a shape factor .
HO = .60FyS for FyO/t < 3300
HO • for 3300 < FyO/t < 13000
See Figure 14 for 1.&7HO'
- 21 -

4) AISI Tentative Criteria. This criteria was written specifi
cally to take full advantage of the properties of tubes and
the research available in the early 1970s. It is a modifi -
cation of AISC provisions.
for FyOft < 3300
for 3300 < FyOft < 13000
See Figure 14 for 1.67MO'
5) API LRFO. This is an ultimate strength design specification
for fixed offshore platforms. Its flexure criteria is
somewhat a mix of RP2A and AISC provisions. Both Oft and
F Oft slenderness parameters are included. y
Mu Fxc Z
M 848 . 51)Fxc Z ;
(F Oft + u y
Mu ~ FxcS
Fy
where Fxc = smallest of 0.6EOft
for FyOft < 1740
for 1740 < FyOft < 3300
for 3300 < FyOft
Fy[1.64 - .23(Oft)·25]
For the range F between 36 and 50 considered in this y
report and the limit of Oft less than 360 implied in the
- 22 -
I I I I I I I I I I I I I I I I I I I
I I I I I I I I I I I I I I I I I I I
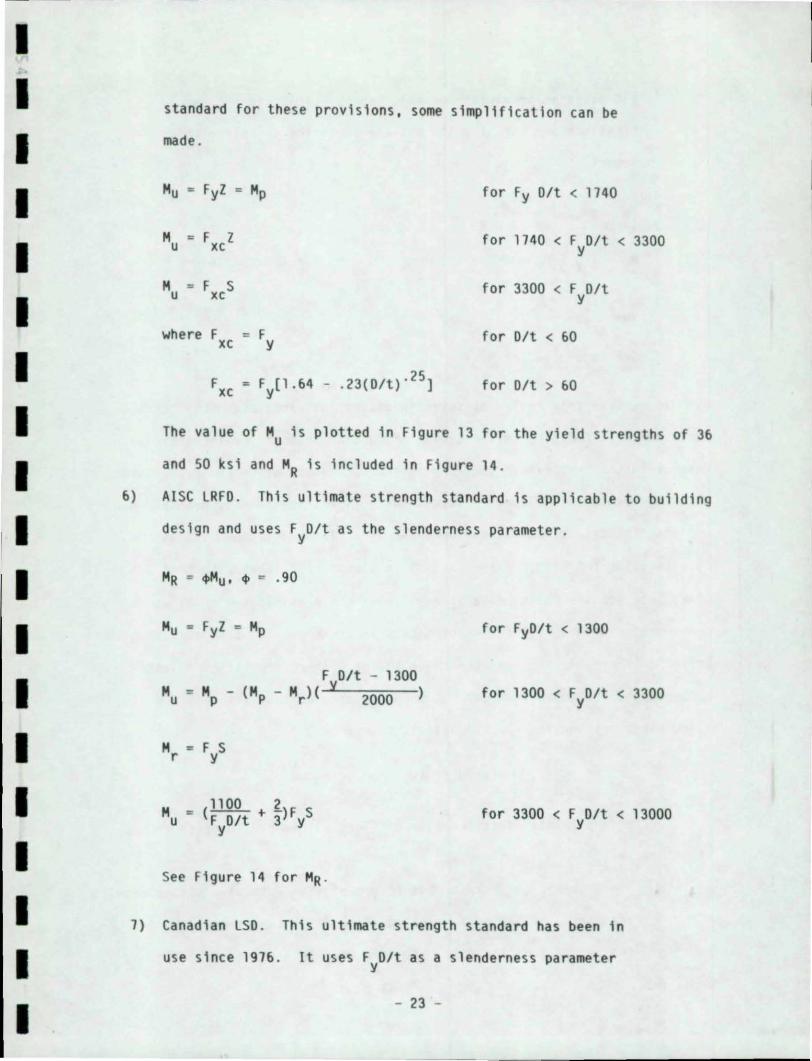
standard for these provisions, some simplification can be
made .
MU = F Z xc
Mu = F S xc
for Fy Olt < 1740
for 1740 < FyO/t < 3300
for 3300 < FyO/t
for Olt < 60
for Olt > 60
The value of Mu is plotted in Figure 13 for the yield strengths of 36
and 50 ksi and MR is included in Figure 14 .
6) AISC LRFO. This ultimate strength standard is applicable to building
design and uses F Olt as the slenderness parameter . y
for FyO/t < 1300
for 1300 < FyO/t < 3300
1100 2 Mu = (F Olt + 3)F S
Y Y for 3300 < FyO/t < 13000
See Figure 14 for MR .
7) Canadian LSD. This ultimate strength standard has been in
use since 1976. It uses F Olt as a slenderness parameter y
- 23 -

but makes no provision for thin tubes. Limits in the speci-
fications are for SI units but are converted to ksi in this
report.
HR = ~u, ~ = .90
Hu = ZFy = Hp for FyO/t < 2610
H = SF u Y
for 2610 <FyO/t < 3335
See Figure 14 for HR '
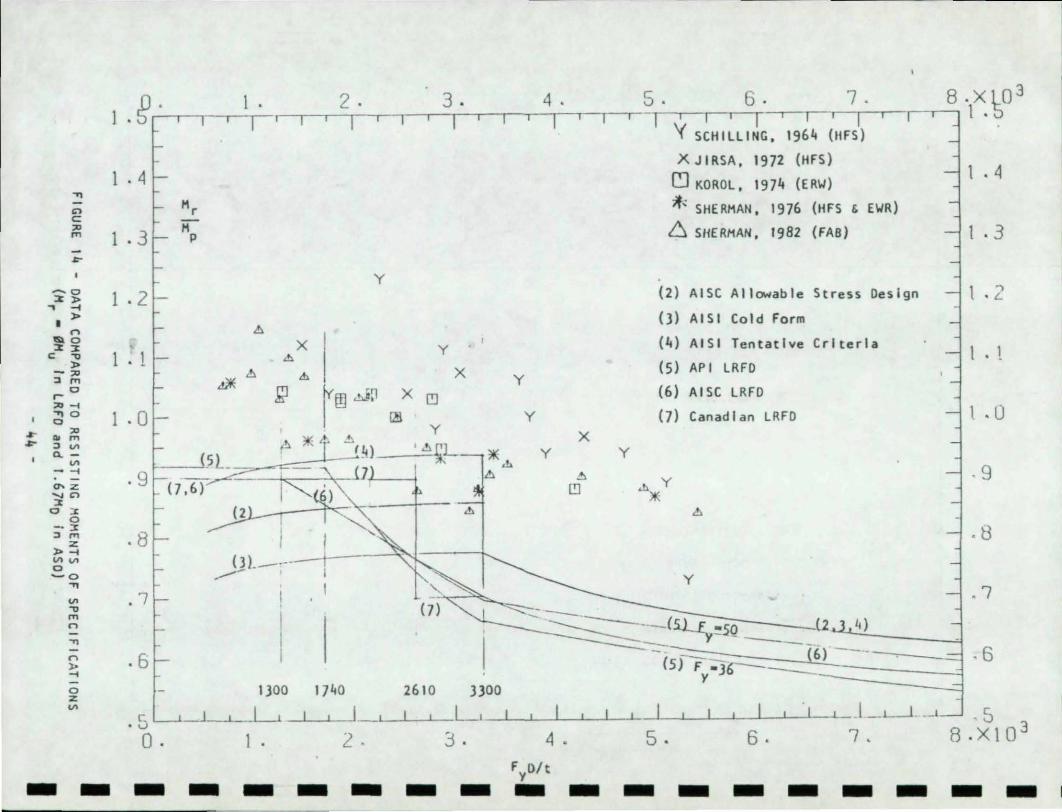
In general this review of seven specifications indicates that current
North American practice in the design of tubular beams is conservative with
respect to the test data. The large degree of conservatism found for tubes
with low Olt in most allowable stress design specifications is probably due to
applying the stress limits developed for wide flange sections without
adjusting for the higher shape factors in pipes. For tubes with high Olt,
where some local buckling data is available, the provisions are not as
conservative when a 1.67 factor of safety is assumed. The ultimate strength
criteria inherently includes the shape factor. Therefore they are less
conservative for tubes with low Olt when compared to the test data and the
allowable stress design specifications.
RESULTS AND CONCLUSIONS
Conclusions related to the design of flexural members in offshore
structures are:
1. Since data from tests on hot formed pipe tend to give higher results
than tests of ERW or fabricated pipe, it is conservative to exclude
the former from the data base used to establish design criteria.
- 24 -
I I I I I I I I I I I I I I I I I I I

I I I I I I I I I I I I I I I I I I I
2. Seven North American specifications present flexural criteria in a
variety of forms . They are, however, generally conservative with
respect to the test data. lRFD specifications are less conservative
than allowable stress design specifications (with an assumed safety
factor of 1.61) for pipe with small Dlt that reach Hp'
3. As Indicated in Figure 14, major differences occur in the
specifications at D/t ratios less than 3300/F . y The early
suggestion that this limit was satisfactory for achieving a plastic
moment was optimistically based on the results of hot formed pipe
tests.
4. Although six different expressions for predicting the ultimate
moment were evaluated, correlation coefficients among the six did
not vary significantly. However, it would appear that the
slenderness parameter should involve the yield strength of the
material.
RECOMMENDATIONS
Based on the results and conclusions of this study, it is recommended
that a relatively simple equation should be used for predicting the ultimate
flexural capacity. For the inelastic range, the recommendation is equation 9
of Table 1
"'u Mp = .115 + .Ol6(E/Fy )/(D/t) ~ 1
or with E = 29000 ksi
- 25 -
". <". p - p
(9)

with this equation, the full value of Hp is the predicted capacity only for
O/t < 20&0/Fy. The elastic buckling equation
"u ~ .33ES/(O/t}
will control for O/t > 8910/Fy if the shape factor is assumed to be 1.29 for
the thin cylinder.
If the ultimate resisting moment is obtained using a resistance factor of
0 .90
HR = ~u' ~ = 0.90
capacities close to the 95% confidence limit in Figure 1 will be predicted.
These recommendations are related to strength only. Rotational
capacities to determine if a pipe section is suitable for plastic analysis
were not considered in the study.
- 2& -
I I I I I I I I I I I I I I I I I I I
I I I I I I I I I I I I I I I I I I I
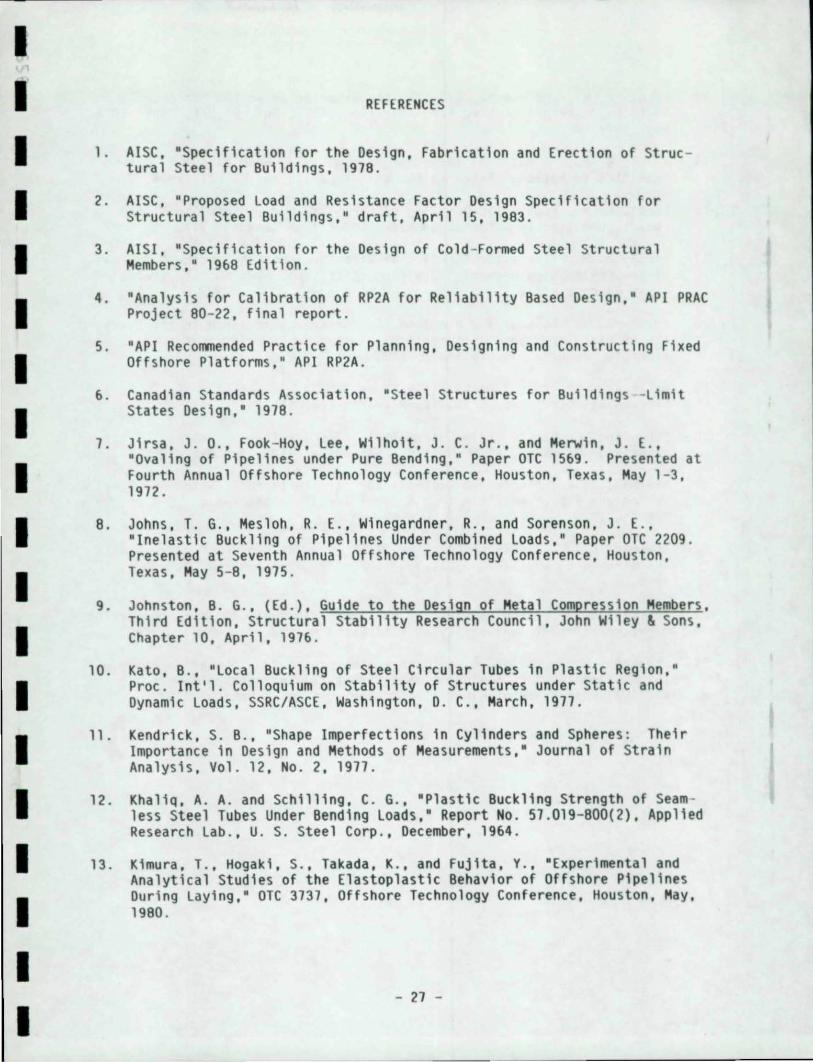
REFERENCES
1. AISC, "Specification for the Design, Fabrication and Erection of Structural Steel for Buildings, 197B .
2. AISC, 'Proposed Load and Resistance Factor Design Specification for Structural Steel Buildings," draft, April 15, 1983 .
3. AISI, "Specification for the Design of Cold -Formed Steel Structural Members,' 19&8 Edition.
4. "Analysis for Calibration of RP2A for Reliability Based Design," API PRAC Project BO-22 , final report.
5. 'API Recommended Practice for Planning, Designing and Constructing Fixed Offshore Platforms,' API RP2A .
&. Canadian Standards Association, 'Steel Structures for Buildings -Limit States Design," 191B.
1. Jirsa, J . 0., Fook-Hoy, Lee, Wilhoit, J. C. Jr., and Merwin, J. E., ' Ovallng of Pipelines under Pure Bending," Paper OTC 1569 . Presented at Fourth Annual Offshore Technology Conference, Houston, Texas, May 1-3, 1912.
B. Johns, T. G., Mes10h, R. E., Winegardner, R., and Sorenson, J. E., "Inelastic Buckling of Pipelines Under Combined Loads," Paper OTC 2209. Presented at Seventh Annual Offshore Technology Conference, Houston, Texas, May 5- B, 1915.
9. Johnston, B. G., (Ed.), Guide to the Design of Metal Compression Members, Third Edition, Structural Stability Research Council, John Wiley ~ Sons, Chapter 10, April, 197&.
10. Kato, B., 'Local Buckling of Steel Circular Tubes in Plastic Region,' Proc. Int'l. Colloquium on Stability of Structures under Static and Dynamic Loads, SSRC/ASCE, Washington, D. C., March, 1911 .
11. Kendrick, S. B., "Shape Imperfections in Cylinders and Spheres: Their Importance in DeSign and Methods of Measurements," Journal of Strain AnalYSiS, Vol. 12, No.2, 1911.
12. Kha1iq, A. A. and Schilling, C. G., 'P1astlc Buckling Strength of Seamless Steel Tubes Under Bending Loads,' Report No. 51.019- 800(2), Applied Research Lab., U. S. Steel Corp., December, 19&4.
13. Kimura, T., Hogakl, S., Takada, K., and Fujita, Y., "Experimental and Analytical Studies of the E1astop1astic Behavior of Offshore Pipelines During Laying,' OTC 3731, Offshore Technology Conference, Houston, May, 19BO .
- 21 -

14. Korol, R. H., and Hudoba, J., 'Plastic Behavior of Hollow Structural Sections,' Journal of Structural Division, ASCE, Vol. 98 ST5, Paper 8872, Hay, 1972.
15 . Korol, R. H., 'A Rationalization of Round Tubular Beam Design . ' A report submitted to National Research Council of Canada and CIDECT, 1974.
1&. Korol, report
17. Korol, of the 13944,
R. H. , "Inelastic Buckling of Circular Tubes in 8ending . ' A submitted to National Research Council of Canada, 1977 .
R. H., 'Inelastic Buckling of Circular Tubes in Bending,' Journal Engineering Hechanics Division, ASCE, Vol. 104, No . EH4, Paper August, 1978.
18. Kurobane, Y., Atsuta, T., and Toma, S., "Research in Japan in the Stabil ity of Circular Tubes,' International Institute of Welding, Annual Assembly, Yugoslavia, September, 1982.
19. Ostapenko, A., 'Local Buckling Tests on Tubular Columns (3&- 50-100 ksi),' Proceedings Structural Stability Research Council, 1979 .
20. Schilling, C. G., 'Buckling Strength of Circular Tubes," Journal of the Structural Division, ASCE, Vol. 91, ST5, Paper 4520, October, 19&5 .
21 . Sherman, D. R. , 'Tentative Criteria for Structural Applications of Steel Tubing and Pipe,' American Iron & Steel Institute SP&04 - 87& - 7- 5 H-HP, August, 197&.
22 . Sherman, D. R., 'Tests of Circular Steel Tubes in Bending,' Journal of the Structural DiviSion, ASCE, Vol . 102, ST11, Paper 125&8, November, 197& .
23. Sherman, D. R. , ' 8ending Capacity of Fabricated Tubes,' Civil Engineering Department Report, University of Wisconsin--Hi1waukee, February, 1983 .
24. Stephens, H. J., Kulak, G. L. , and Hontgomery, C. J., 'Local Buckling of Thin Walled Tubular Steel Hembers,' Structural Engineering Report No. 103, University of Alberta, Edmonton, Canada, February, 1982 .
- 28 -
I I I I I I I I I I I I I I I I I I I

I I I I I I I I I I I I I I I I I I I
A,B,C
D
E
Fxc
Fult
Fy
Fys
M
MD
Mp
Mps
MR
MU
Mult
~
Mys
N
R
S
t
Z
c
O.6.k
•
NOMENCLATURE
coefficients in equations
outside tube diameter
modulus of elasticity (for steel assumed = 29000 ksi)
local buckling stress from equations in API Standard
material ultimate stress
material yield stress (nominal)
material static yield strength
bending moment
design moment in allowable stress criteria
computed plastic moment
Mp based on static yield, Fys
resisting moment in LRFD criteria
ultimate moment predicted by equations
experimental ultimate moment based on static ultimate load
computed yield moment
My based on static yield. Fys
power coefficient in Equations
radius of cylinder
elastic section modulus
tube thickness
plastic section modulus
strain
slenderness parameters
resistance factor in LRFO criteria
- 29 -

EQU. #
9
10
11
12
w o 13
14
TABLE 1 - COMPARISONS WITH EQUATIONS FOR PREDICTING MOMENT CAPACITIES (1)
SLENDERNESS PARAMETER
a = (E/Fy)/(D/t)
a
Dlt
). = a(Fy/E)2I3
6 = (Fy/E)1/2(D/t)
Dlt
EQUATION FORM COEFFICIENTS (2) CORRELATION A B C or N COEFFICIENT
(2)
Mu/Mp = A + Ba 0 . 775 0.016 0.779
= A + Ba + Ca2 0.669 0 .031 -0 .001 0 .194
= A + B(D/t)N 1. 15 -0.0123 0.7 0.731
= A + Sa + Ca2 0 . 605 3.40 -7.61 0.796
= A + B6 1 .10 -0.063 0.169
Mu/My = A - B(D/t)N 1.65 -0.051 0.50 0.113
NOTES: (1) Comparison is with ERW and fabricated pipe data only
(2) Regression coefficients and correlation coefficients are for data in the slenderness range where the pre dicted moment capacity is less than Mp
(3) Deviations include the data where the predicted capa city is Mp
DEVIATIONS (3) SEE FIGURE MEAN RANGE
0.0162 0.1460 7 -0.0788
0.0111 0 . 1460 7 -0.0833
0.0115 0.1460 8 -0.0912
0.0198 0.1460 10 -0.0917
0.0145 0.1460 9 -0.0946
0.0282 0.2090 11 -0.1279
-------------------
- - - - -. - - - - - - - - - - - - - -
.., " c: '" ,.,
... 0 ...
"" :» r 0 :» ... :» CD :» '" ,., :» '" :» .., c: z n ... 0 z 0 "T\
'" .... "
~'J . 20. 40 . 60 . 80 . 100 . I?O . 140 . 1" -'1 ' r 1 1 ' 1 'lor,! '1-' T'TT., 1 . 3 • oJ ~1-rlTl-'r""'"l' 1 1 'l'l '-rr'-I .-, .....,
") . ~
· 1
A:?-~2..
Y'"
'"'" ..J,'::' Y
1 . 0
.9
" '" ,. :.~ x" " ~ _ y <, "i . rn. • !<' ., .." -4 I 1 "<" "x..-", • , < y ,~ - - - (!]- "-'l{n.., --(!].,. .!C - -y-Cl.. - .... ~ _ x Y G IO - - - - - . '. -... --- ,
., s';", " . ,,, ~ " , -- --;.-V- _ __ )($. 'rQ, 'J - ". * ,', , ',~ . - - - - -~. ..* ~ , '- . ",U _ '. ,!> "'~ <; 2. ~? • v_ _.. < ~1 b ., ,.~ 5~ G_ 6 ~ ~"
x Yr s
11 u
• 13 r-- I1p
.7
.6
c: ' 0
· 4
.3
.2
• 1
el Ja.C
y SCHILLING, 1964 (IIFS)
>< JIRSA, 1972 (HFsl
~ KOROL, 1974 (ERW)
*' SHERMAN, 1976 (HFS , ERIiI
6 SHERI1AI4, 1982 (FAa)
· II LLW_L, _I-l .LLl I. I 1 I I ... --1- I 1 , I , I I I 1 I I I 1_'-1 --'-'-:::-"::--'-'-l lJ . 20. 40 . 6-
Olt
1 . 2
• 1
1 . 0
.9
.8 Y c, -1 . 7
. 6
. 5
. 4
.3
. 2
. I
I 4 O' ?

.... '" c:
'" "" m
N N
.... a .... ,. r-
0 ,. .... ,. OJ ,. '" ..., ,. '" ,. .... c: z n .... 0 z a .... ....
-< 0 ...... ~
1. 2. 3 . 4. 5. 6. 7. 8 . XI03 · R . r-r-~~.-~-.-.-.~-.--r-r-~'-.--r-.-.~-.-'.-.-.-~.--r-.-.~-'~o-. 1 . 3
1 . 2
1 . 1
b----
1 .0
. 9 , M u
M
.8 1 P
.7
. 6
. 5
• 4
. 3
. 2
· 1
.0 O.
~~ &
YGO
GJ. ~ 2. Y J3 ' } X X
& At H -.11 iGI
51 <!> "th "'tm X [!] YGo}~-+ -- "" , .'- rn-- G'_Y.m~ I'J7 ,"J X Y"'1 bit M l:f 11- -,;s- _' y __
" '''' " .. ',J' -': --- v.~_ ., Y'"
GI Y
-L-J
<!> 0 & lIE! th 8' A _. __ ~ , * " M • "'" "'-__ •
,!", " • " .~ "M'" " . .., - ___ J~Q, ') ~ th _ "eo
Y SCHILLING, 1964 (HFS)
X JIRSA, 1972 (HFS)
CJ KOROL, 1974 (ERW)
*- SHERMAN, 1976 (UFS & ERW)
6 SHERMAN, 1982 (FAB)
YG5
-,--,--,~I----L.--,---,o-L I I I
-
1 • 2. 3 . 4 5. 6. 7. F Df t
Y
,
I . 2
I . 1
I . 0
. 9
.8
.7
.6
.S
, 4
. 3
.2
, 1
. 0 8.XI0 3
-------------------
I I I %
28
I 21,
I 20
I z a 16 t-o.:
I => cY
'" 12 :0:: a a:
I "-
>- 8 t-
u
I 0.: "- ~ 0.: u
t-Z
I ...
0 x: a x:
"-a -~ I z
a t-o.: -8
I > ... :::>
-12
I -16
I I I I I I
r
r
(
~
) [ ~
[
~ U LS HS
TOTAL SCH I LLI NG JIRSA
OLaw Strength Mean
CHlgh Strength Mean
~ I
LS HS
KOROL
(
~
LS HS
SHERMAN 1976
(
[
LS HS
SHERMAN 1982
FIGURE 3 - ~EPARATION OF DATA ACCORDING TO LOW STRENGTH (LS) AND
HIGH STRENGTH (HS) STEEL WITH Dlt SLENDERNESS
- 33 -
.

N
:z: 20 0
;-4: :::>
16 0' ... X 0 a:
12 ... II> ... ....
8 u 4: "'-4: u
It .... :z: ... x 0
0 x u. 0
:z: -4 0
.... 4:
> -8 ... '"
-12
-16
o Low Strength Mean
DHlgh Strength Mean
~ (
~ \ 4
~ r'
~ (
)
4 d ~ LS HS LS HS LS HS LS HS
TOTAL SCHILLING JIRSA KOROL SHERMAN 1976
SHERMAN 1983
FIGURE It - SEPARATION OF DATA ACCORDING TO LOll STRENGl'H (LS) AND
HIGH STRENGTH (HS) STEEL IIITH F Oft SLENDERNESS y
- 34 -
I I I I I I I I I I I I I I I I I I I

I I I I I I I I I I I I I I I I I I I
N 20 z Io I-< g, 16 I-... x: o ~ 12 .....
>I-
~ 8 I-"< u
~ 4 I-... x: o x: ... 0 o z o ;:: -4 < > ... 0_8 _
o Mean
o 0
-12 I- I . : I -16 I-~ HF
JIRSA
ERII
KOROL
HF ERII
SHERMAN 1976
TOTAL StHI LL1NG
FIGURE 5 - , EPARATION OF DATA ACCORDING TO TYPE
OF PIPE IIITH F Dlt SLENDER~ESS Y
- 35 -
(
SHERMII.N 1983

24 -
N
z 20 -0
t-..:
16 6- -.... x: 0 a::
12 ... -> t-
u 8 ..: Il.
- , ..: u
t- 4 z -.... :<: 0 x:
0 ... 0 I z 0
t- -4 ..:
-
:> .... "" -8 -
-12 -1<-10" 10-13"
-16 - TOTAL
OHean
f i ~
~ • VI i
% >13" >13 LJ 10-11" 1<10" 10-13" >13"
SCHILLING JIRSA KOROL
FIGURE 6 - SEPARATION OF DATA ACCORDING TO PIPE
SIZE WITH F D/t SLENDERNESS Y
- 36 -
4
( (
0-13" >13'
SHERMAN SHERMA 1976 1983
I I I I I I I I I I I
I I I I I

- - - - - - - - - - - - - - - - - ... . ,-
."
Cl c: .,. ,., .....
'" @ ,. ... 0 z III
c: III
"" Cl
"" III ..... r-'" z 0
'" .,. ;z:
'" '" '" " ,. .,. ,. :< ,., .... ,., '" 11. I
~ ,., "-."
'" "-~
0 "-,.
1 . 3 . 0 2.5
1 . 2
1 . 1
1 . 0 r PI ~ PI
P .9
. 8
.7
.6
.5
• 4
. 3
.2
• 1
5.0 7.5 . 10 .0 12.5 15.0 17.5 20.0 22 . 5 25 .~ . 3
1 . 2 ~l
<~ -----_. 1 . 1 .., ", (!)- .. - ." . -~. ___ . __ ._ .., ""." " •• A "'.- ..
_.~. .,...", III • " * ;;.-=--- . .. .. ~~ ;:-J,.~ - • ~ ,., ,to· ,,..,-'" ,,' •
. ~ ,.., .. '" . _.. -----1 .. _"", ...•. .-3 .. ..-. __ .'1 .0
- l<Q· ~ • --- .-.. ",
·9
·8 ---- ""-95% confld ence 1 nterval
CJ KOROL, 1974 (ERW)
* SltERHAU. 1976 (ERW)
+ STEPHEII. 1982 (FAB)
.6 SIiERHAtl, 1982 (FAB)
.7
·6
·5
. .:J
·3
") i...
• 1
. O L LLLJ. 1 I I t I I I I 1 I I I I I I I I I I I I I I I I I I I I I I II
.0 2.5 5 . 0 7 . 5 10 · 0 12.5 15.0 17.5 20.u ~. (E/F )/(U/t)
LU_LJ II 11.0 22.5 25.0
y
I rr) N - , 0
m CO r- ([) Lf) '" rr) N - ' o . I o~ ~ ~ ~ 0
'" '" .-<
I .....
0 01 0 I N '" N '-
.-<~ -,
I *~
0 0 I 0 0 .-< .-< I ..
<
~ .. I (J "I
0 0 (l) (l) I
... ..... I (] ~ 0
. 0 0
I ([) ;C:EJ
([)
~ ~ ~
~"~ :t ., '" < I "(] :t UJ t.-
o: ~
'" UJ
~ EJ-Il '" N ,.... co 0 .:r '" '" 0 I ,.... ~ '" :-<r
T" < (] !i:jl z z
< ..: X
~ ...J ~ ~ a a: a: I .. ;EJ '" UJ UJ
<(] (] a :I: ::t: 0( '" V1 V1
<(] ~ ~ (]~ EJ"* <l ..
I 0 0 N "(]"l N
~
I "I 0. x x
c::rr, N -, 0 m ro r- ([) Lf) '" rr) N cP I .-< .-<
I FIGURE 8 - EQUATION , II WITH Oft SLENDE RN ESS PARAMETER
- 38 - I

- - - - - - - - - - - - - - - - - - ,.-J .3
. 0
1 . 2
1 1
1 . 0 .., C'> . 9 c
'" ,., '" .8F /I ,., u g /I
• » p
"" ~ . 7 '" 0
z c . 6 '" z
"" '" .5 r ,., z 0 ,.,
. 4 '" z ,., '" '" .., . 3 » '" » :x ,., ..., ~ . (. ,., '" ~ . l t • ~ I o L ~ I I
"'h "'1 . 0
.5
.. , h' ~ do
1 . 0 1 . 5
""-~ -,
~ .<4
~" ~
do !!I " ,
~ ~
• .1 .,
o KOROL. 1974 ( ERW)
;4( SHERIIAN. 1976 (ERW )
6SHER/IAN. 1982 (FAD)
2.0
~ &7
2.5 3 . 0 3 . 5 4 . 0
~ . l 11 11-1 1 111 1 1111111 1111111 1 11 1 1 13.0 .S 1 . 0 1 . 5 2 . 0 off . 5 3 . 0 3 . 5 4 . 0 4 . 5
(3 = - y tr

fY)
! .. :') •
o v
tJ') fY)
o fY)
o N
tJ')
o - ,
tJ')
o
o o
en
N
• .. "'EJ
" "
"I ":c :c
o en
~ ~ - ~ ~ ~ :r "'" u.. La.. ac: ~ ~ w
FIGURE 10 - ~QUATION USII~G SLENDERNESS PARAMETER
- 40 -
-10 t..f)
tJ')
v
o v
tJ')
m
~ L,) •
N~
). _ of... (ElF ) 2/3 Y
o N
tJ')
o
I I I I I I I I
I I I I I I I I I

I ([) ..,.. N 0
CO ([) v ~ c.
I 0- - ...... - '0
v[ I. J ~ - -,
I ~ I ·r ~
~ L ~ 0 .... ~
...... 1 -,
I CI
~~ ~ -j I I I
--, .J
0 C
O ~ -:0 I ,-,
I ...... ~ .. I 1 < ~ ,
I
f- I ~ e "l
I ·r I .. -.J a- j~ ...-
~t El
~ * .~ ·rn I . '" < ~.,~ , < -I I~~ ~~ j ...
I .....
El~ :. '" Q ~ a: Lf. ..J ... 3 !oJ
~ . a: ~ ~ 0 ... !oJ 0
I c.D ~El ~ oD .... ([) ..... CO
*1 ~ '" '" ~ ..... '"
~~ . .. z z
I , 11\ . .. . < < ~ -< ...J 2: 2: ~ .~~ .... 0 a: a:
~El ~~ ~ .. a: !oJ ~ 0 :>:
,,') '" '" '"
I 0 '" f EJ~<l
...;0
~ ... ;;} - 'V
<~ .,
~ ~Elh '" I '" ~ ~
(
~ _ t~ ~~
I 0 0
N <fJ ~_ N
/ -< --,
I ..
/ "I >0-x: x:
I Qo v 0 N 0 co ([) v N cO ~ \
-< -< ~ -I
FIGURE II • l Q.UAT 1011 USING H IH AND SLEI1OER:1 ESS PARAHETER Olt u y
I - 41 -

I J) """ /"'I') N a
CJ) r;n r-- C.D J) .
I 0- 0 ~ """
( :. I '" ...,
~
VI ... I ... 0 ::: VI 00 0 ... '" N VI :. ::: ... N
OT ... '" ~ ,., ::: ...,
I '" ~ ~ '" N ...... co N OT '" '" . ...... ......
C> '" '" z z z
I -' . . '" '" q: -' '" -' ::: ::: '" 0 VI 0 '" '" Cl. 0 ::: '" '"
..., ..., r "" 0 u 0 ::: ::: r 0 VI ...., '" VI VI
XEJ*,~ r Cl. - ' I >- q:
r ~
~ I 0 EJ 0 r;n x )lIE r;n
I r ~~ r
~ .. I "-
EJ '" x -~--0 - ---- - 0 C.D r C.D I EJ )lIE r
EP )lIE I :R ~~ ~ ~
EJ 0 0 I """ <:t-
~~ x I ~
EJ ~
~ ~ ~
0 0 I N ~~ N
I "I 0-lI:: lI:: ,l
I I I I I I I I I I I I I I I I I I I I I . I I I I I
OJ) """ ('Y') N 0 CJ) r;n r- C.D .J"P
FIGURE 12 - DATA COMPARED TO API RP2A (wi t h 1.6 7 Sa fety Factor) I - 42 - I

f _
.., Cl C
'" ,...
"" c. » -< » n 0 ~ .., » '" ,...
",. 0 .... -< 0
C r--< ~ » -< ,., ~ 0 ~ ,... :z; -< 0 .., » ."
r-
'" .., 0
- - -O. . 5[ 1
,.4rl1
11
.31-
. 2~-
1 . 1 r
.01-
. 9 r-
.131-
. 7
. G
.5 O.
u
p
8*
- - -- - - - - - - - - -- -1 • 2 . 3. 4. 5. G. 7 .
1 ~ '1 ~ ~p3 I I I I I I
Y SCHILLlNC, 1964 (HFS) -1 1 .4 X JIRSA, 1972 (HFS)
CJ KOROL, 1974 (ERIoI) -j I . 3 ;tt SHERI1AN, 1976 (HFS (, ERIoI)
Y ~ SItERHAN, 1982 (FA8) -j 1 .2
'" x y -j 1 . 1 '" '" '" x y
£I I!l~ x !!I r.! Y -j 1 . 0
y X
'" )I(.<!> '" '" \l( I )I( Y Y
'" \.. '" .<!> -j .9 .<!> Y
'" * !!I )I(
" ,~ '" I '" -1.8
G
~~kS' ---------.~. 36ksl -API LRFD---_ .
7
1740 ))00
I I I I I I . 1 5 \ . 2 . 3 . 4. 5 . G. 7. l1X 1 0 3
F ott y
...,
... c:
'" ",
~
~o
:Xl> ., .... l> • n
.... 0 :x:x
c ." l>
'" :l ",
0 r "' .... ""0 0
~ '" .. ", ~ " '" <>.
'" - ....
"'z -..e> :x 0 :z
0 :x
:l ",
z l> ....
'" '" 0 -0 ...,
'" ." ",
n ..., n » .... 0 z '"
a . 1 . 2 . 3 . 4 . 5 . 6 . 7 . 8 . X La 3 J.5, I I I I I I I I I I 11.5
1 . 4
1 . 3
1 . 2
1 . 1
1 . a
. 9
. 8
. 7
.6
c. ' V a .
Hr
M p
y
<!>
X I y ~ I <!> X
~ iYf!l.hl~ X [!)
I ~ y
<!If< 6
' .!>~L,~ 6
(2L- I 1.........:"\ -;!;I
yl.--- ~---.1t--
1300 1740 261 0 3)00
Y
y
X Y Y
.1> !>
[!)
Y SCHILLING, 1964 (II FS)
X JIRSA, 1972 (HFS)
CJ KOROL, 1974 (ERW)
~, SHERMAN, 1976 (HFS £. EWR)
6 SHERMAN. 1982 (FAa)
(2 ) AIS C Allowable Stress Design
(3) AISI Cold Form
(4) AISI Tentative Criteria
(5) AP I LRFD
(6) AISC LRFD
(7) Canadi an LRFD
.h Y )K
6
y
UJ. 4) j ~ ~ ---·-{~-. ~-::5-:-Q-------6) --. =3 ~-'- ( - {5fF~r-_______ ---1
y
1 . 4
1 . 3
1 . 2
1 . 1
I . 0
.9
.8
.7
.6
L..J. l.J 1 .
I 2 .
.L...L-.L-L, I ..J I .l_~ .-, ·5 8.Xla 3
3 . 4. 5 . 6. 7.
F Olt y -------------------
I I I I I I I I
APPENDICES
A - TABLES OF EXPERIMENTAL DATA
I B - STATISTICAL DEFINITIONS
I I I I I I I I I
- ~5 -
I
I I I I I I I I I I I I I I I I I I I
APPENDIX A. TA8LES OF EXPERIMENTAL DATA
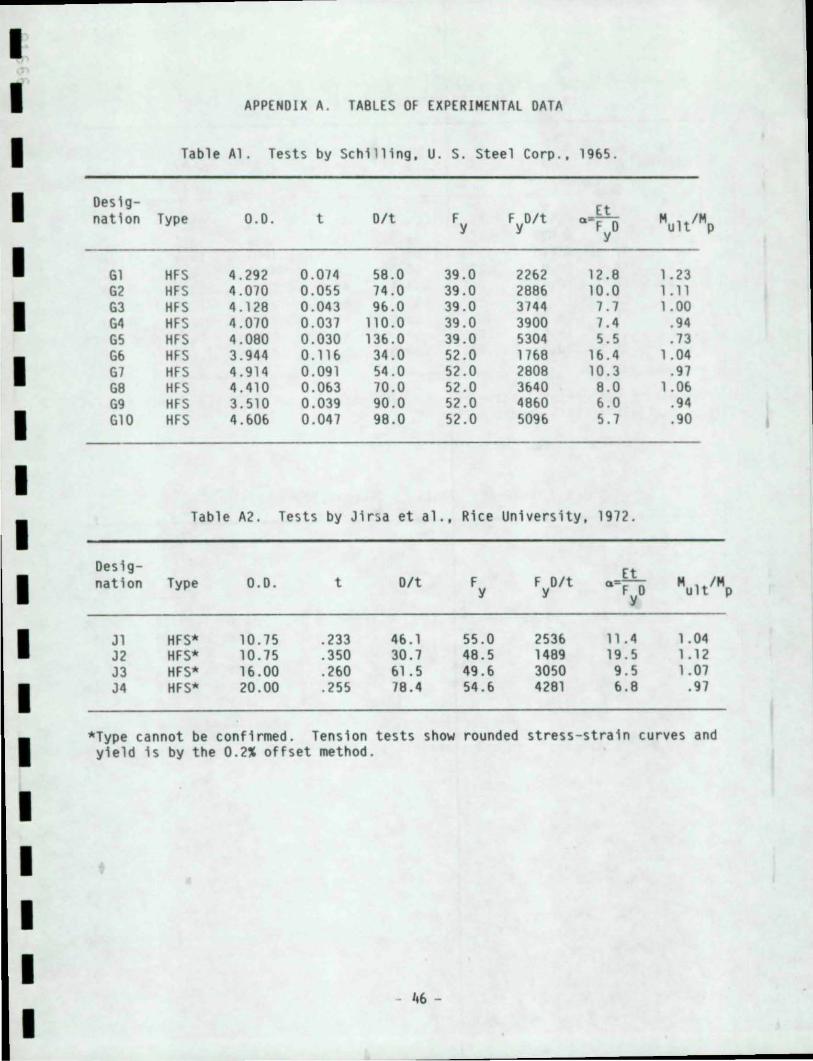
Table Al. Tests by Schilling, U. S. Steel Corp., 1965.
Oesig- Et nation Type 0.0. t Oft Fy FyOft 0 ·- MU1tfMp FyO
G1 HFS 4.292 0 .074 58 .0 39.0 2262 12.B 1.23 G2 HFS 4.070 0.055 74.0 39.0 2BB6 10.0 1.11 G3 HFS 4.12B 0.043 96 .0 39.0 3744 7.7 1.00 G4 HFS 4.010 0 .037 110.0 39.0 3900 7.4 .94 G5 HFS 4.080 0 .030 136.0 39.0 5304 5.5 .73 G6 HFS 3.944 0.116 34.0 52.0 116B 16.4 1.04 G1 HFS 4.914 0.091 54.0 52.0 280B 10.3 .97 G8 HFS 4.410 0.063 70.0 52.0 3640 B.O 1.06 69 HFS 3.510 0.039 90.0 52 .0 4860 6.0 .94 G10 HFS 4.606 0.041 98.0 52.0 5096 5.1 .90
Table A2. Tests by Jirsa et al., Rice University, 1912.
Oesig- Et nation Type 0.0. t Oft F F Oft 0:- MultfMp y y FyO
Jl HFS* 10 .75 .233 46.1 55.0 2536 11 . 4 1.04 J2 HFS* 10.75 .350 30.7 4B.5 14B9 19 .5 1.12 J3 HFS* 16.00 .260 61.5 49.6 3050 9 . 5 1.07 J4 HFS* 20.00 .255 7B.4 54.6 42B1 6.B .91
*Type cannot be confirmed. Tension tests show rounded stress-strain curves and yield is by the 0.2% offset method.
- ~6 -
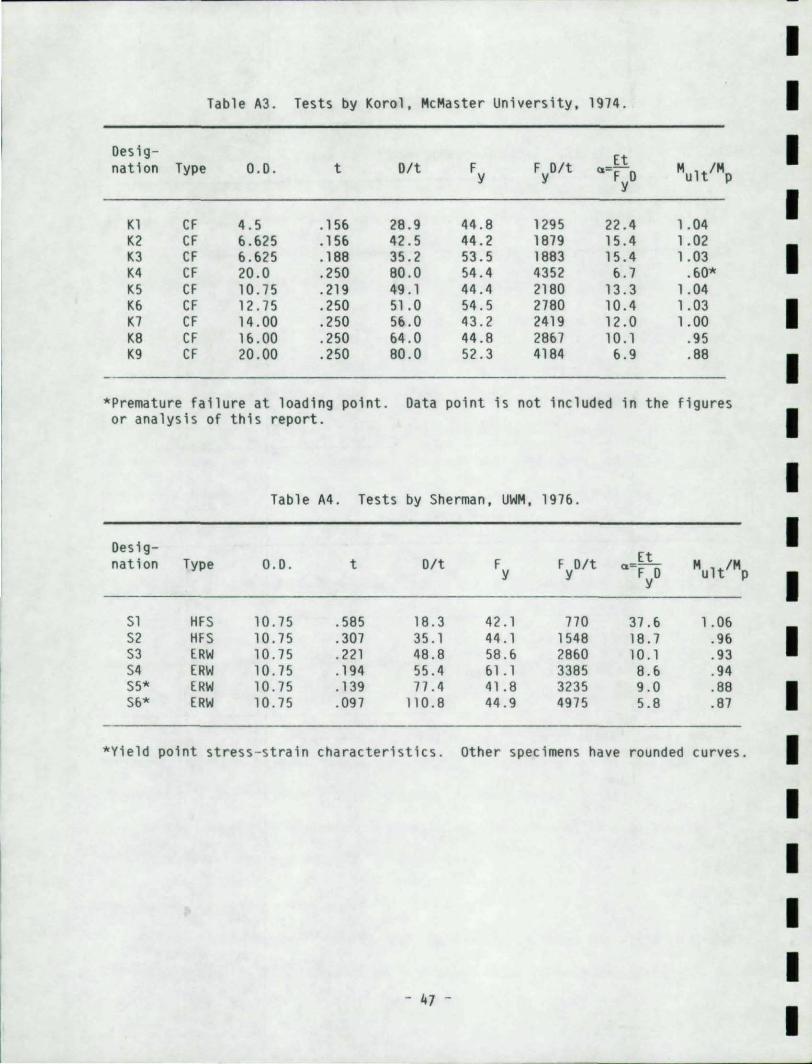
Table A3. Tests by Korol, McMaster University, 1914.
Oesig- Et nation Type 0. 0. t Olt Fy FyO/t ,,=- Mu1t/Mp FyO
K1 CF 4 . 5 . 15& 28.9 44 . 8 1295 22 .4 1.04 K2 CF &.&25 . 15& 42 . 5 44.2 1819 15.4 1.02 K3 CF &.&25 .188 35 . 2 53 . 5 1883 15 .4 1.03 K4 CF 20 .0 .250 80 .0 54 . 4 4352 &.1 . &0'" K5 CF 10 .15 .219 49.1 44.4 2180 13.3 1.04 K& CF 12 .15 . 250 51.0 54.5 2180 10.4 1.03 K1 CF 14 .00 .250 5& .0 43.2 2419 12.0 1.00 K8 CF 1 &.00 . 250 &4 .0 44.8 28&1 10 .1 .95 K9 CF 20.00 .250 80 .0 52 . 3 4184 &.9 .88
"'Premature failure at loading poi nt. Oata point is not included in the figures or analysis of this report.
Table M. Tests by Sherman, UWM, 191&.
Oesig-Et nation Type 0. 0. t Olt F F Olt ,,=- Mult/Mp Y Y FyO
Sl HF S 10 .15 . 585 18 . 3 42.1 110 31.& 1. 0& S2 HFS 10 .15 . 301 35 .1 44.1 1548 18.1 .9& S3 ERW 10 .15 . 221 48 .8 58.& 28&0 10 .1 .93 S4 ERW 10 .15 .194 55 .4 &1.1 3385 8.& .94 S5" ERW 10.15 .139 11 .4 41 .8 3235 9.0 .88 S&" ERW 10.15 .091 110 .8 44 .9 4915 5. 8 .81
"Yield point stress - strain characteri st ic s. Other spec i men s have rounded curves.
- 47 -
I I I I I I I I I I I I I I I I I I I

I-I Table AS. Tests by Stephens et al., University of Alberta, 1982 .
I oesig -Et nation Type 0.0 . t o/t F Fyo/t ,,=- Mult/Mp y Fyo
I Cl Fab . 60.2 . 202 298 54 . 5 16240 1. 79 . 48
I C2 Fab. 60.2 .135 444 44 .4 19710 1.49 .4 2
Sharp yielding stress-s train curves.
I I Table A6 . Tests by Sherman, UWM, 1983 .
I oesig - Et nation Type 0 . 0. t olt F Fyo/t ,,=- Mult/Mp y F ° y
I Al Fab . 18 1.049 11.2 40.5 697 41.6 1.05 A2 Fab. 18 .737 24.4 43.3 1057 27 . 4 1. 15
I A3 Fab. 18 . 651 27.7 49.0 1357 21.4 1 . 10 A4 Fab. 18 . 516 34.9 43.3 1511 19.2 1.07 AS Fab . 18 . 391 46.1 42.6 1964 14 .8 .96
I A6 Fab. 18 . 270 66 . 7 47 .1 3142 9 . 2 .84 A6R Fab. 18 . 242 74.4 45 .6 3392 8.6 .89 A6L Fab. 18 .249 72 . 3 44 .8 3239 9 .0 . 91 A7 Fab . 24 . 509 47.2 45.6 2152 13 . 5 1.03
I A8 Fab . 24 .267 89.9 54 .1 4864 6 .0 .88 81 Fab. 18 1.000 18.0 54 .3 977 29 . 7 1.07 82 Fab. 18 .772 23.4 56 . 5 1322 21.9 . 96
I 82R Fab. 18 .745 24 . 2 53 . 7 1297 22 .4 1.06 83 Fab . 18 . 645 27.9 61. 5 1116 16.9 .96 84 Fab . 18 . 522 34 . 5 59.6 2056 14 . 1 1.03
I 85 Fab. 18 .395 45 . 7 59.5 2719 10 . 7 .95 86 Fab . 18 .267 67.6 62 .9 4252 6.8 .90 87 Fab. 18 .537 44.7 58.8 2628 11.0 .88 87R Fab. 24 . 541 44.4 55.0 2442 11.9 1 .00
I 88 Fab . 24 . 277 86 .6 &2 .3 5395 5 .4 .84 89 Fab. 24 . 394 60 .9 57 .9 3526 8 . 2 . 92
I I I
- ~8 -
I

APPENDIX B
STATISTICAL DEFINITIONS
A regression analysis was used as a statistical tool for comparison of
various data. The statistical package 'MINITAB' (Bl) was used for the calcul -
ation of various statistical parameters, for example correlation and
regression coefficients, confidence intervals, standard error (B2) etc .
Correlation Coefficient:
The ratio of the explained variation to the total variation is called the
coefficient of determination. If the total variation i s completely unex -
plained, this ratio i s zero . If it l S totally explained, the ratio is one .
In other cases the ratio lies between zero and one . Since the ratio is always
2 positive, we denote it by r. The quantity r, called the "coefficient of
correlation, is given by
r = ± explained variation
total variation ± E (y predicted -
I (y _ ~)2
- 2 y)
and varie s between - 1 and +1 . The s igns ± are used for positive linear
correlation and negative correlation, respectively . Correlation coeffi cient
'r' i s a dimensionless quantity, i.e. it does not depend on the units
employed . For the case of linear correlation the quantity 'r' is the same
regardless of whether x or y is considered the independent variable.
In case of multiple independent variables, the correlation coefficient
between y-actual and y- predicted i s calculated .
Regression Analysis:
Often, on the basis of sample data, we wish t o estimate the value of a
dependent variable 'y' corresponding to a given value of an independent
- 49 -
(1)
I I I I I I I I I I I I I I I I I I I

I I I I I I I I I I I I I I I I I I I
variable 'x'. This can be accomplished by estimating the value of 'y' from a
least square curve which fits the sample data. The resulting curve is called
a regression curve of 'y' on 'x' since 'y' is estimated or predicted from 'x'.
A regression equation is an equation for estimating a dependent variable,
say y from the independent variables xl' x2 ' x3, . . • and is called a
regression equation of yon xl' x2' x3' ... In functional notation
this can be written briefly as y = F(x l , x2' x3 ' ... ).
For the case of two variables, the simple regression equation of y on x
has the form:
y = a + bx
where a and b are regression coefficients. The equation represents the equa-
tion of a straight line; therefore, it is called a linear regression equation
of y on x.
If we have dependent variables as 2 x. x • . ., xn etc. then it is
called a nonlinear multiple regression equation and has the following form:
y = a + bx + cx 2 + . . . + dxn
If we have a dependent variable, xn, then it has the form:
the equation is called a nonlinear regression equation.
Confidence Interval:
The confidence interval for any parameter can be computed by a formula
that has the following form:
parameter = observed or predicted statistic ± (A) (B)
- 50 -
•

The A in the first parentheses relates to the specific confidence level chosen
and the 8 in the second parenthesis relates to the precision of estimates or
prediction resulting from the sampling procedure . In calculating the confi -
dence interval the normal distribution of the sample is assumed; therefore,
for a 95% confidence interval the above formula has the following form :
Standard Error
Residual Variance
y = y-predicted ± to .025 (Standard Error)
2 1 - 2 = S = n I(y - y)
n = Degrees of freedom to estimate the variance
y = Mean value
to.025 = Critical value or confidence coefficient corre sponding to 95% confidence limit
REFERENCES: FOR APPENDIX 8
B1. Ryan, T. A., B. L. Joi ner, and 8. F. Ryan (1976), Mi nitab Student Handbook . North Scituate, Ma ss, Duxbury Press.
B2 . Wonna cott, R. J . , and T. H. Wonnacott (1982), Statistics -Discovering Its Power, John Wiley & Sons, New York .
- 51 -
I I I I I I I I I I I I I I I I I I I

I I I I
I I I I I I I I I I I
I I I I I I