the untold story of america’s debt - deloitte · 2019-10-27 · the untold story of america’s...
TRANSCRIPT
The untold story of America’s debtA Deloitte series on making America stronger

The Untold Story Of America’s Debt
A number of Deloitte colleagues contributed insightful knowledge, time, and consideration to the development of this study. In particular, Clarence Crawford of Deloitte Consulting LLP contributed significantly to the evolution of the study from the very beginning. This work would not have been possible without his valuable feedback and perspective. Special thanks must also go to a number of advisors and reviewers: Tom Davis of Deloitte & Touche LLP, Jessica Blume and Ira Goldstein, Deloitte LLP, Ira Kalish and Carl Steidtmann, Deloitte Services LP, Greg Pellegrino and Russ Davis, Deloitte Financial Advisory Services LLP, and Stephen Lewarne, Deloitte Consulting LLP.
Robert N. Campbell III
Robert N. Campbell III serves as vice chairman and U.S. State Government leader, Deloitte LLP. Bob oversees the delivery of Deloitte’s audit, consulting, financial advisory and tax services to state, local, education, public health care, and nonprofit clients.
Daniel Byler
Daniel Byler is a Consultant in Deloitte & Touche LLP’s Business Risk practice. While at Deloitte, Daniel has supported clients in the Department of Homeland Security, the Department of Defense, the FDIC, and currently develops solutions for Deloitte’s Center for Risk Modeling and Simulation. Daniel graduated from The College of William and Mary with a BA in Economics and is currently enrolled in a Masters of Statistics program at Texas A&M.
Megan Schumann
Megan Schumann is a Consultant in Deloitte Consulting LLP’s Federal Strategy and Operations practice. She has served clients in the financial services sector and is currently working with Deloitte’s Global Public Sector industry to develop a book that explores new frontiers of public ser-vices. Megan graduated from Georgetown with a dual degree in Finance and International Business.
William D. Eggers
A Director for Deloitte Research, Deloitte Services L.P., Bill Eggers is responsible for research and thought leadership for Deloitte’s Public Sector industry practices. His seven books include the Washington Post best seller If We Can Put a Man on the Moon: Getting Big Things Done in Government (Harvard Business Press, 2009), Government 2.0 (Rowman and Littlefield, 2005), Governing by Network (Brookings, 2004), a winner of the Brownlow award for best book on public management, and The Public Innovator’s Playbook (Deloitte Research, 2009).
Acknowledgements
About the authors

A Deloitte series on making America stronger
Contents
Introduction | 2
#1: Why the debt problem is bigger than you think | 4
#2: The size of the debt is highly sensitive to economic fluctuations | 6
#3: The debt could adversely impact American competitiveness | 10
#4: The debt crisis could eventually impact the independence of monetary policy | 12
#5: The demand for and composition of America’s debt isn’t just America’s decision | 13
Conclusion | 14
Appendix A: Family statistics | 15
Endnotes | 16
1

The Untold Story Of America’s Debt
DEBATING the U.S debt has practically become a national pastime. Instead of a
productive conversation that results in a clear path forward, however, the facts have grown murkier as fingers are pointed as to which politicians and which party have racked up more debt and who is most responsible for the current impasse. Debt ceiling deals collapse into short-term fixes that defer the difficult decisions down the road. Skeptical citizens, increasingly distrustful of Washington, DC, are left to speculate about whether the debt is even a legitimate concern as they parse fact from fiction, hyperbole from reality. The sheer divisiveness of the issue seems to capture the most headlines, earning the current Congress a reputation for being the most partisan in decades.
This conversation has not only made it virtually impossible to agree and act upon promising solutions, but the complexity of the underlying issue has been simplified to the extent that potentially game-changing details are often overlooked. In fact, many engaged citizens remain unaware of the full trove of viable solutions that have already emerged—not to mention the full array of fiscal risks the country faces.
In some policy areas such as Social Security, taxation, and discretionary spending, promising and practical solutions are known
and are simply impeded by a lack of politi-cal will or ignored altogether. In other policy areas, plans of action are less developed but demand attention if there is to be any mean-ingful dent in the fast-accruing U.S. debt.
This issue brief explores the untold story of the national debt: areas of concern that should be impacting the overall debate, but today, out-side of a handful of budget experts, are largely not part of the current discussion. These con-cerns fall into five major categories:
• The debt crisis is likely bigger than you think: Current baseline projections make a host of optimistic assumptions that very well may not come to pass, that the Bush tax cuts will expire and the cuts to Medicare are allowed to go through. If any of these are reversed by Congress, the debt becomes much larger. Further, current debt levels are significantly higher when the government’s unfunded commitments, particularly around Medicare, are taken into account.
• The magnitude of the debt is highly sensi-tive to economic fluctuations: America’s reliance on short-term debt makes it highly vulnerable to interest rate fluctuations. If rates return to historical levels, this would significantly increase interest payments on U.S. debt. If GDP fails to match expected growth levels it would further drive up the debt.
Introduction
2
A Deloitte series on making America stronger
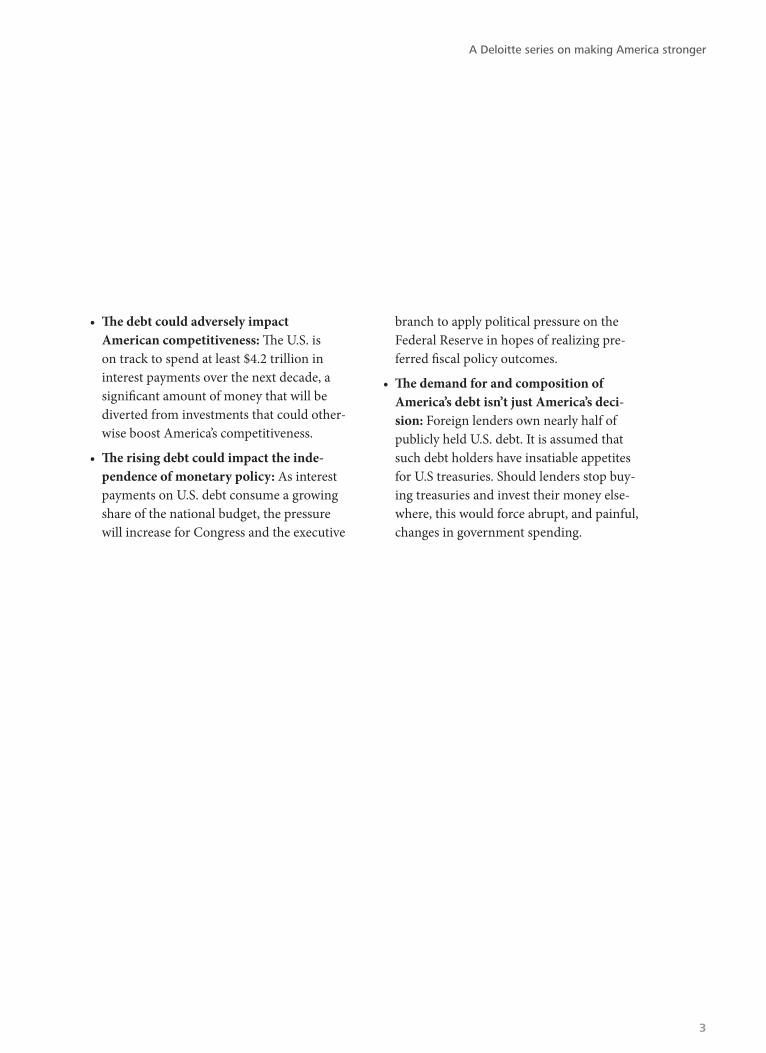
• The debt could adversely impact American competitiveness: The U.S. is on track to spend at least $4.2 trillion in interest payments over the next decade, a significant amount of money that will be diverted from investments that could other-wise boost America’s competitiveness.
• The rising debt could impact the inde-pendence of monetary policy: As interest payments on U.S. debt consume a growing share of the national budget, the pressure will increase for Congress and the executive
branch to apply political pressure on the Federal Reserve in hopes of realizing pre-ferred fiscal policy outcomes.
• The demand for and composition of America’s debt isn’t just America’s deci-sion: Foreign lenders own nearly half of publicly held U.S. debt. It is assumed that such debt holders have insatiable appetites for U.S treasuries. Should lenders stop buy-ing treasuries and invest their money else-where, this would force abrupt, and painful, changes in government spending.
3

The Untold Story Of America’s Debt
LEFT unchecked, current Congressional Budget Office (CBO) baseline estimates
show the national debt accruing at a rate of roughly $4 billion per day.1 That translates to roughly $750 per U.S. household per month, or a fifth of the average household’s monthly income.2 Considering that the nation has already accrued about $140,000 in debt per taxpayer, the financial outlook is daunting at best.3
Unfortunately, the challenge the debt crisis presents is almost certainly more severe and more immediate than the CBO’s forecast
indicates. This is partly due to the fact that the CBO is required to make its projections under the assumption that “current law” will continue. Unfortunately, Congress often shifts course in a way that adds to the deficit.4 Also, the CBO generally makes the reasonable deci-sion to assume that the future will be similar to the past in terms of economic growth and interest rates and that the United States will be able to eventually reduce its high levels of unemployment. When the world is not chang-ing rapidly, this is a very reasonable approach. In the current environment, however, after a game-changing financial crisis and rapid accrual of debt, the CBO’s current-law esti-mates (by their mandated design) likely paint a more optimistic fiscal future than we are likely to experience.5
Let’s dive a little deeper into these factors. Each would make the future U.S. debt higher than currently assumed.
Congress is likely to spend more than baseline projections indicate. When fore-casting deficits, the CBO operates under the assumption that current law, including current plans to decrease or increase spending and taxes, will be followed in the future. While this appears to be a conservative method, at present it involves the assumption that the Bush tax cuts will expire and the Alternative Minimum Tax (AMT) will remain unadjusted; the cuts to Medicare in the Affordable Care Act (“health care reform”) are allowed to go through; the debt-ceiling deal on spending caps hold firm and uninterrupted through all future crises or wars for the next decade; and that the automatic cuts to Medicare Part D (which have never been allowed to go through) all occur. These are, needless to say,
#1: Why the debt problem is bigger than you think
4

A Deloitte series on making America stronger
not necessarily guaranteed, or even likely, in today’s political climate.
If any one of these assumptions fall through, as with Congress’s recent extension of the Bush tax cuts, borrowing costs could increase substantially. Given the contentious current political environment and the inability of the congressional Super Committee and the President’s Fiscal Commission to generate a major deal, it would seem prudent to consider the fiscal impacts of the current law assump-tions not prevailing. The result: America’s future debt and deficit would be significantly higher than currently projected by the CBO’s current law projection.
Measuring America’s debt on an accrual, rather than cash, basis grows the current shortfall from $15.7 trillion to over $50 tril-lion. America’s debt is traditionally measured on a cash basis, which values the current debt
at $15.7 trillion. However, the government regularly releases a report called the Financial Report of the United States Government, in which it gives an estimate of the U.S. budget picture on an accrual basis for individual programs.6 The inclusion of all of America’s long-term unfunded liabilities into a single measure paints a far more difficult future pic-ture for the U.S. over the longer term, in which debt totals over $50 trillion dollars (see figure 1).7 As with most cost estimates, the primary culprit in these estimates is Medicare, which further highlights the criticality of addressing this mandatory spending program.8 However, the sheer magnitude of these estimates shows that many deficit reduction initiatives simply fail to move the needle when compared with the stark shortfalls outlined by both the cash and accrual methods of accounting.
Figure 1. Another perspective: debt on an accrual basis
5

The Untold Story Of America’s Debt
FORECASTS by the Congressional Budget Office (CBO) have been an essential under-
pinning in debt reduction planning. However, the sheer scale of the national debt makes even marginal departures from the CBO assump-tions produce significantly different levels of debt, thereby altering the relative urgency of addressing the issue. Given the ubiquitous questions of “How much time do we have left to make the hard decisions?” and “How long can we afford to wait?” understanding how key assumptions impact forecasts offers valuable insight that favors more immediate action on the debt problem.
GDP growth may be significantly differ-ent than anticipated. As Harvard economist Kenneth Rogoff has demonstrated, after a financial recession, growth typically is rela-tively anemic while unemployment remains high for up to six years after the initial down-turn.9 By this measure, the United States can anticipate sluggish growth and high unemploy-ment rates through 2015.
Furthermore, nations with high debt-to-GDP ratios tend to perform more poorly than those with lower debt ratios. Rogoff concluded that over the last two centuries, nations with government debt in excess of 90 percent of GDP grew by 2 percent less per year than those with more manageable debt levels. In the post-WWII period, the average level of growth is almost 4 percent lower.10 These lowered growth rates are thought to stem from citizens increasing savings in anticipation of future tax increases, as well as from the increased risk
of sovereign debt crises, which force nations to adopt fiscal austerity measures that impede economic growth.11 Rogoff ’s work also dem-onstrates that countries that rely on financing through short-term debt and that therefore must access debt markets more frequently—such as the United States—are more likely to experience sudden sovereign debt crises. As U.S. debt levels rise, Rogoff suggests we can expect additional downward pressure on growth. Lowered economic growth in turn would lead to lower tax revenue and less avail-able money to finance infrastructure improve-ments, research and development initiatives (R&D), and other critical investments.
CBO projections for the next decade, how-ever, assume high peak GDP growth without taking into account the possibility (or likeli-hood) of weak economic years.12 The current baseline projections do not include a single year of negative GDP growth over the next decade but do assume peak real growth at 5.0 percent of GDP, a level not seen since the mid-1980s boom.13 The CBO’s growth forecasts do not reflect current performance. Recent growth has hovered around 2 percent, with no sign yet that the economy is capable of regularly grow-ing at the real 3.1 percent annual rate the CBO assumes.14 These factors may make it more likely that the United States will experience downside risk to its economic growth.
A deviation of 1 percent of average GDP growth over the next decade increases or decreases the U.S. deficit by roughly $3 trillion on a cash basis over 10 years.15 While this is
#2: The size of the debt is highly sensitive to economic fluctuations
6
A Deloitte series on making America stronger
the source of often repeated calls to focus on growth, it can also be seen a different way: the economy is a significant driver of U.S. debt. In this environment, pledges to balance the budget by a certain date or efforts to manage towards a strict debt ceiling level will prove difficult because somewhat unpredictable eco-nomic fluctuations will determine the struc-tural landscape that budget debates are played out over.
America’s reliance on short-term debt exposes it to interest-rate volatility. One-fourth of the U.S. debt held by the public is issued in bills and notes that have to be refinanced at least every two years.16 This amounts to a total of more than $2.5 trillion in payments that are regularly rolled over via short-term debt. Many of these T-Bills must be refinanced more than once per year, creat-ing significant additional refinancing. As the
United States continues to accrue debt, the amount that must be refinanced, and that is therefore affected by the market interest rate, will only grow.
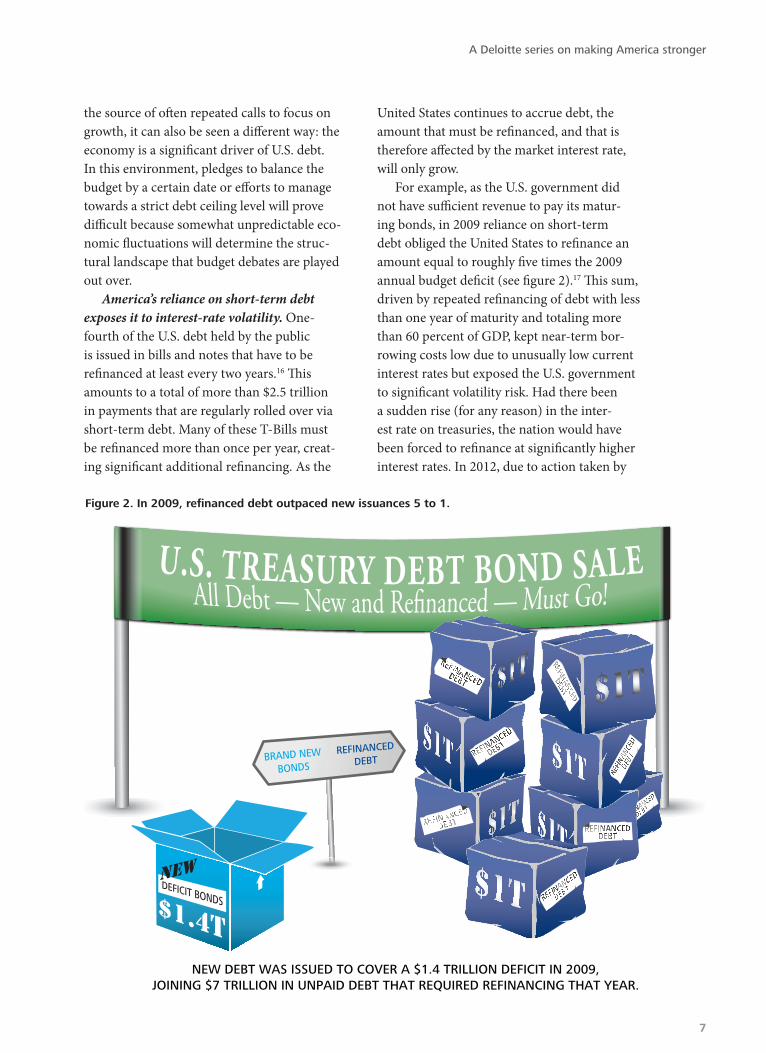
For example, as the U.S. government did not have sufficient revenue to pay its matur-ing bonds, in 2009 reliance on short-term debt obliged the United States to refinance an amount equal to roughly five times the 2009 annual budget deficit (see figure 2).17 This sum, driven by repeated refinancing of debt with less than one year of maturity and totaling more than 60 percent of GDP, kept near-term bor-rowing costs low due to unusually low current interest rates but exposed the U.S. government to significant volatility risk. Had there been a sudden rise (for any reason) in the inter-est rate on treasuries, the nation would have been forced to refinance at significantly higher interest rates. In 2012, due to action taken by
NEW DEBT WAS ISSUED TO COVER A $1.4 TRILLION DEFICIT IN 2009, JOINING $7 TRILLION IN UNPAID DEBT THAT REQUIRED REFINANCING THAT YEAR.
Figure 2. In 2009, refinanced debt outpaced new issuances 5 to 1.
7

The Untold Story Of America’s Debt
the Treasury, this pattern has eased but will still require the United States to refinance an amount double the projected deficit.18
Since the U.S. Treasury is forced to refi-nance large portions of U.S. debt every year, it is likely to have to refinance at higher interest rates sooner or later. The natural rise of interest rates that occurs during a recovery will force higher rates for U.S. treasuries. These increased interest payments in turn will have to be financed through more debt, further com-pounding the problem.
While high levels of inflation are not expected by most economists in the short term, there is always a risk that at some point over the next decade there might be, for any number of reasons, an unexpected bout of inflation. In this scenario, the Fed should be able to freely respond by raising interest rates.
On our current path, however, such an action would have an enormous fiscal impact.
For example, if the Federal Reserve was forced to unexpectedly raise interest rates by 3 percent in 2016 (as occurred in 1981, 1994, and 2004), the total impact would shortly be in excess of $200 billion in additional costs to the U.S. treasury, or more than the annual costs of the wars in Iraq and Afghanistan combined at their peak in 2008 (see figure 3).19 Critically, this cost would continue into future years as interest payments are rolled over and com-pound negatively against the U.S. taxpayer.
An alternative debt forecastJust how much sensitivity is there in the
size of the debt problem? Consider if four CBO assumptions discussed earlier—the Bush tax cuts expiring, the AMT hitting the middle
+3%Interest Rate
U.S. TREASURY ANNUAL
WAR COSTS
Source: "The Cost of Iraq, Afghanistan, and Other Global War on Terror Operations Since 9/11," Amy Belasco, Congressional Research Service Report for Congress, RL33110, p. CRS-9).Read more: Estimated War-Related Costs, Iraq and Afghanistan — Infoplease.com http://www.infoplease.com/ipa/A0933935.html#ixzz1uZzk4Rdnhttp://www.infoplease.com/ipa/A0933935.html
Figure 3. The impact of interest rates on debt projections
IF INTERESTS RATES GO UP BY 3%, THE ADDITIONAL COST TO THE TREASURY
WILL BE AS MUCH AS THE PEAK COMBINED ANNUAL COSTS OF
THE WARS IN AFGHANISTAN AND IRAQ.
8

A Deloitte series on making America stronger
class, the spending caps holding, and cuts to Medicare Part D—failed to actually material-ize. Add to that lower economic growth and higher interest rates that produce $5 trillion in additional deficits. Together, these factors would raise the nation’s likely 10-year debt from the CBO’s current-law baseline (see table 1) of $3 trillion, past many of the adjustments the Committee For a Responsible Budget proposes in its alternative fiscal scenario of $8 trillion in additional spending. This brings the total to about $14 trillion in additional debt over the next decade, even if the wars in Iraq
and Afghanistan were greatly wound down (see figure 4).20 The outlook beyond the next decade provides little reassurance, with interest payments alone on the national debt antici-pated to reach almost $1 trillion annually start-ing in 2020, even by the CBO’s own alternate fiscal scenario.21 Even if revenue is not adjusted from the current CBO baseline, our alternative projections show America would be spending roughly 20 percent of all government revenue on interest toward the national debt by the end of the decade.
Table 1. Impacts of altering CBO assumptions
Category Current CBO Target22 Realistic AlternativeIncreased 10- year deficits
Nominal Annual GDP Growth
4.7% 3.7%23 ~ $3T
10-Year Treasury Note Interest Rates
4.2% 5.8%24 ~ $2T
Continuation of Hard Cuts/Taxes
Current law is enactedCurrent policy (extending Bush tax cuts, suspending Medicare cuts) continues unabated
~ $6T25
CONTINUATION OF CURRENT POLICY
+$6 TRILLION
$14 trillion in deficits
+$5 TRILLION
$3 TRILLION
ADJUSTED GDP GROWTH AND INTEREST RATE PROJECTIONS
CBO CURRENT LAW BASELINE SCENARIO
Figure 4. 10-year deficits are likely to exceed current projections
9

The Untold Story Of America’s Debt
CURRENT spending patterns suggest that the United States will cumulatively spend
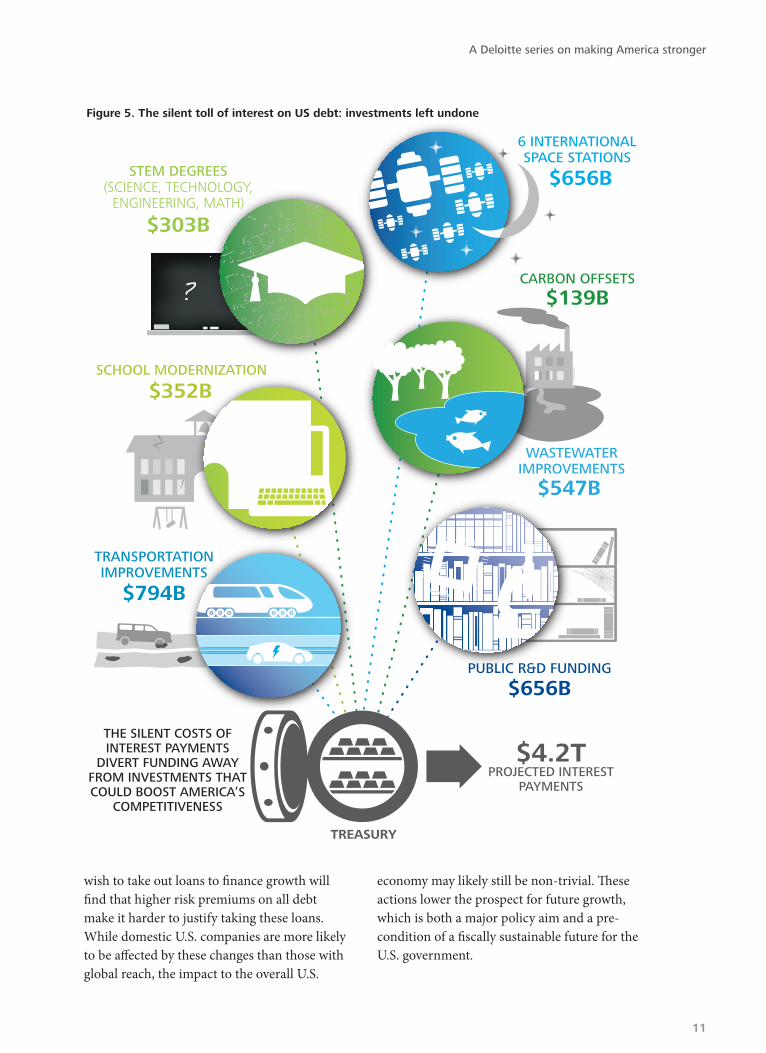
at least $4.2 trillion on interest payments within the next decade.26 This spending will almost inevitably force the adoption of higher taxes and significant program cuts. If recent political negotiations surrounding the debt ceiling are any indication of future behavior, the areas of the government most closely con-nected to competitiveness (non-defense dis-cretionary spending on R&D, infrastructure, education, and training) will be the biggest targets for continuing cuts.27
While the debate surrounding which cur-rent programs to cut to pay the debt will be both important and intense, it is critical to recognize that the $4.2 trillion in interest pay-ments are already taking a silent toll in pro-grams left undone. In an attempt to quantify this silent cost of interest, figure 5 illustrates how, for comparison purposes, a variety of key investments made over the next 10 years would cost less than the total interest paid on the debt. Specifically, these items include modernizing every school in America;28 build-ing 80,000 miles of highways;29 paying for all costs associated with every STEM degree in the country;30 tripling U.S. government general R&D funding;31 building six international space stations;32 offsetting 80 percent of global warming pollution in the atmosphere as rec-ommended by the Intergovernmental Panel on Climate Change;33 and funding unmet water and wastewater infrastructure needs.34 These investments seem massive in scale but actually still total almost $1 trillion dollars less than
planned expenditures on our interest pay-ments. The trillion dollars could be used for tax cuts, paying down the Federal debt, or any number of other uses.
Figure 5 makes clear that a great variety of meaningful investments will almost certainly be left undone simply because interest pay-ments will push them out of the budget. This is the silent cost of prior debts that, unless explicitly recognized, crucially leads policy-makers to underestimate the effect that prior deficits have already had on this decade’s planned expenditures.
Federal debt may raise the cost of borrow-ing for domestic-based American companies. When the government runs large deficits, it competes for funds that could be invested in the private sector. Higher costs for capital and limited access to investment will impact the borrowing costs of companies as well.35 As Harvard Business School professors Richard H.K. Vietor and Matthew Weinziert write, “Capital markets will visit the sins of the public sector upon the private one. If the cost of bor-rowing rises for the U.S. government, it will rise for private-sector borrowers as well.”36
In the corporate sector, $11.5 trillion in loans will mature in the next five years.37 In the face of increased competition from sovereign debtors and diminished net demand from households, firms will compete with govern-ments for funding from a limited pool of investors that lend to the world. As in govern-ments, higher interest costs paid by firms will necessarily detract from other core operations of their businesses. Additionally, firms that
#3: The debt could adversely impact American competitiveness
10
A Deloitte series on making America stronger
wish to take out loans to finance growth will find that higher risk premiums on all debt make it harder to justify taking these loans. While domestic U.S. companies are more likely to be affected by these changes than those with global reach, the impact to the overall U.S.
economy may likely still be non-trivial. These actions lower the prospect for future growth, which is both a major policy aim and a pre-condition of a fiscally sustainable future for the U.S. government.
$656B
6 INTERNATIONAL SPACE STATIONS
$352BSCHOOL MODERNIZATION
$303B
STEM DEGREES(SCIENCE, TECHNOLOGY,
ENGINEERING, MATH)
$656BPUBLIC R&D FUNDING
$794B
TRANSPORTATION IMPROVEMENTS
$139B
$547B
CARBON OFFSETS
WASTEWATER IMPROVEMENTS
$4.2TPROJECTED INTEREST
PAYMENTS
TREASURY
THE SILENT COSTS OF INTEREST PAYMENTS
DIVERT FUNDING AWAY FROM INVESTMENTS THAT COULD BOOST AMERICA’S
COMPETITIVENESS
Figure 5. The silent toll of interest on US debt: investments left undone
11
The Untold Story Of America’s Debt
#4: The debt crisis could eventually impact the independence of monetary policy
THE Federal Reserve’s newfound impact on the budget might encourage Congress to
apply additional political pressure on monetary policy, compromising the Federal Reserve’s ability to make sound monetary policy deci-sions outside the reach of the legislative branch. Similarly, Presidential appointments to the Federal Reserve might be influenced by the desire to appoint individuals who generally favor lower interest rates and therefore lower interest payments for the U.S. government.
Interest payments taking center stage in budget debates as described in the previ-ous section is not just a theory anymore. It is already playing out in the debt crisis in Europe. In 2011, Italy would have run a surplus had it
not been forced to pay 5 percent of its GDP in interest payments on its national debt.38 Moreover, for every percent increase in the interest rate, 1.2 percent more of Italy’s GDP is diverted to paying interest on the national debt. While the United States currently “only” pays 1.2 percent of GDP in interest, as we have shown previously, that number is likely to rise and become more unstable as time progresses unless meaningful action is quickly taken.
Going forward, the United States govern-ment must explicitly decide to what extent it is willing to accept higher interest rates in the short term in exchange for more stable finances in the long term via the use of longer-term debt. Choosing longer-term debt will be politically difficult because it will necessarily raise borrowing costs in the short run and is at odds with recent efforts.39 However, by issuing more long-term debt, the United States reduces the amount of debt it must refinance every year. As such, when interest rates eventually rise, long-term debt shields the U.S. govern-ment from being forced to take a higher interest rate. With this in mind, it is important to realize that structuring America’s debt has become a meaningful budgetary decision with fiscal and monetary implications that can be as serious as any other spending decision made by the government. Unfortunately, interest payments do not garner the attention they deserve because they are harder to explain and difficult to control.
“The conventional wisdom that nearly infinite demand exists for U.S. Treasury debt is flawed and especially dangerous at a time of record U.S. sovereign debt issuance.” — Lawrence Goodwin, Center for Financial Stability
12

A Deloitte series on making America stronger
#5: The demand for and composition of America’s debt isn’t just America’s decision
HEAVY reliance on foreign lenders exposes U.S. Treasury interest rates to fluctua-
tions based on foreign appetites for treasur-ies. Prior to the explosion of U.S. debt in the 2000s, the vast majority of U.S. debt was held by Americans.40 However, the rapidly expand-ing national deficit has quickly outstripped the United States’ weak savings rate. The result: 47 percent of U.S. treasuries not held in U.S. intra-governmental holding are now held by foreign investors.41
However, foreign investors may eventu-ally feel that the absolute amount of treasur-ies they hold is simply too high and may stop purchasing U.S. treasuries at the high levels they do today because of the need to diversify their investments. With U.S. interest payments becoming as high as earlier documented, diversification away from a single income stream of that size might not be an unreason-able course of action. The more the U.S. debt increases and the less risk free it appears, the more likely this is to occur. The result would be a smaller pool of potential buyers for treasur-ies, which over time would likely drive up interest rates.
Alternatively, foreign investors might choose to concentrate their buying on short-term debt to shield them from perceived long-term credit risk. This shift in demand for treasuries would impact America’s ability to easily and swiftly change the composition of its debt. This would pressure the U.S. Treasury to issue additional short-term debt, which (as noted previously) puts an undue fiscal bur-den on monetary policy and makes interest payments a more unpredictable portion of the budget.
In addition, there is no absolute guarantee that foreign savings rates will be stable or con-tinue to increase at the same rate as net world-wide issuance of debt. When the United States financed the bulk of its debt domestically, for-eign savings rates were of relatively little con-cern. However, in the future, the United States will increasingly be exposed to interest-rate fluctuations based on the international as well as domestic demand for debt. Either of these scenarios coming to fruition would increase interest rates and therefore the total interest paid by the United States, further crowding out other important domestic investments.
13
The Untold Story Of America’s Debt
THE factors listed in this paper will produce pressure on policy makers until deficits
and the overall size of the debt reach a more manageable level. Solutions that focus solely on cutting spending, raising taxes, or improving GDP growth are unlikely to slow the rising U.S. debt. Moreover, the laudable but inadequate short-term goal of balancing the budget does not address the more fundamental problem of stabilizing the debt so it is no longer growing faster than the economy in the long run—and then beginning to pay it down.
Instead, all deficit reduction plans should be judged at least in part by how well they achieve the goal of significantly slowing the growth of and eventually paying down the U.S. debt. This
would move the conversation toward a more difficult but necessary discussion that de-emphasizes rosy hopes for a decade of uninter-rupted strong growth.
America needs a bigger conversation that speaks directly to the American people about the extent what factors drive our fiscal future. Beyond that, issues in the past which were of smaller concern, such as debt management and the independence of monetary policy, will take on a new significance. The sooner the debate widens to include the real risks posed by the debt, the sooner we can begin to solve these difficult problems.
Conclusion
14

A Deloitte series on making America stronger
Appendix A: Family statistics
U.S. debt numbers can be overwhelming. It is useful to put them into the context of what debt and interest payments mean for the average taxpayer.
Based on IRS data, 144 million individual taxpayers file income taxes in the United States each year.42 This includes individuals who pay no income tax or who receive 100 percent of their income from the government (such as government workers and Social Security
beneficiaries). We include all taxpayers in our analysis, however, because it is likely that all will participate in any future tax increases or benefit reductions.
Figure 6 shows how much each individual taxpayer would need to pay on a monthly basis to cover interest payments at the Federal level or at the level under Deloitte’s alternative fis-cal scenario on average over the course of the next decade.
RENT DUE
CABLE TV BILL
AUTO LOAN BILL
NATIONAL DEBT
INTEREST
NOW DUE:
$255 $424
CURRENT
$255PER MONTH
$424 PER MONTH
ALTERNATIVE SCENARIO
Federal Interest Payments Per Taxpayer Per Month
Figure 6. U.S. government interest payments expressed as average monthly installments for individual taxpayers over the next decade
15
The Untold Story Of America’s Debt
1. Laura Figueroa, “Sen. Marco Rubio Says Leaders Borrowing $4 Billion a Day to Grow Government,” Politifact, April 15, 2011, http://www.politifact.com/florida/statements/2011/apr/15/marco-rubio/sen-marco-rubio-says-leaders-borrowing-4-billion/.
2. State & County Quick Facts, U.S Census Bureau, Data as of May 11, 2012, http://quickfacts.census.gov/qfd/states/00000.html
3. U.S. Debt Clock, http://www.usdebtclock.org/. Calculated May 11, 2011, when U.S debt was estimated at $15,713,300,000 and debt per taxpayer was $138,361
4. Jeff Sessions, “CBO’s Outlook Drastically Under-states Nation’s Debt Path,” Senate Budget Com-mittee, March 1, 2012, http://budget.senate.gov/republican/public/index.cfm/files/serve?File_id=6046f812-8717-47ca-b3d7-44110818f041&SK=47A17851B5A36E31D01F9F67243FFA8C
5. Ibid.
6. “Citizen’s Guide to the 2011 Financial Report of the United States,” Department of Treasury, 2011 http://www.fms.treas.gov/fr/11frusg/11frusg.pdf
7. Timothy Taylor, “Federal Debt on an Accrual Basis,” The Conversable Economist, April 10, 2012, http://convers-ableeconomist.blogspot.com/2012/04/federal-debt-on-accrual-basis.html
8. Ibid.
9. Kenneth Rogoff and Carmen Reinhart, “The Aftermath of Financial Crises”, National Bureau of Economic Research, January 3, 2009, http://papers.nber.org/papers/w14656
10. Ibid.
11. The United States is featured in Rogoff ’s sample. The country’s growth has never been strong during periods of very high debt. The 1950’s is one exception, but while debt was high, budget surpluses were also very high.
12. “The Budget and Economic Outlook: Fiscal Years 2011 to 2021,” Congressional Budget
Office, January 2011, http://www.cbo.gov/ftpdocs/120xx/doc12039/SummaryforWeb.pdf
13. There have been recent years with real growth above 4 percent, but the absolute level of 5.0 percent would be a recent record; “United States GDP Annual Growth Rate,” Trading Economics, http://www.tradingeconomics.com/united-states/gdp-growth-annual.
14. Ibid.
15. “The Budget and Economic Outlook: Fis-cal Years 2012 to 2022,” Congressional Budget Office, January 2012, http://cbo.gov/sites/default/files/cbofiles/attach-ments/01-31-2012_Outlook.pdf
16. Treasury Direct, http://treasury-direct.gov/tdhome.htm
17. Data taken from SIFMA statistics, http://www.sifma.org/research/statistics.aspx.
18. Keith Jenkins and Anchalee Worrachate, “World’s Biggest Economies Face $7.6 Trillion Bond Tab as Rally Seen Fad-ing,” Bloomberg, January 3, 2012, http://www.bloomberg.com/news/2012-01-03/world-s-biggest-economies-face-7-6-trillion-bond-tab-as-rally-seen-fading.html
19. Calculations were based upon data provided by the U.S. Treasury at http://www.treasurydirect.gov/RT/RTGateway?page=institAnnceRes. Assumptions are based on immediate bout of unexpected inflation followed by Federal Reserve action beginning quickly thereafter. Iraq War costs from http://www.infoplease.com/ipa/A0933935.html
20. “Updated Budget Projections: Fiscal Years 2012 to 2022,” Congressional Budget Office, March 13, 2012, http://www.cbo.gov/publication/43119
21. “Restoring America’s Future,” Bipartisan Policy Center Debt Reduction Task Force, November 2010, p. 11. http://www.bipartisanpolicy.org/sites/default/files/BPC%20FINAL%20REPORT%20FOR%20PRINTER%2002%2028%2011.pdf.
Endnotes
16
A Deloitte series on making America stronger
22. “Updated Budget Projections: Fiscal Years 2012 to 2022,” Congressional Budget Office, March 13, 2012, http://www.cbo.gov/publication/43119
23. Kenneth Rogoff and Carmen Reinhart, “Growth in a Time of Debt,” American Economic Review (December 31, 2009), http://www.nber.org/papers/w15639/.
24. “Selected Interest Rates (Daily) - H.15, His-torical Data,” 30-year average from Board of Governors of the Federal Reserve System, http://www.federalreserve.gov/releases/H15/data.htm.
25. “Analysis of CBO’s Budget and Economic Projections and CRFB’s Realistic Baseline,” The Committee for a Responsible Federal Budget, January 31, 2012, http://crfb.org/document/analysis-cbos-budget-and-economic-projections-and-crfbs-realistic-baseline
26. “Updated Budget Projections,” CBO, March 2012, p.2, http://cbo.gov/sites/default/files/cbofiles/attachments/March2012Baseline.pdf.
27. While future actions to tame the deficit may involve entitlement reforms, it’s quite likely that rising deficits will continue to harm the budgets most directly tied to improving America’s competitiveness.
28. Rebuild America’s Schools, http://www.rebuildamericasschools.org/Need.html
29. Florida Department of Transporta-tion, ftp://ftp.dot.state.fl.us/LTS/CO/Estimates/CPM/summary.pdf;
30. National Center for Education Statistics http://nces.ed.gov/fastfacts/display.asp?id=76
31. Martin Grueber, “2012 Global R&D Funding Forecast: Stable Growth of U.S. R&D,” RDMag, December 16, 2011, http://www.rdmag.com/Featured-Articles/2011/12/2012-Global-RD-Funding-Forecast-Stable-Growth-Of-US-RD/
32. “NASA Considers New Uses for $100 Billion Space Station,” Space.com, July 27, 2011, http://www.space.com/12445-nasa-international-space-station-partner-future-options.html
33. “The New Energy Economy: Putting America on the path to solving global warm-ing,” NRDC, May 2008, http://www.nrdc.org/globalwarming/energy/economy.pdf
34. Senator James Inhofe, speech transcript from Senate Committee on Environment and Public Works Committee Business Meeting, Thursday, May 14, 2009, http://epw.senate.gov/public/index.cfm?FuseAction=Minority.PressReleases&ContentRecord_id=3fc7b6d3-802a-23ad-453c-f4ea21fb86b3&Region_id=&Issue_id=
35. To be sure, for American companies with global reach this might not always be the case.
36. Richard H.K. Vietor and Matthew Weinziert, “Macroeconomic policy and U.S. Competitiveness,” Harvard Busi-ness Review, March 2012, p.115.
37. Deloitte Global CFO Program Leader-ship Council Meeting, March 2011 http://www.deloitte.com/view/en_US/us/press/Press-Releases/09c6a0824328e210VgnVCM3000001c56f00aRCRD.htm
38. Megan McArdle,”Europe’s Real Crisis,” The Atlantic, April 2012, http://www.theatlantic.com/magazine/archive/2012/04/europe-8217-s-real-crisis/8915/
39. Annalyn Censky, “Federal Reserve launches Op-eration Twist,” CNN, September 22, 2011, http://money.cnn.com/2011/09/21/news/economy/federal_reserve_operation_twist/index.htm
40. Comeback America, http://keepingamericagreat.org/educate-yourself/learn-the-facts/fiscal-facts/
41. “Major Foreign Holders of Treasury Securities,” U.S. Department of Treasury, http://www.treasury.gov/resource-center/data-chart-center/tic/Documents/mfh.txt
42. State & County Quick Facts, U.S Census Bureau, Data as of May 11, 2012, http://quickfacts.census.gov/qfd/states/00000.html
17

This publication contains general information only, and none of Deloitte Touche Tohmatsu Limited, its member firms, or its and their affiliates are, by means of this publication, rendering accounting, business, financial, investment, legal, tax, or other professional advice or services. This publication is not a substitute for such professional advice or services, nor should it be used as a basis for any decision or action that may affect your finances or your business. Before making any decision or taking any action that may affect your finances or your business, you should consult a qualified professional adviser.
None of Deloitte Touche Tohmatsu Limited, its member firms, or its and their respective affiliates shall be responsible for any loss whatsoever sustained by any person who relies on this publication.
About Deloitte Deloitte refers to one or more of Deloitte Touche Tohmatsu Limited, a UK private company limited by guarantee, and its network of member firms, each of which is a legally separate and independent entity. Please see www.deloitte.com/about for a detailed description of the legal structure of Deloitte Touche Tohmatsu Limited and its member firms. Please see www.deloitte.com/us/about for a detailed description of the legal structure of Deloitte LLP and its subsidiaries. Certain services may not be available to attest clients under the rules and regulations of public accounting.
Copyright © 2012 Deloitte Development LLC. All rights reserved.