the uploads national incident dataset the first twelve … · 2016-03-30 · this report presents...
TRANSCRIPT

UPLOADS Data: 1st June 2014 – 31st May 2015
1
The UPLOADS National Incident Dataset
The First Twelve Months: 1st June 2014 to 31st May 2015
Authors
Dr Michelle van Mulken
Amanda Clacy
Eryn Grant
Dr Natassia Goode
Erin Stevens
Professor Paul Salmon
CENTRE FOR HUMAN FACTORS AND SOCIOTECHNICAL SYSTEMS

UPLOADS Data: 1st June 2014 – 31st May 2015
2
The UPLOADS Research Team
Professor Paul Salmon1
Adjunct Professor Michael Lenne2
Professor Caroline Finch3
Dr Natassia Goode1
Dr Michelle van Mulken1
Eryn Grant1
Amanda Clacy1
1Centre for Human Factors and Sociotechnical Systems, University of the Sunshine Coast
2Australian Centre for Research into Injury in Sport and its Prevention, Federation University
3Monash University Accident Research Centre, Monash University
Funders and Partner Organisations
This project was supported by funding from the Australia Research Council (ARC) in partnership with
Australian Camps Association, Outdoor Educators’ Association of South Australia, Outdoors South
Australia, United Church Camping, Outdoors Victoria, Outdoor Council of Australia, Recreation South
Australia, Outdoor Recreation Industry Council, Outdoors WA, YMCA Victoria, The Outdoor Education
Group, Girl Guides Australia, Wilderness Escape Outdoor Adventures, Venture Corporate Recharge,
Queensland Outdoor Recreation Federation, Christian Venues Association, Parks Victoria, Victorian
Department of Planning and Community Development, Outdoor Education Australia and the
Department of National Parks, Recreation, Sport and Racing Australia (LP110100037). Caroline Finch
was supported by a NHMRC Principal Research Fellowship (ID: 565900). The Australian Centre for
Research into Injury in Sport and its Prevention (ACRISP) is one of the International Research Centres
for Prevention of Injury and Protection of Athlete Health supported by the International Olympic
Committee (IOC). Paul Salmon’s contribution was funded through his current Australian Research
Council Future Fellowship (FT140100681).

UPLOADS Data: 1st June 2014 – 31st May 2015
3
UPLOADS Data: 1st June 2014 – 31st May 2015
4
EXECUTIVE SUMMARY
Aim
This report presents the findings from an analysis of the data contributed to the UPLOADS
National Incident Dataset in the period between the 1st of June 2014 and the 31st May 2015. The aim
of this report is to provide a holistic understanding of the incidents reported during this period within
led outdoor activities in Australia. In addition, feedback is sought from the sector on the presentation
of the findings, to inform the on-going reporting and analysis of the National Incident Dataset.
Method
Organisations collected incident and participation data using the UPLOADS Software Tool and
UPLOADS Lite for twelve months (1st June 2014 to 31st May 2015). De-identified data were submitted
to the research team on a three monthly basis. The data sets were merged and the contributing factors
reported within the incident descriptions were coded using the UPLOADS Accident Analysis Method.
Organisations involved
Thirty-one organisations from across Australia contributed data. These organisations were
operating in the following states and territories (note some organisations operate in multiple states
and territories): ACT (n = 1); NT (n = 1); NSW (n = 8); QLD (n = 6); VIC (n = 12); SA (n = 6); TAS (n =2);
and WA (n = 3).
Data collected
In total, 1020 incidents were reported over the twelve-month period, including 97 incidents
which occurred from February 2013 - May 2014. The historical data were not included in the
calculation of the incidence rates for each activity. However, all reported incidents were included in
the later analyses, including the analysis of the contributing factors, as these are largely descriptive.
Of the reports involving adverse outcomes: 676 reported injuries; 235 reported illnesses; 35 reported

UPLOADS Data: 1st June 2014 – 31st May 2015
5
social or psychological outcomes. In addition, there were 74 reports of near miss incidents. Within
these incidents 7 reported equipment damage; 1 reported a missing or overdue person; and 1
reported environmental damage.
Result Highlights
Injury data
Across all activities, the mean injury-causing incidence rate over the twelve-month period was
2.1 per 1000 participants (n = 676). This means that approximately two injury-causing incidents were
reported for every thousand participants involved in a led outdoor activity. The median injury severity
level was 1 (range: 1 to 5) indicating that the majority of injuries required only localised care with short
term effects.
The activity of walking/running in the outdoors had the highest injury rate (8.2 incidents per
1000 participants) followed by campcraft (i.e. cooking, campfires; 5.7 incidents per 1000 participants)
and snow sports (5.3 incidents per 1000 participants). Notably, just over half (55%) of all activities had
an injury-causing incidence rate of less than 1 per 1000 participants.
The majority of the injured people were Activity Participants. The majority of injured Activity
Participants were female (71% female; 29% male), with a median age of 16 years (range: 10 to 45
years).
Just over half of the reported injuries had sufficient associated information to support further
analysis with the UPLOADS Accident Analysis Method (n = 363). On average, two contributing factors
were identified per injury-causing incident report.
Contributing factors were identified at the four lower levels of the UPLOADS Accident Analysis
Framework (1. Equipment, Environment and Meteorological Conditions, 2. Decisions and Actions of
Leaders, Participants and other Actors at the Scene, 3. Supervisory and Management Decisions and
Actions, and 4. Local Area Government, Schools, Parents & Carers, Higher Level Management). The
most frequently identified contributing factors were: Infrastructure and Terrain (identified in 33% of

UPLOADS Data: 1st June 2014 – 31st May 2015
6
injury incidents analysed); Equipment, Clothing and Personal Protective Equipment (identified in 33%
of injury incidents analysed); Activity Participant Judgement and Decision-making (identified in 33%
of injury incidents analysed); and Activity Participant Experience and Competence (identified in 24%
of injury incidents analysed).
Illness data
Across all activities, the mean reported illness rate was .57 incidents per 1000 participants (n
= 235). This means that less than one incident associated with an illness was reported for every
thousand participants involved in a led outdoor activity. The median severity was 1 (range: 0 to 5)
indicating that the majority of illnesses required only localised care with short term effects.
The activity of camping in tents had the highest illness rate (6.3 incidents per 1000
participants), followed by campcraft (i.e. cooking, campfires; 3.2 incidents per 1000 participants) and
free time in the outdoors (1.7 incidents per 1000 participants). Under half of all activities reported no
illness-causing incidents.
The majority of people reporting illnesses were identified as Activity Participants. The majority
of Activity Participants experiencing an illness were female (84% female, 16% male), with a median
age of 16 years (range: 11 to 18 years).
Less than half of reported illnesses had sufficient associated information to be analysed (n =
86). On average, there were two contributing factors per illness incident report. Factors at the lower
four levels of the UPLOADS Accident Analysis Framework were identified. The most frequently
identified factors were: Activity Participant Mental and Physical Condition (identified in 69% of illness
related incidents analysed); Weather Conditions (identified in 26% of illness related incidents
analysed); Food and Drink (identified in 21% of illness related incidents analysed); and Medication
(identified in 15% of illness related incidents analysed).

UPLOADS Data: 1st June 2014 – 31st May 2015
7
Near miss data
The total number of reported near misses was low in comparison to the reported injuries (n =
74). Across all activities, the mean near miss rate was .2 incidents per 1000 participants. This means
that less than one near miss was reported for every thousand participants involved in a led outdoor
activity. The median potential severity rating was 3 (range: 0 to 6) indicating that most incidents would
have potentially required timely external care (evacuation) with medium to long term effects.
Almost all of the near misses reported had sufficient information to be coded (n = 68). On
average, 2.6 contributing factors were identified per report. Factors across the lower five levels of the
UPLOADS Accident Analysis Framework were identified. The most frequently identified factors were:
Equipment, Clothing and Personal Protective Equipment (identified in 40% of near miss incidents
analysed); Activity Participant Communication and Following Instructions (identified in 22% of near
miss incidents analysed); Activity Participant Experience and Competence (identified in 19% of near
miss incidents analysed); Activity Participant Judgement and Decision-making (identified in 18% of
near miss incidents analysed); and Infrastructure and Terrain (identified in 18% of near miss incidents
analysed).
Conclusion
This report presents the findings from an analysis of the incident data reported through the
sector’s first twelve months use of the UPLOADS Software Tool and UPLOADS Lite. There are a number
of important conclusions that can be taken from the analysis presented.
First, it is concluded that UPLOADS provides the sector with a usable system to report and
analyse participation and incidents. It also shows that it is possible for organisations across the sector
to report usable data that sheds light on contributing factors. Whilst improvements are required to
enhance the uptake of the system and indeed the quality of the data reported, it is clear that UPLOADS
will be an important tool for the sector in their delivery of safe led outdoor activities.

UPLOADS Data: 1st June 2014 – 31st May 2015
8
Second, compared to other sport and active recreation pursuits, the injury rate associated
with led outdoor activities in Australia appears to be low (2.1 per 1000 participants). Caution is urged
when using this figure, however, and further verification via a larger dataset is recommended (i.e.
through the forthcoming 18 and 24 month UPLOADS reports).
Third, as in most complex sociotechnical systems, the analysis shows that adverse events
(injuries, illnesses, and near misses) in led outdoor activities have multiple contributing factors from
across the overall system. Accordingly, incident prevention activities should focus on the network of
contributing factors driving adverse events, as opposed to factors associated only with instructors,
participants, equipment and the activity environment.
As a final note, we would like to acknowledge the sector’s critical role in producing the dataset
described in this report. Without the continued involvement of the sector, it is not possible for
UPLOADS to produce any meaningful analyses. We again thank our funding partners and also those
who went above and beyond the call to contribute incident data. We would also like to urge others to
contribute data in future. It is intended that the continued analysis and dissemination of the UPLOADS
National Incident Dataset will contribute to the efforts to reduce incidents during led outdoor
activities in Australia.
UPLOADS Data: 1st June 2014 – 31st May 2015
9
CONTENTS
EXECUTIVE SUMMARY ........................................................................................................................... 4
The UPLOADS Research Team ............................................................................................................... 2
Funders and Partner Organisations ....................................................................................................... 2
Introduction .......................................................................................................................................... 13
Method ................................................................................................................................................. 14
How to read this report ........................................................................................................................ 21
Results................................................................................................................................................... 22
Injury-causing incidents .................................................................................................................... 24
Incidents associated with illnesses ................................................................................................... 50
Near miss incidents ........................................................................................................................... 63
Discussion ............................................................................................................................................. 79
Conclusion ............................................................................................................................................ 83

UPLOADS Data: 1st June 2014 – 31st May 2015
10
List of Tables
Table 1: Definitions provided for incident, adverse outcome and near miss ....................................... 15
Table 2: Incident Severity Scale ............................................................................................................ 16
Table 3: Information captured concerning incidents by UPLOADS ...................................................... 17
Table 4. Actual severity ratings and frequency of injuries sustained according to injury location and
type ........................................................................................................................................ 28
Table 5: Contributing factors related to each category represented on the AcciMap at the “Local Area
Government, Schools, Parents & Carers, Higher Level Management” level ........................ 35
Table 6: The relationships between ‘Higher Level Management’, ‘Parents & Carers’ and other factors,
influencing the conduct of activities ..................................................................................... 36
Table 7: Contributing factors related to each category represented on the AcciMap at the
‘Supervisory and Management Decisions and Actions’ level ................................................ 37
Table 8: The relationships between ‘Supervisory and Management Decisions’ and other factors,
influencing the conduct of activities ..................................................................................... 37
Table 9: Contributing factors related to ‘Activity Group’, ‘Other People in the Activity Group’ and
‘Other People in Activity Environment’ categories ............................................................... 38
Table 10: The relationships between ‘Activity Group Factors’ and other factors, influencing the
conduct of activities .............................................................................................................. 39
Table 11: Contributing factors related to ‘Activity Leader’ categories ................................................. 40
Table 12: The relationships between ‘Activity Leader’ and other factors, influencing the conduct of
activities ................................................................................................................................. 41
Table 13: Contributing factors related to ‘Activity Participant’ categories .......................................... 42
Table 14: The relationships between ‘Activity Participant’ factors and other factors, influencing the
conduct of activities .............................................................................................................. 45
Table 15: Contributing factors related to ‘Activity Environment’ categories ....................................... 47
Table 16: Contributing factors related to ‘Activity Equipment’ categories .......................................... 48
Table 17: The relationships between ‘Activity Equipment & Resources’ and ‘Activity Environment’
impacting the conduct of activities ....................................................................................... 49
Table 18: Contributing factors underpinning each category represented on the AcciMap at the ‘Local
Area Government, Schools, Parents & Carers, and Higher Level Management’ level .......... 57
Table 19: The relationships between ‘Parents & Carers’, ‘Schools’ and ‘Activity Equipment and
Resources’, influencing the conduct of activities .................................................................. 58
Table 20: Contributing factors related to ‘Supervisory and Management Decisions and Actions’ ...... 58
Table 21: The relationship between ‘Supervisor/Field Manager’ and ‘Activity Environment’,
influencing the conduct of activities ..................................................................................... 58
Table 22: Contributing factors related to ‘Other People in Activity Group’ and ‘Activity Leader’
categories .............................................................................................................................. 59
Table 23: The relationship between ‘Activity Leader’ and lower level factors, influencing the conduct
of activities ............................................................................................................................ 59
Table 24: Contributing factors related to ‘Activity Participant’ categories .......................................... 60
Table 25: The relationships between ‘Activity Participant’ and lower level factors, influencing the
conduct of activities .............................................................................................................. 61
Table 26: Contributory factors related to ‘Activity Equipment & Resources’ categories ..................... 61
Table 27: Contributory factors related to ‘Activity Environment’ categories ...................................... 62
Table 28: The impact of the “Activity Environment and Equipment” and other factors ..................... 62
Table 29: Contributing factors underpinning each category represented on the AcciMap at the ‘Local
area government, Schools, Parents & Carers, Higher Level Management’ level .................. 70

UPLOADS Data: 1st June 2014 – 31st May 2015
11
Table 30: The relationships between ‘Local Area Government, Schools, Parents & Carers, Higher
Level Management’ and ‘Activity Equipment & Resources’, influencing the conduct of
activities ................................................................................................................................. 71
Table 31: Contributing factors underpinning each category represented on the AcciMap at the
‘Supervisory and Management Decisions and Actions’ level ................................................ 71
Table 32: Relationships between ‘Supervisory and Management Decisions and Actions’ and lower
level factors, influencing the conduct of activities ................................................................ 72
Table 33: Contributing factors related to ‘Other People in the Activity Group’ and ‘Activity Group’
categories .............................................................................................................................. 72
Table 34: Contributing factors related to ‘Activity Leader’ categories ................................................. 73
Table 35: Relationships between Activity Leaders and other factors, influencing the conduct of
activities ................................................................................................................................. 74
Table 36: Contributing factors related to ‘Activity Participant’ categories .......................................... 75
Table 37: Relationships between ‘Activity Participant’ and other factors, influencing the conduct of
activities. ................................................................................................................................ 77
Table 38: Contributing factors related to ‘Activity Environment’ and ‘Activity Equipment’ categories
............................................................................................................................................... 77

UPLOADS Data: 1st June 2014 – 31st May 2015
12
List of Figures
Figure 1: UPLOADS Accident Analysis Method. .................................................................................... 20
Figure 2: Total number of reports associated with each type of incident outcome. ........................... 23
Figure 3: Injury-causing incident rate per 1000 participants by activity type. ..................................... 25
Figure 4: Actual severity ratings for injury-causing incidents. .............................................................. 26
Figure 5: Type and frequency of injuries sustained according to body location. . ............................... 27
Figure 6: Number of people injured by role and gender. ..................................................................... 31
Figure 7: The number of injury-causing incidents by actual severity rating. ........................................ 33
Figure 8: Factors and relationships identified as contributors to injury-causing incidents .................. 34
Figure 9: Illness rate per 1000 participants by activity type. ................................................................ 51
Figure 10: Severity ratings for illness related incidents. ....................................................................... 52
Figure 11: Number of people with an illness by role and gender. ........................................................ 53
Figure 12: The number of incidents associated with illnesses by actual severity rating. ..................... 55
Figure 13: Factors and relationships identified as contributors to illness related incidents. ............... 56
Figure 14: Near miss incidence rate per 1000 participants by activity type. ........................................ 64
Figure 15: Number of people involved in near miss incidents by role and gender. ............................. 65
Figure 16: Potential severity ratings for near miss incidents. ............................................................... 66
Figure 17: The number of near miss incidents by potential severity rating.. ....................................... 67
Figure 18: Factors and relationships identified as contributors to near miss incidents. ...................... 69

UPLOADS Data: 1st June 2014 – 31st May 2015
13
Introduction
For the past six years, the authors have been engaged in a major program of research that
aims to tackle issues around injury causation and incident reporting and analysis in the led outdoor
activity sector in Australia. Known as UPLOADS, one of the major goals is to develop an incident
reporting system that allows led outdoor activity providers in Australia to contribute incident data to
a National Incident Dataset. The project is supported by an Australian Research Council Linkage grant
and a range of stakeholders from the outdoor sector (see Funders and Partner Organisations section).
The project has involved the following stages: 1) development of an accident analysis method
for analysing led outdoor activity incidents (Goode, Salmon, Lenné, & Finch, 2014; Salmon, Cornelissen,
& Trotter, 2012; Salmon, Goode, Lenné, Finch, & Cassell, 2014; Salmon, Williamson, Lenné,
Mitsopoulos-Rubens, & Rudin-Brown, 2010); 2) development of a prototype incident reporting system
(Goode, Finch, Cassell, Lenné, & Salmon, 2014); 3) trial of the prototype incident reporting system; 4)
reliability, validity and usability testing and refinement of the prototype (Grant et al., 2015; Taylor,
Goode, Salmon, Lenné, & Finch, 2015; Taylor, Goode, Salmon, Lenné, & Finch, 2015); and 5)
implementation of the final UPLOADS system in organisations across Australia from the 1st June 2014.
The accident analysis method was developed to ensure that contributing factors, and the
relationships between them, are reliably identified from the qualitative data collected through the
National Incident Dataset. The method is underpinned by a systems-theory model of accident
causation (Rasmussen, 1997), and consists of taxonomy for coding the qualitative descriptions of
incidents and a framework for representing the system of factors identified (see Figure 1). This
approach ensures that all epidemiological data reporting the rate and type of incidents is accompanied
by detailed analyses of the contributing factors involved.
This reports presents an analysis of the first twelve months of data collected via UPLOADS (1st
June 2014 – 31st May 2015). The aim is to present a detailed overview of all the data collected, to
provide a holistic understanding of the incidents that occur during led outdoor activities in Australia.

UPLOADS Data: 1st June 2014 – 31st May 2015
14
In addition, feedback will be sought from the sector on the presentation of the findings, to inform the
ongoing reporting of the National Incident Dataset.
Although the UPLOADS project team analysed all contributed incident reports, it is important
to note that all factors and relationships identified were reported by the participants who completed
the incident reports (activity leaders, activity centre managers, etc.), not by the UPLOADS project team.
This report presents the issues highlighted by the led outdoor activity sector and outlines some of the
key implications for the sector.
Method
Design
Self-nominated personnel from participating organisations used the incident reporting system
to collect data for twelve months (1st June 2014 to 31st May 2015). The University of the Sunshine
Coast Human Ethics Committee approved the study.
Recruitment
Organisations were invited to participate via peak body and professional membership
association newsletters. Interested organisations were asked to invite a senior staff member in a
safety-related role to participate in the study. This person, thereafter referred to as the ‘system
administrator’, was responsible for undertaking training in the system (described below), collecting
and entering all data, and providing training to other staff within their organisations on reporting
incidents. Forty-three (43) organisations had signed up to participate for the 1st June 2014 –31st May
2015 period.
UPLOADS Data: 1st June 2014 – 31st May 2015
15
Data collection
Two incident reporting and learning systems were developed to meet the needs of the diverse
Australian outdoor education and recreation sector: the UPLOADS Software tool and UPLOADS Lite.
The mandatory information captured by both systems is the same.
The UPLOADS Software Tool allows organisations to: 1) systematically track their incident and
participation data; 2) analyse their own incidents using a systems analysis framework; 3) generate
automatic reports on the data they collect; and 4) contribute de-identified data (i.e. names removed)
to the National Incident Dataset. The software tool is installed on a computer within the organisation
and the data is not directly accessible by the research team.
UPLOADS Lite was designed for organisations who only want to contribute data to the
National Incident Dataset. An online survey tool allows organisations to contribute completely
anonymous incident reports. Organisations are also able to save the data they enter for their own
records. Participation data is submitted at three monthly intervals using a spreadsheet.
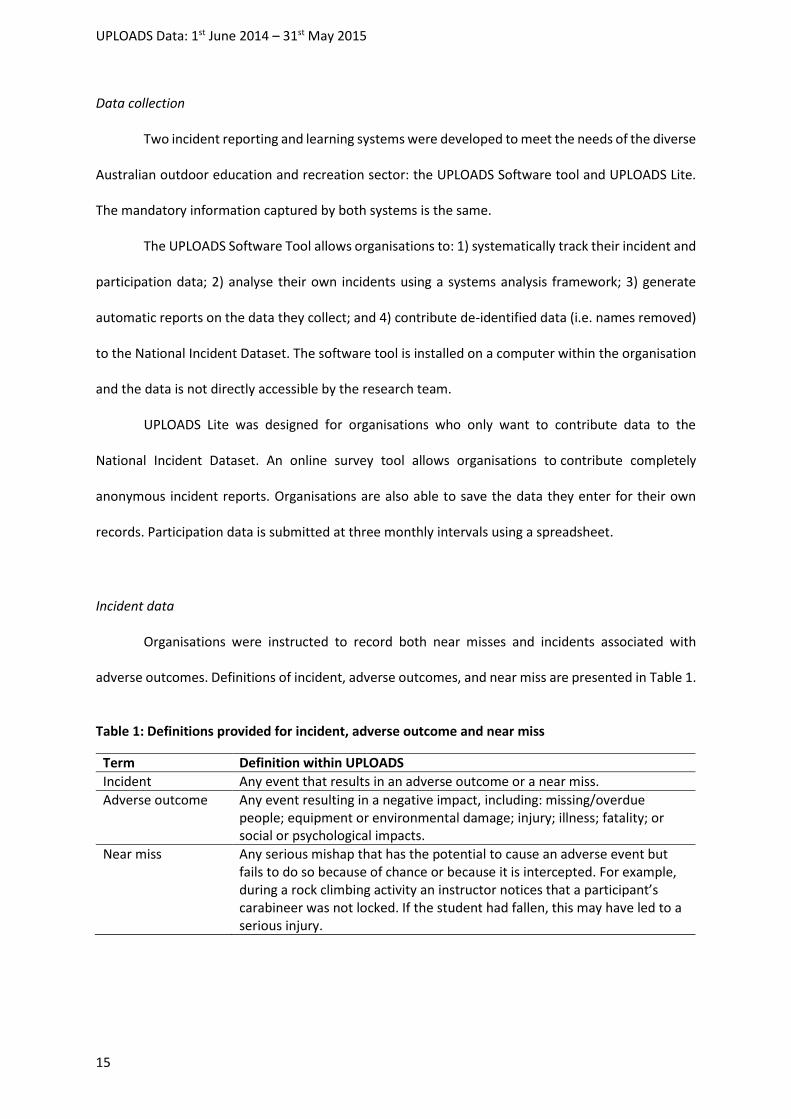
Incident data
Organisations were instructed to record both near misses and incidents associated with
adverse outcomes. Definitions of incident, adverse outcomes, and near miss are presented in Table 1.
Table 1: Definitions provided for incident, adverse outcome and near miss
Term Definition within UPLOADS
Incident Any event that results in an adverse outcome or a near miss.
Adverse outcome Any event resulting in a negative impact, including: missing/overdue people; equipment or environmental damage; injury; illness; fatality; or social or psychological impacts.
Near miss Any serious mishap that has the potential to cause an adverse event but fails to do so because of chance or because it is intercepted. For example, during a rock climbing activity an instructor notices that a participant’s carabineer was not locked. If the student had fallen, this may have led to a serious injury.
UPLOADS Data: 1st June 2014 – 31st May 2015
16
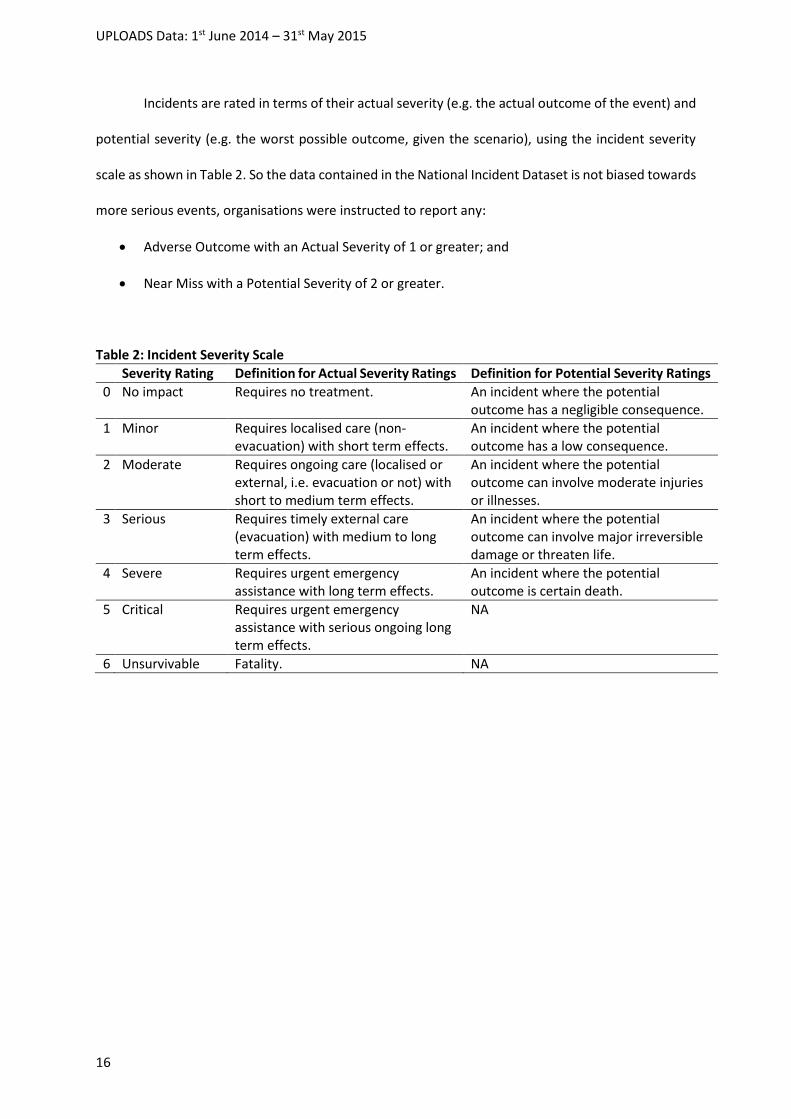
Incidents are rated in terms of their actual severity (e.g. the actual outcome of the event) and
potential severity (e.g. the worst possible outcome, given the scenario), using the incident severity
scale as shown in Table 2. So the data contained in the National Incident Dataset is not biased towards
more serious events, organisations were instructed to report any:
Adverse Outcome with an Actual Severity of 1 or greater; and
Near Miss with a Potential Severity of 2 or greater.
Table 2: Incident Severity Scale
Severity Rating Definition for Actual Severity Ratings Definition for Potential Severity Ratings
0 No impact Requires no treatment. An incident where the potential outcome has a negligible consequence.
1 Minor Requires localised care (non-evacuation) with short term effects.
An incident where the potential outcome has a low consequence.
2 Moderate Requires ongoing care (localised or external, i.e. evacuation or not) with short to medium term effects.
An incident where the potential outcome can involve moderate injuries or illnesses.
3 Serious Requires timely external care (evacuation) with medium to long term effects.
An incident where the potential outcome can involve major irreversible damage or threaten life.
4 Severe Requires urgent emergency assistance with long term effects.
An incident where the potential outcome is certain death.
5 Critical Requires urgent emergency assistance with serious ongoing long term effects.
NA
6 Unsurvivable Fatality. NA

UPLOADS Data: 1st June 2014 – 31st May 2015
17
The UPLOADS Software Tool captures the incident-related information described in Table 3.
Table 3: Information captured concerning incidents by UPLOADS
1. Incident characteristics
Was the reporter present at the incident?
Date/Time
State/Territory
Type of incident (adverse outcome/near miss)
Actual severity rating
Potential severity rating
Activity associated with the incident
Number of people involved in activity (participants, activity leaders, supervisors, volunteers)
Did the activity leader have relevant qualifications?
2. Adverse outcomes (if applicable)
2.1. Outcomes involving injuries, illnesses or social/psychological damage
Person affected
Experience in activity associated with the incident
Was the incident fatal?
Injury type
Injury location
Illness
Social/psychological impacts
Treatment at the scene of the incident
Evacuation method
Were emergency services called?
2.2 Outcomes involving missing or overdue people
Were clients or staff missing or overdue?
Were Emergency Services contacted/engaged in search?
2.3 Outcomes involving equipment loss/damage
Was equipment lost/damaged?
2.4 Outcomes involving environmental damage
Was there environmental damage?
3. Description
Describe the incident in detail, include: who was involved, what happened, when it happened, where it happened and any equipment involved. Describe any relevant events leading up to incident.
4. Contributing factors and relationships
Reporter: explain in detail what you think caused the incident, including any relationships between causes, include suggestions, comments and recommendations. Manager: explain in detail what you think caused the incident, including any relationships between causes, include suggestions, comments and recommendations.
UPLOADS Data: 1st June 2014 – 31st May 2015
18
Participation data
Organisations recorded the total number of participants and participation days for each activity
conducted during a calendar month. A participation day was defined as a day on which a participant
was exposed to the activity (Dickson, 2012). In this report, the total number of participants was
summed for each activity to provide a denominator for incidence rate calculations (i.e. rate per 1000
participants). Participation days were not included in the analysis, as the initial check of the data
revealed that some values were outside the range of possible values (e.g. indicating that data had
been entered incorrectly).
Data analysis
Demographic statistics were calculated in SPSS statistics (version 21) using the participation
data supplied by each organisation. This included: participant age and sex; size of group; number of
supervisors present; and the qualifications of group leaders. The de-identified incident data from all
organisations was merged into a central database. The actual severity scores for all adverse outcomes
were verified against the incident description, and re-coded as required. Descriptive analyses were
performed to calculate frequencies for each variable.
Two researchers from the University of the Sunshine Coast used the UPLOADS Accident
Analysis Method (see Figure 1) to code the qualitative data provided in each report. This involved
identifying contributing factors and relationships from each report, and using the taxonomy in Figure
1 to classify them. Each researcher checked the other’s coding and the few disagreements were
resolved through discussion. Frequency counts of the number of incidents associated with each factor
and relationship were then calculated. The factors and relationships were then represented on the
framework for injuries, illnesses and near misses incident reports.
Participation data was merged into a single Excel file. It included details on 76 different
activities. Activities were grouped into 20 categories. For example, the category “walking/running
outdoors” included bushwalking, orienteering and adventure races. The category “river activities”

UPLOADS Data: 1st June 2014 – 31st May 2015
19
included canoeing, rafting and kayaking (see Appendix A for a full list of activities). Activities were
clustered using higher order classifications (see Appendix A), which were informed by industry
professionals. Incidence rates and severity ratings were calculated for each incident type by activity.
Incidence rates were calculated per 1000 participants ((number of incidents/number of participants)
x 1000)) for each activity. The rate was then averaged across all activities to provide an estimate of
the overall rate. Locations of physical injuries were mapped using data from the incident reports to
inform anatomical diagrams in Visio. Frequencies of confounding factors such as weather conditions
and activity goals were also calculated for all incident types.

UPLOADS Data: 1st June 2014 – 31st May 2015
20
Figure 1: UPLOADS Accident Analysis Method, which was used to code the qualitative data provided in each incident report

UPLOADS Data: 1st June 2014 – 31st May 2015
21
How to read this report
The report begins by presenting an overview of the organisations that contributed data and
the data collected. The report is then split into three main sections: Injury Data, Illness Data, and Near
Miss Data. Each section starts with an overview of the data collected and a summary of the
characteristics of the incidents involved. This is followed by an analysis of the contributing factors
involved in the incidents. The analysis of the contributing factors includes a diagram of the
contributing factors and relationships between them (referred to as an AcciMap), and Tables which
provide specific examples of the contributing factors and relationships that are represented in the
diagram.
Reading the AcciMaps and Tables
The AcciMaps represent a summary of the network of contributing factors and relationships
between them that were identified in the incidents. The boxes include information detailing the
number of times each category of contributing factor was identified across all of the incidents reported.
The boxes shaded in grey represent categories of contributing factors that were identified in more
than one incident. The lines linking the boxes represent relationships between the contributing factors
as identified by the activity providers. These relationships describe how contributing factors are
influenced by other contributing factors. For example, a line between ‘Activity Equipment & Resources:
Equipment, clothing and Personal Protective Equipment’ and ‘Higher Level Management: Financial
Constraints’ could indicate that old equipment was not replaced by new equipment due to financial
constraints (note, the corresponding tables provide a more detailed description of each relationship).
The lines also show the number of times a relationship was identified across all of the incidents, and
are bold when a relationship was identified in more than one incident.
In order to understand the AcciMaps, it is recommended to look at the corresponding tables
which provide specific examples of contributing factors and relationships derived from the incidents
reported. This information describes the specific problems that were identified by the reporting

UPLOADS Data: 1st June 2014 – 31st May 2015
22
organisations as causing the incidents. The tables discuss the contributing factors and relationships
from top (i.e. higher levels in AcciMap) to bottom (i.e. lower levels in AcciMap) and (generally) from
left to right. This means, for example, that if wishing to find more information around the relationship
between “Supervisor/Field Manager: Activity Design” and “Activity Participant: Mental and Physical
Condition”, then the relationships table related to “Supervisor/Field Manager: Activity Design” would
need to be revised. Reading the AcciMaps and tables together will provide an overview of all the
factors that are contributing to incidents during led outdoor activities, and the specific issues
underpinning them.
Results
Sample of organisations contributing data
Thirty-one organisations from across Australia contributed data. These organisations were
operating in the following states and territories (note that some organisations operate in multiple
states and territories): ACT (n = 1); NT (n = 1); NSW (n = 8); QLD (n = 6); VIC (n = 12); SA (n = 6); TAS (n
=2); and WA (n = 3). Five organisations identified as schools, and eight organisations identified as
registered training organisations (e.g. TAFE, University). Eleven organisations identified as not-for-
profits, thirteen identified as commercial enterprises, and four as government agency or public sector
organisations.
System administrator demographics
The majority (71%) of system administrators were male (22 male, 9 female), with a median of
16.9 years’ experience in the outdoor sector (range: 4 to 28 years). Thirty held a management role
within their organisation, and twenty-four led activities as part of their current role.
UPLOADS Data: 1st June 2014 – 31st May 2015
23
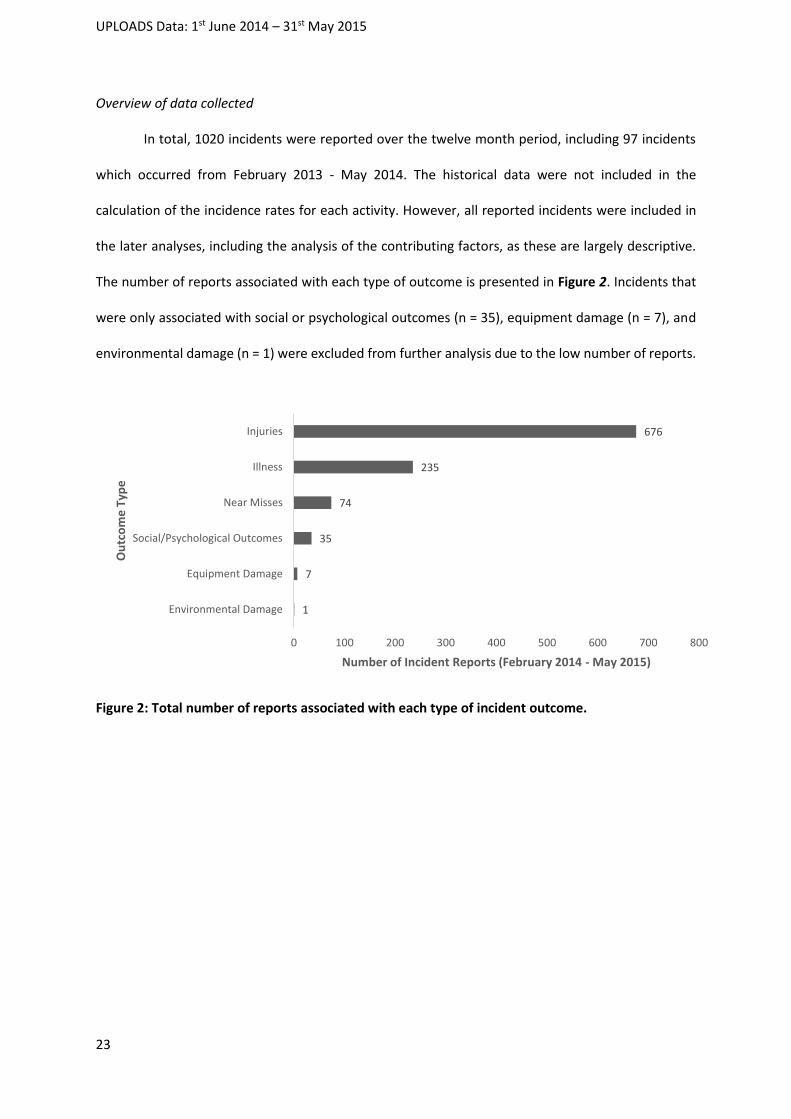
Overview of data collected
In total, 1020 incidents were reported over the twelve month period, including 97 incidents
which occurred from February 2013 - May 2014. The historical data were not included in the
calculation of the incidence rates for each activity. However, all reported incidents were included in
the later analyses, including the analysis of the contributing factors, as these are largely descriptive.
The number of reports associated with each type of outcome is presented in Figure 2. Incidents that
were only associated with social or psychological outcomes (n = 35), equipment damage (n = 7), and
environmental damage (n = 1) were excluded from further analysis due to the low number of reports.
Figure 2: Total number of reports associated with each type of incident outcome.
1
7
35
74
235
676
0 100 200 300 400 500 600 700 800
Environmental Damage
Equipment Damage
Social/Psychological Outcomes
Near Misses
Illness
Injuries
Number of Incident Reports (February 2014 - May 2015)
Ou
tco
me
Typ
e

UPLOADS Data: 1st June 2014 – 31st May 2015
24
Injury-causing incidents
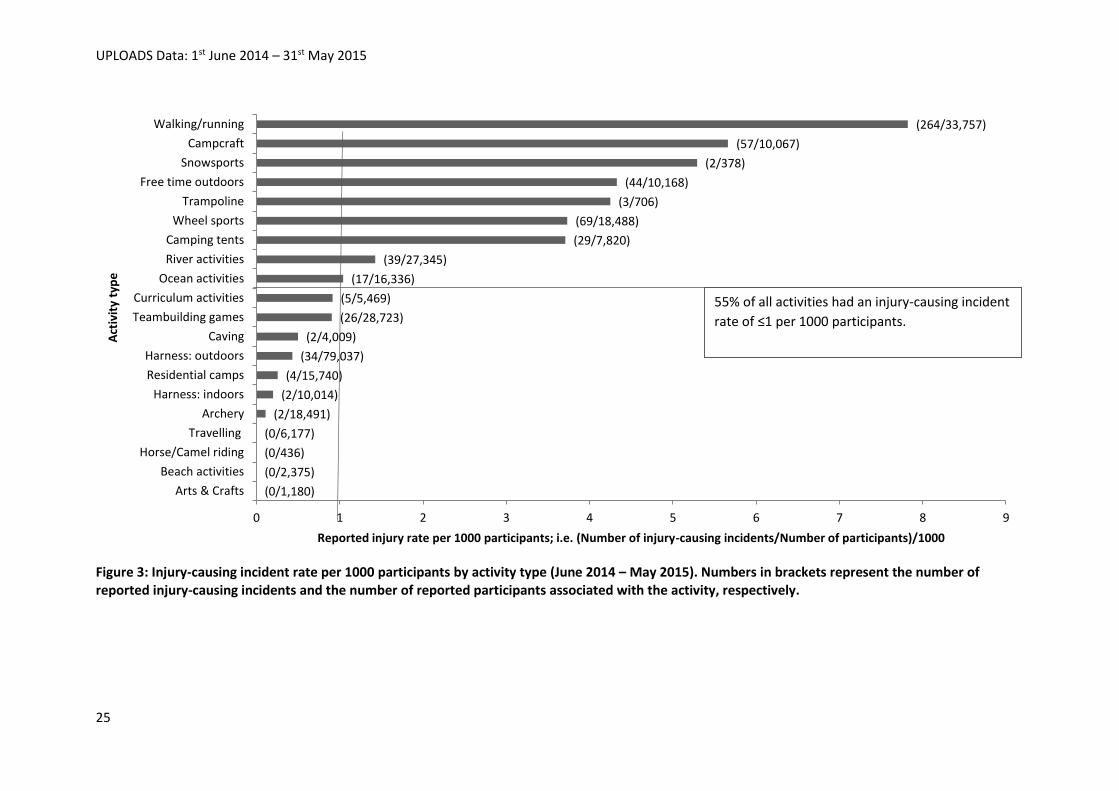
In total, 676 injury-causing incidents were analysed. This included 625 incidents reported
during the twelve-month period and 51 historical incident reports which occurred from February 2014
to June 2014. The historical data were not included in the calculation of the incidence rates for each
activity. However, all reported incidents were included in the later analyses, including the analysis of
the contributing factors, as these are largely descriptive. Across all activities, the average reported
injury rate was 2.1 per 1000 participants. This means that approximately two injury-causing incidents
were reported for every thousand participants involved in a led outdoor activity.
Figure 3 presents a summary of the injury-causing incidence rate per 1000 participants by
activity type (see Appendix A for a full list of activities). Injury-causing incidents not related to an
activity or program were excluded from the Figure (n = 27). Walking/running in the outdoors had the
highest injury-causing incidence rate (8.2 incidents per 1000 participants), followed by campcraft (i.e.
cooking, campfires; 5.7 incidents per 1000 participants) and snow sports (5.3 incidents per 1000
participants). Notably, just over half (55%) of the activity types had an injury-causing incidence rate of
less than 1 per 1000 participants, indicated by the cross section in Figure 3.
UPLOADS Data: 1st June 2014 – 31st May 2015
25
Figure 3: Injury-causing incident rate per 1000 participants by activity type (June 2014 – May 2015). Numbers in brackets represent the number of reported injury-causing incidents and the number of reported participants associated with the activity, respectively.
(0/1,180)
(0/2,375)
(0/436)
(0/6,177)
(2/18,491)
(2/10,014)
(4/15,740)
(34/79,037)
(2/4,009)
(26/28,723)
(5/5,469)
(17/16,336)
(39/27,345)
(29/7,820)
(69/18,488)
(3/706)
(44/10,168)
(2/378)
(57/10,067)
(264/33,757)
0 1 2 3 4 5 6 7 8 9
Arts & Crafts
Beach activities
Horse/Camel riding
Travelling
Archery
Harness: indoors
Residential camps
Harness: outdoors
Caving
Teambuilding games
Curriculum activities
Ocean activities
River activities
Camping tents
Wheel sports
Trampoline
Free time outdoors
Snowsports
Campcraft
Walking/running
Reported injury rate per 1000 participants; i.e. (Number of injury-causing incidents/Number of participants)/1000
Act
ivit
y ty
pe
55% of all activities had an injury-causing incident
rate of ≤1 per 1000 participants.

UPLOADS Data: 1st June 2014 – 31st May 2015
26
Actual severity ratings for injury-causing incidents
Figure 4 shows a histogram of actual severity scores for injury-causing incidents. The median
severity was 1 (range: 1 to 5) indicating that the majority of injuries required only localised care with
short term effects.
Figure 4: Actual severity ratings for injury-causing incidents (total number of injuries = 676).
These ratings are supported by the findings regarding evacuation, hospitalisation and
emergency services. One hundred and eleven (16%) injury-causing incidents were reported as
requiring evacuation (Vehicle = 58; Walked out = 47; Stretcher = 4; Boat = 1; Helicopter = 1), of which
42 required hospitalisation and 9 required Emergency Services. Evacuations were comprised of 45
severity rating 1 incidents, 49 severity rating 2 incidents, 15 severity rating 3 incidents, and both
severity rating 4 and 5 incidents (n = 1 each).
Injury type and location
Figure 5 shows the type and frequency of injuries sustained according to body location.
Highlighted in red are the body locations associated with the most injury causing incidents. In addition
577
76
211 1
0
100
200
300
400
500
600
1 2 3 4 5
Nu
mb
er
of
Inju
ry-c
ausi
ng
Inci
de
nts
Actual Severity Rating

UPLOADS Data: 1st June 2014 – 31st May 2015
27
to those shown on the diagram, 14 of the 676 injury-causing incidents involved injuries to multiple
body regions, and 27 incidents in which people sustained injuries to unspecified body regions. Table
4 presents the actual severity ratings and frequency of injuries sustained according to body location
and injury type.
Abdomen, lower back, lumbar spine and
pelvis 5% (n = 32)
Superficial e.g. abrasion, blister, insect
bite (13)
Dislocation, sprain and strain (8)
Injury to muscle, fascia and tendon (2)
Injury to nerves or spinal cord (2)
Other and unspecified (7)
Ankle and foot 35% (n = 233)
Superficial e.g. abrasion, blister,
insect bite (143)
Dislocations, sprains and strains (61)
Fracture (3)
Crushing (2)
Injury to muscle, fascia and tendon (5)
Open wound (4)
Burns and corrosions (3)
Other and unspecified (12)
Elbow and forearm 3% (n = 18)
Superficial e.g. abrasion,
blister, insect bite (10)
Dislocations, sprains and
strains (6)
Fracture (1)
Burns and corrosions (1)
Head 9.5% (n = 63)
Superficial injury e.g. abrasion, blister, insect bite (21)
Burns and corrosions (4)
Effects of foreign body entering through natural orifice (3)
Injury to muscle, fascia and tendon (2)
Open wound (4)
Other and unspecified (29)
Hip and thigh 4% (n = 32)
Burns and corrosions (2)
Dislocation, sprain and strain (2)
Open wound (1)
Injury to muscle, fascia and tendon (1)
Crushing injury (1)
Superficial injury e.g. abrasion, blister,
insect bite (21)
Other and unspecified (4)
Knee and lower leg 16% (n = 112)
Burns and corrosions (10)
Dislocation, sprain and strain (10)
Injury to muscle, fascia and tendon (9)
Injury to nerves or spinal cord (1)
Open wound (7)
Superficial injury e.g. abrasion, blister,
insect bite (59)
Other and unspecified (16)
Neck <1% (n = 7)
Dislocation, sprain and strain (2)
Injury to muscle, fascia and tendon (1)
Injury to nerves or spinal cord (2)
Superficial injury e.g. abrasion, blister, insect bite
(2)
Shoulder and upper arm 2.5% (n = 18)
Dislocation, sprain and strain (11)
Injury to muscle, fascia and tendon (1)
Superficial injury e.g. abrasion, blister,
insect bite (5)
Other and unspecified (1)
Wrist and hand 17% (n = 117)
Burns and corrosions (15)
Crushing (1)
Dislocations, sprains and strains (13)
Fractures (4)
Injury to muscle, fascia and tendon (2)
Open wound (6)
Other and unspecified (5)
Superficial injury e.g. abrasion, blister,
insect bite (71)
Chest/Thorax <1% (n = 3)
Dislocation, sprain and strain (1)
Crushing injury (1)
Other and unspecified (1)
O O
O O
OO
Figure 5: Type and frequency of injuries sustained according to body location. Most frequently injured locations are highlighted by a red circle.

UPLOADS Data: 1st June 2014 – 31st May 2015
28
Table 4. Actual severity ratings and frequency of injuries sustained according to injury location and type
Actual severity rating Injury location n Main type of injury
1 (n = 577) Ankle/Foot 213 Superficial injury (n = 142); Dislocation, sprain and strain (n = 49)
Wrist/Hand 103 Superficial injury (n = 68); Burns and corrosions (n = 14)
Knee/Lower leg 93 Superficial injury (n = 54); Burns and corrosions (n = 8)
Head/Face 47 Superficial injury (n = 18); Other/unspecified (n = 10)
Hip/Thigh 30 Superficial injury (n = 19); Burns/corrosions (n = 2); Dislocation, sprain and strain (n = 2)
Abdomen/Lower back/Lumbar spine/Pelvis 25 Superficial injury (n = 12); Dislocation, sprain and strain (n = 6)
Unspecified 21 Superficial injury (n = 7); Burns and corrosions (n = 3)
Shoulder/Upper arm 14 Dislocation, sprain and strain (n = 8); Superficial injury (n = 4)
Elbow/Forearm 13 Superficial injury (n = 8); Dislocation, sprain and strain (n = 3)
Multiple body regions 11 Superficial injury (n = 2)
Neck 5 Injury to nerves/muscles/spinal cord (n = 2)
Chest/Thorax 2 Dislocation, sprain and strain (n = 1)
UPLOADS Data: 1st June 2014 – 31st May 2015
29
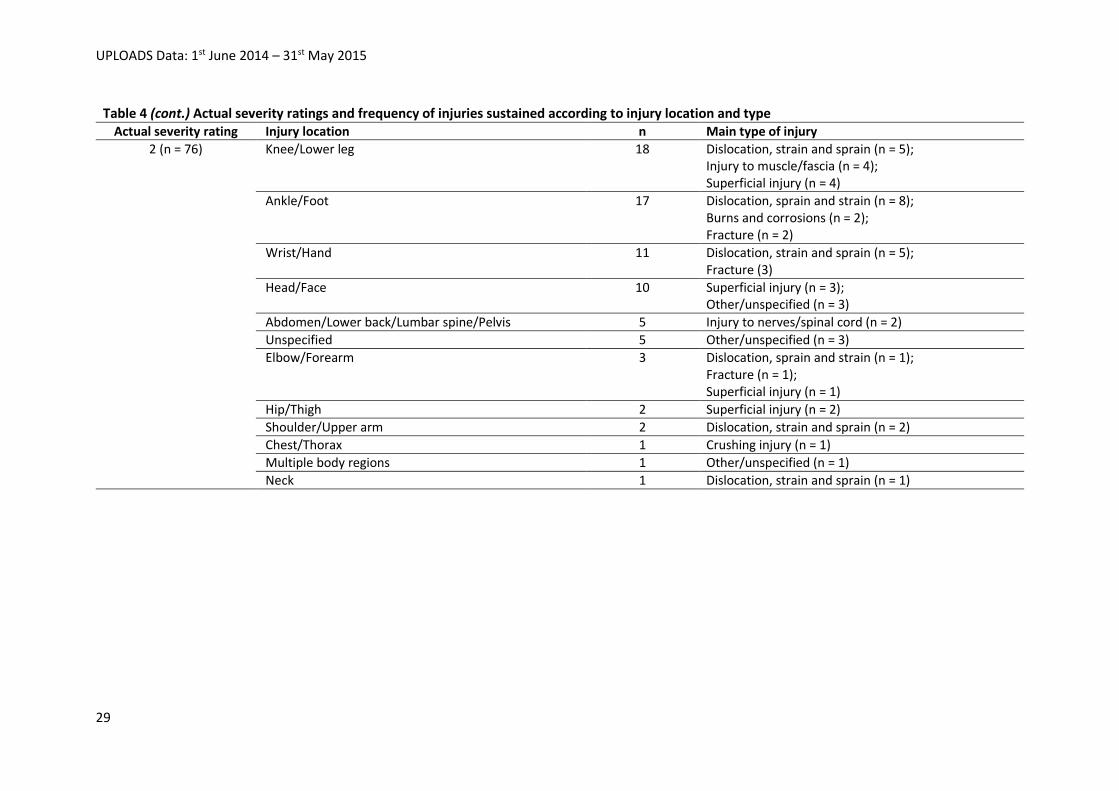
Table 4 (cont.) Actual severity ratings and frequency of injuries sustained according to injury location and type
Actual severity rating Injury location n Main type of injury
2 (n = 76) Knee/Lower leg 18 Dislocation, strain and sprain (n = 5); Injury to muscle/fascia (n = 4); Superficial injury (n = 4)
Ankle/Foot 17 Dislocation, sprain and strain (n = 8); Burns and corrosions (n = 2); Fracture (n = 2)
Wrist/Hand 11 Dislocation, strain and sprain (n = 5); Fracture (3)
Head/Face 10 Superficial injury (n = 3); Other/unspecified (n = 3)
Abdomen/Lower back/Lumbar spine/Pelvis 5 Injury to nerves/spinal cord (n = 2)
Unspecified 5 Other/unspecified (n = 3)
Elbow/Forearm 3 Dislocation, sprain and strain (n = 1); Fracture (n = 1); Superficial injury (n = 1)
Hip/Thigh 2 Superficial injury (n = 2)
Shoulder/Upper arm 2 Dislocation, strain and sprain (n = 2)
Chest/Thorax 1 Crushing injury (n = 1)
Multiple body regions 1 Other/unspecified (n = 1)
Neck 1 Dislocation, strain and sprain (n = 1)

UPLOADS Data: 1st June 2014 – 31st May 2015
30
Table 4 (cont.) Actual severity ratings and frequency of injuries sustained according to injury location and type
Actual severity rating Injury location n Main type of injury
3+ (n = 23) Head/Face 6 Other/unspecified (n = 5); Injury to muscle/fascia (n = 1)
Ankle/Foot 3 Dislocation, strain and sprain (n = 2)
Wrist/Hand 3 Superficial injury (n = 2)
Elbow/Forearm 2 Dislocation, strain and sprain (n = 2)
Multiple body regions 2 Injury to nerves/spinal cord (n = 1); Other/unspecified (n = 1)
Abdomen/Lower back/Lumbar spine/Pelvis 2 Dislocation, strain and sprain (n = 1); Other/unspecified (n = 1)
Shoulder/Upper arm 2 Dislocation, sprain and strain (n = 1); Superficial injury (n = 1)
Neck 1 Injury to nerves/spinal cord (n = 1)
Knee/Lower leg 1 Superficial injury (n = 1)
Unspecified 1 Other/unspecified (n = 1)
Hip/Thigh 0
Chest/Thorax 0

UPLOADS Data: 1st June 2014 – 31st May 2015
31
Demographic information for injured people
The reports included details on 400 injured people (there were missing details on the person
injured in the other 276 reports). Figure 6 shows the number of people injured by role and gender.
The majority of the injured Activity Participants were female (227 female, 91 male), with a median age
of 16 years (range 10 to 18 years). Gender was relatively evenly split in the roles of Activity Leader,
Other (e.g. volunteers and interns) and Teacher (34 female, 35 male) with a median age of 26 (range
15 to 60 years).
Figure 6: Number of people injured by role and gender.
Weather for injury-causing incidents
Weather at the time of the incident was rated on a 4-point scale across three dimensions
(Rain, Temperature, and Wind). The majority of injury-causing incidents occurred when there was an
absence of rain (75%); a moderate temperature (71%), and no or minimal wind (87%).
91
2011 10 4
227
219 3 4
0
50
100
150
200
250
Participant Activity Leader Other Field/ProgramManager
Teacher
Nu
mb
er
of
Pe
op
le I
nju
red
Role of Injured Person
Male Female

UPLOADS Data: 1st June 2014 – 31st May 2015
32
Goals for injury-causing incidents
The majority of injury-causing incidents were missing details regarding the goals associated
with the activity (n = 663) or were associated with recreation (n = 13). No further analysis was
undertaken.
Profile of activity group for injury-causing incidents
The mean number of participants involved in activities associated with injury-causing
incidents was 18 (range: 1 to 145, n = 656 incidents). The mean number of Activity Leaders was 2
(range: 1 to 14, n = 553 incidents). There was a ratio of 1 Activity Leader for every 8 participants in
activities associated with injury-causing incidents. The mean number of Supervisors (e.g. teachers)
was 1 (range: 1 to 12, n = 466 incidents) and Volunteers (e.g. parents) was 1 (range: 1 to 4, n = 26
incidents).
In 80% of incidents (n = 538), the Activity Leader was reported to have relevant qualifications.
In 2% of incidents (n = 12), the Activity Leader was reported to not have had relevant qualifications.
In 17% of incidents (n = 116) qualifications were reported to be “not applicable” and 2% were missing
classification (n = 10). Figure 7 shows the number of injury-causing incidents by actual severity ratings
(ranging from 1 to 3), partitioned according to leader qualifications. There is no clear relationship
between the severity ratings and the presence or absence of leader qualifications. However, the cases
where leader qualifications were reported to be “not applicable” are potentially cause for concern, as
this accounted for 29% of incidents (n = 6) rated as a severity of “3” (serious) within the sample. The
majority of the incidents where leader qualifications were reported to be “not applicable” involved
free time outdoors (n = 26), followed by wheel sports (n = 19), walking/running in the outdoors (n =
16), and team building games (n = 13). It is unclear why some of these activities were deemed not to
require a leader with appropriate qualifications.

UPLOADS Data: 1st June 2014 – 31st May 2015
33
Figure 7: The number of injury-causing incidents by actual severity rating, partitioned according to responses to the question "Did the leader have relevant qualifications".
Contributing factors for injury-causing incidents
In total, 363 injury-causing incidents had sufficient detail in the associated reports to be coded
using the UPLOADS Accident Analysis Framework (see Figure 1). On average, 2.2 contributing factors
were identified per report. Factors at the lower four levels of the UPLOADS Accident Analysis
Framework were identified. No factors were identified in the top two levels of the framework. A
summary of the factors and relationships identified is presented in Figure 8.
469
54
14 0 1 9 2 1 0 0
92
17 6 1 0 7 3 0 0 00
50
100
150
200
250
300
350
400
450
500
1 2 3 4 5 1 2 3 4 5 1 2 3 4 5 1 2 3 4 5
Yes No Not applicable Missing
Nu
mb
er
of
Inju
ry-c
au
sin
g
Incid
en
ts
Did the leader have relevant qualifications and actual severity ratings

UPLOADS Data: 1st June 2014 – 31st May 2015
34
Government Department
Decisions and Actions
Regulatory Bodies and
Associations
Local Area Government,
Schools, Parents & Carers,
and Higher Level
Management
Supervisory and
Management Decisions and
Actions
Decisions and Actions of
Leaders, Participants and
other Actors at the Scene of
the Incident
Equipment, Environment and
Meteorological Conditions
Schools: Communication (1)
0.3%
Local Area Government:
Communication (1) 0.3%
Supervisor/Field
Manager: Activity or
Program Design (40)
11.0%
Activity Equipment &
Resources:
Equipment, Clothing
and Personal
Protective Equipment
(120) 33.1%
Activity
Environment:
Infrastructure and
Terrain (121) 33.3%
Activity Leader:
Communication, Instruction
and Demonstration (29)
8.0%
Activity Leader:
Compliance with
Procedures, Violations
and Unsafe Acts (2)
0.6%
Supervisor/Field
Manager: Supervision
of Activity Leaders and
other Staff (2) 0.6%
Parents & Carers:
Communication (1) 0.3%
Activity Equipment &
Resources:
Documentation (4)
1.1%
Activity
Environment: Animal
and Insect Hazards
(17) 4.7%
Activity
Environment:
Weather Conditions
(19) 5.2%
Activity Leader:
Experience,
Qualifications and
Competence (8) 2.2%
Activity Leader:
Judgement And
Decision-making (14)
3.9%
Activity Leader: Mental
And Physical Condition
(5) 1.4%
Activity Leader:
Situation Awareness
(4) 1.1%Activity Leader:
Supervision and
Leadership of Activity
(27) 7.4%
Activity Participant:
Communication and
Following Instructions
(55) 15.2%
Activity Participant:
Compliance with
Procedures, Violations and
Unsafe Acts (30) 8.3%
Activity Participant:
Experience and
Competence (86)
23.7%
Activity Participant:
Judgement and
Decision-making (118)
32.5%
Activity Participant:
Mental and Physical
Condition (62) 17.1%
Activity Participant:
Planning and
Preparation for Activity
or Trip (1) 0.3%
Activity Participant:
Situation Awareness
(54) 14.9%
Other People In Activity
Group: Communication
and Following
Instructions (1) 0.3%
Other People In Activity
Group: Compliance
with Procedures,
Violations & Unsafe
Acts (1) 0.3%
Other People In Activity
Group: Judgement and
Decision-making (1)
0.3%
Activity Group Factors:
Group Composition (9)
2.5%
Activity Group Factors:
Group Dynamics (5)
1.4%
Higher Level Management:
Policies and Procedures for
Activities and Emergencies
(6) 1.7%
Higher Level
Management: Risk
Assessment and
Management (5) 1.4%
Parents & Carers: Planning and
Preparation for Activity or Trip (1) 0.3%
Activity Equipment &
Resources: Food and
Drink (5) 1.4%
Activity
Environment: Trees
and Vegetation (18)
5.0%
Supervisor/Field
Manager:
Communication (1)
0.3%
Activity
Environment:
Water Conditions
(10) 2.8%
Activity
Environment: Other
(1) 0.3%
Activity Participant:
Other (21) 5.8%
Other People In Activity
Group: Situation
Awareness (1) 0.3%Other People In Activity
Group: Supervision Of
Activity (2) 0.6%
Activity Group Factors:
Communication within
Group (5) 1.4%
Activity Group Factors:
Group Size (2) 0.6%
Activity Group Factors:
Team Work (1) 0.3%
Other People In Activity
Environment (Not In Group):
Compliance with Procedures,
Violations and Unsafe Acts
(1) 0.3%
Supervisor/Field
Manager: Experience,
Qualifications,
Competence (1) 0.3%
Supervisor/Field Manager:
Supervision and Oversight
Of Programs and Activities
(3) 0.8%
Higher Level
Management: Financial
Constraints (1) 0.3%
Higher Level Management:
Supervision, and Oversight of
Activities and Programs (1) 0.3%
Higher Level Management:
Training and Evaluation of
Staff (9) 2.5%
Local Area Government:
Legal Responsibility for
Safety within the Council
Area (3) 0.8%
Parents & Carers: Judgement And
Decision-making (1) 0.3%
(2) 0.6%
(2) 0.6%
(2) 0.6%
(1) 0.3%
(1) 0.3%
(2) 0.6%
(1) 0.3%
(1) 0.3%
(1) 0.3%
(1) 0.3%
(1) 0.3%
(1) 0.3%
(2) 0.6%
(2) 0.8%
(2) 0.6%(1) 0.3%
(2) 0.6%(1) 0.3%
(1) 0.3%(1) 0.3%
(1) 0.3%(2) 0.6% (1) 0.3%
(1) 0.3%
(1) 0.3%
(2) 0.6%
(1) 0.3%
(1) 0.3%
(1) 0.3%
(1) 0.3%
(1) 0.3%
(1) 0.3%
(1) 0.3%
(1) 0.3%
(1) 0.3%
Figure 8: Factors and relationships identified as contributors to injury-causing incidents (n=363). Factors identified in more than one report are shaded in grey, and relationships (i.e. connecting lines) identified in more than one report are bolded.
UPLOADS Data: 1st June 2014 – 31st May 2015
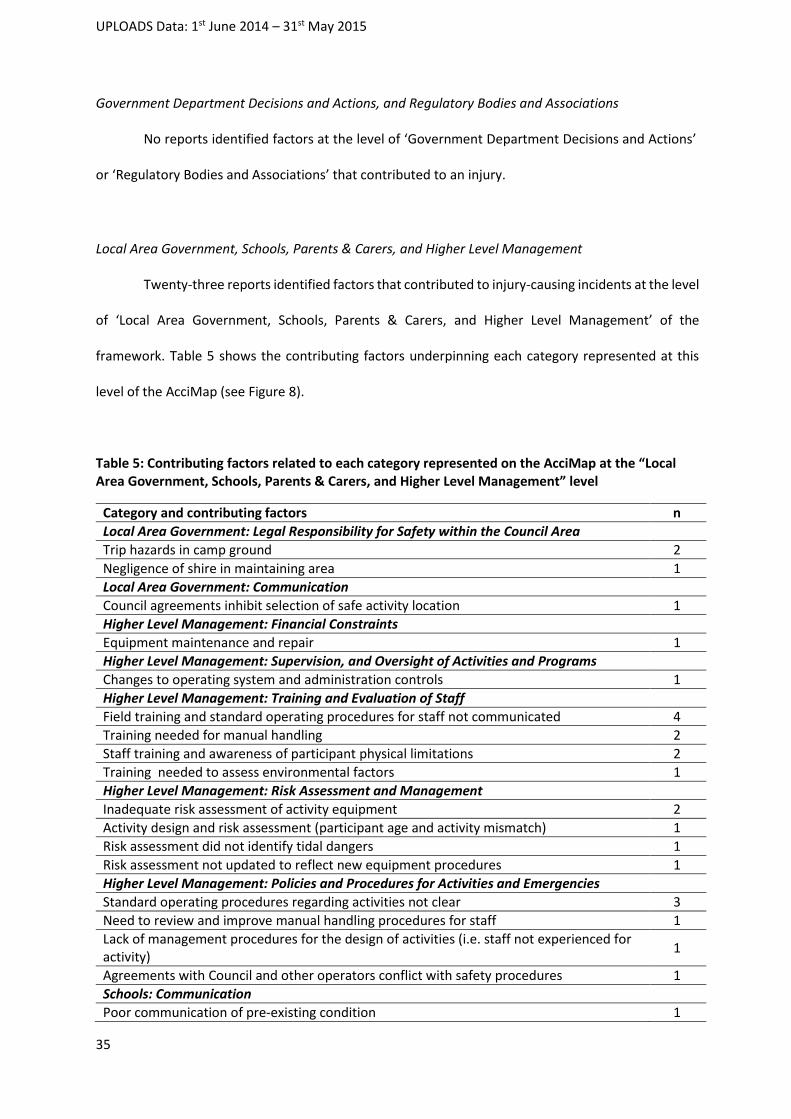
35
Government Department Decisions and Actions, and Regulatory Bodies and Associations
No reports identified factors at the level of ‘Government Department Decisions and Actions’
or ‘Regulatory Bodies and Associations’ that contributed to an injury.
Local Area Government, Schools, Parents & Carers, and Higher Level Management
Twenty-three reports identified factors that contributed to injury-causing incidents at the level
of ‘Local Area Government, Schools, Parents & Carers, and Higher Level Management’ of the
framework. Table 5 shows the contributing factors underpinning each category represented at this
level of the AcciMap (see Figure 8).
Table 5: Contributing factors related to each category represented on the AcciMap at the “Local Area Government, Schools, Parents & Carers, and Higher Level Management” level
Category and contributing factors n
Local Area Government: Legal Responsibility for Safety within the Council Area
Trip hazards in camp ground 2
Negligence of shire in maintaining area 1
Local Area Government: Communication
Council agreements inhibit selection of safe activity location 1
Higher Level Management: Financial Constraints
Equipment maintenance and repair 1
Higher Level Management: Supervision, and Oversight of Activities and Programs
Changes to operating system and administration controls 1
Higher Level Management: Training and Evaluation of Staff
Field training and standard operating procedures for staff not communicated 4
Training needed for manual handling 2
Staff training and awareness of participant physical limitations 2
Training needed to assess environmental factors 1
Higher Level Management: Risk Assessment and Management
Inadequate risk assessment of activity equipment 2
Activity design and risk assessment (participant age and activity mismatch) 1
Risk assessment did not identify tidal dangers 1
Risk assessment not updated to reflect new equipment procedures 1
Higher Level Management: Policies and Procedures for Activities and Emergencies
Standard operating procedures regarding activities not clear 3
Need to review and improve manual handling procedures for staff 1
Lack of management procedures for the design of activities (i.e. staff not experienced for activity)
1
Agreements with Council and other operators conflict with safety procedures 1
Schools: Communication
Poor communication of pre-existing condition 1

UPLOADS Data: 1st June 2014 – 31st May 2015
36
Table 5 (cont.): Contributing factors related to each category represented on the AcciMap at the ‘Local area government, Schools, Parents & Carers, and Higher Level Management’ level
A number of relationships were identified between factors related to ‘Higher Level
Management’, ‘Parents & Carers’, and other factors. This influenced the conduct of activities, which
is shown in Table 6.
Table 6: The relationships between ‘Higher Level Management’, ‘Parents & Carers’ and other factors, influencing the conduct of activities
Factor 1 Factor 2 Examples n
Higher Level Management: Training and Evaluation of Staff
Higher Level Management: Policies and Procedures for Activities and Emergencies
Policies and procedures do not include requirement for manual handling training
1
Higher Level Management: Training and Evaluation of Staff
Activity Leader: Supervision and Leadership of Activity
Supervision of practical students in the field
1
Higher Level Management: Training and Evaluation of Staff
Activity Leader: Experience, Qualifications and Competence
Leader not trained in assessing water conditions
1
Higher Level Management: Training and Evaluation of Staff
Activity Leader: Mental and Physical Condition
Manual handling training for staff not inclusive of variable physical capabilities (e.g. height)
1
Parents & Carers: Communication
Activity Equipment & Resources: Documentation
Parents did not notify the pre-existing condition
2
Parents & Carers: Planning and Preparation for Activity or Trip
Activity participant: Mental and Physical Condition
Participant sent to camp despite family members having flu/illness
1
Category and contributing factors n
Parents & Carers: Communication
Parents not providing information about pre-existing conditions on consent form 1
Parents & Carers: Judgement and Decision-making
Carer decision to keep participant in activity 1
Parents & Carers: Planning and Preparation for Activity or Trip
Participant sent with pre-existing condition (illness in family) 1

UPLOADS Data: 1st June 2014 – 31st May 2015
37
Supervisory and Management Decisions and Actions
Forty-four reports identified factors the level of ‘Supervisory and Management Decisions and
Actions’, which contributed to injury-causing incidents. Table 7 shows the contributing factors
underpinning each category at this level of the AcciMap.
Table 7: Contributing factors related to each category represented on the AcciMap at the ‘Supervisory and Management Decisions and Actions’ level
Category and contributing factors n
Supervisor/Field Manager: Supervision, Oversight of Programs and Activities
Equipment hazard not identified 1
More leaders required for program 1
Staff rostered onto program when injured 1
Supervisor/Field Manager: Experience, Qualifications and Competence
Practical student left to supervise group alone 1
Supervisor/Field Manager: Supervision of Activity Leaders and other Staff
Supervision and regular checks of staff “in the field” not adequate 3
Supervisor/Field Manager: Communication
Clarity of briefing notes 1
Supervisors/Field Manager: Activity or Program Design
Fatigue and tiredness due to length of program or activities (participants) 10
Activity inadequate for participant training or preparation 6
Activity inappropriate for participant age or ability 6
Activity inappropriate for time of day 5
Game increased danger of injury (e.g. blindfold walk, running game) 5
Inherent risk of activity (e.g. quad-bikes, ball sports/team games, cooking with fire) 4
Activity inappropriate for participants level of experience 3
Environmental factors impacting on suitability of activity (e.g. slippery, cold) 1
Five relationships were identified between ‘Supervisory and Management Decisions’ and
lower level factors, which influenced the conduct of activities. This is shown in Table 8.
Table 8: The relationships between ‘Supervisory and Management Decisions’ and other factors, influencing the conduct of activities
Factor 1 Factor 2 Examples n
Supervisor/Field Manager: Supervision and Oversight of Programs and Activities
Activity Group Factors: Group Composition
Group with variable abilities required higher levels of supervision
1

UPLOADS Data: 1st June 2014 – 31st May 2015
38
Table 8 (cont.): The relationships between ‘Supervisory and Management Decisions’ and other
factors, influencing the conduct of activities
Factor 1 Factor 2 Examples n
Supervisor/Field Manager: Supervision of Activity Leaders and other Staff
Activity Leader: Mental and Physical Condition
Staff rostered on to activities with injury
1
Supervisor/Field Manager: Activity or Program Design
Activity Group Factors: Group Composition
Group too inexperienced for activity/program
1
Supervisor/Field Manager: Activity or Program Design
Activity Leader: Communication, Instruction and Demonstration
More skills training and instructions are needed for inexperienced participants
2
Supervisor/Field Manager: Activity or Program Design
Activity Participant: Mental and Physical Condition
Participant’s physical condition was not sufficient for the activity
1
Decisions and Actions of Leaders, Participants, and other Actors at the Scene of the Incident
Three hundred and one reports identified factors at the ‘Decisions and Actions of Leaders,
Participants, and other Actors at the Scene of the Incident’ level, which contributed to injury-causing
incidents.
The role of the Activity Group and Other People in Activity Group
Table 9 shows examples of the contributing factors related to ‘Activity Group’, ‘Other People
in Activity Group’ and ‘Other People in Activity Environment’ categories.
Table 9: Contributing factors related to ‘Activity Group’, ‘Other People in the Activity Group’ and ‘Other People in Activity Environment’ categories
Category and contributing factors n
Activity Group Factors: Communication within Group
Insufficient communication between participants 2
Clustering of bike group on track 1
Lack of communication between participants while cooking 1
Safety buddy did not communicate safety check 1
Spotters not ready in climbing activity 1
Activity Group Factors: Group Composition
The ability of the group to complete activity or program 4
Age of group inappropriate for activity 3

UPLOADS Data: 1st June 2014 – 31st May 2015
39
Table 9 (cont.): Contributing factors related to ‘Activity Group’, ‘Other People in the Activity
Group’ and ‘Other People in Activity Environment’ categories
Three relationships were identified between factors relating to ‘Activity Group Factors’, and
other factors, which impacted the conduct of activities. These are presented in Table 10.
Table 10: The relationships between ‘Activity Group Factors’ and other factors, influencing the conduct of activities
Factor 1 Factor 2 Examples n
Activity Group Factors: Group Composition
Activity Group Factors: Group Size
Large groups with variable abilities
1
Activity Group Factors: Communication within Group
Activity Participant: Judgement and Decision-making
Participant got startled and pushed other participant’s hand (which was holding a pot) away
1
Activity Group Factors: Group dynamics
Activity Participant: Experience and Competence
Inexperienced group 1
Category and contributing factors n
‘At risk’ youth with behavioural issues 1
International students not experienced in activity 1
Activity Group Factors: Group Dynamics
Fighting, taunting or bullying in the group 2
Inexperienced group 1
Getting “carried away” with aggressive behaviour during activity 1
Group peer pressure 1
Activity Group Factors: Group Size
Too many people in the group 3
Activity Group Factors: Team work
Not working as a team 1
Other People in Activity Group: Compliance with Procedures, Violations and Unsafe Acts
Teacher and driver did not assist participant who needed help 1
Other People in Activity Group: Judgement and Decision-making
Continuing to work when injured 1
Other People in Activity Group: Situation Awareness
Poor perception of surroundings 1
Other People in Activity Group: Supervision of Activity
Lack of supervision of situation 2
Other People in Activity Group: Communication and Following Instructions
Lack of communication between supervising teacher and students 1
Other People in Activity Environment (Not in Group): Compliance with Procedures, Violations and Unsafe Acts
Incorrect lifting technique 1
UPLOADS Data: 1st June 2014 – 31st May 2015
40
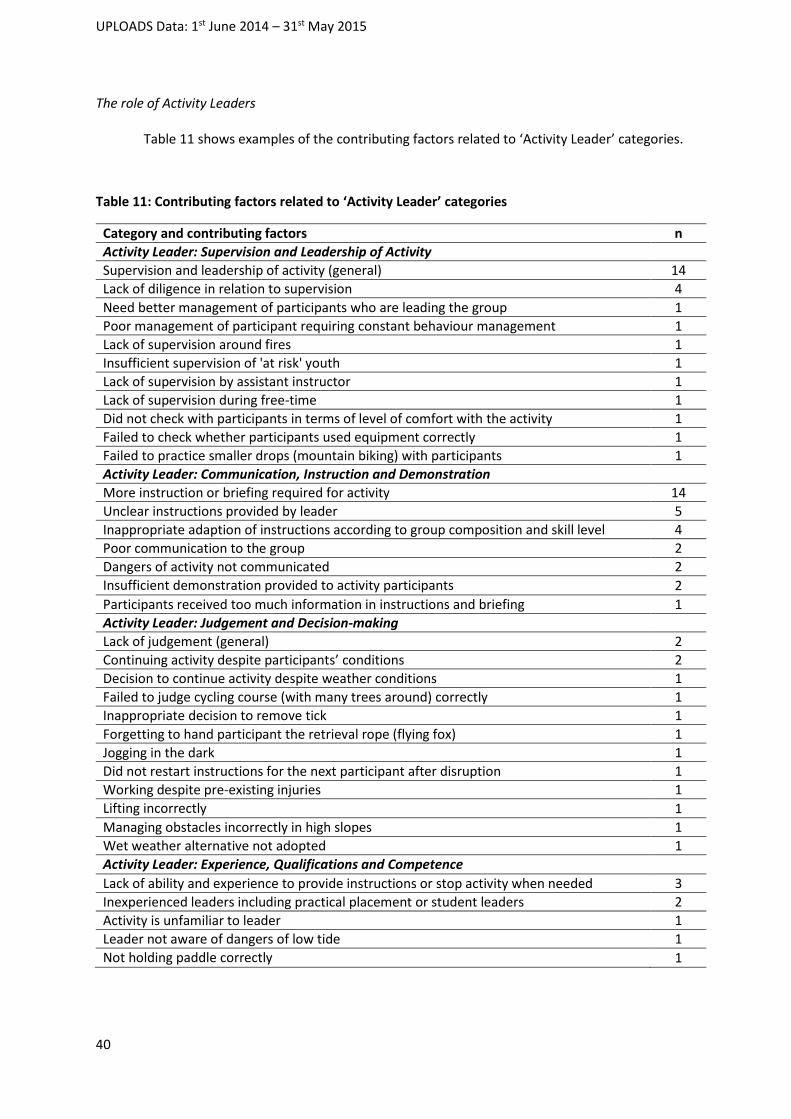
The role of Activity Leaders
Table 11 shows examples of the contributing factors related to ‘Activity Leader’ categories.
Table 11: Contributing factors related to ‘Activity Leader’ categories
Category and contributing factors n
Activity Leader: Supervision and Leadership of Activity
Supervision and leadership of activity (general) 14
Lack of diligence in relation to supervision 4
Need better management of participants who are leading the group 1
Poor management of participant requiring constant behaviour management 1
Lack of supervision around fires 1
Insufficient supervision of 'at risk' youth 1
Lack of supervision by assistant instructor 1
Lack of supervision during free-time 1
Did not check with participants in terms of level of comfort with the activity 1
Failed to check whether participants used equipment correctly 1
Failed to practice smaller drops (mountain biking) with participants 1
Activity Leader: Communication, Instruction and Demonstration
More instruction or briefing required for activity 14
Unclear instructions provided by leader 5
Inappropriate adaption of instructions according to group composition and skill level 4
Poor communication to the group 2
Dangers of activity not communicated 2
Insufficient demonstration provided to activity participants 2
Participants received too much information in instructions and briefing 1
Activity Leader: Judgement and Decision-making
Lack of judgement (general) 2
Continuing activity despite participants’ conditions 2
Decision to continue activity despite weather conditions 1
Failed to judge cycling course (with many trees around) correctly 1
Inappropriate decision to remove tick 1
Forgetting to hand participant the retrieval rope (flying fox) 1
Jogging in the dark 1
Did not restart instructions for the next participant after disruption 1
Working despite pre-existing injuries 1
Lifting incorrectly 1
Managing obstacles incorrectly in high slopes 1
Wet weather alternative not adopted 1
Activity Leader: Experience, Qualifications and Competence
Lack of ability and experience to provide instructions or stop activity when needed 3
Inexperienced leaders including practical placement or student leaders 2
Activity is unfamiliar to leader 1
Leader not aware of dangers of low tide 1
Not holding paddle correctly 1

UPLOADS Data: 1st June 2014 – 31st May 2015
41
Table 11 (cont.): Contributing factors related to ‘Activity Leader’ categories
A number of relationships were identified between factors relating to the ‘Activity Leader’,
and other (equal and lower level) factors, which impacted the conduct of activities. These are
presented in Table 12.
Table 12: The relationships between ‘Activity Leader’ and other factors, influencing the conduct of activities
Factor 1 Factor 2 Examples n
Activity Leader: Supervision and Leadership of Activity
Activity Leader: Judgement and Decision-making
Participant not removed from group because of lack of supervision
1
Activity Leader: Supervision and Leadership of Activity
Activity Participant: Experience and Competence
Participant leading group was walking too fast for others
1
Activity Leader: Supervision and Leadership of Activity
Activity Leader: Communication, Instruction and Demonstration
Poor communication leading to poor supervision around fires
1
Activity Leader: Communication, Instruction and Demonstration
Activity Leader: Experience, Qualifications and Competence
Instructor not experienced to stop activity and provide more instruction to participant
1
Activity Leader: Judgement and Decision-making
Activity Equipment & Resources: Equipment, Clothing and Personal Protective Equipment
Forgot to hand the retrieval rope to participants
1
Category and contributing factors n
Activity Leader: Situation Awareness
Attention to surroundings 2
Lack of awareness around hot water 1
Did not recognise danger of ladder to participant on flying fox 1
Activity leader was distracted 1
Activity Leader: Mental and Physical Condition
Female instructors unable to lift male participant after fall 1
Inability to complete normal workload due to back injury 1
Inability to lift canoes onto trailer safety due to smaller stature 1
Staff member lack of physical fitness 1
Activity leader fatigue 1
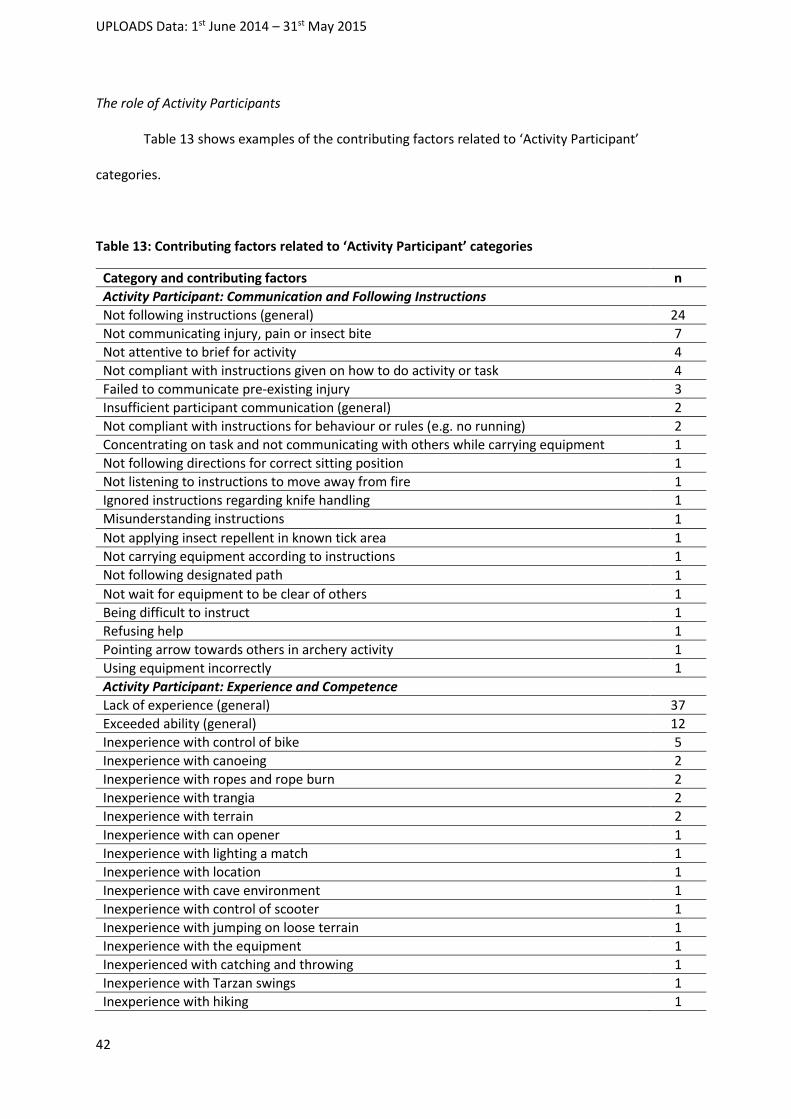
UPLOADS Data: 1st June 2014 – 31st May 2015
42
The role of Activity Participants
Table 13 shows examples of the contributing factors related to ‘Activity Participant’
categories.
Table 13: Contributing factors related to ‘Activity Participant’ categories
Category and contributing factors n
Activity Participant: Communication and Following Instructions
Not following instructions (general) 24
Not communicating injury, pain or insect bite 7
Not attentive to brief for activity 4
Not compliant with instructions given on how to do activity or task 4
Failed to communicate pre-existing injury 3
Insufficient participant communication (general) 2
Not compliant with instructions for behaviour or rules (e.g. no running) 2
Concentrating on task and not communicating with others while carrying equipment 1
Not following directions for correct sitting position 1
Not listening to instructions to move away from fire 1
Ignored instructions regarding knife handling 1
Misunderstanding instructions 1
Not applying insect repellent in known tick area 1
Not carrying equipment according to instructions 1
Not following designated path 1
Not wait for equipment to be clear of others 1
Being difficult to instruct 1
Refusing help 1
Pointing arrow towards others in archery activity 1
Using equipment incorrectly 1
Activity Participant: Experience and Competence
Lack of experience (general) 37
Exceeded ability (general) 12
Inexperience with control of bike 5
Inexperience with canoeing 2
Inexperience with ropes and rope burn 2
Inexperience with trangia 2
Inexperience with terrain 2
Inexperience with can opener 1
Inexperience with lighting a match 1
Inexperience with location 1
Inexperience with cave environment 1
Inexperience with control of scooter 1
Inexperience with jumping on loose terrain 1
Inexperience with the equipment 1
Inexperienced with catching and throwing 1
Inexperience with Tarzan swings 1
Inexperience with hiking 1

UPLOADS Data: 1st June 2014 – 31st May 2015
43
Table 13 (cont.): Contributing factors related to ‘Activity Participant’ categories
Category and contributing factors n
Lack of technique 6
Inexperience with knife or saw handling 2
Lack of experience with large drops or steep downhill mountain biking 2
Not competent on wires and heights 1
Not experienced in running while map reading 1
Misjudged the rapid 1
Not familiar with activity 1
Standing too far forward on surfboard 1
Activity Participant: Judgement and Decision-making
Poor judgment and decision making (general) 28
Not concentrating on task 11
Actions and decisions around heat and fires involving food preparation 9
Judgement and decisions – falling, slipping and tripping 8
Cycling too fast downhill 5
Not assessing wet weather and slippery conditions 5
Not reporting injury or illness in a timely manner 4
Cycling around corner too fast 3
Cycling – applying brakes too suddenly and heavily 3
Pre-existing injury affected the ability to safely complete activities 3
Decision to throw object too close to others 2
Cycling too slow uphill 2
Lack of awareness of hazards associated with hot marshmallows 2
Body weight too far forward on surfboard 1
Failed to ask for help with carrying pole 1
Cycling - bike slippage due to excessive lean 1
Cycling - looking behind and losing balance 1
Cycling - not applying brakes 1
Doing too many things at the same time 1
Decision to play around the inflatable tube 1
Decision to run during game 1
Going down a large drop while mountain biking 1
Hitting stick on ground 1
Lack of judgement leaning over electric fence 1
Holding the abseil brake too tightly 1
Legs exposed out of canoe 1
Poor navigation and map reading 1
Negotiating the abseil, the participant stepped awkwardly 1
Decision to stand rather than sit on the board during sandboarding 1
Not behaving according to conditions 1
Not being cautious in the creek environment 1
Not exiting platform at designated place 1
Participant attempted to lean on a tree whilst still mounted on bike 1
Jogging on uneven ground with backpack 1
Jumping into water 1
Jumping on a stick 1
Over excited and competitive during game play 1
Continuing with activity when physically exhausted 1

UPLOADS Data: 1st June 2014 – 31st May 2015
44
Table 13 (cont.): Contributing factors related to ‘Activity Participant’ categories
Category and contributing factors n
Impatience on high ropes course 1
Refusing [first aid] treatment 1
Rushing 1
Decision to stop halfway down the slide 1
Wanting to impress others 1
Skiing to fast downhill 1
Using hand as brake while carting 1
Decision to play an unsafe game 1
Decision not to wear shoes on the beach 1
Decision to tackle someone without considering consequences 1
Activity Participant: Compliance with Procedures, Violations and Unsafe Acts
Acting in an unsafe manner 2
Did not wait for instructors or instructions 2
Hitting other participant with equipment (accident) 2
Not complying with rules 2
Not using PPE gloves 2
Rushing 1
Continuing to climb despite holds being too hot 1
Did not follow instructions for self-protection during water-based activity 1
Ignored instructions regarding knife handling 1
Engaging in unsafe behaviour (general) 1
Hitting other participant with equipment (intentional) 1
“Messing around” 1
Misbehaviour 1
Did not apply sunscreen 1
Not complying with procedures 1
Not engaging with activity safely 1
Participant handling PPE equipment when they shouldn't have 1
Playing with fire hose 1
Pushing and shoving 1
Running in unsafe areas on site 1
Showing disregard for equipment 1
Sitting on fence 1
Climbed over the swimming enclosure 1
Tipping canoe on purpose 1
Unclipped from safety line 1
Activity Participant: Situation Awareness
Not paying attention or aware of surroundings 34
Not watching where going 7
Not seeing (or seeing too late) other people in activity environment 4
Lack of terrain awareness (e.g. steepness of hill, slippery terrain) 3
Misjudged obstacle in activity environment (e.g. moving logs, flying object) 2
Distraction 1
Lack of concentration 1
Equipment inattention 1
Not realising camper window was locked 1
Not detecting danger in activity environment 1

UPLOADS Data: 1st June 2014 – 31st May 2015
45
Table 13 (cont.): Contributing factors related to ‘Activity Participant’ categories
Sixteen relationships were identified between ‘Activity Participant’ factors and other factors,
which influenced the conduct of activities. These are presented in Table 14.
Table 14: The relationships between ‘Activity Participant’ factors and other factors, influencing the conduct of activities
Factor 1 Factor 2 Examples n
Activity participant: Communication and Following Instructions
Activity participant: Compliance with Procedures, Violations and Unsafe Acts
Did not put equipment away despite prior instruction
2
Activity participant: Communication and Following Instructions
Activity participant: Judgement and Decision-making
Decision to not communicate injury 2
Activity participant: Communication and Following Instructions
Activity Equipment & Resources: Documentation
Did not disclose pre-existing condition on medical form or in pre-program interview
2
Activity participant: Communication and Following Instructions
Activity Equipment & Resources: Equipment, Clothing and Personal Protective Equipment
Not applying insect repellent or sunscreen
2
Category and contributing factors n
Activity Participant: Mental and Physical Condition
Symptoms related to pre-existing injury (e.g. knee injury, wrist injury) 21
Pre-existing injury or condition (general) 10
Lack of physical fitness 7
Tiredness or fatigue 6
Anxiety 4
Pre-existing injury prior to program (e.g. wound or burn) 3
Family situation or participant background 2
Injuries related to personal protective equipment (e.g. blisters) 2
Symptoms related to pre-existing illness (e.g. asthma, epilepsy, cystic fibrosis) 2
Participant was affected by a loose tooth 1
Participants excited about camp 1
Frailty of elderly participant 1
Symptoms related to pre-existing psychological issue (e.g. mental health, behaviour) 1
Visual impairment 1
Activity Participant: Planning and Preparation for Activity or Trip
Participant was not sufficiently ready for camp 1
Lack of prior planning 1
Activity Participant: Other
Carelessness 21

UPLOADS Data: 1st June 2014 – 31st May 2015
46
Table 14 (cont.): The relationships between ‘Activity Participant factors’ and other factors,
influencing the conduct of activities
Factor 1 Factor 2 Examples n
Activity participant: Communication and Following Instructions
Activity Participant: Mental and Physical Condition
Participant did not communicate poor eyesight
1
Activity participant: Experience and Competence
Activity Equipment & Resources: Equipment, Clothing and Personal Protective Equipment
Participants inexperienced with equipment
2
Activity participant: Experience and Competence
Activity Environment: Infrastructure and Terrain
Age impacted understanding of environmental hazards
1
Activity Participant: Experience and Competence
Activity Participant: Situation Awareness
Lack of experience caused nervousness which led to lack of concentration
1
Activity Participant: Experience and Competence
Activity Participant: Planning and Preparation for Activity or Trip
Participants not prepared for activities due to inexperience
1
Activity Participant: Judgement and Decision-making
Activity Equipment & Resources: Food and Drink
Choking due to laughing while eating
2
Activity Participant: Judgement and Decision-making
Activity Participant: Mental and Physical Condition
Fitness affecting concentration on task
1
Activity Participant: Judgement and Decision-making
Activity Equipment & Resources: Equipment, Clothing and Personal Protective Equipment
Participant decided not to wear any shoes
1
Activity Participant: Judgement and Decision-making
Activity Environment: Infrastructure and Terrain
Student did not go up the hill at the correct speed causing bike to slip on the wet ground
1
Activity Participant: Compliance with Procedures, Violations and Unsafe Acts
Activity Equipment & Resources: Equipment, clothing and Personal Protective Equipment
Participant was unclipped from safety line
1
Activity participant: Situation Awareness
Activity Environment: Infrastructure and Terrain
Participant did not see change in terrain
2
Activity Participant: Mental and Physical Condition
Activity Equipment & Resources: Equipment, Clothing and Personal Protective Equipment
Pre-existing injury meant that participant could not correctly use equipment
1

UPLOADS Data: 1st June 2014 – 31st May 2015
47
Equipment, Environment and Meteorological Conditions
Two hundred and sixty-three reports identified factors at the level of ‘Equipment,
Environment and Meteorological Conditions’, which contributed to injury-causing incidents. Table 15
shows the contributing factors related to ‘Activity Environment’ categories and Table 16 shows the
contributing factors related to ‘Activity Equipment’ categories.
Table 15: Contributing factors related to ‘Activity Environment’ categories
Category and contributing factors n
Activity Environment: Infrastructure and Terrain
Rocky terrain or ground cover causing slip or trip 26
Traversing a steep track or hills 17
Uneven ground 15
Wet or slippery terrain or track 11
Debris on path 7
Slips, trips and falls on track 7
Colliding with infrastructure in activity environment (e.g. hit head on shelter) 5
Pot hole on path or track 4
Sharp objects in activity environment 4
Tripping over terrain 4
Colliding with infrastructure on the side of the road (e.g. during bike riding) 3
Hitting tyre wall during riding activity 3
Difficult terrain 2
Riding bike on gravel track 2
Slip or trip on stairs 2
Sandy terrain 2
Walking on 4X4 track 2
Bike riding on 4X4 track 1
Broken wood on wall 1
Dirt from activity environment entering wound 1
Electric fence in activity environment 1
Erosion exposing hazards on track 1
Hand caught in door 1
Jumping over wire fence 1
Logs suspended in air for course 1
Participant jumping on debris 1
Participant sinking in mud 1
Riding on an ‘S’ bend 1
Slipped on moss 1
Slippery and mossy canyon 1
Activity Environment: Water Conditions
Rocks in water environment 5
Water environment (general) 2
Landing in shallow water 1
Natural obstruction or strainer in water environment 1

UPLOADS Data: 1st June 2014 – 31st May 2015
48
Table 15 (cont.): Contributing factors related to ‘Activity Environment’ categories
Table 16: Contributing factors related to ‘Activity Equipment’ categories
Category and contributing factors n
Surfing at low tide 1
Water faster than anticipated 1
Activity Environment: Weather Conditions
Wet weather, rain and showers 9
Warm weather impacting on activity 6
Weather conditions (general) 3
Windy conditions impacting on activity 2
Cold weather exposure 1
Heat exposure 1
Activity Environment: Animal and Insect Hazards
Insect (unknown) bite 6
Tick on body 5
Leech on body 2
Insect (unknown) bite 1
Jelly fish sting 1
Spider in tent 1
Mosquito bite 1
Activity Environment: Trees and Vegetation
Collision with tree or branches 9
Injury from thick scrub or shrubbery 3
Exposed tree root on path 2
Collision with fallen trees or logs 2
Fallen branches and sticks on path 1
Fallen leaves makes conditions slippery 1
Participants throwing fallen sticks and branches 1
Walking through sharp bladed grass 1
Activity Environment: Other
Poor light conditions 1
Category and contributing factors n
Activity Equipment and Resources: Documentation
Documentation did not include details of health issue or existing condition 4
Briefing notes for activity did not have enough information 1
Unable to locate medical consent forms 1
Activity Equipment and Resources: Food and Drink
Anxiety related to new or different food 1
Choking 1
Dehydration 1
Food causing burns 3
Activity Equipment and Resources: Equipment, Clothing and Personal Protective Equipment
Lack of appropriate equipment or clothing 34
Equipment (general) 19
People colliding with equipment 11
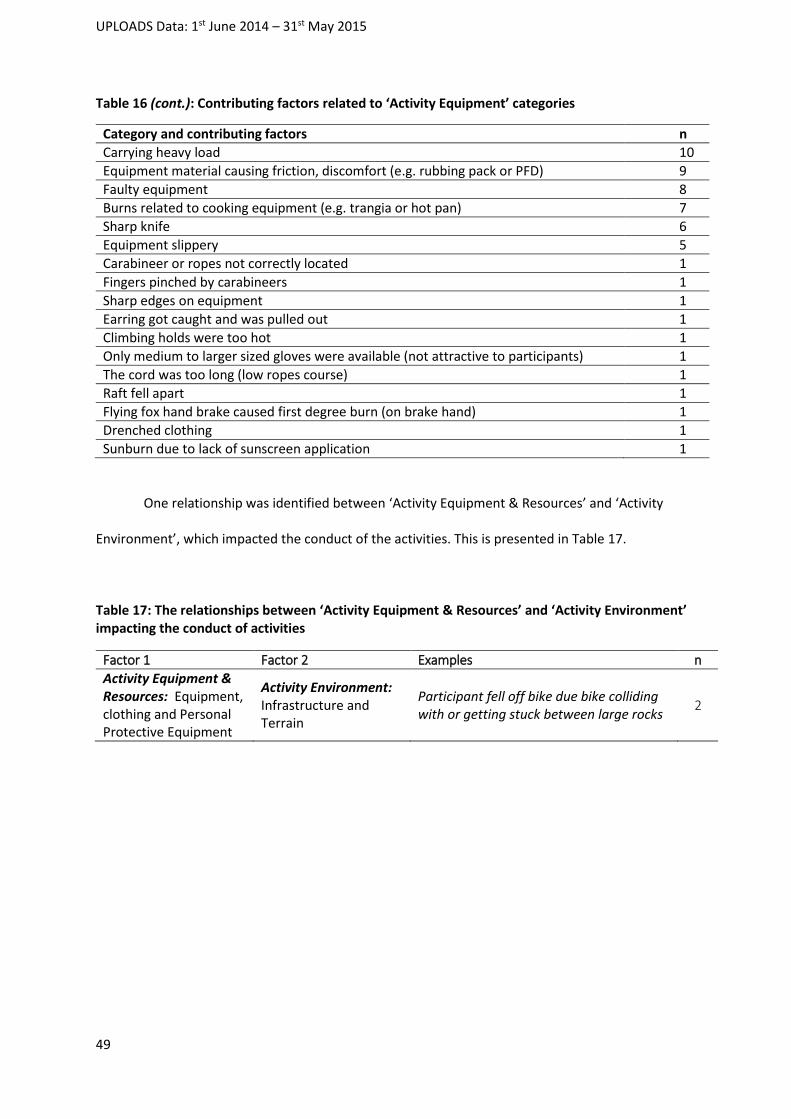
UPLOADS Data: 1st June 2014 – 31st May 2015
49
Table 16 (cont.): Contributing factors related to ‘Activity Equipment’ categories
One relationship was identified between ‘Activity Equipment & Resources’ and ‘Activity
Environment’, which impacted the conduct of the activities. This is presented in Table 17.
Table 17: The relationships between ‘Activity Equipment & Resources’ and ‘Activity Environment’ impacting the conduct of activities
Factor 1 Factor 2 Examples n
Activity Equipment & Resources: Equipment, clothing and Personal Protective Equipment
Activity Environment: Infrastructure and Terrain
Participant fell off bike due bike colliding with or getting stuck between large rocks
2
Category and contributing factors n
Carrying heavy load 10
Equipment material causing friction, discomfort (e.g. rubbing pack or PFD) 9
Faulty equipment 8
Burns related to cooking equipment (e.g. trangia or hot pan) 7
Sharp knife 6
Equipment slippery 5
Carabineer or ropes not correctly located 1
Fingers pinched by carabineers 1
Sharp edges on equipment 1
Earring got caught and was pulled out 1
Climbing holds were too hot 1
Only medium to larger sized gloves were available (not attractive to participants) 1
The cord was too long (low ropes course) 1
Raft fell apart 1
Flying fox hand brake caused first degree burn (on brake hand) 1
Drenched clothing 1
Sunburn due to lack of sunscreen application 1

UPLOADS Data: 1st June 2014 – 31st May 2015
50
Incidents associated with illnesses
In total, 235 incidents were analysed. This included 170 incidents associated with illnesses
reported over the twelve-month period and 65 historical incident reports occurring between February
2013 and June 2014. The historical data were not included in the calculation of the incidence rates,
however all reported incidents were included in the descriptive analyses. Across all activities, the
mean reported illness rate was .57 incidents per 1000 participants. This means that, on average, less
than 1 incident associated with an illness was reported for every thousand participants involved in a
led outdoor activity.
Figure 9 presents a summary of the illness rate per 1000 participants by activity type (see
Appendix A for a full list of activities). Incidents associated with illnesses not related to an activity or
program (n = 31) were excluded from the Figure. Notably, 40% of the activity types were not
associated with any illnesses.
UPLOADS Data: 1st June 2014 – 31st May 2015
51
Figure 9: Illness rate per 1000 participants by activity type (June 2014 – May 2015). Numbers in brackets represent the number of reported incident associated with illnesses and the number of reported participants associated with the activity, respectively.
(0/18,491)
(0/1,180)
(0/2,375)
(0/4,009)
(0/10,014)
(0/436)
(0/378)
(0/706)
(1/28,723)
(3/79,037)
(1/6,177)
(3/18,488)
(1/5,469)
(4/16,336)
(7/27,345)
(6/15,740)
(46/33,757)
(17/10,168)
(31/10,067)
(49/7,820)
0 1 2 3 4 5 6 7
Archery
Arts & Crafts
Beach activities
Caving
Harness: indoors
Horse/Camel riding
Snowsports
Trampoline
Teambuilding games
Harness: outdoors
Travelling
Wheel sports
Curriculum activities
Ocean activities
River activities
Residential camps
Walking/running
Free time outdoors
Campcraft
Camping tents
Reported illness rate per 1000 participants; i.e. (Number of illness related incidents/Number of participants)/1000
Act
ivit
y Ty
pe
40% of all activities were not associated with any illnesses.

UPLOADS Data: 1st June 2014 – 31st May 2015
52
Actual severity ratings for incidents associated with illnesses
Figure 10 shows a histogram of severity scores for illness related incidents. The median
severity was 1 (range: 0 to 5) indicating that the majority of illnesses only required localised care with
short term effects.
Figure 10: Severity ratings for illness related incidents.
These ratings are supported by the findings regarding evacuation, hospitalisation and
emergency services. Forty-eight (21%) reported illness related incidents required evacuation (Vehicle
= 41; Walked out = 7), of which 9 required hospitalisation and 4 required Emergency Services.
Evacuations were comprised of 6 severity rating 1 incidents, 29 severity rating 2 incidents, 10 severity
rating 3 incidents, and all 3 severity rating 5 incidents.
Illness type
Of the 235 incidents associated with illnesses, 107 reports detailed the specific illness type. In
the remaining 128 reports illness type was either reported as “unknown” (n = 73) or was missing (n =
162
59
11
0 3
0
20
40
60
80
100
120
140
160
1 2 3 4 5
Nu
mb
er
of
Illn
ess
re
late
d I
nci
de
nts
Actual Severity Rating

UPLOADS Data: 1st June 2014 – 31st May 2015
53
55). The following illness types were reported: abdominal problem (n = 32); non-specific fever (n = 21);
allergic reaction (n = 14); menstrual (n = 13); asthma (n = 9); heat stroke (n = 6); respiratory/chest pain
(n = 5); diarrhoea (n = 3); food poisoning (n = 1); hypothermia (n = 1); skin infection (n = 1); and urinary
tract infection (n = 1).
Demographic information for ill people
The reports included details on 129 people who reported illnesses. Figure 11 shows the
number of people with an illness by role and gender. The majority of ill Activity Participants were
female (79 female, 15 male), with a median age of 16 years (range 11 to 18; 1 missing classification).
Gender was relatively evenly split in the role of Activity Leader, Field/Program Manager, Teacher and
Other (e.g. volunteers and interns) with an overall median age of 27 (range 15 to 46 years).
Figure 11: Number of people with an illness by role and gender.
1510
3 2 1
79
13
3 30
0
10
20
30
40
50
60
70
80
90
Participant Activity Leader Other Field/ProgramManager
Teacher
Nu
mb
er
of
Ill P
eo
ple
Role of Ill Person
Male Female

UPLOADS Data: 1st June 2014 – 31st May 2015
54
Weather for incidents associated with illnesses
Weather at the time of the incident was rated on a 4-point scale across three dimensions (Rain,
Temperature and Wind). The majority of illnesses occurred when there was an absence of rain (65%),
a moderate temperature (64%), and no or minimal wind (76%).
Goals for incidents associated with illnesses
The majority of incidents associated with illnesses were missing details regarding the goals
associated with the activity (n = 226 missing classification). Of the goals that were listed, most were
related to mealtimes (i.e. having breakfast, lunch, or dinner; n = 9). No further analysis was undertaken.
Profile of activity group for incidents associated with illnesses
The mean number of participants involved in activities associated with illnesses was 17 (range:
0 to 146). The mean number of Activity Leaders was 2 (range: 0 to 4) and of Supervisors (e.g. teachers)
was 1 (range: 0 to 6). Only one volunteer (e.g. parent) was involved in activity groups for incidents
associated with illnesses. There was a ratio of 2 Activity Leaders for every 17 participants in activities
associated with illness-causing incidents.
In 74% of incidents (n = 174), the Activity Leader was reported to have relevant qualifications.
In 20% of incidents (n = 47) qualifications were reported to be “not applicable”, and 6% (n = 14) were
missing classification. Figure 12 shows the number of incidents associated with illnesses by actual
severity ratings, partitioned according to leader qualifications. There was no clear relationship
between the severity ratings and the presence or absence of leader qualifications. However, as with
injuries, the incidents where leader qualifications were reported to be “not applicable” are a potential
cause for concern, as this accounted for nearly 20% of incidents (n = 9) with a severity rating of 3 to 5
(i.e. serious to critical) within the sample. The majority of illness related incidents where leader
qualifications were reported to be “not applicable” involved: camping in tents (n = 12), free time

UPLOADS Data: 1st June 2014 – 31st May 2015
55
outdoors (n = 8) and incidents not involving an activity or program (n = 11). It is unclear why camping
in tents was considered not to require a leader with appropriate qualifications.
Figure 12: The number of incidents associated with illnesses by actual severity rating, partitioned according to responses to the question "Did the leader have relevant qualifications".
Contributing factors for incidents associated with illness
In total, 86 illness incident reports had enough detail to be coded using the UPLOADS Accident
Analysis Framework (see Figure 1). On average, two contributing factors were identified per report
associated with an illness. Factors at the lower four levels of the UPLOADS Accident Analysis
Framework were identified. A summary of the factors and relationships identified is presented in
Figure 13.
126
43
50 0 0 0 0 0 0
2216
60 3
14
0 0 0 00
20
40
60
80
100
120
140
1 2 3 4 5 1 2 3 4 5 1 2 3 4 5 1 2 3 4 5
Yes No Not applicable Missing
Nu
mb
er
of
Illn
ess
re
late
d In
cid
en
ts
Did the leader have relevant qualifications and actual severity ratings

UPLOADS Data: 1st June 2014 – 31st May 2015
56
Government department
decisions and actions
Regulatory bodies and
associations
Local area government,
Schools, Parents & Carers,
and Higher Level
Management
Supervisory and
management decisions and
actions
Decisions and actions of
leaders, participants and
other actors at the scene of
the incident
Equipment, environment and
meteorological conditions
Schools:
Communication (1)
1.2%
Supervisors/Field Managers:
Activity or Program Design
(2) 2.3%
Activity Equipment &
Resources:
Equipment, Clothing
and Personal
Protective Equipment
(7) 8.1%
Activity Environment:
Infrastructure and
Terrain (2) 2.3%
Activity Leader:
Communication, Instruction
and Demonstration (1) 1.2%
Parents & Carers:
Communication (11)
12.8%
Activity Equipment &
Resources:
Documentation
(11) 12.8%Activity Environment:
Animal and Insect
Hazards (1) 1.2%
Activity Environment:
Weather Conditions
(22) 25.6%
Activity Leader:
Judgement and Decision-
making (2) 2.3%
Activity Leader: Supervision
and Leadership of Activity
(3) 3.5%
Activity Leader: Other
(1) 1.2%
Activity Participant:
Communication and
Following Instructions
(2) 2.3%
Activity Participant:
Compliance with
Procedures, Violations
and Unsafe Acts (2) 2.3%
Activity Participant:
Experience and
Competence (12)
14.0%
Activity Participant:
Judgement and
Decision-making
(7) 8.1%
Activity Participant:
Mental and Physical
Condition (59) 68.6%
Activity Participant:
Planning and
Preparation for Activity
or Trip (1) 1.2%
Activity Participant:
Other (1) 1.2%
Other People In Activity
Group: Mental and Physical
Condition (1) 1.2%
Activity Group Factors:
Group Size (1) 1.2%
Parents & Carers:
Other (1) 1.2%
Activity Equipment &
Resources: Food and
Drink (18) 20.9%
Activity Equipment &
Resources: Medication
(13) 15.1%
Activity Environment:
Trees and Vegetation
(3) 3.5%
Supervisors/Field Managers:
Judgement and Decision-
Making (1) 1.2%
(1) 1.2%
(1) 1.2%
(11) 12.8%
(1) 1.2%
(1) 1.2%(1) 1.2%
(1) 1.2%
(1) 1.2%
(1) 1.2%
(1) 1.2%
(1) 1.2%
(1) 1.2%
Figure 13: Factors and relationships identified as contributors to illness related incidents (n=86). Factors identified in more than one report are shaded in grey, and relationships (i.e. connecting lines) identified in more than one report are bolded.

UPLOADS Data: 1st June 2014 – 31st May 2015
57
Government Department Decisions and Actions, and Regulatory Bodies and Associations
No reports identified factors at the level of ‘Government Department Decisions and Actions’
or ‘Regulatory Bodies and Associations’ that contributed to incidents associated with illness.
Local Area Government, Schools, Parents & Carers, and Higher Level Management
Twelve reports identified factors at the level of ‘Local Area Government, Schools, Parents &
Carers, and Higher Level Management’, which contributed to incidents associated with illnesses. Table
18 shows the contributing factors underpinning each category represented at this level on the
AcciMap (Figure 13).
Table 18: Contributing factors underpinning each category represented on the AcciMap at the ‘Local Area Government, Schools, Parents & Carers, and Higher Level Management’ level
Category and contributing factors n
Parents & Carers: Communication
Information not listed on medical form 6
Failed to report their child’s pre-existing health condition 5
Parents & Carers: Other
Lack of knowledge 1
Schools: Communication
Poor communication of pre-existing condition 1
Two relationships were identified between ‘Parents & Carers’, ‘Schools’ and ‘Activity
Equipment and Resources’, which influenced the conduct of activities. These are presented in Table
19. Noteworthy is the relationship between ‘Parents & Carers: Communication’ and ‘Activity
Equipment and Resources: Documentation’, which was identified as the single most significant
relationship contributing to illnesses in the UPLOADS data, showing the importance of parents
reporting pre-existing conditions.

UPLOADS Data: 1st June 2014 – 31st May 2015
58
Table 19: The relationships between ‘Parents & Carers’, ‘Schools’ and ‘Activity Equipment and Resources’, influencing the conduct of activities
Factor 1 Factor 2 Examples n
Parents & Carers: Communication
Activity Equipment and Resources: Documentation
Failed to report their child’s pre-existing condition
11
Schools: Communication
Activity Equipment and Resources: Documentation
No information provided about dietary requirements
1
Supervisory and Management Decisions and Actions
Three reports identified factors at the level of ‘Supervisory and Management Decisions and
Actions’, which are shown in Table 20.
Table 20: Contributing factors related to ‘Supervisory and Management Decisions and Actions’
One relationship was identified between ‘Supervisor/Field Manager: Activity or Program
Design’ and ‘Activity Environment: Animal and Insect Hazards’, which influenced the conduct of
activities. This is presented in Table 21.
Table 21: The relationship between ‘Supervisor/Field Manager’ and ‘Activity Environment’, influencing the conduct of activities
Factor 1 Factor 2 Examples n
Supervisors/Field Managers: Activity or Program Design
Activity Environment: Animal and Insect Hazards
Insect hazards led to shorter rest breaks during the activity
1
Decisions and Actions of Leaders, Participants, and other Actors at the Scene of the Incident
Seventy-six reports identified factors at the level of ‘Decisions and Actions of Leaders,
Participants and other Actors at the Scene of the Incident’, which contributed to incidents associated
with illnesses.
Category and contributing factors n
Supervisor/Field Manager: Activity or Program Design
Continuing activity in wet weather/cold conditions 2
Supervisor/Field Manager: Judgment and decision making
Did not adapt instructions to age group and skill levels 1

UPLOADS Data: 1st June 2014 – 31st May 2015
59
The role of Activity Leaders and Other People in the Activity Group
Table 22 shows examples of the contributing factors related to ‘Other People in the Activity
Group’ and ‘Activity Leader’ and categories.
Table 22: Contributing factors related to ‘Other People in Activity Group’ and ‘Activity Leader’ categories
Two relationships were identified between the ‘Activity Leader’ and lower level factors,
influencing the conduct of activities. These are shown in Table 23.
Table 23: The relationship between ‘Activity Leader’ and lower level factors, influencing the conduct of activities
Factor 1 Factor 2 Examples n
Activity Leader: Supervision and Leadership of Activity
Activity Equipment & Resources: Food and Drink
Activity leader did not remind participant to drink water through the day
1
Activity Leader: Communication, Instruction and Demonstration
Activity Equipment & Resources: Food and Drink
Activity leader not checking water consumption
1
The role of Activity Participants
Table 24 shows examples of the contributing factors related to the ‘Activity Participant’
categories.
Category and contributing factors n
Other People in Activity Group: Mental and Physical Condition
Symptoms of pre-existing illness - cold and flu 1
Activity Group Factors: Group Size
Group size (general) 1
Activity Leader: Supervision and Leadership of Activity
Supervising fluid intake of participants 2
Supervision and leadership of activity (general) 1
Activity Leader: Judgement and Decision-making
Mistaking gastro for car sickness 1
Providing known allergen food source to participant 1
Activity Leader: Communication, Instruction and Demonstration
Failed to check with group about water consumption during activity 1
Activity Leader: Other
Unaware that sauce contained peanut meal 1

UPLOADS Data: 1st June 2014 – 31st May 2015
60
Table 24: Contributing factors related to ‘Activity Participant’ categories
Six relationships were identified between ‘Activity Participant’ and lower level factors, which
influenced the conduct of activities. These are shown in Table 25.
Category and contributing factors n
Activity Participant: Judgement and Decision-making
Was feeling ill but still decided to participate in activity 3
Not reporting illness in a timely manner 2
Decision to not wear protective clothing (e.g. hat or gloves) 1
Poor hygiene 1
Activity Participant: Mental and Physical Condition
Pre-existing injury or condition (general) 11
Sickness developed while on program (e.g. cold symptoms, headache, stomach ache, dizziness)
10
Symptoms related to pre-existing illness (e.g. asthma, epilepsy, cystic fibrosis) 8
Lack of physical fitness 6
Pre-existing conditions (e.g. cold and flu) 6
Anxiety 5
Symptoms related to pre-existing condition (e.g. vomiting, gastro) 3
Allergy 3
Tiredness or fatigue 2
Menstruation 1
Mentally challenging environment (e.g. loud voices) 1
Pre-existing injury prior to program (e.g. wound or burn) 1
Sun exposure 1
Symptoms related to allergens in activity environment (e.g. rash) 1
Illness due to sharing room with ill person the day before 1
Activity Participant: Communication and Following Instructions
Poor communication of pre-existing injury 2
Not drinking enough water 1
Activity Participant: Experience and Competence
Lack of experience (general) 6
Exceeded ability (general) 2
Inexperience with high temperatures 2
Participant not familiar with activity 2
Activity Participant: Compliance with Procedures, Violations and Unsafe acts
Did not wear a hat 1
Not complying with procedures 1
Activity Participant: Planning and Preparation for Activity or Trip
Prior planning – lack of medication 1
Activity Participant: Other
Carelessness 1
Eating known allergens - unaware of food ingredients 1

UPLOADS Data: 1st June 2014 – 31st May 2015
61
Table 25: The relationships between ‘Activity Participant’ and lower level factors, influencing the conduct of activities
Factor 1 Factor 2 Examples n
Activity Participant: Judgement and Decision-making
Activity Equipment & Resources: Medication
Participant took medication without prescription
1
Activity Participant: Mental and Physical Condition
Activity Equipment & Resources: Food and Drink
Participant reported that he had vomited in the past after eating creamy or cheesy food
1
Activity Participant: Communication and Following Instructions
Activity Equipment & Resources: Documentation
Participant did not put condition on medical form
1
Activity Participant: Communication and Following Instructions
Activity Equipment & Resources: Food and Drink
Participant did not drink enough fluids
1
Activity Participant: Experience and Competence
Activity Environment: Weather Conditions
Participant was unfamiliar with warm conditions
1
Activity Participant: Planning and Preparation for Activity
Activity Equipment & Resources: Medication Participant did not bring Ventolin 1
Equipment, Environment and Meteorological Conditions
Fifty-one reports identified factors at this level which contributed to incidents associated with
illnesses. Table 26 shows the contributing factors related to ‘Activity Equipment & Resources’ and
Table 27 shows the contributory factors related to ‘Activity Environment’ categories.
Table 26: Contributory factors related to ‘Activity Equipment & Resources’ categories
Contributing factors n
Activity Equipment & Resources: Documentation
Not enough detail on medical forms 8
No information on medical form around existing health issues or conditions 4
Activity Equipment & Resources: Equipment, Clothing and Personal Protective Equipment
Lack of appropriate clothing 3
Equipment material causing friction, discomfort (e.g. rubbing pack or PFD) 2
Lack of appropriate equipment 1
Sunscreen caused allergic reaction 1
Activity Equipment & Resources: Food and Drink
Dehydration 18
Anxiety related to new or different food 2
Consumption of foods with allergy 2

UPLOADS Data: 1st June 2014 – 31st May 2015
62
Table 26 (cont.): Contributory factors related to ‘Activity Equipment & Resources’ categories
Category and contributing factors n
Activity Equipment & Resources: Medication (for those involved in the activity)
Cannot swallow pills 1
Did not bring medication 2
Reaction to new medication 1
Not taking medication 3
Ran out of medication 2
Taking non-prescribed medication 2
Other medication issues 2
Table 27: Contributory factors related to ‘Activity Environment’ categories
One relationship was identified between the ‘Activity Environment’ and ‘Activity Equipment
& Resources’, influencing the conduct of an activity. This is shown in Table 28.
Table 28: The impact of the “Activity Environment and Equipment” and other factors
Factor 1 Factor 2 Examples N
Activity Environment: Weather conditions
Activity Equipment & Resources: Food and Drink
Dehydration and heat stress 1
Category and contributing factors n
Activity Environment: Weather conditions
Warm weather impacting on activity 9
Weather conditions (general) 4
Cold temperature impacting on activity 3
Environmental factors - dryness and dust 2
Heat exposure 2
Cold exposure 1
Pre-existing condition made worse by cold weather 1
Windy conditions impacting on activity 1
Activity Environment: Infrastructure and Terrain
Difficult terrain 2
Activity Environment: Trees and vegetation
Allergens from flora in activity environment 3
Injury from thick scrub or shrubbery 1
Activity Environment: Animal and Insect Hazards
Insect hazards prevented sufficient activity rest stops 1

UPLOADS Data: 1st June 2014 – 31st May 2015
63
Near miss incidents
In total, 74 near misses were analysed. These included 66 near misses reported over the
twelve and 8 historical incident reports occurring between February 2013 and June 2014. The
historical data were not included in the calculation of the incidence rates, however all reported
incidents were included in the descriptive analysis.
Across all activities, the average reported near miss rate was .2 incidents per 1000 participants.
This means that less than 1 near miss was reported for every thousand participants involved in a led
outdoor activity. Figure 14 presents a summary of the near miss rate per 1000 participants by activity
type (see Appendix A for a full list of activities). Five near miss incidents were not related to an activity
or program, so were excluded from the Figure. Notably, 35% of the activity types were not associated
with any near miss incidents.
UPLOADS Data: 1st June 2014 – 31st May 2015
64
Figure 14: Near miss incidence rate per 1000 participants by activity type (June 2014 – May 2015). Numbers in brackets represent the number of reported incidents associated with near misses and the number of reported participants associated with the activity, respectively.
(0/1,180)
(0/2,375)
(0/5,469)
(0/378)
(0/28,723)
(0/706)
(0/15,740)
(1/18,491)
(1/10,168)
(1/10,014)
(2/16,336)
(11/79,037)
(4/18,488)
(8/33,757)
(1/4,009)
(11/27,345)
(6/7,820)
(8/10,067)
(6/6,177)
(1/436)
0 0.5 1 1.5 2 2.5
Arts & Crafts
Beach activities
Curriculum activities
Snowsports
Teambuilding games
Trampoline
Residential camps
Archery
Free time outdoors
Harness: indoors
Ocean activities
Harness: outdoors
Wheel sports
Walking/running
Caving
River activities
Camping tents
Campcraft
Travelling
Horse/Camel riding
Reported near miss rate per 1000 participants; (Number of near misses/Number of participants)/1000
Act
ivit
y ty
pe
35% of all activities were not associated with any near misses.

UPLOADS Data: 1st June 2014 – 31st May 2015
65
Demographic information for near miss incidents
The reports included details on 24 people involved in near miss incidents. Figure 15 shows the
number of people involved by role and gender. The majority of participants were male (7 male, 4
female), with a median age of 15 years (range: 10 to 17; 2 missing classification). The majority of
people in the role of Activity Leader, Field/Program Manager and Other (e.g. volunteers and interns)
were also male with an overall median age of 27 (range: 21 to 50 years). However, due to the low
number of reported near miss incidents, nothing can be said regarding the significance of these
demographic differences and no conclusions should therefore be drawn.
Figure 15: Number of people involved in near miss incidents by role and gender.
Potential severity ratings for near miss incidents
Near misses were rated in terms of potential severity. Figure 16 shows a histogram of potential
severity scores for near miss incidents. The median severity was 3 (range: 0 to 6). Half (50%) of the
near miss incidents had a potential severity rating of 2 or 3 (n = 16 and 21, respectively). A severity
rating of 2 indicates an incident where the potential outcome can involve moderate injuries or
illnesses. A severity rating of 3 indicates an incident where the potential outcome can involve major
irreversible damage or threaten life.
4
3 3
4
7
2
1
00
1
2
3
4
5
6
7
8
Participant Activity Leader Field/Program Manager Other
Nu
mb
er
of
Pe
op
le in
Ne
ar M
iss
Inci
de
nt
Role of Person in Near Miss Incident
Male Female
UPLOADS Data: 1st June 2014 – 31st May 2015
66
Figure 16: Potential severity ratings for near miss incidents.
Weather at the time of the incident
Weather at the time of the incident was rated on a 4-point scale across three dimensions (Rain,
Temperature and Wind). The majority of near misses occurred when there was no or minimal rain
(72%), a moderate temperature (70%), and no or minimal wind (74%).
Goals for near miss incidents
The majority of incidents associated with near misses were missing details regarding the goals
associated with the activity (n = 53 missing classification). No further analysis was undertaken.
Profile of activity group for near miss incidents
The mean number of participants involved in activities associated with near misses was 13
(range: 0 to 47, n = 74 incidents). The mean number of Activity Leaders was 2 (range: 0 to 4),
Supervisors (e.g. teachers) was 1 (range: 0 to 4) and Volunteers (e.g. parents) was 1 (range: 0 to 3).
There was an activity ratio of 1 Activity Leader for every 12 participants in activities associated with
near miss incidents.
11
9
16
21
9
1
7
0
5
10
15
20
25
0 1 2 3 4 5 6
Nu
mb
er
of
Ne
ar M
iss
Inci
de
nts
Potential Severity Rating

UPLOADS Data: 1st June 2014 – 31st May 2015
67
In 69% of incidents (n = 51), the Activity Leader was reported to have relevant qualifications,
in 3% (n = 2) the Activity Leader was reported to not have relevant qualification, and in 28% of
incidents (n = 21) qualifications were reported to be “not applicable”. Figure 17 shows the number of
near miss incidents by potential severity ratings, partitioned according to leader qualifications. There
is no clear relationship between the potential severity ratings and the presence or absence of leader
qualifications. However, as with injuries and illnesses, the incidents where leader qualifications were
reported to be “not applicable” are a potential cause for concern, as this accounted for 12 of the 38
incidents (32%) with a potential severity of 3 or higher within the sample. The majority of the incidents
where leader qualifications were reported to be “not applicable” involved campcraft (n = 7); camping
in tents (n = 3); travelling (n = 3); walking/running (n = 3) and incidents not related to an activity (n =
3). It is unclear why these activities were considered not to require a leader with appropriate
qualifications.
Figure 17: The number of near miss incidents by potential severity rating, partitioned according to responses to the question "Did the leader have relevant qualifications".
6 6
14
17
4
1
3
01
01
0 0 0
5
2 23
5
0
4
0
2
4
6
8
10
12
14
16
18
0 1 2 3 4 5 6 0 1 2 3 4 5 6 0 1 2 3 4 5 6
Yes No Not applicable
Nu
mb
er
of
Ne
ar M
iss
Inci
de
nts
Did the leader have relevant qualifications and potential severity ratings

UPLOADS Data: 1st June 2014 – 31st May 2015
68
Contributing factors for near miss incidents
In total, 68 near miss incident reports had enough detail to be coded using the UPLOADS
Accident Analysis Framework (see Figure 1). On average, 2.6 contributing factors were identified per
report. A summary of the factors and relationships identified is presented in Figure 18.

UPLOADS Data: 1st June 2014 – 31st May 2015
69
Government department
decisions and actions
Regulatory bodies and
associations
Local area government,
Schools, Parents & Carers,
and Higher Level
Management
Supervisory and
management decisions and
actions
Decisions and actions of
leaders, participants and
other actors at the scene of
the incident
Equipment, environment and
meteorological conditions
Local Area Government:
Legal Responsibility for
Safety within the Council
Area (1) 1.5%
Supervisors/Field Manager:
Activity or Program Design
(6) 8.8%
Activity Equipment & Resources:
Equipment, Clothing and Personal
Protective Equipment (27) 39.7%
Activity Environment:
Infrastructure and
Terrain (12) 17.6%
Activity Leader:
Communication,
Instruction and
Demonstration (7)
10.3%
Activity Leader:
Compliance With
Procedures, Violations
and Unsafe Acts (7)
10.3%
Supervisors/Field Manager:
Supervision of Activity Leaders
and Other Staff (2) 2.9%
Parents & Carers:
Communication (3)
4.4%
Activity Equipment &
Resources: Documentation
(1) 1.5%
Activity Environment:
Animal and Insect
Hazards (4) 5.9%
Activity Environment:
Weather Conditions (6)
8.8%
Activity Leader:
Experience,
Qualifications and
Competence (2) 2.9%
Activity Leader:
Judgement and
Decision-making (7)
10.3%
Activity Leader:
Planning and
Preparation (3) 4.4%
Activity Leader:
Situation Awareness
(6) 8.8%
Activity Leader:
Supervision and
Leadership of Activity
(9) 13.2%
Activity Leader: Other
(3) 4.4%
Activity Participant:
Communication and
Following Instructions
(15) 22.1%
Activity Participant:
Compliance With
Procedures, Violations and
Unsafe Acts (8) 11.8%
Activity Participant:
Experience and
Competence (13)
19.1%
Activity Participant:
Judgement and
Decision-making (12)
17.6%
Activity Participant:
Mental and Physical
Condition (9) 13.2%
Activity Participant:
Situation Awareness
(10) 14.7%
Activity Participant:
Other (5) 7.4%
Other People in Activity
Group: Communication
and Following
Instructions (1) 1.5%
Other People in Activity
Group: Experience,
Qualifications,
Competence (2) 2.9%
Other People in Activity
Group: Supervision of
Activity (1) 1.5%
Activity Group Factors:
Group Composition (1)
1.5%
Activity Group Factors:
Group Dynamics (2)
2.9%
Higher Level
Management: Policies
and Procedures for
Activities and
Emergencies (1) 1.5%
Higher Level
Management: Risk
Assessment and
Management (2)
2.9%
Parents & Carers:
Planning and
Preparation for Activity
or Trip (1) 1.5%
Activity Equipment &
Resources: Food and
Drink (6) 8.8%
Activity Equipment &
Resources: Medication
(1) 1.5%
Activity Environment:
Trees & Vegetation (4)
5.9%
Activity Environment:
Water Conditions (4)
5.9%
Other People in Activity
Group: Judgement and
Decision-making (2)
2.9%
Other People in Activity
Group: Planning and
Preparation for Activity
or Trip (1) 1.5%
Other People in Activity
Group: Situation
Awareness (1) 1.5%
Activity Group Factors:
Communication Within
Group (1) 1.5%
Higher Level
Management: Training
and Evaluation of Staff
(1) 1.5%
Other People In Activity
Environment: Compliance
with Procedures, Violations
and Unsafe Acts (1) 1.5%
Higher Level
Management: Financial
Constraints (1) 1.5%
(1) 1.5%
(1) 1.5%
(1) 1.5%
(2) 2.9%
(2) 2.9%
(1) 1.5%
(1) 1.5%
(2) 2.9%
(1) 1.5%
(1) 1.5%
(1) 1.5%
(1) 1.5%
(1) 1.5%
(2) 2.9%
(1) 1.5%
(1) 1.5%
(1) 1.5%
(1) 1.5%
Figure 18: Factors and relationships identified as contributors to near miss incidents (n=68). Factors identified in more than one report are shaded in grey, and relationships (i.e. connecting lines) identified in more than one report are bolded.

UPLOADS Data: 1st June 2014 – 31st May 2015
70
Government Department Decisions and Actions, and Regulatory Bodies and Associations
No reports identified factors at the level of ‘Government Department Decisions and Actions’
or ‘Regulatory Bodies and Associations’ that contributed to a near miss incident.
Local Area Government, Schools, Parents & Carers, Higher Level Management
Seven reports identified factors at the level of ‘Local area government, Schools, Parents &
Carers, Higher Level Management’, which contributed to near miss incidents. Table 29 shows the
contributing factors underpinning each category represented at this level on the AcciMap (Figure
18).
Table 29: Contributing factors underpinning each category represented on the AcciMap at the ‘Local area government, Schools, Parents & Carers, Higher Level Management’ level
Category and contributing factors n
Local area Government: Legal Responsibility for Safety within the Council Area
Roads not maintained 1
Parents and Carers: Planning and Preparation for Activity or Trip
Inadequate food supplied for participant 1
Parents and Carers: Communication
Aggressive or angry parent 1
Information not listed on medical form 1
Did not inform of their child’s pre-existing health condition 1
Poor communication skills 1
Higher Level Management: Financial Constraints
Insufficient Equipment maintenance and repair 1
Higher Level Management: Training and Evaluation of Staff
Time constraints and driver training 1
Higher Level Management: Risk Assessment and Management
Failure to identify risks associated with cable tension - flying fox 1
Safety strop colour of instructor was the same as participant’s, causing entanglement 1
Higher Level Management: Policies and Procedures for Activities and Emergencies
Standard operating procedures regarding activities not clear 1
Three relationships were identified between factors at this level and ‘Activity Equipment &
Resources’, influencing the conduct of activities. These are shown in Table 30.
UPLOADS Data: 1st June 2014 – 31st May 2015
71
Table 30: The relationships between ‘Local Area Government, Schools, Parents & Carers, Higher Level Management’ and ‘Activity Equipment & Resources’, influencing the conduct of activities
Factor 1 Factor 2 Examples n
Higher Level Management: Financial Constraints
Activity Equipment & Resources: Equipment, Clothing and Personal Protective Equipment
Used equipment with normal wear and tear, but possibly needed to be maintained better
1
Parents & Carers: Communication
Activity Equipment & Resources: Documentation
Not notified of pre-existing condition
1
Parents & Carers: Planning and Preparation for Activity or Trip
Activity Equipment & Resources: Food and Drink
Parents not supplying correct food for participants allergies
1
Supervisory and Management Decisions and Actions
Eight reports identified factors at the level of ‘Supervisory and Management Decisions and Actions’,
which contributed to near miss incidents. Table 31 shows the contributing factors underpinning each
category represented at this level on the AcciMap.
Table 31: Contributing factors underpinning each category represented on the AcciMap at the ‘Supervisory and Management Decisions and Actions’ level
Category and contributing factors n
Supervisor/Field Manager: Activity or Program Design
Fatigue and tiredness due to program activities and length of camp 4
Insufficient preparation/training of participants for activity 1
Time constraints of activity 1
Supervisor/Field Manager: Supervision of Activity Leaders and other Staff
Insufficient field checks by supervisors 1
Supervision of staff not adequate 1
Three relationships were identified between factors at the level of ‘Supervisory and
Management Decisions and Actions’ and lower level factors, influencing the conduct of activities.
This is shown in Table 32.

UPLOADS Data: 1st June 2014 – 31st May 2015
72
Table 32: Relationships between ‘Supervisory and Management Decisions and Actions’ and lower level factors, influencing the conduct of activities
Factor 1 Factor 2 Examples n
Supervisor/Field Manager: Activity or Program Design
Activity Leader: Communication, Instruction and Demonstration
Students had only had one hour skills session and on-water mentoring
1
Supervisor/Field Manager: Activity or Program Design
Activity Participant: Communication and Following Instructions
Participants forgot briefing instructions due to fatigue
1
Supervisor/Field Manager: Activity or Program Design
Activity Participant: Experience and competence
Instruction on how to adjust the route for different terrains needed to be given (to suit ability level)
1
Decisions and Actions of Leaders, Participants and other Actors at the Scene of the Incident
Fifty-nine reports identified factors at the level of ‘Decisions and Actions of Leaders,
Participants and other Actors at the Scene of the Incident’, which contributed to incidents associated
with a near miss.
The role of the Other People in the Activity Group and Activity Group factors
Table 33 show the contributing factors related to the ‘Other People in the Activity Group’
and ‘Activity Group’ categories.
Table 33: Contributing factors related to ‘Other People in the Activity Group’ and ‘Activity Group’ categories
Category and contributing factors n
Other People in Activity Environment (not in activity group): Compliance with Procedures, Violations and Unsafe acts
Not complying with road rules 1
Activity Group Factors: Group Dynamics
Fighting in the group 2
Group dynamics (general) 1
Activity Group Factors: Group Composition
The ability/capacity of the group to complete the activity or program 1
Activity Group Factors: Communication within Group
Communication between vessels 1
Other People in Activity Group: Communication and Following Instructions
School staff did not follow supervision instructions 1

UPLOADS Data: 1st June 2014 – 31st May 2015
73
Table 33 (cont.): Contributing factors related to ‘Other People in the Activity Group’ and ‘Activity
Group’ categories
No relationships were identified that involved factors related to ‘Other People in the Activity
Group’ or ‘Activity Group Factors’.
The role of the Activity Leader
Table 34 shows the contributing factors related to ‘Activity Leader’ categories.
Table 34: Contributing factors related to ‘Activity Leader’ categories
Category and contributing factors n
Activity Leader: Planning and Preparation
Gas lead to BBQ not connected 1
Pre departure checks insufficient 1
Tie downs not checked 1
Checking equipment is clear of participant 1
Activity Leader: Judgement and Decision-making
Camping under trees 2
Misreading environmental conditions 2
Made the wrong decision by letting a fatigued participant take part in activity 1
Activity continued in high water conditions 1
Activity not cancelled when flying fox speeds became inconsistent 1
Allowed kids to navigate while leader did not know the route 1
Activity Leader: Communication, Instruction and Demonstration
Participants required more instruction or briefing for activity 3
Miscommunication between activity staff 3
Better communication to the group 1
Unclear instructions provided by activity leader 1
Category and contributing factors n
Other People in Activity Group: Experience, Qualifications, Competence
Driver experience - not driving to road conditions 1
Lack of education and understanding around the need to ask for dietary requirements 1
Other People in Activity Group: Judgement and Decision-making
Time constraints 1
Travelling on unfamiliar tracks 1
Other People in Activity Group: Planning and Preparation for Activity or Trip
Insufficient departure checks 1
Other People in Activity Group : Situation Awareness
Distracted 1
Other People in Activity Group: Supervision of Activity
Female teachers not present 1

UPLOADS Data: 1st June 2014 – 31st May 2015
74
Table 34 (cont.): Contributing factors related to ‘Activity Leader’ categories
Category and contributing factors n
Activity Leader: Experience, Qualifications and Competence
Expedition leader unfamiliar with route 1
Participant not observed on flying fox change over due to lack of experience 1
Activity Leader: Compliance with Procedures, Violations and Unsafe Acts
Trailer door not latched correctly 1
Failed to check whether cooking equipment was assembled correctly prior to use 1
Driving over the speed limit 1
Harness not checked prior to leaving the ground 1
Not checking whether participant’s hair is worn appropriately for helmet safety 1
State issued driver log book not with driver 1
Leaders not walking whole route or track prior to activity 1
Activity Leader: Situation Awareness
Lack of attention to surroundings 1
Lack of awareness of vehicle and road 1
Recognising tidal of water effects too late 1
Leader distraction 1
Lack of awareness of location using map 1
Not paying sufficient attention during bike riding 1
Activity Leader: Supervision and Leadership of Activity
Lack of supervision and leadership of activity (general) 4
Incident was not witnessed by leader 1
Not watching belayer closely 1
Not observing fly fox changeover 1
Lack of supervision regarding safety 1
Staff performing risky rescue on his own, leaving the rest of the group with insufficient number of supervisors
1
Activity Leader: Other
Carelessness 2
Fumbling a twist lock carabineer 1
Eight relationships between ‘Activity Leader’ factors and other factors at an equal or lower
level were identified, which influenced the conduct of activities. These are shown in Table 35.
Table 35: Relationships between Activity Leaders and other factors, influencing the conduct of activities
Factor 1 Factor 2 Examples n
Activity Leader:
Planning and
Preparation
Activity Equipment and
Resources: Equipment,
Clothing and Personal
Protective Equipment
BBQ was not connected
correctly 1

UPLOADS Data: 1st June 2014 – 31st May 2015
75
Table 35 (cont.): Relationships between Activity Leaders and other factors, influencing the conduct of activities
Factor 1 Factor 2 Examples n
Activity Leader:
Judgement and
Decision-making
Activity Environment:
Weather Conditions Misread environmental
conditions regarding
weather
1
Activity Leader:
Judgement and
Decision-making
Activity Environment:
Trees and Vegetation Camping under trees 2
Activity Leader:
Judgement and
Decision-making
Activity Environment:
Water conditions Decision to continue activity
in high water conditions 1
Activity Leader:
Judgement and
Decision-making
Activity Leader:
Experience,
Qualifications and
Competence
The expedition leader did not
know the route and still
allowed the kids to navigate
1
Activity Leader:
Experience,
Qualifications and
Competence
Activity Leader:
Supervision and
Leadership of Activity
A lack of activity leader’s
experience meant that participant
was not supervised
1
Activity Leader:
Supervision and
Leadership of Activity
Activity Participant:
Experience and
Competence
Insufficient or lack of supervision
led to incorrect technique or
mistakes by inexperienced
participants
2
Activity Leader:
Other
Activity Environment:
Infrastructure and
Terrain
As the terrain was really easy, the
instructor became complacent 1
The role of Activity Participants
Table 36 shows the contributing factors related to ‘Activity Participant’ categories.
Table 36: Contributing factors related to ‘Activity Participant’ categories
Category and contributing factors n
Activity Participant: Mental and Physical Condition
Tiredness or fatigue 2
Symptoms related to pre-existing condition (mental health, behaviour issues) 2
Lack of physical fitness 1
Menstruation 1
Mentally challenging environment (e.g. loud voices) 1
Sickness developed while on program (e.g. cold symptoms, headache, stomach ache, dizziness)
1
Symptoms related to pre-existing condition (e.g. knee injury, wrist injury) 1

UPLOADS Data: 1st June 2014 – 31st May 2015
76
Table 36 (cont.): Contributing factors related to “Activity Participant” categories
Multiple relationships were identified between ‘Activity Participant’ factors and factors at
lower levels, which influenced the conduct of activities. These are shown in Table 37.
Category and contributing factors n
Activity Participant: Compliance with Procedures, Violations and Unsafe Acts
Unclipped from safety line 3
Aiming bow and arrow at others 1
Not complying with procedures 1
Not engaging with equipment safely 1
Placing bag over head of others 1
Throwing rocks and stones 1
Activity Participant: Communication and Following Instructions
Not following instructions (general) 6
Participants did not follow instructions to paddle away from hazard 3
Descended on flying fox without moving safety strop 1
Not attentive to brief for activity 1
Misunderstanding instructions 1
Participant not compliant with instructions given on how to do activity or task 1
Poor communication between belayer and climber 1
Unclipping from safety line before instructed 1
Activity Participant: Judgement and Decision-making
Errors in judgement and decision making (general) 3
Decision to detach from the safety tether while on high ropes 2
Cycling too close to others 1
Deliberately swung upside-down on flying fox 1
Entering a boat that was floating away from the dock 1
Lowering participant on abseil as they were still holding onto wall holds 1
Not concentrating on task 1
Participant decision to throw object too close to others 1
Participant late reporting of snake sighting 1
Activity Participant: Situation Awareness
Not paying attention or aware of surroundings 4
Not detecting danger in activity environment 2
Unaware of dangers associated with terrain (e.g. slipperiness, risk of rock fall) 2
Distraction 1
Equipment inattention 1
Activity Participant: Experience and Competence
Exceeded ability (general) 4
Lack of experience (general) 3
Poor technique in executing activity 2
Unaware of potential risks 1
Misjudged rapid 1
Not breaking correctly (flying fox) 1
Lack of experience with terrain (horseback riding) 1
Activity Participant: Other
Carelessness 5

UPLOADS Data: 1st June 2014 – 31st May 2015
77
Table 37: Relationships between ‘Activity Participant’ and other factors, influencing the conduct of activities.
Factor 1 Factor 2 Examples n
Activity Participant: Communication and Following Instructions
Activity Equipment & Resources: Equipment, Clothing and Personal Protective Equipment
Instructions around use of safety equipment were not followed
2
Activity Participant: Compliance with Procedures, Violations and Unsafe Acts
Activity Equipment & Resources: Equipment, Clothing and Personal Protective Equipment
Student was unclipped from any form of safety line
2
Activity Participant: Judgement and Decision-making
Activity Environment: Animal and Insect Hazards
Snake sighting was not reported until dinner time
1
Activity Participant: Situation Awareness
Activity Environment: Animal and Insect Hazards
Participant did not see the snake
1
Equipment, Environment and Meteorological Conditions
Forty-nine reports identified factors at the level of ‘Equipment, Environment and Meteorological
Conditions’, which contributed to near miss incidents. Table 38 shows the contributing factors
underpinning each category represented at this level on the AcciMap.
Table 38: Contributing factors related to ‘Activity Environment’ and ‘Activity Equipment’ categories
Category and contributing factors n
Activity Environment: Weather Conditions
Windy conditions impacting on activity 3
Wet weather, rain and showers 2
Warm weather impacting on activity 1
Weather conditions (general) 1
Activity Environment: Trees and Vegetation
Tree or tree limbs falling on or near campsite 3
Tree obstructed recovery of canoe 1
Activity Environment: Water Conditions
Natural obstruction or strainer in water environment 1
Strong tides and currents 1
Water faster than anticipated 1
Water higher than normal 1
Activity Environment: Animal and Insect Hazards
Snake sighted on track 4
Snake on participant’s shoe (unaware) 1

UPLOADS Data: 1st June 2014 – 31st May 2015
78
Table 38 (cont.): Contributing factors related to ‘Activity Environment’ and ‘Activity Equipment’ categories
No relationships were identified between ‘Activity Equipment & Resources’ and ‘Activity
Environment’. However, 12 relationships were identified between ‘Activity Equipment & Resources’,
‘Activity Environment’ and other factors, which are shown in previous tables (Table 30, Table 35 and
Table 37).
Category and contributing factors n
Activity Environment: Infrastructure and Terrain
Rocky terrain or ground cover causing slip or trip 3
Traversing a steep track or hill 3
Dislodged rock falling on or near others 2
Driving with trailer on gravel road 1
Walking on 4X4 track 1
Wet or slippery terrain 1
Pot hole in path or track 1
Terrain (general) 1
Insufficient space to turn van around 1
Activity Equipment & Resources: Equipment, Clothing and Personal Protective Equipment
Burns related to cooking equipment (e.g. trangia or hot pan) 5
Lack of appropriate equipment 4
Carrying a heavy load 4
Equipment material causing friction, discomfort (e.g. rubbing pack or PFD) 3
Carabineer or ropes not correctly located 3
Equipment (general) 2
Faulty equipment 2
Damaged equipment 1
Collision with equipment 1
Missing equipment 1
Sharp knife 1
Activity Equipment & Resources: Documentation
Not enough detail on medical forms 1
Not notified of health issue or existing condition 1
Activity Equipment & Resources: Medication
Did not bring medication 1
Activity Equipment & Resources: Food and Drink
Lack of food 2
Anxiety related to new or different food 1
Dehydration 1
Consumption of foods with allergy 1
Boiling water knocked over 1
Certain foods were past expiry date 1

UPLOADS Data: 1st June 2014 – 31st May 2015
79
Discussion
The aim of this report was to present the findings from an analysis of the data contributed to
the UPLOADS National Incident Dataset in the period between the 1st of June 2014 and 31st May 2015.
The aim is to provide a holistic understanding of the incidents that occurred during this period within
led outdoor activities in Australia. The following discussion reflects on the key findings and themes
and outlines some of the key implications for the sector.
Incident rates
The analysis presented indicates that, for this dataset, the injury rate for led outdoor activities
in Australia is low (2.1 per 1000 participants). It is worth emphasising, however, that caution should
be urged as the incident rate presented here may underestimate the actual incidence of injuries due
to potential underreporting. That said, the low injury rate reported is encouraging and is particularly
striking when compared to estimates of injury rates per 1000 participants for other organised sports
in Australia. For example, in a study of sports and active recreation injury in the Latrobe Valley, cricket
had the highest rate of 242 injuries per 1000 participants, followed by horse-riding (122 injuries per
1000 participants), soccer (107 injuries per 1000 participants) and netball (51 injuries per 1,000
participants; Finch, Cassell, & Stathakis, 1999). The UPLOADS incidence data could not be compared
with more recent data sets or incidence rates in other contexts such as attending schools or being at
home, due to a lack of incidence data within these locations or due to a reporting format incompatible
with the UPLOADS format (per 1000 participants). In addition to the low rate, the vast majority of
injuries were rated as having only a short-term impact on participation. In the current data set, only
42 injuries (out of 676) were reported to require hospitalisation.
Contributing factors
A significant contribution of the analysis presented is that it enables practitioners to identify
contributing factors and relationships that could be focussed on for prevention strategies. Whilst the
UPLOADS Data: 1st June 2014 – 31st May 2015
80
purpose of this report is not to identify specific areas for improvement, the major findings in terms of
the contributing factors identified are discussed below. It is important to note here that it is up to
organisations, and the sector, to incorporate the information provided in this report into their existing
risk management approaches.
The data analysed indicates that there were, on average, 2.2 contributing factors involved in
each injury-causing incident. These contributing factors were found at the four lower levels of the
UPLOADS Accident Analysis Framework: Equipment, Environment and Meteorological Conditions;
Decisions and Actions of Leaders, Participants, and other Actors at the Scene of the Incident;
Supervisory and Management Decisions and Actions; and Local Area Government, Schools, Parents &
Carers, Higher Level Management. This finding provides further evidence that led outdoor activity
injuries represent a systemic issue (Salmon et al., 2014) and adds weight to the notion that led outdoor
activity incident reporting systems should attempt to collect data on contributing factors across all
levels of the system. Rather than simply be the outcome of participant or instructor actions, the
network of events preceding led outdoor activity incidents can involve the decisions and actions of
many actors from across the overall system, including those outside of activity providers (e.g. schools,
parents, peak bodies). A key implication of this is that interventions developed by organisations and
the sector need to focus on factors across the sector as a whole, rather than only on instructors,
equipment, and the environment.
Whilst the majority of contributing factors reported were related to activity participants,
leaders, equipment, and the environment; this and other analyses (e.g. Salmon et al., 2012; 2014, In
Press) suggest that other contributing factors are involved in shaping participant and leader
behaviours, use of equipment, and the environment in which activities take place. In this and other
datasets, the prominent reporting of factors related to activity participants, leaders, equipment, and
the environment, but lower or lack of reporting of factors related to higher levels (i.e. Government
Department Decisions and Actions; Regulatory Bodies and Associations; Local Area Government,
Schools, Parents & Carers, and Higher Level Management; Supervisory and Management Decisions

UPLOADS Data: 1st June 2014 – 31st May 2015
81
and Actions), may be a by-product of the limited exposure that the sector has had to systems thinking
in accident causation. In addition, it may also be related to a lack of awareness of how higher level
factors such as actions and decisions by the Government or Regulatory Bodies impact the conduct of
led outdoor activities. An important implication then is that further education may be required on the
systems thinking approach to accident causation and indeed on how factors across the led outdoor
activity system might influence activity and leader behaviour, use of equipment, and the environment
in which activities take place. This can be delivered via practitioner workshops, practitioner articles,
and other standard dissemination activities. One key requirement is that ‘sector champions’ emerge
and push systems thinking and UPLOADS philosophies within organisations and the wider sector.
The relationships identified provide some important conclusions regarding accident causation
and prevention in relation to this dataset. For example, in relation to activity equipment factors,
associations (i.e. the lines in the AcciMap) were identified with supervisors, activity and program
design, risk assessment, training and evaluation of staff, planning and preparation, and participants.
The implication of this is that not just lower level factors, but the whole system including the
relationships between the factors (e.g. representing a lack of communication between certain actors)
contributes to incidents. Prevention efforts should focus on removing the whole network of
contributing factors, not just the prominent factors at the lower levels.
Reporting
From the data provided during the first twelve months of UPLOADS, some important
conclusions for incident reporting in the sector can be drawn. Of the 35 participating organisations,
31 provided participation and/or incident data. Just over half of the injury-causing incidents contained
sufficient information to enable further analysis and subsequent identification of contributing factors.
An important implication is that further education may be needed around the level of detail required
in the incident description of the report to be able to identify contributing factors.

UPLOADS Data: 1st June 2014 – 31st May 2015
82
Finally, compared to the number of incidents reported, a disproportionate number of near
miss incidents were reported (only 7% of the 1020 incidents reported). These findings again suggest
that there is work to do with regard to the sector’s current reporting culture. In particular, efforts
should focus on educating the sector on the importance and benefits of reporting all incidents, on
what kind of information and detail to report, and on the importance of near miss reporting. Overall,
further effort is required to build a stronger reporting culture within the led outdoor activity sector.
This will increase the uptake of UPLOADS and will enhance the quality of the data reported by users.
Limitations
It should be acknowledged that UPLOADS is a relatively new initiative and that there remain
opportunities for improvement. Accordingly, there are several limitations worthy of mention in
relation the analysis presented. First, generalisability is potentially limited due to the short period of
data collection and limited number of organisations who contributed data. This will improve as more
organisations begin to use UPLOADS and a larger dataset is acquired over time.
Second, the reported injury rate may underestimate the actual incidence of injuries for various
reasons, such as underreporting of injuries that do not require treatment or organisations choosing
not to report more serious injuries. However, the large number of minor injury-causing incidents
reported indicates that the organisations involved in the study readily reported this type of incident.
Third, the extremely low number of reported near miss incidents suggests that this area
warrants further attention within organisations and from the UPLOADS research team. On the one
hand, it may indicate that there is not a strong culture of reporting near miss incidents within the
sector. On the other hand, the definition of a near miss may not be suitable for the led outdoor activity
domain, as it was adopted from the healthcare field. In response to this, a PhD research program
focussing exclusively on near miss incidents in the led outdoor activity sector has recently been
initiated by the UPLOADS research team.

UPLOADS Data: 1st June 2014 – 31st May 2015
83
Fourth, under half of all reported injury incidents contained sufficient associated information
to support further analysis with the UPLOADS Accident Analysis Method. This means that critical
information regarding incident causation could not be gleaned from approximately a third of injury
incident reports. Further work with the sector is required to increase the quality of the incident
descriptions. Despite these limitations, the analysis presented represents the most comprehensive
incident data available for led outdoor activities in Australia.
Conclusion
This report presents the findings from an analysis of the first twelve months use of UPLOADS.
There are a number of important conclusions that can be taken from the analysis presented. These
relate both to incidents and incident causation in led outdoor activities, and also to incident reporting
within the sector.
First, it is concluded that UPLOADS provides the sector with a usable system to report and
analyse participation and incidents. It also shows that it is possible for organisations across the sector
to report usable data that sheds light on contributing factors. Whilst there is work to do in order to
enhance uptake of the system and indeed the quality of the data reported, it is clear that UPLOADS
will be an important tool for the sector in their delivery of safe led outdoor activities.
Second, compared to other sport and active recreation pursuits, the injury rate associated
with led outdoor activities in Australia appears to be low (2.1 per 1000 participants). Caution is urged
when using this figure, however, and further verification via a larger dataset is recommended (i.e.
forthcoming 18 and 24 month UPLOADS reports).
Third, as in most complex sociotechnical systems, the analysis shows that adverse events
(injuries, illnesses, and near miss incidents) in led outdoor activities have multiple contributing factors
from across the system as a whole. It is concluded from this that incident prevention strategies should
focus on the network of contributing factors driving adverse events, as opposed to factors associated
only with instructors, participants, equipment and the activity environment.
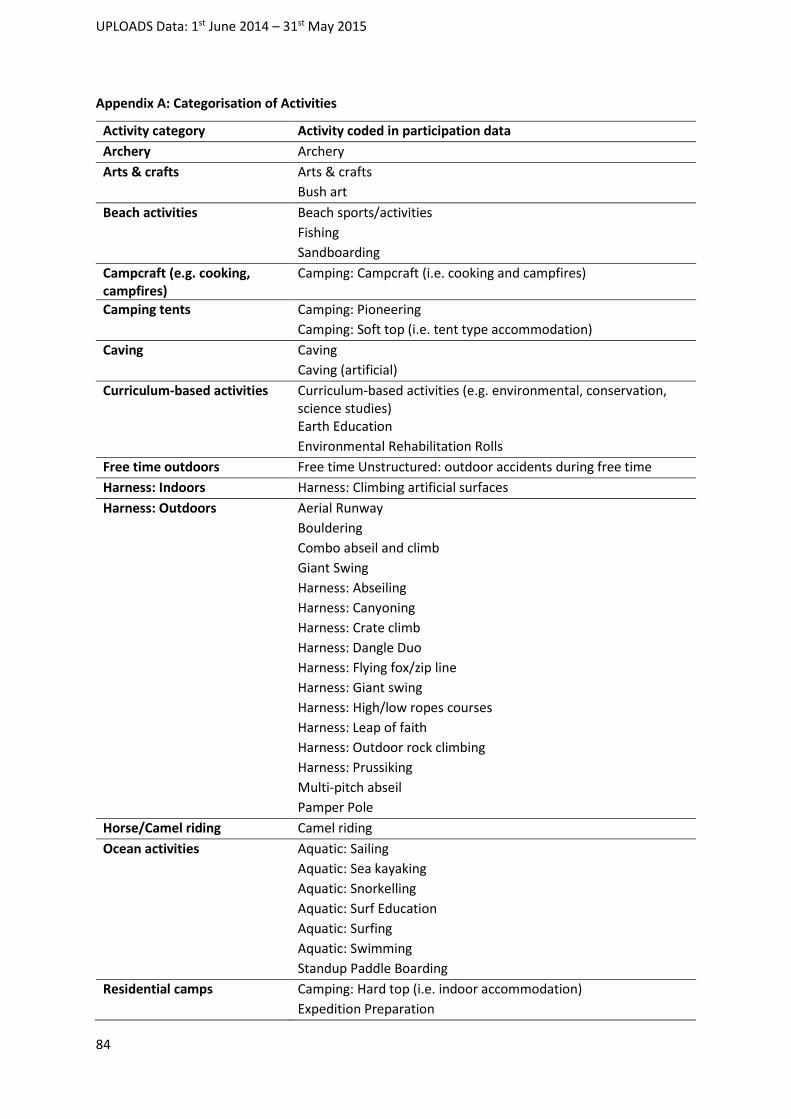
UPLOADS Data: 1st June 2014 – 31st May 2015
84
Appendix A: Categorisation of Activities
Activity category Activity coded in participation data
Archery Archery
Arts & crafts Arts & crafts
Bush art
Beach activities Beach sports/activities
Fishing
Sandboarding
Campcraft (e.g. cooking, campfires)
Camping: Campcraft (i.e. cooking and campfires)
Camping tents Camping: Pioneering
Camping: Soft top (i.e. tent type accommodation)
Caving Caving
Caving (artificial)
Curriculum-based activities Curriculum-based activities (e.g. environmental, conservation, science studies)
Earth Education
Environmental Rehabilitation Rolls
Free time outdoors Free time Unstructured: outdoor accidents during free time
Harness: Indoors Harness: Climbing artificial surfaces
Harness: Outdoors Aerial Runway
Bouldering
Combo abseil and climb
Giant Swing
Harness: Abseiling
Harness: Canyoning
Harness: Crate climb
Harness: Dangle Duo
Harness: Flying fox/zip line
Harness: Giant swing
Harness: High/low ropes courses
Harness: Leap of faith
Harness: Outdoor rock climbing
Harness: Prussiking
Multi-pitch abseil
Pamper Pole
Horse/Camel riding Camel riding
Ocean activities Aquatic: Sailing
Aquatic: Sea kayaking
Aquatic: Snorkelling
Aquatic: Surf Education
Aquatic: Surfing
Aquatic: Swimming
Standup Paddle Boarding
Residential camps Camping: Hard top (i.e. indoor accommodation)
Expedition Preparation

UPLOADS Data: 1st June 2014 – 31st May 2015
85
Appendix A (cont.): Categorisation of Activities
Activity category Activity coded in participation data
River activities Aquatic: Canoeing Aquatic: Dragon Boating
Aquatic: Kayaking (flatwater)
Aquatic: Rafting (flatwater)
Aquatic: Rafting (whitewater)
Raft Making
Rock Pooling / Creek Dipping
Snowsports Snow: Skiing (Cross-country/Nordic)
Snow: Skiing (Downhill)
Snow: Snowboarding
Teambuilding games Animal Games
Initiatives/Team games
Night Time Activities
Trampoline Trampoline
Travelling - by bus Travelling - by bus
Walking/running outdoors Adventure Course
Adventure Racing
Bird watching
Bushwalking
Farm Days
Geocaching
Guided Tour
Kite-flying
Laser Skirmish
Orienteering/Rogaining
Running activities
Solo Day/Environmental Interpretation
Wheel sports Wheel sports: Billy Carts
Wheel sports: Cycling (bmx)
Wheel sports: Mountain biking
Wheel sports: Quad biking
Wheel sports: Skating - inline and skateboarding

UPLOADS Data: 1st June 2014 – 31st May 2015
86
References
Dickson, T. J. (2012). Learning from injury surveillance and incident analysis. In T. J. Dickson & T. Gray (Eds.), Risk Management in the Outdoors: A Whole-of-Organisation Approach for Education, Sport and Recreation (pp. 204-230). Cambridge University Press: Cambridge, GB.
Finch, C. F., Cassell, E., & Stathakis, V. (1999). The epidemiology of sport and active recreation injury in the la trobe valley: Monash University Accident Research Centre.
Goode, N., Finch, C., Cassell, E., Lenne, M. G., & Salmon, P. M. (2014). What would you like? Identifying the required characteristics of an industry-wide incident reporting and learning system for the led outdoor activity sector. Australian Journal of Outdoor Education, 17(2), 2-15.
Goode, N., Salmon, P. M., Lenne, M., & Finch, C. F. (2014). A test of a systems theory-based incident coding taxonomy for risk managers. Paper presented at the 5th Applied Human Factors and Ergonomics International Conference, Krakow, Poland.
Grant, E., Goode, N., Salmon, P., Lenne, M., Finch, C., & Scott-Parker, B. (2015). “How do I save it?” Usability evaluation of a systems theory-based incident reporting software prototype by novice end users. Paper presented at the HCI International 2015, Los Angeles, U.S.A.
Rasmussen, J. (1997). Risk management in a dynamic society: A modelling problem. Safety Science, 27(2/3), 183-213.
Salmon, P. M., Cornelissen, M., & Trotter, M. J. (2012). Systems-based accident analysis methods: A comparison of Accimap, HFACS, and STAMP. Safety Science, 50(4), 1158-1170.
Salmon, P. M., Goode, N., Lenné, M. G., Finch, C. F., & Cassell, E. (2014). Injury causation in the great outdoors: A systems analysis of led outdoor activity injury incidents. Accident Analysis & Prevention, 63, 111-120. doi: http://dx.doi.org/10.1016/j.aap.2013.10.019
Salmon, P. M., Goode, N., Taylor, N., Dallat, C., Finch, C., Lenne, M. G. (In Press). Rasmussen's legacy in the great outdoors: a new incident reporting and learning system for led outdoor activities. Applied Ergonomics. Accepted for publication 14th July 2015
Salmon, P. M., Williamson, A., Lenne, M., Mitsopoulos-Rubens, E., & Rudin-Brown, C. M. (2010). Systems-based accident analysis in the led outdoor activity domain: Application and evaluation of a risk management framework. Ergonomics, 53(8), 927-939. doi: 10.1080/00140139.2010.489966
Taylor, N. Z., Goode, N., Salmon, P. M., Lenne, M. G., & Finch, C. F. (2015a). Which code is it? Inter-rater reliability of systems theory-based causal factor taxonomy for the outdoor sector. Paper presented at the 19th Triennial Congress of the International Ergonomics Association, Melbourne, Australia.
Taylor, N. Z., Goode, N., Salmon, P. M., Lenne, M. G., & Finch, C. F. (2015b). Inter-rater reliability of a causal factor taxonomy that uses systems theory designed for the outdoor domain. Paper presented at the AHFE2015, 1st International Conference on Human Factors in Sports and Outdoor Recreation, Las Vegas, U.S.A.