the uptake and distribution of selected heavy metals … · 2020. 1. 28. · table 4.5: results of...
TRANSCRIPT

,~:
THE UPTAKE AND DISTRIBUTION OF SELECTEDHEAVY METALS IN THE FRESHWATER CRAB,
POTAMONAUTES PERLATUS (MILNE EDWARDS), IN THEEERSTE RIVER, WESTERN CAPE
. ',.'
BYREINETTE GEORGENIE SNYMAN
FULFILMENTOR THE DEGREE
LSCIENCE
FACULTY OF AGRICULTURAL SCIENCESUNIVERSITY OF STELLENBOSCH
OCTOBER 1996
SUPERVISOR: PROFESSOR J.A.J. NEL.CO-SUPERVISOR: PROFESSOR A.J. REINECKE

DECLARAnON
I, the undersigned, hereby declare that the work contained in this thesis is my own original work
and that I have not previously in its entirety or in part submitted it at any university for a degree.
Signature: ~tJ";:_",,·r.•~,,,,:=Gf-ll1A'--::':=='I_.~_<,,----- Date: _....;;d--=.5-+/_J_1-+/_i_o.,-1'-_I~"""'__,r }
ABSTRACT
A number of studies on the general physico-chemical character of the Eerste River, Western
Cape, had previously been done, but the problem of heavy metal pollution had, by 1993, not
been addressed. A study was therefore undertaken from 1993-1995 in order to investigate these
aspects. Since several researchers have shown that freshwater crabs accumulate certain heavy
metals in their bodies and may therefore be used as monitors of environmental heavy metal
pollution, the present study concentrated mainly on metal concentrations (Mn, Zn, Cu, Pb and
Cd) in the local freshwater crab species, Potamonautes perlatus, and its possible use as
biomonitor in the Eerste River.
Two localities in the Eerste River were chosen,. in order to make comparisons, namely a
relatively uncontaminated site in the Assegaaibosch Nature Reserve, Jonkershoek, and a visibly
polluted site downstream from Stellenbosch, behind Stellenbosch Farmers' Winery (SFW).
Crabs, water and sediment samples were collected seasonally at both localities, and metal
concentrations thereof determined by atomic absorption spectrophotometry.
The results showed that the Eerste River down to the SFW locality is still relatively unpolluted
in terms of heavy metals. It was, however, clear that runoff from the Stellenbosch municipal,
industrial and agricultural areas do have an influence on other physico-chemical features of the
river. The concentrations of heavy metals in whole crabs, tissues and carapace showed that Zn
concentration was well regulated in P. perlatus from both localities, Mn and Cu were
accumulated in individuals from SFW, and Pb and Cd accumulated in both populations.
Compartmentalization of heavy metals was shown to occur in P. perlatus: the carapace was
found to be the most important storage site for Mn, Zn and Pb, the carapace and gonads equally
important for Cd storage, and the digestive gland the most important site for Cu storage.
Whereas gender was shown, generally, to be of little importance in heavy metal uptake in P.
perlatus, crab body size and seasonality were both shown to influence heavy metal uptake to
some extent. However, only summer peaks in whole crab, carapace and tissue manganese
concentrations were shown to correlate with peaks in environmental Mn concentrations.
It was concluded that P. perlatus would possibly only be a Suitable monitor of environmental
Mn, Pb and Cd pollution, although there is no guarantee that the crab body would accurately
reflect environmental concentrations. It was also ascertained that, since a study of the sperm
ultrastructure of P. perlatus showed a significantly larger number of abnormal spermatozoa in
male crabs from ,SFW, and since these observed differences could possibly be related to heavy
metal exposure, the sperm of this species might be a more reliable indicator of heavy metal
pollution. It was finally concluded that more intensive research need to be undertaken on various
aspects, especially the use of the spermatozoon as indicator of environmental heavy metal
pollution, and that the results of the present study could serve as a basis for future studies.

ii
UITTREKSEL
'n Aantal studies oor die algemene fisiese en chemiese eienskappe van die Eersterivier, Wes
Kaap, is voorheen gedoen, maar die probleem van swaarmetaalbesoedeling is, teen 1993, nog nie
aangeraak nie. 'n Studie is dus ondemeem, van 1993-1995, om hierdie aspekte te ondersoek.
Aangesien verskeie navorsers bevind het dat varswaterkrappe sekere swaarmetale in hul liggame
akkumuleer en dus moontlik as monitors van omgewingsbesoedeling Lt.v. swaarmetale kan dien,
het die huidige studie hoofsaaklik gekonsentreer op metaalkonsentrasies (Mn, Zn, Cu, Pb en Cd)
in die plaaslike varswaterkrapspesie, Potamonautes perlatus, asook sy moontlike gebruik as
biomonitor in die Eersterivier.
Twee lokaliteite in die Eersterivier is gekies om vergelykings te kan tref, naamlik 'n relatief
ongekontamineerde plek in die Assegaaibosch Natuurreservaat, Jonkershoek, en 'n ooglopend
besoedelde plek stroomaf vanStellenbosch, agter Stellenbosch Boere Wynmakery (SBW).
Krappe, water- en sedimentrnonsters is seisoenaal by albei lokaliteite versamel, en
metaalkonsentrasies daarvan bepaal d.m.v. atoomabsorpsie spektrofotometrie.
Die resultate het getoon dat die Eersterivier tot by die SBW lokaliteit nog relatief onbesoedel is
i.t.v. swaarmetale. Dit was egter duidelik dat afloop vanaf die Stellenbosch munisipale,
industril!le en landbougebiede wei 'n invloed het op ander fisiese en chemiese eienskappe van die
rivier. Die swaarmetaalkonsentrasies in heel krappe, weefsels en die karapaks, het getoon dat Zn
konsentrasie goed gereguleer is in P. perlatus eksemplare van albei lokaliteite, Mn en eu
geakkumuleer is in eksemplare van SBW, en Pb en Cd geakkumuleer is in beide bevolkings.
Kompartementalisasie van swaarmetale is waargeneem in P. perlatus: die karapaks was die
belangrikste bergingsplek van Mn, Zn en Pb, die karapaks en gonades ewe belangrik vir Cd
berging, en die spysverteringsklier die belangrikste bergingsplek vir Cu. Terwyl dit geblyk het
dat geslag nie baie belangrik is in die opneem van swaarmetale in P. perlatus nie, het krap
liggaamsgrootte en seisoenaliteit weI geblyk om, tot 'n lTIate, 'n invloed te he op die opneem van
swaarmetale. Slegs die somer pieke vir mangaankonsentrasies in heel krap, karapaks en weefsel
het egter gekorreleer met pieke in omgewingskonsentrasies.
Daar is tot die gevolgtrekking gekom dat P. perlatus moontlik slegs 'n paslike monitor van
omgewingsbesoedeling met Mn, Pb en Cd sal kan wees. Daar is egter geen waarborg dat die
krapliggaam omgewingskonsentrasies akkuraat sal weerspiel!1 nie. Dit is ook bevind dat,
aangesien 'n studie van die' sperm ultrastruktuur van P. perlatus 'n beduidend groter getal
abnormale spermselle in manlike krappe van SBW opgelewer het, en aangesien die waargenome
verskille moontlik herlei kan word na metaalblootstelling, die spermsel van hierdie spesie
moontlik 'n met::r betroubare indikator van swaarmetaalbesoedeling kan wees. Die finale
gevolgtrekking was dat meer intensiewe navorsing oor verskeie aspekte ondemeem moet word,
veral oor die gebruik van die spermatosoon as indikator van omgewingsbesoedeling met

111
swaannetale, en dat die resliitate van die hllidige studie sal kan dien as basis vir toekomstige
studies.
---000---

Dedicated to my Heavenly Father
"... Who is able to do immeasurably more than all we ask or imagine,according to His power that is at work within us, to Him be glory... "
Ephesians 3:20-21
and to my parents, Genie and the late Chris Snyman, my role-models.

IV
ACKNOWLEDGEMENTS
I would like to express my sincere gratitude to the following persons, all of whom have
contributed, in their special ways, towards this research project:
Q. To my supervisor, Professor J.A.J. Nel and co-supervisor, Professor AJ. Reinecke, for their
valuable advice, assistance and encouragement.
Q To Dr S.A. Reinecke, for help with the interpretation of the electron micrographs.
Q To Mari de Beer, for her countless hours of unselfish assistance with the electron
microscopical work and photography.
Q To Mrs Wilna Kloppers of the Department of Water Affairs for her kind assistance.
Q To Mr Marius Visser for the scanning of the electron micrographs and for adding the final
touches to them.
Q To my colleagues and friends, especially Tanya Cousin, Martin Purves, Michael Somers and
Laura Vermeulen, for their help in the field and laboratory, their support and
encouragement.
Q To my mother, Mrs Genie Snyman and brother Pierre, for all their love, support,
encouragement and constant belief in my abilities.
---000---

CONTENTS
Page
ABSTRACT .i
UlTTREKSEL ii
ACKNOWLEDGEMENTS .iv
LIST OF TABLES vii
LIST OF FIGURES xx
CHAPTER 1: INTRODUCTION 1-5
* Aims of the Study 4
CHAPTER 2: STUDY AREA 6-11
* General Description 6
* Climate and Rainfall ; 6
* Vegetation 8
* Fauna 8
* Localities 8
CHAPTER 3: MATERIALS AND METHODS .12-16
* 1. Crab samples 12
* 2. Water and sediment samples , 14
* 3. Sperm ultrastructure 15
CHAPTER 4: PHYSICO-CHEMICAL CONDITIONS AT THE
CHOSEN LOCALITIES IN THE EERSTERIVER .17-29
* Introduction 17
* Materials and Methods 18
* Results 18
* Discussion 27
CHAPTER 5: CONCENTRATIONS OF MANGANESE IN THE FRESHWATER
CRAB, POTAMONAUTES PERLATUS 30-56
* Introduction 30
* Materials and Methods 31
* Results 31
* Discussion : 53
v

CHAPTER 6: CONCENTRATIONS OF ZINC IN THE FRESHWATER
CRAB, POTAMONAUTES PERLATUS 57-84
* Introduction 57
* Materials and Methods 58
.* Results 58
* Discussion 79
CHAPTER 7: CONCENTRATIONS OF COPPER IN THE FRESHWATER
CRAB, POTAMONAUTES PERLATUS 85-111
* Introduction 85
* Materials and Methods 86
* Results 86
* Discussion 107
CHAPTER 8: CONCENTRATIONS OF LEAD IN THE FRESHWATER
CRAB, POTAMONAUTES PERLATUS 112-136
* Introduction 112
* Materials and Methods 113
* Results 113
* Discussion 134
CHAPTER 9: CONCENTRATIONS OF CADMIUM IN THE FRESHWATER
CRAB, POTAMONAUTES PERLATUS 137-162* Introduction : 137
*Materials and Methods 138
* Results 138
* Discussion 159
CHAPTER 10: HEAVY METALS AND THE SPERMATOZOA
OF POTAMONAUTES PERLATUS 163-172
* Introduction 163
* Materials and Methods 164
* Results 164
* Discussion 171
CHAPTER 11: CONCLUSIONS : 173
REFERENCES 176
VI

vii
LIST OF TABLES
Page
Table 2.1: Rainfall data for the period 1993-1995, for Stellenbosch and Jonkershoek,
including total annual and mean daily rainfall (mm) 7
Table 2.2: Temperature data for the period 1993-1995, for Stellenbosch and
Jonkershoek, including mean daily, absolute maximum and absolute minimum
temperatures (OC) 7/8
Table 4.1: Results of Student's t-test for the differences in water heavy metal
concentrations (mg.l-1) between the two localities: Jonkershoek (1) and SFW
(S) : 20
Table 4.2: Results of the Mann-Whitney test for the differences in water zinc
concentrations (mg.l- I) between the two localities: Jonkershoek (J) and SFW (S) 20
Table 4.3: Mean values of physical and chemical features of water, collected at
selected stations in the Eerste River. Stations: 1. Jonkershoek Nature Reserve; 2.
Assegaaibosch Nature Reserve; 3. Plankenburg River (Adam Tas bridge); 4.
Stellenbosch Farmers' Winery; 5. Below confluence of Veldwachters and Eerste
Rivers 21
Table 4.4: Results of the Mann-Whitney test for differences between chemical and
physical data of water from stations 2 and 4: Assegaaibosch (1) and SFW (S) (Cond.
= conductivity; Temp. = temperature; Diss.02 = dissolved oxygen; S.sol. =
suspended solids; N03 = nitrates; P04 = phosphates; Hard = hardness; T.col. = total
coliforms and F.col. = faecal coliforms) 22
Table 4.5: Results of Student's t-test for the differences between sediment heavy
metal concentrations (flg.g- 1 dry mass) at the two localities: Jonkershoek (1) and
SFW (S) 23
Table 5.1: Results of Student's t~test for differences in whole crab manganese
concentrations (flg.g-1 wet mass) of the various size classes at each locality 37
Table 5.2: Results of the Mann-Whitney test for differences in manganese
concentrations (flg.g- I wet mass) of medium sized crabs and the other size classes,
from SFW 37
Table 5.3: R2-values calculated for sizes of crabs and selected tissue and carapace
manganese concentrations (OF =Degrees of freedom; Dig.gland = digestive

V11l
gland) ; 38
Table 5.4: Mean manganese concentrations (Jlg.g- I .wet mass) in the muscles,
digestive gland, gonads, gills and carapace of crabs from the Eerste River
(Jonkershoek and SFW data pooled) 38
Table 5.5: Results of Student's t-test for the differences in mean tissue and carapace
manganese concentration (Jlg.g- I wet mass) of crabs (Jonkershoek and SFW data
pooled; Mean logarithms of manganese concentrations used for the calculation of the
t-value) 38/39
Table 5.6: Results of Student's t-test for the differences in mean whole crab
manganese concentration (Jlg.g- I wet mass) from Jonkershoek and SFW (Mean
logarithms of the whole crab manganese concentrations used in the t-test) 39
Table 5.7: Results of Student's t-test for the differences in mean whole crab
manganese concentration (Jlg.g- I wet mass) of large and small size classes from
Jonkershoek (J) andSFW (S) (Mean logarithms of manganese concentrations used in
the t-test) 39
Table 5.8: Results of the Mann-Whitney test for the differences in manganese
concentrations (Jlg.g- I wet mass) of medium sized crabs from Jonkershoek (J) and
SFW (S) 39
Table 5.9: Results of Student's t-test for the differences in mean tissue manganese
concentration (Jlg.g- I wet mass) of crabs from Jonkershoek (J) and SFW (S) (Mean
logarithms of the tissue manganese concentrations used in the t-test) 40
Table 5.10: Results of the Mann-Whitney test for the differences in mean carapace
manganese concentration (Jlg.g- l wet mass) of crabs from the two localities,
Jonkershoek (J) and SFW (S) 40
Table 5.11: Results of Student's t-test for the differences in mean whole crab
manganese concentration (Jlg.g- I wet mass) of males and females (Mean logarithms
of the whole crab manganese concentrations used to calculate the t-value) 41
Table 5.12: Results of Student's t-test for the differences in mean tissue and carapace
manganese concentration (Jlg.g- I wet mass) of male (m) and female (f) crabs (Mean
logarithms of the. tissue and carapace manganese concentrations used to calculate the
t-value) 41
Table 5.13: Results of Student's t-test for the seasonal differences in whole crab
manganese concentrations (J.1g.g-1 wet mass) 42

IX
Table 5.14: Results of Student's t-test for the differences in mean crab carapace
summer, autumn and winter manganese concentrations (Jlg.g-1 wet mass) (Mean
logarithms of seasonal manganese concentrations used to calculate the t-value) 43
Table 5.15: Results of the Mann-Whitney test for differences in crab carapace
manganese concentration (Jlg.g- 1 wet mass) of spring and the other seasons 43
Table 5.16: Results of Student's t-test for the seasonal differences in mean crab
muscle manganese concentration (Jlg.g-1 wet mass) (Mean logarithms of seasonal
manganese concentrations used to calculate the t-value) 44
Table 5.17: Results of Student's t-test for seasonal differences in mean crab gill
manganese concentration (Jlg.g-1 wet mass) (Mean logarithms of seasonal
manganese concentrations used to calculate the t-value) 45
Table 5.18: Results of Student's t-test for seasonal differences in mean crab digestive
gland manganese concentration (Jlg.g-1 wet mass) (Mean logarithms of seasonal
manganese concentrations used to calculate the t-value) 45/46
Table 5.19: Results of Student's t-test for seasonal differences in mean crab gonad
manganese concentration (Jlg.g- 1 wet mass) (Mean logarithms of seasonal
manganese concentrations used to calculate the t-value) 46
Table 5.20: Results of Student's t-test for differences in whole crab (Jlg.g-1 wet
mass) and water manganese concentrations (mg.l-1) at each locality: Jonkershoek (J)
and SFW (S), as well as the bioconcentration factor (BCFw)' calculated for whole
crabs (Mean logarithms of manganese concentrations used for the t-test; t = t-value,
p = p-value) 47
Table 5.21: Results of Student's t-test ~or differences in crab tissue (Jlg.g-1 wet mass)
and water manganese concentrations (mg.l- l ) at each locality, as well as the
bioconcentration factor (BCFw) calculated for all tissues (Dig.gland = digestive
gland; t = t-value, p = p-value) 47
Table 5.22: Results of the Mann-Whitney test for differences in crab carapace (Jlg.g
1 wet mass) and water manganese concentrations at each locality, Jonkershoek (J)
and SFW (S), as well as the bioconcentration factor (BCFw) calculated for the
carapace (z = z-value, p = p-value) 48
Table 5.23: Results of Student's t-test for the differences in manganese
cuncentrations (Jlg.g- 1 wet mass) in whole crabs and sediments from Jonkershoek (1)
and SFW (S), as well as the bioconcentration factor (BCFs) calculated for whole

x
crabs (Mean logarithms of manganese concentrations used to calculate the t-value; t
= t-value, p = p-value) 48
Table 5.24: Results of Student's t-test for the differences in mean manganese
concentration (llg.g-1 wet mass) in selected crab tissues and sediments at each
locality, as well as the bioconcentration factor (BCFs) calculated for all tissues
(Dig.gland = digestive gland; Mean logarithms of manganese concentrations used to
calculate the t-value; t =t-value, p =p-value) 49
Table 5.25: Results of the Mann-Whitney test for the differences in manganese
concentrations (llg.g-1 wet mass) of the crab carapace and sediments at each locality,
Jonkershoek (1) and SFW (S), as well as the bioconcentration factor (BCFs)
calculated for the carapace (z = z-value, p = p-value) , 49
Table 6.1: Results of Student's t-test for differences in whole crab zinc
concentrations (llg.g-1 wet mass)of the various size classes at each locality 64
Table 6.2: R2-values calculated for sizes of crabs and selected tissue and carapace
zinc concentrations (DF = Degrees of freedom; Dig.gland = digestive gland) 64
Table 6.3: Mean zinc concentration (llg.g-1 wet mass) in the muscles, digestive
gland (dig. gland), gonads, gills and carapace of crabs from the Eerste River
(Jonkershoek and SFW data pooled) 65
Table 6.4: Results of Student's t-test for the differences in mean tissue and carapace
zinc concentration (llg.g- 1 wet mass) of crabs (Jonkershoek and SFW data pooled;
Mean logarithms ofzinc concentrations used for the calculation of the t-value) 65
Table 6.5: Results of Student's t-test for the differences in mean whole crab zinc
concentration (llg.g- 1 wet mass) from Jonkershoek and SFW (Mean logarithms of
the whole crab zinc concentrations used in the t-test) 66
Table 6.6: Results of Student's t-test for the differences in mean whole crab zinc
concentration (llg.g-1 wet mass) for the various size classes, small, medium and
large, from Jonkershoek (J) and SFW (S) (Mean logarithms of zinc concentrations
used in the t-test) 66
Table 6.7: Results of Student's t-test for the differences in mean tissue zinc
concentration (llg.g-1 wet mass) of crabs from Jonkershoek (1) and SFW (Mean
logarithms of the tissue zinc concentrations used in the test) 67

Xl
Table 6.8: Results of the Mann-Whitney test for the differences in mean crab
carapace zinc concentration (J,lg.g-I wet mass) from the two localities, Jonkershoek
(J) and SFW 67
Table 6.9: Results of Student's t-test for the differences in mean whole crab zinc
concentration (J,lg.g-l wet mass) of males and females (Mean logarithms of the
whole crab zinc concentrations used to calculate the t-value) 68
Table 6.10: Results of Student's t-test for the differences in mean tissue and carapace
zinc concentration (J,lg.g-I wd mass) of male (m) and female (f) crabs (Mean
logarithms of the tissue and carapace zinc concentrations used to calculate the t-
value) , 68
Table 6.11: Results of the Mann-Whitney test for the differences in muscle and gill
zinc concentrations (J,lg.g-I wet mass) of male (m) and female (f) crabs 68
Table 6.12: Results of the Mann-Whitney test for the seasonal differences in whole
crab zinc concentrations (J,lg.g-I wet mass) 69
Table 6.13: Results of Student's t-test for seasonal differences in mean crab carapace
zinc concentration (J,lg.g-I wet mass) (Mean logarithms of seasonal zinc
concentrations used to calculate the t-value) 70
Table 6.14: Results of Student's Hest for seasonal differences in mean crab muscle
zinc concentration (J,lg.g-I wet mass) (Mean logarithms of seasonal zinc
concentrations used to calculate the t-value) 70171
Table 6.15: Results of Student's t~test for seasonal differences in mean crab gill zinc
concentration (J,lg.g-1 wet mass) (Mean logarithms of seasonal zinc concentrations
used to calculate the t-value) 71
Table 6.16: Results of Student's t-test for the seasonal differences in mean crab
digestive gland zinc concentration (J,lg.g-I wet mass) (Mean logarithms of digestive
gland zinc concentrations used to calculate the t-value) 71172
Table 6.17: Results of Student's t-test for the seasonal differences in mean crab
gonad zinc concentration (J,lg.g-1 wet mass) (Mean logarithms of seasonal gonad
zinc concentrations used to calculate the t-value) 72
Table 6.18: Res~lts of the Mann-Whitney test for differences in whole crab (J,lg.g-I
wet mass) and water zinc concentrations (mg.!-I) at each locality: Jonkershoek (J)
and SFW (S), as well as the bioconcentration factor (BCFw) calculated for whole
crabs (z = z-value, p = p-value) 73

Xli
Table 6.19: Results of the Mann-Whitney test for differences in crab tissue, carapace
(I!g.g-l wet mass) and water zinc concentrations (mg.!-l) at each locality, as well as
the bioconcentration factor (BCFw) calculated for all tissues and the carapace
(Dig.gland = digestive gland; z = z-value, p = p-value) 73
Table 6.20: Results of Student's t-test for the differences in zinc concentrations
(I!g.g-l wet mass) of whole crabs and sediments from the two localities, Jonkershoek
(1) and SFW (S), as well as the bioconcentration factor (BCFs) calculated for whole
crabs (Mean logarithms of zinc concentrations used to calculate the t-value; t = t-
value, p =p-value) 74
Table 6.21: Results of Student's t-test for the differences in zinc concentrations
(I!g.g-l wet mass) of the sediments and crab tissues at each locality: Jonkershoek and
SFW, as well as the bioconcentration factor (BCFs) calculated for all tissues
(Dig.gland = digestive gland; mean logarithms of manganese concentrations used to
calculate the t-value; t = t-value, p =p-value) 74
Table 6.22: Results of the Mann-Whitney test for differences in zinc concentrations
(I!g.g-l wet mass) of the crab carapace and sediment from Jonkershoek (1) and SFW
(S), as well as the bioconcentration factor (BCFs) calculated for the carapace (z = z-
value, p = p-value) ; 75
Table 7.1: Results of the Mann-Whitney test for differences in whole crab copper
concentrations (I!g.g-l wet mass) of the various size classes at each locality 92
Table 7.2: R2-values calculated for sizes of crabs and selected tissue and carapace
copper concentrations (DF = Degrees offreedom; Dig.gland = digestive gland) 92
Table 7.3: Mean copper concentration (I!g.g-l wet mass) in the muscles, digestive
gland (dig. gland), gills, gonads and carapace of crabs from the Eerste River
(Jonkershoek and SFW data pooled) 93
Table 7.4: Results of Student's t-test for the differences in mean crab tissue and
carapace copper concentration (I!g.g-l wet mass) (Jonkershoek and SFW data
pooled; Mean logarithms of copper concentrations used for the calculation of the t-
value) 93
Table 7.5: Results of the Mann-Whitney test for the differences in whole crab copper
concentrations (I!g.g-l wet mass) from Jonkershoek and SFW 94
Table 7.6: Results of the Mann-Whitney test for the differences in whole crab copper
concentrations (I!g.g-l wet mass) of the various size classes, small, medium and
large, from Jonkershoek (J) and SFW (S) 94

Xlll
Table 7.7: Results of Student's t-test for the differences in mean tissue and carapace
copper concentration (J,lg.g-l wet mass) of crabs from 10nkershoek (1) and SFW (S)
(Mean logarithms of the tissue and carapace copper concentrations lised in the
test) :. 94
Table 7.8: Results of the Mann-Whitney test for the differences in crab gill copper
concentrations (J,lg.g-I wet mass) from the two localities, 10nkershoek (1) and
SFW , , 95
Table 7.9: Results of the Mann-Whitney test for the differences in whole crab copper
concentrations (J,lg.g-I wet mass) of males and females 95
Table 7.10: Results of Student's t-test for the differences in mean tissue and carapace
copper concentration (J,lg.g-I wet mass) of male (m) and female (f) crabs (Mean
logarithms of the tissue and carapace copper concentrations used to calculate the t-
value) 95
Table 7.11: Results of the Mann-Whitney test for the seasonal differences in whole
crab copper concentrations (J,lg.g-I wet mass) 96
Table 7.12: Results of Student's t-test for the seasonal differences in mean crab
carapace copper concentration (J,lg.g-I wet mass) (Mean logarithms of seasonal
copper concentration used to calculate the t-value) 97
Table 7.13: Results of Student's t-test for the seasonal differences in mean crab
muscle copper concentration (J,lg.g-I wet mass) (Mean logarithms of seasonal copper
concentration used to calculate the t-value) 97/98
Table 7.14: Results of Student's t-test for the differences in mean crab gill copper
concentration (J,lg.g-l wet mass) of autumn, winter and spring (Mean logarithms of
seasonal copper concentrations used to calculate the t-value) 98
Table 7.15: Results of the Mann-Whitney test for the differences in crab gill copper
concentrations (J,lg.g-l wet mass) of summer and the other seasons 98
Table 7.16: Results of the Mann-Whitney test for the differences in crab digestive
gland copper concentrations (J,lg.g-l wet mass) of summer, spring and the other
seasons 99
Table 7.17: Results of Student's t-test for the differences in mean crab digestive
gland copper concentration (J,lg.g-I wet mass) of autumn and winter 99

XIV
Table 7.18: Results of Student's t-test for the seasonal differences in mean crab
gonad copper concentration (llg.g-1 wet mass) (Mean logarithms of gonad copper
concentrations used to calculate the t-value) ; 100
Table 7.19: Results of the Mann-Whitney test for the differences in whole crab
(I!g.g-I wet mass) and water copper concentrations (mg.l-1) at each locality:
Jonkershoek (J) and SFW (S), as well as the bioconcentration factor (BCFw)
calculated for whole crabs (z = z-value, p = p-value) 100
Table 7.20: Results of Student's t-test for differences in mean crab tissue and
carapace (llg.g- 1 wet mass), and water copper concentration (mg.l- I) at each
locality, as well as the bioconcentration factor (BCFw) calculated for the tissues and
carapace (Dig.gland = digestive gland; Mean logarithms of copper concentrations
used to calculate the t-value; t = t-value, p = p-value) 101
Table 7.21: Results of the Mann-Whitney test for differences in crab gill (llg.g- 1 wet
mass) and water copper concentrations (mg.l-1) in Jonkershoek, as well as the
bioconcentration factor (BCFw) calculated for the gills (z = z-value, p = p-
value) 101
Table 7.22: Results of the Mann-Whitney test for differences in copper
concentrations (llg.g- 1 wet mass) of whole crabs and sediments from the two
localities, Jonkershoek (1) and SFW (S), as well as the bioconcentration factor
(BCFs) calculated for whole crabs (z =z-value, p =p-vaiue) 102
Table 7.23: Results of Student's t-test for differences in mean copper concentration
(llg.g- 1 wet mass) of the sediments, crab tissues and carapace at each locality:
Jonkershoek and SFW, as well as the bioconcentration factor (BCFs) calculated for
the tissues and carapace (Dig.gland = digestive gland; Mean logarithms of copper
concentrations used to calculate the t-value; t = t-value, p =p-value) 102
Table 7.24: Results of the Mann-Whitney test for differences in copper
concentrations (llg.g- 1 wet mass) of sediment and crab gills from Jonkershoek (1)
and SFW (S), as well as the bioconcentration factor (BCFs) calculated for the gills (z
= z-value, p = p-value) 103
Table 8.1: Results of the Mann-Whitney test for differences in whole crab lead
concentrations (llg.g-1 wet mass) of the various size classes at each locality 119,
Table 8.2: R2-values calculated for sizes of crabs and selected tissue and carapace
lead concentrations (DF = Degrees offreedom; Dig.gland = digestive gland) 119

xv
Table 8.3: Mean lead concentration (llg.g-I wet mass) in the muscles, digestive
gland (dig. gland), gonads, gills and carapace of crabs from the Eerste River
(Jonkershoek and SFW data pooled) 120
Table 8.4: Results of Student's t-test for the differences in mean crab tissue and
carapace lead concentration (llg.g-1 wet mass) (Jonkershoek and SFW pooled; Mean
logarithms oflead concentrations used for the calculation of the t-value) 120
Table 8.5: Results of the Mann-Whitney test for the differences in whole crab lead
concentrations (llg.g-I wet mass) from Jonkershoek and SFW 121
Table 8.6: Results of the Mann-Whitney test for the differences in whole crab lead
concentrations (llg.g-1 wet mass) for the various size classes, small, medium and
large, from Jonkershoek (1) and SFW (S) 121
Table 8.7: Results of Student's Hest for the differences in mean tissue lead
concentration (llg.g-1 wet mass) of crabs from Jonkershoek (1) and SFW (SF) (Mean
logarithms of the tissue lead concentrations used in the test) 121
Table 8.8: Results of the Mann-Whitney test for the differences in carapace lead
concentrations (llg.g-I wet mass) of crabs from the two localities, Jonkershoek (J)
and SFW (SF) 122
Table 8.9: Results of the Mann-Whitney test for the differences in whole crab lead
concentrations (llg.g-1 wet mass) of males and females 122
Table 8.10: Results of Student's t-test for the differences in mean digestive gland and
gonad lead concentration (llg.g-I·wet mass) of male (m) and female (f) crabs (Mean
logarithms of the tissue lead concentrations used to calculate the t-value) 122I
Table 8.11: Results of the Mann-Whitney test for the differences in carapace, muscle
and gill lead concentrations (llg.g-1 wet mass) of male (m) and female (f) crabs 122
Table 8.12: Results of the Mann-Whitney test for the seasonal differences in whole
crab lead concentrations (llg.g-I wet mass) 123
Table 8.13: Results of the Mann-Whitney test for the seasonal differences in crab
carapace lead concentrations (llg.g-1 wet mass) 124
Table 8.14: Results of the Mann-Whitney test for differences in crab muscle lead
concentrations (llg.g-I wet mass) of summer and the other seasons 125
XVI
Table 8.15: Results of Student's t-test for differences in mean crab muscle lead
concentration (l-Ig.g-1 wet mass) of autumn, winter and spring (Mean logarithms of
seasonal lead concentrations used to calculate the t-value) 125
Table 8.16: Results of the Mann-Whitney test for differences in crab gill lead
concentrations (I-Ig.g-I wet mass) of summer and the other seasons 125
Table 8.17: Results of Student's t-test for differences in mean crab gill lead
concentration (I-Ig.g-I wet mass) of autumn, winter and spring (Mean logarithms of
the seasonal lead concentrations used to calculate the t-value) 126
Table 8.18: Results of Student's t-test for the seasonal differences in mean crab
digestive gland lead concentration (I-Ig.g-I wet mass) (Mean logarithms of lead
concentrations used to calculate the t-value) 126
Table 8.19: Results of Student's t-test for the seasonal differences in mean crab
gonad lead concentration (I-Ig.g-I wet mass) (Mean logarithms of the lead
concentrations used to calculate the t-value) 127
Table 8.20: Results of the Mann-Whitney test for differences in whole crab (I-Ig.g-I
wet mass) and water lead concentrations (mg.!-I) at each locality: Jonkershoek (J)
and SFW (S), as well as the bioconcentration factor (BCFw) calculated for whole
crabs (z = z-value, p = p-value) 127
Table 8.21: Results of Student's t-test for differences in mean crab tissue and
carapace (I-Ig.g-I wet mass), and water lead concentration (mg.!-I) at each locality,
as well as the bioconcentration. factor (BCFw) calculated for all tissues· and the
carapace (Dig.gland = digestive gland; t = t-value, p = p-value) 128
Table 8.22: Results of the Mann-Whitney test for differences in crab carapace (I-Ig.g
1 wet mass) and water lead concentrations (mg.!-I) from SFW, as well as the
bioconcentration factor (BCFw) calculated for the carapace (z = zcvalue, p = p-
value) ; 128
Table 8.23: Results of the Mann-Whitney test for the differences in lead
concentrations (I-Ig.g-I wet mass) of whole crabs and sediments from the two
localities, Jonkershoek (J) and SFW (S), as well as the bioconcentration factor
(BCFs) calculated for whole crabs (z =z-value, p =p-value) 129
Table 8.24: Results of Student's t-test for differences in mean lead concentration
(l-Ig.g- 1 wet mass) of the sediments and crab tissues at each locality: Jonkershoek and
SFW, as well as the bioconcentration factor (BCFs) calculated for all tissues(Dig.gland = digestive gland; t = t-value, p = p-value) 129

XVll
Table 8.25: Results of the Mann-Whitriey test for differences in lead concentrations
(~g.g-l wet mass) of crab carapace and sediment from-Jonkershoek (J) and SFW (S),
as well as the bioconcentration factor (HeFs) calculated for the carapace (z = z-
value, p = p-value) 130
Table 9.1: Results of the Mann-Whitney test for differences in whole crab cadmium
concentrations (~g.g-l wet mass) of the various size classes at each locality 144
Table 9.2: R2-values cal~ulated for sizes of crabs and selected tissue and carapace
cadmium concentrations (DF = degrees of freedom; Dig.gland = digestive
gland) 144
Table 9.3: Mean cadmium concentration (llg.g-l wet mass) in the muscles, digestive
gland (dig.gland), gonads, gills and carapace of crabs from the Eerste River
(Jonkershoek and SFW data pooled) 145
Table 9.4: Results of Student's t-test for the differences in mean crab tissue cadmium
concentration (llg.g-l wet mass) (Jonkershoek and SFW data pooled; Mean
logarithms of tissue cadmium concentrations used for the calculation of the t-
value) 145
Table 9.5: Results of the Mann-Whitney test for differences in crab tissue and
carapace cadmium concentrations (~g.g-l wet mass) (Jonkershoek and SFW data
pooled) 145
Table 9.6: Results of the Mann-Whitney test for the differences in whole crab
cadmium concentrations (llg.g-l wet mass) at Jonkershoek and SFW 146
Table 9.7: Results of the Mann-Whitney test for the differences in whole crab
cadmium concentrations (llg.g-l wet mass) of large and medium sized crabs from
Jonkershoek (J) and SFW (S) 146
Table 9.8: Results of Student's t-test for the differences in mean whole crab cadmium
concentration (llg.g-l wet mass) of small sized crabs from Jonkershoek (J) and SFW
(S) (Mean logarithms of cadmium concentrations used in the t-test) 146
Table 9.9: Results of Student's t-test for the differences in mean digestive gland, gill
and gonad cadmi\lm concentration (llg.g-1 wet mass) of crabs from Jonkershoek (J)
and SFW (S) (Mean logarithms of the tissue cadmium concentrations used in the
test) ; 147

xviii
Table 9.10: Results of the Mann-Whitney test for the differences in muscle and
carapace cadmium concentrations (llg.g-1 wet mass) of crabs from Jonkershoek (J)
and SFW (S) ~ 147
Table 9.11: Results of Student's t-test for the differences in mean whole crab
cadmium concentration (llg.g-1 wet mass) of males and females (Mean logaritluns of
the whole crab cadmium concentrations used to calculate the t-value) 148
Table 9.12: Results of Student's t-test for the differences in mean tissue and carapace
cadmium concentration (llg.g- 1 wet mass) of male (m) and female (f) crabs (Mean
logarithms of the tissue and carapace cadmium concentrations used to calculate the t-
value) , 148
Table 9.13: Results of the Mann-Whitney test for the differences in muscle cadmium
concentrations (llg.g-1 wet mass) of male (m) and female (f) crabs 148
Table 9.14: Results of the Mann-Whitney test for the seasonal differences in whole
crab cadmium concentrations (llg.g-1 wet mass) 149
Table 9.15: Results of Student's t-test for the seasonal differences in mean crab
carapace cadmium concentration (llg.g- 1 wet mass) (Mean logaritluns of the
cadmium concentrations used to calculate the t-value) 150
Table 9.16: Results of Student's t-test for the seasonal differences in mean crab
muscle cadmium concentration (llg.g-1 wet mass) (Mean logarithms of cadmium
concentrations used to calculate the t-value) 150/l51
Table 9.17: Results of Student's t-test for the seasonal differences in mean crab gill
cadmium concentration (llg.g-1 wet mass) (Mean logaritluns of cadmium
concentrations used to calculate the t-value) 151
Table 9.18: Results of Student's t-test for the seasonal differences in mean crab
digestive gland cadmium concentration (llg.g-1 wet mass) (Mean logarithms of
cadmium concentrations used to calculate the t-value) 151/152
Table 9.19: Results of Student's t-test for the seasonal differences in mean crab
gonad cadmium concentration (llg.g-1 wet mass) (Mean logarithms of cadmium
concentrations used to calculate the t-value) 152
Table 9.20: Results of the Mann-Whitney test for differences in whole crab (llg.g-1
wet mass) and water !'admium concentrations (mg.!-I) at each locality: Jonkershoek
(J) and SFW (8), as well as the bioconcentration factor (BeFw) calculated for whole
crabs (z = z-value, p = p-value) 153
XIX
Table 9.21: Results of Student's t-test for differences in mean crab tissue (~g.g-l wet
mass) and water cadmium concentration (mg.l- l ) at each locality, as well as the
bioconcentration factor (BCFw) calculated for the tissues (Dig.gland = digestive
gland; t = t-value, p = p-value) 153
Table 9.22: Results of the Mann-Whitney test for differences in crab muscle and
carapace (~g.g-l wet mass), and water cadmium concentrations (mg.l- l ) at each
locality: Jonkershoek (1) and SFW (S), as well as the bioconcentration factor
(BCFw) calculated for the muscles and carapace (z =z-value, p =p-value) 154
Table 9.23: Results of the Mann-Whitney test for differences in cadmium
concentrations (~g.g-l wet mass) of whole crabs and sediments from the two
localities: Jonkershoek (1) and SFW (S), as well as the bioconcentration factor
(BCFs) calculated for whole crabs (z = z-value, p = p-value) , 154
Table 9.24: Results of Student's t-test for differences in mean cadmium
concentration (~g.g-l wet mass) of the sediments and crab tissues at each locality:
Jonkershoek and SFW, as well as the bioconcentration factor (BCFs) calculated for
the tissues (Dig.gland = digestive gland; Mean logarithms of cadmium
concentrations used to calculate the t-value; t = t-value, p = p-value) 155
Table 9.25: Results of the Mann-Whitney test for differences in cadmium
concentrations (~g.g-l wet mass) of sediments, crab muscles and carapace at each
locality: Jonkershoek (1) and SFW (S), as well as the bioconcentration factor (BCFs)
calculated for the muscles and carapace (z = z-value, p = p-value) 155
Table 10.1: Results of Student's t~test for the differences between the total number of
spermatozoa of P. perlatus per grid block, of males from Jonkershoek and SFW 164
Table 10.2: Results of Student's t-test for the differences between the number of
abnormal spermatozoa of P. perlatus per grid block, of males from Jonkershoek and
SFW 165
---000--

xx
LIST OF FIGURES
Page
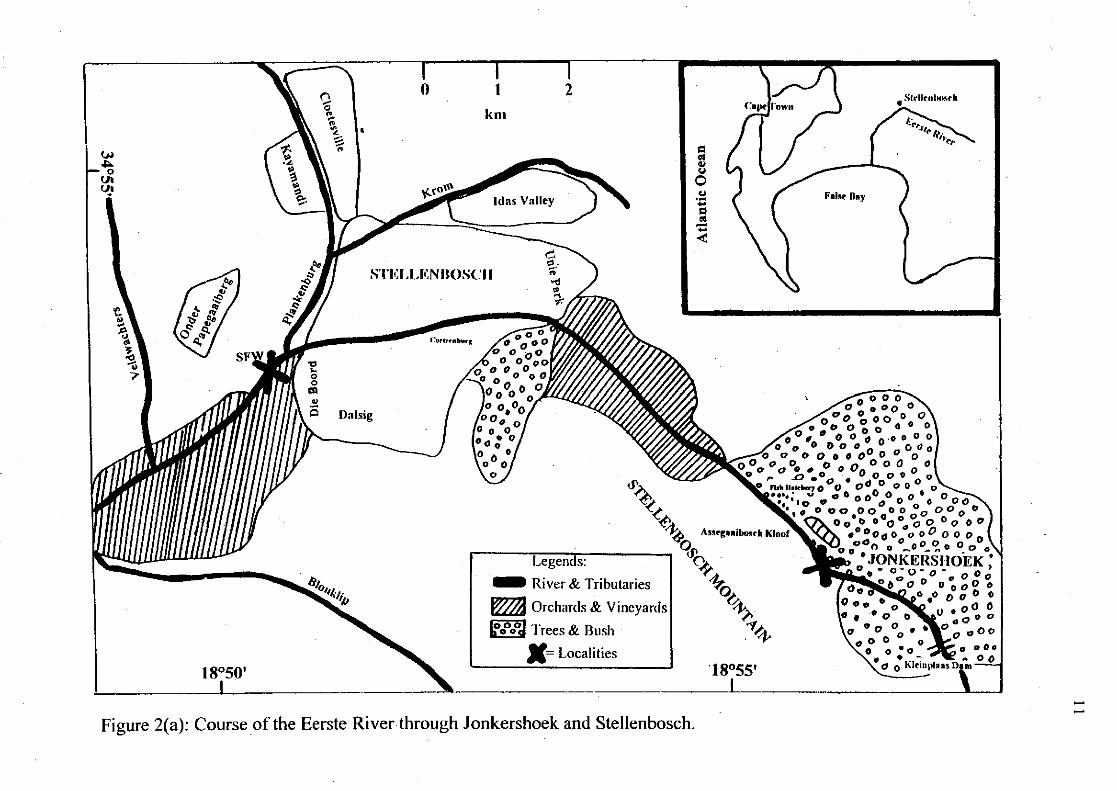
Figure 2(a): Course of the Eerste River through Jonkershoek and Stellenbosch 11
Figures 4(a)-(b): Mean heavy metal concentrations in the water (a) and sediments (b)
at Jonkerhoek and SFW (SO in parenthesis) 24
Figures 4(c)-(g): Mean seasonal heavy metal concentrations (mg/I) in the water at
Jonkershoek and SFW 25
Figures 4(h)-(1): Mean seasonal heavy metal concentrations (~g/g dry mass) in the
sediments at Jonkershoek and SFW 26
Figures 5(a)-(b): Mean manganese concentration in whole crabs (a) and various size
classes (b) from both localities (SO in parenthesis) 50
Figures 5(c)-(d): Mean manganese concentration' in carapace and tissues of P.
perlatus from the Eerste River (SO in parenthesis) 51
Figures 5(e)-G): Mean seasonal manganese concentration in whole crabs, carapace
and tissues of P. perlatus (Jonkershoek and SFW data pooled; SO in parenthesis) 52
Figures 6(a)-(b): Mean zinc concentration in whole crabs (a) and various size classes
(b) from both localities (SO in parenthesis) 76
Figures 6(c)-(d): Mean zinc concentration in carapace and tissues of P. perlatus from
the Eerste River (SO in parenthesis) 77
Figures 6(e)-0): Mean seasonal zinc concentration in whole crabs, carapace and
tissues of P. perlatus (Jonkershoek and SFW data pooled; SO in parenthesis) 78
Figures 7(a)-(b): Mean copper concentration in whole crabs (a) and various size
classes (b) from both localities (SO in parenthesis) 104
Figures 7(c)-(d): Mean copper concentration in carapace and tissues of P. perlatus
from the Eeiste River (SO in parenthesis) 105
Figures 7(e)-G): Mean seasonal copper concentration in whole crabs, carapace and
tissues of P. perlatus (Jonkershoek and SFW data pooled; SO in parenthesis) ;.;.. 106
Figures 8(a)-(b): Mean lead concentration in whole crabs (a) and various size classes
(b) from both localities (SO in parenthesis) 131

XXI
Figures 8(c)-(d): Mean lead conc,~ntration in carapace and tissues of P. perlatus from
the Eerste River (SD in parenthesis) 132
Figures 8(e)-(j): Mean seasonal lead concentration in whole crabs, carapace and
tissues ofP. perlatus (Jonkershoek and SFW data pooled; SD in parenthesis) 133
Figures 9(a)-(b): Mean cadmium concentration in whole crabs (a) and various size
classes (b) from both localities (SD in parenthesis) 156
Figures 9(c)-(d): Mean cadmium concentration in carapace and tissues of P. perlatus
from the Eerste River (SD in parenthesis) 157
Figures 9(e)-(j): Mean seasonal cadmium concentration in whole crabs, carapace and
tissues of P. perlatus (Jonkershoek and SFW data pooled; SD in parenthesis) 158
Figures lO(a): Transmission electron micrograph of a longitudinal section through
the spermatozoon of Potamonautes perlatus. Abbreviations: Dm = dense membrane;
N = nucleus; 0 = operculum; Pc = peripheral cytoplasm; Sa = subacrosomal
chamber; Sp = spermatophore. .. 166
Figures 10(b)-(c): Transmission electron micrographs ofa longitudinal (b) and a cros
section (c) through the spermatozoon of P. perlatus. Abbreviations: C = centrioles;
dm = dense membrane; n = nucleus; sa = subacrosomal membrane 167
Figures lO(d)-(e): Transmission electron micrographs of longitudinal sections
through abnormal spermatozoa of P. perlatus. Abbreviations: dm = dense
membrane; n = nucleus; 0 = operculum and sa = subacrosomal chamber. 168
Figures 10(f)-(g): Transmission electron micrographs of a longitudinal (f) and a
cross (g) section through abnormal sPermatozoa of P. perlatus. Abbreviations: dm =
dense membrane; n = nucleus; 0 = operculum and sa = subacrosomal chamber 169
Figure lOCh): Percentage of abnormal spermatozoa per grid block, of P. perlatus
from Jonkershoek and SFW 170
---000---
-

I
CHAPTERl
INTRODUCTION
Water is one of mankind's most precious resources and needs to be protected and maintained in a
healthy state (Roux et al., 1996). Unfortunately, in South Africa, according to Davies et a!.
(1993), we are already facing a water resources crisis of appalling dimensions.· They state that
South African rivers are not only threatened by UIieven rainfall and extraordinarily high
evaporation rates, but that few rivers in this region have not been affected by over-exploitation,
degradation; pollution and regulation by impoundments.
The destruction of our freshwater ecosystems due to poor management, inconsiderate use and
the needs of a rapidly-expanding human population, is placing tremendous pressure on
conservation bodies to develop new conservation strategies, wherein stricter control of human
activities in and around lakes, dams and rivers, can be implemented. Rivers, especially, are very
vulnerable, since runoff from factories, industries, homes and farms, are dumped directly into
them or reach them through ground water seepage, while human activities such as swimming,
picnicking, boating, etc., cause serious litter problems.
The criteria used to evaluate the degree of pollution in a river are normally those which only
give an indication of organic pollution, such as the amounts of litter and bacteria in and around
the river and the concentrations of oxygen, carbon dioxide, phosphates and nitrates in the water.
This, however, does not present the full picture. A riverine ecosystem might seem relatively
unpolluted, but even small volumes of effluent of industrial, household and agricultural origin
can contain high concentrations of inorganic pollutants, especially heavy metals and pesticides
such as polychlorinated biphenyls (PCB's).
Another problem that arises is that even after it has been established that a river contains
relatively low concentrations of these pollutants, the long term. effects on the entire ecosystem
(fauna included) might still be great and should be investigated.
Many animal species are not apparently adversely affected by sublethal levels of pollutants.
Various are known to regulate the concentrations of heavy metals and PCB's in their bodies,
whilst other species, including plants, bioaccumulate these pollutants in their bodies, to relatively
high concentrations (e.g. Bryan, 1968; de Wet et a!', 1990 and Steenkamp, 1992). Reinecke
(pers. comm.) defines a bioaccumulator as an organism which accumulates xenobiotic
substances over time in its body, thus reflecting exposure levels and bioavailability and possibl~
threat to other participants in the food chain.

2
The question arises whether and to what extent these relatively high concentrations affect the
animals in some other way, for example morphologically, physiologically or behaviourally. A
very popular research topic nowadays involves the effects of pollutants on the sperm
morphology of the animal. For instance, Ackerman (1995), Reinecke et al. (1995) and Reinecke
& Reinecke (1996 in press) have all illustrated the negative effects of heavy metals and
pesticides on the sperm morphology of their study animals.
Several authors have studied the relationship between the concentrations of heavy metals in
aquatic plant species and the degree of water pollution, e.g. de Wet et al. (1990), Manny et al.
(1991) and'van der Merweet al. (1990). Others, however, have concentrated on aquatic animals
such as invertebrates (Bryan, 1971 & 1976; Burrows & Whitton, 1983; Dixit & Witcomb, 1983;
Kiffney & Clements, 1993; Klump et al., 1987; Lynch & Popp, 1988; Sanders & Chandler, 1972
and Timmermans et aI., 1989) and fish (Bezuidenhout et aI., 1990; Seymore et al., 1995 and
Stouthart et aI., 1996).
A number of these studies were carried out over a period of several years and the species
investigated were, therefore, used as biomonitors, e.g. Burrows & Whitton (1983), Kiffney &
Clements (1993) and Lynch & Popp (1988). Van Straalen & Verkleij (1993) defines a
biomonitor as an indicator organism which is used repeatedly in order to establish trends in
environmental quality. Reinecke (pers. comm.) describes an indicator organism, on the other
hand, as one whose responses at various levels can be reliably, specifically and causally linked to
environmental factors.
Since magnification of certain heavy metals and pesticides can occur in the food chain, scientists
are becoming increasingly concerned about the effects on birds and mammals and several
authors, therefore, expanded their ecotoxicological research to include these groups (Mason et
aI., 1986; Mason & Macdonald, 1986; Mason & Sullivan, 1993; Scheuhammer, 1987 and Van
Eeden & Schoonbee, 1993).
•However, the invertebrates remain the best studied group. Extensive research on Crustacea
pollutant interactions have been undertaken, in the field as well as in the laboratory. Topics
range from the metabolic requirements in crustaceans for heavy metals (Depledge, 1989), to
environmental studies and laboratory tests on the accumulation and regulation of heavy metals
by crustaceans (Bryan, 1968; Johns & Miller, 1982; Rainbow & White, 1989 and Van et aI.,
1989) and to the toxic effects of heavy metals and pesticides on these animals (Corner &
Sparrow, 1956 and Weis et al., 1992).
The marine crustaceans, especially, have received much attention. Not only have investigations
been made into heavy metal accumulation, regulation and distribution in these animals, but also
3
into the toxicity of heavy metals and pesticides to various species, as well as their degree of
tolerance to these pollutants.
Among the species studied are the lobster Homarus vulgaris (Bryan, 1965), shrimps such as
Crangon crangon (Rasmussen et aI., 1995) and Palaemon elegans (Rainbow & Nugegoda, 1984
and Rainbow & White, 1989), as well as several species of crab: Portunus pelagicus (Hilmy et
aI., 1988), Scylla serrata (Arumugam & Ravindranath, 1983; 1987), Carcinus mediterraneus
(Devescovi & Lucu, 1995), Carcinus maenas (Rasmussen et aI., 1995; Pedersen & Bjerregaard,
1995 and Rainbow, 1985), the Cancer species, C. pagurus (Lind et aI., 1995) and C. irroratus
(Martin, 1974), Chasmognatus granulata (Rodriguez & Lombardo, 1991), the blue crab
Callinectes sapidus (Engel & Brouwer, 1987) and a number of Uca species: U annulipes, U
triangularis (Devi, 1987) and U uruguayensis (Rodriguez & Lombardo, 1991).
During the past two decades numerous publications have appeared on freshwater crustaceans and
pollutants. Several are field and laboratory studies on the accumulation and regulation of heavy
metals, while others discuss the toxic effects of various pollutants on body processes. The
decapod crustaceans, particularly the freshwater crayfish and crab, have been given the most
publicity. Examples include the crayfish species Orconectes propinquus (Roldan & Shivers,
1987),0. virilis (Bendell Young & Harvey, 1991; France, '1987 and Anderson & Brower, 1978),
Austropotamobius pallipes (Lyon, 1984) and two Cambarus species, namely C. bartoni and C.
robustus (Bendell Young & Harvey, 1991). Rajeswari et al. (1988), Rafi et al. (1991) and
Radhakrishnaiah (1987), have all studied the freshwater field crab OZiotelphusa senex senex,
whereas Tulasi et al. (1987) and Tulasi & Ramana Rao (1988) brought out publications on
Barytelphusa guerini.
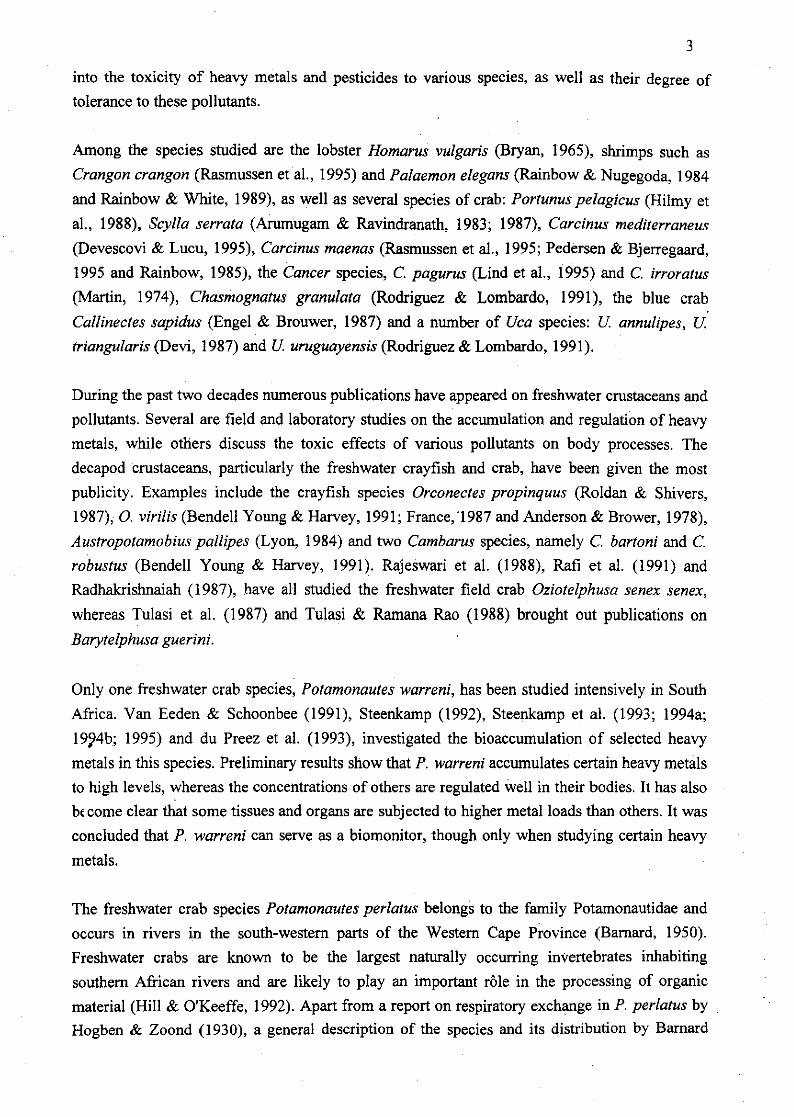
Only one freshwater crab species, Potamonautes warreni, has been studied intensively in South
Africa. Van Eeden & Schoonbee (1991), Steenkamp (1992), Steenkamp et al. (1993; I994a;
19?4b; 1995) and du Preez et aI. (1993), investigated the bioaccumulation of selected heavy
metals in this species. Preliminary results show that P. warreni accumulates certain heavy metals
to high levels, whereas the concentrations of others are regulated well in their bodies. It has also
b, come clear that some tissues and organs are subjected to higher metal loads than others. It was
concluded that P. warreni can serve as a biomonitor, though only when studying certain heavy
metals.
The freshwater crab species Potamonautes perlatus belongs to the family Potamonautidae and
occurs in rivers in the south-western parts of the Western Cape Province (Barnard, 1950).
Freshwater crabs are known to be the largest naturally occurring invertebrates inhabiting
southern African rivers and are likely to play an important role in the processing of organic
material (Hill & O'Keeffe, 1992). Apart from a report on respiratory exchange in P. perlatus by
Hogben & Zoond (1930), a general description of the species and its distribution by Barnard
4
(1950), its ecology, studied by Hill & O'Keeffe (1992) and the sperm ultrastructure, discussed by
Jamieson (1993), very little is known about this species. A full description of its reproductive
cycle is lacking and, until 1993, no ecotoxicological studies on P. perlatus had been done.
With the findings of Van Eeden & Schoonbee (1991) and Steenkamp (1992) as basis, a study
was undertaken from 1993 to 1995, in the Eerste River near Stellenbosch, using P. perlatus as a
biomonitor. Even though there are no heavy industries on the banks of this river or of its
tributaries, there has been growing concern for its future condition, as shown by the
implementation of the Stellenbosch Rivers Interest Group. It was thus found necessary to
investigate the levels of inorganic pollutants, which might originate from the existing factories,
wineries and farmlands in the vicinity, in this ecosystem.
The study was of an ecotoxicological nature and dealt with the accumulation, regulation and
distribution of selected heavy metals in the body, as well as the possible sublethal effects of
these heavy metals on the sperm ulqastructure of the species. The selected heavy metals tested
for were manganese, zinc, copper, lead and cadmium.
Aims of the study
· To determine the effects of industries, farms and wineries on the Eerste River ecosystem,
through a comparison between the concentrations of heavy metals and other chemical factors at
two different locations in the river, namely upstream and downstream from Stellenbosch
(Assegaaibosch Nature Reserve and Stellenbosch Farmers' Winery respectively).
· To establish whether and to what extent Potamonautes perlatus accumulates heavy metals, as•
well as the specific tissues and organs to which these metals are distributed, i.e. either the
digestive gland, gills, gonads, muscles or exoskeleton (carapace).
· To investigate the relationships between size, gender, seasonality and the concentrations of
heavy metals in the animal.
· To evaluate the possible use of P. perlatus as a monitor of heavy metal pollution, i.e. to
determine to what extent the species satisfies the definition of a biomonitor.
· To ascertain whether sublethal levels of heavy metals affect the sperm ultrastructure of the
species, through (a) an electron microscopic study of its sperm ultrastructure, as well as through

5
(b) comparisons of the total nwnber of sperm and nwnberof abnormal sperm per grid block (see
Chapter 3), per individual, from the two chosen localities.
---000---
•
6
CHAPTER 2
STUDY AREA
General Description
The study was undertaken in a section of a Western Cape Province river, the Eerste River
(Figure 2(a)). This river, 40 Ian in length, rises in the Dwarsberg, at the head of the Jonkershoek
Valley (Petitjean, 1987), and flows through the Jonkershoek Forest Reserve, Assegaaibosch
Nature Reserve, as well as several vineyards, after which it passes through the town of
Stellenbosch (33°56'10"S; 18°51'34"E). For the rest of its course, the river is surrounded by
agricultural land and a few settlements, until it reaches the sea at Macassar Beach on the False
Bay coast.
In 1981 the Kleinplaas Dam was constructed in the Jonkershoek Forest Reserve, to regulate the
flow of the upper Eerste River. This isa balancing and diversion structure and forms part of the
Riviersonderend-Berg River Water Transfer Project (Petitjean, 1987). This dam also receives
water from the Theewaterskloof Dam, near Villiersdorp (Department of Water Affairs, 1986).
Immediately downstream from Stellenbosch, the Eerste River receives its first main tributary,
the Plankenburg River. This is a 10 Ian long river which runs past the townships of Cloetesville
and Kaya Mandi, as well as past the Stellenbosch industrial area. The Plankenburg River joins·
the Eerste River at the Adam Tas bridge. Another stream, the Krom River, flows through forest
reserves and grasslands before- it joins the Plankenburg River at the George Blake road
(Petitjean, 1987). The main abstraction point of the Lower Eerste River Irrigation Board is
situated immediately below the Adam Tas bridge (Petitjean, 1987). The remaining three
tributaries of the Eerste River are tJy: small Veldwagters, Blouklip and Sanddrif Rivers. The
Veldwagters River carries the treated effluent of the Stellenbosch Municipality sewage works.•
These three rivers were, however, not included in the specific study area.
Climate and rainfall
Stellenbosch and the Eerste River are' situated in the winter rainfall region, characterised by a
Mediterranean-type climate of cool, wet winters in the south-west (as in the area chosen for the
present study), grading eastwards along the south coast into spring and autumn rain peaks
(Davies et aI., 1993). According to the Rutherford and Westfall (1986) classification,
Stellenbosch is situated in a part of the Fynbos Biome, which, apart from mainly winter rainfall,
is also characterised by short-lived snowfalls on the higher mountain peaks in winter, whereas

7
hail is rare. Summer wind is, however, a common occurrence and is often very strong, persisting
for several days.
The mean daily temperature and rainfall and total annual rainfall for Stellenbosch and
Jonkershoek, respectively, during the period of study, 1993-1995, including absolute maximum
and minimum temperatures for each year of study, are recorded in Tables 2.1 and 2.2. The
marked difference in temperature and rainfall between Stellenbosch and Jonkershoek is an
important consideration, since, of the two localities chosen for the study, one fell within the
boundaries of Stellenbosch and the other within those of Jonkershoek.
All rainfall and temperature data were provided by the South African Weather Bureau, Agromet
and Forestech, Jonkershoek.
Table 2.1: Rainfall data for the period 1993-1995, for Stellenbosch and Jonkershoek, including
total annual and mean daily rainfall (mm).
Year Stellenbosch Jonkershoek
Total annual 1993 823.0 1298.0
rainfall 1994 611.0 968.0
(mm) 1995 638.0 1217.0
Mean daily 1993 2.3 3.6
rainfall 1994 1.7 2.7
(mm) 1995 1.7 3.9
Table 2~2: Temperature data for the period 1993-1995, for Stellenbosch and Jonkershoek,
including mean daily, absolute maximum and absolute minimum temperatures (OC).
Year Stellenbosch Jonkershoek
Mean daily 1993 17.8 15.7
temperatures 1994 17.7 15.7
(OC) 1995 17.5 18.0
Absolute 1993 39.3 40.3
maximum 1994 38.8 37.8
temp. (oq 1995 38.7 38.7.

8
IAbsolute 1993 3.5 2.0
minimum 1994 3.0 2.2
temp. (0C) 1995 2.3 1.5
Vegetation
The vegetation types which characterise the Fynbos Biome .are the usually evergreen,
sclerophyllous phanerophytes, chamaephytes and hemicryptophytes, which occur codominantly
(Rutherford and Westfall, 1986). The plant species found along the banks of the Eerste River
vary throughout its course and indigenous trees have, to a large extent, been replaced by exotic
species. The specific species found at each locality will be discussed later.
Fauna
Although the area is rich in endemic fauna, only a few species will be mentioned. Listed below
are those species, endemic and exotic, which are considered significant to the study and which
will be referred to in the final discussion.
1. Invertebrates:
Freshwater crab (Potamonautes perlatus)
2. Fishes (all exotics):
Smallmouth bass (Micropterus dolomieu)
Largemouth bass (Micropterus salmoides)
Rainbow trout (Onchorhynchus mykiss)
3. Birds:
Giant kingfisher (Megaceryle maxima)
4. Mammals: /)
Cape clawless otter (Aonyx capensis)
Water mongoose (Ati/ax paludinosus)
Localities
In order to investigate the effects of the Stellenbosch industries on the Eerste River ecosystem,
two localities were chosen for this study: one to represent a relatively uncontaminated
environment, upstream from the town, and the other a section of the river downstream from
Stellenbosch, where human intervention and pollution are clearly visible.

9
The first locality was situated in the Assegaaibosch Nature Reserve, at a small weir (33°58'21 "S;
18°56'4"E). Here the river is approximately 10 m wide in summer, and forms a pool upstream
from the weir, but flows fast thereafter. A narrow, fast flowing canal runs alongside the main
stream at this point. The river substrate consists of boulders, large stones, bedrock (King, 1981),
as well as pebbles and coarse sand. Algal growth is normally sparse, although Spirogyra is
common in summer. The river is lined by tough-leaved, evergreen trees, e.g. Metrosideros
angustifolia and Brabejum stellatifolium, but these are mostly replaced by the exotic oak,
Quercus robur (King, 1981). The trees form a canopy over the stream and the fall oftheir leaves
through late spring and early summer forms the major source of instream organic material, a fact
which is of great importance to the freshwater crab, a detritus feeder. This coincidence of leaf
fall and high temperatures is in contrast with the autumnal leaf fall at decreasing temperatures in
the Northern Hemisphere (King et al., 1987; 1988).
Apart from crab-eating fish species in the river, a number of other animal species which rely on
crabs in their diet have been recorded at this locality: a Giant kingfisher pair (Megaceryle
maxima) was often observed here during the study period. Signs of Cape clawless otter (Aonyx
capensis), in the form of scats and eaten crab, were frequently found at the weir. The water
mongoose, Atilax paludinosus, which is a potential competitor of the Cape clawless otter for
crabs, is also found in this area. Although no signs of water mongoose were recorded at this
specific locality during the study, previous personal observations and local home range studies
on these animals (Purves, 1995) have proved that they do utilize this area.
The water at this locality is clear and apparently free of organic pollution. Although some human
activity occurs here, such as hiking and occasionally swimming, the area is kept clean and is free
oflitter.
The second ,locality, which will in future chapters be referred to as SFW, was situated
downstream from the Adam Tas bridge, where the Eerste and Plankenburg Rivers meet, directly.behind Stellenbosch Farmers' Winery (33°56'47"S; 18°50'32"E). This station is also located just
below a small weir, where the river is approximately 5-8 m wide in summer. Similar to the first
locality, the river at this point forms a pool upstream from the weir, but is fast-flowing
thereafter. The river substrate consists of stones and pebbles on coarse sand (King, 1981) as well
as finer, muddy sand. Some algal and fungal growth can be found on the rocky substrate and,
compared to Locality 1, fewer water-dwelling invertebrates are found here (King, 1981). This is
a well known sign of pollution. Evergreen as well as deciduous trees line the banks, with the two
dominant species being the exotics, Quercus robur and Populus canescens (King, 1981). Similar
to the first locality, the fall of the leaves also forms the main source of instream organic material
during the warmer months.

10
The site includes an otter latrine, which was frequently used during the study period, indicating
that these animals also often utilize this area for foraging.
Possibly as a result of human activities such as picnicking and swimming, the water is murky
and often foul-smelling. The water quality is also greatly affected by runoff from the
Plankenburg River and winery effluent from Stellenbosch Farmers' Winery.
At both the chosen localities the water level remains relatively low throughout the drier months
as a result of draw-off for water supply to Greater Cape Town and excessive irrigation demand
(Davies et al., 1993), but slight increases in level and flow rate do occur, coinciding with the
occasional opening of the Kleinplaas Dam sluices in Jonkershoek. During the months of heaviest
rainfall, however, the water level at Locality 2, especially, rises dramatically with the increase in
water volume and flow rate. This results in a large amount of sludge and litter being washed
downstream and settling at this site.
---000---
-
• SlrlltlllMlsrll
'18°55'
Lege/iils:
- River & Tributaries
~ Orchards & Vineyards
LOooooJ Trees & Bush
X= Localities
l:orluab,orR:
s'n:I,LI':NBOSCII
Dalsig
18°50'I
Figure 2(a): Course of the Eerste Riverthrough Jonkershoek and Stellenbosch,
0 1 20 \ kmQ
%~
U~'
'")
(.-> \\\~ IdaSVal~~
°U.
1:1
'-'.'
"-.....(
12
CHAPTER 3
MATERIALS AND METHODS
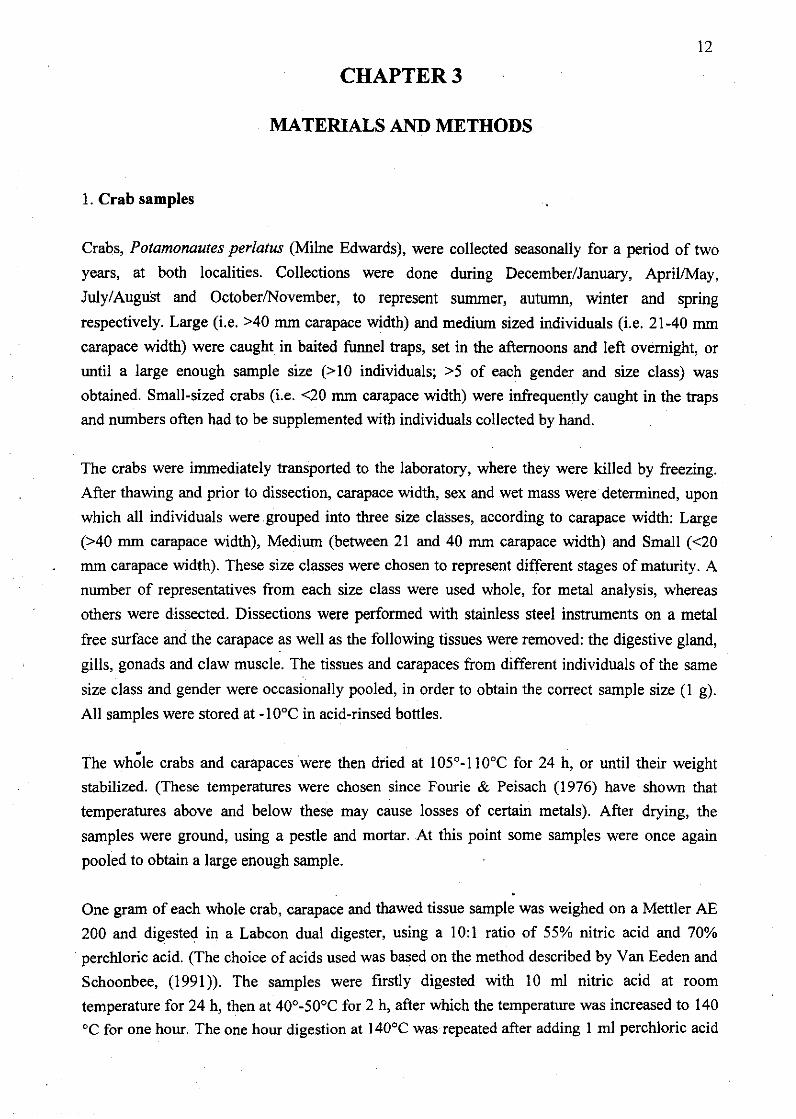
1. Crab samples
Crabs, Potamonautes per!atus (Milne Edwards), were collected seasonally for a period of two
years, at both localities. Collections were done during December/January, April/May,
July/August and October/November, to represent summer, autumn, winter and spring
respectively. Large (i.e. >40 mm carapace width) and medium sized individuals (i.e. 21-40 mm
carapace width) were caught in baited funnel traps, set in the afternoons and left overnight, or
until a large enough sample size (>10 individuals; >5 of each gender and size class) was
obtained. Small-sized crabs (i.e. <20 mm carapace width) were infrequently caught in the traps
and numbers often had to be supplemented with individuals collected by hand.
The crabs were immediately transported to the laboratory, where they were killed by freezing.
After thawing and prior to dissection, carapace width, sex and wet mass were determined, .upon
which all individuals were .grouped into three size classes, according to carapace width: Large
(>40 mm carapace width), Medium (between 21 and 40 mm carapace width) and Small «20
mm carapace width). These size classes were chosen to represent different stages of maturity. A
number of representatives from each size class were used whole, for metal analysis, whereas
others were dissected. Dissections were performed with stainless steel instruments on a metal
free surface and the carapace as well as the following tissues were removed: the digestive gland,
gills, gonads and claw muscle. The tissues and carapaces from different individuals of the same
size class and gender were occasionally pooled, in order to obtain the correct sample size (l g).
All samples were stored at -10°C in acid-rinsed bottles.
The wh~le crabs and carapaces were then dried at 105°-110°C for 24 h, or until their weight
stabilized. (These temperatures were chosen since Fourie & Peisach (1976) have shown that
temperatures above and below these may cause losses of certain metals). After drying, the
samples were ground, using a pestle and mortar. At this point some samples were once again
pooled to obtain a large enough sample.
One gram of each whole crab, carapace and thawed tissue sample was weighed on a Mettler AE
200 and digested in a Labcon dual digester, using a 10:1 ratio of 55% nitric acid and 70%
perchloric acid. (The choice of acids used was based on the method described by Van Eeden and
Schoonbee, (1991)). The samples were firstly digested with 10 ml nitric acid at room
temperature for 24 h, then at 40°-50°C for 2 h, after which the temperature was increased to 140
°C for one hour. The one hour digestion at 140°C was repeated after adding 1 ml perchloric acid

13
to each sample. A blank sample containing only a 10: I ratio nitric:perchloric acid solution was
also prepared, using the same method. The samples were allowed to cool only after obtaining a
clear solution.
After cooling, each sample was filtered through Whatrnan 9.0 cm qualitative filterpaper, as well
as a Sartorius Minisart 0.45 Jim pore size filter, using a needle and syringe. The filtrate was then
diluted to 100 ml with distilled water and stored at 6°C until needed for heavy metal analysis. To
avoid contamination of samples, all glassware used was carefully washed and rinsed several
times with a solution of 32% hydrocWoric acid and distilled water.
The concentrations of zinc, manganese, copper, lead and cadmium in the various samples were
determined by atomic absorption spectrophotometry on a Varian Spectr.AA 250 Plus model.
Atomic Absorption Standard Solutions from Sigma, as well as deionised water, were used to
prepare the analytical standards.
The metal concentrations in the whole crab and carapace samples, expressed as Jig metal per
gram dry mass,. were recalculated, using the dry and wet mass of each sample, to be expressed as
Jig metal per .gram wet mass.. All tissue samples, expressed as Jig metal per gram wet tissue
mass, were in turn recalculated to Jig metal per gram dry tissue mass, in order to use in the
statistical analysis and to compare with results in the literature. This recalculation was done by
dissecting a number of crabs and weighing and drying the carapace and tissues of each
individual, as well as a few whole individuals, at 60°C for 24 h, or until the mass stabilized.
Using the wet and dry mass of each sample, the percentage water loss, thus also percentage dry
matter, was ascertained. The mean dry matter percentage for whole crabs, each tissue and for the
carapace were then used for the final recalculation.
A bioconcentration factor (BCF) was calculated for whole crabs, tissues and carapace, for each
metal. The formula used to calculate the BCF (from Van Straalen & Verkleij, 1993), was:•
BCF = [metal] in crab sample -;- [metal] in water/sediment,
yielding a value of <I, 0 or >1 and giving an indication of the degree of heavy metal
accumulation in the animal, from the water (BCFw) and sediments (BCFs)'
Statistical analysis of the data was done with the use of the Quattro Pro and StatGraphics
computer programs, as well as Student's t-test. In order to avoid confusion, the results for the
five selected heavy metals will be discussed in separate chapters (Chapters 5-9).
14
2. Water and sediment samples
With every seasonal collection of crabs, water and sediment samples were also taken at each
locality.
Water samples (50ml), were taken once every season, in fast flowing sections of the river,
approximately 5-10 cm below the surface. Sediment samples, also taken once per season, were
collected from the river bottom, in shallower sections, closer to the river banks. Only the top 10
cm was taken. In each instance a 100 ml container was filled. All samples were stored in pre
washed, acid-rinsed containers, at -I oDe, until needed for analysis.
In order to determine the total metal concentration in each water sample, these were acidified
with 55% nitric acid and filtered through Whatrnan 9.0 cm qualitative filterpaper, as well as a
Sartorius Minisart 0.45 f.lm pore size filter, using a needle and syringe. Thereafter, each sample
was diluted to 100 ml with distilled water and kept at 6°e until analysed.
Sediment samples were prepared for heavy metal analysis by firstly drying the samples at 1000e
for 24 h, or until the weight stabilized, after which each sample was sieved to obtain a,homogenous sample. These were then finely ground with a pestle and mortar and a 1 g
subsample then weighed off on a Mettler AE 200.
The choice of acids used for digestion was based on the method described by Anderson (1974),
in which a l: 1 ratio of hydrochloric and nitric acid was used. Ten ml 55% nitric acid was added
to each sample and left at room temperature for 24 h, after which the temperature of the Labcon
dual digester used was adjusted to 40o-S0oe for 2 h. The temperature was then increased to
1400 e for 1 h. This 1 h digestion at 1400e was repeated after adding 10 ml 32% hydrochloric
acid to each sample. A blank sample containing only a I: 1 hydrochloric:nitric acid solution was
also prepared, using the same method. The samples were allowed to cool only after a clear
solution was obtained. Each sample was filtered through Whatman 9.0 cm qualitative filterpaper
as well as a Sartorius Minisart 0.45f.lm pore size filter, using a needle and syringe. The filtrate
was then diluted to lOO ml with distilled water and the samples stored at 6°C for further analysis.
The residues were dried at loooe until the weight stabilized, and then weighed accurately, to
determine the actual amount digested. To avoid contamination ofthe samples, all glassware was
carefully washed and rinsed several times with a 32% hydrochloric acid and distilled water
solution, prior to use.
Heavy metal, i.e. zinc, manganese, copper, lead and cadmium concentrations, were determined
by atomic absorption spectrophotometry on a Varian Spectr.AA 250 Plus model. Atomic
Absorption Standard Solutions from Sigma, as well as deionised water, were used to prepare the
analytical standards.
15
All other water analysis data were obtained from the Department of Water Affairs, Cape Town.
Several sampling stations along the Eerste River were chosen and frequented by researchers
from this Department. Of these stations, the following were selected for the present study: a site
in the Jonkershoek Nature Reserve, one in the Assegaaibosch Nature Reserve (a few hundred
meters downstream of Locality I of the present study), a site in the Plankenburg River (under
Adam Tas bridge), a site behind Stellenbosch Farmers' Winery (at Locality 2 of the present
study) and fmally, one downstream of the point where the Veldwachters and Eerste Rivers meet.
Of these sites, a few were only visited on one or two occasions, or selected recently, hence the
lack ofchemical data on some of them (see Table 4.3).
Chemical analyses of samples from these stations were done by the Department of Water
Affairs, whereas the data from bacteriological analyses were provided by the Cape Town
Municipality and Regional Services Council. Statistical analysis of the data was done with the
use of the Quattro Pro and StatGraphics computer programs as well as Student's t-test.
3. Sperm ultrastructure
The testes and vasa deferentia from selected mature male crabs (±3 individuals from each
locality, seasonally) were dissected and stored in 4% gluteraldehyde at 6°C for primary fixation,
until needed for transmission electron microscopic preparation.
Samples were washed 3 times in Millonig phosphate buffer for 10 min each, after which they
were post fixated for I h in 0.5% watery osmium tetroxide. The samples were then washed 3
times for 10 min each with distilled water. Staining was done with 2% uranyl acetate for 30 min,
after which the samples were once more washed with distilled water: 3 times for 10 min each.
Five different concentrations of acetoI/e were used in the dehydration process for 10 min each,,namely 25%, 50%, 75%, 95% and 100% acetone. The 100% acetone dehydration was repeated
but left overnight and the acetone removed before commencing the embedding process.
The samples were infiltrated with 3 different ratios of acetone:Spurr resin solutions, for I h each.
The ratios were 3: I, 2: I and I: 1. Hereafter infiltrating was done for I h in 100% Spurr resin,
which was repeated a second time but left overnight and the resin removed before embedding
the samples in silicone rubber embedding moulds, and filling them with 100% Spurr resin.
Polymerization was then done at 70°C for 24 h.
The resin blocks were prepared for transmission electron microscopy by firstly trimming and
shaping them, using razor blades, after which thick sectioning and fine trimming with an
ultramicrotome were done. Ultrathin sections. (±70-90 urn) were finally made. These were
stained as follows: the sections were evened out with xylene and mounted on 200 square size

16
copper grids. The staining procedure started with 5% uranyl acetate for 10 min, after which the
sections were washed with distilled water and dried on filter paper. The last staining was done
with Reynolds' lead citrate (Reynolds, 1963) for 2 min and the sections finally washed and dried
once more. Sections were viewed in a Phillips 20 I transmission electron microscope, operated at
60kV.
Sections of the vasa deferentia of four animals from each locality were used for the sperm
counts. These were done by counting the total number of sperm in 2-3 blocks of a grid, as well
as the number of abnormal spermatozoa per block, and determining the average thereof.
Statistical comparisons of the two localities were done with the help of the StatGraphics
computer program and Student's t-test.
---000---
•
17
CHAPTER 4
PHYSICO-CHEMICAL CONDITIONS AT THE CHOSEN LOCALITIESIN THE EERSTE RIVER
Introduction
An important objective of most water management programmes is the preservation of aquatic
life. To meet this objective, it is necessary to maintain, within certain limits, variables such as
water temperature, turbidity and other parameters which contribute to the chemical quality of the
water (Abel, 1989). For this reason, management bodies such as the. Department of Environment
Affairs and Tourism have developed quality criteria for, among others, river water.
A number ofhydrobiological studies have been undertaken in the Eerste River, at approximately
the same sites as were chosen for the present study, of which the investigations of King (1981)
and Petitjean (1987) are examples. These studies have, however, concentrated on the physical
and selected chemical features of the river and have not addressed the occurrence of heavy
metals. An assessment of the levels of heavy metals in river water is of great significance, since
it can, if present in high concentrations in the water, hold serious implications for aquatic life
(See introductions to Chapters 5 to 9).
The present study dealt with both the physical and chemical (including heavy metal) features of
Eerste River water. All these features should be considered together since the physical features
on their own not only affect the physiology and behaviour of organisms (Warburg et aI., 1982
and Van Aardt, 1993) but may also affect heavy metal availability and toxicity. Kempster et al.
(1980) reported that the toxicity of metals such as lead, zinc and copper to fish is higher in water
with a low conductivity, whilst Campbell & Stokes (1985), Crowder (1991) and Wren &
Stephenson"(1991) discussed the effects of water acidification on the toxicity and availability of
certain heavy metals.
. .Since many aquatic organisms, including freshwater crabs, arc;:. closely associated with river
sediments the latter should be considered as an additional source'of heavy metals together with
the water and therefore analysed as well. Even heavy metals which are "immobilized" in the
bottom sediments of rivers constitute a potential hazard since they may be released as a result of
chemical changes in the aquatic environment. These changes may include increased salinity, a
lowering of pH~ the introduction of synthetic complexing agents, microbial activities and
physical effects such as erosion (Forstner & Prosi, 1979).

18
Materials and Methods
All samples for heavy metal analysis were prepared, tested and statistically analysed according
to the method described in Chapter 3. All physical and .chemical data for Eerste River water
were gathered during the present study or obtained from the Department of Water Affairs, Cape
Town.
Results
WATER ANALYSIS
Differences in heaVY metal concentrations between 10nkershoek and SFW
Student's t-test, and the Mann-Whitney test in the case of the zinc concentration data, were used
to determine whether statistically significant differences (p<O.05) in heavy metal concentrations
existed between the two chosen localities. These results are shown in Tables 4.1 and 4.2.
Although all metals, except manganese, had their highest concentrations at SFW, no significant
differences (p>O.05) were found between the two localities. Figure 4(a) shows the mean metal
concentrations in the water at both localities.
Analysis of physical and other chemical features of Eerste River water
A list of the physical and chemical features tested for at each station during the study period, as
well as their respective mean concentrations/values, is given in Table 4.3. A comparison of these
features, with the water quality criteria as stipulated by the Department of Environmental Affairs
and Tourism and other international bodies, is made in the discussion of this chapter.
The chemical and physical data fJr Assegaaibosch and SFW (stations 2 and 4 in Table 4.3) were
compared by means of the nonparametric Mann-Whitney test, in order to investigate possible
significant differences (p<O.05). Table 4.4 lists the results of these tests.
In the cases of all the chemical and physical factors tested for, except the dissolved oxygen,
water temperature and nitrates, the data from SFW had the highest mean concentrations/values.
Statistically sigcificant differences in these factors between the two localities/stations were
found for pH, conductivity, suspended solids, phosphates, faecal coliforms and total coliforms.

19
SEDIMENT ANALYSIS
Differences in heavy metal concentrations between lonkershoek and SFW
When the mean metal concentrations in the sediments from 10nkershoek and SFW were
compared statistically (Table 4.5), it was found that significant differences (p<O.05) existed
between the manganese and between the zinc concentrations of the two localities.
The sediments from 10nkershoek exhibited the highest manganese concentration of the two sites,
whereas the SFW sediments exhibited the highest concentrations for zinc and also, though not
statistically significant, for the other three metals. Figure 4(b) shows the mean metal
concentrations in the sediments from both localities.
•
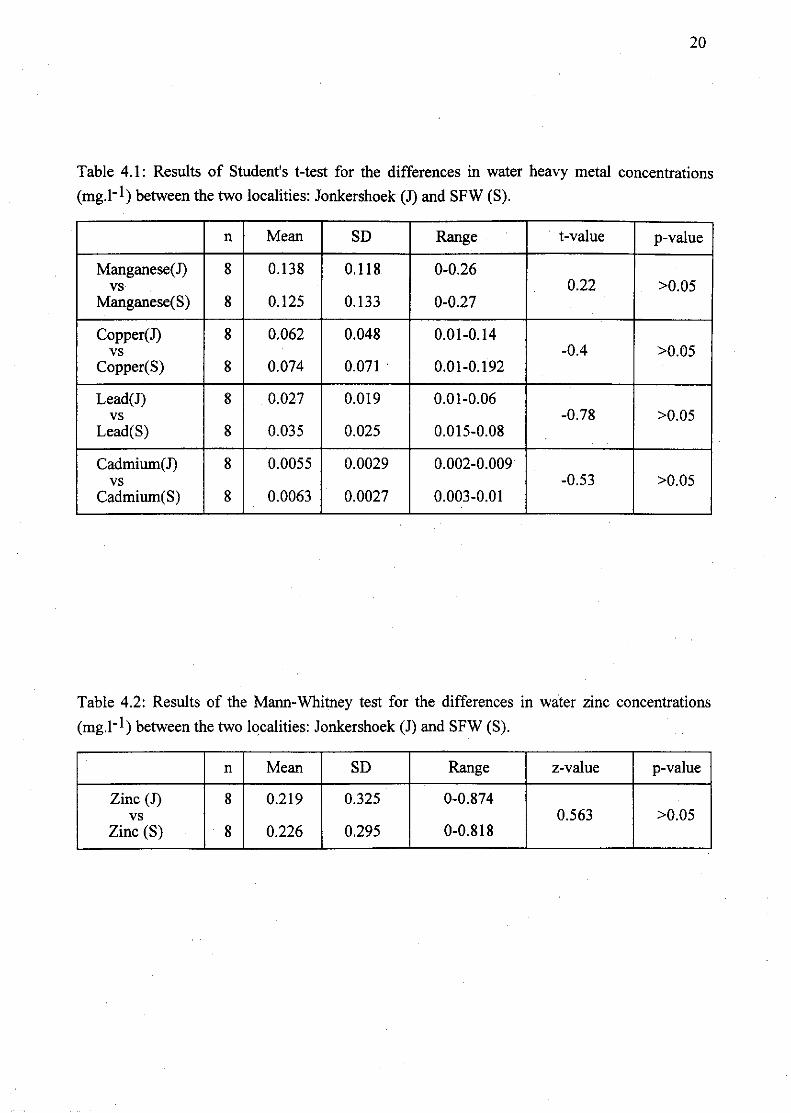
20
Table 4.1: Results of Student's t-test for the differences in water heavy metal concentrations
(mg.l- 1) between the two localities: Jonkershoek (J) and SFW (S).
n Mean SD Range t-value p-value
Manganese(J) 8 0.138 0.118 0-0.26vs 0.22 >0.05
Manganese(S) 8 0.125 0.133 0-0.27
Copper(J) 8 0.062 0.048 0.01-0.14vs -0.4 >0.05
Copper(S) 8 0.074 0.071 . 0.01-0.192
Lead(J) 8 0.027 0.019 O.oI-0.06vs -0.78 >0.05
Lead(S) 8 0.035 0.025 0.015-0.08
Cadmium(J) 8 0.0055 0.0029 0.002-0.009vs -0.53 >0.05
Cadmium(S) 8 0.0063 0.0027 0.003-0.01. .
Table 4.2: Results of the Mann-Whitney test for the differences in water zinc concentrations
(mg.l-1) between the two localities: Jonkershoek (1) and SFW (S).
n Mean SD Range z-value p-value
Zinc (J) 8 0.219 0.325 0-0.874vs 0.563 >0.05
Zinc (S) 8 0.226 0.295 0-0.818

21
Table 4.3 : Mean values of physical and chemical features of water, collected at selected stations
in the Eerste River. Stations: 1. Jonkershoek Nature Reserve; 2. Assegaaibosch Nature Reserve;
3. Plankenburg River (Adam Tas bridge); 4. Stellenbosch Farmers' Winery; 5. Below confluence
of Veldwachters and Eerste Rivers..
Determinand Unit t . 2 3 4 5
pH pH 6.19 6.74 7.27 7.1 7.17
Conductivity mS/m 4.23 6.76 45.53 18.5 32.32
Temperature °C 16.15 18.33 -- 16.3 17.7
Dissolved 02 mg.l- 1 10.38 10.07 -- 9.03 7.45
Suspended solids mg.l- 1 5.0 7.38 14.13 9.07 14.69
Nitrates mg.l-1 0.2 0.48 0.43 0.27 1.57
Phosphates mg.l- 1 0.03 0.05 0.05 0.06 2.2
Hardness (CaC03) mg.J- 1 4.0 14.5 -- 45.0 --Total co1iforms 100mi 13.29 498.83 -- 128227.3 53209
Faecal coliforms 100mi 2.9 105.83 -- 15347.3 17664

22
Table 4.4: Results of the Mann-Whitney test for differences between chemical and physical data
of water from stations 2 and 4: Assegaaibosch (J) and SFW (S) (Cond. = conductivity; Temp. =
temperature; Diss.02 = dissolved oxygen; S.so!. = suspended solids; N03 = nitrates; P04 =phosphates; Hard = hardness; T.co!. =total coliforms andF.co!. =faecal coliforms).
n Mean SD Range z-value p-value
pH(J) 26 6.74 0.24 5.9-7.0vs 3.685 <0.05
pH (S) 43 7.1 0.38 6.3-7.6
Condo (J) 24 6.76 1.31 3.44-8.88vs 6.558 <0.05
Condo (S) 43 18.5 7.08 7.2-35.0
Temp. (J) 3 18.33 5.13 14.0-24.0vs -0.524 >0.05
Temp. (S) 21 16.3 3.59 10.1-25.7
Diss.02 (1) 3 10.07 0.64 9.47-10.75vs -1.484 >0.05
Diss.02 (S) 21 9.02 5.81 4.6-32.6
S.so!. (1) 24 7.38 11.64 5.0-62.0vs 2.198 <0.05
S.so!. (S) 43 9.07 9.58 5.0-57.0
N03 (J) 18 0.48 1.2 0.2-5.3vs 0.944 >0.05
N03 (S) 42 0.27 0.16 0.1-0.8
P04 (J) 18 0.05 0.07 0.03~0.33
vs -2.504 <0.05P04 (S) 42 0.06 0.17 0.03-1.1
Hard (J) 2 14.5 14.14 4.5-24.5vs 0.866 >0.05
Hard (S) 3 45.0 21.93 20.0-61.0
T.co!. (J) 6 498.83 371.01 93-1100vs 3.69 <0.05
T.co!. (S) 22 128227 255768 2400-1100000
F. co!. (1) 6 105.83 71.44 23.0-240.0vs 3.573 <0.05
F. co!. (S) 22 15347 32185 110-110000

23
Table 4.5: Results of Student's t-test for the differences between sediment heavy metal
concentrations (J,lg.g-I dry mass) at the two localities: Jonkershoek (1) and SFW (S).
h Mean SD Range t-value p-value
Manganese(1) 8 184.68 138.66 39.6-386.5vs 2.63 <0.05
Manganese(S) 8 55.27 13.23 40-77.3
Zinc(1) 8 44.72 32.82 10-104.3vs . -1.84 <0.05
Zinc(S) 8 77.53 38.41 32-120
Copper(J) 8 7.2 4.87 1.4-15.8vs -0.1 >0.05
Copper(S) 8 7.43 4.75 3-15
Lead(J) 8 5.25 3.54 1.2-10vs -0.77 >0.05
Lead(S) 8 6.97 5.21 1.4-15
Cadmium (1) 8 0.43 0.1 0.3-0.6.
vs -0.23 >0.05Cadmium (S) 8 0.45 0.18 0.3-0.7

(a) (b)
Concentration (mgll) Concentration (~g/g dry mass)
0.3200 --J I 1138.65)
(O.29S)(0.325)
I - Jonkershoek ~S=) Cadmium
(4.75)(4.8n (5.21)
13.54)
Copper Lead
HEAVY METALS
ZincManganeseo
50
100
150
(0.003)(0.003)
CadmiumLeadCopper
HEAVY METALS
Manganese Zinco
0.1
0.2
0.05
0.15
0.25
Figures 4(a)-(b): Mean heavy metal concentration in thewater (a) and sediments (b) at Jonkershoek and SFW (SD in parenthesis).
N...

(e): Manganese IdJ, Zinc
O.fI;·
SprlrlgWlnl........-8EASON
9u.....r
Conc.ntratlon (l'IIOlI~
...~.Aultl..., WIn...
SEASON
-----~--.
Conc:entratlon_(mom . .__.
1_ ,~........ "'" •.-w I___ .......... -CO- Max__
o
1.2
0.4
0.2
0.8
M'n Ind "I. p.,.'lllllo'l oonolnlrilloni
.1 .lIplll.ted by til. Dlpt. of Enylronllllnl AfI.lr.
IK."luter .t I'., ,.801
(e~ Copper (I), Lead (g), Cadmium
0.2&
Cone""trallorl (ntgm
0.12
Conc.ntrallon (mgm Concenlretfon (mg/l)
0.036 ./I I
SEASONSpring~tu...n Wlnl.,
SEASONSufllmer
0.01
0.03(3 8 8 IJ
0.02
0.026
0.016
SpringAutu..n Winter
SEASON
(3 B a IJ
Summer
0.02
0.1
o
0.0.4
0.06
0.08
SprlnvWlnl,rAuhJ..nBu..""r
0.2
0.1
0.06
Figures 4(c)-(g): Mean seasonal heavy metal concentration(mgll) in the water at Jonkerhoek and SFW. tv
V.

(h): Manganese (I): Zinc
Conclllnlrllltlon Cilg/g dry .....) Coneanlt.I1on flJQ/g dry "'JlIIIJI)
Summer Autu~ Wlntlllr
SEASON
SprIng
1<0
Summer Autumn Winter
SEASONSO"""
(j), Copper (k), Lead (I), Cadmium
Coneenlr.lion (lIV/g dry m...l Conclllnlr.llon (pg/g dry man) ConctHltrellon (lIg/g dry· me••)
SEASON
SpringAulu.-n Winter
SEASON
S\lmmer
0.1
0.4
0.'
0.7 -
~rfngWinter
SEASON
",ul\lmn
I- Jonkerabon ~ 8FW 18umm.r
14
99rlngWlnt.rAulumnS\I",,,,er
'8
Figures 4(h)-(I): Mean seasonal heavy metal concentration(~g/g dry mass) in the sediments at Jonkershoek and SFW.
tv0\

27
Discussion
Kempster et al. (1980) presented lists of the South African water quality criteria for the various
water uses, as stipulated by the Department of Environment Affairs. Among other criteria, the
minimum and maximum permissible heavy metal concentrations, so as to protect wildlife in
river and dam water, were provided. The corresponding mean water Mn, Cu, Pb and Cd
concentrations for Jonkershoek and SFW (Figures 4 (c)-(g» were found to be well under the
maximum permissible concentrations (as also indicated in Figures 4 (c)-(g», although the mean
spring Cu and Pb concentrations were found to be relatively high. On a seasonal basis, zinc
concentrations at Jonkershoek and SFW, especially during spring, were however very high,
often exceeding the maximum allowed (Figure 4(d».
Palmer & O'Keeffe (1990) cited the work of Ward & Stanford (1983), who developed the Serial
Discontinuity Concept (SDC), which states that dams are physical barriers in river systems and
that they and their associated impoundment water can result in changes in, among others, the
chemistry of the receiving river. As the river progresses downstream from the dam, natural
riverine conditions are restored as a result of natural processes and tributary inflows. Palmer &
O'Keeffe (1990) tested this concept on the Buffalo River, Eastern Cape and found that, in
agreement with this concept, impoundments which received water from a near-pristine upper
catchment caused alterations of the water quality. Also, recovery to natural riverine conditions
was within 2.6 and 18.4 km of the dam, depending on flow. The fact that the water from
Jonkershoek contained high levels of zinc indicated that this locality is perhaps not as
uncontaminated as would be believed and that the human activities in the Kleinplaas Dam, as
well as the inflow of water from the Theewaterskloof Dam, may have a significant effect on the
quality of the Eerste River water upstream from Stellenbosch.
Through comparisons of the water /metal concentrations at Jonkershoek and SFW it was
established that no significant differences existed between the two localities (Tables 4.1 and 4.2),
indicating that the contribution of household, agricultural and industrial input to metal
concentrations was not significant. This, however, does not mean that the town of Stellenbosch
has no negative effect on the Eerste River water quality and therefore on the health of the aquatic
fauna, since it is well known that the physico-chemistry of river water may greatly affect the
bioavailability and toxicity of heavy metals to animals (e.g. Forstner & Prosi, 1979; Kempster,
1980; Moore & Ramamoorthy, 1984 and Lewis & McIntosh, 1986. See Chapters 5-9).
The influence of run-off from various sources in and around Stellenbosch on the physico
chemistry of the Eerste River was evident from the statistically significant differences between
the two localities as far as pH, conductivity, suspended solids, phosphates, total coliforrns and
faecal coliforms are concerned, with SFW having had the highest values/concentrations for each
of these features (Table 4.4).
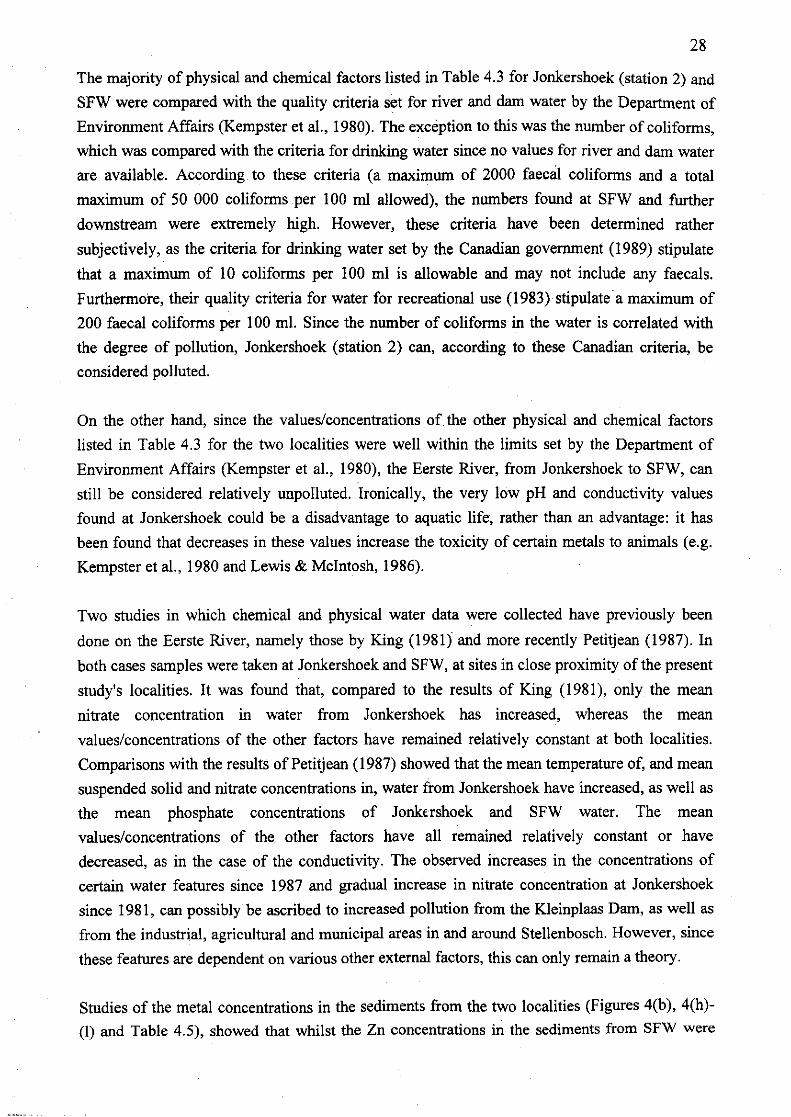
28
The majority of physical and chemical factors listed in Table 4.3 for Jonkershoek (station 2) and
SFW were compared with the quality criteria set for river and dam water by the Department of
Environment Affairs (Kempster et aI., 1980). The exception to this was the number of coliforms,
which was compared with the criteria for drinking water since no values for river and dam water
are available. According to these criteria (a maximum of 2000 faecal coliforms and a total
maximum of 50 000 coliforms per 100 ml allowed), the numbers found at SFW and further
downstream were extremely high. However, these criteria have been determined rather
subjectively, as the criteria for drinking water set by the Canadian government (1989) stipulate
that a maximum of 10 coliforms per 100 ml is allowable and may not include any faecals.
Furthermore, their quality criteria for water for recreational use (1983) stipulate a maximum of
200 faecal coliforms per 100 ml. Since the number of coliforms in the water is correlated with
the degree of pollution, Jonkershoek (station 2) can, according to these Canadian criteria, be
considered polluted.
On the other hand, since the values/concentrations of. the other physical and chemical factors
listed in Table 4.3 for the two localities were well within the limits set by the Department of
Environment Affairs (Kempster et aI., 1980), the Eerste River, from Jonkershoek to SFW, can
still be considered relatively unpolluted. Ironically, the very low pH and conductivity values
found at Jonkershoek could be a disadvantage to aquatic life, rather than an advantage: it has
been found that decreases in these values increase the toxicity of certain metals to animals (e.g.
Kempster et aI., 1980 and Lewis & McIntosh, 1986).
Two studies in which chemical and physical water data were collected have previously been
done on the Eerste River, namely those by King (1981) and more recently Petitjean (1987). In
both cases samples were taken at Jonkershoek and SFW, at sites in close proximity of the present
study's localities. It was found that, compared to the results of King (1981), only the mean
nitrate concentration in water from Jonkershoek has increased, whereas the mean
values/concentrations of the other factors have remained relatively constant at both localities.
Comparisons with the results of Petitjean (1987) showed that the mean temperature of, and mean
suspended solid and nitrate concentrations in, water from Jonkershoek have increased, as well as
the mean phosphate concentrations of Jonkushoek and SFW water. The mean
values/concentrations of the other factors have all remained relatively constant or have
decreased, as in the case of the conductivity. The observed increases in the concentrations of
certain water features since 1987 and gradual increase in nitrate concentration at Jonkershoek
since 1981, can possibly be ascribed to increased pollution from the Kleinplaas Dam, as well as
from the industrial, agricultural and municipal areas in and around Stellenbosch. However, since
these features are dependent on various other external factors, this can only remain a theory.
Studies of the metal concentrations in the sediments from the two localities (Figures 4(b), 4(h)
(I) and Table 4.5), showed that whilst the Zn concentrations in the sediments from SFW were

29
significantly higher than in the sediments from Jonkershoek, the opposite was true for the Mn
concentrations. There were no differences in sediment Cu, Pb or Cd concentrations between the
two localities. Overall, the metal concentrations were, however, still relatively low. Moore &
Ramamoorthy (1984) listed the average Zn, Cu, Pb and Cd concentrations found in sediments
associated with freshwaters. They gave the Zn concentrations in sediments of unpolluted and
industrially/municipally polluted waters as <50 and 6 to 339 mg.kg-! dry mass respectively. The
sediment Zn concentrations from SFW, listed in Table 4.5, compared better with the latter,
whereas the mean Zn concentration in the sediments from Jonkershoek compared favourably
with the former, although the maximum Zn concentration found in sediments from this locality
(104.3 llg.g-! dry mass) was much higher. The Cu and Pb concentrations in sediments from
Jonkershoek and SFW (Table 4.5) all compared well with the concentrations cited for unpolluted
waters, i.e. ~O and 2 to 50 mg.kg- I dry mass for Cu and Pb respectively. The mean Cd
concentrations given for unpolluted and industrially/muniCipally polluted freshwater sediments
were ±O.! and ±2.7 mg.kg-! dry mass respectively. The sediment Cd concentrations from both
localities (Table 4.5) were found to be higher than the former but still much lower than the
latter.
Watling & Watling (1983) studied heavy metal concentrations in the sediments of the relatively
unpolluted Boesmans, Kowie, Kariega and Great Fish Rivers and found Mn concentrations to be
between 36 and 920 Ilg.g- 1 dry mass. The mean Mn concentrations in Eerste River sediments
(both localities) (Table 4.5) were relatively low to average in comparison, therefore comparing
favourably with Mn concentrations in unpolluted freshwater sediments.
Finally, it is clear that overall, the Eerste River, from its origin to the SFW locality, can be
classified as relatively unpolluted, in terms of the parameters surveyed during this study,
although the Kleinplaas Dam and agricultural, municipal and industrial areas in and around
Stellenbosch definitely influence the physico-chemistry and general quality of the water, up- and
downstream from the town. This situation certainly needs to be monitored regularly.
---000---

30
CHAPTER 5
CONCENTRATIONS OF MANGANESE IN THE FRESHWATER CRAB,POTAMONAUTES PERLATUS
Introduction
Manganese is a heavy metal which occurs widely in nature. It is found in many minerals, e.g.
pyrolusite, as the oxide, and rhodochronite, where it occurs as the carbonate. Manganese also
occurs in nodules in the sea floor and in most iron ores. It is not, however, found in nature as the
free metal (Piscator, 1979b and Richardson & Gangolli, 1994). In waters, manganese is in
dissolved, colloidal and complex forms. It is known that Mn-organic matter complexes may
form, which are stable and cause major problems in water treatment processes (Galvin, 1996).
Manganese is an essential trace element in animal nutrition. It is a constituent of the enzymes
pyruvatecarboxylase and superoxidedismutase, as well as being an enzymatic catalyst (Piscator,
I979b). This metal is also involved in the synthesis of flavo proteins, cholesterol dynamics and
haemoglobin production (Galvin, 1996). Although manganese deficiency has not been found in
the general population, it has been shown experimentally that, in animals, a deficiency will cause
heart disease, skeletal abnormalities and impaired growth (Piscator, 1979b and Galvin, 1996)..
Aquatic ecosystems are in danger of receiving unnaturally high loads of manganese from
especially industrial waste water, since this metal is mainly used in. metallurgical processes of
which ferromanganese is the main product. Other uses are as alloys with other metals in the
electrical industry and as manganese dioxide for dry cell batteries (Piscator, 1979b).
High concentrations of manganese in industrial and agricultural runoff pose a great threat to
aquatic animals exposed to resultant increased levels. Experiments with animals have shown that
excessive exposure to manganese may cause a variety of symptoms, e.g. mononuclear reactions,
changes in enzymatic activities and testicular morphology, fibrosis as well as aggressive
reactions and irritation (Piscator, 1979b). It is well known that water pH is an important factor
influencing the toxicity and bioavailability of manganese to aquatic fauna: a lowered pH
increases the amounts of Mn accumulated by, as well as the toxicity of the metal to the animals
(France, 1987 and Rouleau et aI., 1996).
Very little research has, as yet, been done on manganese concentrations in freshwater decapod
crustaceans. The crayfish Orconectes virilis has been studied by France (1987), whereas Van
Eeden & Schoonbee (1991) and Steenkamp et aI. (l994b) investigated the bioaccumulation of
manganese in the crab Potamonautes warreni.
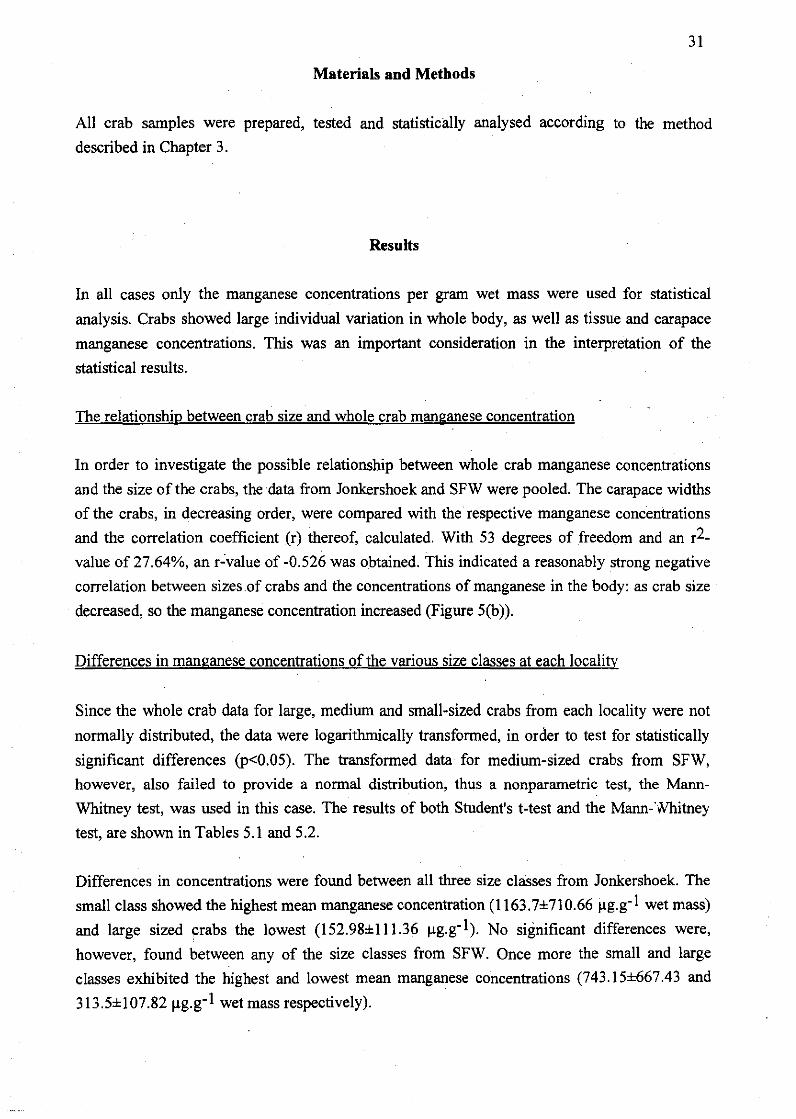
31
Materials and Methods
All crab samples were prepared, tested and statistically analysed according to the method
described in Chapter 3.
Results
In all cases only the manganese concentrations per gram wet mass were used for statistical
analysis. Crabs showed large individual variation in whole body, as well as tissue and carapace
manganese concentrations. This was an important consideration in the interpretation of the
statistical results.
The relationship between crab size and whole crab manganese concentration
In order to investigate the possible relationship between whole crab manganese concentrations
and the size of the crabs, the data from 10nkershoek and SFW were pooled. The carapace widths
of the crabs, in decreasing order, were compared with the respective manganese concentrations
and the correlation coefficient (r) thereof, calculated. With 53 degrees of freedom and an r2
value of 27.64%, an r~value of -0.526 was obtained. This indicated a reasonably strong negative
correlation between sizes .of crabs and the concentrations of manganese in the body: as crab size
decreased, so the manganese concentration increased (Figure 5(b».
Differences in manganese concentrations of the various size classes at each locality
Since the whole crab data for large, medium and small-sized crabs from each locality were not
normally distributed, the data were logarithmically transformed, in order to test for statistically
significant differences (p<0.05). The transformed data for medium-sized crabs from SFW,
however, also failed to provide a normal distribution, thus a nonparametric test, the Mann
Whitney test, was used in this case. The results of both Student's t-test and the Mann-\Vhitney
test, are shown in Tables 5.1 and 5.2.
Differences in concentrations were found between all three size classes from Jonkershoek. The
small class showed the highest mean manganese concentration (1163.7±71O.66 I!g.g-I wet mass)
and large sized crabs the lowest (152.98±111.36 I!g.g-I). No significant differences were,
however, found between any of the size classes from SFW. Once more the small and large
classes exhibited the highest and lowest mean manganese concentrations (743.15±667.43 and
313.5±107.82 I!g.g-I wet mass respectively).

32
The relationship between crab size, and tissue and carapace manganese concentration
In order to investigate the possible relationship between crab size and manganese concentration
in selected tissues, namely muscle tissue, digestive gland, gills and gonads, as well as the
carapace, the data from Jonkershoek and SFW were pooled, after which the carapace widths of
crabs, in decreasing order, were compared with the respective tissue or carapace manganese
concentration. Table 5.3 shows the r-values calculated for each tissue and for the carapace.
Strong negative correlations were found between crab size and the manganese concentration in
the muscles, digestive gland, gills and gonads. Only the manganese concentration in the carapace
proved to be poorly negatively correlated with the size of the crabs.
Differences in manganese concentrations of the various selected tissues and the carapace
The mean manganese concentration found in the selected tissues and the carapace of crabs from
Jonkershoek and SFW were pooled, in order to determine whether statistically significant
differences (p<O.05) existed between the various tissues and the carapace. Since the data were
not normally distributed, the mean logarithms of the tissue and carapace manganese
concentrations were used in the t-test. The respective mean concentrations and standard
deviations are tabulated in Table 5.4. Table 5.5 shows the results of the t-test performed on the
tissue and carapace concentrations.
When comparing values obtained from the selected tissues and carapace, significant differences
in mean manganese concentration were found between the muscles and digestive gland, muscles
and carapace, digestive gland and carapace, gonads and carapace and gills and carapace. The
carapace showed the highest meaD. concentration (229.73±213.33 Ilg.g-1 wet mass), whereas the
lowest mean was found in the gills (30.25±55.08 J.lg.g- l wet mass) (Figure 5(c)).
Differences in manganese concentrations of crabs from Jonkershoek and SFW
(a) Differences in concentration values for whole crabs
The results of Student's t-test performed on the mean logarithms of the whole crab manganese
concentrations from Jonkershoek and SFW are shown in Table 5.6. The highest mean
manganese concentration (596.21±1lJ3.83 Ilg.g-1 wet mass), was found in crabs from SFW
(Figure 5(a)). A t-value of -3.9 indicated that there was a statistically significant difference
(p<O.05) in mean whole crab manganese concentrations between the two localities.
(a) (i) Differences in mean whole crab concentrations of the various size classes
Through a comparison of the mean logarithms of whole crab manganese concentration values
between large and small crabs from Jonkershoek and SFW, with the use of Student's t-test
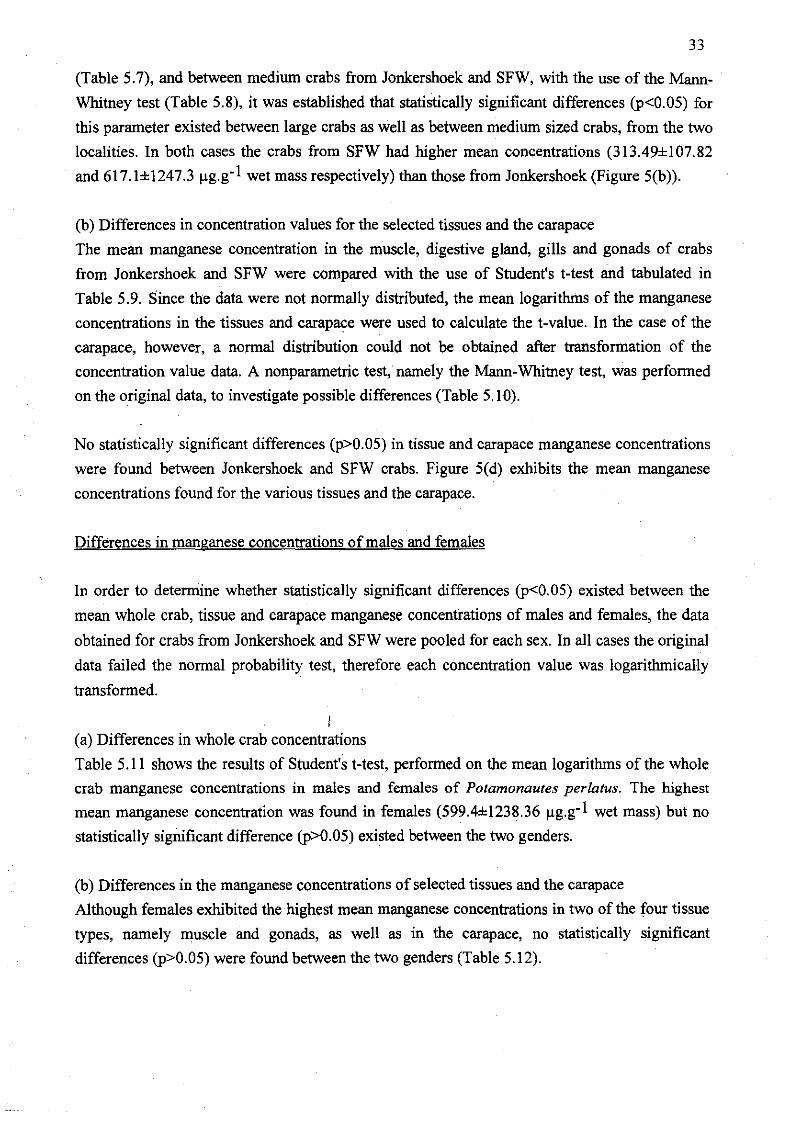
33
(Table 5.7), and between medium crabs from Jonkershoek and SFW, with the use of the Mann
Whitney test (Table 5.8), it was established that statistically significant differences (p<O.05) for
this parameter existed between large crabs as well as between medium sized crabs, from the two
localities. In both cases the crabs from SFW had higher mean concentrations (313.49±I07.82
and 617.1±1247.3 ~g.g-l wet mass respectively) than those from Jonkershoek (Figure 5(b».
(b) Differences in concentration values for the selected tissues and the carapace
The mean manganese concentration in the muscle, digestive gland, gills and gonads of crabs
from Jonkershoek and SFW were compared with the use of Student's t-test and tabulated in
Table 5.9. Since the data were not normally distributed, the mean logarithms of the manganese
concentrations in the tissues and carapace were used to calculate the t-value. In the case of the
carapace, however, a normal distribution could not be obtained after transformation of the
concentration value data. A nonparametric test, namely the Mann-Whitney test, was performed
on the original data, to investigate possible differences (Table 5.10).
No statistically significant differences (p>0.05) in tissue and carapace manganese concentrations
were found between Jonkershoek and SFW crabs. Figure 5(d) exhibits the mean manganese
concentrations found for the various tissues and the carapace.
Differences in manganese concentrations of males and females
In order to determine whether statistically significant differences (p<0.05) existed between the
mean whole crab, tissue and carapace manganese concentrations of males and females, the data
obtained for crabs from Jonkershoek and SFW were pooled for each sex. In all cases the original
data failed the normal probability test, therefore each concentration value was logarithmically
transformed.
I(a) Differences in whole crab concentrations
Table 5.11 shows the results of Student's t-test, performed on the mean logarithms of the whole
crab manganese concentrations in males and females of Potamonautes perlatus. The highest
mean manganese concentration was found in females (599.4±1238.36 ~g.g-l wet mass) but no
statistically significant difference (p>0.05) existed between the two genders.
(b) Differences in the manganese concentrations of selected tissues and the carapace
Although females exhibited the highest mean manganese concentrations in two of the four tissue
types, namely muscle and gonads, as well as in the carapace, no statistically significant
differences (p>O.05) were found between the two genders (Table 5.12).

34
Seasonal variations in manganese concentration
The manganese concentrations in whole crabs, selected tissues and carapace from the different
seasons were tested for statistically significant differences (p<0.05). In each instance, the data
for crabs collected from Ionkershoek and SFW were pooled and these then tested for normality.
None of the data sets were normally distributed and were thus logarithmically transformed. The
transformed carapace data for spring also failed the normal probability test, thus the Mann
Whitney test was performed.
(a) Seasonal differences in mean whole crab manganese concentration
Student's t-test showed statistically significant differences in whole crab manganese
concentrations, between summer and autumn, autumn and winter and winter and spring (Table
5.13). The highest mean whole crab manganese concentration (664.37±1170.08 Ilg.g- l wet
mass), was observed for summer, whereas winter showed the lowest mean (149.7±120.02Ilg.g- l
wet mass) (Figure 5(e».
(b) Seasonal differences in tissue and carapace manganese concentrations
1. Carapace
Statistically significant differences (p<0.05) in carapace manganese concentrations were found
between summer and the other three seasons. Summer showed the highest mean manganese
concentration (337.79±257.l5 Ilg.g- l wet mass) and winter the lowest (l17.24±126.9 Ilg.g- l wet
mass) (Figure 5(f). The results of Student's t-test, performed on the mean logarithms of the
summer, autumn and winter manganese concentrations as well as the Mann-Whitney test,
performed on the spring manganese concentrations, are tabulated in Tables 5.14 and 5.15.
2.Muscle tissue
The highest mean muscle manganese concentration (51.2±68.l8 Ilg.g- l wet mass) occurred in
summer, whereas in autumn the mean concentration was the lowest (l ,69±1.97 Ilg.g- l wet mass)
(Figure 5(g». Through pairwise comparisons of the different seasons, it was found that
statistically significant differences (p<O.05) existed between summer and autumn and between
summer and spring (Table 5.16).
3. Gill tissue
Statistically significant differences (p<0.05) in gill manganese concentrations were found when
comparing values for summer and autumn, and summer and spring. In Table 5.17 and Figure
5(h) it can be seen that the highest and lowest mean manganese concentrations occurred in
summer (45.74±68.66Ilg.g- l wet mass) and spring (7.25±9.62Ilg.g-l wet mass) respectively.

35
4. Digestive gland
The results of Student's t-test on the mean logarithms of the digestive gland manganese
concentrations, when comparing values for the different seasons, are given in Table 5.18.
Comparisons of summer with the other seasons yielded statistical differences (p<0.05). The
summer value for mean manganese concentration was the highest (l74.99±198.06 J.lg.g-1 wet
mass), whilst the lowest mean concentration occurred in autumn (l1.69±21.0 J.lg.g- I wet mass)
(Figure 5(i».
5. Gonads
When the data for the ovaries and testes were pooled, the highest and lowest mean manganese
concentrations (88.55±143.32 and 15.54±24.2 J.lg.g-1 wet mass) occurred in summer and autumn
respectively (Figure 50). A statistically significant difference was observed between summer
and autumn (Table 5.19).
Differences in manganese concentrations of whole crabs, tissues, carapace. and Eerste River
water
The original data from water samples failed to provide a normal distribution, therefore the
logarithmically transformed concentrations in water were used to test for statistically significant
differences (p<0.05).
(a) Differences between concentration values for whole crabs and water
Student's t-test (Table 5.20) yielded significant differences between the whole crab and water
manganese concentrations in both localities, i.e. Jonkershoek as well as SFW.
(b) Differences between concentration values for the selected tissues, carapace and water
The manganese concentrations in all tissues and the carapace from both localities proved to be
significantly different (P<0.05) from the cop-centrations in the water. The results of Student's t
test and the Mann-Whitney test in the case of comparisons with the carapace data, are recorded
in Tables 5.21 and 5.22 respectively.
Differences in manganese concentrations of whole crabs, tissues, carapace. and sediments
(a) Differences between concentration values for whole crabs and sediments
Student's t-test, performed on the mean logarithms of whole crab and sediment manganese
concentrations for Jonkershoek and SFW, yielded a statistically significant difference (p<0.05)
in the whole crab and sediment concentrations from SFW. The results of the test are tabulated in
Table 5.23.

36
(b) Differences between concentration values for the selected tissues, carapace and sediments
The mean logarithms of the tissue and carapace manganese concentrations were used to test for
statistically significant differences (p<O.05) between'tissue, carapace and sediment manganese
concentrations within the two localities. The transformed carapace data, however, were not
normally distributed, therefore the Mann-Whitney test was performed. Significant differences in
manganese concentrations were found between the sediments and all four tissue types from
Jonkershoek and all but two of the tissues (digestive gland and gonads) from SFW. Tables 5.24
and 5.251ist the results of Student's t- and the Mann-Whitney tests.

37
Table 5.1: Results of Student's t-test for differences in whole crab manganese concentrations
(Jlg.g-1 wet mass) of the various size classes at each locality.
JONKERSHOEK
n Mean SD Range t-value z-value
Large 22 152.98 111.36 52.04-373.38vs -2.16 <0.05
Medium 34 277.66 2.60.72 45.54-1148.33
Large 22 152.98 111.36 52.04-373.38vs -2.9 <0.05
Small 4 1163.7 710.66 106.4-1644.04
Medium 34 277.66 260.72 45.54-1148.33vs -4.34 <0.05
Small 4 1163.7 710.66 106.4-1644.04
SFW
n Mean SD Range t-value p-value
Large 6 313.49 107.82 162.73-480.99vs -1.56 >0.05
Small 6 743.15 667.43 228.17-1831.96
Table 5.2: Results of the Mann-Whitney test for differences in manganese concentrations (Jlg.g
1 wet mass) of medium sized crabs and the other size classes, from SFW.
n Mean SD Range z-value p-value
Large 6 313.49 . 107.82 162.73-480.99vs -0.15 >0.05
Medium 39 617.1 1247.3 120.53-6138.67
Medium 39 617.1 1247.3 120.53-6138.67vs 1.619 >0.05
Small 6 743.15 667.43 228.17-1831.96

38
Table 5.3: R2-values calculated for sizes of crabs and selected tissue and carapace manganese
concentrations (DF =Degrees of freedom; Dig.gland = digestive gland).
DF r-value R-sq. (%)
Crab size and Muscle 27 -0.687 47.21
Crab size and Dig.gland 29 -0.603 36.41
Crab size and Gills 24 -0.602 36.18
Crab size and Gonads.
23 -0.603 36.32
Crab size and Carapace 28 -0.267 7.10
Table 5.4: Mean manganese concentrations (~g.g-I wet mass) in the muscles, digestive gland,
gonads, gills and carapace of crabs from the Eerste River (Jonkershoek and SFW data pooled).
n Mean SD Range
Muscle 29 30.68 53.48 0.0-193.52
Digestive gland 33 86.96 154.94 0.0-740.7
Gonads.
25 54.5 108.34 0.0-500.0
Gills 26 30.25 55.08 0.0-235.97
Carapace 39 229.73 213.33 0.0-1082.73
Table 5.5: Results of Student's t-test for the differences in mean.tissue and carapace manganese
concentration (~g.g-I wet mass) of crabs (Jonkershoek and SFW data pooled; Mean logarithms
of manganese concentrations used for the calculation of the t-value).
t-value p-value.
Muscle vs Digestive gland -1.87 <0.05
Muscle vs Gonads -1.44 >0.05
Muscle vs Gills -0.25 >0.05
Muscle vs Carapace -7.97 <0.05
Digestive gland vs Gonads 0.46 >0.05
Digestive gland vs Gills. 1.59 >0.05
Digestive gland vs Carapace -5.06 <0.05
Gonadsvs Gills 1.18 >0.05
Gonads vs Carapace -5.92 <0.05

39
<0.05-7.61Gills vs Carapace I_________-.1.. _
Table 5.6: Results of Student's t-test for the differences in mean whole crab manganese
concentration (J.lg.g-1 wet mass) from Jonkershoek and SFW (Mean logarithms of the whole
crab manganese concentrations used in the t-test).
n Mean SD Range t-value p-value
Jonkershoek 60 291.01 356.31 45.54-1644.04vs -3.9 <0.05
SFW 51 596.21 1113.83 120.53-6138.67
Table 5.7: Results of Student's t-test for the differences in mean whole crab manganese
concentration (J.lg.g- l wet mass) of large and small size classes from Jonkershoek (J) and SFW
(S) (Mean logarithms of manganese concentrations used in the t-test).
n Mean SD Range t-value p-value
Large (1) 22 152.98 111.36 52.04-373.38vs -3.09 <0.05
Large (S) 6 313.49 107.82 162.73-480.99
Small (J) 4 1163.7 710.66 106.4-1644.04vs 0.54 >0.05
Small (S) 6 743.15 .1 667.43 228.17-1831.96
Table 5.8: Results of the Mann-Whitney test for the differences in manganese concentrations
(J.lg.g- l wet mass) of medium sized crabs from Jonkershoek (1) and SFW(S)..
n Mean SD Range z-value p-value
Medium (1) 34 277.66 260.72 45.54-1148.33vs 2.217 <0.05
Medium (S) 39 617.1 1247.3 120.53-6138.67
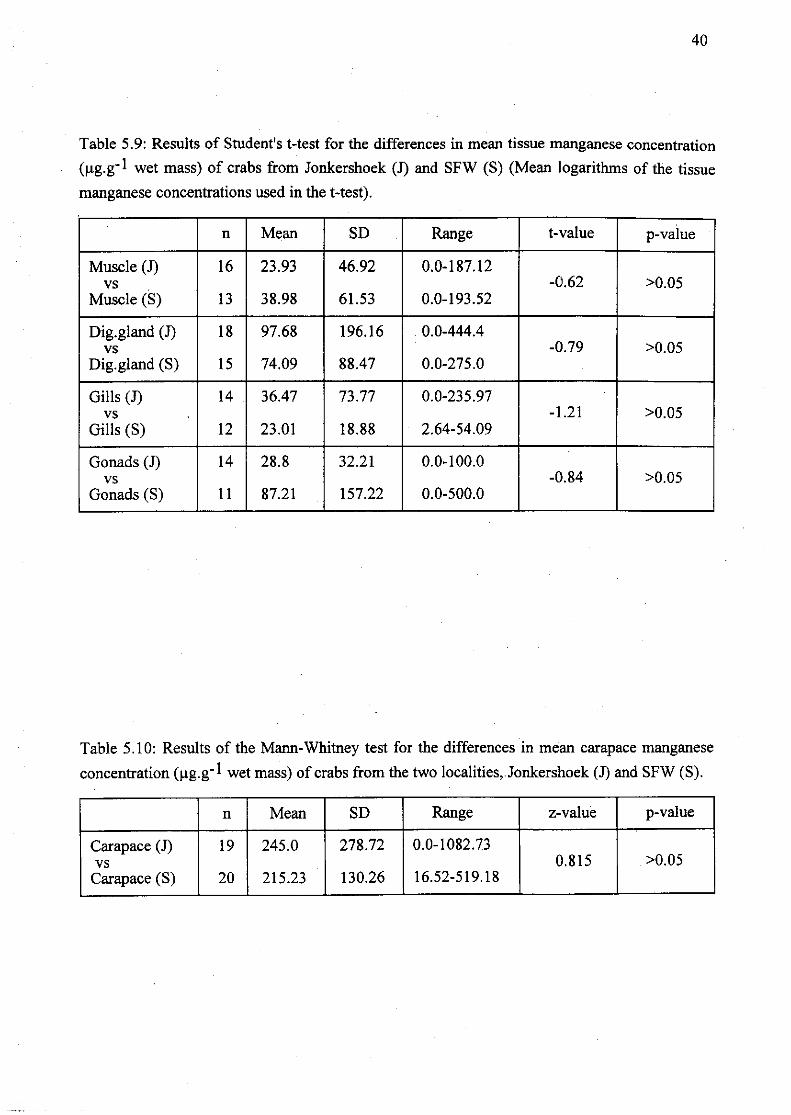
40
Table 5.9: Results of Student's t-test for the differences in mean tissue manganese concentration
(llg.g-l wet mass) of crabs from Jonkershoek (J) and SFW (S) (Mean logarithms of the tissue
manganese concentrations used in the t-test) .
.
n Mean SD Range t-value p-value
Muscle (J) 16 23.93 46.92 0.0-187.12vs -0.62 >0.05
Muscle (S) 13 38.98 61.53 0.0-193.52
Dig.gland (J) 18 97.68 196.16 0.0-444.4vs -0.79 >0.05
Dig.gland (S) 15 74.09 88.47 0.0-275.0
Gills (J) 14 36.47 73.77 0.0-235.97vs -1.21 >0.05
Gills (S) 12 23.01 18.88 2.64-54.09
Gonads (J) 14 28.8 32.21 0.0-100.0vs -0.84 >0.05
Gonads (S) II 87.21 157.22 0.0-500.0
Table 5.10: Results of the Mann-Whitney test for the differences in mean carapace manganese
concentration (llg.g-I wet mass) of crabs from the two localities,Jonkershoek (J) and SFW (S).
n Mean SD Range z-value p-value
Carapace (J) 19 245.0 278.72 0.0-1082.73vs 0.815 >0.05
Carapace (8) 20 215.23 130.26 16.52-519.18

41
Table 5.11: Results of Student's t-test for the differences in mean whole crab manganese
concentration (/lg.g-1 wet mass) of males and females (Mean logarithms of the whole crab
manganese concentrations used to calculate the t-value).
n Mean SD Range t-value p-value
Females 40 599.4 1238.36 55.82-6138.67vs 1.03 >0.05
Males 49 334.29 334.18 58.62-1831.96
Table 5.12: Results of Student's t-test for the differences in mean tissue and carapace manganese
concentration (/lg.g-I wet mass) of male (m) and female (t) crabs (Mean logarithms of the tissue
and carapace manganese concentrations used to calculate the t-value).
n Mean SD Range t-value p-value
Carapace (t) 15 271.17 240.64 93.17-1052.73vs 1.29 >0.05
Carapace (m) 18 226.74 207.0 16.52-858.09
Muscle (t) 11 30.99 57.04 3.67-193.52vs 0.02 >0.05
Muscle (m) 13 27.82 40.0 0.0-143.8
Dig.gland (t) 12 70.56 95.89 0.0-275.0vs -0.4 >0.05
Dig.gland (m) 15 83.69 120.37 0.0-444.42
Gills (t) 11 14.66 18.89 0.0-54.09vs -0.63 >0.05
Gills (m) 14 31.89 60.42 0.0-235.97
Ovaries II 69.7 145.09 0.0-92.05vs -0.67 >0.05
Testes 10 57.8 80.57 5.97-272.71

42
Table 5.13: Results of Student's t-test for the seasonal differences in whole crab manganese
concentrations (llg.g-1 wet mass).
n Mean SD Range t-value p-value
Summer 49 664.37 1170.08 55.82-6138.67vs 0.34 >0.05
Autumn 16 304.48 104.71 64.64-451.2
Summer 49 664.37 1170.08 55.82-6138.67vs 3.59 <0.05
Winter 21 149.7 120.02 45.54-496.54
Summer 49 664.37 1170.08 55.82-6138.67vs 0.85 >0.05
Spring 25 291.92 188.25 112.44-901.36
Autumn 16 304.48 104.71 64.64-451.2vs 4.31 <0.05
Winter 21 149.7 120.02 45.54-496.54
Autumn 16 304.48 104.71 64.64-451.2vs 0.65 >0.05
Spring 25 291.92 188.25 112.44-901.36
Winter 21 149.7 120.02 45.54-496.54vs -4.28 <0.05
Spring 25 291.92 188.25 112.44-901.36

43
Table 5.14: Results of Student's t-test for the differences in mean crab carapace summer, autumn
and winter manganese concentrations (I-lg.g-I wet mass) (Mean logarithms of seasonal
manganese concentrations used to calculate the t-value).
n Mean SD Range t-value p-value
Summer 18 337.79 257.15 100.34-1082.73vs 2.68 <0,05
Autumn 5 155.4 154.46 0.0-395.9
Summer 18 337.79 257.15 100.34-1082.73vs 3.78 <0.05
Winter 6 117.24 126.9 13.65-307.1
Autumn 5 155.4 154.46 0.0-395.9vs -0.09 >0.05
Winter 6 117.24 126.9 13.65-307.1.
Table 5.15: Results of the Mann-Whitney test for differences in crab carapace manganese
concentration (I-lg.g-I wet mass) of spring and the other seasons.
n Mean SD Range z-value p-value
Summer 18 337.79 257.15 100.34-1082.73vs -2.9 <0.05
Spring 10 139.89 62.15 17.68-232.42
Autumn 5 155.4 154.46 0.0-395.9vs 0.306 >0.05
Spring 10 139.89 62.15 17.68-232.42
Winter 6 117.24 126.9 13.65-307.1vs . 0.813 >0.05
Spring 10 . 139.89 62.15 17.68-232.42

44
Table 5.16: Results of Student's t-test for the seasonal differences in mean crab muscle
manganese concentration (ltg.g- I wet mass) (Mean logarithms of seasonal manganese
concentrations used to calculate the t-value).
n Mean SD Range t-value p-value
Summer 15 51.2 68.18 3.67-193.52vs 3.1 <0.05
Autumn 4 1.69 1.97 0.0-3.77
Summer 15 51.2 68.18 3.67-193.52vs 1.43 >0.05
Winter 4 11.62 14.96 0.0-33.53
Summer 15 51.2 68.18 3.67-193.52vs 1.74 <0.05
Spring 6 11.41 13.85 0.0-37.35
Autumn 4 1.69 1.97 0.0-3.77vs -1.49 >0.05
Winter 4 11.62 14.96 0.0-33.53.
Autumn 4 1.69 1.97 0.0-3.77vs -1.44 >0.05
Spring 6 11.41 13.85 0.0-37.35
Winter 4 11.62 14.96 0.0-33.53vs 0.05 >0.05
Spring 6 11.41 13.85 0.0-37.35
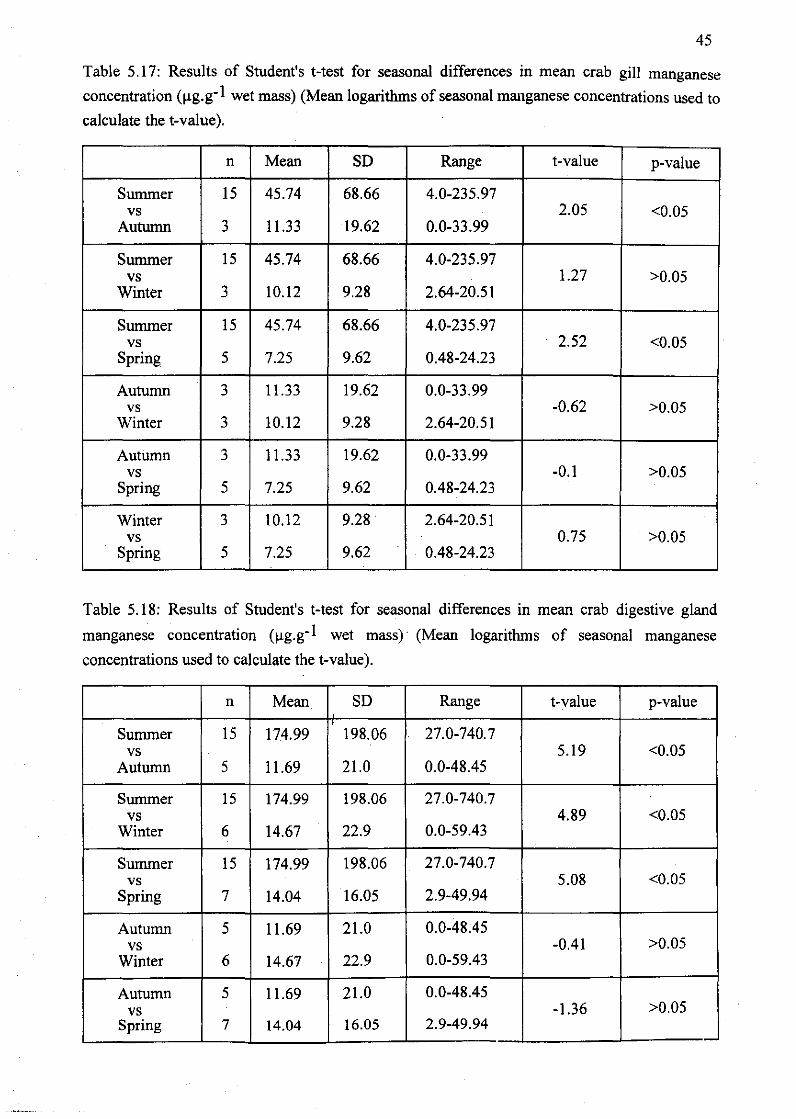
45
Table 5.17: Results of Student's t-test for seasonal differences in mean crab gill manganese
concentration (l!g.g-l wet mass) (Mean logarithms of seasonal manganese concentrations used to
calculate the t-value).
n Mean SD Range t-value p-value
Summer 15 45.74 68.66 4.0-235.97vs 2.05 <0.05
Autumn 3 11.33 19.62 0.0-33.99
Summer 15 45.74 68.66 4.0-235.97vs 1.27 >0.05
Winter 3 10.12 9.28 2.64-20.51
Summer 15 45.74 68.66 4.0-235.97vs 2.52 <0.05
Spring 5 7.25 9.62 0.48-24.23
Autumn 3 11.33 19.62 0.0-33.99vs -0.62 >0.05
Winter 3 10.12 9.28 2.64-20.51
Autumn 3 11.33 19.62 0.0-33.99vs -0.1 >0.05
Spring 5 7.25 9.62 0.48-24.23
Winter 3 10.12 9.28 2.64-20.51vs 0.75 >0.05
Spring 5 7.25 9.62 0.48-24.23
Table 5.18: Results of Student's t-test for seasonal differences in mean crab digestive gland
manganese concentration (l!g.g-l wet mass)' (Mean logarithms of seasonal manganese
concentrations used to calculate the t-value).
n Mean SD Range t-value p-value
Summer 15 174.99 198.06 27.0-740.7vs 5.19 <0.05
Autumn 5 11.69 21.0 0.0-48.45
Summer 15 174.99 198.06 27.0-740.7vs 4.89 <0.05
Winter 6 14.67 22.9 0.0-59.43
Summer 15 174.99 198.06 27.0-740.7vs 5.08 <0.05
Spring 7 14.04 16.05 2.9-49.94
Autumn 5 11.69 21.0 0.0-48.45vs -0.41 >0.05
Winter 6 14.67 22.9 0.0-59.43
Autumn 5 11.69 21.0 0.0-48.45vs -1.36 >0.05
Spring 7 14.04 16.05 2.9-49.94
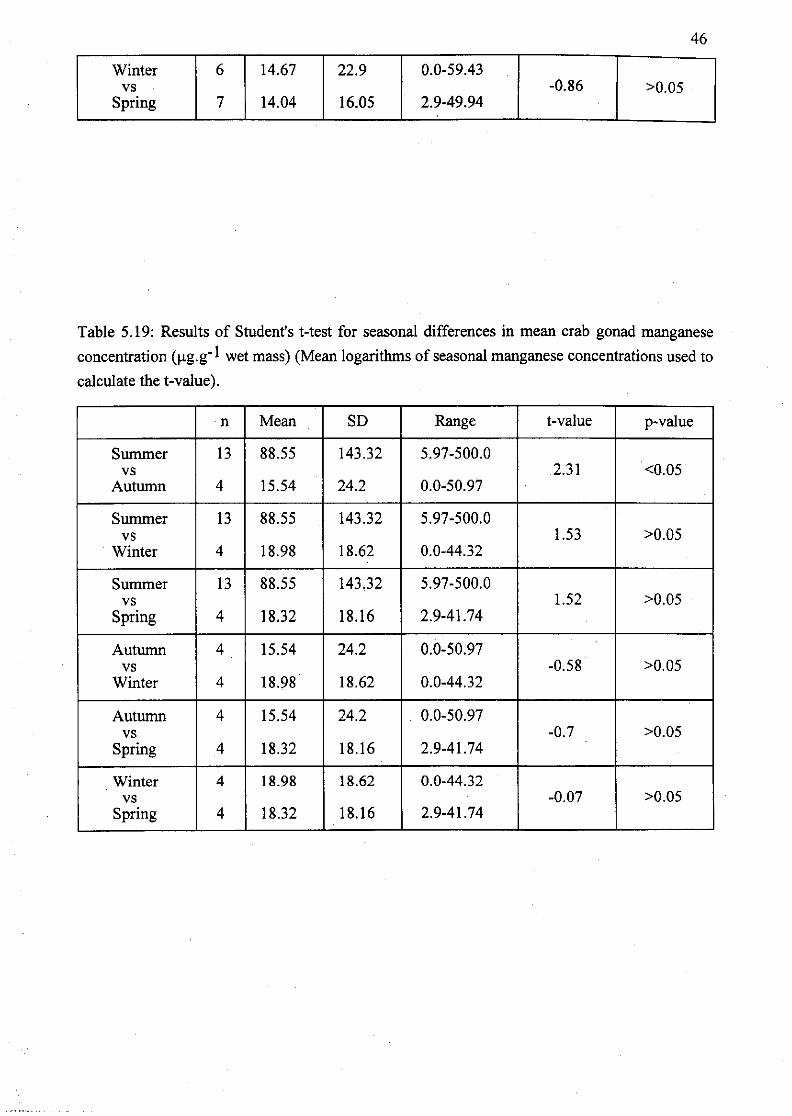
46
Winter 6 14.67 22.9 0.0-59.43vs -0.86 >0.05
Spring 7 14.04 16.05 2.9-49.94
Table 5.19: Results of Student's t-test for seasonal differences in mean crab gonad manganese
concentration (lJg.g- I wet mass) (Mean logarithms of seasonal manganese concentrations used to
calculate the t-value).
n Mean SD Range t-value p-value
Summer 13 88.55 143.32 5.97-500.0vs 2.31 <0.05
Autumn 4 15.54 24.2 0.0-50.97
Summer 13 88.55 143.32 5.97-500.0vs 1.53 >0.05
Winter 4 18.98 18.62 0.0-44.32
Summer 13 88.55 143.32 5.97-500.0vs 1.52 >0.05
Spring 4 18.32 18.16 2.9-41.74
Autumn 4 15.54 24.2 0.0-50.97vs -0.58 >0.05
Winter 4 18.98 18.62 0.0-44.32
Autumn 4 15.54 24.2 0.0-50.97vs -0.7 >0.05
Spring 4 18.32 18.16 2.9-41.74
Winter 4 18.98 18.62 0.0-44.32vs -0.07 >0.05
Spring 4 18.32 18.16 2.9-41.74

47
Table 5.20: Results of Student's t-test for differences iIi whole crab (~g.g-I wet mass) and water
manganese concentrations (mg.l- I) at each locality: Jonkershoek (1) and SFW (S), as well as the
bioconcentration factor (BCFw)' calculated for whole crabs (Mean logarithms of manganese
concentrations used for the t-test; t = t-value, p = p-value).
n Mean SD Range t p BCFw
Water (1) 8 0.138 0.118 0.0-0.26vs -17.94 <0.05 2108.77
Whole crab (J) 60 291.01 356.31 45.54-1644.04
Water (S) 8 0.125 0.133 0.0-0.27vs -20.22 <0.05 4769.68
Whole crab (S) 51 596.21 1113.83 120.53-6138.67
Table 5.21: Results of Student's t-test for differences in crab tissue (~g.g-I wet mass) and water
manganese concentrations (mg.l- I) at each locality, as well as the bioconcentration factor
(BCFw) calculated for all tissues (Dig.gland = digestive gland; t = t-value, p = p-value).
JONKERSHOEK.
n Mean SD Range t p BCFw
Water 8 0.138 0.118 0.0-0.26
vs Muscle 16 23.93 46.92 0.0-187.12 -5.42 <0.05 173.41
vs Dig.gland 18 97.68 196.16 0.0-444.4 4.67 <0.05 707.83
vs Gills 14 36.47 73.77 0.0-235.97 -4.47 <0.05 264.28.
vs Gonads 14 28.8 32.21 0.0-100.0 -6.42 <0.05 208.7
SFW
n Mean SD . Range t p BCFw
Water 8 0.125 0.133 0.0-0.27
vs Muscle 13 38.98 61.53 0.0-193.52 -5.19 <0.05 311.84
vs Dig.gland 15 74.09 88.47 0.0-275.0 -3.78 <0.05 592.72
vs Gills 12 23.0 18.88 2.64-54.09 -7.32 <0.05 184.0
vs Gonads 11 87.21 157.22 0.0-500.0 -5.92 <0.05 697.68
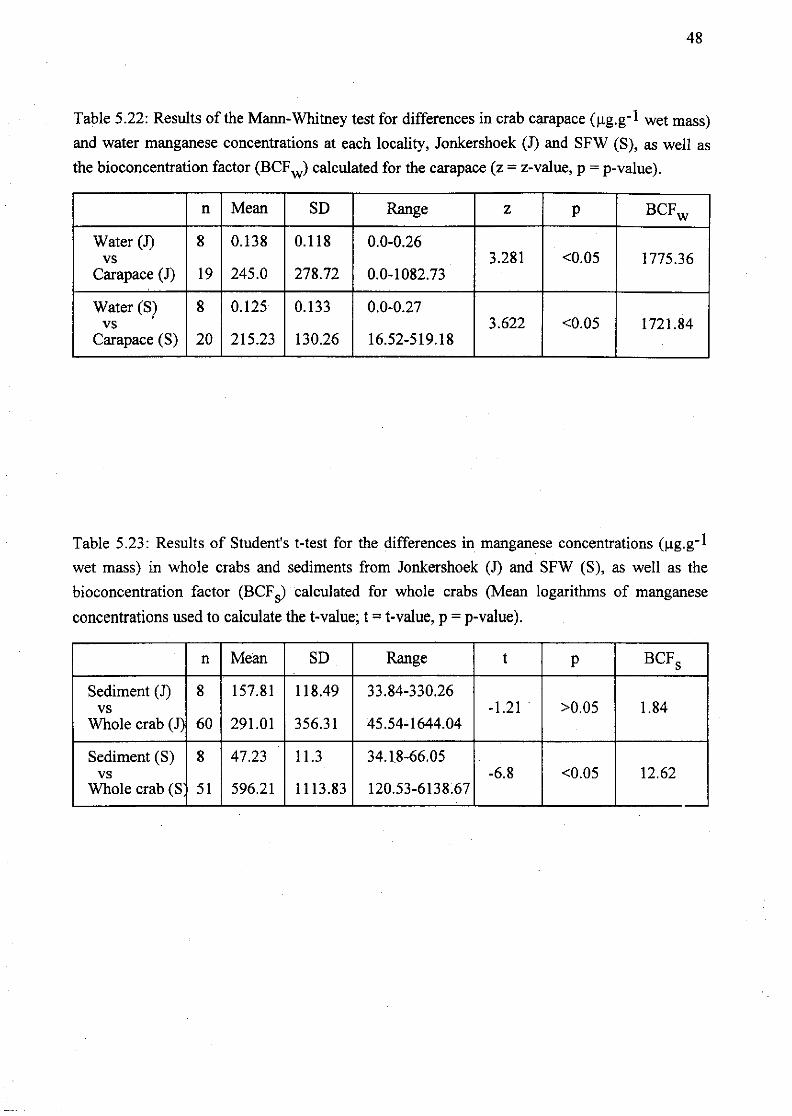
48
Table 5.22: Results of the Mann-Whitney test for differences in crab carapace (~g.g-I wet mass)
and water manganese concentrations at each locality, Jonkershoek (1) and SFW (S), as well as
the bioconcentration factor (BCFw) calculated for the carapace (z =z-value, p =p-value).
n Mean SD Range z p BCFw
Water (1) 8 0.138 0.118 0.0-0.26vs 3.281 <0.05 1775.36
Carapace (1) 19 245.0 278.72 0.0-1082.73
Water (S) 8 0.125 0.133 0.0-0.27vs 3.622 <0.05 1721.84
Carapace (S) 20 215.23 130.26 16.52-519.18
Table 5.23: Results of Student's t-test for the differences in manganese concentrations (~g.g-I
wet mass) in whole crabs and sediments from Jonkershoek (1) and SFW (S), as well as the
bioconcentration factor (BCFs) calculated for whole crabs (Mean logarithms of manganese
concentrations used to calculate the t-value; t =t-value, p =p-value).
n Mean SD Range t p BCFs
Sediment (1) 8 157.81 118.49 33.84-330.26vs -1.21 . >0.05 1.84
Whole crab (J) 60 291.01 356.31 45.54-1644.04
Sediment (S) 8 47.23 11.3 34.18-66.05vs -6.8 <0.05 12.62
Whole crab (S 51 596.21 1113.83 120.53-6138.67

49
Table 5.24: Results of Student's t-test for the differences in mean manganese concentration
(~g.g-1 wet mass) in selected crab tissues and sediments at each locality, as well as the
bioconcentration factor (BCFs) calculated for all tissues (Dig.gland = digestive gland; Mean
logarithms of manganese concentrations used to calculate the t-value; t = t-value, p = p-value).
JONKERSHOEK
n Mean SD Range t p BCFs
Sediment 8 157.81 118.49 33.84-330.26
vs Muscle 16 23.93 46.92 0.0-187.12 4.66 <0.05 0.15
vs Dig.gland 18 97.68 196.16 0.0-444.4 2.3 <0.05 0.62
vs Gills 14 36.47 73.77 0.0-235.97 3.97 <0.05 0.23
vs Gonads 14 28.8 32.21 0.0-100.0 3.71 <0.05 0.18
SFW
n Mean SD Range t p BCFs
Sediment 8 47.23 11.3 34.18-66.05
vs Muscle 13 38.98 61.53 0.0-193.52 2.24 <0.05 0.83
vs Dig.gland 15 74.09 88.47 0.0-275.0 0.74 >0.05 1.57
vs Gills 12 23.01 18.88 2.64-54.09 2.95 <0.05 0.49
vs Gonads 11 87.21 157.22 0.0-500.0 1.04 >0.05 1.85
Table 5.25: Results of the Mann-Whitney test for the differences in manganese concentrations
(~g.g-1 wet mass) of the crab carapace and sediments at each locality, Jonkershoek (J) and SFW
(S), as well as the bioconcentration factor (BCFs) calculated for the carapace (z = z-value, p = p
value).
n Mean SD Range z p BCFs
Sediment (J) 8 157.81 118.49 33.84-330.26vs 0.415 >0.05 1.55
Carapace (J) 19 245.0 278.72 0.0-1082.73
Sediment (S) 8 47.23 11.3 34.18-66.05vs 2.769 <0.05 4.56
Carapace (S) 120 215.23 130.26 16.52-519.18

(a) (b)
Concentration (lJg/g wet mass) Concentration (lJg/g wet mass) Thousands
Large: >41 mm-carapace wldthj Medium:between 21 and 40 mm carapace width;Small: <20 mm carapace width
I - Jonkershoek ~ SFW ISmall
(710.88)
Medium
SIZE CLASSES
Largeo
1
1.4 -
0.2
1.2
0.6
0.4
0.8
r--~----~7
(ii];jWJ)
Jonkershoek SFW
LOCALITIES
(356.31)
./
200
o
100 -
300
400
700 _.
500
600
Figures 5(a)-(b): Mean manganese concentration in whole crabs (a) andvarious size classes (b) from both localities (SD in parenthesis).
v.o

(c) (d)
Concentration (lIg/g wet mass)
Carapace Muscle Dig.gland Gills
TISSUES
Gonads
I'.. ~:~~~r-~~o~;--~-~;~--'
Concentration (1I9/g wet mass)
(278.72)
Carapace Muscle Dig.gland Gills
TISSUES
50
o
150
100
200
300 -
250
(108.34)
Gonads
( 154.94)
(213.33)
50
o
100
150
250
200
Jonkershoek and SFW data pooled
Figures 5(c)-(d): Mean manganese concentration in carapaceand tissues of P. perlatus from the Eerste River (SD in parenthesis).
v.
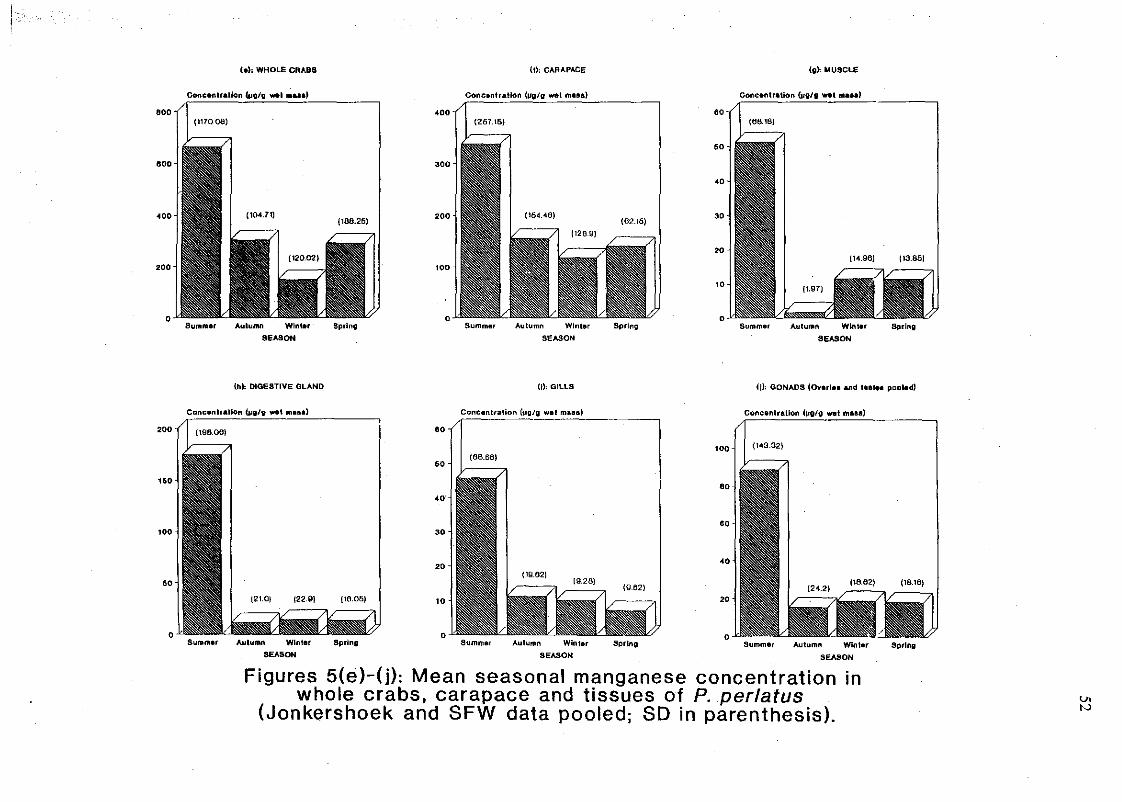
(e), WHOLE CRABS (t), CARAPACE (g}; MUSCLE
Concenlralkln ....0/'11 "' ....a) Concantratlon W'IIlg _t mau) Concentration ()lO/'ll _Imaa.'
-~ I400 60
(267.16) I I (66,lBj
600j~ '0
300
40
400(100.261
'00 30
~ 20
'00 '00
'0
0 0 0Summer AululM Winter SprlllQ SLImmer Autumn Winter Spring
SEASON SEASON SEASON
(h), DIGESTIVE OLAND (i); GILLS (j), GONADS (Overle. and teatel pooled)
SpringAutumn Winter
SEASON
(143.32f
Cone.nlraUon (110/'11 _t mau)
Summer
'00
I
SpringWinter
SEASON
Aut\lmn
(68.661
Concenlralion (1111/11 wei m8as)
S\lmm.r
30
'0
40
60
60
'0
SpringAulu"", Wlnler
SEASON
Suram.r
ConeenlraUon UJ'II/'II _t m•••)
'00
Figures 5(e)-(j): Mean seasonal manganese concentration Inwhole crabs, carapace and tissues of P. perlatus
(Jonkershoek and SFW data pooled; SD in parenthesis).v.N

53
Discussion
Comparisons of the mean manganese concentration found in the various selected tissues and the
carapace of Potamonautes perlatus (Table 5.4; Figure 5(c)), with the results obtained by Bryan
&. Ward (1965) for the lobster Homarus vulgaris and Steenkamp et al. (1994b) for the
freshwater crab Potamonautes warreni, were made. Steenkamp et aI. (1994b) found mean
concentrations of 11±9 to 39±46 flg.g- l wet muscle mass, 24±19 to 67±4l flg.g- l wet gonad
mass, 66±64 to 252±253 flg.g- l wet digestive gland mass, 52±57 to 117±277 flg.g- I wet.gill
mass and 275±130 to 973±513 flg.g- l wet carapace mass for P. warreni, from polluted
freshwater ecosystems. It was found that, in comparison, the manganese concentrations in the
gills and carapace of P. perlatus were relatively low. The mean muscle, gonad and digestive
gland concentrations compared well. However, compared to the findings of Bryan & Ward
(1965) for unexposed individuals of Homarus vulgaris, namely mean manganese concentrations
of 0.8, 4.8,1.6,20.8 and 225 flg.g- l wet mass for the muscles, digestive gland, gonads, gills and
carapace respectively, the manganese concentrations in the muscles, digestive gland and gonads
of P. perlatus were extremely high and the gill and carapace manganese somewhat high.
Despite the fact that fairly high manganese concentrations were found in certain tissues of P.
perlatus, the whole body manganese concentrations in crabs from Jonkershoek and SFW, i.e.
l19.0±152.19 and 161.76±221.31 flg.g- l dry mass respectively, when compared to the dry mass
Mn concentrations found in P. warreni by Van Eeden & Schoonbee (1991) (568.0±O.03 to
l675.O±O.02 flg.g- I), were shown to be very low.
It is clear that large intra- and interspecific variations in manganese concentrations in whole
body, tissue and carapace exist, complicating efforts to determine the degree of accumulation in
the species. The low whole crab dry mass concentrations in P. perlatus indicate that Mn is
relatively well regulated in this species in the Eerste River. However, the statistically significant
differences in whole body Mn, observed between Jonkershoek and SFW, as well as the
differences in Mn between large-sized and between medium-sized crabs from the two localities
(Tables 5.6 to 5.8), indicate Mn accumulation from the environment in the SFW population.
This is supported by the significantly higher concentrations in whole crabs than in the sediments
from SFW (Table 5.23), as well as the higher BCFw's and BCFs's for whole crabs, tissues
(except gills) and carapace from SFW (Tables 5.20-5.25). The reasons for the observed
differences between the two localities are not clear, but it is probable that the availability of Mn
from the water and sediments of SFW were increased by certain physico-chemical factors at this
site.
The determination of the specific sites of manganese storage in the crab body revealed that the
carapace contained the most Mn, and can therefore be considered the most important storage
site, with the digestive gland the second most important site (Tables 5.4 and 5.5). The BCFw and

54
the BCFs for the carapace (Tables 5.21, 5.22, 5.24 and 5.25), from Jonkershoek and SFW, were
also clearly higher than BCF's of any of the selected tissues and therefore support these findings.
The results of the present study agree with those of Bryan & Ward (1965) and Steenkarnp et al.
(1994b) for the marine lobster Homarus vulgaris and the freshwater crab Potamonautes warreni
respectively. Bryan & Ward (1965) stated that most of the manganese in the lobster is
incorporated into calcified regions such as the "shell" and ossicles and teeth of the gastric mill. It
was also suggested that the "shell" could possibly act as a reservoir for Mn. It is therefore
possible that the storage of Mn in the carapace is a mechanism by which the animal protects
itself against long-term Mn accumulation, since the carapace is shed during moulting. Similarly,
collembola· store metals in the intestinal epithelium and rid themselves of these metals through
excretion ofa type of intestinal "plug" with every moult (Van Straalen & Verkleij, 1993).
Food was found to be an important source of Mn for the lobster, Homarus vulgaris. When Bryan
& Ward (1965) pipetted a Mn solution into the stomach fluid of individuals of this species, the
Mn content of the "hepatopancreas" reached a maximum after 2 h, suggesting that much of the
absorption takes place via this organ. It is therefore expected that the digestive gland would
show high but variable concentrations of manganese, as was indeed the case with P. perlatus
(Table 5.4). The importance of food as source of manganese can also possibly explain the
relatively high and variable concentrations of manganese in the muscles, gills and gonads (Table
5.4): Bryan & Ward (1965) found corresponding increases in Mn in abdominal muscle and gills
with increases in blood Mn, indicating contamination of these tissues from the blood. They also
showed that Mn might be absorbed across the gills, but that this may be a passive rather than an
active process.
Whilst the carapace, and to a lesser extent the digestive gland, are clearly the most important
sites for Mn storage, the remaining three tissue types do not differ significantly in their
concentrations of manganese and therefore in their contribution to Mn storage (Table 5.5).
The relationship between crab size and whole body, tissue and carapace manganese
concentrations were investigated. The relatively strong negative correlation (r = -0.526) between
sizes of crabs and whole crab Mn c,)ncentrations, as well as. the statistically significant
differences in whole crab Mn found between large and small, and between medium and small
crabs from Jonkershoek (Table 5.1), prove that smaller (therefore younger) individuals of P.
perlatus take up more manganese per unit body mass than larger (older) individuals. These
results are supported by the strong negative correlations found between crab size and tissue
manganese concentrations (Table 5.3). Steenkamp et al. (I 994b) reported that P. warreni
showed a significant decrease in muscle manganese with an increase in crab size at two of the
sampling localities. Hill & O'Keeffe (1992) studied the feeding ecology of P. perlatus and found
that smaller individuals preyed significantly more on aquatic invertebrates than larger
individuals, whilst the latter preferred vegetable material. It is known that aquatic invertebrates

55
(e.g. insects) are able to accumulate heavy metals in their bodies (Albers & Camardese, 1993
and Kiffney & Clements, 1993). It is therefore possible that smaller individuals of P. perlatus
bioaccumulate more Mn from their prey and that upon reaching an unspecified size/age, a
change in food preference from invertebrates to vegetable material results in a decrease in Mn
bioaccumulation, which would explain the observed lower Mn concentrations in larger crabs.
Steenkamp et al. (I 994b) suggested that the higher manganese concentrations in smaller
individuals are due to the fact that the regulation mechanisms are not yet fully developed and
that younger crabs have a relatively higher metabolic rate. Gherardi et al. (1987) and Gherardi &
Micheli (1989) found that younger individuals of Potamon fluviatile and P. potamios
palestinensis respectively, tend to hide more under stones and rocks, especially during the night.
Since this type of microhabitat offers a relatively constant environment, it is possible that the
younger crabs are exposed to specific manganese concentrations for longer periods, which might
also contribute to these elevated manganese concentrations.
Despite the difficulty in explaining the observed higher manganese concentrations in small
crabs, it is clear that body size is an important factor influencing the uptake of manganese by
Potamonautes perlatus.
As far as the relationships between factors such as gender and seasonality and whole body, tissue
and carapace manganese concentrations are concerned, it was found that no statistically
significant differences in whole body, tissue or carapace manganese concentrations existed
between males and females (Tables 5.11 and 5.12). The results of Steenkamp et al. (l994b)
varied between their three sampling locations. Whilst at one of the locations no differences
occurred between the sexes, at the remaining two locations significant differences indeed
occurred between the two sexes. Despite the fact that gender seems to be of some importance in
the accumulation of Mn in specie's such as P. warreni, it is concluded from this study that gender
does not seem to be an influencing factor in P. perlatus.
There were, however, clear relationships between seasonality and whole crab, tissue and
carapace manganese concentrations. All selected tissues and the carapace, as well as whole
crabs, exhibited a number of statistical differences between the seasons (Tables 5.13 to 5.19). In
all cases a summer peak in manganese concentration occurred, corresponding with a slight
summer increase in water manganese concentration (Figures 4(c) and 5(e)-G)). Although the
water is a probable source of Mn to the crabs, it is also likely that a change in diet and activity
patterns during summer could be responsible for the summer Mn peaks in the crabs. As food is
such an important source of Mn, and as all four selected tissues and the carapace are affected by
raised blood manganese concentrations (Bryan & Ward, 1965), a possible manganese-rich diet in
summer could increase the Mn levels in the various tissues and the carapace, as well as in the
entire body.

56
Finally, it is concluded from the preliminary results, that P. perlatus in the Eerste River, similar
to P. warreni (Steenkamp et aI., 1994b), qualifies as a potentially useful monitor of Mn
pollution. This is based entirely on the observed high concentrations of Mn in certain tissues of
P. perlatus and the summer water Mn peak, reflected in whole crabs, tissues .and carapace. On
the other hand, it must be noted that the degree of regulation ofMn in the body, as shown in the
present study, as well as the large intraspecific variations in Mn concentrations, may greatly
influence the accuracy to which Mn pollution in the riverine ecosystem is reflected in the crab.
Final conclusions can only be made after further intensive research has been undertaken on,
especially, the uptake of Mn in P. perlatus and the factors affecting the availability of Mn to the
species.
---000---

57
CHAPTER 6
CONCENTRATIONS OF ZINC IN THE FRESHWATER CRAB,POTAMONAUTES PERLATUS
Introduction
Zinc is a heavy metal which occurs frequently in nature and is generally associated with Fe, Cu,
Cd and Pb sulphides (Galvin, 1996). It is found in several minerals such as zinc blends,
smithsonite, ZnC03, willemite, Zn2Si04' zincite, ZnO etc. (Moore & Ramamoorthy, 1984), but
particularly in ZnS (Galvin, 1996). The ability of zinc to form complexes with particularly
ammonia, amines, halide ions and cyanide is well known (Moore & Ramamoorthy, 1984).
Zinc is an essential element in animal nutrition and is required in several processes e.g. the
biosynthesis of nucleic acids, namely RNA and DNA polymerases, the healing of tissues,
hormone metabolism, immune response and the stabilization of ribosomes and membranes
(Moore & Ramamoorthy, 1984).
According to Moore and Ramamoorthy (1984), zinc ranks fourth among metals next to steel,
aluminium and copper in annual global consumption. It has several industrial uses, of which the
galvinizing of iron and steel products, the use in brass products and the use as zinc-base alloys
for mechanical components in automobiles, are the major and most well known uses (Elinder &
Piscator, 1979 and Moore & Ramamoorthy, 1984). Other uses include as rolled zinc for e.g. dry
cell battery production and as zinc oxide for paints and agricultural products, among others
(Moore & Ramamoorthy, 1984).
An excess of zinc in aquatic ecosystems, originating from industrial, household and agriculturalI
runoff, can occur and this holds serious implications for those aquatic animals which cannot
regulate the levels of zinc in their bodies but accumulate the metal to high concentrations. The
sublethal effects of zinc on animals include, among others, retarded growth, poor appetite,
delayed wound healing (Richardson & Gangolli, 1994), leg paralysis, lion-viable newborn,
cartilage erosion, changes in tissue minerals and decreased retention of calcium and phosphorus
(Mills, 1989). Abel (1989) reported that zinc is a fairly potent bactericide and fungicide and
could therefore, in an aquatic ecosystem, interfere with the processing of detritus by decomposer
organisms, thus depriving other aquatic animals of a major food source.
There are several factors influencing the bioavailability and toxicity of zinc in freshwater
ecosystems: the toxicity of zinc, for instance, decreases with an increase in water hardness and
pH (Forstner & Prosi, 1979 and Moore & Ramamoorthy, 1984) as well as a decrease in age of
the animal: immature stages are, in general, more sensitive to zinc than adults (Moore &

58
Rarnamoorthy, 1984). The interactions between Zn and Cd, and Zn and Cu, also play important
roles (Blinder & Piscator, 1979). Certain organic substances in solution can remove zinc ions
from the water by the formation of organic cornpounds, which subsequently lower the
availability of zinc to the aquatic organisms (Forstner & Prosi, 1979). Zinc toxicity, in the
animal, may also be modified by sequestration in metallothionein, a small protein synthesized
when zinc is administered to experimental animals (Ottaway, 1980). The synthesis of
metallothioneins has also been reported for decapod crustaceans: Rainbow & .Scott (1979) and
Engel & Brouwer (1987) discussed the production of a heavy metal- (notably zinc) binding
protein in the midgut-/digestive gland of the crabs, Carcinus maenas and Callinectes sapidus,
respectively.
The accumulation of zinc by freshwater decapod crustaceans has been studied in several species,
e.g. the crayfishes Orconectes virilis (Anderson & Brower, 1978 and France, 1987) and
Austopotamobius pallipes (Bryan, 1968) as well as the crabs OZiotelphusa senex senex
(Radhakrishnaiah, 1987) and Potamonautes warreni (du Preez et aI., 1993; Steenkamp, 1992 and
Van Eeden & Schoonbee, 1991).
Materials and Methods
All crab samples were prepared, tested and statistically analysed according the method described
in Chapter 3.
Results
In all cases only the zinc concentrations per gram wet mass were used for statistical analysis.
Crabs showed large individual variation in whole body, as well as tissue and carapace zinc
concentrations. This was an important consideration in the interpretation of the statistical results.
The relationship between crab size and whole crab zinc concentration
In order to investigate the possible relationship between whole crab zinc concentrations and the
size of the crabs, the data from Ionkershoek and SFW were pooled. The carapace widths of the
crabs, in decreasing order, were compared with the respective zinc concentrations and the
correlation coefficient (r) thereof, calculated. With 53 degrees of freedom and an r2-value of
23.77%, an r-value of -0.4875 was obtained. This indicated a reasonably strong negative

59
correlation between sizes of crabs and the concentrations of zinc in the body: as crab size
decreased, so did the zinc concentration increase (Figure 6(b)).
Differences in zinc concentrations of the various size classes at each locality
Since the whole crab data for large, medium and smal1-sized crabs from each locality were not
normally distributed, the mean logarithm of the zinc concentrations in each class was used to test
for statistical1y significant differences (p<O.05) (Table 6.1).
Differences in concentrations were found between large and smal1 crabs from Jonkershoek. The
small size class showed the highest mean zinc concentration (131.22±61.23 Ilg.g-1 wet mass)
and large sized crabs the lowest {74.64±25.85 Ilg.g- l wet mass).
Significant differences existed between large and medium and between medium and smal1 size
classes from SFW, with smal1 and large crabs also exhibiting highest and lowest mean
concentrations respectively (345.66±260.36 and 48.7±24.9Ilg.g: l wet mass).
The relationship between crab size. and tissue and carapace zinc concentration
In order to investigate the possible relationship between crab size and zinc concentration in
selected tissues, namely muscle tissue, digestive gland, gills and gonads, as wen as the carapace,
the data from Jonkershoek and SFW were pooled, after which the carapace widths of crabs, in
decreasing order, were compared with the respective tissue and carapace zinc concentration.
Table 6.2 shows the r-values calculated for each tissue and for the carapace.
Strong negative correlations were found between crab size and the zinc concentration in the
muscles and carapace. Reasonably strong negative correlations existed between crab size and
zinc concentration in the· digestive gland and gonads, whereas the zinc concentration in the gills
proved to be poorly negatively correlated with the size of the crabs.
Differences in zinc concentrations of the various selected tissues and the carapace
The mean zinc concentration values for the selected tissues and the carapace of crabs from
Jonkershoek and SFW, were pooled in order to determine whether statistical1y significant
differences (p<O.05) existed between the various tissues and the carapace. Since the data were
not normal1y distributed, the mean logarithms of the tissue and carapace zinc concentrations
were used in the t-test. The respective mean concentrations and standard deviations are tabulated
in Table 6.3. Table 6.4 shows the results of the t-test performed on the tissu.: and carapace
concentrations.

60
When comparing values obtained for the selected tissues and the carapace, significant
differences were found between the mean zinc concentration in all the tissues, except between
muscle and gonads, digestive gland and gonads, and digestive gland and gill tissue. The carapace
showed the highest mean concentration (78.55±9I.926 flg.g- I wet mass), whereas the lowest
mean was found in the digestive gland (26.968±3I.423 flg.g- I wet mass) (Figure 6(c».
Differences in zinc concentrations of crabs from Jonkershoek and SFW
(a) Differences in concentration values for whole crabs
The results of Student's t-test performed on the mean logarithms of the whole crab ZInC
concentrations from Jonkershoek and SFW are shown in Table 6.5.
The highest mean zinc concentration (l12.69±155.88 flg.g- 1 wet mass), was found in crabs from
SFW (Figure 6(a». A t-value of 1.33 indicated that there was no statistically significant
difference (p>0.05) in mean whole crab zinc concentrations between the two localities.
(a)(i) Differences in mean whole crab zinc concentration of the various size classes
Through a comparison of the mean logarithms of whole crab zinc coricentration values between
large, medium and small crabs, from Jonkershoek and SFW, it was established that statistically
significant differences (p<0.05) existed between large crabs as well as between medium sized
crabs from the two localities. In both cases the crabs from Jonkershoek had higher mean
concentrations(74.64±25.85 and 87.25±80.08 flg.g- I wet t:nass respectively) than those from
SFW (Table 6.6; Figure 6(b».
(b) Differences in concentration values for the selected tissues and the carapace
The mean zinc concentration in the carapace, muscle, digestive gland, gills and gonads of crabs
from Jonkershoek and SFW were compared with the use of Student's t-test and tabulated in
Table.6.7. Since the data were not normally distributed, the mean logarithm of the zinc
concentrations in the tissues and carapace were used to calculate the t-value. In the case of the
carapace, however, a normal distribution could not be obtained after transformation of the
com;entration value data. A nonparametric test, namely the Mann-Whitney test, was therefore
performed on the original data, to investigate possible differences (Table 6.8).
Statistically significant differences (p<0.05) were found to exist between the zinc concentration
values for the muscles, digestive gland, gills and gonads, from crabs originating from
Jonkershoek and SFW respectively. In the case of all four tissues, the highest mean zinc
concentrations were found in crabs collected from SFW. The respective means were
63.87±72.22 flg.g- 1 wet mass for muscle tissue, 3I.843±38.98 flg.g- I wet mass for the digestive
gland, 56.54±73.93 flg.g- I wet mass for the gills and 113.93±193.48 flg.g- 1 wet mass for the
gonads (Figure 6(d».

61
Differences between zinc concentrations of males and females
In order to determine whether statistically significant differences (p<O.OS) existed in the mean
whole crab, tissue and carapace zinc concentrations· between males and females, the data
obtained for crabs from Jonkershoek and SFW, were pooled for each sex. In all cases the
original data failed the normal probability test, therefore each concentration value was
logarithmically transformed. In the case of the muscle and gill tissues, the transformed data also
failed to provide a normal distribution, therefore the Mann-Whitney nonparametric test was
performed.
(a) Differences in the zinc concentrations of whole crabs
Table 6.9 shows the results of Student's t-test, performed on the mean logarithm of the whole
crab zinc concentrations in males and females of Potamonautes perlatus. The highest mean zinc
concentration was found in males (I 16.89±IS2.4 Ilg.g-1 wet mass) but no statistically significant
difference (p>O.OS) existed between the two genders.
(b) Differences in zinc concentrations of selected tissues and the carapace .
Although males exhibited the highest mean zinc concentrations in the carapace and all but one of
the four tissue types (gonads), no statistically significant differences (p>O.OS) were found
between the two genders (Tables 6.1 0 and 6.11).
!')easonal variations in zinc concentration
The zinc concentrations in whole crabs, selected tissues and carapace from the different seasons
were tested for statistically significant differences (p<O.OS). In each instance, the data for crabs
collected from Jonkershoek and SFW were pooled and these then tested for normality. None of
the data sets were normally distributed and were thus logarithmically transformed. The
transformed whole crab data also failed the normal probability test, thus the Mann-Whitney test
was performed.
(a) Seasonal differences in whole crab zinc concentrations
The Mann-Whitney nonparametric test produced statistically significant differences (p<O.OS) in
whole crab zinc concentrations for spring and the other three seasons (Table 6.12). The highest
mean whole crab zinc concentration (l77.6±213.89 Ilg.g-1 wet mass), was observed for winter,
whereas spring showed the lowest mean (S0.36±67.3 Ilg.g-1 wet mass) (Figure 6(e».
(b) Seasonal differences in tissue and carapace zinc concentrations
1. Carapace

62
Statistically significant differences (p<O.05) in carapace zinc concentrations were found between
all seasonal comparisons, except between autumn and spring. The highest mean zinc
concentration occurred in winter (l76.95±180.25 Ilg.g- l wet mass) and the lowest in autumn
(40.43±32.94 Ilg.g- l wet mass) (Figure 6(f). The results of the t-test, performed on the mean
logarithms of the seasonal zinc concentrations, are tabulated in Table 6.13.
2. Muscle tissue
The highest mean muscle zinc concentration (7 I.95±72.19 Ilg.g- l wet mass) occurred in winter,
whereas in autumn the mean concentration was the lowest (9.65±3.93 Ilg.g- l wet mass) (Figure
6(g». Through pairwise comparisons of the different seasons, it was found that statistically
significant differences (p>O.05) existed between summer and autumn and between autumn and
winter (Table 6.14).
3. Gill tissue
Statistically significant differences (p<O.05) in gill ZinC concentrations were found when
comparing values for summer and winter, and winter and spring. In Table 6.15 it can be seen
that the highest and lowest mean zinc concentrations occurred in autumn (l27.96±98.65 Ilg.g- l
wet mass) and summer (lO.23±14.03 Ilg.g- l wet mass) respectively (Figure 6(h».
4. Digestive gland
The results of Student's t-test on the mean logarithms of the digestive gland zinc concentrations,
when comparing values from the different seasons, are tabulated in Table 6.16. Only the
comparisons of summer and winter and of winter and spring showed significant differences
(p<O.05). The mean zinc concentration was the highest in winter (37.02±25.62 Ilg.g- l wet
mass), whilst the lowest mean concentration occurred in summer (l7.533±23.6l7 Ilg.g- l wet
mass) (Figure 6(i».
5. Gonads
When the data for the ovaries and testes were pooled, the highest and lowest mean gonad zinc
concentrations (l20.93±118.97 and 22.704±22.5 Ilg.g- l wet mass) occurred in winter and spring
respectively (Figure 60». No statistically significant differences (p>O.05) were however found
to exist between the values for any of the seasons (Table 6.17).
Differences in zinc concentrations of whole crabs, tissues, carapace, and Eerste River water
The original as well as the transformed data from water samples failed to provide a normal
distribution, therefore the Mann-Whitney test was performed in each case, to test for statistically
significant differences (p<O.05).
(a) Differences in concentration values for whole crabs and water

63
The Mann-Whitney test (Table 6.18) indicated significant differences between the whole crab
and water zinc concentrations in both localities, i.e. Jonkershoek as well as SFW.
(b) Differences in concentration values for the selected tissues, carapace and water
The zinc concentrations in all the tissues as well as the carapace from both localities proved to be
significantly different (P<0.05) from the concentrations in the water. The results of the Mann
Whitney test are listed in Table 6.19.
Differences in zinc concentrations of whole crabs. tissues. carapace. and sediments
(a) Differences in concentration values for whole crabs and sediments
Student's t-test, performed on the mean logarithms of whole crab and sediment ZinC
concentrations, for Jonkershoek and SFW, yielded a statistically significant difference (P<0.05)
in the whole crab and sediment concentrations from Jonkershoek. The results of the t-test are
tabulated in Table 6.20.
(b) Differences in concentration values for the selected tissues, carapace and sediments
The mean logarithms of the tissue and carapace zinc concentrations were used to test for
statistically significant differences (p<O.05) between tissue, carapace and sediment zinc
concentrations within the two localities. The transformed carapace concentrations, however,
were not normally distributed, therefore the Mann-Whitney test was performed.
Significant differences in zinc concentrations were found between the sediment and digestive
gland and gills from Jonkershoek and between the sediment and muscles from SFW.
Table 6.21 lists the results of Student's t-test, performed on the mean logarithms of the tissue
zinc concentrations from the two localities. The results of the Mann-Whitney test, performed on
the original carapace data, are shown in Table 6.22.

64
Table 6.1: Results of Student'st-test for differences in whole crab zinc concentrations (~g.g-l
wet mass) of the various size classes at each locality.
JONKERSHOEK
. n Mean SD Range t-value p-value
Large 22 74.64 25.85 40.47-133.94vs 0.04 >0.05
Medium 34 87.25 80.08 30.72-432.64
Large 22 74.64 25.85 40.47-133.94vs -2.24 <0.05
Small . 4 131.22 61.23 41.65-171.65
Medium 34 87.25 80.08 30.72-432.64vs -1.55 >0.05
Small 4 131.22 61.23 41.65-171.65
SFW
n Mean SD Range t-value p-value'.
Large 6 48.7 24.9 17.48-71.78vs -0.3 >0.05
Medium 39 86.69 114.28 10.39-624.87
Large 6 48.7 24.9 17.48-71.78vs -4.58 <0.05
Small· 6 345.68 260.36 98.03-690.63.
Medium 39 86.69 114.28 10.39-624.87vs -3.73 <0.05
Small 6 345.68 260.36 98.03-690.63
Table 6.2: R2-values calculated for sizes of crabs and selected tissue and carapace zmc
concentrations (DF =Degrees of freedom; Dig.gland =digestive gland).
DF r-value.
R-sq.(%)
Crab size and Muscle 27 -0.7061 49.85
Crab size and Dig.gland 29 -0.5683 32.3
Crab size and Gills 24 -0.2076 4.31
Crab size and Gonads 23 -0.466 21.68
Crab size and Carapace 28 -0.612 37.45
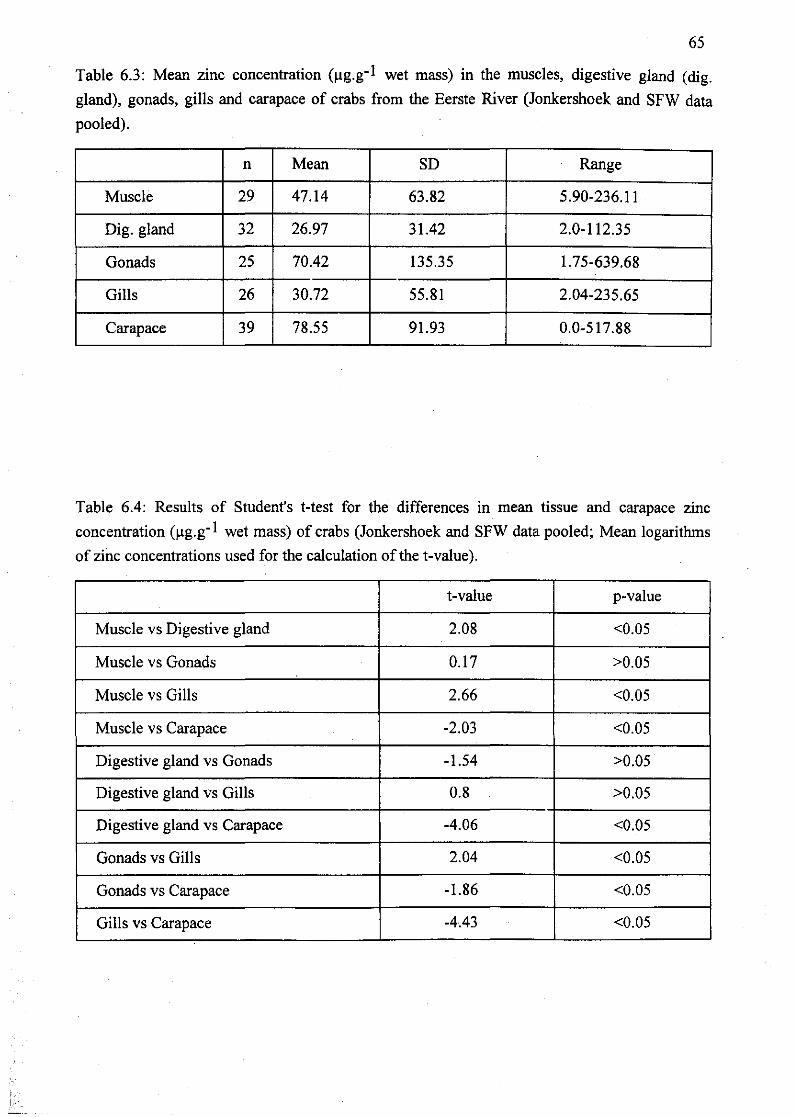
65
Table 6.3: Mean zinc concentration (llg.g-1 wet mass) in the muscles, digestive gland (dig.
gland), gonads, gills and carapace of crabs from the Eerste River (Jonkershoek and SFW data
pooled).
n Mean SD Range
Muscle 29 47.14 63.82 5.90-236.11
Dig. gland 32 26.97 31.42 2.0-112.35
Gonads 25 70.42 135.35 1.75-639.68
Gills 26 30.72 55.81 2.04-235.65
Carapace 39 78.55 91.93 0.0-5 I7.88
Table 6.4: Results of Student's t-test for the differences in mean tissue and carapace zinc
concentration (Ilg.g- I wet mass) of crabs (Jonkershoek and SFW data pooled; Mean logarithms
of zinc concentrations used for the calculation of the t-value).
t-value p-value
Muscle vs Digestive gland 2.08 <0.05
Muscle vs Gonads 0.1 7 >0.05
Muscle vs Gills 2.66 <0.05
Muscle vs Carapace -2.03 <0.05
Digestive gland vs Gonads -1.54 >0.05
Digestive gland vs Gills 0.8 >0.05
Digestive gland vs Carapace -4.06 <0.05
Gonads vs Gills 2.04 <0.05
Gonads vs Carapace -1.86 <0.05
Gills vs Carapace -4.43 <0.05

66
Table 6.5: Results of Student's t-test for the differences in mean whole crab zinc concentration
(~g.g-1 wet mass) from .Jonkershoek and SFW (Mean logarithms of the whole crab zmc
concentrations used in the t-test).. .
il Mean SD Range t-value p-value
Jonkershoek 60 85.56 64.83 30.7-432.6vs 1.333 >0.05
SFW 51 112.69 155.88 10.4-690.6
Table 6.6: Results of Student's t-test for the differences in mean whole crab zinc concentration
(~g.g-1 wet mass) for the various size classes, small, medium and large, from Jonkershoek (1)
and SFW (S) (Mean logarithms of zinc concentrations used in the t-test).
n Mean SD Range t-value p-value
Large (1) 22 74.64 25.85 40.47-133.94vs 2.74 <0.05
Large (S) 6 48.7 24.9 17.48-71.18
Medium (1) 34 87.25 80.08 30.72-432.64vs 1.78 <0.05
Medium (S) 39 86.69 114.28 10.39-624.87
Small (J) 4 131.22 61.23 41.65-171.65vs -1.78 >0.05
Small (S) 6 345.68 260.36 98.03-690.63

67
Table 6.7: Results of Student's t-test for the differences in mean tissue zinc concentration (~g.g-I
wet mass) of crabs from Jonkershoek (J) and SFW (Mean logarithms of the tissue zinc
concentrations used in the test).
n Mean SD Range t-value p-value
Muscle (J) 16 33.55 54.69 . 5.9-236.1vs -5.7 <0.05
Muscle (SFW) 13 63.87 72.22 6.0-196.8
Dig.gland (J) 17 22.67 31.84 3.5-79.5vs -3.52 <0.05
Dig.gland (SFW) 15 23.28 38.98 1.2-112.3
Gills (J) 14 8.52 9.36 2.0-38.5vs -3.09 <0.05
Gills (SFW) 12 56.54 73.93 3.5-235.6
Gonads (J) 14 36.24 46.49 4.8-184.2vs -3.61 <0.05
Gonads (SFW) 11 113.93 193.48 1.8-639.7
Table 6.8: Results of the Mann-Whitney test for the differences in mean. crab carapace zinc
concentration (~g.g-l wet mass) from the two localities, Jonkershoek (J) and SFW.
n Mean SD Range z-value p-value
Carapace (J) 19 64.63 52.81 0-222.7vs 0.084 >0.05
Carapace (SFW) 20 91.78 117.82 5.7-577.9

68
Table 6.9: Results of Student's t-test for the differences in mean whole crab zinc concentration
(llg.g-1 wet mass) of males and females (Mean logarithms of the whole crab zinc concentrations
used to calculate the t-value).
n Mean SD t-value p-value
Females 40 88.73 85.97vs -0.71 >0.05Males 49 116.89 152.4
Table 6.10: Results of Student's t-test for the differences in mean tissue and carapace zinc
concentration (llg.g-1 wet mass) of male (m) and female (f) crabs (Mean logarithms of the tissue
and carapace zinc concentrations used to calculate the t-value).
n Mean SD Range t-value p-value
Carapace (f) 15 72.93 65.99 8.1-517.9vs -0.3 >0.05
Carapace (m) 18 95.8 118.73 11.9-222.7
Dig.gland (f) 11 19.065 25.9 2.4-112.3vs . -0.66 >0.05
Dig.gland (m) 15 27.78 36.6 1.2-93.7
Ovaries 11 94.87 189.6 7.4-241.6vs -0.47 >0.05
Testes 10 67.5 80.8 4.8-639.7
Table 6.11: Results of the Mann-Whitney test for the differences in muscle and gill zinc
concentrations (llg.g-1 wet mass) of male (m) and female (f) crabs.
n Mean SD Range z-value p-value
Muscle (f) 10 26.72 23.4 7.8-180.1vs -0.589 >0.05
Muscle (m) 13 47.23 59.0 14.1-89.7
Gills (f) 10 15.9 18.7 3.3-235.6vs -0.674 >0.05
Gills (m) 14 42.96 72.5 2.0-56.3

69
Table 6.12: Results of the Mann-Whitney test for the seasonal differences in whole crab zinc
concentrations (l!g.g-1 wet mass).
n Mean SD Range z-value p-value
Summer 49 83.44 72.66 35.0-432.6vs 0.38 >0.05
Autumn 16 86.29 56.6 35.1-253.9
Summer 49 83.44 72.66 35.0-432.6vs 1.69 >0.05
Winter 21 177.6 213.89 30.7-690.6
Summer 49 83.44 72.66 35.0-432.6vs -3.38 <0.05
Spring 25 50.36 67.3 10.4-304.6
Autumn 16 86.29 56.6 35.1-253.9vs 1.16 >0.05
Winter 21 177.6 213.89 30.7-690.6
Autumn 16 86.29 56.6 35.1-253.9vs -3.01 <0.05
Spring 25 50.36 67.3 10.4-304.6
Winter 21 177.6 213.89 30.7-690.6vs
67.31-3.85 <0.05
Spring 25 50.36 10.4-304.6

70
Table 6.13: Results of Student's t-test for seasonal differences in mean crab carapace zinc
concentration (~g.g-l wet mass) (Mean logarithms of seasonal zinc concentrations used to
calculate the t-value).
n Mean SD Range t-value p-va1ue
Summer 18 67.02 44.09 19.0-185.8vs 2.02 <0.05
Autumn 5 40.43 32.94 0-75.6
Summer 18 67.02 44.09 19.0-185.8vs -2.06 <0.05
Winter 6 176.95 180.25 29.3-517.9
Summer 18 67.02 44.09 19.0-185.8vs 1.93 <0.05
Spring 10 59.32 74.41 5.7-222.7
Autumn 5 40.43 32.94 0-75.6vs -1.99 <0.05
Winter 6 176.95 180.25 29.3-517.9
Autumn 5 40.43 32.94 0-75.6vs -0.33 >0.05
Spring 10 59.32 74.41 5.7-222.7
Winter 6 176.95 180.25 29.3-517.9vs 2.25 <0.05
Spring 10 59.32 74.41 5.7-222.7
Table 6.14: Results of Student's t-test for seasonal differences in mean crab muscle zinc
concentration (~g.g-l wet mass) (Mean logarithms of seasonal zinc concentrations used to
calculate the t-value).
n Mean SD Range t-value p-value
Summer 15 50.73 69.82 13.2-236.1vs 2.29 <0.05
Auturrm 4 9.65 3.93 5.9-15.0
Summer 15 50.73 69.82 13.2-236.1vs -1.17 >0.05
Winter 4 71.95 72.19 31.3-180.1
Summer 15 50.73 69.82 13.2-236.1vs 0.67 >0.05
Spring 6 22.28 11.22 6.0-37.1
Autumn 4 9.65 3.93 5.9-15.0vs -3.91 <0.05
Winter 4 71.95 72.19 31.3-180.1

71
Autumn 4 9.65 3.93 5.9-15.0vs -0.81 >0.05
Spring 6 22.28 11.22 6.0-37.1
Winter 4 71.95 72.19 31.3-180.1vs 1.05 >0.05
Spring 6 22.28 11.22 6.0-37.1
Table 6.15: Results of Student's t-test for seasonal differences in mean crab gill zinc
concentration (llg.g-1 wet mass) (Mean logarithms of seasonal zinc concentrations used to
calculate the t-value).
n Mean SD Range t-value p-value
Summer 15 10.23 14.03 2.0-56.3vs -1.07 >0.05
Autumn 3 127.96 98.65 3.6-159.3
Summer 15 10.23 14.03 2.0-56.3vs -4.88 <0.05
Winter 3 55.84 89.57 42.0-235.6
Summer 15 10.23 14.03 2.0-56.3vs -1.34 >0.05
Spring 5 15.21 13.49 5.2-38.5
Autumn 3 127.96 98.65 3.6-159.3vs -1.51 >0.05
Winter 3 55.84 89.57 42.0-235.6
Autumn 3 127.96 98.65 3.6-159.3vs 0.17 >0.05
Spring 5 15.21 13.49 5.2-38.5
Winter 3 55.84 89.57 42.0-235.6vs 3.67 <0.05
Spring 5 15.21 13.49 5.2-38.5
Table 6.16: Results of Student's t-test for the seasonal differences in mean crab digestive gland
zinc concentration (llg.g-1 wet mass) (Mean logarithms of digestive gland zinc concentrations
used to calculate the t-value).
n Mean SD Range t-value p-value
Summer 15 17.53 23.62 3.5-93.7vs -0.51 >0.05
Autumn 5 30.47 46.1 3.7-112.3
Summer 15 17.53 23.62 3.5-93.7vs -2.57 <0.05
Winter 6 37.02 25.62 17.8-79.5
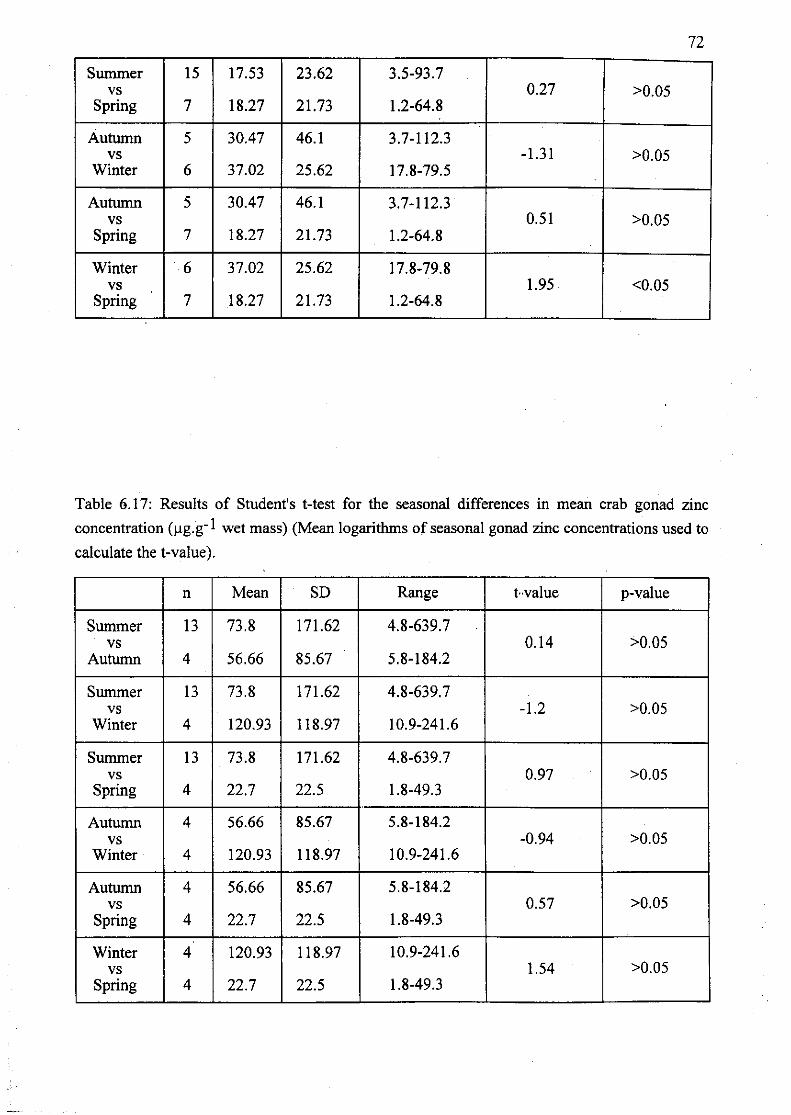
72
Summer 15 17.53 23.62 3.5-93.7vs 0.27 >0.05
Spring 7 18.27 21.73 1.2-64.8
Autumn 5 30.47 46.1 3.7-112.3vs -1.31 >0.05
Winter 6 37.02 25.62 17.8-79.5
Autumn 5 30.47 46.1 3.7-112.3vs 0.51 >0.05
Spring 7 18.27 21.73 1.2-64.8.
Winter 6 37.02 25.62 17.8-79.8vs 1.95 <0.05
Spring 7 18.27 21.73 1.2-64.8
Table 6.17: Results of Student's t-test for the seasonal differences in mean crab gonad zinc
concentration (llg.g-1 wet mass) (Mean logarithms of seasonal gonad zinc concentrations used to
calculate the t-value).
n Mean SD Range t..value p-value
Summer 13 73.8 171.62 4.8-639.7vs 0.14 >0.05
Autumn 4 56.66 85.67 5.8-184.2
Summer 13 73.8 171.62 4.8-639.7vs -1.2 >0.05
Winter 4 120.93 118.97 10.9-241.6
Summer 13 73.8 171.62 4.8-639.7vs 0.97 >0.05
Spring 4 22.7 22.5 1.8-49.3
Autumn 4 56.66 85.67 5.8-184.2vs -0.94 >0.05
Winter 4 120.93 118.97 10.9-241.6
Autumn 4 56.66 85.67 5.8-184.2vs 0.57 >0.05
Spring 4 22.7 22.5 1.8-49.3
Winter 4 120.93 118.97 10.9-241.6vs 1.54 >0.05
Spring 4 22.7 22.5 1.8-49.3

73
Table 6.18: Results of the Mann-Whitney test for differences in whole crab (llg.g- 1 wet mass)
and water zinc concentrations (mg.l- l ) at each locality: Jonkershoek (1) and SFW (S), as well as
the bioconcentration factor (BCFw) calculated for whole crabs (z = z-value, p = p-value).
n Mean SD Range z p BCFw.
Water (1) 8 0.23 0.33 0-0.88vs 4.004 <0.05 390.68
Whole crab (1) 60 85.56 64.83 30.7-432.6
Water (S) 8 0.23 0.3 0-0.82vs 3.965 <0.05 498.63
Whole crab (S 51 112.69 155.88 10.4-690.6
Table 6.19: Results of the Mann-Whitney test for differences in crab tissue, carapace (llg:g-1 wet
mass) and water zinc concentrations (mg.l- l ) at each locality, as well as the bioconcentration
factor (BCFw) calculated for all tissues and the carapace (Dig.gland = digestive gland; z = z
value, p = p-value).
JONKERSHOEK
n Mean SD Range z p BCFw
Water 8 0.219 0.325 0-0.875
vs Carapace 19 64.63 52.81 0-222.68 3.503 <0.05 295.11
vsMuscle 16 33.55 54.69 5.9-236.1 3.503 <0.05 153.2
vs Dig.gland 17 22.67 23.28 3.5-79.5 3.537 <0.05 103.52
vs Gills 14 8.52 9.36 2.0-38.5 3.424 <0.05 38.9
vs Gonads 14 36.24 46.49 4.8-184.2 3.424 <0.05 165.48
SFW
n Mean SD Range z p BCFw
Water 8 0.226 0.295 0-0.818
vs Carapace 20 91.76 117.82 5.7-517.9 3.621 <0.05 406.02
vsMuscle 13 63.87 72.22 6.0-196.8 3.377 <0.05 282.61
vs Dig.gland , 15 31.84 38.98 1.2-112.3 3.464 <0.05 140.88
vs Gills 12 56.54 73.93 3.5-235.6 3.325 <0.05 250.18
vs Gonads 11 J 13.93 193.48 1.8-639.7 . 3.266 <0.05 504.12

74
Table 6.20: Results of Student's t-test for the differences in zinc concentrations (~g.g-1 wet
mass) of whole crabs and sediments from the two localities, lonkershoek (1) and SFW (S), as
well as the bioconcentration factor (BCFs) calculated for whole crabs (Mean logarithms of zinc
concentrations used to calculate the t-value; t = t-value, p = p-value).
n Mean SD Range t p BCFs
Sediment (1) 8 38.21 28.05 8.55-89.12vs -4.2 <0.05 2.24
Whole crab (1) 60 85.56 64.83 30.7-432.6
Sediment (S) 8 66.25 32.82 27.34-102.54vs 0.01 >0.05 1.7
Whole crab (S 51 112.69 155.88 104-690.6
Table 6.21: Results of Student's t-test for the differences in zinc concentrations (~g.g-1 wet
mass) of the sediments and crab tissues at each locality: lonkershoek and SFW, as well as the
bioconcentration factor (BCFs) calculated for all tissues (Dig.gland = digestive gland; mean
logarithms of manganese concentrations used to calculate the t-value; t = t-value, p = p-value).
JONKERSHOEK
n Mean SD Range t p BCFs
Sediment 8 38.21 28.05 8.55-89.12
vs Muscle 16 33.55 54.69 5.9-236.1 1.02 >0.05 0.89
vs Dig.gland 17 22.67 31.84 3.5-79.5 1.86 <0.05 0.59
vs Gills 14 8.52 9.36 2.0-38.5 4.59 <0.05 0.22
vs Gonads 14 36.24 46.49 4.8-184.2 0.86 >0.05 0.95
SFW
n Mean SD Range t p RCFs
Sediment 8 66.25 32.82 27.34-102.54
vs Muscle 13 63.87 72.22 6.0-196.8 -2.41 <0.05 0.96
vs Dig.gland 15 23.28 38.98 1.2-112.3 -0.08 >0.05 0.35
vs Gills 12 56.54 73.93 3.5-235.6 1.66 >0.05 0.85
vs Gonads 11 113.93 193.48 1.8-639.7 -1.57 >0.05 1.72

75
Table 6.22: Results of the Mann-Whitney test for differences in zinc concentrations (~g.g-l wet
mass) of the crab carapace and sediment from Jonkershoek (1) and SFW (S), as well as the
bioconcentration factor (BCFs) calculated for the carapace (z = z-value, p = p-value).
n Mean SD Range z p BCFs
Sediment (1) 8 38.21 28.05 8.55-89.12vs 0.923 >0.05 1.69
Carapace (1) 19 64.63 52.81 0-222.7
Sediment (S) 8 66.25 32.82 27.34-102.54vs -0.152 >0.05 1.39
Carapace (S) 20 91.78 117.82 5.7-577.9

Large: >41 mm .carapace width; Medium:between 21 and 40 mm carapace width;Small: c20 mm carapace width
(b)
(260.36l
SmallMedium
SIZE CLASSES
180.081 1114.281
I - Jonkershoek ~ SFW ILarge
(25.85)
Concentration (~g/g wet mass)._---------,-,~,.,----,
o
100
300
200 -
400
(a)
Concentration (~g/g wet mass)
/l/,
140 -( I ( Ibb.UU)
-
120 i I / ,,
(64.83)I I
100
80
60
40
20
0Jonkershoek SFW
LOCALITIES
Figures 6(a)-(b): Mean zinc concentration in whole crabs (a)and various size classes (b) from both localities (SD in parenthesis).
--J0'>

(c) (d)
Concentration (1J9/g wet mass) Concentration (lJg/g wet mass)
100150
(91.93)
I - ,Jonkershoek ~ SFW IGonads
( H,KJ,4lJ)(46.491
(73,93)(9.381
(J 1l ,H2)( b:.'.ttl)
0-Carapace Muscle Dig.gland Gills
TISSUES
50
100
(135.35)
Gonads
(63.82)
Carapace Muscle Dig.gland . Gills
TISSUES
20
o
40
60
80
Jonkershoek and SFW data pooled
Figures 6(c)-(d): Mean zinc concentration in carapaceand tissues of P. per/atus from the Eerste River (SO in parenthesis).
--J--J

t--
(el: WHOLE CRABS (f): CARAPACE (g): MUSCLE
Concenlr.nona llIO/g wei I'll",) Concenlr.tlon fug/lil _I rna••) COflcenlraUon htg,g wei I'll.,,)
'00 (2t3.89) '00 (lB025)
Sunmer Aulumn Win....
SEASON
Springo
Summer Autumn Win'"SEASON
Sp,lng
80
oSu"'...,
(72.191
Aulumn Winter
SEASON
9J)rlng
Ill): DIGESTIVE GLAND ro: GILLS Ii): GONADS (Ov.rl...nd le.te. P<l'0l.d~
Conc.nlr.Uon (Ug/g _I ID•••)----- --- --_.._----_._-- ~c.!!'~~t1~~~_~~e ~.!..~~ _ Concenlr.UOfl lllg/g wei ru•••-----------------
Spring
IttB.Q7}---/
Su,..,.., Aulumn Win'"
SEASON
40
o
20
80
80
'00
140
"0
SpringAulv.., Winter
.....ON
(~",OQ)
[14.03)
40"
,O~
oSUMmer
80
80
'00
140
"0
SpringAutuMn Wlrlter
SEASON
(25.62~
Sum_r
00
10
'0
'0
4.
Figures 6(e)-(j): Mean seasonal zinc concentration inwhole crabs, carapace and tissues of P. perlatus
(Jonkershoek and SFW data pooled; SO in parenthesis). "00
79
Discussion
The mean wet mass zinc concentration found in each of the selected tissues and the carapace of
P. perlatus (Table 6.3; Figure 6(c)) was compared with the results of Steenkamp (1992) and du
Preez et al. (1993) for P. warreni from polluted freshwater ecosystems, as well as with those of
Bryan (1968) for various uncontaminated marine and freshwater decapods. Steenkamp (1992)
found mean Zn concentrations of 31.2:1:15.5 to 80.5±263.1 I-lg.g-1 wet digestive gland mass,
23.8±12.6 to 67.5±275.6 I-lg.g-l wet gill mass, 63.1±17.8 to 101.7±256.7 I-lg.g-1 wet muscle
mass, 30.2±1O.4 to 120.8±366.5 I-lg.g- 1 wet gonad mass and 15.2±9.3 to 51.7±276.3 I-lg.g- 1 wet
carapace mass. The mean zinc concentrations in the gonads and carapace of P. warreni, found
by du Preez et al. (1993), were very similar, namely 112.9±413.9 and 16.0±5.1 I-lg.g-1 wet mass
respectively. While the mean zinc concentrations in the digestive gland and muscles of P.
perlatus, in comparison with the above mentioned results, were relatively low and those in the
carapace relatively high, the concentrations in the gills and gonads compared well. In
comparison with the results of Bryan (1968), namely mean wet mass Zn concentrations of 15 to
66 I-lg.g-I for muscle tissue, 24 to 169 I-lg.g-1 for the digestive gland, 8 to 69 I-lg.g-I for gill
tissue, 3 to 28 I-lg.g-I for the "shell" and 13 to 87 I-lg.g-I for the gonads, the mean Zn
concentration in the carapace of P. perlatus was found to be very high. The concentrations in the
digestive gland, muscles, gills and gonads, however, compared favourably.
When comparing the mean dry mass zinc concentration of whole individuals of Potarnonautes
perlatus from .Tonkershoek (28.93±25.04I-lg.g- l ) and SFW (27.69±37.68 I-lg.g-I) with the results
of Van Eeden & Schoonbee (1991) for P. warreni (73.3±O.03 to 138.3±O.OI I-lg.g-1), it was clear
that the zinc concentrations in P. perlatus were comparatively low.
Despite the fairly high concentrations observed in some of the tissues of P. perlatus, it seems
that Zn is generally well regulated in this species in the Eerste River.
Comparisons of the two localities,lonkershoek and SFW, showed that, although crabs from
SFW had higher tissue zinc concentrations than those from Jonkershoek (Tables 6.7-6.8), and
although large- and medium-sized crabs from 10nkershoek in turn had higher whole body zinc
concentrations than those from SFW (Table 6.6), no statistically significant differences in whole
crab zinc concentrations existed overall between the two populations (Table 6.5). The water at
both localities can certainly be considered as a source of zinc, as indicated by the BCFw's for
whole crabs, tissues and carapace (Tables 6.18 and 6.19), but since it was found that there was
no difference in water zinc concentrations between 10nkershoek and SFW (Table 4.5), the
reason for the observed differences between the 10nkershoek and SFW populations need to be
searched for elsewhere: bioaccumulation from the sediments also fail to fully explain the
observed tissue and size class population differences, since, though the sediment from SFW was
found to contain significantly more zinc than sediment from Jonkershoek (Table 4.11), the crabs

80
from the latter had significantly higher zinc concentrations than the sediments and a larger BCFs
for whole crabs (Table 6.20). Another possible source of zinc is of course food, but the most
likely reason for these differences can possibly be found in the differences in water physico
chemistry between the two localities (Table 4.8), affecting the bioavailability of the metal to the
animals.
It was established that, in P. perlatus, most zinc was stored in the carapace, with the gonads
being the second most important storage site (Tables 6.3 and 6.4). The higher BCFw's and
BCFs's for the carapace from Jonkershoek and the gonads from SFW (Tables 6.19 and 6.21)
confirm these findings. These results are, however, in contrast to those of Steenkamp (1992) and
du Preez et al. (1993), who found that the carapace of P. warreni contained the lowest zinc
concentration of the sites and tissue types they tested. Bryan (1968) also found relatively low
zinc concentrations (3 to 28 ).1g.g-1 wet mass) in the "shells" of various decapods, compared to
their tissues. Rainbow (1985), however, contradicted Bryan's [mdings by showing that Carcinus
maenas had a mean "cuticle" Zn concentration of 76.1±1O.8 ).1g.g-1 dry mass, which is far
greater than the concentrations found by Bryan.
Bryan (1968) reported that much of the Zn in the "shell" appears to be absorbed from the
external environment. The large variations in individual carapace zinc concentrations may be a
result of the stage in the moult cycle (Nugegoda & Rainbow, 1987) or may be residual zinc
which remains when the "shell" is renewed during moulting (Bryan, 1968). White & Rainbow
(1984) exposed the shrimp Palaemon elegans to zinc and found that the animals that moulted
during the experiment took up greater amounts of labelled zinc than those that were not
moulting. All these factors, if applicable, could have contributed to the high mean carapace
concentration found in P. perlatus, as well as the great individual variations observed.
The digestive gland and gills are the store for excess zinc absorbed from food or from the
surrounding water, and the main site of absorption and loss of zinc across the body surface,
respectively (Bryan, 1968). The zinc concentrations in these tissues are therefore subject to
environmental fluctuations and feeding status and can thus be expected to vary greatly between
individuals, as indicated in Table 6.3. Bryan (1968) also reported that internal organs such as the
muscles and gonads are provided with a controlled environment, since the concentrations of zinc
in the blood is regulated, but that when changes in the blood zinc concentrations do occur, these
organs may themselves be able to control internal homeostasis by regulating against these
changes. Although the mean zinc concentrations in the muscles and gonads of P. perlatus were
observed to be ~e second highest and highest of the four tissues respectively (Table 6.3), the
present results still seem to support the conclusions of Bryan (1968), since, as mentioned before,
the concentrations in these two tissues were found to be relatively low to average, compared to
the results of other authors.
81
Individual variation in ZInC concentrations is clearly large in most species of decapod
crustaceans, as illustrated by Bryan (1968) and this complicates comparisons between species
and individuals. However, despite these variations, the preliminary results from the present study
show that the carapace seems to be of greater importance in the storage of zinc in P. perlatus
than the four tissue types studied, and that these do not differ significantly in their contribution
to zinc storage.
The present study also investigated the possible relationship between body size -and zinc
concentrations. A reasonably strong negative correlation between crab size and whole crab zinc
concentrations (r = -0.488), as well as the strong and reasonably strong negative correlations
between crab size, tissue (except gill) and carapace concentrations (Table 6.2), confirmed that
smaller (immature) individuals are subjected to greater Zn loads. This is also confirmed by the
statistically significant differences in zinc concentrations between large and small crabs within
each locality (Table 6.1). Steenkamp (1992) found that smaller individuals of P. warreni
accumulated zinc to a higher degree in two tissues, the carapace and the gills. Upon exposing a
number of ephemeropteran and one plecopteran species to zinc, Kiffney & Clements (1996) also
observed an inverse relationship between body size and survivorship. These results are in
contrast to those of Hilmy et al. (1988), who exposed Portunus pelagicus to zinc and found that
the accumulation of the toxicant in mature (therefore larger) individuals, was significantly
greater than in immature animals.
Hill & O'Keeffe (1992) studied the feeding ecology of P. perlatus and found a statistically
significant difference in food preferences between large and small crabs. While smaller
individuals preyed significantly more on aquatic invertebrates, larger individuals preferred
vegetable matter. This is a significant finding and could explain the present results when
considering the fact that heavy metals are accumulated in aquatic invertebrates (e.g. insects).
Albers & Camardese (1993) and Kiffney & Clements (1993) showed that aquatic invertebrates
accumulate heavy metals to high levels. The heavy metals can possibly, in turn, be accUmulated
in the small individuals of P. perlatus who feed on these invertebrates. Also, Gherardi et al.
(1987) and Gherardi & Micheli (1989) found that younger individuals of Potamon fluviatile and
P. potamios palestinensis, respectivdy, tend to hide more under stones and rocks, especially
during the night. This type of behaviour could prolong smaller individuals' exposure time to a
certain metal concentration, in this particular microhabitat, resulting in the observed elevated
zinc concentrations.
The possible influence of factors such as seasonality and gender on the levels of Zn in P.
perlatus was also investigated. Bryan (1964), Hilmy et al. (1988) and Nugegoda & Rainbow
(1989) found no significant difference between zinc concentrations in the tissues and carapace of
male and female decapods. The only exception was the significant difference between the
mature gonads, found by Bryan (1964) and Hilmyet al. (1988). This pattern was also observed

82
by Bryan (1968) in most of the decapods studied. The results of the present study are in
agreement with these fmdings, except that th.e difference in zinc concentrations in the ovaries
and testes of P. perlatus was not significant (Tables 6.9-6.11). Steenkamp (1992) also found no
such significant difference between the ovaries and testes of P. warreni but did, however, detect
differences between the zinc concentrations of the digestive gland, gills and muscles of males
and females from one of the sampling localities. She concluded that this could not be attributed
to variation between males and females alone but rather to possible sampling variation.
In general, there seems to be no clear relationship between gender and body zinc concentrations
in P. perlatus, and gender can therefore not be considered an influencing factor in Zn uptake and
distribution in this species.
When the possible relationship between seasonality and zinc concentrations in P. perlatus was
investigated (Tables 6.13-6.17), it was established that there were no significant seasonal
differences. for gonad concentrations, whereas the muscle tissue, gills and digestive gland
showed a number of significant seasonal differences. Only the carapace exhibited significant
differences between almost all seasons. It is important to note that even though certain tissues
and the carapace exhibited significant seasonal differences in zinc concentrations, there were no
seasonal differences in whole body zinc concentrations (Table 6.12). Peaks in whole crab, tissue
and carapace zinc concentrations in winter, and in gill concentrations in autumn, although not
significant in all cases, were observed (Figures 6(e)-(j)). The marked seasonal variations in
carapace zinc agrees with the findings of Steenkamp (1992), although the peaks differ. Whilst
Potamonautes perlatus showed peaks in winter, P. warreni exhibited a summer peak.
The observed peaks in whole crab, tissue and carapace concentrations in the colder months can
not be explained by seasonal variations in the water and sediment zinc concentrations, since no
corresponding peaks were observed (Figures 4(c)-(I)). However, Warburg et al. (1982) showed
that the crab Potamon potamiospreferred the thermal zone between 24° and 27°C and that its
activity dropped below and above these temperatures. Similarly, Potamonautes perlatus' activity
is also affected by environmental temperatures. This species has been observed to be relatively
inactive in winter (personal observations and marked decrease in capture rate) and tend to retreat
into burrows or under rocks and stones, in order to avoid the force of the water flow. The
exposure time to a specific zinc concentration is therefore possibly lengthened. The decreased
activity implies a lowered metabolic rate which would mean that metal loads are not disposed of
as effectively as during normal activity.
Engel & Brouwer (1987) found that in the blue crab, Callinectes sapidus, zinc metallothioneins
in the digestive gland is at its highest during the pre-moult period, when the new epidermis is
being synthesized beneath the existing exoskeleton, but is possibly mobilized via the
haemolymph at moult. The carapace and digestive gland zinc concentrations are therefore clearly

83
coupled with the moult cycle. Steenkamp (1992) reported for Potamonautes warreni and
Gherardi et aI. (1987) for Potamonfluviatile that moulting takes place in the warmer months and
in summer/autumn respectively, while Raubenheimer (1986) reported gender-related moulting
peaks for Potamonautes sidneyii: males moulted in autumn and winter, and females in autumn,
summer and spring, depending on their age and therefore reproductive status. Although it is not
certain when P. perlatus moults in the Eerste River, and though it seems certain that moulting is
not synchronized in all individuals (clearly shown by the great individual variations), it is
possible that a number of individuals in the two populations (Jonkershoek and SFW) moulted
during winter, with a corresponding peak in mean carapace zinc concentration. The peak in
digestive gland zinc concentration during winter supports this theory.
Apart from its relationship with the moulting cycle, the seasonal variations in concentration
values for the digestive gland (Table 6.16) can also be ascribed to the relative inactivity of the
animals during winter, as a result of the high rainfall (Table 2.1) and therefore fast flow of the
river, which would certainly necessitate changes in the diets of the animals. Similarly, the
seasonal variations in gill zinc concentrations, with peaks in the colder months (Table 6.15), may
possibly also be explained by the fact that P. perlatus is relatively inactive during winter and
may possibly be exposed to specific zinc concentrations for longer periods.
Also, Bryan (1968) found large differences in zinc concentrations between samples of muscle
from different species. These differences seemed to correlate with the degree of activity of the
species. He found the lowest and highest concentrations of zinc in leg muscles of the swimming
crab Portunus depurator and the slow-moving Maia squinado and Cancer pagurus respectively,
and therefore concluded that the results suggested that zinc concentrations in muscle tissue may
be related to the speed with which it can contract. Since P. perlatus is physically less active in
winter, Bryan's results give a possible explanation for the observed winter peak in muscle zinc
concentration. The fact that no seasonal differences in gonad zinc concentrations were observed,
and that these concentrations remained relatively constant throughout all seasons, supports the
conclusions of Bryan (1968) on the concentrations of zinc in the internal organs such as muscles
and gonads, as mentioned previously.
Although a few seasonal variations in tissue and carapace zinc concentrations were observed, the
whole body concentrations remained relatively constant throughout the seasons, implying an
ability of P. perlatus to regulate the body zinc concentrations and suggesting that seasonality did
not have a major influence on the concentrations of zinc in this species.
Finally, the fact that P. perlatus in the Eerste River was shown to regulate Zn in its body, as well
as the fact that seasonal fluctuations in environmental Zn concentrations were not reflected in the
crab body, imply that this species in the Eerste River does not qualify as a potential monitor of
environmental Zn pollution. Also, the fact that the carapace was shown to contain the highest Zn
84
concentrations and that periodic moulting is probably a mechanism in which the animal rids
itself of excess Zn and therefore protects itself against long term accumulation, as well as the
observed large intraspecific variations in Zn concentrations, provide further proof that this
species would probably not be a suitable monitor of environmental Zn pollution. Steenkamp
(1992) also concluded that there is no certainty that Zn concentrations in the tissues of P.
warreni would accurately reflect environmental Zn contamination and that of all the tissues
tested, only the digestive gland proved to be useful as indicator of the degree of Zn pollution.
However, more frequent observations on P. per/atus are heeded before final conclusions can be
made.
---oOo--~

85
CHAPTER 7
CONCENTRATIONS OF COPPER IN THE FRESHWATER CRAB,POTAMONAUTES PERLATUS
Introduction
Copper is widely distributed in nature and is found either in the element form or in several
compounds, together with hard bases such as carbonate, nitrate, sulfate, chloride, ammonia and
hydroxide (Moore & Ramamoorthy, 1984 and Galvin, 1996). In aquatic environments copper
can exist in three broad categories: particulate, colloidal and soluble. Speciation of Cu in natural
waters is determined by the physico-chemical, hydro-dynamic characteristics and the biological
state of the water (Moore & Ramamoorthy, 1984).
Copper is an essential trace element in animals, since it is contained in many proteins, such as
oxygen-binding haemocyanin, cytochrome oxidase, tyrosinase and laccase (Piscator, I979a;
Moore & Ramamoorthy, 1984 and Galvin, 1996). Piscator (1979) reported that copper
deficiency may occur when the intake of molybdenum is excessive.
This metal poses a threat to aquatic ecosystems, as it can reach water bodies via industrial and
agricultural runoff: the largest single user of copper is the electrical industry, accounting for
~50% of the total consumption (Piscator, 1979a; Moore & Ramamoorthy, 1984 and Richardson
& Gangolli, 1993). Use under this category includes power transmission, electronics and
electrical equipment. Construction and plumbing is the second largest user (Moore &
Ramamoorthy, 1984). Other uses include contribution to alloys, together with other metals such
as silver, cadmium, tin and zinc (Piscator, 1979a) and in agriculture as fungicides and
insecticides (Richardson & Gangolli, 1993).
High levels of copper is highly toxic to aquatic animals, especially freshwater invertebrates.
Through animal experiments, it has been shown that exposure to copper may cause a wide
variety of symptoms, including e.g. a loss of cellular adhesion in the gills, cell necrosis, retarded
growth and a lowered rate of reproduction and egg survival. Behavioural changes such as
decreased degree of concealment and ability to orientate may also occur (Moore &
Ramamoorthy, 1984).
Several factors are known to influence copper availability and toxicity to aquatic animals:
toxicity of copper is generally greater in freshwater than in marine waters, reflecting the relative
proportion of the toxic free Cu ion in solution. A lowered pH (Stouthart et al., 1996), soft water
and salinity can often increase copper toxicity, especially to invertebrates. Also, sensitivity to
copper generally increases with decreasing age/size (Moore & Ramamoorthy, 1984).
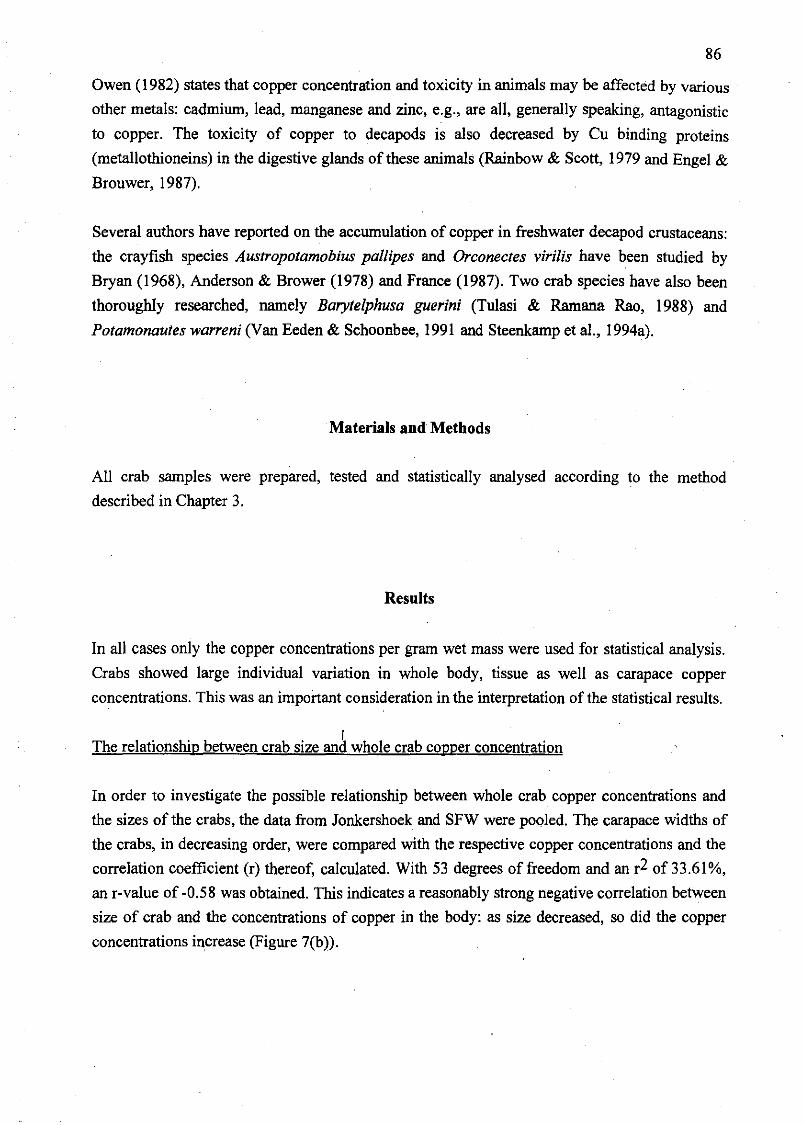
86
Owen (1982) states that copper concentration and toxicity in animals may be affected by various
other metals: cadmium, lead, manganese and zinc, e.g., are all, generally speaking, antagonistic
to copper. The toxicity of copper to decapods is also decreased by Cu binding proteins
(metallothioneins) in the digestive glands of these animals (Rainbow & Scott, 1979 and Engel &
Brouwer, 1987).
Several authors have reported on the accumulation of copper in freshwater decapod crustaceans:
the crayfish species Austropotamobius pal/ipes and Orconectes viri/is have been studied by
Bryan (1968), Anderson & Brower (1978) and France (1987). Two crab species have also been
thoroughly researched, namely Barytelphusa guerini (Tulasi & Rarnana Rao, 1988) and
Potamonautes warreni (Van Eeden & Schoonbee, 1991 and Steenkamp et al., I994a).
Materials and Methods
All crab samples were prepared, tested and statistically analysed according to the method
described in Chapter 3.
Results
In all cases only the copper concentrations per gram wet mass were used for statistical analysis.
Crabs showed large individual variation in whole body, tissue as well as carapace copper
concentrations. This was an important consideration in the interpretation of the statistical results.
The relationship between crab size ana whole crab copper concentration
In order to investigate the possible relationship between whole crab copper concentrations and
the sizes of the crabs, the data from Jonkershoek and SFW were pooled. The carapace widths of
the crabs, in decreasing order, were compared with the respective copper concentrations and the
correlation coefficient (r) thereof, calculated. With 53 degrees of freedom and an r2 of 33.6 I%,
an r-value of -0.58 was obtained. This indicates a reasonably strong negative correlation between
size of crab and the concentrations of copper in the body: as size decreased, so did the copper
concentrations i!,\crease (Figure 7(b)).

87
Differences in copper concentrations of the various size classes at each locality
Since the logarithmically transformed whole crab data for large, medium and small-sized crabs
from each locality also failed to provide normal distributions, the nonparametric Mann-Whitney
test was performed to test for statistically significant differences (p<O:05) (Table 7.1).
Differences in concentrations were found between all size classes from Jonkershoek. The small
size class crabs showed the highest mean copper concentration (35.61±17.38 Ilg.g-1 wet mass)
and large sized crabs the lowest (1I.68±I0.34Ilg.g-1 wet mass).
Significant differences were found between the copper concentrations of large and small and
between medium and small size classes from SFW, with the small and large-sized crabs also
exhibiting highest and lowest mean concentrations respectively (73.36±63.26 and 13.54±4.23
Ilg.g- l wet mass).
The relationship between crab size. and tissue and carapace copper concentration
In order to investigate the possible relationship between crab size and copper concentration in
the carapace and selected tissues, namely muscle tissue, digestive gland, gills and gonads, the
data from Jonkershoek and SFW were pooled, after which the carapace widths, in decreasing
order, were compared with the respective tissue and carapace copper concentration. Table 7.2
shows the r-values calculated for each tissue and for the carapace.
Reasonably strong negative correlations were found to exist between crab sizes and the copper
concentrations in the muscles, digestive gland and carapace, whereas the copper concentrations
in the gills and gonads proved to be poorly negatively correlated with the sizes of the crabs.
Differences in copper concentrations between the various selected 'tissues and the carapace
The mean copper concentration values from the selected tissues and carapace of crabs from
Jonkershoek and SFW were pooled, in order to determine whether statistically significant
differences (p<O.05) in copper concentrations existed between the various tissues and the
carapace. Since the data were not normally distributed, the mean logarithms of the tissue and
carapace copper concentrations were used in the t-test. The respective mean concentrations and
standard deviations are tabulated in Table 7.3. Table 7.4 shows the results of the t-test performed
on the tissue and carapace concentrations.
When comparing values obtained for the selected tissues and the carapace, significant
differences were found between the mean copper concentration of the carapace and all tissues,
except between muscle and gonads, muscle and gills, muscle and gonads, and gonads and gills.

88
The digestive gland showed the highest mean concentration (29.95±21.42 /-lg.g-l wet mass),
whereas the lowest mean was found for the carapace (6.78±9.l2 /-lg.g-l wet mass) (Figure 7(c)).
Differences in copper concentrations of crabs from Jonkershoek and SFW
(a) Differences in whole crab values
The results of the Mann-Whitney test performed on the whole crab copper concentrations from
Jonkershoek and SFW are shown in Table 7.5.
The highest mean copper concentration (27.6±31.19 /-lg.g-l wet mass) was found in crabs from
SFW (Figure 7(a)). A z-value of 3.056 indicated that there was a statistically significant
difference in whole crab copper concentrations between crabs from the two localities.
(a) (i) Differences in whole crab concentrations between the various size classes
Through a comparison of the whole crab copper concentration values between large, medium
and small crabs from Jonkershoek and SFW, with the use of the Mann-Whitney test, it was
established that no significant differences (p>0.05) existed between copper concentrations in any .
of the size classes from the two localities.
(b) Differences in copper concentrations of the selected tissues and the carapace
The mean copper concentration in the carapace, muscle, digestive gland, gills and gonads of
crabs from Jonkershoek and SFW were compared with the use of Student's t-test and tabulated in
Table 7.7. Since the data were not normally distributed, the mean logarithms of the copper
concentrations in the tissues and carapace were used to calculate the t-value. In the case of the
gills, however, a normal distribution could not be obtained even after transformation of the
concentration value data, therefore the Mann-Whitney test was performed on the original data, in
order to investigate possible differences (Table 7.8).
Although the mean copper concentrations observed in all four tissues were highest in crabs
collected from SFW (Figure 7(d)), no statistically significant differences (p>0.05) could be
found between the two localities.
Differences in copper concentrations ofmales and females
In order to determine whether statistically significant differences (p<0.05) existed in the mean
whole crab, tissue and carapace copper concentrations between males and females, the data
obtained for crabs from Jonkershoek and SFW, were pooled for each sex. In all cases the
original data failed the normal probability test, therefore each concentration value was
logarithmically transformed. In the case of the whole crab concentrations the transformed data

89
also failed to provide a normal distribution, therefore the Mann-Whitney nonpararnetric test was
performed.
(a) Differences in whole crab concentrations
Table 7.9 shows the results of the Mann-Whitney test, performed on the whole crab copper
concentrations of males and females of Potarnonautes per/atus. A statistically significant
difference (p<0.05) was found between the two genders; males had the highest mean whole body
copper concentration (26.89±30.5b Ilg.g- 1 wet mass).
(b) Differences in the copper concentrations of the selected tissues and the carapace
Although males exhibited the highest mean copper concentrations for the carapace and all but
one of the four tissue types (gonads), no statistically significant differences (p>0.05) were found
to exist between the two genders (Table 7.10).
Seasonal variations in copper concentrations
The copper concentrations in whole crabs, selected tissues and carapace from the different
seasons were tested for statistically significant differences (P<0.05). In each instance, the data
from crabs collected at Jonkershoek and SFW were pooled and these then tested for normality.
None of the data sets were normally distributed and were thus logarithmically transformed. The
transformed data for whole crabs, as well as the digestive gland sununer and spring data and the
gill summer data, also failed the normal probability test, therefore the Mann-Whitney test was
performed.
(a) Seasonal differences in whole.crab copper concentrations
The Mann-Whitney test produced statistically significant differences (p<0.05) in whole crab
copper concentrations, between sununer and autumn and between autumn and spring (Table
7.11). The highest mean whole crab copper concentration (30.79±23.38 Ilg.g-1 wet mass)
occurred in autumn, whereas sununer showed the lowest mean (l6.52±14.02 Ilg.g-1 wet mass)
(Figure 7(e».
(b) Seasonal differences in tissue and carapace copper concentrations
I. Carapace
Statistically significant differences (p<0.05) in seasonal carapace copper concentrations were
found to exist only between sununer and spring values. Data for autumn had the highest mean
copper concentration (l2.45±12.97 Ilg.g-1 wet mass) and sununer the lowest (4.65±3.45 Ilg.g"1
wet mass) (Figure 7(f). The results of Student's t-test, performed on the mean logarithms of the
seasonal copper concentrations, are given in Table 7.12.

90
2. Muscle tissue
The highest mean muscle copper concentration (54.73±75.63 Ilg.g- l wet mass) was observed in
winter, whereas autumn showed the lowest mean concentration (2.59±1.48 Ilg.g- l wet mass)
(Figure 7(g». However, through pairwise comparisons of the different seasons, it was found that
no significant differences (p>0.05) existed between any of the seasons (Table 7.13).
3. Gill tissue
Statistically significant differences (p<0.05) in seasonal gill copper concentrations were found
between almost all seasonal comparisoTls, except between autumn and winter and between
autumn and spring. Tables 7.14 and 7.15 show the results of Student's t-test and the Mann
Whitney test respectively, perfonned on the original data. It can be seen in Figure 7(h) that the
highest and lowest mean copper concentrations were found in autumn (50.25±71.1l Ilg.g- 1 wet
mass) and summer (6.l6±4.48Ilg.g- l wet mass) respectively.
4. Digestive gland
The results of the Mann-Whitney test, perfonned on the original data from samples collected in
summer and spring, and Student's t-test, perfonned on the logarithmically transfonned data from
autumn and winter, are given in Tables 7.16 and 7.17 respectively. Summer showed the highest
mean copper concentration (39.07±23.2 Ilg.g- l wet mass), with the lowest mean concentration
found in winter (l5.5l±9.35 Ilg.g- l wet mass) (Figure 7(i». However, none of the comparisons
between the different seasons yielded statistical differences (p>0.05).
5. Gonads
When the data for the ovaries and testes were pooled, the highest and lowest mean copper
concentrations (23.3±60.12 and 7.93±9.2 Ilg.g- l wet mass) occurred in summer and autumn
respectively (Figure 7(j». No statistically significant differences (p>0.05) were however found
to exist between values from any of the seasons (Table 7.18).
Differences in copper concentrations of whole crabs. tissues, carapace. and Eerste River water
(a) Differences between concentration values for whole crabs and.water
Since the logarithmically transformed whole crab data from Jonkershoek and SFW were not
nonnally distributed, the Mann-Whitney test was perfonned on the original data (Table 7.19). It
was ascertained that statistically significant differences (p<0.05) existed between the whole crab
and water copper concentrations from both localities.
(b) Differences between concentration values for the selected tissues, carapace and water
The copper concentrations in all the tissues and the carapace from both localities proved to be
significantly different (p<0.05) from the concentrations in the water. This was ascertained with
the use of the Mann-Whitney test (Table 7.21), perfonned on the gill and water copper

91
concentrations from Jonkershoek, and Student's t-test (Table 7.20) performed on all the other
data.
Differences in copper concentrations of whole crabs. tissues, carapace. and sediments
(a) Differences between concentration values for whole crabs and sediments
The Mann-Whitney test, performed on the whole crab and sediment copper concentrations, from
Jonkershoek and SFW, showed statistically significant differences (p<0.05) to exist at both
localities. The results of the test are tabulated in Table 7.22.
(b) Differences between concentration values for the selected tissues, carapace and sediments
The mean logarithms of the tissue and carapace copper concentrations were used to test for
statistically significant differences (p<0.05) between tissue, carapace and sediment copper
concentrations at the two localities. The transfonned gill concentration values from Jonkershoek
and SFW, however, were both not nonnally distributed, therefore the Mann-Whitney test was
performed.
From both the Jonkershoek and SFW data, significant differences in copper concentrations were
found only between concentrations for the sediments and the digestive gland. Table 7.23 lists the
results of Sfudent's t-test, perfonned on the mean logarithms of the tissue and carapace copper
concentrations from the two localities. The results of the Mann-Whitney test, performed on the.
original Jonkershoek and SFW gill data, are shown in Table 7.24.

92
Table 7.1: Results of the Mann-Whitney test for differences in whole crab copper concentrations
(llg.g-1 wet mass) of the various size classes at each .locality.
JONKERSHOEK
n Mean SD Range z-value p-value
Large 22 11.07 10.34 5.1-41.8vs 2.491 <0.05
Medium 34 15.26 7.88 4.64-35.39
Lar~e 22 11.07 10.34 5.1-41.8vs 2.594 <0.05
Small 4 35.61 17.38 9.59-45.18
Medium 34 15.26 7.88 4.64-35.39vs 1.926 =0.05
Small 4 35.61 17.38 9.59-45.18
SFW-
n Mean SD Range z-value p-value
Large 6 13.54 4.23 8.8-20.71.
vs 0.718 >0.05Medium 39 22.72 19.1 7.48-92.3
Large 6 13.54 4.23 8.8-20.71vs 2.802 <0.05
Small 6 73.36 63.26 32.69-200.32
Medium 39 22.72 19.1 7.48-92.3vs 3.222 <0.05
Small 6 73.36 63.26 32.69-200.32
Table 7.2: R2-value~ calculated for sizes of crabs and selected tissue and carapace copper
concentrations (DF = Degrees of freedom; Dig.gland = digestive gland).
DF r-value R-sq. (%)
Crab size and Muscle 27 -0.571 32.59
Crab size and Dig.gland 29 -0.466 21.69
Crab size and Gills 24 -0.257 6.61
Crab size and Gonads 23 -0.361 13.02
Crab size and Carapace 28 -0.415 17.23

93
Table 7.3: Mean copper concentration (~g.g-I wet mass) in the mu<scles, digestive gland (dig.
gland), gills, gonads and carapace of crabs from the Eerste River (Jonkershoek and SFW data
pooled).
n Mean SD Range
Muscle 29 18.! 34.26 0.0-166.32
Dig. gland 33 29.95 21.42 1.9-74.1
Gonads 25 18.43 43.91 1.0-222.2
Gills 26 16.99 25.93 2.56-132.35
Carapace 39 6.78 9.12 0.0-44.54
Table 7.4: Results of Student's t-test for the differences in mean crab tissue and carapace copper
concentration (~g.g-1 wet mass) (Jonkershoek and SFW data pooled; Mean logarithms of copper
concentrations used for the calculation of the t-value).
t-value p-value
Muscle vs Digestive gland -4.28 <0.05
Muscle vs Gonads -0.46 >0.05
Muscle vs Gills -1.56 >0.05
Muscle vs Carapace 1.05 >0.05
Digestive gland vs Gonads 4.06 <0.05
Digestive gland vs Gills 3.21 <0.05
Digestive gland vs Carapace 7.61 <0.05
Gonads vs Gills -1.16 >0.05
Gonads vs Carapace 1.79 <0.05
Gills vs Carapace 3.58 <0.05

94
Table 7.5: Results of the Mann-Whitney test for the differences In whole crab copper
concentrations (llg.g"1 wet mass) from Jonkershoek and SFW.
n Mean SD . Range z-value p-value
Jonkershoek 60 15.31 11.0 6.64-45.18vs 3.056 <0.05SFW 51 27.6 3I.l9 7.48-200.32
Table 7.6: Results of the Mann-Whitney test for the differences in whole crab copper
concentrations (~g.g-I wet mass) of the various size classes, small, medium and large, from
Jonkershoek (1) and SFW (S).
n Mean SD Range z-value p-value
Large (J) 22 11.68 10.34 5.1-41.8vs 1.595 >0.05
Large (S) 6 13.54 4.23 8.8-20.71
Medium (1) 34 15.26 7.88 4.64-35.39vs 1.288 >0.05
Medium (S) 39 22.72 19.1 4.48-92.3
Small (1) 4 35.61 17.38 9.59-45.18vs 0.533 >0.05
Small (S) 6 73.36 63.26 32.69-200.32
Table 7.7: Results of Student's t-test for the differences in mean tissue and carapace copper
concentration (llg.g-1 wet mass) of crabs from Jonkershoek (1) and SFW (S) (Mean logarithms
of the tissue and carapace copper concentrations used in the test).
n Mean I SD Range t-value p-value
Carapace (J) 19 6.82 8.9 0.0-34.57vs -0.33 >0.05
Carapace (S) 20 6.75 9.55 2.02-44.54
Muscle (1) 16 10.24 17.26 0.0-66.6vs -1.42 >0.05
Muscle (8) 13 27.78 46.72 0.35-166.32
Dig.gland (1) 18 24.62 20.95 2.3-74.1vs -1.28 >0.05
Dig.gland (S) 15 36.33 20.87 1.9-68.0
Gonads (J) II 11.53 13.61 1.0-50.7vs -0.38 >0.05
Gonads (S) 14 27.22 65.07 1.64-222.2 I
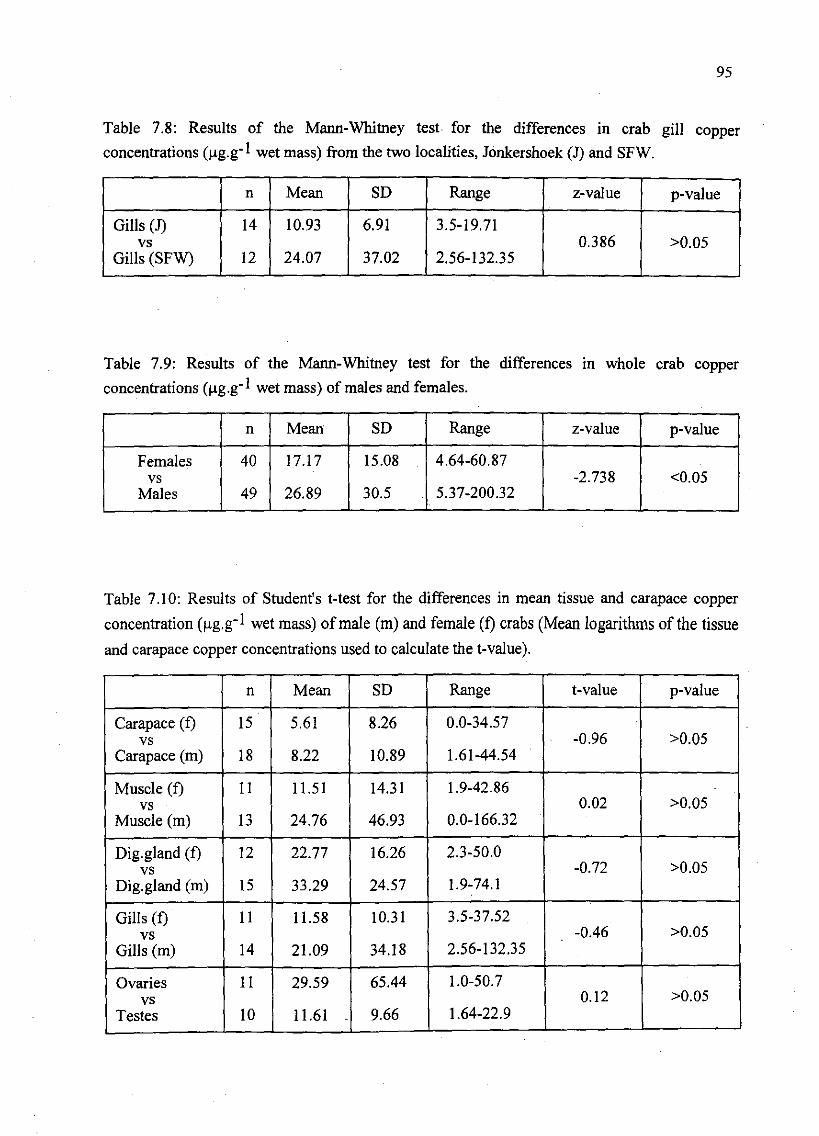
95
Table 7.8: Results of the Mann-Whitney test for the differences in crab gill copper
concentrations (llg.g-I wet mass) from the two localities, Jonkershoek (1) and SFW.
n Mean SD Range z-value p-value
Gills (1) 14 10.93 6.91 3.5-19.71vs 0.386 >0.05
Gills (SFW) 12 24.07 37.02 2.56-132.35
Table 7.9: Results of the Mann-Whitney test for the differences in whole crab copper
concentrations (llg.g-1 wet mass) of males and females.
n Mean SD Range z-value p-value
Females 40 17.17 15.08 4.64-60.87vs -2.738 <0.05
Males 49 26.89 30.5 5.37-200.32
Table 7.10: Results of Student's t-test for the differences in mean tissue and carapace copper
concentration (flg.g- l wet mass) of male (m) and female (f) crabs (Mean logarithms of the tissue
and carapace copper concentrations used to calculate the t-value).
n Mean SD Range t-value p-value
Carapace (f) 15 5.61 8.26 0.0-34.57vs -0.96 >0.05
Carapace (m) 18 8.22 10.89 1.61-44.54
Muscle (f) 11 1l.51 14.31 1.9-42.86vs 0.02 >0.05
Muscle (m) 13 24.76 46.93 0.0-166.32
Dig.gland (f) 12 22.77 16.26 2.3-50.0vs -0.72 >0.05
Dig.gland (m) 15 33.29 24.57 1.9-74.1
Gills (f) 11 11.58 10.31 3.5-37.52vs -0.46 >0.05
Gills (m) 14 21.09 34.18 2.56-132.35
Ovaries 11 29.59 65.44 1.0-50.7vs 0.12 >0.05
Testes 10 11.61 9.66 1.64-22.9

96
Table 7.1 I: Results of the Mann-Whitney test for the seasonal differences in whole crab copper
concentrations (llg.g-1 wet mass).
Mean SD Range z-value p-value.
n
Summer 49 16.52 14.02 4.64-60.87vs 2.825 <0.05
Autumn 16 30.79 23.38 10.05-92.3
Summer 49 16.52 14.02 4.64-60.87vs 0.564 >0.05
Winter 21 28.78 42.97 5.37-300.32
Summer 49 16.52 14.02 4.64-60.87vs 1.829 >0.05
Spring 25 16.77 6.87 7.48-31.15
Autumn 16 30.79 23.38 10.05-92.3vs -1.855 >0.05
Winter 21 28.78 42.97 5.37-200.32
Autumn 16 30.79 23.38 10.05-92.3vs -1.991 <0.05
Spring 25 16.77 6.87 7.48-31.15
Winter 21 28.78 42.97 5.37-200.32vs 0.132 >0.05
Spring 25 16.77 6.87 7.48-31.15
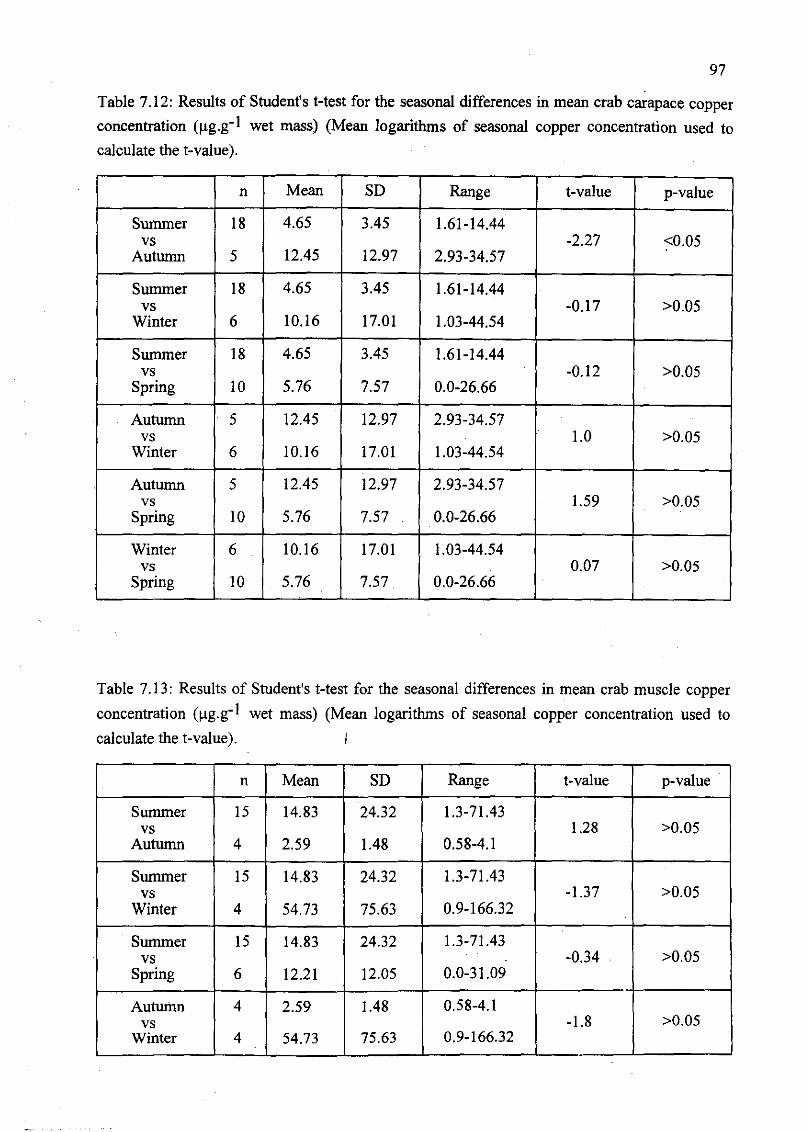
97
Table 7.12: Results of Student's t-test for the seasonal differences in mean crab carapace copper
concentration (Jlg.g- I wet mass) (Mean logarithms of seasonal copper concentration used to
calculate the t-value).
n Mean SD Range t-value p-value
Summer 18 4.65 3.45 1.61-14.44vs -2.27 <0.05
Autumn 5 12.45 12.97 2.93-34.57
Summer 18 4.65 3.45 1.61-14.44vs -0.17 >0.05
Winter 6 10.16 17.01 1.03-44.54
Summer 18 4.65 3.45 1.61-14.44vs -0.12 >0.05
Spring 10 5.76 7.57 0.0-26.66
Autumn 5 12.45 12.97 2.93-34.57vs 1.0 >0.05
Winter 6 10.16 17.01 1.03-44.54
Autumn 5 12.45 12.97 2.93-34.57vs 1.59 >0.05
Spring 10 5.76 7.57 0.0-26.66
Winter 6 10.16 17.01 1.03-44.54vs 0.07 >0.05
Spring 10 5.76 . 7.57 0.0-26.66
Table 7.13: Results of Student's t-test for the seasonal differences in mean crab muscle copper
concentration (Jlg.g- I wet mass) (Mean logarithms of seasonal copper concentration used to
calculate the t-value). I
n Mean SD Range t-value p-value
Summer 15 14.83 24.32 1.3-71.43vs 1.28 >0.05
Autumn 4 2.59 1.48 0.58-4.1
Summer 15 14.83 24.32 1.3-71.43vs -1.37 >0.05
Winter 4 54.73 75.63 0.9-166.32.
Summer 15 14.83 24.32 1.3-71.43vs -0.34 >0.05
Spring 6 12.21 12.05 0.0-31.09
Autumn 4 2.59 1.48 0.58-4.1vs -1.8 >0.05
Winter 4 54.73 75.63 0.9-166.32

98
Autumn 4 2.59 1.48 0.58-4.1vs -1.46 >0.05
Spring 6 12.21 12.05 . 0.0-31.09
Winter 4 54.73 75.63 0.9-166.32vs 0.86 >0.05
Spring 6 12.21 12.05 0.0-31.09
Table 7:14: Results of Student's t-test for the differences in mean crab gill copper concentration
(llg.g- 1 wet mass) of autumn, winter and spring (Mean logarithms of seasonal copper
concentrations used to calculate the t-value).
n Mean SD Range.
t-value p-value
Autumn 3 50.25 71.11 8.1-132.35vs 0.34 >0.05
Winter 3 36.01 11.04 24.3-46.22
Autumn 3 50.25 71.11 8.1-132.35vs 1.07 . >0.05
Spring 5 18.14 1.04 17.22-19.71
Winter 3 36.01 11.04 24.3-46.22vs 3.81 <0.05
Spring 5 18.14 1.04 17.22-19.71
Table 7.15: Results of the Mann-Whitney test for the differences III crab gill copper
concentrations (llg.g-1 wet mass) of summer and the other seasons.
n Mean SD Range z-value p-value
Summer IS 6.16 4.48 2.56-19.23vs 2.132 <0.05
Autumn 3 50.25 71.11 8.1-132.35
Summer 15 6.16 4.48 2.56-19.23vs 2.606 <0.05
Winter 3 36.01 11.04 24.3-46.22
Summer 15 6.16 4.48 2.56-19.23vs 2.88 <0.05
Spring 5 18.14 1.04 17.22-19.71

99
Table 7.16: Results of the Mann-Whitney test for the differences in crab digestive gland copper
concentrations (Jlg.g- I wet mass) of summer, spring and the other seasons.
n Mean SD Range z-value p-value
Summer 15 39.07 23.2 7.0-74.1VS -1.267 >0.05
Autumn 5 25.75 19.82 2.3-49.0
Summer 15 39.07 23.2 7.0-74.1vs -I. 752 >0.05
Winter 6 15.51 9.35 1.9-27.0
Summer 15 39.07 23.2 7.0-74.1vs -0.846 >0.05
Spring 7 25.78 20.13 7.32-68.0
Autumn 5 25.75 19.82 2.3-49.0vs 0.0 >0.05
Spring 7 25.78 20.13 7.32-68.0
Winter 6 15.51 9.35 1.9-27.0vs 0.643 >0.05
Spring 7 25.78 20.13 7.32-68.0
Table 7.17: Results of Student's t-test for the differences in mean crab digestive gland copper
concentration (Jlg.g- I wet mass) of autumn and winter.
n Mean SD Range t-value p-value
Autumn 5 25.75 19.82 2.3-49.0vs 1.13 >0.05
Winter 6 15.51 9.35 1.9-27.0

100
Table 7.18: Results of Student's t-test for the seasonal differences in mean crab gonad copper
concentration (j.lg.g-I wet mass) (Mean logarithms of gonad copper concentrations used to
calculate the t-value).
n Mean SD Range t-value p-value
Summer 13 23.3 60.12 1.0-222.2vs 0.16 >0.05
Autumn 4 7.93 9.2 2.4-21.67
Summer 13 23.3 60.12 1.0-222.2vs -0.23 >0.05
Winter 4 10.28. 8.91 1.6-22.69
Summer 13 23.3 60.12 1.0-222.2vs -1.07 >0.05
Spring 4 21.24 21.29 4.14-50.7
Autumn 4 7.93 9.2 2.4-21.67vs -0.42 >0.05
Winter 4 10.28 8.91 1.6-22.69
Autumn 4 7.93 9.2 2.4-21.67vs -1.29 >0.05
Spring 4 21.24 21.29 4.14-50.7
Winter 4 10.28 8.91 1.6-22.69vs -0.83 >0.05
Spring 4 21.24 21.29 4.14-50.7
Table 7.19: Results of the Mann-Whitney test for the differences in whole crab (j.lg.g-I wet
mass) and water copper concentrations (mg.l- I ) at each locality: Jonkershoek (J) and SFW (S),
as well as the bioconcentration factor (BCFw) calculated for whole crabs (z = z-value, p = p
value).
n Mean SD Range z p BCFw
Water (J) 8 0.06 0.05 0.01-0.14vs 4.0 <0.05 255.17
Whole crab (J) 60 15.31 11.0 4.64-45.18
Water (S) 8 0.07 0.07 0.01-0.192vs 3.965 <0.05 394.29
Whole crab (S 51 27.6 31.19 7.48-200.32

101
Table 7.20: Results of Student's t-test for differences in mean crab tissue and carapace (/lg.g-I
wet mass), and water copper concentration (mg.l- I) at each locality, as well as the
bioconcentration factor (BCFw) calculated for the tissues and carapace (Dig.gland = digestive
gland; Mean logarithms of copper concentrations used to calculate the t-value; t = t-value, p = p
value).
JONKERSHOEK
n Mean SD Range t p BCFw
Water 8 0.06 0.05 0.01-0.14
vs Carapace 19 6.82 8.9 0.0-34.57 -10.72 <0.05 113.67
vs Muscle 16 10.24 17.26 0.0-66.6 -8.43 <0.05 170.67
vs Dig.gland 18 24.62 20.95 2.3-74.1 -16.0 <0.05 410.33
vs Gonads II 11.53 13.61 1.0-50.7 -10.10 <0.05 192.17
SFW
n Mean SD Range t p BCFw
Water 8 0.Q7 0.07 0.01-0.192
vs Carapace 20 6.75 9.55 2.02-44.54 -12.20 <0.05 96.43
vsMuscle 13 27.78 I 46.72 1.35-166.32 -8.15 <0.05 396.86
vs Dig.gland 15 36.33 20.87 1.9-68.0 -14.10 <0.05 519.0
vs Gills 12 24.07 37.02 2.56-132.35 -10.20 <0.05 343.86
vs Gonads 14 27.22 65.07 1.64-222.2 -8.61 <0.05 388.86
Table 7.21: Results of the Mann-Whitney test for differences in crab gill (/lg.g-I wet mass) and
water copper concentrations (mg.l- I) in Jonkershoek, as well as the bioconcentration factor
(BCFw) calculated for the gills (z =z-value, p =p-value).
n Mean SD Range z p BCFw
Water 8 0.06 0.05 0.01-0.14vs 30424 <0.05 182.17
Gills 14 10.93 6.91 3.5-19.71

102
Table 7.22: Results of the Mann-Whitney test for differences in copper concentrations (llg.g-1
wet mass) of whole crabs and sediments from the two localities, Jonkershoek (J) and SFW (S),
as well as the bioconcentration factor (BCFs) calculated for whole crabs (z = z-value, p = p
value).
n Mean SD Range z p BCFs
Sediment (J) 8 6.15 4.16 1.2-13.5vs 2,331 <0.05 2.49
Whole crab (J) 60 15.31 11.0 6.64-45.18
Sediment (S) 8 6.35 4.06 2.56-12.82vs 3.29 <0.05 4.35
Whole crab (S) 51 27.6 31.19 7.48-200.32
Table 7.23: Results of Student's t-test for differences in mean copper concentration (llg.g- 1 wet
mass) of the sediments, crab tissues and carapace at each locality: Jonkershoek and SFW, as well
as the bioconcentration factor (BCFJ calculated for the tissues and carapace (Dig .gland =
digestive gland; Mean logarithms of copper concentrations used to calculate the t-value; t = t
value, p = p-value).
JONKERSHOEK
n Mean SD Range t p BCFs
Sediment 8 6.15 4.16 1.2-13.5
vs Carapace 19 6.82 8.9 0.0-34.57 0.48 >0.05 1.11
vs Muscle 16 10.24 17.26 0.0-66.6 0.36 >0.05 1.67
vs Dig.gland 15 24.62 20.95 2.3-74.1 -3.66 <0.05 4.0
vs Gonads II 11.53 13.61 1.0-50.7 -0.53 >0.05 1.87
SFW
n Mean SD Range t p BCFs
Sediment 8 6.35 4.06 2.56-12.82
vs Carapace 20 6.75 9.55 2.02-44.54 0.6 >0.05 1.06
vs Muscle 13 27.78 46.72 0.35-166.32 -0.83 >0.05 4.37
vs Dig.gland 15 36.33 20.87 1.9-68.0 -4.15 <0.05 5.72
vs Gonads 14 27.22 65.07 1.64-222.2 -0.66 >0.05 4.29
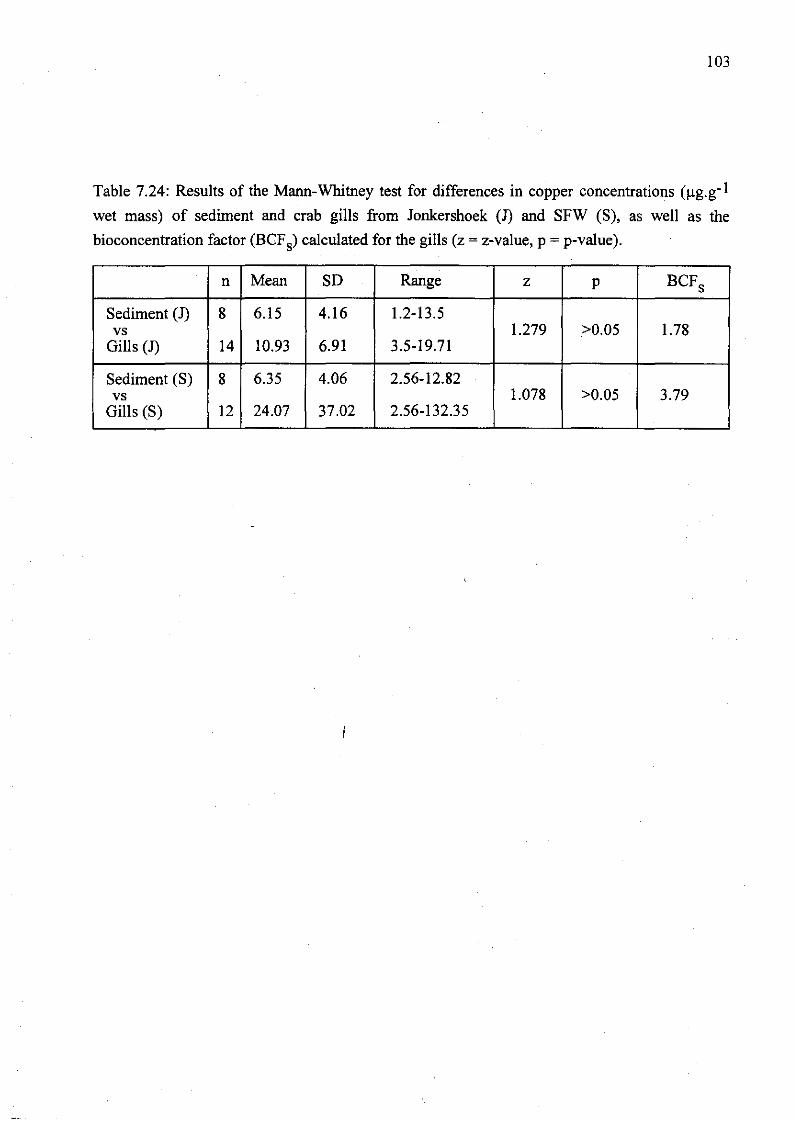
103
Table 7.24: Results of the Mann-Whitney test for differences in copper concentrations (llg.g- 1
wet mass) of sediment and crab gills from Jonkershoek (1) and SFW (S), as well as the
bioconcentration factor (BCFs) calculated for the gills (z = z-va1ue, p = p-value).
n Mean SD Range z p BCFs
Sediment (1) 8 6.15 4.16 1.2-13.5vs 1.279 >0.05 1.78
Gills (1) 14 10.93 6.91 3.5-19.71
Sediment (S) 8 6.35 4.06 2.56-12.82vs 1.078 >0.05 3.79
Gills (S) 12 24.07 37.02 2.56-132.35
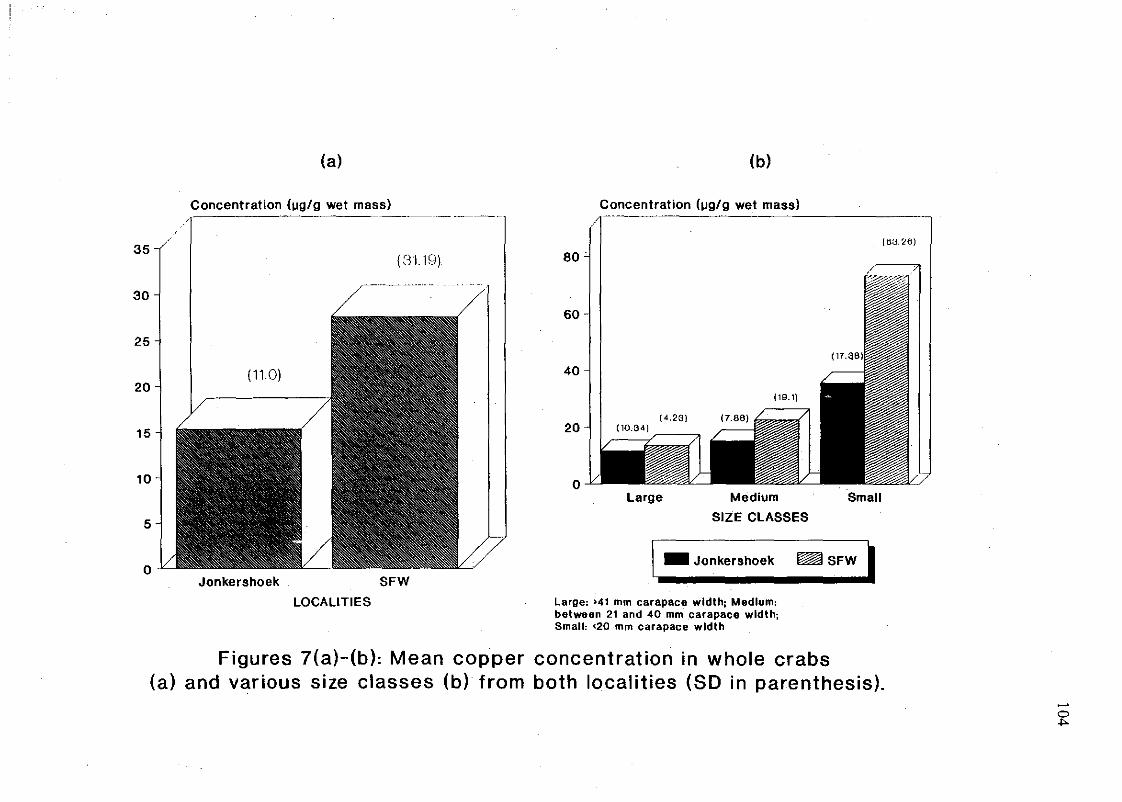
(a) (b)
Concentration (lIg/g wet mass), ----------1
Concentration (lJ9/g wet mass)---------"
(B:J 26)
SmallMedium
SIZE CLASSES
I- Jonkershoek ~ SFW ILarge
o
20
40
80
60
(3119)
SFWJonkershoek
(11.0)
5
o
10
15
25
20
35
30
LOCALITIES Large: >41 mm carapace width; Medium:between 21 and 40 mmcarapace width;Small: <20mm carapace width
Figures 7(a)-(b): Mean copper concentration in whole crabs(a) and various size classes (b) from both localities (SO in parenthesis).
-!::

(c) (d)
Concentration (Ug/g wet mass)/1 ~
Concentration (1J9/g wet mass).~"":"_------------,
35(L I.I)~!)
40 (20.67)
Carapace Muscle Dig.gland Gills
TISSUES[ _ Jonkershoek ~ SFW I
Gonads
(65.07)(13_611
(37.02)(6. 91)~
(46.72)
Carapace Muscle Dig.gland Gills
TISSUES
o
10
20
30
(43.91)
Gonads
(25.931
o
(34.26)
5
10 -l I (9.12)
15
25-
20
30-
Jonkershoek and SFW data pooled
Figures 7(c)-(d): Mean copper concentration in carapaceand tissues of P. perlatu5 from the Eerste River (SD in parenthesis).
-ov.

(e): WHOLE CRABS (I): CARAPACE (III: MUSCLE
Oonc....1rallon (J,Ig/g WIlt .....) Concantrallon WO/Q _tma...) Ooncantrallon (JlII/II WIlt l'IIa••)
SEASON
(16.63t
SEASON
Summer
80
40
Sprln9Winter
(12.97)
AutumnSummar
14
Sprln9Autumn Winter
SEASON
Summar
35
(h): DlOESTIVE GLAND (ir. GILLS (t): GONADS (Ovar_ and laatlla pooled)
Conc.nlr.flon (ala'a _t rna••) Concentration b.la'g _I ",aaa) Conc.nlralJon wa/a ..t m•••)
60 80- 30
\71.111
SEASON
SprlnaAutumn Winter
SEASON
(60.12)
9u",merSprlnaWlntar
SEASON
AlJtumn
(o101A)
Sumllllaro
30
50
40
'0
.0
SprlnoWln"rAutumn
(23.2)
Summar
Figures 7(e)-(j): Mean seasonal copper concentration inwhole crabs, carapace and tissues of P. perlatus
(Jonkershoek and SFW data pooled; SD in parenthesis). oIJ'
107
Discussion
Comparisons of whole body, tissue, and· carapace copper concentrations III Potamonautes
perlatus (Table 7.3; Figure 7(c)), with the corresponding concentrations found by Bryan (1968)
for several uncontaminated marine and freshwater decapods, Arumugam & Ravindranath (1983)
for the green lagoon crab Scylla serrata and Steenkamp et al. (1994a) for Potamonautes warreni,
were made.
Bryan (1968) illustrated mean wet mass Cu concentrations of 3.2 to 11.0 Ilg.g- 1 for muscle
tissue, 34.0 to 603.0 Ilg.g- l for the digestive gland, 7.0 to 57.0 Ilg.g- l for the gills, 3.0 to 50.0
Ilg.g- l for the gonads and trace concentrations to 9.5 Ilg.g-1 for the "shell". Unexposed
individuals of the green lagoon crab, Scylla serrata, contained mean wet mass Cu concentrations
of 39.5±4.3, l52.3±24.3, 58.2±9.2, 30.2±2.2 and l4.8±1.3 Ilg.g- l in the muscles, digestive
gland, gills, gonads and "cuticle" respectively (Arumugam & Ravindranath, 1983). It was found
that, when compared with the results of Bryan (1968), the mean Cu concentrations in the tissues
and carapace of P. perlatus were all relatively low to very low, whereas, compared to the results
of Arumugam & Ravindranath (1983), the Cu concentrations in the digestive gland of P.
perlatus were relatively low and the concentrations in the muscles relatively high. The mean Cu
concentrations in the gills, gonads and carapace of P. perlatus, however, compared well.
Steenkamp et ai. (1 994a) observed mean wet mass Cli concentrations of 13.2±4.7 to 28.9±14.8
Ilg.g- l in the muscles of P. warreni from polluted waters, 20.6±18.0 to 67.0±205.5 Ilg.g- l in the
digestive gland, 35.3±25.l to 61.2±56.3 Ilg.g- l in the gills, l5.9±9.7 to 23.7±15.2 Ilg.g- l in the
gonads and 8.8±4.6 to l4.9±6.8 Ilg.g- l in the carapace. In comparison, the mean concentrations
in the carapace and gills of P. perlatus were found to be relatively low, whilst the concentrations
in the remaining tissues compared favourably. Also,when the whole crab copper concentrations
in several uncontaminated marine and freshwater decapods (10 to 33 Ilg.g- l wet mass) (Bryan,
1968) were compared with the whole body Cu concentrations in Potamonautes perlatus (Table
7.5), the concentrations in the latter were found to compare favourably.
Despite the fact that the mean Cu concentrations in the muscles, digestive gland and gonads of
P. perlatus were observed to be similar to the concentrations in P. warreni collected from
polluted freshwater ecosystems (Steenkamp et ai., 1994a), the whole body Cu concentrations in
P. perlatus indicate that this metal is generally well regulated in this species in the Eerste River.
However, comparisons of the concentration values from the two localities produced results to the
contrary: whilst no significant differences between either the various size classes or the selected
tissues and carapace (Tables 7.6-7.8) were found, the statistically significant differences in Cu
concentrations observed between whole crabs (Table 7.5), as well the higher BCFw and BCFsfor whole crabs from SFW (Tables 7.19 and 7.22), indicated a Cu accumulation in crabs from
this locality.

108
Since no differences in copper concentrations existed between either the water or the sediments
from the two localities (Tables 4.5 and 4.11), the reason for the observed whole crab differences
between the localities must lie within differences in the physico-chemistry of the water (Table
4.8), possibly resulting in, among others, an increase in the bioavailability of eu to the animals.
Also, as mentioned, food is an important source of Cu, therefore differences in the diets of the
two populations may also have been an influencing factor.
Upon researching the distribution of Cu in P. perlatus, it was found that the tissue into which the
most copper was concentrated, was the digestive gland (Tables 7.3 and 7.4), supported by the
higher BCFw's and BCFs's observed for this tissue from both localities (Tables 7.20,7.21,7.23
and 7.24), as well as the fact that this was the only tissue in which the Cu concentrations were
significantly higher than in the sediments, at both localities (Table 7.23). The carapace, on the
other hand, contained the lowest Cu concentrations (Table 7.3). Hilmy et al. (1988) also found
the highest Cu concentrations in the digestive gland of Portunus pelagicus and a relatively low
Cu concentration in the carapace. These results also agree with those of Bryan (1968) and
Arumugam & Ravindranath (1983). Although Steenkamp et al. (1994a) also found low Cu
concentrations in the carapace of Potamonautes warreni, they detected the highest
concentrations in the gills, followed by the digestive gland.
Since food is the major source of copper in decapod crustaceans (Wieser, 1968), the copper
concentrations in the digestive gland are expected to be fairly high but to vary with feeding
status. Authors such as Rainbow & Scott (1979) and Engel & Brouwer (1987) have reported on
specific heavy metal-binding proteins (metallothioneins) in the digestive glands of the marine
crabs Carcinus maenas and Callinectes sapidus respectively. Arumugam & Ravindranath (1983)
stated that the digestive gland is a unique tissue in storing Cu associated with lipids, and that this
may be a mechanism to detoxify Cu.
In the haemolymph Cu is present in the TCA-insoluble fraction, suggesting that all the copper
may be very tightly bound to the TeA-protein precipitate which is probably mainly
haemocyanin (Arurnugam & Ravindranath, 1983). Bryan (1968) suggested that the Cu found in
the muscles and gills of decapod crustaceans are related to the blood concentration and are
normally probably due to contamination by the blood. One can assume that this is also
applicable in the case of other internal organs such as the gonads.
It is not known to what extent copper is absorbed by the exoskeleton or whether copper is
incorporated in the exoskeleton, but the consistently low Cu concentrations found in the
carapaces of P. perlatus and various other species suggest that the exoskeleton (specifically the
carapace) does not playa significant role in the uptake and storage of Cu.

109
It is concluded that the digestive gland is the most important tissue for Cu storage in P. perlatus
and that the carapace is ofrelatively little importance. The remaining three selected tissue types
do not seem to vary significantly in their contribution to Cu storage.
Investigations into the relationship between crab body size and whole body, tissue and carapace
copper concentrations, brought to light that reasonably strong negative correlations existed
between body size and whole body (r = -0.58), muscle, gonad and carapace Cu concentrations
(Table 7.2). The statistically significant differences between Cu concentrations of the various
size classes from the two localities (except between large and medium crabs from SFW) (Table
7.1), provide more proof t1).at smaller individuals of P. perlatus take up more copper than larger
individuals. Although this contradicts the fmdings of Hilmy et al. (1988), who found that mature
crabs (Portunus pelagicus) accumulated more Cu than immature crabs, it supports the findings
of Steenkamp et al. (l994a), who found that immature individuals of Potamonautes warreni
were able to bioaccumulate more Cu per unit weight than mature crabs. Also, Kiffney &
Clements (1996) demonstrated an inverse relationship between body size and survivorship, upon
exposing three ephemeropteran and one plecopteran species to copper.
It is therefore concluded that body size can be considered to be a factor which influences the
uptake of copper in Potamonautes perlatus. The reasons for this phenomenon however, are not
clear. Hill & O'Keeffe (1992) who studied the feeding ecology of P. perlatus, found that smaller
individuals preyed significantly more on aquatic invertebrates than larger individuals, while the
latter preferred vegetable material. It is known that aquatic invertebrates (e.g. insects) are able to
accumulate heavy metals in their bodies (Albers & Camardese, 1993 and Kiffney & Clements,
1993). It is therefore possible that smaller individuals of P. perlatus bioaccumulate more Cu
from their prey. Steenkamp et aL (l994a) suggested that the higher Cu concentrations in smaller
individuals are due to the fact that the regulation mechanisms of these animals are not yet fully
developed and that younger crabs have relatively higher metabolic and growth rates. Also,
Gherardi et al. (1987) and Gherardi & Micheli (1989) found that younger individuals of
Potamon fluviatile and P. potamios palestinensis respectively tend to hide more under stones and
rocks, especially during the night. Since these microhabitats create relatively constant
environments, it is possible that younger (therefore smaller) individuals of P. perlatus are
exposed to specific Cu concentrations for longer periods, resulting in the observed higher Cu
concentrations.
An investigation into the relationship between gender and whole body, tissue and carapace Cu
concentrations showed that gender also seems to be a factor influencing the uptake of Cu in P.
perlatus. Although no significant differences were found in tissue or carapace Cu concentrations
in the two genders, the copper concentrations of whole male individuals of P. perlatus were
found to be significantly higher than the concentrations of whole females (Table 7.9). Hilmy et
al. (1988) also found no significant differences in tissue or carapace eu concentrations between

110
males and females of Portunus pelagicus (Table 7.10). Bryan (1968) and Steenkarnp et al.
(1994a), on the other hand, found a singular difference between the concentrations in the mature
gonads. Since the differences in whole body Cu between males and females of P. perlatus
cannot be attributed to the copper concentrations in any of the tissues or the carapace, it must be
assumed that males had higher Cu concentrations in the haemolymph or other internal organs
but, as mentioned previously, the concentrations in the latter are influenced by the
concentrations in the former. Gherardi et al. (1989) and Gherardi & Vannini (1989) studied the
foraging strategies and spatial behaviour of Potamon fluviatile and determined that, in relation to
the reproductive phases, females moved faster and occupied a larger area during summer and
autumn. In contrast, males moved more slowly and occupied a smaller area, displaying a
sedentary behaviour. These seasonal "nomadic" movements of females have also been observed
for Potamonautes perlatus during the present study and could explain the higher Cu
concentrations found in whole males: the less active males are possibly exposed to specific Cu
concentrations for longer periods, suggesting that more Cu is absorbed per time unit.
Seasonality was also found to influence Cu uptake to some extent: a number of seasonal
variations were found in whole crab, carapace and gill copper concentrations (Tables 7.11, 7.12,
7.14 and 7.15) In each case, peaks in Cu were observed during autumn/winter (Figures 7(e),(f)
and (i)). Authors Steenkamp et al. (1994a) and Devescovi & Lucu (1995) however, found
summer Cu peaks in tissues of P. warreni and whole individuals of Carcinus mediterraneus
respectively. The observed peaks for P. perlatus do not correspond with the slight seasonal
peaks in water and sediment Cu (Figures 4«;)-(1)), therefore another explanation for these peaks
in this species need to be considered. It is known that P. perlatus is less active in winter and
retreats into burrows or under rocks and stones (personal observations and lowered catch rate),
in order to escape the increased water flow rate. The constant environment created by this type
of microhabitat and the close contact with the sediments could increase the amount of Cu
absorbed by the animals, through ltmgthened exposure to a specific copper concentration. The
copper is possibly absorbed via the gills, since Arumugam & Ravindranath (1983; 1987) found
that the gills of Scylla serrata were capable of sequestering Cu from the environment.
The seasonal carapa,;e copper concentrations are probably not directly related to environmental
copper and absorption via the gills but more likely a result of the stage of the moult cycle, as
suggested by Arumugam & Ravindranath (1983). Steenkamp et al. (1994a) speculated that since
the carapace is shed periodically, this could represent a route of excretion of Cu in decapods.
Since the exact time of moulting in P. perlatus is not yet known, it will be impossible to
substantiate this theory in the case of this species.
Although no significant seasonal differences were observed for the remaining tissues, namely the
muscles, digestive gland and gonads, these tissues exhibited peaks during autumn/winter
(muscles), in summer (digestive gland) and during spring/sununer (gonads) (Figures 7(g), (h)

III
and 0». Devescovi & Lucu (1995) also observed a summer peak in digestive gland Cu for
Careinus mediterraneus. Bryan (1968) reported that the Cu in the digestive gland increases
following a moult and reaches a maximum at the start of the intermoult period, after which it
decreases. It is likely that the Cu is mobilized into the haemolymph and partly incorporated into
the exoskeleton, especially the carapace, to be excreted during the moult. It is possible that the
intermoult period, for a number of individuals of P. perlatus, may have commenced in summer,
explaining the summer peak in digestive gland Cu. However, again, owing to the limited
information on the moulting cycle of this species, this theory cannot be substantiated. Gherardi
et al. (1989) showf:d that during early summer, when second vitellogenesis takes place in
females of Potamon fluviatile, a corresponding deposition of fats in the gonads occurred. The
lipid content of the digestive gland was also significantly higher. Considering the opinion of
Arumugam & Ravindranath (1983), that the digestive gland stores Cu associated with lipids, this
could be a plausible explanation for the observed summer peaks in digestive gland Cu in
Potamonautes perlatus.
Finally, in agreement with the findings of Steenkamp et al. (1994a) for P. warreni, it is
concluded from the preliminary results, that P. perlatus in the Eerste River does not seem to
qualify as a monitor of environmental Cu pollution. This is based on the fact that seasonal
variations in whole body, carapace and gill Cu were observed, indicating that long term
accumulation would not occur, as well as the fact that fluctuations in environn'lental Cu were not
reflected in any body parts analysed. The observed large intraspecific variations in Cu
concentrations also support these findings. However, more intensive research on Cu uptake and
distribution in P. perlatus is needed before final conclusions can be made.
---000---

112
CHAPTER 8
CONCENTRATIONS OF LEAD IN THE FRESHWATER CRAB,POTAMONAUTES PERLATUS
Introduction
Lead has played an important role in human societies over many thousands of years: the decline
of the Rom/lll Empire has been ascribed to the deleterious effect of lead poisoning, It occurs in
several ores, namely galena, galenite, lead sulphide, cerussite, anglesite, lancarksite, massicot
and matlockite. The main Pb minerals are the sulphides and carbonates. The Pb+2 forms
complexes which are slightly stable with nitrate, chloride and cyanide, and other fairly stable
complexes with acetic, organic hydroxyl and thiosulphuric acids. The salts of lead (II), lead
oxides and lead sulphide are poorly soluble in water with the exception of lead acetate, lead
chlorate and, to some extent, lead chloride (Galvin, 1996; Harrison & Laxen, 1984; Richardson
& Gangolli, 1994 and Tsuchiya, 1979).
The world consumption of lead was about 4.1 million tons in 1975, more than 50% of which
was used by the automobile industry, in the form of batteries and alkyllead. The largest
consumer of lead in 1974 was the storage battery industry, followed by alkyllead production and
cable sheathing. Other uses are e.g. as an element of alloys, in paint pigments, in petrol to give,anti-knock properties, for x-ray and atomic radiation protection, as well as a means of
sweetening wine (Harrison & Laxen, 1984; Newland & Daum, 1982; Richardson & Gangolli,
1994 and Tsuchiya, 1979).
Lead can reach riverine ecosystems via industrial runoff and atmospheric fallout; the latter is
known to be the main source ofPb i~ marine and freshwaters (Moore & Ramamoorthy, 1984).
This metal poses a threat to riverine fauna since it is not a physiologically essential element, but
has a toxic character (Galvin, 1996). It is known to be less toxic to invertebrates than copper,
cadmium, zinc and mercury but generally more toxic than nickel, cobalt and manganese (Moore
& Ramamoorthy, 1984).
Lead, accumulated to sublethal levels in animals, can cause a number of symptoms of which the
following are examples: anemia, mental deterioration, aggressive behaviour, loss of appetite,
insomnia, vomiting, decreased male fertility, stillbirths and miscarriages. Acute and chronic lead
poisoning may lead to gastrointestinal colic and encephalopathy (Harrison & Laxen, 1984;
Richardson & Gangolli, 1994 and Tsuchiya, 1979).
There are several factors which influence the toxicity and bioavailability of lead in freshwaters,
such as the presence of other salts in. the water, which reduce the bioavailability of lead because
113
it precipitates. An increase in water pH lowers the concentration of Pb+2, therefore lowering its
toxicity to invertebrates. Chelators and complexing agents bind Pb+2, thus decreasing Pb
toxicity. It is also known that the acute toxicity of lead to freshwater organisms is greater in soft
water than in hard water. Age may also be an important factor: it has been shown that young
people absorb lead faster and are more susceptible to its toxic effects than adults. This may also
be true for immature aquatic animals (Galvin, 1996; Newland & Daum; 1982 and Richardson &
Gangolli, 1994). Lastly, Roldan & Shivers (1987) reported that the toxicity of Pb to decapods
(e.g. the crayfish Orconectes propinquus), may be decreased by the formation of Pb-containing
vacuoles in the digestive gland.
The accumulation of lead by freshwater decapods have been studied in a number of crayfish and
crab species. Lead concentrations in the two crayfish species Orconectes virilis and 0.
propinquus were investigated by Anderson & Brower (1978), France (1987) and Roldan &
Shivers (1987). Tulasi et a!. (1987) and Tulasi & Rarnana Rao (1988) studied lead accumulation
in the crab Barytelphusa guerini, whereas for the South African crab species Potamonautes
warreni intensive research was undertaken by Van Eeden & Schoonbee (1991), Steenkamp et a!.
(1992) and du Preez et aI. (1993).
Materials and Methods
All samples were prepared, tested and statistically analysed according to the method described in
Chapter 3.
Results
In all cases only the lead concentrations per gram wet mass were used for statistical analysis.
Crabs showed large individual variation in whole body, tissue and carapace lead concentrations.
This was an important consideration in the interpretation of the statistical results.
The relationship between crab size and whole crab lead concentration
In order to investigate the possible relationship between whole crab lead concentrations and the
sizes of the crabs, the data from Jonkershoek and SFW were pooled. The carapace widths of the
crabs, in decreasing order, were compared with the respective lead concentrations and the
correlation coefficient (r) thereof, calculated. With 53 degrees of freedom and an r2-value of
21.69%, an r-value of -0.466 was obtained. This indicated a reasonably strong negative
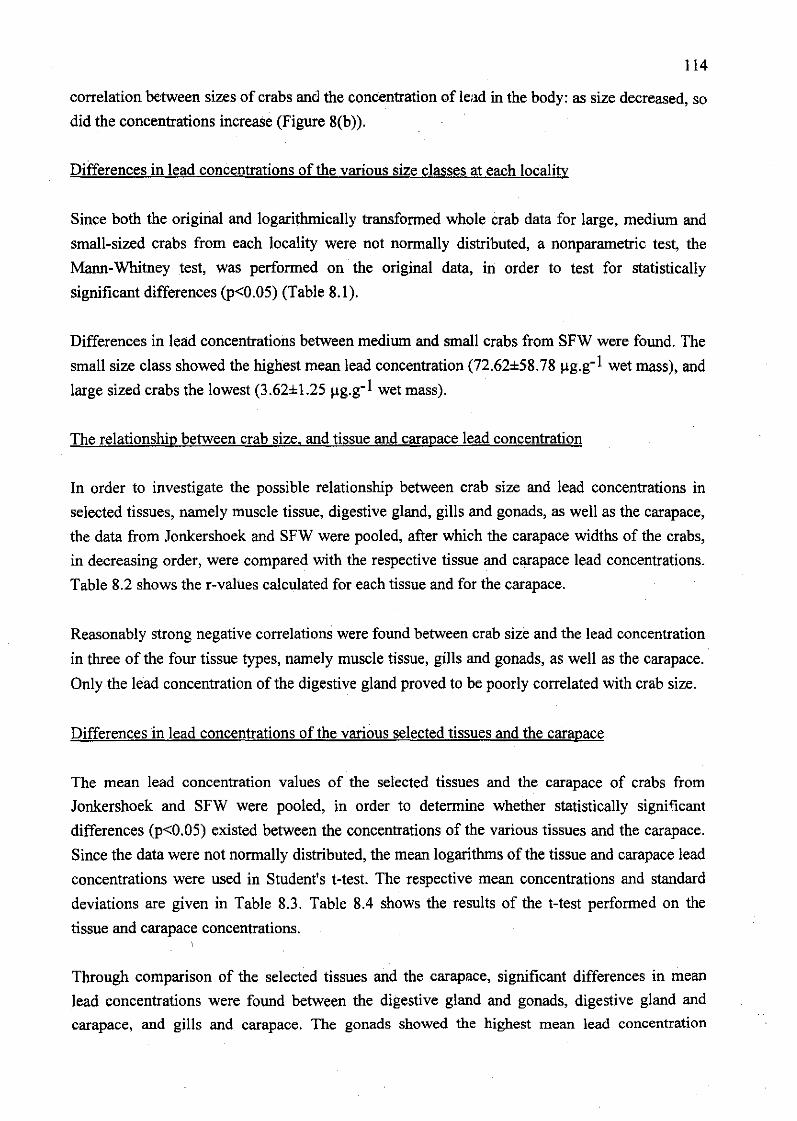
114
correlation between sizes of crabs and the concentration of lead in the body: as size decreased, so
did the concentrations increase (Figure 8(b».
Differences in lead concentrations of the various size classes at each locality
Since both the original and logarithmically transfonned whole crab data for large, medium and
small-sized crabs from each locality were not nonnally distributed, a nonparametric test, the
Mann-Whitney test, was perfonned on the original data, in order to test for statistically
significant differences (p<O.05) (Table 8.1).
Differences in lead concentrations between medium and small crabs from SFW were found. The
small size class showed the highest mean lead concentration (72.62±58.78 J,lg.g-l wet mass), and
large sized crabs the lowest (3.62±1.25 J,lg.g-l wet mass).
The relationship between crab size. and tissue and carapace lead concentration
In order to investigate the possible relationship between crab size and lead concentrations in
selected tissues, namely muscle tissue, digestive gland, gills and gonads, as well as the carapace,
the data from Jonkershoek and SFW were pooled, after which the carapace widths of the crabs,
in decreasing order, were compared with the respective tissue and carapace lead concentrations.
Table 8.2 shows the r-valiles calculated for each tissue and for the carapace.
Reasonably strong negative correlations were found between crab size and the lead concentration
in three of the four tissue types, namely muscle tissue, gills and gonads, as well as the carapace.
Only the lead concentration of the digestive gland proved to be poorly correlated with crab size.
Differences in lead concentrations of the various selected tissues and the carapace
The mean lead concentration values of the selected tissues and the carapace of crabs from
Jonkershoek and SFW were pooled, in order to detennine whether statistically significant
differences (p<O.05) existed between the concentrations of the various tissues and the carapace.
Since the data were not nonnally distributed, the mean logarithms of the tissue and carapace lead
concentrations were used in Student's t-test. The respective mean concentrations and standard
deviations are given in Table 8.3. Table 8.4 shows the results of the t-test perfonned on the
tissue and carapace concentrations.I
Through comparison of the selected tissues and the carapace, significant differences in mean
lead concentrations were found between the digestive gland and gonads, digestive gland and
carapace, and gills and carapace. The gonads showed the highest mean lead concentration

lIS
(23.44±32.45 ~g.g-I wet mass), and the digestive gland the lowest (7.43±12.45 ~g.g-l wet
mass) (Figure 8(c».
Differences in lead concentrations of crabs from 10nkershoek and SFW
(a) Differences in whole crab lead concentration
The logarithmically transformed whole crab data for 10nkershoek and SFW failed the normal
probability test, thus the Mann-Whitney test was performed (Table 8.5).
The highest mean lead concentration (l9.49±32.36 ~g.g-l wet mass) was found in crabs from
SFW (Figure 8(a» but a z-value of 0.145 indicated that there were no statistically significant
differences (p>0.05) between whole crab lead concentrations in the two localities.
(a)(i) Differences in whole crab lead concentrations of the various size classes
Through a comparison of the whole crab lead concentration values between large, medium and
small crabs from 10nkershoek and SFW, it was established with the Mann-Whitney test that no
statistically significant differences existed in lead concentration between any of the size classes
(Table 8.6).
(b) Differences between concentration values of selected tissues and the carapace
The mean lead concentrations in the carapace, muscle, digestive gland, gills and gonads of crabs
from 10nkershoek and SFW were compared with the use of Student's t-test and the results
tabulated in Table 8.7. Since the data were not normally distributed, the mean logarithms of the
lead concentrations in the tissues and carapace were used to calculate the t-value. In the case of
the carapace data from SFW, however, a normal distribution could not be obtained after
transformation of the concentration data. The Mann-Whitney test was therefore performed on
the original data, to investigate possible differences (Table 8.8).
Although the tissue and carapace samples from SFW showed the highest mean lead
concentration in each instance (Figure 8(d», no significant differences could be found between
the two localities.
Differences in lead concentrations of males and females
In order to determine whether statistically significant differences (p<0.05) existed between the
mean whole crab, tissue and carapace lead concentration of males and females, the data for crabs
collected from 10nkershoek and SFW, were pooled for each sex. In all cases the original data
failed the normal probability test, therefore each concentration was logarithmically transformed.
In all cases except the digestive gland and gonads, the transformed data also failed to provide a
normal distribution, thus the Mann-Whitney nonparametric test was performed,

116
(a) Differences in whole crab concentrations
Table 8.9 shows the results of the Mann-Whitney test, perfonned on the original whole crab lead
concentrations of males and females of Poiamonautes per/atus. The highest mean lead
concentration was found in males (24.39±34.24 /lg.g-I wet mass) but no statistically significant
difference (p>0.05) existed between the two genders.
(b) Differences in lead concentration of the selected tissues and the carapace
Although males exhibited the highest mean lead concentrations in the carapace and all but one of
the four tissue types (gonads), the digestive gland was the only tissue type in which a significant
difference between the two genders was found (Tables 8.10 and 8.1 I).
Seasonal variations in lead concentrations
The lead concentrations of whole crabs, selected tissues and carapace from the different seasons
were tested for statistically significant differences (p<0.05). In each instance, the data for crabs
collected at Jonkershoek and SFW were pooled and these then tested for nonnality. None of the
data sets were nonnally distributed and were therefore logarithmically transfonned. The
transfonned whole crab, carapace and summer muscle and gill data also failed the nonnal
probability test, thus the Mann-Whitney test was perfonned.
(a) Seasonal differences in whole crab lead concentrations
The Mann-Whitney nonparametric test produced statistically significant differences between
whole crab lead concentrations of all the seasons, except between summer and spring and
between winter and spring (Table 8.12). The highest mean whole crab lead concentration
(39.25±35.89 /lg.g-I wet mass), was found in autumn, whereas summer showed the lowest mean
(IO.78±13.97 /lg.g-I wet mass) (Figure 8(e».
(b) Seasonal differences in tissue and carapace lead concentrations
1. Carapace
No statistically significant differences (p>O.05) between carapace lead concentrations of any of
the four seasonS were found. The results of the Mann-Whitney test, perfonned on the seasonal
lead concentrations, are tabulated in Table 8.13. Figure 8(f) shows the mean seasonal carapace
lead concentrations.
2. Muscle tissue
Through pairwise comparisons of the different seasons, it was found that no statistically
significant differences in muscle lead concentrations existed between any of the seasons (Tables
8.14 and 8.15). Figure 8(g) exhibits the mean seasonal muscle lead concentration.
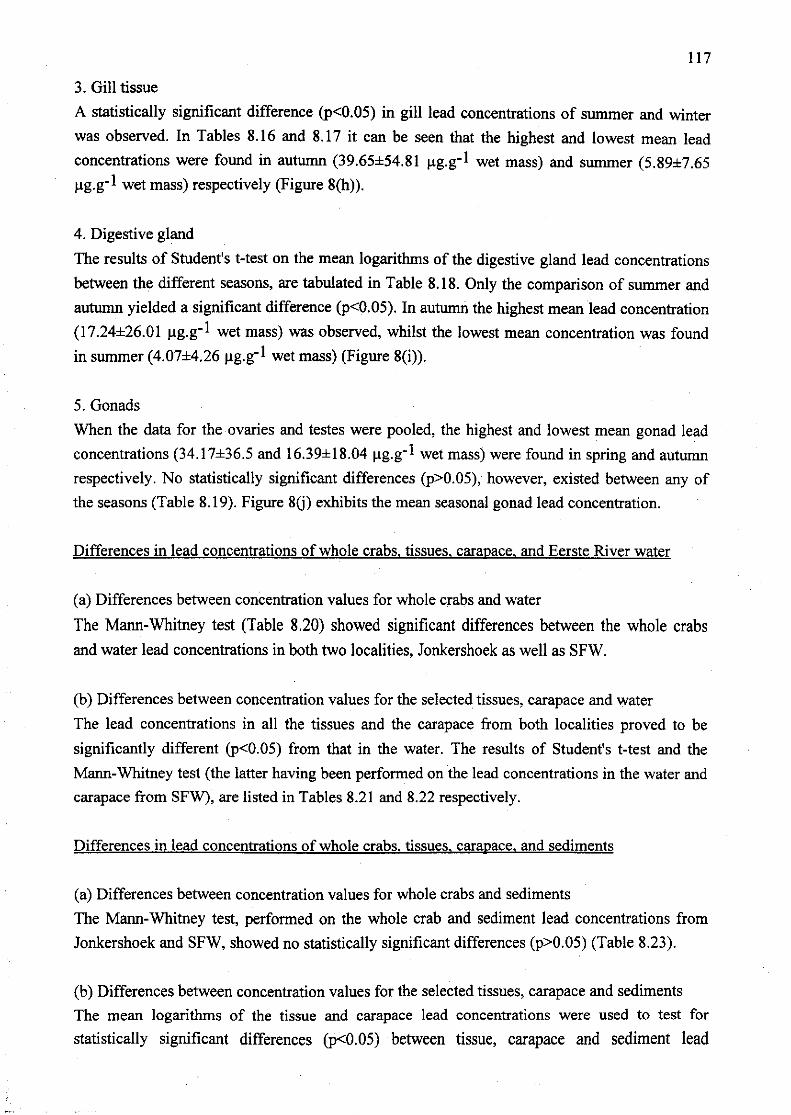
117
3. Gill tissue
A statistically significant difference (p<O.05) in gill lead concentrations of summer and winter
was observed. In Tables 8.16 and 8.17 it can be seen that the highest and lowest mean lead
concentrations were found in autumn (39.65±54.81 Ilg.g-1 wet mass) and summer (5.89±7.65
Ilg.g-1 wet mass) respectively (Figure 8(h)).
4. Digestive gland
The results of Student's t-test on the mean logarithms of the digestive gland lead concentrations
between the different seasons, are tabulated in Table 8.18. Only the comparison of summer and
autumn yielded a significant difference (p<O.05). In autumn the highest mean lead concentration
(l7.24±26.01 Ilg.g- 1 wet mass) was observed, whilst the lowest mean concentration was found
in summer (4.07±4.26 Ilg.g-1 wet mass) (Figure 8(i)).
5. Gonads
When the data for the ovaries and testes were pooled, the highest and lowest mean gonad lead
concentrations (34.17±36.5 and 16.39±18.04Ilg.g-1 wet mass) were found in spring and autumn
respectively. No statistically significant differences (p>O.05), however, existed between any of
the seasons (Table 8.19). Figure 80) exhibits the mean seasonal gonad lead concentration.
Differences in lead concentrations of whole crabs. tissues. carapace. and Eerste River water
(a) Differences between concentration values for whole crabs and water
The Mann-Whitney test (Table 8.20) showed significant differences between the whole crabs
and water lead concentrations in both two localities, Jonkershoek as well as SFW.
(b) Differences between concentration values for the selected tissues, carapace and water
The lead concentrations in all the tissues and the carapace from both localities proved to be
significantly different (p<O.05) from that in the water. The results of Student's t-test and the
Mann-Whitney test (the latter having been performed on the lead concentrations in the water and
carapace from SFW), are listed in Tables 8.21 and 8.22 respectively.
Differences in lead concentrations of whole crabs. tissues. carapace. and sediments
(a) Differences between concentration values for whole crabs and sediments
The Mann-Whitney test, performed on the whole crab and sediment lead concentrations from
Jonkershoek and SFW, showed no statistically significant differences (p>O.05) (Table 8.23).
(b) Differences between concentration values for the selected tissues, carapace and sediments
The mean logarithms of the tissue and carapace lead concentrations were used to test for
statistically significant differences (p<0.05) between tissue, carapace and sediment lead
118
concentrations at the two localities. The transformed carapace concentrations, however, were not
normally distributed, therefore the Mann-Whitney test was performed.
The data from both localities showed no significant differences in lead concentrations between
the sediments, tissues and carapace. Table 8.24 lists the results of Student's t-test, performed on
the mean logarithms of the tissue lead concentrations from the two localities. The results of the
Mann-Whitney test, performed on the original carapace data, are shown in Table 8.25.

119
Table 8.1: Results of the Mann-Whitney test for differences in whole crab lead concentrations
(llg.g-1 wet mass) of the various size classes at each locality.
JONKERSHOEK
n Mean SD Range z-value p-value
Large 22 9.27 11.89 0.78-33.29vs 1.334 >0.05
Medium 34 19.45 23.39 0.97-75.62
Large 22 9.27 11.89 0.78-33.29vs 1.173 >0.05
Small 4 21.4 14,03 1.31-33.85
Medium 34 19.45 23.39 0.97-75.62vs 0.499 >0.05
Small 4 21.4 14,03 1.31-33.85
SFW
n Mean SD Range z-value p-value
Large 6 3.62 1.25 2.34-5.22vs -0.083 >0.05
Medium 39 13.76 20.1 1.16-74.68
Large 6 3.62 1.25 2.34-5.22vs 1.841 >0.05
Small 6 72.62 58.78 1.95-164.7
Medium 39 13.76 20.1 1.16-74.68vs 2.655 <0.05
Small 6 72.62 58.78 1.95-164.7
Table 8.2: R2-values calculated for sizes of crabs and selected tissue and carapace lead
concentrations (DF =Degrees offreedom; Dig.gland =digestive gland)
DF r-value R-sq (%)
Crab size and Muscle 27 -0.549 30.15
Crab size and Dig.gland 29 -0.343 11.79
Crab size and Gills I 24 -0.498 24.79
Crab size and Gonads 23 -0.463 21.44
Crab size and Carapace 28 -0.467 21.81

120
Table 8.3: Mean lead concentration (f!g.g-I wet mass) in the muscles, digestive gland (dig.
gland), gonads, gills and carapace of crabs from the Eerste River (Jonkershoek and SFW data
pooled).
n Mean SD Range.
Muscle 29 17.84 24.96 0.3-85.7
Dig. gland 33 7.43 12.45 0.0-63.2
Gonads 25 23.44 32.45 0.1-.125.0
Gills 26 14.11 23.43 0.0-102.94
Carapace 39 23.41 53.28 0.73-329.63
Table 8.4: Results of Student's t-test for the differences in mean crab tissue and carapace lead
concentration (f!g.g-I wet mass) (Jonkershoek and SFW pooled; Mean logarithms of lead
concentrations used for the calculation of the t-value).
t-value p-value
Muscle vs Digestive gland 1.65 >0.05
Muscle vs Gonads -0.23 >0.05
Muscle vs Gills 0.27 >0.05
Muscle vs Carapace -1.31 >0.05
Digestive gland vs Gonads -1.74 <0.05
Digestive gland vs Gills -1.39 >0.05
Digestive gland vs Carapace -3.53 <0.05
Gonads vs Gills 0.48 >0.05
Gonads vs Carapace -1.69 <0.05
Gills vs Carapace -0.89 >0.05

121
Table 8.5: Results of the Mann-Whitney test for the differences In whole crab lead
concentrations (llg.g-1 wet mass) from Jonkershoek and SFW.
n Mean SD Range z-value p-value
Jonkershoek 60 15.84 19.8 0.78-75.62vs 0.145 >0.05
SFW 51 19.49 32.36 1.16-164.7
Table 8.6: Results of the Mann-Whitney test for the differences in whole crab lead
concentrations (llg.g- 1 wet mass) for the various size classes, small, medium and large, from
Jonkershoek (1) and SFW (S).
n Mean SD Range z-value p-value
Large (1) 22 9.27 11.89 0.78-33.29vs 0.364 >0.05
Large (S) 6 3.62 1.25 2.34-5.22
Medium (1) 34 19.45 23.39 0.97-75.62vs -0.824 >0.05
Medium (S) 39 13.76 20.1 1.61-74.68
Small (1) 4 21.4 41.03 1.31-33.85vs 1.173 >0.05
Small (S) 6 72.62 58.78 1.95-164.7.
Table 8.7: Results of Student's t-test for the differences in mean tissue lead concentration (llg.g-1
wet mass) of crabs from Jonkershoek(J) and SFW (SF) (Mean logarithms of the tissue lead
concentrations used in the test).
n Mean SD Range t-value p-value
Muscle (1) 16 14.15 18.98 0.4-63.63vs -0.14 >0.05
Muscle (SF) 13 22.38 31.04 0.3-85.7
Dig.gland (1) 18 5.72 8.52 0.0-31.96vs -0.86 >0.05
Dig.gland (SF) 15 9.49 16.12 0.2-63.2
Gil.ls (J) 14 9.52 16.51 0.0-61.4vs -1.24 >0.05
Gills (SF) 12 19.46 29.45 0.9-102.94
Gonads (1) 14 19.46 23.6 0.2-69.4vs 0.04 >0.05
Gonads (SF) II 28.5 41.86 0.1-125.0

122
Table 8.8: Results of The Mann-Whitney test for the differences in carapace lead concentrations
(llg.g-1 wet mass) of crabs from the two localities, Jonkershoek (1) and SFW (SF).
n Mean SD Range z-value p-value
Carapace (1) 19 17.5 17.23 0.73-55.08vs -0.829 >0.05
Carapace (SF) 20 29.03 73.0 1.95-329.63
Table 8.9: Results of the Mann-Whitney test for the differences III whole crab lead
concentrations (llg.g-1 wet mass) of males and females.
n Mean SD Range z-value p-value
Females 40 15.74 17.6 1.16-66.44vs -0.037 >0.05
Males 49 24.39 34.24 1.23-164.7
Table 8.10: Results of Student's t-test for the differences in mean digestive gland and gonad lead
concentration (llg.g- 1 wet mass) of male (m) and female (f) crabs (Mean logarithms of the tissue
lead concentrations used to calculate the t-value).
n Mean SD Range t-value p-value
Dig.gland (f) 12 2.63 2.78 0.0-7.8vs -2.28 <0.05
Dig.gland (m) 15 12,29 16.87 0.4-63.2
Ovaries 11 32.47 41.85 0.1-125.0vs -0.31 >0.05
Testes 10 22.51 23.15 0.9-69.4
Table 8.11: Results of the Mann-Whitney test for the differences in carapace, muscle and gill
lead concentrations (llg.g-1 wet mass) of male (m) and female (f) crabs.
n Mean SD Range z-vallle p-value
Carapace (f) 15 16.26 16.42 2.64-51.28vs -0.289 >0.05
Carapace (m) 18 35.67 76.07 1.95-329.63
Muscle (f) 11 15.89 25.17 0.9-85.7vs -0.261 >0.05
Muscle (m) 13 22.3 26.76 0,8-71.43
Gills (f) 11 6,27 8.39 0.0-25.02vs -1.425 >0.05
Gills (m) 14 19.36 30.12 0.9-102.94

123
Table 8.12: Results of the Mann-Whitney test for the seasonal differences in whole crab lead
concentrations (llg.g-1 wet mass).
n Mean SD Range z-value p-value
Summer 49 10.78 13.97 1.62-66.44vs 2.597 <0.05
Autumn 16 39.25 35.89 1.25-99.61
Summer 49 10.78 13.97 1.62-66.44vs -1.935 =0.05
Winter 21 21.1 37.95 0.78-164.7
Summer 49 10.78 13.97 1.62-66.44vs -1.309 >0.05
Spring 25 13.82 18.23 1.16-64.83
Autumn 16 39.25 35.89 1.25-99.61vs -2.652 <0.05
Winter 21 21.1 37.95 0.78-164.7
Autumn 16 39.25 35.89 1.25-99.61vs -2.713 <0.05
Spring 25 13.82 18.23 1.16-64.83
Winter 21 21.1 . 37.95 0.78-164.7vs 1.434 >0.05
Spring 25 13.82 18.23 1.16-64.83

124
Table 8.13: Results of the Mann-Whitney test for the seasonal differences in crab carapace lead
concentrations (llg.g-1 wet mass).
n Mean SD Range z-value p-value
Summer 18 8.82 6.24 3.08-21.83vs 0.112 >0.05
Autumn 5 15.0 15.97 1.03-35.16
Summer 18 8.82 6.24 3.08-21.83vs 1.168 >0.05
Winter 6 81.02 124.64 0.73-329.63
Summer 18 8.82 6.24 3.08-21.83vs -0.672 >0.05
Spring 10 19.32 21.77 1.95-55.08
Autumn 5 15.0 15.97 1.03-35.16vs 0.822 >0.05
Winter . 6 81.02 124.64 0.73-329.63
Autumn 5 ·15.0 15.97 1.03-35.16vs 0.184 >0.05
Spring 10 19.32 21.77 1.95-55.08
Winter 6 81.02 124.64 0.73-329.63vs -0.706 >0.05
Spring 10 19.32 21.77 1.95-55.08

125
Table 8.14: Results of the Mann-Whitney test for differences in crab muscle lead concentrations
(llg.g-1 wet mass) of summer and the other seasons.
n Mean SD Range z-value p-value
Summer 15 16.15 27.23 0.8-85.7vs 0.0 >0.05
Autumn 4 6.55 6.55 0.6-12.89
Summer 15 16.15 27.23 0.8-85.7vs 0.751 >0.05
Winter 4 29.43 31.42 0.4-71.43
Summer 15 16.15 27.23 0.8-85.7vs 0.974 >0.05
Spring 6 21.86 23.64 0.3-63.63
Table 8.15: Results of Student's t-test for differences in mean crab muscle lead concentration
(llg.g-1 wet mass) of autumn, winter and spring (Mean logarithms of seasonal lead
concentrations used to calculate the t-value).
n Mean SD Range t-value p-value
Autumn 4 6.55 6.55 0.6-12.89vs -0.83 >0.05
Winter 4 29.43 31.42 0.4-71.43
Autumn 4 6.55 6.55 0.6-12.89vs -0.93 >0.05
Spring 6 21.86 23.64 0.3-63.63
Winter 4 29.43 31.42 0.4-71.43vs 0.Q7 >0.05
Spring 6 21.86 23.64 0.3-63.63
Table 8.16: Results of the Mann-Whitney test for differences in crab gill lead concentrations
(llg.g- 1 wet mass) of summer and the other seasons.
n Mean SD Range z-value p-value
Summer 15 5.89 7.65 0.9-26.9vs 1.665 >0.05
Autumn 3 39.65 54.81 8.0-102.94
Summer 15 5.89 7.65 0.9-26.9vs 2.02 <0.05
Winter 3 26.87 I 19.3 8.56-47.02
Summer 15 5.89 7.65 0.9-26.9vs 0.0 >0.05
Spring 5 15.78 25.89 0.0-61.4
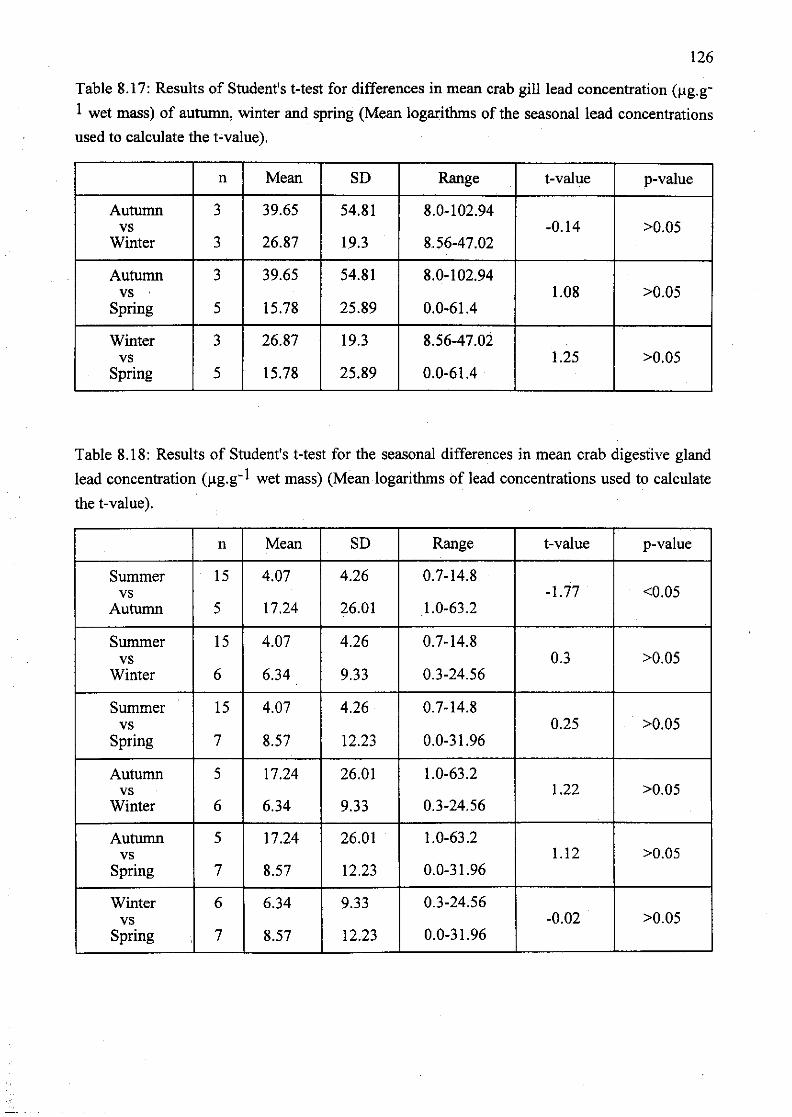
126
Table 8.17: Results of Student's t-test for differences in mean crab gill lead concentration (Ilg.g
I wet mass) of autumn, winter and spring (Mean logarithms of the seasonal lead concentrations
used to calculate the t-value).
n Mean SD Range t-value p-value
Autumn 3 39.65 54.81 8.0-102.94vs -0.14 >0.05
Winter 3 26.87 19.3 8.56-47.02
Autumn 3 39.65 54.81 8.0-102.94vs 1.08 >0.05
Spring 5 15.78 25.89 0.0-61.4
Winter 3 26.87 19.3 8.56-47.02vs 1.25 >0.05
Spring 5 15.78 25.89 0.0-61.4
Table 8.18: Results of Student's t-test for the seasonal differences in mean crab digestive gland
lead concentration (llg.g-1 wet mass) (Mean logarithms of lead concentrations used to calculate
the t-value).
n Mean SD Range t-value p-value
Summer 15 4.07 4.26 0.7-14.8vs -1.77 <0.05
Autumn 5 17.24 26.01 1.0-63.2
Summer 15 4.07 4.26 0.7-14.8vs 0.3 >0.05
Winter 6 6.34 9.33 0.3-24.56
Summer.
15 4.07 4.26 0.7-14.8vs 0.25 >0.05
Spring 7 8.57 12.23 0.0-31.96
Autumn 5 17.24 26.01 1.0-63.2vs 1.22 >0.05
Winter 6 6.34 9.33 0.3-24.56
Autumn 5 17.24 26.01 1.0-63.2vs 1.12 >0.05
Spring 7 8.57 12.23 0.0-31.96
Winter 6 6.34 9.33 0.3-24.56vs -0.02 >0.05
Spring 7 8.57 12.23 0.0-31.96

127
Table 8.19: Results of Student's t-test for the seasonal differences in mean crab gonad lead
concentration (I!g.g-I wet mass) (Mean logarithms of the lead concentrations used to calculate
the t-value).
n Mean SD Range t-value p-value
Summer 13 20.59 34.64 0.1-125.0vs 0.05 >0.05
Autumn 4 16.39 18.04 0.8-34.8
Summer 13 20.59 34.64 0.1-125.0vs 0.09 >0.05
Winter 4 29.01 40.83 0.2-87.39
Summer 13 20.59 34.64 0.1-125.0vs -0.47 >0.05
Spring 4 34.17 36.5 0.43-69.4
Autumn 4 16.39 18.04 0.8-34.8vs 0.03 >0.05
Winter 4 29.01 40.83 0.2-87.39
Autumn 4 16.39 18.04 0.8-34.8vs -0.38 >0.05
Spring 4 34.17 36.5 0.43-69.4
Winter 4 29.01 40.83 0.2-87.39vs -0.36 >0.05
Spring 4 34.17 36.5 0.43-69.4
Table 8.20: Results of the Mann-Whitney test for differences in whole crab (I!g.g-I wet mass)
and water lead concentrations (mg.!-I) at each locality: Jonkershoek (J) and SFW (S), as well as
the bioconcentration factor (BCFw) calculated for whole crabs (z = z-value, p = p-value).
Mean SD Range.
BCFwn z p
Water (J) 8 0.03 0.02 0.01-0.06vs 4.004 <0.05 528.0Whole crab (J) 60 15.84 19.8 0.78-75.62
Water (S) 8 0.04 0.03 0.02-0.08vs 3.966 <0.05 487.25Whole crab (S 51 19.49 32.36 1.16-164.7

128
Table 8.21: Results of Student's t-test for differences in mean crab tissue and carapace (lJg.g- 1
wet mass), and water lead concentration (mg.!-I) at each locality, as well as the bioconcentration
factor (BCFw) calculated for all tissues and the carapace (Dig.gland = digestive gland; t = t
value, p = p-value).
JONKERSHOEK
n Mean SD Range t p BCFw
Water 8 0.03 0.02 0.01-0.06
vs Carapace 19 17.5 17.23 0.73-55.08 -12.73 <0.05 583.33
vsMuscie 16 14.15 18.98 0.4-63.63 -8.91 <0.05 471.67
vs Dig.gland 18 5.72 8.42 0.0-31.96 -8.44 <0.05 190.67
vs Gills 14 9.52 16.51 0.0-61.4 -8.62 <0.05 317.33
vs Gonads 14 19.46 23.6. 0.2-69.4 -8.17 <0.05 648.67
SFW
n Mean SD Range t p BCFw
Water 8 0.04 0.03 0.02-0.08
vs Muscle 13 22.38 31.04 0.3-85.7 -7.27 <0.05 559.5
vs Dig.gland 15 9.49 16.12 0.2-63.2 -8.18 <0.05 237.25
vs Gills 12 19.46 29.45 0.9-102.94 -9.19 <0.05 486.5
vs Gonads 11 28.5 41.86 0.1-125.0 -6.29 <0.05 712.5
Table 8.22: Results of the Mann-Whitney test for differences in crab carapace (lJg.g- I wet mass)
and water lead concentrations (mg.!-I) from SFW, as well as the bioconcentration factor
(BCFw) calculated for th,e carapace (z =z-value, p =p-value).
n Mean SD Range z p BCFw
Water 8 0.04 0.03 0.02-0.08vs 3.625 <0.05 725.75
Carapace 20 29.03 73.0 1.95-329.63

129
Table 8.23: Results of the Mann-Whitney test for the differences in lead concentrations (lJg.g-1
wet mass) of whole crabs and sediments from the two localities, Jonkershoek (1) and SFW (S),
as well as the bioconcentration factor (BCFs) calculated for whole crabs (z = z-value, p = p
value).
n Mean SD Range z p BCFs
Sediment (1) 8 4.38 2.96 1.0-8.35vs 1.149 >0.05 3.62
Whole crab (1) 60 15.84 19.8 0.78-75.62
Sediment (S) 8 5.81 4.35 1.17-12.52vs 0.481 >0.05 3.35
Whole crab (S) 51 19.49 32.36 1.16-164.7
Table 8.24: Results of Student's t-test for differences in mean lead concentration (lJg.g- I wet
mass) of the sediments and crab tissues at each locality: Jonkershoek and SFW, as well as the
bioconcentration factor (BCFs) calculated for all tissues (Dig.gland = digestive gland; t = t
value, p = p-value).
JONKERSHOEK
n Mean SD Range t p BCFs
Sediment 8 4.38 2.96 1.0-8.35
vs Muscle 16 14.15 18.98 0.4-63.63 -0.69 >0.05 3.23
vs Dig.gland 18 5.72 . 8.52 0.0-31.96 0.73 >0.05 1.31
vs Gills 14 9.52 16.51 0.0-61.4 -0.00 >0.05 2.17
vs Gonads 14 19.46 23.6 0.2-69.4 -0.87 >0.05 4.44
SFW
n Mean SD Range t p BCFs
Sediment 8 5.81 4.35 1.17-12.52
vs Muscle 13 22.38 31.04 0.3-85.7 -0.43 >0.05 3.85
vs Dig.gland 15 9.49 16.12 0.2-63.2 0.27 >0.05 1.63
vs Gills 12 19.46 29.45 0.9-102.94 -0.88 >0.05 3.35
vs Gonads 11 28.5 41.86 0.1-125.0 -0.42 >0.05 4.91

130
Table 8.25: Results of the Mann-Whitney test for differences in lead concentrations (Jlg.g- I wet
mass) of crab carapace and sediment from Jonkershoek (J) and SFW (S), as well as the
bioconcentration factor (BCFs) calculated for the carapace (z =z-value, p =p-value).
n Mean SD Range z p BCFs
Sediment (J) 8 4.38 2.96 1.0-8.35vs 1.495 >0.05 4.0
Carapace (J) 20 17.5 17.23 0.73-55.08
Sediment (S) 8 5.81 4.35 1.1 7-12.52vs 0.518 >0.05 5.0
Carapace (S) 20 29.03 73.0 1.95-329.63

(a)
Concentration (lIg/g wet mass)
(58.78)
r- J:~~~rshoek ~ SFW I/
SFW
(32.36)
(19.8)
Jonkershoek
5
o
10
15
20
//25 '
LOCALITIES large: )41 mm carapace width; Medium:between 21 and 40 mm carapace width;Small: <20 mm carapace width
Figures 8(a)-(b): Mean lead concentration in whole crabs (a)and various size classes (b) from both localities (SD in parenthesis).
t.>

iI
(c)
Concentration (I)g/g wet mass)/1 I
30 - 35 -
(d)
Concentration (I)g/g wet mass)
Gonads
(53.28)
25 .
20
15
10
5
oCarapace Muscle Dlg.gland Gills
TISSUES
Jonkershoek and SFW data pooled
(32.45)
Gonads
30
25
20
15
10
5
oCarapace Muscle Dig.gland Gills
TISSUES
[ _ Jonkershoek ~ SF"" I
(41.86)
Figures 8(c)-(d): Mean lead concentration in carapace andtissues of P. perlatus from the Eerste River (SO in parenthesis).
I
wtv

(.): WHOLE CRABS (I): CARAPACE (g): MUSCLE
Cone.nlr.llon ltlg/g wet m...} Conellntratlon (j.lII/g _I mau) Conellntr.non 6!1iI/1il _t .....)
60 100 36
Summllr
(36aQ)
AUlumn Winter Spring
80
80
.0
'0
Summar Autumn
(124.64)
Winter Sprlnll
,.
Summer Aulumn
(31.42)
Wlntar SprinG
SEASON SEASON SEASON
(h): DIGESTIVE GLAND (I): GILLS (j): GONADS IOyarl.. lind t••t... pooled)
Conellntration WljJ/g will maaa) Concentration 11J1l/1i _I Ill".) Conellnlrallon (j.lII/O _I ,....I
'0 60 .0
SEASON
(:36.5)
SpringWlntllrAul ...mnS.....III.rSpringAlllumn Winter
SEASON
{ti481)
SummerSpringAutumn Winter
SEASON
Summllr
Figures 8(e)-(j): Mean seasonal lead concentration inwhole crabs, carapace and tissues of P. perlatu8
(Jonkershoek and SFW data pooled; SD in parenthesis).-ww

134
Discussion
Comparisons of the mean wet mass lead concentrations determined for Potamonautes perlatus
(Table 8.3; Figure 8(c)), with those found by Steenkamp (1992) and du Preez et aI. (1993) for P.
warreni from polluted freshwater ecosystems, were made. Steenkamp (1992) found mean Pb
concentrations of 8.3±7.3 to 30.0±44.l Ilg.g- I, 7.0±7.0 to 21.0±28.2 Ilg.g- I , 6A±6.3 to
29.8±161.2 Ilg.g- I , 6.7±7.9 to 38.9±58.5 Ilg.g-1 and 8.0±16.3 to 50.5±67.7 Ilg.g- 1 in the
digestive gland, muscles, gills, gonads and carapace respectively. The results of du Preez et aI.
(1993) forthe carapace and muscle tissue, differed from those of Steenkamp (1992). The former
found mean Pb concentrations of 86.6±73.4 Ilg.g- 1 wet mass in the carapace and 3.0±IA Ilg.g- 1
wet mass in the muscles. In comparison with Steenkamp's results, the mean Pb concentration in
the digestive gland of P. perlatus was found to be relatively low, whilst the concentrations in the
carapace and remaining tissues compared well. Comparisons with the results of du Preez et al.
showed that the mean Pb concentrations in the carapace and muscles of P. perlatus were
comparatively very low and high respectively.
When the dry mass whole crab lead concentrations of P. perlatus (4.3±5.65 Ilg.g-1 for
Jonkershoek and 5.49±9.27 Ilg.g-1 for SFW), were compared with the findings of Van Eeden &
Schoonbee (1991) (2.0±0.06 to 13.9±0.06Ilg.g- I), who studied P. warreni from a mine-polluted
wetland, it was found that the mean concentrations in P. perlatus compared favourably, but that
the individual variations in Pb concentrations were greater and the highest whole crab
concentration from each population (22.83 and 52.5 Ilg.g-1 dry mass for Jonkershoek and SFW
respectively) was higher than in P. warreni (13.96 Ilg.g-1 dry mass). This in itself is a cause for
concern and indicates an accumulation of lead by P. perlatus. The theory of Pb accumulation in
this species is supported by the high BCFw's and relatively high BFCs's found for whole crabs
(Tables 8.20 and 8.23), tissues and carapace (Tables 8.21,8.22,8.24 and 8.25) at both localities.
Furthermore, comparisons of data from the two localities yielded no statistically significant
differences between whole crab, tissue, carapace, water or sediment Pb concentrations (Tables
8.20-8.25), indicating that accumulation of Pb took place at both localities.
It is therefore concluded that P. perlatus is not able to regulate the concentrations of Pb in its
body and that accumulation takes place, even in aquatic environments where the Pb
concentrations in the water and sediments are low and not considered a problem (see Chapter 4).
An investigation into the distribution of Pb in P. perlatus showed that the carapace and gonads
contained the highest lead concentrations, whilst the digestive gland contained the lowest
concentrations (Tables 8.3 and 8.4). These results were also substantiated by the higher BCFw's
and BCFs's determined for the carapace in SFW and the gonads in Jonkershoek (Tables 8.21,
8.22. 8.24 and 8.25). Similarly, Steenkamp (1992) and du Preez et al. (1993) found the highest

II
135
Pb concentrations in the carapace of P. warreni, whilst Tulasi et al. (1987) observed the highest
concentrations in the haemolymph and gills of Barytelphusa guerini.
Anderson & Brower (1978) suggested that Pb may be incorporated in the exoskeleton, so that
this becomes a potential sink for Pb. This theory could explain the higher Pb concentrations in
the carapace of P. perlatus. It is important to note that, due to periodic moulting, soft tissue
burdens of this metal would be eliminated and long term accumulation would not occur
(Anderson & Brower, 1978). Tulasi et al. (1987) reported that Pb is mostly absorbed through the
gills an" distributed via the haemolymph to the internal organs (and exoskeleton).
Contamination of the internal organs by the haemolymph might explain the relatively high mean
concentrations observed in the gonads, compared to the other tissues. Though the Pb
concentrations in the digestive gland of P. perlatus were found to be relatively low, Pb
concentrations in the digestive glands of decapods in general may be expected to increase
dramatically upon exposure to this metal: Roldan & Shivers (1987) exposed crayfish,
Orconectes propinquus, to low doses of lead acetate, which resulted in the accumulation of fine
electron-dense particles, possibly lead, in the R-cells of the digestive gland. They stated that this
mechanism prevents contact of excess metal with vital cell constituents and effectively detoxifies
the metal until it is eliminated or passed on to other tissues.
It is concluded that in P. perlatus, the carapace is the most important Pb storage site, with the
gonads being the second most important site. The remaining three tissue types do not seem to
vary greatly in their contributions tu Pb storage.
The possible relationship between crab body size and whole crab, tissue and carapace lead
concentrations was investigated. The reasonably strong negative correlations between whole crab
(r = -0.466), muscle, carapace, gonad and gill lead concentrations and size of crab (Table 8.2), as
well as the statistically significant difference in lead concentration between medium and small
crabs from SFW (Tables 8.1), showed that size (therefore age), can be considered to have some
influence on the uptake and distribution of lead in P. perlatus. These findings are in agreement
with those of Steenkamp (1992) and du Preez et.al. (1993) for P. warreni. The latter found that
the Pb concentrations in the digestive gland and muscles were significantly higher in immature
crabs than in mature crabs. Steenkamp (1992) concluded that younger individuals seemed to be
able to accumulate more Pb per unit weight than mature crabs. She ascribed this to the higher
metabolic rates of the smaller/younger individuals. Hill & O'Keeffe (1991) found significant
differences in the diets of large and small individuals of P. perlatus. Smaller crabs were shown
to prey significantly more on aquatic invertebrates, whilst the larger and more mature crabs
preferred vegetable material. Since it has been shown by several authors, e.g. Albers &
Camardese (1993) and Kiffney & Clements (1993) that aquatic invertebrates (e.g. insects)
accumulate heavy metals, bioaccumulation from their prey might be a plausible. explanation for
the observed higher Pbconcentrations in the smaller individuals.

r,136
Investigations into the influence of gender on the whole crab, tissue and carapace Pb showed
only one significant difference, namely between male and female digestive gland concentrations
(Tables 8.9-8.11). This observed general lack of difference between the two genders agrees with
the findings of Anderson & Brower (1978) for the crayfish Orconectes virilis. Steenkamp (1992)
also found only one difference in Pb concentrations between male and female Potamonautes
warreni, namely a significantly higher concentration in the mature ovaries than in the testes. It is
therefore concluded that although gender may affect the concentrations of Pb in the digestive
gland, it does not have a significant influence, generally, on lead uptake and distribution in P.
perlatus..
It was ascertained, through the observed statistically significant differences in seasonal whole
crab Pb concentrations, as well as the few seasonal variations in gill and digestive gland Pb
concentrations (Tables 8.12-8.19), that seasonality can be considered an influencing factor in Pb
uptake and distribution. Whereas P. perlatus exhibited autumn peaks in the Pb content of whole
crabs, gills and digestive gland, winter peaks in carapace and muscle Pb content and a spring
peak in gonad Pb content (Figures 8(e)-G)), Steenkamp (1992) reported that P. warreni
exhibited Pb peaks in tissues, only in the warmer months. Although the peaks in tissue and
carapace Pb in P. perlatus did not follow the Pb peaks in water and sediment Pb closely (Figures
4(c)-(1)), the lowest Pb concentrations were found in summer for most of the tissues as well as
for the water and sediments. This may indicate a relationship between environmental Pb
concentrations and the concentrations in P. perlatus. The clear seasonal variations in whole crab
Pb concentrations are also indications that lead is accumulated periodically, to some extent, in
this species. However, it also implies that long term Pb accumulation does not occur and that
excesses of the metal are excreted periodically, probably through moulting (Anderson & Brower,
1978).
Finally, although large intraspecific V/:lriation in Pb concentrations was observed for P. perlatus
in the Eerste River, and although the seasonal fluctuations in environmental Pb were not
accurately reflected in the crab, it is concluded from the preliminary results, that this species in
the Eerste River can be considered as a potential monitor of environmental Pb pollution. This is
based entirely on the fact that Pb accumulation was shown to occur at both localities. It must,
however, be remembered that long term Pb accumulation probably does not occur, due to the
carapace being an important store of Pb and periodic moulting taking place. This in itself
suggests that P. perlatus might in fact not be a suitable monitor. Steenkamp (1992). also
concluded that P. warreni may be useful as a potential indicator of Pb pollution but that there is
no guarantee diat environmental Pb concentrations will be accurately reflected by the tissue
concentrations. However, final conclusions can only be made after further intensive research on
especially the accumulation and distribution of Pb in P.perlatus, has been done.
---000---

137
CHAPTER 9
CONCENTRATIONS OF CADMIUM IN THE FRESHWATER CRAB,POTAMONAUTES PERLATUS
Introduction·
Cadmium displays chemical similarity to and occurs together with zinc. It is contained in many
inorganic compounds, of which several are quite soluble in water, e.g. the acetates, chlorides and
sulfates. The common cadmium minerals are greenockite (hexagonal CdS), hawleyite (cubic
CdS), otavite (CdC03), monteponite (CdO) and cadmoselite (hexagonal CdSe).
Cadmium is obtained as a by-product from the refining of zinc and other metals, particularly
copper and lead. The world production of cadmium in 1970 was 16 000 tons. It had increased
yearly by 14% during the preceding five years (Forstner, 1980 and Friberg et al., 1979). This
metal is used in a number of industrial processes, of which electroplating is the most important.
Other uses include in copper-cadmium alloys, for the production of fungicides, in nickel
cadmium batteries and as a stabilizer in PVC. Of these major industries employing cadmium,
electroplating shops, pigment plants and producers of alloys and batteries can be expected to be
major sources of cadmium pollution (Forstner, 1980; Friberg et al., 1979; Moore &
Ramamoorthy, 1984 and Richardson & Gangolli, 1993).
Cadmium can reach riverine ecosystems via industrial and, to a lesser extent, agricultural runoff
and pose a great threat to aquatic fauna, since it is known to be bioaccumulated and concentrated
in the food chain (Richardson & Gangolli, 1993). Cadmium is regarded as one of the most toxic
metals and may cause various symptoms and illnesses when taken in, either via the respiratory or
the digestive system, e.g. nausea, vomiting, osteomalacia, anemia and disturbed liver function. It
has been shown thatinjections of single doses of soluble cadmium salts (1-3 mg/kg body weight)
give rise to dramatic effects in the testicles of several experimental animal species. Effects on
non-ovulating ovaries of females as well as on sensory ganglia have also been reported. All these
organs undergo complete destruction within hours after injection, without evident damage to
other organs. It is also known that ingestion of highly contaminated food results in acute
gastrointestinal effects (Forstner, 1980 and Friberg et aI., 1979).
There are several factors which may influence the toxicity and bioavailability of cadmium in
aquatic environments: crustaceans appear to be the most sensitive group to cadmium levels in the
water, followed by molluscs and polychaetes. It also seems that, depending on the species,
cadmium concentrations in specific organs may either increase or decrease with temperature and
reproductive activity.
138
Cd-Zn interactions are thought to be of special importance in cadmium toxicity. A biochemical
explanation is offered by the replacement of zinc by cadmium in zinc-dependent enzymes. The
toxicity of cadmium is also affected by calcium levels: the latter has an antagonistic effect on the
toxicity of the former (Friberg et aI., 1979 and Moore & Ramamoorthy, 1984). Other
influencing factors include water pH, hardness, salinity, temperature and the presence of ligands
and co-existing metal cations: a lower pH increases the solubility of the metal, thus increasing its
availability, whereas high concentrations of calcium and magnesium salts reduce cadmium
uptake. It has also been shown that an increased salinity decreases cadmium toxicity to many
estuarine ~pecies, and low temperature enhances the survival of most organisms (Rosenberg &
Costlow, 1976). Waters rich in humic compounds contain the lowest Cd levels (Galvin, 1996;
Moore & Ramamoorthy, 1984 and Richardson & Gangolli, 1993). Rainbow & Scott (1979) and
Lyon (1984) illustrated a possible Cd detoxification mechanism, through Cd-binding proteins in
the digestive glands of the crab Carcinus maenas and the crayfish Austropotamobius pallipes
respectively.
Studies on the accumulation of cadmium by freshwater decapod crustaceans has as yet been
neglected. The only known studies to date are those undertaken by Anderson & Brower (1978)
and France (1987), on the crayfish Orconectes virilis and Lyon (1984) on the crayfish
Austropotamobius pallipes.
Materials and Methods
All samples were prepared, tested and statistically analysed according to the method described in
Chapter 3.
Results
In all cases only the cadmium concentrations per gram wet mass were used for statistical
analysis. Crabs showed large individual variation in whole body, tissue as well as carapace
cadmium concentrations. This was an important consideration in the interpretation of the
statistical results.
The relationship between crab size and whole crab cadmium concentration
In order to investigate the possible relationship between whole crab cadmium concentrations and
the size~, of the crabs, the data from Ionkershoek and SFW were pooled. The carapace widths of

139
the crabs, in decreasing order, were compared with the respective cadmium concentrations and
the correlation coefficient (r) thereof, calculated. With 53 degrees offreedom and an r2-value of
27.23%, an r-value of -0.522 was obtained. This indicated a reasonably strong negative
correlation between size of crab and the concentration of cadmium in the body: as size
decreased, so did the concentrations increase (Figure 9(b)).
Differences in cadmium concentrations of the various size classes at each locality
Since the whole crab concentration data for large, medium and small-sized crabs from each
locality were not normally distributed, the cadmium concentrations for each size class were
logarithmically transformed. Apart from the large and small size classes from SFW, all
transformed data sets also failed the normal probability test, therefore the Mann-Whitney
nonparametric test was used to test for statistically significant differences (p<0.05) (Table 9.1).
Differences were found between cadmium concentrations in large and small, and in medium and
small crabs from SFW. The small size class had the highest mean cadmium concentration
(l6.65±9.97 Ilg.g-1 wet mass) and large sized crabs the lowest (2.08±0.82 Ilg.g-1 wet mass).
The relationship between crab size, and tissue and carapace cadmium concentration
In order to investigate the possible relationship between crab size and cadmium concentration in
the selected tissues, namely muscle tissue, digestive gland, gills and gonads, as well as the
carapace, the data from Ionkershoek and SFW were pooled, after which the carapace widths of
crabs, in decreasing order, were compared with the respective tissue or carapace cadmium
concentration. Table 9.2 shows the r-values calculated for each tissue and for the carapace.
Reasonably strong negative correlations were found between crab size and the cadmium
concentration in the carapace and all but one of the four tissue types (muscle). The cadmium
concentration in the latter proved to be poorly negatively correlated with the size of the crabs.
Differences in cadmium concentrations of the various selected tissues and the carapace
The cadmium concentration values for the selected tissues and the carapace of crabs from
Ionkershoek and SFW were pooled, in order to determine whether statistically significant
differences (p<0.05) existed between the various tissues and the carapace. Since the data were
not normally distributed, the mean logarithms of the tissue and carapace cadmium concentrations
were used in Student's t-test. The logarithmically transformed data sets for the carapace and
muscle tissue, however, also failed to provide a normal distribution, thus the Mann-Whitney test
was performed in order to compare these the carapace and muscles with the other three tissue
types. The respective mean concentrationsimd standard deviations are tabulated in Table 9.3.

140
Tables 9.4 and 9.5 show the results of the t-test and Mann-Whitney test perfonned on the tissue
and carapace concentrations.
When comparing values obtained for the selected tissues and the carapace, significant
differences in cadmium concentrations were found for muscle and carapace, digestive gland and
gonads, digestive gland and carapace, and- gills and carapace. The gonads showed the highest
mean concentration (5.29±6.46 Ilg.g-1 wet mass), and the digestive gland the lowest (2.21±3.37
Ilg.g-1 wet mass) (Figure 9(c)).
Differences in cadmium concentrations of whole crabs from Jonkershoek and SFW
(a) Differences in whole crab concentrations
The result of the Mann-Whitney test perfonned on the whole crab cadmium concentrations from
Jonkershoek and SFW are shown in Table 9.6.
The highest mean cadmium concentration (5.04±6.26 Ilg.g- 1 wet mass), occurred in crabs from
SFW (Figure 9(a)), but a z-value of 0.896 indicated that there was no statistically significant
difference (p>0.05) between whole crab cadmium concentrations of the two localities.
(a)(i) Differences in whole crab concentrations of the various size classes
Through comparisons of the whole crab cadmium concentration values between large-sized
crabs and between medium-sized crabs, as well as a comparison of the mean logarithms of
whole crab cadmium concentrations between small-sized crabs from Jonkershoek and SFW, it
was established that a statistically significant difference (p<0.05) existed between the small size
class crabs from the two localities. The small crabs from SFW had the highest mean cadmium
concentration of the two localities (l6.65±9.97 Ilg.g- l wet mass) (Tables 9.7 and 9.8).
(b) Differences in concentration values for the selected tissues and the carapace
The mean cadmium concentration of the digestive gland, gills and gonads of crabs from
Jonkershoek and SFW were compared using of Student's t-test, and tabulated in Table 9.9, while
the cadmium concentrations of the carapace and muscle tissue of crabs from the two localities
were compared by means of the Mann-Whitney test, and recorded in Table 9.10.
Although the mean Cd concentrations in all the tissues and the carapace were higher in crabs
collected from SFW (Figure 9(d)), no statistically significant differences in the cadmium
concentrations of any of the tissues or the carapace were found between the two localities.

141
Differences in cadmium concentrations of males and females
In order to determine whether statistically significant differences (p<O.05) existed between the
mean whole crab, tissue and carapace cadmium concentrations of males and females, the data
obtained from 10nkershoek and SFW were pooled for each sex. In the case of the muscle tissue,
the data for both sexes failed the normal probability test, therefore the Mann-Whitney test was
performed.
(a) Differences in whole crab concentrations
Table 9.11 shows the result of Student's t-test, performed on the mean logarithms of the whole
crab cadmium concentrations of males and females of Potamonautes perlatus. The highest mean
cadmium concentration was found in males (5,48±6.13 f.lg.g-l wet mass) but no statistically
significant difference (p>O.05) existed between the two genders.
(b) Differences in concentration values for the selected tissues and the carapace
Although males exhibited the highest mean cadmium concentration in the carapace and all but
one of the four tissue types (gonads), a significant difference was found only in one case, namely
between the digestive gland cadmium concentrations of males and females (Tables 9.12 and
9.13).
Seasonal variations in cadmium concentrations
The cadmium concentrations in whole crabs, selected tissues and carapace from the different
seasons were tested for statistically significant differences (p<O.05). In each instance, the data
for crabs collected at 10nkershoek and SFW were pooled and these then tested for normality.
None of the data sets were normally distributed and were thus logarithmically transformed. The
transformed whole crab data also failed the normal probability test, therefore the Mann-Whitney
test was performed.
(a) Seasonal differences in whole crab cadmium concentrations
The Mann-Whitney nonparametric test produced no statistically significant differences (p>O.05)
between whole crab cadmium concentrations in the four seasons (Table 9.14). The highest mean
whole crab cadmium concentration (5.77±5.92 f.lg.g- 1 wet mass), was observed for autumn,
whereas summer showed the lowest mean (3,45±3.09 f.lg.g- 1 wet mass) (Figure 9(e)).
(b) Seasonal differences in tissue and carapace cadmium concentrations
1. Carapace
A statistically significant difference (p<O.05) between carapace cadmium concentrations In
summer and autumn was found. Data for winter showed the highest mean cadmium
142
concentration (7.08±6.7 J.lg.g- l wet mass) and autumn the lowest (2.72±1.42 J.lg.g- 1 wet mass)
(Figure 9(£)). The results of the t-test, performed on the mean logarithms of the seasonal
cadmium concentrations, are tabulated in Table 9.15.
2. Muscle tissue
The highest mean cadmium concentration (4.31±3.4 J.lg.g- I wet mass) occurred in winter,
whereas in summer the mean concentration was the lowest (1.8±2.08 J.lg.g- l wet mass) (Figure
9(g)). Through pairwise comparisons of the different seasons, it was found that a statistically
significant difference in muscle tissue cadmium concentration existed betw,:en summer and
spring (Table 9.16).
3. Gill tissue
Statistically significant differences (p<0.05) between mean gill cadmium concentrations were
found when comparing values for summer and the other three seasons. In Table 9.17 it can be
seen that the highest and lowest mean cadmium concentrations occurred in autumn (8.13±11.06
J.lg.g- l wet mass) and summer (1.74±2.25 J.lg.g- l wet mass) respectively (Figure 9(h)).
4. Digestive gland
The results of Student's t-test on the mean logarithms of the digestive gland cadmium
concentrations, ~hen comparing the different seasons, are tabulated in Table 9.18. No
statistically significant differences (p>0.05) were found between any of the four seasol}s. The
mean seasonal digestive gland cadmium concentration are shown in Figure 9(i).
5. Gonads
When the data for the ovaries and testes were pooled and tested by means of Student's t-test, no
statistically significant differences were found to occur between any of the four seasons (Table
9.19). Figure 9G) shows the mean sea~onal gonad cadmium concentration.
Differences in cadmium concentrations of whole crabs. tissues. carapace. and Eerste River water
(a) Differences in concentration values of whole crabs and water
The Mann-Whitney nonparametric test (Table 9.20) showed significant differences between the
whole crab and water cadmium concentrations in both localities, lonkershoek and SFW.
(b) Differences between concentration values of the selected tissues, carapace and water
Student's t-test was used to investigate possible significant differences between tissue and water
cadmium concentrations from the two localities (Table 9.21). In the case of the carapace and
muscle tissue from lonkershoek and the carapace from SFW, the logarithmically transformed
data sets were not normally distributed, therefore the Mann-Whitney test was performed (Table
9.22).
143
The cadmiwn concentrations in all the tissues and the carapace from both localities proved to be
significantly different (p<O.05) from the concentrations in the water.
Differences in cadmiwn concentrations of whole crabs, tissues, carapace, and sediments
(a) Differences between concentration values of whole crabs and sediments
The Mann-Whitney test, performed on the whole crab and sediment cadmiwn concentrations
from 10nkershoek and SFW, yielded statistically significant differences (p<O.05) between these
concentrations at both localities (Table 9.23).
(b) Differences between concentration values ofthe selected tissues, carapace and sediments
The mean logarithms of the tissue and carapace cadmiwn concentrations were used to test for
statistically significant differences (p<O.05) between tissue, carapace and sediment cadmiwn
concentrations at the two localities. The transformed carapace and muscle tissue data, however,
were not normally distributed, therefore the Mann-Whitney test was performed.
The data from both localities showed significant differences between the cadmiwn
concentrations of the sediment, the carapace and all tissues of crabs from 10nkershoek, and
between the concentrations in the sediment, the carapace and all but one of the tissues (muscle)
of crabs from SFW. Tables 9.24 and 9.25 list the results of Student's and the Mann-Whitney
tests respectively.

144
Table 9.1: Results of the Mann-Whitney test for differences in whole crab cadmium
concentrations (Ilg.g-I wet mass) of the various size classes at each locality.
JONKERSHOEK
n Mean SD Range z-value p-value
Large 22 2.73 2.09 0.62-6.99vs 1.242 >0.05
Medium 34 3.61 2.93 0.77-11.2
Large 22 2.73 2.09 0.62-6.99'vs 1.528 >0,05
Small 4 5.8 4.02 1.02-10.81
Medium 34 3.61 2.93 0.77-11.2vs 0.88 >0.05
Small 4 5.8 4.02 1.02-10.81
SFW
n Mean SD Range z-value p-value
Large 6 2.08 0.82 1.01-2.99vs 0.134 >0.05
Medium 39 3.72 3.73 0.49-14.6
Large 6 2.08 0.82 1.01-2.99vs 2.802 <0.05
Small 6 16.65 9.97 4.83-33.67
Medium 39 3.72 3.73 0.49-14.6vs 3.456 <0.05
Small 6 16.65 9.97 4.83-33.67
Table 9.2: R2-values calculated for sizes of crabs and selected tissue and carapace cadmium
concentrations (DF = degrees offreedom; Dig.gland = digestive gland).
DF r-value R-sq.(%)
Crab size and Muscle 27 -0.332 11.01
Crab size and Dig.gland 29 -0.406 16.52
Crab size and Gills 24 -0.454 20.62
Crab size and Gonads 23 -0.511 26.11
Crab size and Carapace 28 -0.542 29.38.
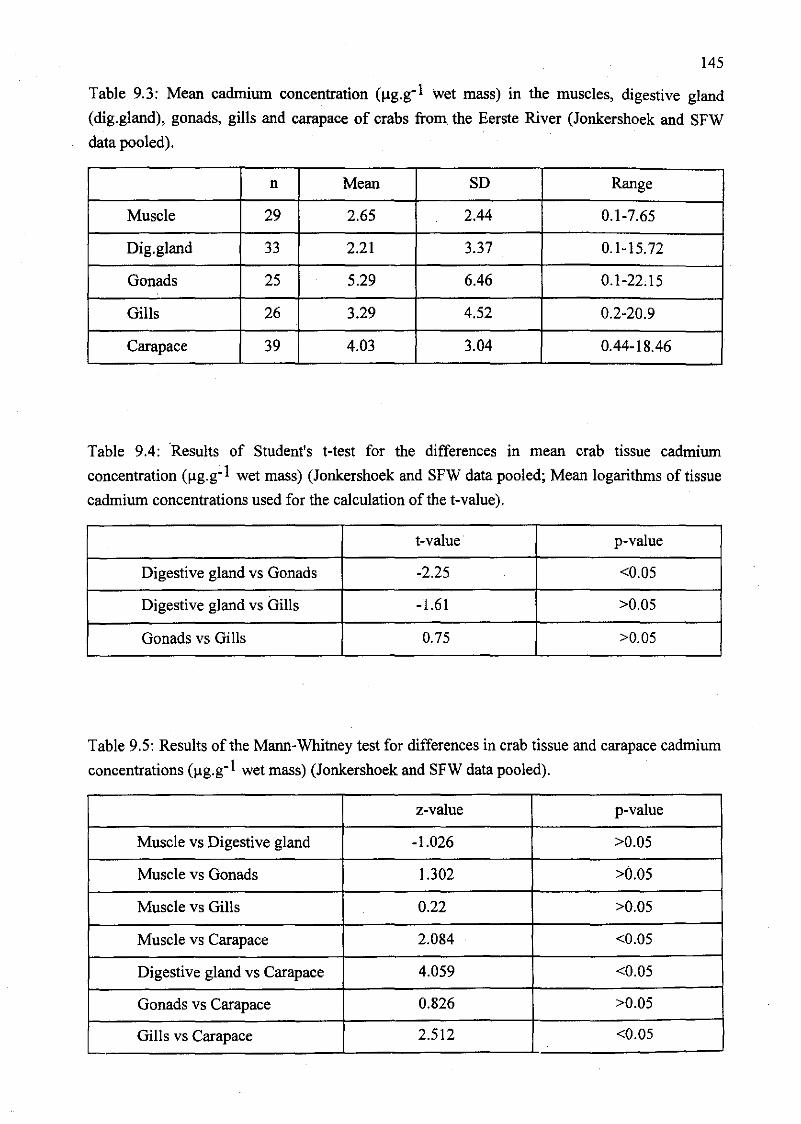
145
Table 9.3: Mean cadmium concentration (Ilg.g- l wet mass) in the muscles, digestive gland
(dig.gland), gonads, gills and carapace of crabs from. the Eerste River (Jonkershoek and SFW
data pooled).
n Mean SD Range
Muscle 29 2.65 2.44 0.1-7.65
Dig.gland 33 2.21 3.37 0.1-15.72
Gonads 25 5.29 6.46 0.1-22.15
Gills 26 3.29 4.52 0.2-20.9
Carapace 39 4.03 3.04 0.44-18.46
Table 9.4: 'Results of Student's t-test for the differences in mean crab tissue cadmium
concentration (llg.g-1 wet mass) (Jonkershoek and SFW data pooled; Mean logarithms of tissue
cadmium concentrations used for the calculation of the t-value).
t-value p-value
Digestive gland vs Gonads -2.25 <0.05
Digestive gland vs Gills -1.61 >0.05
Gonads vs Gills 0.75 >0.05
Table 9.5: Results of the Mann-Whitney test for differences in crab tissue and carapace cadmium
concentrations (llg.g-1 wet mass) (Jonkershoek and SFW data pooled).
z-value p-value
Muscle vs Digestive gland -1.026 >0.05
Muscle vs Gonads 1.302 >0.05
Muscle vs Gills 0.22 >0.05
Muscle vs Carapace 2.084 <0.05
Digestive gland vs Carapace 4.059 <0.05
Gonads vs Carapace 0.826 >0.05
Gills vs Carapace 2.512 <0.05

146
Table 9.6: Results of the Mann-Whitney test for the differences in whole crab cadmium
concentrations (fig.g- I wet mass) at Jonkershoek and SFW.
n Mean SD Range z-value p-value
Jonkershoek 60 3.43 2.79 0.62-11.2vs 0.896 >0.05
SFW 51 5.04 6.26 0.49-33.67
Table 9.7: Results of the Mann-Whitney test for the differences in whole crab cadmium
concentrations (fig.g- l wet mass) of large and medium sized crabs from Jonkershoek (J) and
SFW (S).
n Mean SD Range z-value p-value
Large (J) 22 2.73 2.09 0.62-6.99vs -0.Q28 >0.05
Large (S) 6 2.08 0.82 1.01-2.99
Medium (J) 34 3.61 2.93 0.77-11.2vs -0.194 >0.05
Medium (S) 39 3.72 3.73 0.49-14.6
Table 9.8: Results of Student's t-test for the differences in mean whole crab cadmium
concentration (llg.g-I wet mass) of small sized crabs from Jonkershoek (J) and SFW (S) (Mean
logarithms of cadmium concentrations used in the t-test).
n Mean SD Range t-value p-value
Small (J) 4 5.8 4.02 1.02-10.81vs -2.23 <0.05
Small (S) 6 16.65 9.97 4.83-33.67

147
Table 9.9: Results of Student's 'I-test for the differences in mean digestive gland, gill and gonad
cadmium concentration (llg.g-I wet mass) of crabs from Jonkershoek (1) and SFW (S) (Mean
logarithms of the tissue cadmium concentrations used in the test).
n Mean SD Range t-value p-value
Dig.g1and (1) 18 1.78 2.53 0.2-9.59vs -0.34 >0.05
Dig.gland (S) 15 2.72 4.21 0.1-15.72.
Gills (1) 14 2.81 3.43 0.3-12.28vs -0.29 >0.05
Gills (S) 12 3.85 5.65 0.2-20.9
Gonads (1) 14 3.95 3.78 0.3-12.5vs -0.01 >0.05
Gonads (S) 11 7.0 8.71 0.1-22.15
Table 9.10: Results of the Mann-Whitney test for the differences in muscle and carapace
cadmium concentrations (llg.g-1 wet mass) of crabs from Jonkershoek (1) and SFW (S).
n Mean SD Range z-vaiue p-value
Muscle (J) 16 2.56 2.19 0.2-7.05vs -0.088 >0.05
Muscle (S) 13 2.77 2.8 0.1-7.65
Carapace (J) 19 3.32 1.41 0.44-5.57vs 0.113 >0.05
Carapace (S) 20 4.71 3.95 1.9-18.46

148
Table 9.11: Results of Student's t-test for the differences in mean whole crab cadmium
concentration (llg.g-1 wet mass) of males and females (Mean logarithms of the whole crab
cadmium concentrations used to calculate the t-value).
n Mean SD Range t-value p-value
Females 40 3.79 3.04 0.86-14.6vs -0.94 >0.05
Males 49 5.48 6.13 0.49-33.67
Table 9.12: Results of Student's t-test for the differences in mean tissue and carapace cadmium
concentration (llg.g-1 wet mass) of male (m) and female (f) crabs (Mean logarithms of the tissue
and carapace cadmium concentrations used to calculate the t-value).
n Mean SD Range t-value p-value
Carapace (f) 15 3.99 1.79 2.2-8.2vs -0.29 >0.05
Carapace (m) 18 4.71 3.95 1.9-18.46
Dig.gland (f) 12 1.02 1.08 0.1-3.5vs -1.77 <0.05
Dig.gland (m) 15 3.47 4.52 0.2-15.72
Gills (f) 11 1.99 1.69 0.4-4.8 ,vs -1.42 >0.05
Gills (m) 14 4.0 5.79 0.2-20.9
Ovaries 11 6.23 7.04 0.3-20.81vs -0.04 >0.05
Testes 10 6.13 6.67 0.3-22.15
Table 9.13: Results of the Mann-Whitney test for the differences In muscle cadmium
concentrations (llg.g-1 wet mass) of male (m) and female (f) crabs.
n Mean SD Range z-value p-value
Muscle (f) 11 2.94 2.56 0.3-7.05vs -0.261 >0.05
Muscle (m) 13 2.97 2.55 0.1-7.65

149
Table 9.14: Results of the Mann-Whitney test for the seasonal differences in whole crab
cadmium concentrations (Ilg.g-I wet mass).
n Mean SD Range z-value p-value
Summer 49 3.45 3.09 0.49-14.6vs 1.728 >0.05
Autumn 16 5.77 5.92 1.1-21.34
Summer 49 3.45 3.09 0.49-'14.6vs -1.0 >0.05
Winter 21 5.24 7.72 0.62-33.67
Summer 49 3.45 3.09 0.49-14.6vs 0.731 >0.05
Spring 25 3.67 2.98 1.0-11.2
Autumn 16 5.77 5.92 1.1-21.34vs -1.794 >0.05
Winter 21 5.24 7.72 0.62-33.67
Autumn 16 5.77 5.92 1.1-21.34vs -0.842 >0.05
Spring 25 3.67 2.98 1.0-11.2
Winter 21 5.24.
7.72 0.62-33.67vs 1.5 >0.05
Spring 25 3.67 2.98 1.0-11.2

150
Table 9.15: Results of Student's t-test for the seasonal differences in mean crab carapace
cadmium concentration (~g.g-I wet mass) (Mean logarithms of the cadmium concentrations
used to calculate the t-value).
n Mean SD Range t-value p-value
Summer 18 3.86 1.48 2.34-7.47vs 1.97 <0.05
Autumn 5 2.72 1.42 0.44-4.1
Summer 18 3.86 1.48 2.34-7.47vs -0.44 >0.05
Winter 6 7.08 6.7 0.59-18.46
Summer 18 3.86 1.48 2.34-7.47vs 1.35 >0.05
Spring 10 3.16 1.04 1.9-5.13
Autumn 5 2.72 1.42 0.44-4.1vs -0.96 >0.05
Winter 6 7.08 6.7 0.59-18.46
Autumn 5 2.72 1.42 0.44-4.1vs -1.06 >0.05
Spring 10 3.16 1.04 1.9-5.13
Winter 6 7.08 6.7 0.59-18.46vs 0.79 >0.05
Spring 10 3.16 1.04 1.9-5.13
Table 9.16: Results of Student's t-test for the seasonal differences in mean crab muscle cadmium
concentration (~g.g-I wet mass) (Mean logarithms of cadmium concentrations used to calculate
the t-value).
n Mean SD Range t-value p-value
Summer 15 1.8 2.08 0.1-7.15vs -0.6 >0.05
Autumn 4 1.93 1.69 0.4-4.0
Summer 15 1.8 2.08 0.1-7.15vs -1.52 >0.05
Winter 4 4.31 3.4 0.4-7.65
Summer 15 1.8 2.08 0.1-7.15vs -2.13 <0.05
Spring . 6 4.18 2.24 0.4-7.05
Autumn 4 1.93 1.69 0.4-4.0vs -0.83 >0.05
Winter 4 4.31 3.4 0.4-7.65
Autumn 4 1.93 1.69 0.4-4.0vs -1.29 >0.05
Spring 6 4.18 2.24 0.4-7.05

lSI
Winter 4 4.31 3.4 0.4-7.65vs -0.21 >0.05
Spring 6 4.18 2.24 0.4-7.05
Table 9.17: Results of Student's t-test for the seasonal differences in mean crab gill cadmium
concentration (/lg.g-l wet mass) (Mean logarithms of cadmium concentrations used to calculate
the t-value).
n Mean SD Range t-value p-value
Summer 15 1.74 2.25 0.2-7.7vs -1.96 <0.05
Autumn 3 8.13 11.06 1.4-20.9
Summer 15 1.74 2.25 0.2-7.7vs -1.96 <0.05
Winter 3 3.48 0.66 2.81-4.12
Summer 15 1.74 2.25 0.2-7.7vs -2.6 <0.05
Spring 5 4.91 4.3 1.9-12.28
Autumn 3 8.13 11.06 1.4-20.9vs 0.16 >0.05
Winter 3 3.48 0.66 2.81-4.12
Autumn 3 8.13 11.06 1.4-20.9vs 0.05 >0.05
Spring 5 4.91 4.3 1.9-12.28
Winter 3 3.48 0.66 2.81-4.12vs -0.22 >0.05
Spring 5 4.91 4.3 1.9-12.28
Table 9.18: Results of Student's t-test for the seasonal differences in mean crab digestive gland
cadmium concentration (/lg.g-1 wet mass) (Mean 10garitluns of cadmium concentrations used to
calculate the t-value).
n Mean SD Range t-value p-value
Summer 15 1.29 1.58 0.1-5.6vs -0.61 >0.05
Autumn 5 2.17 3.51 0.4-8.43
Summer 15 1.29 1.58 0.1-5.6vs -1.56 >0.05
Winter 6 4.1 5.89 0.4-15.72
Summer 15 1.29 1.58 0.1-5.6vs -0.94 >0.05
Spring 7 2.57 3.47 0.2-9.59-.-

152
Autumn 5 2.17 3.51 0.4-8.43vs -0.7 >0.05
Winter 6 4.1 5.89 0.4-15.72.
Autumn 5 2.17 3.51 0.4-8.43vs -0.21 >0.05
Spring 7 2.57 3.47 0.2-9.59
Winter 6 4.1 5.89 0.4-15.72vs 0.52 >0.05
Spring 7 2.57 3.47 0.2-9.59
Table 9.19: Results of Student's t-test for the seasonal differences in mean crab gonad cadmium
concentration (J.lg.g-1 wet mass) (Mean logarithms of cadmium concentrations used to calculate
the t-value).
n Mean SD Range t-va1ue p-va1ue
Summer 13 4.11 5.84 0.3-20.81vs 0.52 >0.05
Autumn 4 3.6 3.85 0.1-7.6
Summer 13 4.11 5.84 0.3-20.81vs , -0.72 >0.05
Winter 4 9.87 10.74 0.3-22.15
Summer 13 4.11 5.84 0.3-20.81vs -0.83 >0.05
Spring 4 6.24 5.28 0.43-12.5
Autumn 4 3.6 3.85 0.1-7.6vs -0.71 >0.05
Winter 4 9.87 10.74 0.3-22.15
Autumn 4 3.6 3.85 0.1-7.6vs -0.82 >0.05
Spring 4 6.24 5.28 0.43-12.5
Winter 4 9.87 10.74 0.3-22.15vs -0.02 >0.05
Spring 4 6.24 5.28 0.43-12.5

153
Table 9.20: Results of the Mann-Whitney test for differences in whole crab (J.lg.g- I wet mass)
and water cadmium concentrations (mg.!-I) at each locality: Jonkershoek (1) and SFW (S), as
well as the bioconcentration factor (BCFw) calculated for whole crabs (z = z-value, p = p-value).
n Mean SD Range z p BCFw
Water (1) 8 0.005 0.003 0.002-0.009vs 4.004 <0.05 686.0
Whole crab (1) 60 3.43 2.79 0.62-11.2
Water (S) 8 0.006 0.003 0.003-0.01vs 3.966 <0.05 840.0
Whole crab (S 51 5.04 6.26 0.49-33.67
Table 9.21: Results of Student's t-test for differences in mean crab tissue (J.lg.g- I wet mass) and
water cadmium concentration (mg.!-I) at each locality, as well as the bioconcentration factor
(BCFw) calculated for the tissues (Dig.gland = digestive gland; t = t-value, p = p-value).
JONKERSHOEK
n Mean SD Range t p BCFw
Water 8 0.005 0.003 0.002-0.009
vs Dig.gland 18 1.78 2.53 0.2-9.59 -12.45 <0.05 356.0
vs Gills 14 2.81 ·3.43 0.3-12.28 -13.04 <0.05 562.0
vs Gonads 14 3.95 3.78 0.3-12.5 -12.76 <0.05 790.0
SFW
n Mean SD Range t p BCFw
'Vater 8 0.006 0.003 0.D3-0m
vs Muscle 13 2.77 2.8 0.1-7.65 -9.9 <0.05 461.67
vs Dig.gland IS 2.72 4.21 0.1-15.72 -9.53 <0.05 453.33
vs Gills 12 3.85 5.65 0.2-20.9 -11.24 <0.05 641.67
vs Gonads 11 7.0 8.71 0.1-22.15 -8.89 <0.05 1166.67
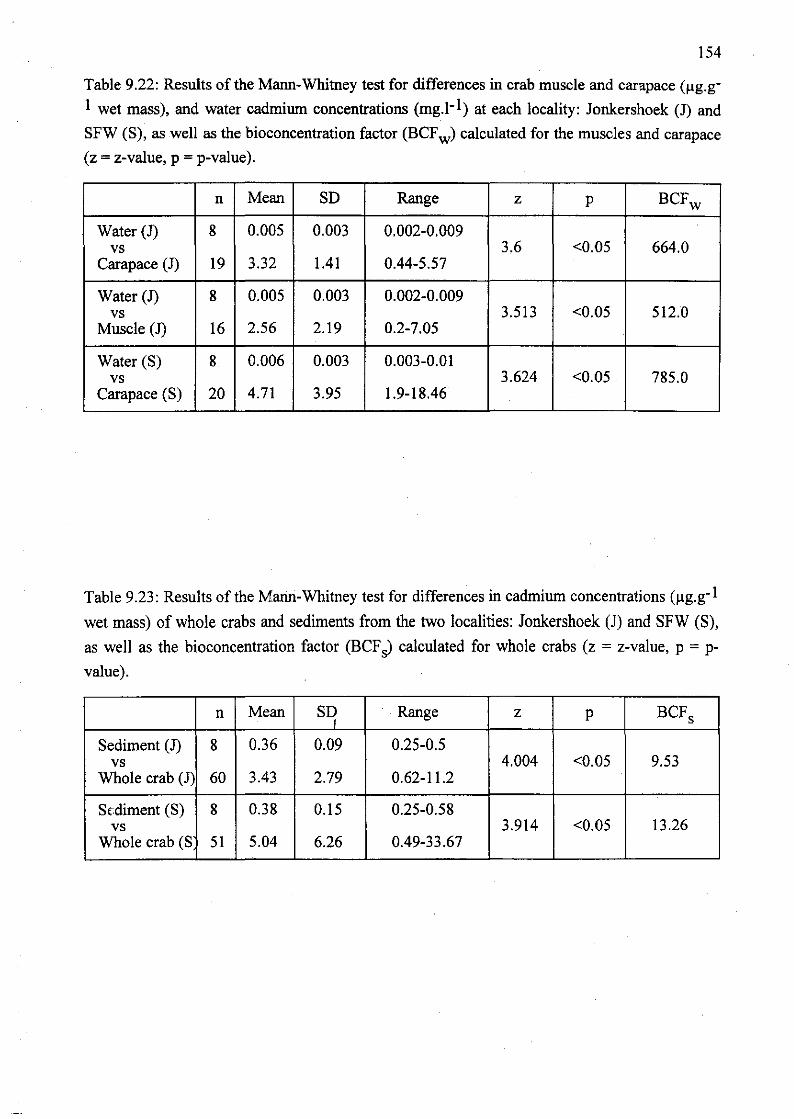
154
Table 9.22: Results of the Mann-Whitney test for differences in crab muscle and carapace (flg.g
1 wet mass), and water cadmium concentrations (mg.l- I) at each locality: Jonkershoek (J) and
SFW (S), as well as the bioconcentration factor (BCFw) calculated for the muscles and carapace
(z = z-value, p = p-value).
n Mean SD Range z p BCFw
Water (J) 8 0.005 0.003 0.002-0.009vs 3.6 <0.05 664.0
Carapace (J) 19 3.32 1.41 0.44-5.57
Water (1) 8 0.005 0.003 0.002-0.009vs 3.513 <0.05 512.0
Muscle (J) 16 2.56 2.19 0.2-7.05
Water (S) 8 0.006 0.003 0.003-0.01vs 3.624 <0.05 785.0
Carapace (S) 20 4.71 3.95 1.9-18.46
Table 9.23: Results of the Mann-Whitney test for differences in cadmium concentrations (flg.g- l
wet mass) of whole crabs and sediments from the two localities: Jonkershoek (J) and SFW (S),
as well as the bioconcentration factor (BCFs) calculated for whole crabs (z = z-value, p = p
value).
n Mean S~ Range z p BCFs
Sediment (J) 8 0.36 0.09 0.25-0.5vs 4.004 <0.05 9.53
Whole crab (J) 60 3.43 2.79 0.62-11.2
Sfdiment (S) 8 0.38 0.15 0.25-0.58vs 3.914 <0.05 13.26
Whole crab (S 51 5.04 6.26 0.49-33.67

155
Table 9.24: Results of Student's t-test for differences in mean cadmium concentration (llg.g-1
wet mass) of the sediments and crab tissues at each locality: Jonkershoek and SFW, as well as
the bioconcentration factor (BCFs) calculated for the tissues (Dig.gland = digestive gland; Mean
logarithms of cadmium concentrations used to calculate the t-value; t = t-value, p = p-value).
JONKERSHOEK
n Mean SD Range t p BCFs
Sediment 8 0.36 0.09 0.25-0.5
vs Dig.gland 18 1.78 2.53 0.2-9.59 -2.3 <0.05 4.94
vs Gills 14 2.81 3.43 0.3-12.28 -3.48 <0.05 7.81
vs Gonads 14 3.95 3.78 0.3-12.5 -3.96 . <0.05 10.97
SFW
n Mean SD Range t p BCFs
Sediment 8 0.38 0.15 0.25-0.58
vs Dig.gland 15 2.72 4.21 0.1-15.72 -2.0 <0.05 7.16
vs Gills 12 3.85 5.65 0.2-20.9 -3.18 <0.05 10.13
vs Gonads 11 7.0 8.71 0.1-22.15 -2.75 <0.05 18.42
Table 9.25: Results of the Mann-Whitney test for differences in cadmium concentrations (llg.g- 1
wet mass) of sediments, crab muscles and carapace at each locality: Jonkershoek (J) and SFW
(S), as well as the bioconcentration factor (BCFs) calculated for the muscles and carapace (z = z-
value, p = p-value). •
n Mean SD Range z p BCFs
Sediment (J) 8 0.36 0.09 0.25-0.5vs 3.538 <0.05 9.22
Carapace (J) 19 3.32 1.41 0.44-5.57
Sediment (J) 8 0.36 0.09 0.25-0.5vs 2.109 <0.05 7.11
Muscle (J) 16 2.56 2.19 0.2-7.05
Sediment (S) 8 0.38 0.15 0.25-0.58vs 3.627 <0.05 12.39
Carapace (S) 20 4.71 3.95 1.9-18.46
Sediment (S) 8 0.38 0.15 0.25-0.58vs 1.625 >0.05 7.29
Muscle (S) 13 2.77 2.8 0.1-7.65

(a) (b)
Concentration (1I9/g wet mass) Concentration (1I9/g wet mass)
20
(6.26)
I - Jonkershoek ~ SFW l
/
(9.97)
SmallMedium
SIZE CLASSES
Large
10
15
/
/
SFW
(2.79)
Jonkershoek
2
1
3
6
o
5
4
LOCALITIES Large: )41 mm carapace width; Medium:between 21 and 40 mm caraptlce width;Small: <20 rom carapace width
Figures 9(a)-(b): Mean cadmium concentration in whole crabs(a) and various size classes (b) from both localities (SD in parenthesis).
V>0'>

I - Jonkershoek ~ SFW I
(c)
Concentrations (~g/g wet mass)
6
5
4
3
2
1
oCarapace Muscle Dig.gland Gills
TISSUES
Jonkerahoek and SFW data pooled
(6.46)
Gonads
8
7
6
5
4
3
2
1
o
(d)
Concentration (~g/g wet mass)
Carapace Muscle Dig.gland GlIIs
TISSUES
(8.71)
Gonads
Figures 9(c)-(d): Mean cadmium concentration in carapaceand tissues of P. perfatus from the Eerste River (SD in parenthesis).
v......
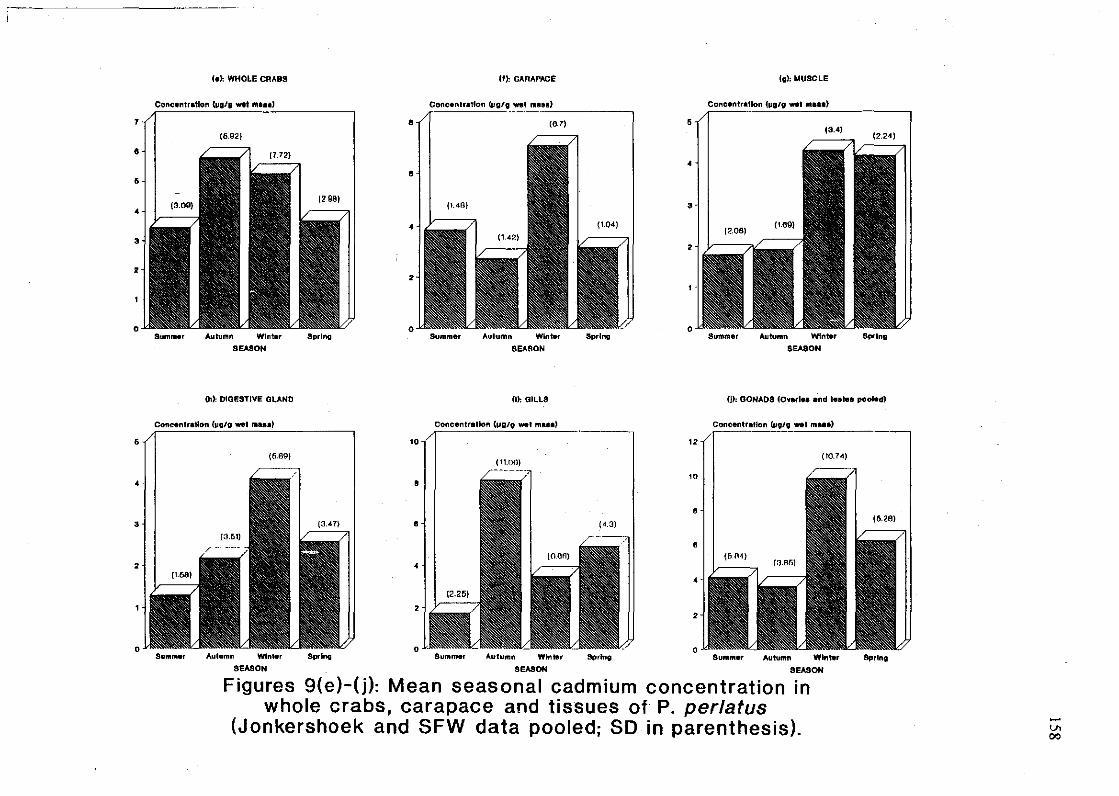
(t1>: WHOLE CRABS (1): CARAPACE (g): MUSCLE
Conetlnlr.tfon (Ilg/g wei fIl•••)
SpI"lnll
(3.4)
Wln'-r
SEASON
AutumnSumm.r
Concentr.llon {Illl/g wet mu.'
3
o
•
•
•
Spring
(6.7)
Aulumn Winter
SEASON
Summar
Conctlnlr.tlon (l/g/g wei nUl")
•
•
Spring
(6.921
....utul'lln Wlnt.r
SEASON
Sum_r
3
o
•
1
•
•
•
(II): DIOESTIVE OLAND (I): GILLS m: GONADS (O.,.rl.. and la."8 pooled)
•Concenlr.flon (Ilg/g wet .....1
10
Coneenlr.llon (",,/g _I I'll.'"I
12
Concen'rallon (I/g/g ....1 I'll••,)
•
Summar
(6.139}
Alliumn Wlnt.r
SeASON
Sprl",
•
•
•
Summer
(11.001
jl,utumn Winter
SEASON
Spring
10
•
•
•
•o
Summer
(10.704)
Aulumn Winter
SEASON
Spring
Figures 9(e)-(j): Mean seasonal cadmium concentration inwhole crabs, carapace and tissues of P. perlatu8
(Jonkershoek and SFW data pooled; SD in parenthesis). v.00

159
Discussion.
The mean cadmium concentration in whole bodies, tissues and carapace of Potamonautes
perlatus (Table 9.3; Figure 9(c)), were compared with the concentrations found by several other
researchers in two decapod species, the crayfish Orconectes virilis and the shore crab Carcinus
maenas. In comparison with the "Criteria for Cadmium", cited by Forstner (1980), ranging from
5 to 33.1 mg.kg-1 dry mass for whole crabs from the UK and 22 mg.kg-1 dry mass for whole
crabs from Europe, the cadmium concentrations in whole crabs P. perlatus (0.99±0.9 and
1.57±2.71.llg.g-1 dry mass for Ionkershoek and SFW respectively) were found to be very low.
The whole crab Cd concentrations in P. perlatus did, however, compare favourably with the
mean whole body Cd concentrations in the crayfish Orconectes virilis, collected from a
relatively unpolluted site on the Fox River, Illinois, namely 0.83±0.13 to 2.38±0.74 Ilg.g-1 dry
mass (Anderson & Brower, 1978).
The mean dry mass Cd concentrations in the digestive gland and carapace of P. perlatus, i.e.
OA4±0.63 and 0.68±1.05 Ilg.g-1 for the digestive gland from Ionkershoek and SFW respectively
and 2.26±0.96 and 3.22±2.7 Ilg.g-1 for the carapace from Ionkershoek and SFW respectively,
were found to be low and high respectively, compared to the cadmium concentrations in
unexposed Carcinus maenas (7.75±8.78 Ilg.g-1 dry mass (digestive gland) and 0.55±0.3 Ilg.g-1
dry mass (carapace)), as found by Rainbow (1985). The mean dry mass Cd concentration in the
muscles of P. perlatus (0.52±0.19 and 0.55±0.55 Ilg.g-1 for IOnkershoek and SFW respectively)
were found to be relatively high, in comparison with the mean Cd concentrations in muscles of
the crayfish Orconectes virilis, (0.1 to 0.22 Ilg.g-1 dry mass) collected by France (1987) from
lakes with low metal burdens, as well as from acid lakes with slightly higher metal levels than
the non-acidified lakes. Anderson & Brower (1978) observed mean Cd concentrations of
0.78±0.13, <0.5 and 1.47±0.78 Ilg.g-1 dry mass, respectively, in the exoskeleton, muscles and
gills of Orconectes virilis. The carapace and muscle concentrations in Potamonautes perlatus
(see above), in comparison with Anderson & Brower's results, were found to be relatively high
and the gill Cd (OAI±0.5 and 0.56±0.82 Ilg.g-1 for Ionkershoek and SFW respectively)
relatively low.
It is clear that the Cd concentrations in P. perlatus compare well with the concentrations found
in decapod species from relatively unpolluted fresh and marine waters elsewhere. However, the
high dry mass concentrations in the carapace of crabs from Ionkershoek and SFW ranging from
0.3 to 3.8 and from 1.3 to 12.6 Ilg.g-1 respectively, as well as the very high maximum whole
crab dry mass concentration (18.67 Ilg.g-1) found in the SFW population, are of some concern
and indicate possible Cd accumulation in P. perlatus from the Eerste River. Also,. the
significantly higher Cd concentrations in whole crab, tissue and carapace cadmium
concentrations than in the sediments from both localities, as well as the high BCFw's and BCFs's
obtained (Tables 9.23-9.25), indicated that Cd was accumulated in P. perlatus from both
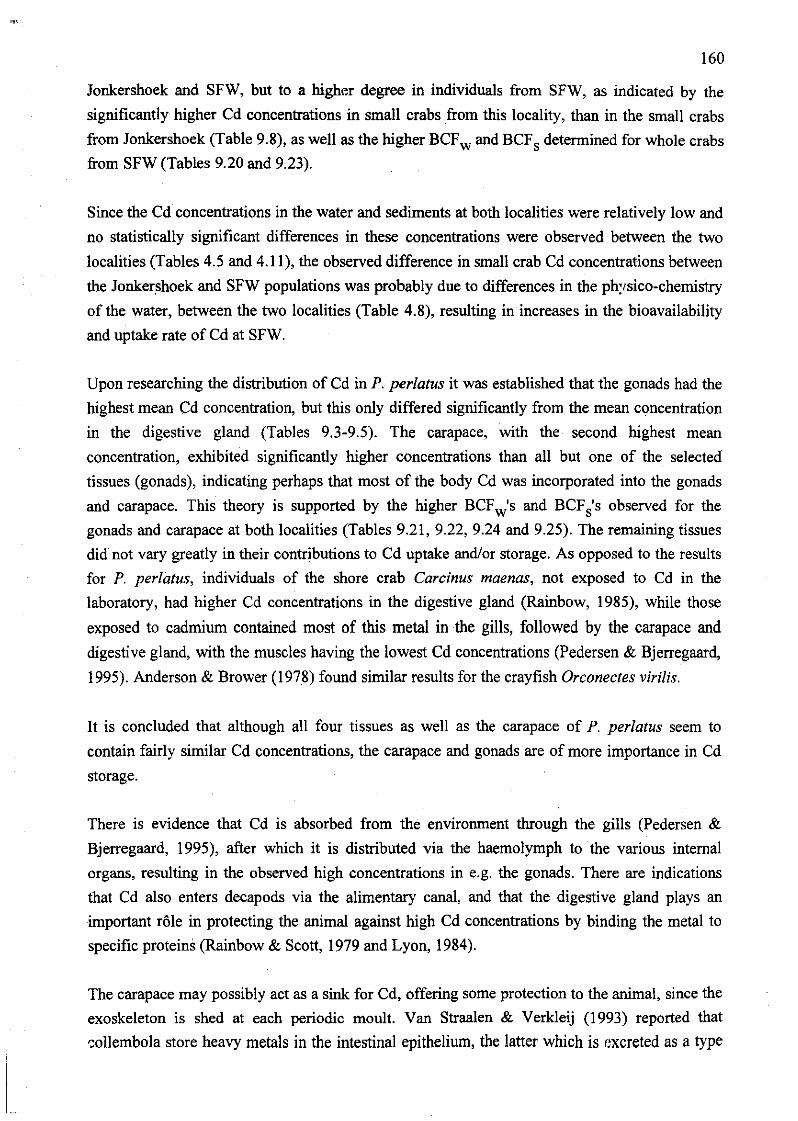
160
Jonkershoek and SFW, but to a higher degree in individuals from SFW, as indicated by the
significantly higher Cd concentrations in small crabs from this locality, than in the small crabs
from Jonkershoek (Table 9.8), as well as the higher BCFw and BCFs determined for whole crabs
from SFW (Tables 9.20 and 9.23).
Since the Cd concentrations in the water and sediments at both localities were relatively low and
no statistically significant differences in these concentrations were observed between the two
localities (Tables 4.5 and 4.11), the observed difference in small crab Cd concentrations between
the Jonkershoek and SFW populations was probably due to differences in the physico-chemistry
of the water, between the two localities (Table 4.8), resulting in increases in the bioavailability
and uptake rate of Cd at SFW.
Upon researching the distribution of Cd in P. perlatus it was established that the gonads had the
highest mean Cd concentration, but this only differed significantly from the mean concentration
in the digestive gland (Tables 9.3-9.5). The carapace, with the second highest mean
concentration, exhibited significantly higher concentrations than all but one of the selected
tissues (gonads), indicating perhaps that most of the body Cd was incorporated into the gonads
and carapace. This theory is supported by the higher BCFw's and BCFs's observed for the
gonads and carapace at both localities (Tables 9.21, 9.22, 9.24 and 9.25). The remaining tissues
did not vary greatly in their contributions to Cd uptake and/or storage. As opposed to the results
for P. perlatus, individuals of the shore crab Carcinus maenas, not exposed to Cd in the
laboratory, had higher Cd concentrations in the digestive gland (Rainbow, 1985), while those
exposed to cadmium contained most of this metal in the gills, followed by the carapace and
digestive gland, with the muscles having the lowest Cd concentrations (Pedersen & Bjerregaard,
1995). Anderson & Brower (1978) found similar results for the crayfish Orconectes virilis.
It is concluded that although all four tissues as well as the carapace of P. perlatus seem to
contain fairly similar Cd concentrations, the carapace and gonads are of more importance in Cd
storage.
There is evidence that Cd is absorbed from the environment through the gills (Pedersen &
Bjerregaard, 1995), after which it is distributed via the haemolymph to the various internal
organs, resulting in the observed high concentrations in e.g. the gonads. There are indications
that Cd also enters decapods via the alimentary canal, and that the digestive gland plays an
important role in protecting the animal against high Cd concentrations by binding the metal to
specific proteins (Rainbow & Scott, 1979 and Lyon, 1984).
The carapace may possibly act as a sink for Cd, offering some protection to the animal, since the
exoskeleton is shed at each periodic moult. Van Straalen & Verkleij (1993) reported that
-;ollembola store heavy metals in the intestinal epithelium, the latter which is r:xcreted as a type

I.
161
of intestinal "plug" with each moult. Periodic moulting therefore clearly offers protection against
accumulated metals to these animals.
Investigations into the relationship between crab size and Cd. uptake in P. perlatus showed
significantly higher concentrations in small crabs from SFW (Table 9.1). Furthermore, the
reasonably strong negative correlations between size and whole crab (r = -0.522), tissue (except
muscle) and carapace Cd (Table 9.2), showed that body size (therefore age) has some influence
in the uptake of Cd from the enviromnent, in this species. Kiffney & Clements (1996) exposed
three ephemeropteran and one plecopteran species to cadmium and also found an inverse
relationship between body size and survivorship. All the above mentioned results differ from
those of Anderson & Brower (1978) who found no differences in Cd concentrations between the
various size classes of Orconectes virilis.
One can speculate on the reason for these observed size/age differences. Hill & O'Keeffe (1991)
demonstrated differences in food preference between different sized individuals of P. perlatus.
Smaller crabs were shown to prefer aquatic invertebrates (e.g. insects), which are known to
accumulate heavy metals (e.g. Albers & Camardese, 1993 and Kiffney & Clements, 1993).
Small crabs may therefore bioaccumulate higher Cd concentrations from their food. Also,
Gherardi et al. (1987) and Gherardi & Micheli (1989) showed that younger (smaller) individuals
of Potamon fluviatile and P. potamios palestinensis respectively, tend to hide more under rocks
and stones, especially at night. This type of microhabitat offers a relatively constant enviromnent
for the crabs, which might result in lengthened exposure times to specific Cd concentrations,
possibly explaining the observed higher concentrations in the smaller individuals of P. perlatus.
As in the case of Orconectes virilis (Anderson & Brower, 1978), gender also proved to have
little influence on Cd uptake and distribution. The only significant difference between cadmium
concentrations of males and females of P. perlatus was found for the digestive gland, with males
exhibiting the highest concentrations (Tables 9.12-9.13). Since metal levels in this tissue are
mostly affected by levels in the diet, one may speculate that factors such as possible differences
in diet between the genders could have resulted in the observed differences in digestive gland
Cd. Comparisons between whole crab Cd concentrations of males and females did not, however,
show a statistically significant difference, therefore the difference in digestive gland Cd is not
considered of great importance.
Seasonality proved to be of some influence III cadmium uptake in P. perlatus. Seasonal
differences in Cd levels were observed for the carapace, muscle tissue and gills (Tables 9.15
9.17). However, the latter two tissue types exhibited only very slight seasonal variations. Peaks
in Cd concentrations in carapace, muscles and gill tissue were observed for autumn,
winter/spring and winter respectively (Figures 9(e)-G)). These peaks did not follow the peaks in

162
water and sediment Cd closely (Figures 4(c)-(1)), although the sediments did exhibit a slight
autumn peak.
It has been shown that the crab Potamon potamios prefers the thermal zone between 24° and
27°C and that its activity drops below and above these temperatures (Warburg et aI., 1982).
Similarly, the activity of Potamonautes perlatus is affected by environmental temperatures: this
species is relatively inactive during the colder, wetter months and tend to retreat into burrows or
under rocks and stones (personal observations and marked decrease in capture rate), in order to
avoid the full force of the water flow. The relatively constant environment produced by this type
of microhabitat may cause the animals to be exposed to specific Cd concentrations for longer
periods. This theory might explain the observed tissue and carapace Cd peaks in the colder
months.
Finally, the fact that P. perlatus in the Eerste River at both localities was shown to accumulate
Cd in its body, indicates that this species may be considered as a potential monitor of
environmental Cd pollution in the Eerste River. On the other hand, it must be noted that since
long term accumulation probably does not occur, due to loss of excesses of this metal through
moulting, and since environmental fluctuations in Cd were not accurately reflected in the crab
body, this species might in fact not be a suitable monitor. More frequent observations and a
better understanding of the factors affecting bioavailability of Cd to, and uptake and distribution
thereof in, P. perlatus are needed, in order to make final conclusions.
---000---

163
CHAPTER 10
HEAVY METALS AND THE SPERMATOZOA OF POTAMONAUTESPERLATUS
Introduction
The sperm ultrastructure and spermiogenesis of some decapod crustaceans, especially crabs,
have been studied intensively, e.g. for the genus Cancer (Langreth, 1960), the species Eriocheir
japonicus (Yasuzumi, 1960), Ranina ranina, Portunus pelagicus, Potamonautes perlatus
sidneyii (Jamieson, 1989; 1993) and for Uca tangeri (Medina & Rodriguez, 1992).
A transmission electron microscopic study of the spermatozoon of the freshwater crab
Potamonautes perlatus sidneyii (Jamieson, 1993) was published shortly after the present study
had commenced. It revealed that each spermatozoon, contained in its own spermatophore, is
spheroidal in shape, slightly depressed antero-posteriorly and has broadly based lateral
projections. Furthermore, like all decapod sperm, it lacks a flagellum and like all brachyuran
sperm, the nucleus, which surrounds the acrosome, consists of diffuse, fibrous chromatin. The
dorsal tip of the sperm cell is covered by a dense caplike structure, the operculum, and two
elongate centrioles are present at the base of the acrosomal perforatorium.
It has been shown by several researchers that accumulated pesticides and heavy metals may have
adverse effects on the morphology, physiology and/or behaviour of animals (see Chapter I). Of
these, changes in sperm morphologyand physiology are well known: Young & Nelson (1974)
and Castagna et al. (1981) studied the effects of heavy metals on the sperm motility of the sea
urchin species Arbacia punctulata and A. lixula respectively. Ackerman (1995) investigated the
effects of copper on impala (Aepyceros melampus) sperm, whereas Reinecke et al. (1995)
discussed the effects of dieldrin on the sperm structure of the earthworm Eudrilus eugeniae. The
sperm structure of another earthworm species, Eisenia fetida, was investigated by Reinecke &
Reinecke (1996 in press) after exposure to lead and manganese.
Studies on the effects of pollutants on the sperm ultrastructure of crabs are lacking. The
possibility of sperm abnormalities occurring in freshwater crabs such as Potamonautes perlatus,
caused by exposure to heavy metals also exists. It was therefore decided to study the sperm
ultrastructure of the test animal, Potamonautes perlatus and the possible adverse effects of heavy
metals. The aim: was to establish whether the occurrence of sperm abnormalities and sperm
counts could be related to exposure to heavy metals.

164
Materials and Methods
Samples and sections were prepared for transmission electron microscopy according to the
method described in Chapter 3.
Results
Sperm were found in the testes and vasa deferentia of males of approximately 45 mm carapace
width and larger. Also, sperm were only detected in these organs during AprillMay and late
October to January, therefore during autumn, late spring and summer.
Figures lO(a)-(c) show the typical structure of normal spermatozoa of Potamonautes perlatus.
These were found to be similar in structure to the spermatozoa of P. perlatus sidneyii, described
by Jamieson (1993). Note the operculum, subacrosomal chamber, peripheral cytoplasm, dense
membrane, elongate centrioles and nucleus, as indicated in Figures 10(a) and (b).
Abnormal spermatozoa were found in males from both localities, i.e. Jonkershoek and SFW.
Figures 1O(d)-(g) illustrate the various types of abnormalities observed, such as the deformed
dense membrane and peripheral cytoplasm and the thickened operculum.
1. Differences between the two localitie.§
(a) Differences in the total number of spermatozoa per grid block
Student's t-test was performed in order to establish whether statistically significant differences
(p<0.05) between the total number of spennatozoa of males from the two localities existed
(Table 10.1). It was found that the individuals from SFW had significantly higher sperm counts
per grid block than those from Jonkershoek.
Table 10.1: Results of Student's t-test for the differences between the total number of
spermatozoa of P. perlatus per grid block, of males from Jonkershoek and SFW.
n Mean SD Range t-value p-value
Jonkershoek 4 37.75 22.16 16-65vs -3.3 <0.05
SFW 4 94.25 26.08 62-124
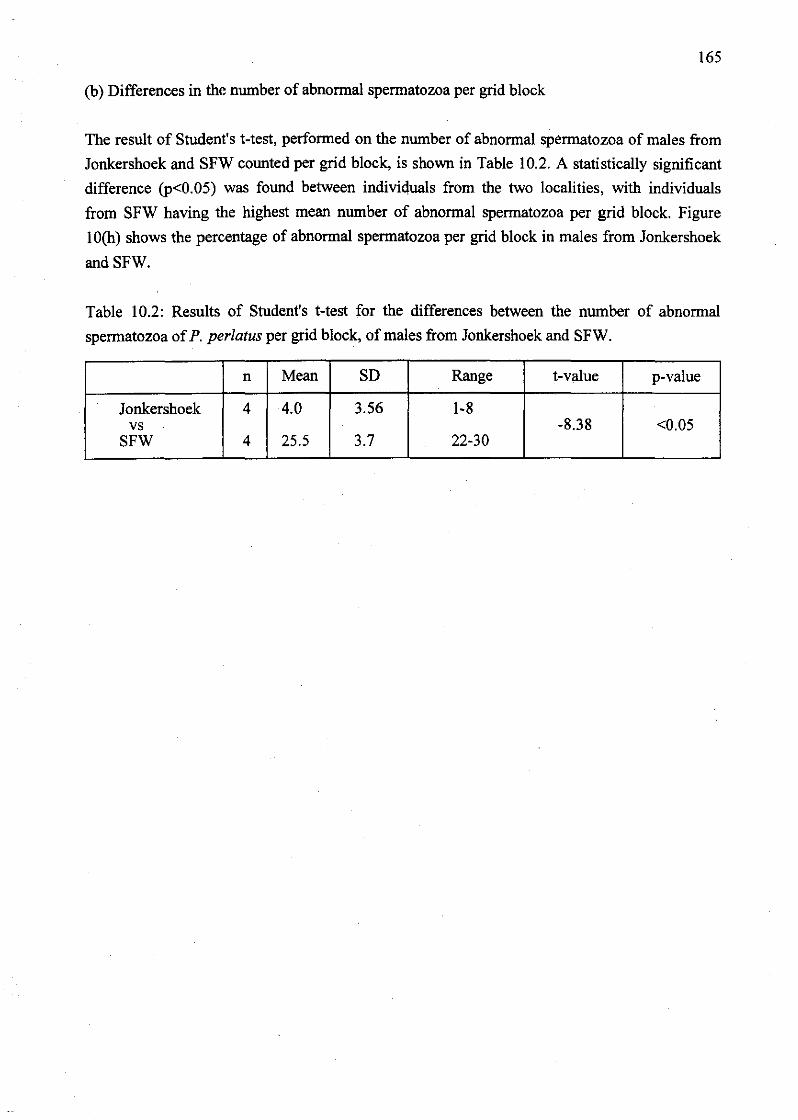
165
(b) Differences in the number of abnormal spermatozoa per grid block
The result of Student's t-test, performed on the number of abnormal spermatozoa of males from
Jonkershoek and SFW counted per grid block, is shown in Table 10.2. A statistically significant
difference (p<0.05) was found between indiviquals from the two localities, with individuals
from SFW having the highest mean number of abnormal spermatozoa per grid block. Figure
10(h) shows the percentage of abnormal spermatozoa per grid block in males from Jonkershoek
andSFW.
Table 10.2: Results of Student's t-test for the differences between the number of abnormal
spermatozoa ofP. perlatus per grid block, of males from Jonkershoek and SFW.
n Mean SD Range t-value p-value
Jonkershoek 4 4.0 3.56 1-8vs -8.38 <0.05
SFW 4 25.5 3.7 22-30

166
l.OJtrn
Figures 10(a):
Transmission electron micrograph of a longitudinal sections through the spermatozoon of
Potamonautesperlatus. Abbreviations: Dm =dense membrane; N =nucleus; 0 =operculum;
Pc =peripheral cytoplasm; Sa =subacrosomal f:hamber; Sp =spermatophore.
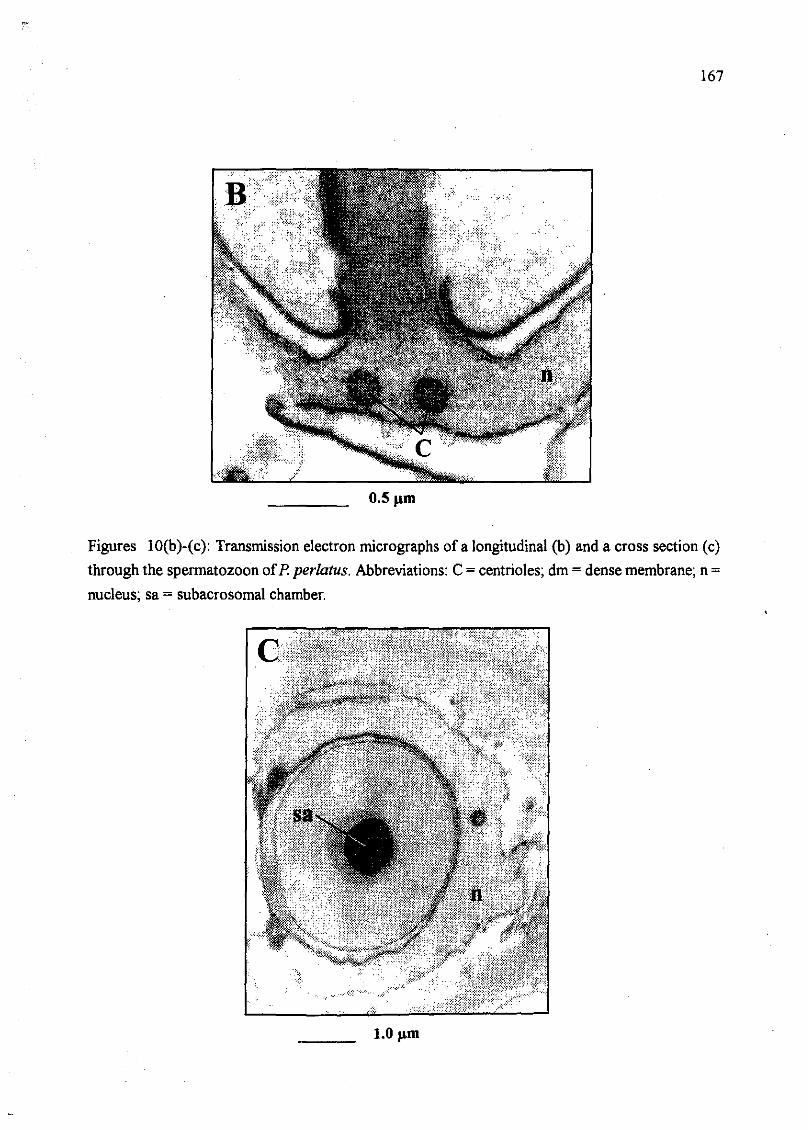
167
O.5~m
Figures IO(b)-(c): Transmission electron micrographs of a longitudinal (b) and a cross section (c)
through the spermatozoon ofP. perlatus. Abbreviations: C = centrioles; dm = dense membrane; n =
nucleus; sa = subacrosomal chamber.
l.O~m

168
l.Oflm
Figures 10(d)-(e): Transmission electron micrographs of longitudinal sections through abnormal
spermatozoa ofP. perlatus. Abbreviations: dm =dense membrane; n =nucleus; 0 = operculum and
sa = subacrosomal chamber.
l.Oflm

169
l.0J1m
Figures lO(f)-(g): Transmission electron micrographs of a longitudinal (f) and a cross (g) section
through abnormal spermatozoa ofP. perlatus. Abbreviations: dm =dense membrane; n =nucleus; 0
=operculum and sa =subacrosomal chamber.
l.0J1m
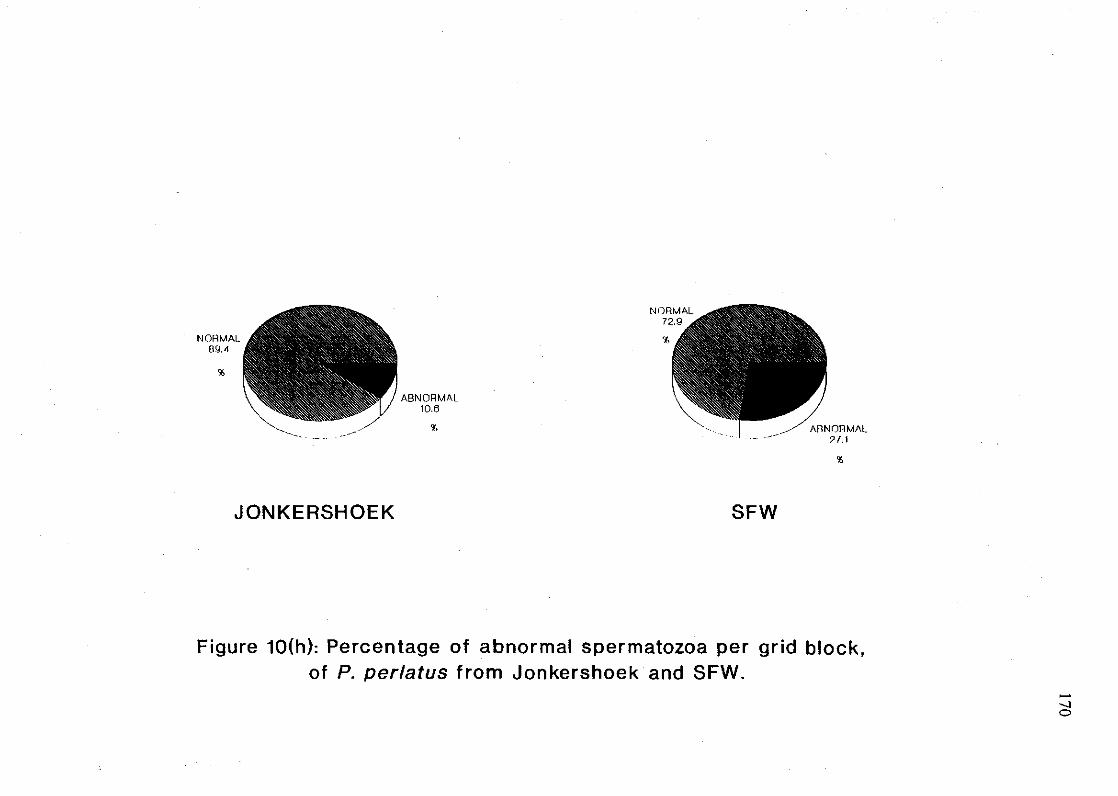
NORMALOg,4
%
.~.
JONKERSHOEK
ABNORMAL10.6
%
%
-,'
SFW
ARNORMAL?1.1
%
Figure 10(h): Percentage of abnormal spermatozoa per grid block,of P. perlatus from Jonkershoek and SFW.
--...Io

171
Discussion
Reproduction in Potamonautes perlatus is clearly periodical, probably seasonal but does not
seem to be synchronized between individuals. It is also evident that only the largest and most
mature males (2:45 mm carapace width) produce sperm and can reproduce (personal observations
during dissections and transmission electron microscopy). Micheli et al. (1990) also found no
sperm in subadult males (95 mm carapace width) of Potamonfluviatile, an Italian freshwater
crab species.
A comparison of the total number of sperm cells counted for males of P. perlatus, collected at
Jonkershoek and SFW, showed that individuals from SFW had a significantly higher number of
spermatozoa per grid block than males from Jonkershoek (Table 10.1). Cikutovic et al. (1993)
reported that exposure to heavy metals such as cadmium resulted in lowered sperm counts of
earthworms, but the results of the present study differ from this finding, since it was shown that
individuals of the SFW population had accumulated, and therefore been exposed to a greater
variety of heavy metals (Mn, Cu, Pb and Cd) than those of the Jonkershoek population (Pb and
Cd) (See discussions of Chapters 5-9). It must, however, be noted that it has not as yet been
established whether the reproductive cycles of the two populations are synchronized, and that the
possibility therefore exists that spermiogenesis commenced earlier in the season in the SFW
population, resulting in higher sperm counts at the time of capture. The observed differences in
total sperm counts of crabs from the two localities might therefore not be .related to heavy metal
exposure at all.
A number of abnormal spermatozoa were observed in all males investigated, from Jonkershoek
as well as from SFW. These cells all differed from the normal form, which is illustrated in
Figures 10(a)-(c), as they all had highly deformed dense membranes and also appeared to have
thickened opercula (Figures 10(d)-(g~). One explanation for these abnormalities is the possible
negative effects of chemical fixation techniques, as described by Reger et al. (1984). They found
that cryofixed, as opposed to chemically fixed spermatozoa of the crab Carcinus maenas,
exhibited greater cytonucleoplasmic density, the filament and membrane fine structure was more
detailed, membranes appeared smoother and membrane particle distribution was more regular.
Another explanation could be the technique used to kill the animals, namely by freezing.
However, this fails to explain the significantly higher number of abnormal spermatozoa found in
individuals from SFW (Table 10.2). One would indeed expect a proportionally higher number of
abnormal sperm cells in individuals from SFW, coinciding with the significantly higher total
number of sperm cells but, upon investigation, it was found that the percentage of abnormal
spermatozoa per grid block in SFW individuals were in fact more than twice as great as the
percentage of abnormal spermatozoa per grid block in Jonkershoek individuals (Figure lOCh»~.

172
There must, therefore, be alternative explanations for these observed differences, one of whiGh
might be the significantly higher Mn and eu concentrations found in whole crabs from SFW
(Tables 5.6 and 7.5). Ackennan (1995) and Reinecke & Reinecke (1996 in press) have clearly
illustrated the negative influence of heavy metals, specifically copper (Ackennan, 1995) and
manganese (Reinecke & Reinecke, 1996 in press), on the spenn ultrastructure of the impala,
Aepyceros melampus and the earthwonn, Eiseniafetida, respectively.
It is therefore concluded that the greater number of abnonnal spennatozoa per grid block of
males from SFW could possibly be related to heavy metal exposure. To test this hypothesis, it
will of course be necessary to execute sublethal exposure experiments on P. perlatus, In a
controlled laboratory environment.
---000---

173
CHAPTER 11
CONCLUSIONS
Results of the present study indicated that heavy metal (except Zn) concentrations in the water
and sediments at Jonkershoek and SFW were either well Within the limits set by the Department
of Environment Affairs and Tourism, or compared well with the results of other researchers on
relatively unpolluted freshwater ecosystems. It was therefore concluded that the Eerste River,
from its origin to the SFW locality, can still be considered relatively unpolluted in terms of
heavy metals, but that runoff from the Stellenbosch municipal, industrial and agricultural areas
definitely influence the physico-chemistry and general quality of the water.
Despite the relatively low heavy metal concentrations in the water and sediments at Jonkershoek
and SFW, some of the heavy metals tested for, when compared with the results of various other
researchers on several decapod crustaceans, were found to be relatively high in Potamonautes
perlatus, such as Zn, Cd and Mn in the carapace, Mn, Cu, Pb and Cd in muscle tissue and Mn in
the remaining tissues. Dry mass Pb concentrations in whole crabs from both localities, as well as
dry mass Cd concentrations in whole crabs from SFW, were also relatively high. Heavy metal
concentrations in the remaining tissues and dry mass Zn, Mn and Cd concentrations in whole
crabs all compared favourably or were relatively low.
Comparisons between the metal concentrations of crabs from Jonkershoek and SFW showed
significantly higher (p<O.05) whole body Mn and Cu concentrations of crabs collected at SFW.
These results especially, as well as the bioconcentration factors (BCFw and BCFs) calculated for
whole crabs, tissues and carapace, aided in the decision whether the metals were accumulated in
the crabs or generally well regulated. It was concluded that while Zn was well regulated in crabs
from both localities, Mn and Cu were accumulated in P. perlatus from SFW, and Pb and Cd in
individuals from both localities.
All five selected heavy mlltals were shown to be compartmentalized in the body of P. perlatus,
i.e. concentrated more in certain body parts and/or tissues than in others. The carapace
especially, as well as the digestive gland and gonads were indicated as the most important
storage sites for these heavy metals: Mn was shown to concentrate in the carapace and, to a
lesser degree in the digestive gland, Cd and Pb in both the carapace and gonads, and Zn and Cu
mainly in the carapace and digestive gland respectively.
Investigations were made into the possible relationship between factors such as body size,
gender and seasonality, and heavy metal concentrations in P. perlatus in the Eerste River.
Crab body size was shown to be an important factor influencing heavy metal uptake in this
species: for all five selected metals, reasonably strong negative corrdations were found between

174
body size and whole crab, carapace and gonad metal concentrations, indicating higher metal
concentrations in smaller crabs.
Gender, on the other hand, generally seemed to be of little importance in heavy metal uptake in
the crab. Only in the cases of Cu in whole crabs, and Pb and Cd in the digestive gland, were
gender shown to be of some importance. In all these instances metal concentrations were found
to be highest in male crabs.
Seasonal variations in all five selected heavy metals in this species indicated that seasonality can
be considered of some influence in metal uptake in P. perlatus. Peaks in Zn, Cu, Pb and Cd in
those body parts/tissues which showed significant seasonal variations, were found in the colder
months, i.e. autumn and/or winter. These peaks did not follow the seasonal peaks in water and
sediment metal concentrations. The Mn concentrations in whole crabs, tissues and carapace,
however, showed summer peaks which corresponded with peaks in water and sediment Mn
concentrations.
Factors such as the degree of regulation or accumulation of each metal in P. perlatus, the large
intraspecific variations in metal concentrations in the crabs, as well as the degree to which metal
concentrations in the riverine environment is reflected in the crabs, were all taken into account
when the species was evaluated as monitor of environmental heavy metal pollution. It was
concluded that the species in the Eerste River can be considered as a potential biomonitor of Mn,
Pb and Cd pollution, but that there is no certaintj that environmental metal concentrations would
be accurately reflected in the crab.
The sperm ultrastructure of P. perlatus, on the other hand, might prove to be of greater value in
environmental heavy metal pollution monitoring, since it was found that mature male crabs (>45
mm carapace width) from SFW had a significantly larger amount (p<O.05) of abnormal
spermatozoa than those from Jonkershoek. Whether these observed abnormalities can definitely
be related to the effects of heavy metal exposure, and if so, precisely which metals are
responsible, still need to be investigated. It is also necessary that further investigations be made
into possible differences between the two populations of P. perlatus, i.e. from Jonkershoek and
SFW, in terms of biomass and population density, since the higher number of abnormal
spermatozoa observed in the SFW population may hold serious long term implications for the
population's reproduction. Also, an intensive study on the reproductive cycle of the species is
crucial, since this may help to explain several of the trends observed in the present study, as well
as results of future studies.
One of the major questions which arises from this study, is whether the heavy metal
concentrations in P. perlatus influence animals further up in the food chain. Such predators
along and in the Eerste River include the Cape clawless ott~r Aonyx capensis, the water

175
mongoose Atilax paludinosusand the Giant kingfisher Megaceryle maxima, which have all been
shown to prey on crabs in the Eerste River and elsewhere (Purves et aI., 1994; Purves, 1995 and
Arkel, 1979), as well as a number of fish species such as the Small- and Largemouth basses
(Micropterus dolomieu and M salmoides) and the Rainbow trout Onchorhynchus mykiss
(Skelton, 1993).
Mason et al. (1986) reported heavy metal, particularly lead, concentrations in tissues of the
British otter Lutra lutra, approaching concentrations known to produce sublethal effects in
mammals. This implies possible metal accumulation from the prey. These fmdings may be taken
a step further, in light of the results of the present study on the distribution of heavy metals in
the crab body, and the influence of crab body size on heavy metal concentrations: Cape clawless
otters and water mongooses may possibly be exposed to higher metal concentrations than for
instance the Giant kingfisher, since the former two have been shown to consume the entire crab,
carapace included (although the water mongoose discards the carapaces of larger crabs) (Rowe
Rowe, 1977b; Baker, 1989 and Purves et aI., 1994), whereas the kingfisher always discards the
carapace (Arkel, 1979). Also, the studies of Arkel (1979) and Purves (1995) have shown that the
Giant kingfisher takes larger crabs than otters and water mongooses which hunt along the Eerste
River at Jonkershoek, and that otters, in tum, generally take larger crabs than the mongoose.
This implies that otters at Jonkershoek are possibly exposed to higher concentrations of heavy
metals than any other predators which feed on P. perlatus in this area, since they not only take
large crabs which, although shown to contain lower concentrations of heavy metals per gram
body mass than smaller crabs, would contain higher total body heavy metal concentrations, but
also always consume the carapace, which was shown to contain the highest concentrations of
most of the selected heavy metalS. However, the opposite might possibly be true for the above
mentioned animals found along the Bushmans River, since Somers & Purves (1996) showed that
water mongooses along this river take significantly larger crabs than the Cape clawless otter.
In conclusion, the results of the present study have clearly raised many new questions on various
issues surrounding the Eerste River ecosystem. With this study the grounds have been lain for
several divergent and more intensive studies.
---000---

176
REFERENCES
Abel, P.D. (1989) Water pollution biology. Ellis Horwood Limited, Chichester.
Ackerman, D.J. (1995) Die ultrastruktuur van sperme van die rooibok Aepyceros melampus
(Lichtenstein, 1812) in die Nasionale Krugerwildtuin met spesiale verwysing na die
invloed van koperbesoedeling. Ph.D. Thesis, Department of Zoology, University of
Stellenbosch.
Albers, P.H. and M.B. Camardese (1993) Effects of acidification on metal accumulation by
aquatic plants and invertebrates. Environ. Toxicol. Chem. 12: 959-976.
Anderson, l (1974) A study of the digestion of sediment by the HN03-H2S04 and the HN03
HCI procedures. Atomic Absorption Newsletter 13: 31-32.
Anderson, R.V. and lE. Brower (1978) Patterns of trace metal accumulation III crayfish
populations. Bull. Environ. Contam. Toxicol. 20: 120-127.
Arkel, G.B.F. (1979) Aspects of the feeding and breeding biology of the Giant Kingfisher.
Ostrich 50: 176-181.
Arumugam, M. and M.H. Ravindranath (1983) Nature and distribution of copper in Green
Lagoon Crab Scylla serrata (Forskal). J Exp. Mar. Bioi. Ecol. 70: 271-280.
Arumugam, M. and M.H. Ravindranath (1987) Copper toxicity in the crab, Scylla serrata,
copper levels in tissues and regulation after exposure to a copper-rich medium. Bull.
Environ. Contam. Toxicol. 39: 708-715.
Baker, C.M. (1989) Feeding habits of the Water mongoose (Ati/ax paludinosus). Z.
Saiigetierkunde 54: 31-39.
Barnard, K.H. (1950) Descriptive catalogue of South African decapod Crustacea. Annals o/the
South African Museum 38: 179-194.
Bendell Young, L. and H.H. Harvey (1991) Metal concentrations in crayfish tissues in relation
to lake pH and metal concentrations in water and sediments. Can. J Zool. 69: 1076-1082.
Bezuidenhout, L.M.; H.J. Schoonbee and L.P.D. de Wet (1990) Heavy metal content in organs
of the African sharptooth catfish, Clarias gariepinus (Burchell), from a Transvaal lake
affected by mine and industrial effluents. Part I: Zinc and copper. Water SA 16: 125-129.
177
Bryan, O.W. (19'64) Zinc regulation in the lobster Homarus vulgaris. 1. Tissue zinc and copper
concentrations. J. mar. bioi. Ass. UK. 44: 549-563.
Bryan, O.W. and E. Ward (1965) The absorption and loss of radioactive and non-radioactive
manganese by the lobster, Homarus vulgaris. J. mar. bioi. Ass. UK. 45: 65-95.
Bryan, O.W. (1968) Concentrations of zinc and copper in the tissues of decapod crustaceans. J.
mar. bioi. Ass. UK 48: 303-321.
Bryan, O.W. (1971) The effects of heavy metals (other than mercury) on marine and estuarine
organisms. Proc. Roy. Soc. Lond. B 177: 389-410.
Bryan, O.W. (1976) Some aspects of heavy metal tolerance in aquatic organisms. In: Society for
Experimental Biology seminar series 2: Effect of pollutants on aquatic organisms.
Lockwood, A.P.M. (Ed.). Cambridge University Press.
Burrows, 1.0. and B.A Whitton (1983) Heavy metals in water, sediments and invertebrates from
a metal-contaminated river free of organic pollution. Hydrobiologia 106: 263-273.
Campbell, P.O.c. and P.M. Stokes (1985) Acidification and toxicity of metals to aquatic biota.
Can. J. Fish. Aquat. Sci. 42: 2034-2049.
Castagna, A.; F. Sinatra; M. Scalia and V. Capodicasa (1981) Observations of the effect of zinc
on the gametes and various development phases of Arbacia lixula. Mar. Bioi. 64: 285
289.
Cikutovic, M.A; L.G. Fitzpatrick; IDJ. Venables and AJ. Goven (1993) Sperm count in
earthworms (Lumbricus terrestris) as a biomarker for environmental toxicology: Effects'--
of cadmium and chlordane. Environ. Pollut. 81: 123-125.
Corner, E.D.S. and B.W. Sparrow (1956) The modes of action of toxic agents. 1. Observations
on the poisoning of certain crustaceans by copper and mercury. J. mar. bioi. Ass. UK
35: 531-548.
Crowder, A. (1991) Acidification, metals and macrophytes. Environ. Pollut. 71: 171-203.
Davies, B.R.; J.H. O'Keeffe and C.D. Snaddon (1993) A synthesis of the ecological functioning,
conservation and management of South African river ecosystems. Water Research
Commission Report No. TT 62/93.
178
Department of Water Affairs (1986) Management of the water resources of the Republic of
South Africa.
Depledge, M.H. (1989) Re-evaluation of metabolic requirements for copper and zinc in decapod
crustaceans. Mar. Environ. Res. 27: 115-126.
Devescovi, M. and C. Lucu (1995) Seasonal changes of the copper level in shore crabs Carcinus
mediterraneus. Mar. Ecol. Prog. Ser. 120: 169-174.
Devi, V.U. (1987) Heavy metal toxicity to fiddler crabs, Uca annulipes Latreille and Uca
triangularis (Milne Edwards): Tolerance to copper, mercury, cadmium and zinc. Bull.
Environ. Contam. Toxicol. 39: 1020-1027.
De Wet, L.P.D.; H.J. Schoonbee; J. Pretorius and L.M. Bezuidenhout (1990) Bioaccumulation
of selected heavy metals by the water fern, Azolla filiculoides Lam. in a wetland
ecosystem affected by sewage, mine and industrial pollution. Water SA 16: 281-286.
Dixit, S.S. and D. Witcomb (1983) Heavy metal burden in water, substrate, and
macroinvertebrate body tissue of a polluted River 1rwell (England). Environ. Pollut. Ser.
B 6: 161-172.
Du Preez, RH.; V.E. Steenkamp and H.J. Schoonbee (1993) Bioaccumulation of zinc and lead
in selected tissues and organs of the freshwater crab, Potamonautes warreni. Sci. Tot.
Environ. Suppl.: 469A78.
Elinder, CoG. and M. Piscator (1979) Zinc. In Handbook on the toxicology ofmetals. Friberg, L.et al. (Eds). ElsevierlNorth-Holland Biomedical Press.
Engel, D.W. and M. Brouwer (1987) Metal regulation and molting in the Blue Crab, Callinectes
sapidus: Metallothionein function in metal metabolism. BioI. Bull. 173: 239-251.
Federal-provincial advisory committee on environmental and occupational health (1983)
Guidelines for Canadian recreational water quality.
Federal-provincial advisory committee on environmental and occupational health (1989)
Guidelines for Canadian drinking water quality, Edition 4.
Forstner, U. and F. Prosi (1979) Heavy metal pollution in freshwater ecosystems. In Biological
aspects offreshwater pollution. Ravera, O. (Ed). Pergamon Press, Oxford.
179
Forstner, U. (1980) Cadmium. In The handbook of environmental chemistry Volume 3A:
Anthropogenic compounds. Hutzinger, O. (Ed). Springer-Verlag, Berlin.
Fourie, H.O. and M. Peisach (1976) Are freeze drying and oven drying methods for trace metal
determination in zoological specimens analytically sound? Radiochem, Radioanal.
Letters 2: 277-290.
France, R1. (1987) Calcium and trace metal composition of crayfish (Orconectes virilis) in
relation to experimental lake acidification. Can. J. Fish. Aquat, Sci. 44: 107-113.
Friberg, 1.; T. Kjellstrom; G. Nordberg and M. Piscator (1979) Cadmium. In Handbook on the
toxicology ofmetals. Friberg, 1. et al. (Eds). ElsevierlNorth-Holland Biomedical Press.
Galvin, RM. (1996) Occurrence of metals in waters: An overview. Water SA 22: 7-18,
George, S.G. (1982) Subcellular accumulation and detoxification of metals in aquatic animals.
In: Physiological mechanisms of marine pollution toxicity. Vemberg, W.B, et al. (Eds).
Academic Press.
Gherardi, F.; S. Guidi and M. Vannini (1987) Behavioural ecology of the freshwater crab,
Potamonjluviatile: Preliminary observations. Inv. Pesq. 51: 389-402.
Gherardi, F.; F. Tarducci and F. Micheli (1989) Energy maximization and foraging strategies in
Potamonjluviatile (Decapoda, Brachyura). Freshw, Bioi. 22: 233-245.
Gherardi, F. and F. Micheli (1989) Relative growth and population structure of the freshwater
crab, Potamon potamios palestinensis, in the Dead Sea area (Israel). Israel J. Zool. 36:
133-145.
Gherardi, F. and M. Vannini (1989) Spatial behaviour of the freshwater crab, Potamonjluviatile:
a radio-telemetric study. Bioi, Behav, 14: 28-45.
Harrison, RM. and D.P.H. Laxen (1984) Lead pollution. Causes and control. Chapman and
Hall, New York.
Hill, M.P. and J.H. O'Keeffe (1992) Some aspects of the ecology of the freshwater crab
(Potamonautes perlatus Milne Edwards) in the upper reaches of the Buffalo River,
eastern Cape Province, South Africa. S. Afr. J. Aquat. Sci, 18: 42-50,
180
Hi1my, A.M.; N.F. Abd EI-Hamid and K.S. Ghazaly (1988) Variation of zinc and copper level!
with sex and size in different tissues of the crab Portunus pelagicus (Linnaeus). Folia
Morph. 36: 160-166.
Hogben, E. and A. Zoond (1930) Respiratory exchange in the freshwater crab, Potamonautes
perlatus. Trans. Roy. Soc. SA. 18: 283-286.
Jamieson, B.G.M. (1989) Ultrastructural comparison of the spermatozoa of Ranina ranina
(Oxystomata) and other crabs exemplified by Portunus pelagicus (Brachygr..atha)
(Crustacea, Brachyura). Zoomorphology 109: 103-111.
Jamieson, B.G.M. (1993) Ultrastructure of the spermatozoon of Potamonautes perlatus sidneyii
(Heterotremata, Brachyura, Crustacea). S Afr. J. Zoo!' 28: 40-45.
Johns, D.M. and D.C. Miller (1982) The use of bioenergetics to investigate the mechanisms of
pollutant toxicity in crustacean larvae. In: Physiological mechanisms ofmarine pollutant
toxicity. Vernberg, W.B. et al. (Eds). Academic Press.
Kempster, P.L.; W.H.J. Hattingh and H.R. van Vliet (1980) Summarized water quality criteria.
Department of Environment Affairs Technical Report No TR 108.
Kiffney, P.M. and W.H. Clements (1993) Bioaccumulation of heavy metals by benthic
invertebrates at the Arkansas River, Colorado. Environ. Toxicol. Chern. 12: 1507-1517.
Kiffney, P.M. and W.H. Clements (1996) Size-dependent response of macroinvertebrates to
metals in experimental streams. Environ. Toxico!. Chern. 15: 1352-1356.
King, J.M. (1981) The distribution of invertebrate communities in a small South African river.
Hydrobiologia 83: 43-65.
King, J.M.; J.A. Day; B.R. Davies and M-P. Henshall-Howard (1987) Particulate organic matter
in a mountain stream in the south-western Cape, South Africa. Hydrobiologia 154: 165
187.
King, J.M.; J.A. Day; P.R. Hurly; M-P. Henshall-Howard and B.R. Davies (1988)
Macroinvertebrate communities and environment in a southern African mountain stream.
Can. J. Fish. Aquat. Sci. 45: 2168-2181.

181
Klump, J.V.; J.R. Krezoski; M.E. Smith and J.1. Kaster (1987) Dual tracer studies of the
assimilation of an organic contaminant from sediments by deposit feeding oligochaetes.
Can. J. Fish. Aquat. Sci. 44: 1574-1583.
Langreth, S.G. (1960) Spermiogenesis in Cancer crabs. J. Biophys. Biochem. Cytol. 7: 575-603.
Lewis, T.E. and A.W. McIntosh (1986) Uptake of sediment-bound lead and zinc by the
freshwater isopod Asellus communis at three different pH levels. Arch. Environ. Contam.
Toxieol.lS: 495-504.
Lind, Y.; A. Wicklund Glynn; J. Engman and 1. Jorhem (1995) Bioavailability of cadmium
from crab hepatopancreas and mushroom in relation to inorganic cadmium: A 9-week
feeding study in mice. Fd Chern. Toxic. 33: 667-673.
Lynch, T.R. and C.J. Popp (1988) Aquatic insects as environmental monitors of trace metal
contamination: Red River, New Mexico. Water, Air & Soil Pollut. 42: 19-31.
Lyon, R. (1984) Metal-protein binding patterns in the hepatopancreas of the crayfish
(Austropotamobius pallipes) during short term cadmium stress. Comp. Biochem. Physiol.
C 78: 415-418.
Manny, B.A.; SJ. Nichols and D.W. Schloesser (1991) Heavy metals in aquatic macrophytes
drifting in a large river. Hydrobiologia 219: 333-344.
Martin, J-1.M. (1974) Metals in Cancer irroratus (Crustacea: Decapoda): Concentrations,
concentration factors, discrimination factors, correlations. Mar. Bioi. 28: 245-251.
Mason, C.F.; N.!. Last and S.M. Macdonald (1986) Mercury, cadmium and lead in British otters.
Bull. Environ. Contam. Toxieol. 37: 844-849.
Mason, C.F. and S.M. Macdonald (1986) Levels of cadmium, mercury and lead in otter and
mink faeces from the United Kingdom. Sci. Tot. Environ. 53: 139-146.
Mason, C.F. and W.M. Sullivan (1993) Heavy metals in the livers of otters, Lutra lutra, from
Ireland. J. Zool., Lond. 231: 675-678.
Medina, A. and A. Rodriguez (1992) Spermiogenesis and sperm structure in the crab Uca
tangeri (Crustacea, Brachyura), with special reference to the acrosome differentiation.
Zoomorphology 111: 161-165.

182
Micheli, F.; F. Gherardi and M. Vannini (1990) Growth and reproduction in the frf'shwater crab,Potamonfluviatile (Decapoda, Brachyura). Freshw. Bioi. 23: 491-503.
Mills, C.F. (1989) Zinc in human biology. Human nutrition reviews. Springer-Verlag, Berlin.
Moore, J.W. and S. Ramamoorthy (1984) Heavy metals in natural waters. Applied monitoring
and impact assessment. Springer-Verlag, New York.
Newland, L.W. and K.A. Daum (1982) Lead. In The handbook of environmental chemistry
Volume 3B: "Anthropogenic compounds. Hutzinger, O. (Ed). Springer-Verlag, Berlin.
Nugegoda, D. and P.S. Rainbow (1989) Zinc uptake rate and regulation breakdown in the
decapod crustacean, Palaemon elegans Rathke. Ophelia 30: 199-212.
Ottaway, J.R. (1980) The biochemistry of pollution. Studies in Biology no. 123. Edward Arnold
(Publishers) Limited.
Owen, C.A. (1982) Biological aspects of copper. Occurrence, assay and interrelationships.
Copper in Biology and Medicine Series Volume 5. Noyes Publications, New Jersey.
Palmer, RW. and lH. O;Keeffe (1990) Downstream effects of impoundments on the water
chemistry of the Buffalo River (Eastern Cape), South Africa. Hydrobiologia 202: 71-83.
Pedersen, T.V. and P. Bjerregaard (1995) Calcium and cadmium fluxes across the gills of the
Shore Crab, Carcinus maenas. Mar. Poll. Bull. 31: 73-77.
Petitjean, M.O.G. (1987) Eerste River catchment management report.
Piscator, M. (1979a) Copper. In Handbook on the tOXicology ofmetals. Friberg, L. et al. (Eds).
ElsevierlNorth-Holland Biomedical Press.
Piscator, M. (1979b) Manganese. In Handbook on the toxicology of metals. Friberg, L. et al.
(Eds). ElsevierlNorth-Holland Biomedical Press.
Purves, M.G.; H. Kruuk and lA.J. Nel (1994) Crabs Potamonautes perlatus in the diet of Otter
Aonyx capensis and Water mongoose Atilax paludinosus in a freshwater habitat in South
Africa. Z. Saugetierkunde 59: 332-341.
Purves, M.G. (1995) Coexistence of three syntopic small carnivores in Mountain Fynbos. M.Sc.
Thesis, Department of Zoology, Univflrsity of Stellenbosch.

183
Radhakrishnaiah, K. (1987) Size and sex-related tolerance to zinc in the freshwater Field Crab
OZiotelphusa senex senex. Geobios 14: 10-12.
Rafl, G.Md.; T. Srinivas; S.l Reddy; D.C. Reddy and R Ramamurthi (1991) Acute and chronic
toxicity of endosulfan to crab: Effe~t on lipid metabolism. Bull. Environ. Contam.
Toxicol. 47: 918-924.
Rainbow, P.S. and AG. Scott (1979) Two heavy metal-binding proteins in the midgut gland of
the crab Carcinus maenas. Mar. Bioi. 55: 143-150.
Rainbow, P.S. (1985) Accumulation ofZn, Cu and Cd by crabs and barnacles. Estuar., Coast. &
ShelfScience 21: 669-686.
Rainbow, P.S. arid S.L. White (1989) Comparative strategies of heavy metal accumulation by
crustaceans: zinc, copper and cadmium in a decapod, an amphipod and a barnacle.
Hydrobiologia 174: 245-262.
Rajeswari, K.; V. Kalarani; D.C. Reddy and R Ramamurthi (1988) Acute toxicity of endosulfan
to crabs: Effect on hydromineral balance. Bull. Environ. Contam. Toxicol. 40: 212-218.
Rasmussen, AD.; A Krag, P. Bjerregaard; lM. Weeks and M.H. Depledge (i995) The effects
of trace metals on the apparent water permeability of the Shore Crab Carcinus maenas
(L.)and the Brown Shrimp Crangon crangon (L.). Mar. Poll. Bull. 31: 60-62.
Raubenheimer, C.D. (1986) Aspects of the biology of the freshwater crab, Potarnonautes
sidneyi, with particular reference to general seasonality and female aggression. M. Sc.
Thesis, Department of Biologlcal Sciences, University of Nata\.
Reger, J.F.; F. Escaig; l Pochon-Masson and M.E.C. Fitzgerald (1984) Observations on crab,
Carcinus maenas, spermatoma following rapid-freeze and conventional fixation
techniques. J Ultrastr. Res. 89: 12-22.
Reinecke, S.A; AJ. Reinecke and M.L. Froneman (1995) The effects of dieldrin on the sperm
ultrastructure of the earthworm Eudrilus eugeniae (Oligochaeta). Environ. Toxieol.
Chern. 14: 961-965.
Reinecke, S.A and AJ. Reinecke (1996) The influence of lead and manganese on spermatozoa
of Eisenia fetida (Oligochaeta). Soil Bioi. Biochem. In Press.

184
Reynolds, E.S. (1963) The use of lead citrate at high pH as an electron-opaque stain in electron
microscopy. J. Cell Bioi. 17: 208-212.
Richardson, M.L. and S. Gangolli (1993) The dictionary of substances and their effects 2. The
Royal Society of Chemistry.
Richardson, M.L. and S. Gangolli (1994) The dictionary. of substances and their effects 5. The
Royal Society of Chemistry.
Richardson, M.L. and S. Gangolli (1994) The dictionary of substances and their effects 7. The
Royal Society of Chemistry.
Rodriguez, E.M. and RJ. Lombardo (1991) Acute toxicity of parathion and 2,4D to estuarine
adult crabs. Bull. Environ. Contam. Toxicol. 46: 576-582.
Roldan, B.M. and RR Shivers (1987) The uptake and storage of iron and lead in cells of the
crayfish (Orconectes propinquus) hepatopancreas and antennal gland. Camp. Biochem.
Physiol. C 86: 201-214.
Rosenberg, R and J.D. Costlow Jr. (1976) Synergistic effects of cadmium and salinity combined
with constant and cycling temperatures on the larval development of two estuarine crab
species. Mar. Biol. 38: 291-303.
Rouleau, C.; H. Tjiilve and J. Gottofrey (1996) Effects of low pH on the uptake and distribution
of 54 Mn (II) in Brown Trout (Salmo trutta). Environ. Toxicol. Chern. 15: 708-710.
Roux, DJ.; S.HJ. Jooste and H.M. MacKay (1996) Substance-specific water quality criteria for
the protection of South African freshwater ecosystems: methods for derivation and initial
results for some inorganic substances. S.A. J. Sc. 92: 198-206.
Rowe-Rowe, D.T. (1977b) Prey capture and feeding behaviour of South African otters.
Lammergeyer 23: 13-21.
Rutherford, M.C. and RH. Westfall (1986) Biomes of southern Africa - An objective
categorization. Memoirs of the Botanical Survey of Southern Africa No. 54. Leistner,
O.A. (Ed.).
Sanders, H.O. and J.H. Chandler (1972) Biological magnification of a polychlorinated biphenyl
(Aroclor R 1254) from water by aquatic invertebrates. Bull. Environ. Contam. Toxicol.7:
257-263.
185
Scheuhammer, AM. (1987) The chronic toxicity of aluminium, cadmium, mercury and lead in
birds: A review. Environ. Pol/ut. 46: 263-295.
Seymore, T.; H.H. du Preez and lHJ. van Vuren (1995) Manganese, lead and strontium
bioaccumulation in the tissues of the yellowfish, Barbus marequensis from the lower
Olifants River, Eastern Transvaal. Water SA 21: 159-172.
Skelton, P. (1993) A complete guide to the freshwater fishes of southern Africa. Southern Book
Publishers (Pty) Ltd.
Somers, MJ. and M.G. Purves (1996) Trophic overlap between three syntopic semi-aquatic
carnivores: Cape clawless otter, Spotted-necked otter and Water mongoose. Afr. J Eco!.
34: 158-166.
Steenkamp, V.E. (1992) The bioaccumulation of selected heavy metals in the crab
Potamonautes warreni from industrial and mine polluted freshwater ecosystems. M.Sc.
Thesis, Department of Zoology, Rand Afrikaans University.
Steenkamp, V.E.; H.H. Du Preez; HJ. Schoonbee; AlB. Wiid and M.M. Bester (1993)
Bioaccumu1ation of iron in the freshwater crab (Potamonautes warreni) from three
industrial, mine and sewage polluted freshwater ~cosystems in the Transvaal. Water SA
19: 281-290.
Steenkamp, V.E.; RH. du Preez and HJ. Schoonbee (1994a) Bioaccumulation of copper in the
tissues of Potamonautes warreni (Caiman) (Crustacea, Decapoda, Brachiura), from
industrial, mine and sewage-polluted freshwater ecosystems. S. Afr. J Zoo!. 29: 152-161.
Steenkamp, V.E.; H.H. du Preez; HJ. Schoonbee and P.H. van Eeden (1994b) Bioaccumulation
of manganese in selected tissues of the freshwater crab, Potamonautes warreni (Caiman),
from industrial and mine-polluted freshwater ecosystems. Hydrobio!ogia 288: 137-150.
Steenkamp, V.E.; RH. du Preez; HJ. Schoonbeeand A. Shafir (1995) Accumulation of nickel
in three freshwater crab populations. S. Afr. J Wildl. Res. 25: 67-76.
Stouthart, XJ.H.x.; lL.M. Haans; R.AC. Lock and S.E. Wende1aar Bonga (1996) Effects of
water pH on copper toxicity to early life stages of the Common Carp (Cyprinus carpio).
Environ. Toxico!. Chem. 15: 376-383.

.186
Timmermans, KR.; B. Van Hattum; M.H.S. Kraak and C. Davids (1989) Trace metals in a
littoral foodweb: Concentrations in organisms, sediment and water. Sci. Tot. Environ.
87/88: 477-494.
Tsuchiya, K (1979) Lead. In Handbook on the toxicology of metals. Friberg, L. et al. (Eds).
ElsevierlNorth-Holland Biomedical Press.
Tulasi, SJ.; R. Yasmeen; C.P. Reddy and lV. Ramana Rae (1987) Lead uptake andlead loss in
the freshwater Field Crab, Barytelphusa guerini, on exposure to organic and inorganic
lead. Bull. Environ. Contam. Toxicol. 39: 63-68.
Tulasi, SJ. and J.V. Ramana Rao (1988) Effects of lead on copper content of freshwater crab,
Barytelphusa guerini (H. Milne Edwards). Indian J Exp. BioI. 26: 323-324.
Van Aardt, W.J. (1993) The influence of temperature on the haemocyanin function and oxygen
uptake of the freshwater crab Potamonautes warreni Calman. Compo Biochem. Physiol.
A 106: 31-35.
Van der Merwe, C.G.; H.J. Schoonbee and l Pretorius (1990) Observations on concentrations of
the heavy metals zinc, manganese, nickel and iron in the water, in the sediments and in
two aquatic macrophytes, Typha capensis (Rohrb.) N.E. Br. and Arundo donax 1., of a
stream affected by goldmine and industrial effluents. Water SA 16: 119-124.
Van Eeden, P.H. and HJ. Schoonbee (1991) Bio-accumulation of heavy metals by the
freshwater crab Potamonautes warreni from a polluted wetland. S. Afr. J Wildi. Res. 21:
103-108.
Van Eeden, P.H. and H.J. Schoonbee (1993) Metal concentrations in sediments and some
organisms from a polluted wetland. S. Afr. J Wildi. Res. 23: 12-16.
Van Straalen, N.M. and JAC. Verkleij (1993) Leerboek Oecotoxlco10gie. VU Uitgeverij,
Amsterdam.
Warburg, M.R.; S. Goldenberg and D. Rankevich (1982) Temperature effect on the behavior and
locomotor activity rhythm as related to water balance in the aquaticlland crab Potamon
potamios Olivier (Crustacea, Brachyura, Potamonidae). J crust. bioi. 2: 420-429.
Ward, lV. and J.A. Stanford (1983) The Serial Discontinuity Concept of lotic ecosystems. In
Dynamics of iotic ecosystems. Fontaine, T.D and S.M. Bartel (Eds). Ann Arbor Science
Publishers.

187
Watling, RJ. and H.R. Watling (1983) Metal surveys in South African estuaries VII Bushmans,
Kariega, Kowie and Great Fish Rivers. Water SA 9: 66-70.
Weis, J.S.; A. Cristini and K. Ranga Rao (1992) Effects of pollutants on molting and
regeneration in Crustacea Amer. Zool. 32: 495-500.
White, S.L. and Rainbow, P.S. (1984) Zinc flux in Pa1aemon e1egans (Crustacea: Decapoda):
moulting, iridividual variation and tissue distribution. Mar. Eco1. Prog. Ser. 19: 153-166.
Wieser, W. (1968) Aspects of nutrition and the metabolism of copper in isopods. Am. Zool. 8:
495-506.
Wren, C.D. and G.L. Stephenson (1991) The effects of acidification on the accumulation and
toxicity of metals to freshwater invertebrates. Environ. Pollut. 71: 205-241.
Yan, N.D.; G.L. Mackie and D. Boomer (1989) Chemical and biological correlates of metal
levels in crustacean zooplankton from Canadian shield lakes: A multivariate analysis. Sci.
Tot. Environ. 87/88: 419-438.
Yasuzumi, M.D. (1960) Spermatogenesis in animals as revealed by electron microscopy VII.
Spermatid differentiation in the crab, Eriocheir japonicus. 1. Biophys. Biochem. CytoI. 7:
73-87.
Young, L.G. and L. Nelson (1974) The effects of heavy metal ions on the mobility of sea urchin
spermatozoa. BioI. Bull. 147: 236-246.
---000---