the u.s. environmental protection agency · 2015-08-21 · the u.s. environmental protection agency...
TRANSCRIPT


THE U.S. ENVIRONMENTAL PROTECTION AGENCY FEDERAL PREVENTION OF SIGNIFICANT DETERIORATION PERMIT APPLICATION
Update
OCCIDENTAL CHEMICAL CORPORATION INGLESIDE CHEMICAL PLANT, SAN PATRICIO COUNTY
TCEQ ACCOUNT ID NO. SD-0092-F TCEQ CUSTOMER NO. 600125256
TCEQ REGULATED ENTITY NO. 100211176
ETHYLENE PLANT
November 2013
Submitted by:
Mark R. Evans Environmental Manager
Occidental Chemical Corporation

Occidental Chemical Corporation October 20 13
Introduction Summary of Changes Ethylene Plant Process Description
TABLE OF CONTENTS
Proposed Greenhouse Gas (GHG) Emissions Prevention of Significant Deterioration (PSD) Regulatory Requirements
Appendices Appendix A - General Application and PSD Applicability Forms Appendix B - Area Map, Plot Plan and Other Supporting Documents Appendix C - Emission Calculations Appendix D - Best A vail able Control Technology
I 2 3 5
12

Occidental Chemical Corporation October 2013
INTRODUCTION
Occidental Chemical Corporation (OxyChem) is proposing to construct and operate a new l.2 billion pound per year Ethylene Plant at its existing site near Ingleside, Texas on land immediately adjacent to the existing Vinyl Chloride Monomer (VCM) Plant. The new Ethylene Plant will receive ethane feed from a planned Natural Gas Liquids (NGL) Fractionation Plant to be constructed on adjacent property or by pipeline. The Ethylene Plant will produce market grade ethylene which will be transported by pipeline as feed material to the existing VCM Plant or to other markets.
It should be noted that this Ethylene Plant constitutes a major modification and is subject to federal prevention of significant deterioration (PSD) review for the following pollutants: volatile organic compounds, nitrogen oxides, carbon monoxide, particulate matter, particulate matter less than lO microns, particulate matter less than 2.5 microns and greenhouse gases (GHGs). All of these PSD pollutants except for GHG are addressed in a separate application submitted to the TCEQ in December 2012. This application is only intended to authorize the proposed facilities relative to GHG emissions.
A general application and GHG PSD applicability forms for these proposed facilities are provided in Appendix A, General Application and PSD Applicability Forms.
Occidental Chemical Corporation October 20 13
SUMMARY OF CHANGES
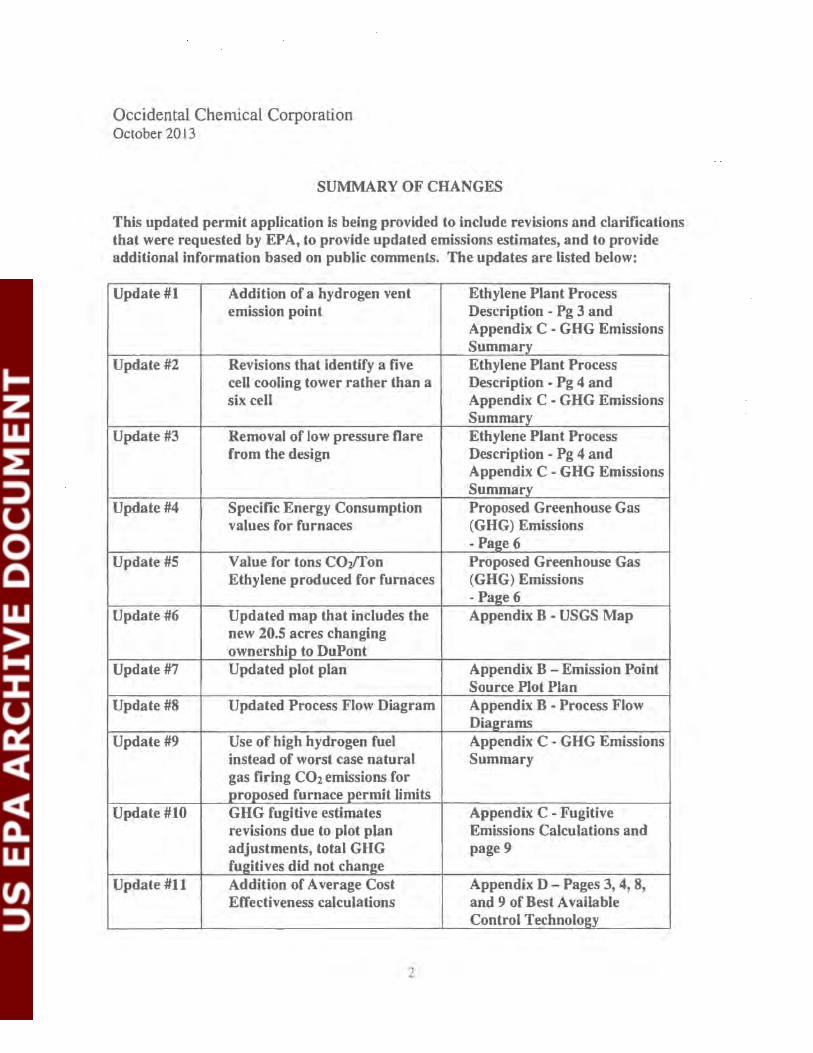
This updated permit application is being provided to include revisions and clarifications that were requested by EPA, to provide updated emissions estimates, and to provide additional information based on public comments. The updates are listed below:
Update #1 Addition of a hydrogen vent Ethylene Plant Process emission point Description - Pg 3 and
Appendix C- GHG Emissions Summary
Update #2 Revisions that identify a five Ethylene Plant Process cell cooling tower rather than a Description - Pg 4 and six cell Appendix C - GHG Emissions
Summary Update #3 Removal of low pressure Dare Ethylene Plant Process
from the design Description - Pg 4 and Appendix C- GHG Emissions Summary
Update #4 Specific Energy Consumption Proposed Greenhouse Gas values for furnaces (GHG) Emissions
-Page 6 Update #5 Value for tons COz{fon Proposed Greenhouse Gas
Ethylene produced for furnaces (GHG) Emissions -Page 6
Update #6 Updated map that includes the Appendix B - USGS Map new 20.5 acres changing ownership to DuPont
Update #7 Updated plot plan Appendix B -Emission Point Source Plot Plan
Update #8 Updated Process Flow Diagram Appendix B - Process Flow Diagrams
Update #9 Use of high hydrogen fuel Appendix C- GHG Emissions instead of worst case natural Summary gas firing C02 emissions for proposed furnace permit limits
Update #10 GHG fugitive estimates Appendix C - Fugitive revisions due to plot plan Emissions Calculations and adjustments, total GHG page9 fugitives did not change
Update #11 Addition of Average Cost Appendix D- Pages 3, 4, 8, Effectiveness calculations and 9 of Best Available
Control Technology

Occidental Chemical Corporation October 20 13
ETHYLENE PLANT PROCESS DESCRIPTION
The ethane feed to the Ethylene Plant is combined with recycle ethane from the ethylene fractionator and superheated with water before being sent to the cracking furnaces. The cracking furnaces will be equipped with selective catalytic reduction (SCR) technology for NOx control. The ethane is fed to five cracking furnaces to heat the ethane to cracking temperature.
To reduce coke formation in the cracking furnace tubes, a sulfide material is added continuously to the ethane feed. The concentration of sulfide material in the ethane feed is maintained at low ppm levels. Two chemicals may be used for this purpose, dimethyl disulfide (DMDS) or dimethyl sulfide (OMS). The sulfide chemical is stored in a pressurized tank and truck offloading of the material is accomplished using vapor balancing with the delivery truck.
The effluent from cracking furnaces is used to produce high pressure steam in transfer line exchangers (TLE's) before being quenched in the quench tower. The cracked gas from the TLE's is cooled and partially condensed by direct countercurrent contact with recirculating water in the quench tower. The condensed gasoline and dilution steam, along with quench water, are separated in the bottom section of the quench tower and the non-condensable gas exits the top of the quench column.
The quench tower overhead vapor (non-condensable gas) is sent to the first stage of the steam driven charge gas compressor where the vapors are compressed in a three stage centrifugal compressor. Acid gases are removed from the charge gas in the third stage compressor discharge. The acid gas removal consists of a three stage caustic wash tower. Charge gas from the caustic wash tower overhead is chilled in the dryer feed chiller system. Charge gas from the dryer feed chiller system overhead is dried in a molecular sieve drying system.
The vapor from the charge gas dryer is chilled before entering the front-end de-ethanizer . The de-ethanizer tower produces a vapor overhead product with primarily C2 and lighter content and a bottoms product that is stripped of ethane and lighter components. Acetylene is removed from the de-ethanizer overhead by selective hydrogenation to ethylene and ethane. The de-ethanizer overhead product is then chilled and sent to the de-methanizer.
The overhead of the de-methanizer consists of methane and hydrogen. This hydrogen-rich vapor from the de-methanizer is processed to separate hydrogen for use in the hydrogenation reactors and the balance is used as fuel gas. During brief periods when more fuel gas is produced than is required by the furnaces, hydrogen is vented through a hydrogen vent to remove fuel gas from the system. De-methanizer bottoms are fed to the ethylene fractionator. The ethylene fractionator overhead vapor is condensed as ethylene product that is sent out by pipeline or to the adjacent VCM plant. The ethylene fractionator bottoms are predominantly ethane and this stream is returned to the cracking furnace feed.
3

Occidental Chemical Corporation October 2013
The de-ethanizer bottoms product is sent to the de-butanizer to separate the C3's and C4's from the C5+ gasoline. The debutanizer bottoms product is sent to C5 gasoline storage. The debutanizer overhead product is hydrotreated in the hydrogenation reactor to convert diolefins and olefins into normal propane and butane. The propane/butane mix stream from the hydrogenation reactor is returned to the NGL Fractionation Plant as feed or shipped off site as product ..
One of the byproducts of the ethylene plant is a stream called pyrolysis gasoline. This material is sold to petroleum refineries as a gasoline blend stock. The pyrolysis gasoline will be loaded into trucks for transportation to the refinery customers. The vents from loading these trucks are routed to the cracker thermal oxidizers for VOC control.
A propylene refrigeration system, which utilizes a steam turbine-driven centrifugal compressor, provides refrigeration at four levels of temperature. A binary refrigerant system uses methane and ethylene to provide the coldest level of refrigeration in the plant for cooling and condensing process streams at three additional levels.
Spent caustic from the caustic tower is treated in a wet air oxidizer system to oxidize sulfides and other chemical oxidation demand before being discharged to the wastewater treatment plant.
A five cell cooling tower will be used to remove the heat from the process by thermal exchange.
Low pressure discharges of vent gases from process equipment and storage vessels are collected in dedicated headers and transferred to a thermal oxidizer to provide emissions control and generate steam from the waste heat. The two thermal oxidizers are designed to destroy and remove organic materials from the collected vent gases with an efficiency of 99.9%. They are supplied with natural gas to ensure complete combustion with minimum production of carbon monoxide.
In addition to the Thermal Oxidizers which provide the primary emissions control for vents, a high pressure flare system provides a means to collect and bum hydrocarbon process streams that have relieved or been drained to the flare headers at a rate or pressure greater than the thermal oxidizers to control. The emergency relief collection and transfer systems discharge to a multipoint low profile, high pressure ground flare with a staged burner control system. A heat radiation shielding fence will minimize the radiation to the acceptable level outside the fence and avoid production of a visible flame. Numerous pilots, supplied with natural gas, are provided to ensure that any emergency relief will be ignited.
Process wastewaters, contaminated storm water, surface wash down and other wastewaters are collected in process area sumps which pump to wastewater storage tanks. The wastewater storage tank is vented to the thermal oxidizers. Wastewater from the wastewater storage tank is sent to the wastewater steam stripper to remove volatile organic compounds prior to treatment in an activated sludge treatment system within the existing VCM Plant.
4

Occidental C::hernical Corporation October 2013
A summary of storage tanks is provided as follows:
I) Pressure tanks: 90,000 gal propylene tank; two 650,000 gal C3/C4 tanks; 10,000 gal anhydrous ammonia tank; 10,000 gal DMS/DMDS tank
2) Low pressure tanks venting to the oxidizers: three I, 100,000 gal contaminated water tanks; two 135,000 gal pyrolysis gasoline tanks; 45000 gal heavy oil tank; 105,000 gal collected oil tank; 18,000 gal wash oil tank; two 82,620 gal spent caustic tanks
3) Atmospheric tanks: 10,000 gal methanol tank (PBR 106.473); 10,000 gal sulfuric acid tank (PBR 106.4 72)
Process flow diagrams for the new Ethylene Plant are provided in Appendix B. This appendix includes a plot plan, area map and other documents requested in Section VII of the Form PI-I.
PROPOSED GREENHOUSE GAS (GHG) EMISSIONS
Emission calculations for maximum hourly and annual rates are provided in Appendix C, Emission Calculations. This emissions data includes the basis for the calculations, the emission factors, the sources of the factors, pollutant specific estimates and calculation methods.
The GHG emissions calculated for these sources include the following: carbon dioxide (C02),
methane (CH4 ) and nitrous oxide (N20). The reported emissions in Appendix C include the use of the appropriate global warming potential factors to express these GHG emissions as carbon dioxide equivalents (C02e).
The new sources proposed for the Ethylene Plant are identified as follows: five cracking furnaces, two thermal oxidizers, a high pressure ground flare, an emergency generator engine, a a cooling tower, a hydrogen vent, and fugitive sources identified for six operating areas. In addition, intermittent emissions are expected from the C3/C4 hydrogenation regeneration vent. GHG emissions are expected from all of these sources except for two of the six fugitive areas.
It should be noted that the existing cogeneration facilities at the site are also considered affected sources for GHG permitting purposes. Appendix C includes estimated emission increases for all of the ethylene production facilities, including the cogeneration units.
These cogeneration units are not being modified and their increased fuel firing will not exceed previously authorized levels (see Permit Nos. 35335 and PSD-TX-880). However, for the purpose of the current permit review, these cogeneration units are considered by the EPA to be affected sources that should be used to determine the applicability of federal PSD permitting.
EPN's CR-1 through CR-5; Ethane Cracking Furnaces Nos. 1 through 5
The ethane cracking furnaces for the proposed facilities include five identical combustion units expected to fire natural gas and hydrogen-rich fuel gas at a maximum rate of 275 MM Btu/hr.
5

Occidental Chemical Corporation October 20 13
Typically, four of these units will be operating while the fifth unit is being serviced or held on stand-by. However, at times, all five units may be running at full capacity. Based on the maximum proposed firing rate for five furnace operation at 12.05 x 10⁶ MMBtu/yr (275 MMBtu/hr x 5 furnaces x 8760 hr/yr) and the annual ethylene production of 1.2 billion pounds per year (600,000 tons/yr), this yields a specific energy consumption value of 20.1 MMBtu/ton, which compares favorably to recently pernlitted ethylene production facilities.
Normal operation involves natural gas and/or process-related fuel gas (high hydrogen gas) firing in the furnaces and the control of NOx emissions using SCR. Three additional operating scenarios are described below that pertain to furnace maintenance, start-up and shutdown (MSS) activities.
During normal operations, furnaces will be operated using process generated fuel gas which is a combination of hydrogen, methane, ethane, and heavier hydrocarbons. During this operation, the heat input to the fire box is maintained to achieve the desired cracking rate. Ethane and steam are fed to the furnace tube inlets and the furnace outlet is routed to the quench tower where the process gases are cooled.
It should be noted that normal operations can include firing only natural gas without the process fuel gas, and so, this scenario is included in the Appendix C emission calculations. Firing with natural gas represents worst-case enlissions for most criteria pollutants because fuel gas with hydrogen is a much cleaner fuel and results in less C02.
OxyChem will use hydrogen-rich fuel gas as a preferred fuel for the furnaces and will minimize C02 emissions in this way. The only exception to burning this fuel gas is that some of the produced hydrogen will be used in the facilities' hydrogenation processes.
The emission calculations in Appendix C assume firing of high-hydrogen fuel gas which results in worst-case CH4 and N20 emissions, and anticipated normal emissions of C02. The proposed C02e emissions from the cracking furnaces results in an emission rate of 0.43 ton of COze per ton of ethylene produced (295, I 00 tons/yr C02e -:- 690,000 tons/yr ethylene) which compares favorable to recently permitted ethylene cracking furnaces.
EPN's CR-1-MSS through CR-5-MSS; Ethane Cracking Furnaces Nos. 1 through 5- MSS Activities
The ethane cracking furnaces mentioned above have three additional scenarios that can be described as follows:
I) Furnace Cold Start-up- When the furnaces are starting up after a complete plant shutdown, there is no process generated fuel gas available and pipeline supplied natural gas is fired in the furnaces.
2) Hot Steam Standby- Hot steam standby mode of operation is established immediately after a
6

Occidental Chemical Corporation October 20 13
furnace has completed a steam decoke. During hot steam standby, the furnace has steam flowing through the tubes, minimum firing rate on the firebox, and the furnace discharge is routed to the quench tower. This operation mode is maintained until the furnace is placed back in the normal operation mode.
3) Steam Decoking- Due to the high furnace tube temperatures during normal operations, coke deposits build up on the furnace tube walls. To maintain efficient furnace operation, this coke must be removed periodically using a steam decoking process.
The steam decoking process is started by cutting the ethane feed to an operating furnace while leaving steam flowing through the furnace tubes, and maintaining fire box heat input at a reduced rate. The furnace discharge continues to feed forward to the quench tower until the ethane is purged from the furnace tubes.
Once the furnace tubes are cleared of ethane, the furnace discharge is diverted from the quench tower to the furnace fire box. Air is added to the furnace tubes along with steam, to begin burning coke in the furnace tubes.
The air flow is gradually increased until all of the coke is burned off. Once decoking has been completed, the air flow to the tubes is cut off, steam flow is maintained on the furnace tubes, minimum firing is maintained on the fire box and the furnace outlet is re-routed to the quench column.
The emissions from these activities were reviewed and the only possible increase in GHG emissions involves the steam decoking scenario. However, as shown in the Appendix C calculations, steam decoking GHG emissions are not greater than emissions estimated for normal operations.
EPN's CR-6 and CR-7; CR Thermal Oxidizer Nos. 1 and 2
The thermal oxidizer system for the proposed facilities includes two identical combustion units expected to fire fuel gas and waste gas at a maximum rate of 85 MM Btu/hr. Typically, these units will both be operating and will share the load of waste gases generated by the new facilities. ·
Waste gases include both continuous and intermittent streams from the process and storage vessels. All non-pressurized storage tanks at the site handling VOC materials with vapor pressures greater than 0.5 psia are vented to the thermal oxidizers for control.
Also, pyrolysis gasoline truck loading will be handled through the oxidizers. The pressure ratings of trucks are sufficient to maintain I 00% collection of displaced vapors.
Since each thermal oxidizer is capable of handling all of the waste gas from the proposed facilities, each unit will be permitted at maximum rates so that operational flexibility is
7

Occidental Chemical Corporation October 2013
maximized. Also, the thermal oxidizers will be equipped with heat recovery boilers to recover waste heat for increased energy efficiency. Steam generation from these units is intended to reduce the demand for steam from the existing cogeneration units.
EPN CR-8; CR High Pressure Flare
The high pressure ground flare is included in the emission calculations because its pilots burn natural gas. Otherwise, all gases routed to the flare will be the result of MSS events (see EPN CR-8-MSS) or upsets (emission events). Since emission events are not subject to permitting requirements, they are not addressed in this application.
EPN CR-8-MSS; CR High Pressure Flare- MSS Activities
The high pressure ground flare's start-up and shutdown emissions are included in this authorization. It should be noted that the number of events, gas input mass rates and hours per event represented in the Appendix C calculations are provided for calculation purposes only; these parameters could change, but the annual emission rates will not be exceeded.
EPN's CR-9; CR Emergency Generator Diesel Engine
The diesel-fired emergency generator engine is included in the emission calculations because of emissions that occur during the scheduled testing of this engine. The use of this engine for emergency conditions will not be authorized by this permit since these events are not subject to permitting requirements.
EPN CR-11; CR Cooling Tower
The make-up water for the cooling tower is treated surface water from the local municipal water district and this water contains naturally occurring dissolved minerals and bicarbonate ions that will tend to concentrate in the cooling tower water, raising the pH and alkalinity. To prevent scale formation, acid is injected into the circulation water system to reduce the alkalinity and pH.
In the process, bicarbonate ion is converted into C02 which de-gasses in the cooling tower. C02
is discharged to the atmosphere through the mechanical draft cooling tower fan stacks.
The C02 emissions are conservatively estimated using the maximum expected bicarbonate concentration and cooling tower make-up water flow rate assuming all the bicarbonate ion is converted to C02. In actual practice some bicarbonate remains in the circulating water and is removed with the blowdown water from the cooling tower.
EPN CR-12; C3/C4 Hydrogenation Regeneration Vent- MSS Activities
Hydrogenation reactors will be used to convert olefinic C3 and C4 compounds to saturated compounds. Periodic regeneration of these reactors is required to remove coke and residual
8
Occidental Chemical Corporation October 20 13
hydrocarbon deposits from the catalyst. This regeneration process is started by shutting off the process flow to the reactor and routing the reactor discharge to the quench tower.
Steam is used to sweep hydrocarbons from the reactor into the quench column for recovery of these materials. After the steam sweep is completed, the reactor discharge is routed to an atmospheric vent. High pressure steam and air are used to burn the remaining coke and residual hydrocarbons from the reactor catalyst.
EPN's CR-13, 14, 15 and 16; Ethylene Plant Fugitive Emissions
Fugitive emissions were estimated for the state PSD application for six areas of the proposed facilities: the CR Furnace Area Fugitives (EPN CR-13), the CR Charge Gas Area Fugitives (EPN CR-14), the CR Recovery Area Fugitives (EPN CR-15), the CR C3+ Area Fugitives (EPN CR-16), the CR Waste Treatment and C5 Area Fugitives (EPN CR-17) and the CR LPG Storage Area Fugitives (EPN CR-18). However, since the last two areas do not contain GHG pollutants, they are not included in this GHG application. Calculations utilize the TCEQ's SOCMI factors with ethylene, without ethylene and average factors, all based on the ethylene content of the streams. Changes were made based on engineering updates to fugitive emission sources CR -14 and CR-15 in the November 2013 application update, however, the total fugitive GHG emissions have not changed from the December 2012 application.
Fugitive emissions are minimized with the use of a TCEQ-styled 28MID fugitive monitoring and maintenance program with quarterly monitoring of flanges. This program with quarterly monitoring of flanges is a more aggressive program that the TCEQ-styled 28LAER program. New pumps and compressors in VOC service will have dual mechanical seals that route vapor losses to the thermal oxidizer or will be of equivalent non-leaker design.
Relief valves that vent to control devices and relief valves that are equipped with rupture discs and pressure indicators are not identified in the calculations since their control is expected to be 100%. Relief valves associated with contaminated water storage and gasoline storage cannot be equipped with rupture discs since they operate at low pressure. It should be noted that these tanks are initially routed to the thermal oxidizers for control, so losses through the relief valves are a secondary option for managing these tank losses.
VOC speciation is provided with the fugitive emission calculations and these VOC representations are the best available at this time and could vary slightly. This speciation includes a reasonable VOC distribution for the materials expected to be processed at the site.
Summary calculations are only provided for four of the six fugitives areas within the Ethylene Plant since these areas are the only ones that include GHG emissions. These areas include the following: the CR Furnace Area Fugitives (EPN CR-13), the CR Charge Gas Area Fugitives (EPN CR-14), the CR Recovery Area Fugitives (EPN CR-15) and the CR C3+ Area Fugitives (EPN CR-16).
9
Occidental Chemical Corporation October 20 13
Detailed calculations can be provided for each of about 40 distinct portions of the six fugitive areas (those with unique VOC speciation), but due to the volume of the calculations and the relatively small GHG quantities involved, these details are not included in this application. Nevertheless, one example calculation is provided in Appendix C that details the calculations for the binary refrigeration area within the CR Recovery Area Fugitives, EPN CR-15.
VOC and GHG speciation is provided with the fugitive emission calculations. This speciation includes a reasonable GHG distribution for the Ethylene Plant based on materials expected to be processed at the site. Fugitive methane emissions are about 3 tons/yr and C02 emissions are less than 0.1 ton/yr.
EPN's CR-19; CR Hydrogen Vent
Hydrogen is a major constituent of the fuel gas which is generated by the cracking process. This fuel gas is used as the primary heat source for the cracking furnaces. During periods of time when the amount of fuel gas produced is greater than the fuel demand of the furnaces, the excess fuel must be diverted from the fuel gas system. Diversion of hydrogen from the PSA unit is the preferred method of diverting fuel gas as the PSA will remove almost all of the hydrocarbons from the stream prior to venting.
EPN's CG-1 and CG-2; Existing Cogeneration Units
As mentioned previously, the existing cogeneration units are not being modified and their increased fuel firing will not exceed previously authorized levels. However, as affected sources the cogenerations units will enter in the scope of the project to supply the new demand for steam and power for the proposed facilities.
Therefore, for the purpose of the current PSD permit review, the emissions from the increase in fuel firing expected from these existing units will need to be added to the emissions associated with the proposed new facilities. In this regard, it has been determined that a maximum 215 MM Btulhr increase in fuel firing is needed when steam and power are provided by the cogeneration units' heat recovery steam boilers for the new Ethylene Plant.
It is likely that the increase in steam and power will occur from increased firing of the gas turbines, but since the higher efficiency turbines' emissions do not represent worst-case, the steam boilers were chosen for the purpose of estimating emission increases. Also, it should be noted that since the two cogeneration facilities are identical, the increased fuel firing could occur from either unit with no difference in the calculated emissions.
10

Occidental Chemical Corporation October 2013
Proposed GHG Emissions
\
A summary of maximum GHG emissions to be authorized for the proposed Ethylene Plant is provided below.
GHG Emissions Summary Annual C02e Emissions
(tons/yr)
EPN Sources C02- CH4- NzO-related related related Total C01e C02e COzc C02e
CR-1 Ethane Cracking Furnace No. I 58,358.20 167.43 494.31 59,019.94
CR-2 Ethane Cracking Furnace No.2 58,358.20 167.43 494.31 59,019.94
CR-3 Ethane Cracking Furnace No. 3 58,358.20 167.43 494.31 59,019.94
CR-4 Ethane Cracking Furnace No.4 58,358.20 167.43 494.31 59,019.94 CR-5 Ethane Cracking Furnace No.5 58,358.20 167.43 494.31 59,019.94 CR-6 CR Thermal Oxtdtzer No. I 53,938.77 48.49 140.76 54,128.02 CR-7 CR Thermal Oxidtzer No. 2 53,938.77 48.49 140.76 54,128.02
CR-8 CR High Pressure Flare 842.24 0.33 0.49 843.06
CR-8-MSS CR High Pressure Flare - MSS 69,541.37 76.65 226.29 69,844.31 CR-9 CR Emergency Generator Diesel Engine 61.44 0.05 0.15 61.64
CR-1 I CR Cooling Tower 674.20 0.00 0.00 674.20 C3/C4 Hydrogenation Regen. Vent-
CR-12-MSS MSS 12.93 0.03 0.06 13.02
CR-13 CR Furnace Area Fugitives 0.01 28.39 0.00 28.40
CR-14 CR Charge Gas Area Fugitives 0.00 21.05 0.00 21.05 CR-15 CR Recovery Area Fugitives 0.00 I 1.32 0.00 11.32
CR-16 CR C3+ Area Fugitives 0.00 5.42 0.00 5.42
CR-19 Hydrogen Vent 0.00 30.24 0.00 30.24 CG-1 and CG-2 Cogeneration Units 110,093.30 43.61 64.37 I 10,201.28
Totals 580,894.0.3 I, I 51.22 .3,044.4.3 585,089.68
II

Occidental Chemical Corporation October 2013
PREVENTION OF SIGNIFICANT DETERIORATION (PSD) REGULATORY REQUIREMENTS
OxyChem's new Ethylene Plant will comply with all applicable PSD regulatory requirements. Details of these permitting requirements and the company's compliance are explained below for the requirements found in 40 CFR 52.21 U)-(w).
(j) Control technology review.
One aspect of the required control technology review is that a major stationary source or major modification must comply with each applicable emissions limitation under the State Implementation Plan and each applicable emission standard and standard of performance under 40 CFR parts 60 and 61. However, since GHG emissions are not addressed in these requirements, the proposed facilities are not subject to any of these standards.
Also, new major stationary sources and major modifications must apply best available control technology for each regulated NSR pollutant subject to PSD review. The review of BACT using the EPA's five-step, top-down BACT approach typically includes the following items for each source category: I) the identification of available control technologies; 2) the elimination of the technically infeasible alternatives; 3) the ranking of the remaining control technologies; 4) the evaluation of the most effective controls regarding cost-effectiveness, energy impacts, and environmental effects; and 5) the selection of BACT.
For the sources associated with the proposed facilities, this BACT review is provided in Appendix D, Best Available Control Technology. It should be noted that the existing cogeneration units are not subject to BACT since they are not modified sources. The cogeneration units are included in this application because they are considered affected facilities that influence PSD applicability.
(k) Source impact analysis.
Subsection (k) requirements prevent a proposed source or modification from causing or contributing to a violation of a national ambient air quality standard (NAAQS) or an applicable maximum allowable increase over the baseline concentration in any area. However, since NAAQS and baseline concentrations have not been established for GHGs, these requirements are not relevant to this application.
(I) Air quality models.
Subsection (I) requirements specify that all estimates of ambient concentrations must be based on applicable air quality models, data bases, and other requirements specified in Appendix W of 40 CFR 51 (Guideline on Air Quality Models). However, since no air quality modeling is required for GHGs, these specifications are not applicable.
12

Occidental Chemical Corporation October 20 13
(m) Air quality analysis.
The air quality requirements for pre-application monitoring and post-construction monitoring in Subsection (m) of the rules is not required for GHGs since EPA regulations provide an exemption in 40 CFR 52.21 (i)(5)(iii) and 51.166(i)(5)(iii) for pollutants, including GHGs, that are not listed in the appropriate section of the regulations. Therefore, it is understood that the EPA does not require applicants to gather monitoring data to evaluate ambient air quality for GHGs under 40 CFR 52.2l(m)(l)(ii), 40 CFR 51.166(m)(l)(ii) or similar provisions.
(n) Source information.
The GHG permit applicant is required to provide all information necessary to perform any analysis or make any determination required under these PSD rules, including the following: a description of the nature, location, design capacity and typical operating schedule of the source, a schedule for construction of the source, a detailed description of emission controls, emission estimates and any other information necessary relative to demonstrating BACT. This information is provided in the previous process discussion and in Appendices A, B, C and D.
Also, it is understood that upon request of the Administrator, the applicant must provide information on the air quality impact of the new sources, including meteorological and topographical data necessary to estimate such impact, and the nature and extent of any or all general commercial, residential, industrial, and other growth expected to occur as a result of the proposed project.
ln addition, it is understood that EPA is required to ensure compliance with the Endangered Species Act, the National Historic Preservation Act, Environmental Justice mandates, and the Magnuson-Stevens Fishery Conservation and Management Act, as applicable to agency decisions regarding the GHG PSD permit issuance process.
Endangered Species Act (ESA):
It is our understanding that OxyChem will serve as its non-federal agent for informal consultation and the associated compliance review process pursuant to ESA. The U.S. Fish and Wildlife Service (USFWS) office of jurisdiction will likely be the Corpus Christi Field Office.
The initial informal consultation process typically includes identifying the list of federally-listed threatened and endangered (T&E) species that may occur in each county within the action area, collecting existing baseline information on each species (e.g., habitat requirements, approved survey protocols, known records of occurrence, etc.), performing potential habitat surveys of the action area, and identifying potential occurrences and associated project impacts on each species.
If no T&E species are listed within the action area, then the USFWS typically would concur with a "no effect" determination. If no known occurrences or potential habitat for identified T&E species are present within the action area, then the USFWS typically would concur with a "not
13

Occidental Chemical Corporation October 2013
likely to adversely affect" determination. Either of these determinations would conclude the informal consultation process, and obviate the need to enter into formal consultation.
The formal consultation process is reserved for projects that are likely to adversely affect a federally-listed T&E species. Under this process, the EPA would request that OxyChem conduct any required in-field, habitat and species-specific surveys, prepare a Biological Assessment (BA) on behalf of EPA, and file the BA with USFWS. If upon BA review the USFWS determines the project is not likely to adversely affect a T&E species, the formal consultation is then concluded.
OxyChem's documentation in satisfaction of these requirements is separate from the current GHG PSD permit application submittal. These reports were submitted to EPA in June of 2013.
National Historic Preservation Act (NHPA):
For the proposed Ethylene Plant, an approval letter from the executive director of the Texas Historical Commission (THC) will likely meet the EPA's NHPA compliance requirements. The EPA will retain primary consultation authority for NHPA compliance, and will not request that OxyChem serve as its non-federal agent. A Cultural Resource Report was submitted to EPA in July of2013 for review and submittal to THC. Environmental Justice (EJ):
OxyChem's understanding is that the EPA will be responsible for evaluating whether operation of the proposed ethylene production facilities will result in an EJ concern. The EPA is expected to run a model to perform the EJ evaluation. The EPA does not anticipate that OxyChem will need to perform any additional evaluations.
Magnuson-Stevens Fishery Conservation and Management Act (MSFCMA):
For the proposed Ethylene Plant, an approval letter from the National Oceanic and Atmospheric Administration-National Marine Fisheries Service (NOAA-NMFS), Habitat Conservation Division, Galveston Office will likely meet the EPA's MSFCMA compliance requirements. It is our understanding that the EPA will retain primary consultation authority for MSFCMA compliance and will not request that OxyChem serve as its non-federal agent.
OxyChem submitted an Essential Fish Habitat (EFH) Assessment in June of 2013 for EPA review and submittal to NMFS-Habitat Conservation Division.
(o) Additional impact analyses.
Subsection (o) requirements typically result in an analysis of the potential impairment to visibility, soils and vegetation that may occur as a result of the proposed source or modification and the expected general commercial, residential, industrial and other growth. Also, the Administrator may require monitoring of visibility in any nearby Federal Class I area.
14

Occidental Chemical Corporation October 20 13
However, an impact analysis is not required for GHG pollutants. The EPA's document entitled "PSD and Title V Permitting Guidance for Greenhouse Gases" prepared by the Office of Air Quality Planning and Standards and dated March 20 II, states the EPA's belief that it is not necessary for applicants to assess impacts from GHGs in the context of the additional impacts analysis or Class I area provisions of the PSD regulations for several reasons. The reasons provided by the EPA are that climate change modeling and impact evaluations are typically conducted for changes in emissions much larger than those from individual projects and that quantifying the impacts from a specific, permitted GHG source would not be possible with current climate change models.
This EPA document concludes that the most practical approach to addressing Class I areas and additional impacts analysis is to focus on maximizing the reduction of GHGs through compliance with the BACT analysis.
(p) Sources impacting Federal Class I areas- additional requirements.
Subsection (p) rules include the requirement that the Administrator provide written notice of the permit application and provide other information for a proposed major stationary source or major modification when the emissions may affect a Federal Class I area. Since the nearest Class I area is the Big Bend National Park, which is located more than 350 miles (600 kilometers) from the proposed facilities, the emissions from this project are not expected to have an impact on this Class I area. In addition, the EPA position explained in Item (o) regarding additional impact analyses appears to apply to these additional Class I concerns.
(q) Public participation.
Subsection (q) rules place certain requirements on the Administrator to follow the applicable public notice procedures of 40 CFR 124 in processing applications under this section. It is expected that the Administrator will follow the procedures at 40 CFR 52.2l(r) to the extent that the procedures of 40 CFR 124 do not apply.
(r) Source obligation.
It is understood that these requirements preclude an owner or operator from constructing or operating a source or modification not in accordance with the application submitted pursuant to these PSD requirements or with the terms of the issued permit. In addition, it is understood that the permit is invalid if construction is not commenced within 18 months after receipt of the permit (unless an extension is authorized), if construction is discontinued for a period of 18 months or more, and if construction is not completed within a reasonable time.
(s) Environmental impact statements.
These rules state that whenever a proposed source is subject to permitting action by a federal
15

Occidental Chemical Corporation October 2013
agency that might necessitate preparation of an environmental impact statement pursuant to the National Environmental Policy Act (NEPA, 42 U.S.C. 4321), review by the Administrator conducted pursuant to this section shall be coordinated with the environmental reviews under that Act and under Section 309 of the Clean Air Act. However, it appears that NEPA is not applicable to this GHG permit action because of the exemption from NEPA for air permitting (15 USC§ 793(c)).
(t) Disputed permits or redesignations.
OxyChem understands that certain affected parties who determine a proposed permit will cause or contribute to a cumulative change in air quality in excess of that allowed by these rules may request the Administrator to enter into negotiations with the parties involved to resolve the concerns.
(u) Delegation of authority.
OxyChem understands that the delegation of responsibility for conducting GHG source review permitting has not occurred in Texas, and therefore, this application is being submitted to the Region 6 Office of the EPA.
(v) Innovative control technology.
OxyChem understands that certain regulatory options exist for implementing innovative control technology for a PSD permit. However, no innovative controls are proposed for the new ethylene production facilities.
(w) Permit rescission.
OxyChem understands that a permit issued under these PSD rules shall remain in effect, unless and until it expires under the regulations referenced above or is rescinded.
16

Occidental Chemical Corporation October 201 3
APPENDIX A GENERAL APPLICATION AND PSD APPLICABILITY FORMS

Texas Commission on Environmental Quality Form PI-1 General Application for
Air Preconstruction Permit and Amendment
Important Note: The agency requires that a Core Data Form be submitted on all incoming applications unless a Regulated Entity and Customer Reference Number have been issued and no core data information has changed. For more information regarding the Core Data Form, call (512) 239-5175 or go to www. tceq. texas.gov /permitting/ central_registry I guidance.html.
I. Applicant Information
A. Company or Other Legal Name: Occidental Chemical Corporation
Texas Secretary of State Charter/Registration Number (if applicable):
B. Company Official Contact Name: Paul A. Thomas
Title: Plant Manager
Mailing Address: P.O. Box CC
City: Ingleside State: TX ZIP Code: 78362-0720
Telephone No.: (361) 776-6169 Fax No.: (361) 776-6240 E-mail Address: [email protected]
c. Technical Contact Name: Mark R. Evans
Title: Environmental Manager
Company Name: Occidental Chemical Corporation
Mailing Address: P.O. Box CC
City: Ingleside State: TX ZIP Code: 78362-0720
Telephone No.: (361) 776-6169 Fax No.: (361) 776-6240 E-mail Address: [email protected]
D. Site Name: Ingleside Chemical Plant
E. Area Name/Type of Facility: Ethylene Plant I [8] Permanent 0 Portable
F. Principal Company Product or Business: Chemical Manufacturing
Principal Standard Industrial Classification Code (SIC): 2869
Principal North American Industry Classification System (NAICS): 325199
G. Projected Start of Construction Date: 6{30{14
Projected Start of Operation Date: 9{30{16
H. Facility and Site Location Information (If no street address, provide clear driving directions to the site in writing.):
Street Address: 4133 Hwy 361; 2 miles west of Hwy 1069 on Hwy 361
City /Town: Gregory County: San Patricio ZIP Code: 78359
Latitude (nearest second): 27' 52' 51" I Longitude (nearest second): 97° 14' 39"
TCEQ-10252 (Revised 10/12) PI-t Instructions This form is for use by facilities subject to air quality requirements and may be revised periodically. (APDG 5171v19) Page 1 of 9

I.
I.
J.
Texas Commission on Environmental Quality Form PI-1 General Application for
Air Preconstruction Permit and Amendment
Applicant Information (continued)
Account Identification Number Oeave blank if new site or facility): SD-0092-F
Core Data Form.
Is the Core Data Form (Form 10400) attached? If No, provide customer reference number and regulated entity number (complete K and L).
K. Customer Reference Number (CN): 600125256
L. Regulated Entity Number (RN): 100211176
II. General Information
A. Is confidential information submitted with this application? If Yes, mark each confidential page confidential in large red letters at the bottom of each page.
B. Is this application in response to an investigation, notice of violation, or enforcement action? If Yes, attach a copy of any correspondence from the agency and provide the RN in section I.L. above.
c. Number of New Jobs: 123
OYES~NO
OYES~NO
OYES~NO
D. Provide the name of the State Senator and State Representative and district numbers for this facility site:
State Senator: Judith Zarrafini District No.: 21
State Representative: Todd Hunter District No.: 32
III. Type of Permit Action Requested
A. Mark the appropriate box indicating what type of action is requested.
~Initial 0Amendment D Revision (30 TAC u6.u6(e) 0Change of Location 0 Relocation
B. Permit Number (if existing):
c. Permit Type: Mark the appropriate box indicating what type of permit is requested. (check all that apply, skip for change of location)
~ Construction D Flexible 0 Multiple Plant D Nonattainment 0 Plant-Wide Applicability Limit
~ Prevention of Significant Deterioration 0 Hazardous Air Pollutant Major Source
D Other:
D. Is a permit renewal application being submitted in conjunction with this OYES~NO amendment in accordance with 30 TAC 116.315(c).
TCEQ-10252 (Revised 10{12) PI-1 Instructions This form is for use by facilities subject to air quality requirements and may be revised periodically. (APDG 5171Vt9) Page 2 of 9

III.
E.
Texas Commission on Environmental Quality Form PI-1 General Application for
Air Preconstruction Permit and Amendment
Type of Permit Action Requested (continued)
Is this application for a change of location of previously permitted facilities? IfYes, complete III.E.1- III.E40
OYES~NO
1. Current Location of Facility (If no street address, provide clear driving directions to the site in writing.):
Street Address:
City: I county: ZIP Code:
2. Proposed Location of Facility (If no street address, provide clear driving directions to the site in writing.):
Street Address:
City: jcounty: ZIP Code:
3· Will the proposed facility, site, and plot plan meet all current technical requirements of 0YES0NO the permit special conditions? If "NO", attach detailed information.
4· Is the site where the facility is moving considered a major source of criteria pollutants 0YES0NO or HAPs?
F. Consolidation into this Permit: List any standard permits, exemptions or permits by rule to be consolidated into this permit including those for planned maintenance, startup, and shutdown.
List: none
G. Are you permitting planned maintenance, startup, and shutdown emissions? If Yes, IZJYES0NO attach information on any changes to emissions under this application as specified in VII and VIII.
H. Federal Operating Permit Requirements IZI YES 0 NO 0 To be determined (30 TAC Chapter 122 Applicability) Is this facility located at a site required to obtain a federal operating permit? IfYes, list all associated permit number(s), attach pages as needed).
Associated Permit No (s.) : 01240 for the existing site; a new permit will be requested for the proposed facilities
1. Identify the requirements of 30 TAC Chapter 122 that will be triggered if this application is approved.
[8] FOP Significant Revision OFOPMinor D Application for an FOP Revision
0 Operational Flexibility/Off-Permit Notification 0 Streamlined Revision for GOP
D To be Determined 0None
TCEQ-10252 (Revised 10/12} PI-1Instructions This form is for usc by facilities subject to air quality requirements and may be revised periodically. (APDG 517tV19} Page 3 of9

, Texas Commission on Environmental Quality Form PI-1 General Application for
Air Preconstruction Permit and Amendment
lll. Type of Permit Action Requested (continued)
H. Federal Operating Permit Requirements (30 TAC Chapter 122 Applicability) (continued)
2. Identify the type(s) of FOP(s) issued and/or FOP application(s) submitted/pending for the site. (check all that apply)
0 GOP Issued 0 GOP application/revision application submitted or under APD review
lZ! SOP Issued !8] SOP application/revision application submitted or under APD review
IV. Public Notice Applicability
A. Is this a new permit application or a change oflocation application? IZ!YES0NO
B. Is this application for a concrete batch plant? If Yes, complete V.C.1 - V.C.2. OYESIZ!NO
c. Is this an application for a major modification of a PSD, nonattainment, !8]YES0NO FCAA 112(g) permit, or exceedance of a PAL permit?
D. Is this application for a PSD or major modification of a PSD located within OYESIZ!NO 100 kilometers or less of an affected state or Class I Area?
If Yes, list the affected state(s) and/or Class I Area(s).
List:
E. Is this a state permit amendment application? IfYes, complete IV.E.1. - IV.E.3. 0YES!8]NO
1. Is there any change in character of emissions in this application? 0YES0NO
2. Is there a new air contaminant in this application? 0YES0NO
3· Do the facilities handle, load, unload, dry, manufacture, or process grain, seed, 0YES0NO legumes, or vegetables fibers (agricultural facilities)?
F. List the total annual emission increases associated with the application (List all that apply and attach additional sheets as needed):
Greenhouse Gases (GHG) : 585,217.55 tons/yr
Volatile Organic Compounds (VOC):
Sulfur Dioxide (S02) :
Carbon Monoxide (CO):
Nitrogen Oxides (NOx):
Particulate Matter (PM):
PM 10 microns or less (PM1o):
PM 2.5 microns or less (PM2.5):
Hazardous Air Pollutants (HAPs):
Other speciated air contaminants not listed above:
TCEQ-10252 (Revised 10/12) PI-t Instructions This form is for use by facilities subject to air quality requirements and may be revised periodically. (APDG 5171V19) Page 4 of 9
n Texas Commission on Environmental Quality Form PI-1 General Application for
Air Preconstruction Permit and Amendment
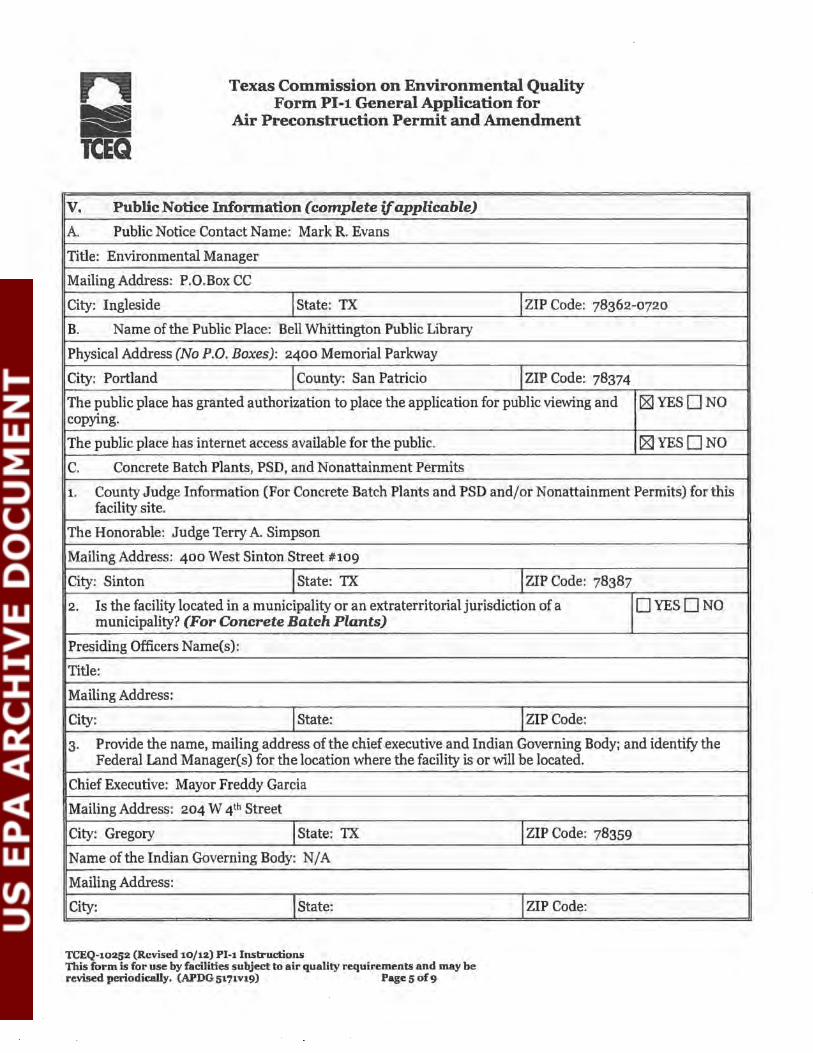
v. Public Notice Infonnation (complete if applicable)
A. Public Notice Contact Name: Mark R. Evans
Title: Environmental Manager
Mailing Address: P.O.Box CC
City: Ingleside !state: TX I ZIP Code: 78362-0720
B. Name of the Public Place: Bell Whittington Public Library
Physical Address (No P.O. Boxes): 2400 Memorial Parkway
City: Portland I County: San Patricio I ziP Code: 78374
The public place has granted authorization to place the application for public viewing and 18]YES0NO copying.
The public place has internet access available for the public. 18]YES0NO
c. Concrete Batch Plants, PSD, and Nonattainment Permits
1. County Judge Information (For Concrete Batch Plants and PSD and/or Nonattainment Permits) for this facility site.
The Honorable: Judge Terry A. Simpson
Mailing Address: 400 West Sinton Street #109
City: Sinton !state: TX I ZIP Code: 78387
2. Is the facility located in a municipality or an extraterritorial jurisdiction of a 0YES0NO municipality? (For Concrete Batch Plants)
Presiding Officers Name(s):
Title:
Mailing Address:
City: I state: I ZIP Code:
3· Provide the name, mailing address of the chief executive and Indian Governing Body; and identify the Federal Land Manager(s) for the location where the facility is or will be located.
Chief Executive: Mayor Freddy Garcia
Mailing Address: 204 W 4th Street
City: Gregory !state: TX I ZIP Code: 78359
Name of the Indian Governing Body: N/ A
Mailing Address:
City: I state: I ZIP Code:
TCEQ-10252 (Revised 10/12) PI-1 Instructions This form is for use by facilities subject to air quality requirements and may be revised periodically. (APDG 5171V19) Page 5 of9

v. c.
Texas Commission on Environmental Quality Form PI-1 General Application for
Air Preconstruction Permit and Amendment
Public Notice Information (complete if applicable) (continued)
Concrete Batch Plants, PSD, and Nonattainment Permits
3- Provide the name, mailing address of the chief executive and Indian Governing Body; and identify the Federal Land Manager(s) for the location where the facility is or will be located. (continued)
Name of the Federal Land Manager(s):
D. Bilingual Notice
Is a bilingual program required by the Texas Education Code in the School District? OYES~NO
Are the children who attend either the elementary school or the middle school closest to OYES~NO your facility eligible to be enrolled in a bilingual program provided by the district?
If Yes, list which languages are required by the bilingual program? I VI. Small Business Classification (Required)
A. Does this company (including parent companies and subsidiary companies) have OYES~NO fewer than 100 employees or less than $6 million in annual gross receipts?
B. Is the site a major stationary source for federal air quality permitting? ~YES0NO
c. Are the site emissions of any regulated air pollutant greater than or equal to ~YES0NO so tpy?
D. Are the site emissions of all regulated air pollutants combined less than 75 tpy? OYES~NO
VII. Technical Information
A. The following information must be submitted with your Form PI-1 (this is just a checklist to make sure you have included everything)
1. ~ Current Area Map
2. ~Plot Plan
3- ~ Existing Authorizations
4· ~ Process Flow Diagram
s. ~ Process Description
6. ~ Maximum Emissions Data and Calculations
7· ~ Air Permit Application Tables
a. ~ Table 1(a) (Form 10153) entitled, Emission Point Summary
b. ~Table 2 (Form 10155) entitled, Material Balance
c. ~ Other equipment, process or control device tables
B. Are any schools located ·within 3,000 feet of this facility? IDYES~NO
TCEQ-10252 (Revised 10/12) Pl· t Instructions This form is for use by facilities subject to air quality requirements and may be revised periodically. (APDG 5171Vt9) Page 6 of9

VII.
c.
Texas Commission on Environmental Quality Form PI-1 General Application for
Air Preconstruction Permit and Amendment
Technical Information
Maximum Operating Schedule:
Hour(s): 24 I Day(s): 7 I Week(s): 52 jYear(s):
Seasonal Operation? IfYes, please describe in the space provide below. 0YESI8]NO
D. Have the planned MSS emissions been previously submitted as part of an emissions 0YESI8]NO inventory?
Provide a list of each planned MSS facility or related activity and indicate which years the MSS activities have been included in the emissions inventories. Attach pages as needed.
E. Does this application involve any air contaminants for which a disaster review is 18JYES0NO required?
F. Does this application include a pollutant of concern on the Air Pollutant Watch List 0YESI8]NO (APWL)?
VIII. State Regulatory Requirements Applicants must demonstrate compliance with all applicable state regulations to obtain a permit or amendment. The application must contain detailed attachments addressing applicability or non applicability; identify state regulations; show how requirements are met; and include compliance demonstrations.
A. Will the emissions from the proposed facility protect public health and welfare, and 18]YES0NO comply with all rules and regulations of the TCEQ?
B. Will emissions of significant air contaminants from the facility be measured? 18]YES0NO
c. Is the Best Available Control Technology (BACT) demonstration attached? 18JYES0NO
D. Will the proposed facilities achieve the performance represented in the permit 18]YES0NO application as demonstrated through recordkeeping, monitoring, stack testing, or other applicable methods?
IX. Federal Regulatory Requirements Applicants must demonstrate compliance with all applicable federal regulations to obtain a permit or amendment. The application must contain detailed attachments addressing applicability or non applicability; identify federal regulation subparts; show how requirements are met; and include compliance demonstrations.
A. Does Title 40 Code of Federal Regulations Part 60, (40 CFR Part 6o) New Source 18]YES 0 NO Performance Standard (NSPS) apply to a facility in this application?
B. Does 40 CFR Part 61, National Emissions Standard for Hazardous Air Pollutants [g)YES 0 NO (NESHAP) apply to a facility in this application?
TCEQ-10252 (Revised t0/12) PI-t Instructions This form is for use by facilities subject to air quality requirements and may be revised periodically. (APDG 5171vt9) Page 7 of9

,., Texas Commission on Environmental Quality Form PI-1 General Application for
Air Preconstruction Permit and Amendment
IX. Federal Regulatory Requirements Applicants must demonstrate compliance with all applicable federal regulations to obtain a permit or amendment. The application must contain detailed attachments addressing applicability or non applicability; identify federal regulation subparts; show how requirements are met; and include compliance demonstrations.
c. Does 40 CFR Part 63, Maximum Achievable Control Technology (MACT) standard ~YES0NO apply to a facility in this application?
D. Do nonattainment permitting requirements apply to this application? OYES~NO
E. Do prevention of significant deterioration permitting requirements apply to this ~YES0NO application?
F. Do Hazardous Air Pollutant Major Source [FCAA 112(g)] requirements apply to this 0YES181NO application?
G. Is a Plant-wide Applicability Limit permit being requested? OYES~NO
X. Professional Engineer (P.E.) Seal
Is the estimated capital cost of the project greater than $2 million dollars? I~YESONO If Yes, submit the application under the seal of a Texas licensed P.E.
XI. Permit Fee Information
Check, Money Order, Transaction Number ,ePayVoucher Number: I Fee Amount:
Paid online? IDYESONO
Company name on check:
Is a copy of the check or money order attached to the original submittal of this 0YES0N00N/ A application?
Is a Table 30 (Form 10196) entitled, Estimated Capital Cost and Fee Verification, 0YES0N00N/ A attached?
TCEQ-10252 (Revised 10/12) PI-t Instructions This form is for use by facilities subject to air quality requirements and may be revised periodically. (APDG 5171Vt9) Page 8 ofg

Texas Commission on Environmental Quality Form PI-1 General Application for
Air Preconstruction Permit and Amendment
XII. Delinquent Fees and Penalties
This form will not be processed until all delinquent fees andjor penalties owed to the TCEQ or the Office of the Attorney General on behalf of the TCEQ is paid in accordance with the Delinquent Fee and Penalty Protocol. For more information regarding Delinquent Fees and Penalties, go to the TCEQ Web site at: www.tceq.texas.govfagencyfdelin/index.html.
XIII. Signature
The signature below confirms that I have knowledge of the facts included in this application and that these facts are true and correct to the best of my knowledge and belief. I further state that to the best of my knowledge and belief, the project for which application is made will not in any way violate any provision of the Texas Water Code (TWC), Chapter 7, Texas Clean Air Act (TCAA), as amended, or any of the air quality rules and regulations of the Texas Commission on Environmental Quality or any local governmental ordinance or resolution enacted pursuant to the TCAA I further state that I understand my signature indicates that this application meets all applicable nonattainment, prevention of significant deterioration, or major source of hazardous air pollutant permitting requirements. The signature further signifies awareness that intentionally or knowingly making or causing to be made false material statements or representations in the application is a criminal offense subject to criminal penalties.
Name: Paul A. Thomas
Signature: Original Signature Required
Date:
TCEQ-10252 (Revised 10j12) PI-t Instructions This form is for use by facilities subject to air quality requirements and may be revised periodically. (APDG 5171V19) Page 9 of9
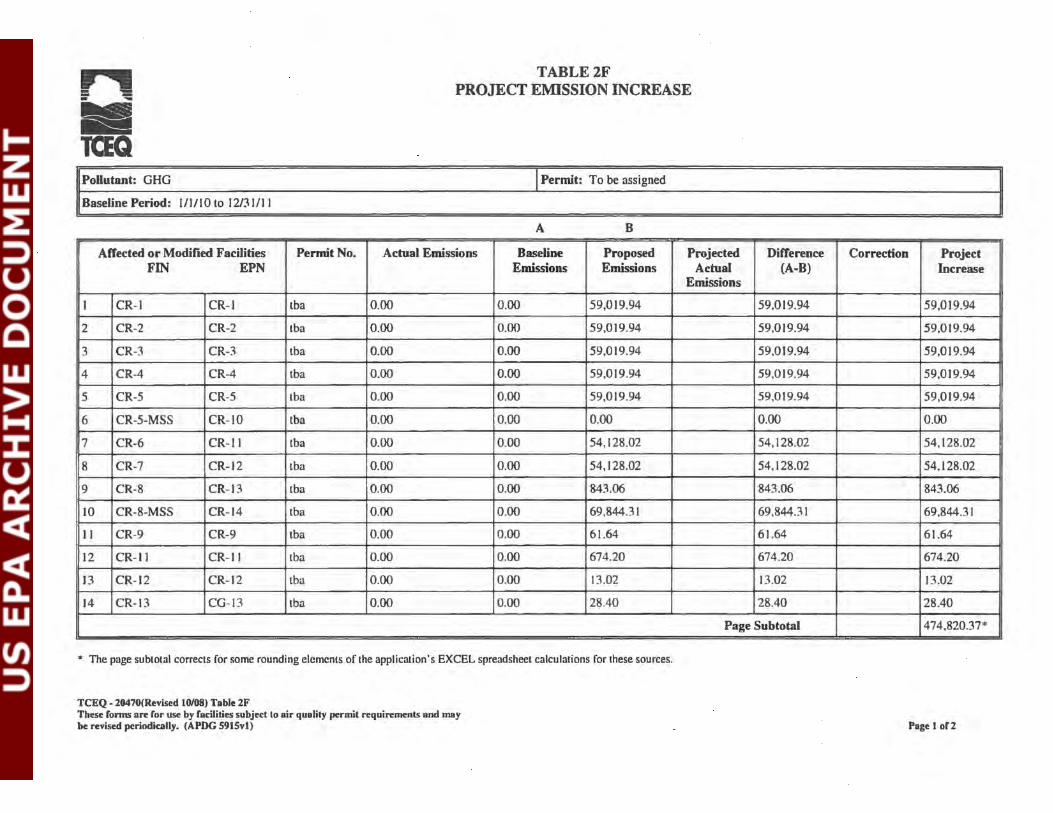
TABLE2F PROJECT EMISSION INCREASE
Pollutant: GHG I Permit: To be assigned
Baseline Period: IIIII 0 to 12/31/1 I
A B ----- - --
Affected or Modified Facilities Permit No. Actual Emissions Baseline Proposed FIN EPN Emissions Emissions
I CR-1 CR-1 tba 0.00 0.00 59,019.94
2 CR-2 CR-2 tba 0.00 0.00 59,019.94
3 CR-3 CR-3 tba 0.00 0.00 59,019.94
4 CR-4 CR-4 tba 0.00 0.00 59,019.94
5 CR-5 CR-5 tba 0.00 0.00 59,019.94
6 CR-5-MSS CR-10 tba 0.00 0.00 0.00
7 CR-6 CR-11 tba 0.00 0.00 54,128.02
8 CR-7 CR-12 tba 0.00 0.00 54,128.02
9 CR-8 CR- 13 tba 0.00 0.00 843.06
10 CR-8-MSS CR-14 tba 0.00 0.00 69,844.31
II CR-9 CR-9 tba 0.00 0.00 61.64
12 CR-11 CR-11 tba 0.00 0.00 674.20
13 CR-12 CR-12 tba 0.00 0.00 13.02
14 CR-13 CG-13 tba 0.00 0.00 28.40
• The page subtotal corrects for some rounding elements of the application's EXCEL spreadsheet calculations for these sources.
TCEQ- 20470(Reviscd 10108) Table 2F These Fonns ore For use by Facilities subject to air quality permit requirements and may be revised periodically. (APDG 591Svl)
Projected Difference Actual (A-B)
Emissions
59,019.94
59,019.94
59,019.94
59,019.94
59,019.94
0.00
54,128.02
54,128.02
843.06
69,844.31
61.64
674.20
13.02
28.40
Page Subtotal
Correction Project Increase
59,019.94
59,019.94
59,019.94
59,019.94
59,019.94
0.00
54,128.02
54,128.02
843.06
69,844.31
61.64
674.20
13.02
28.40
474,820.37*
Page 1 oF2
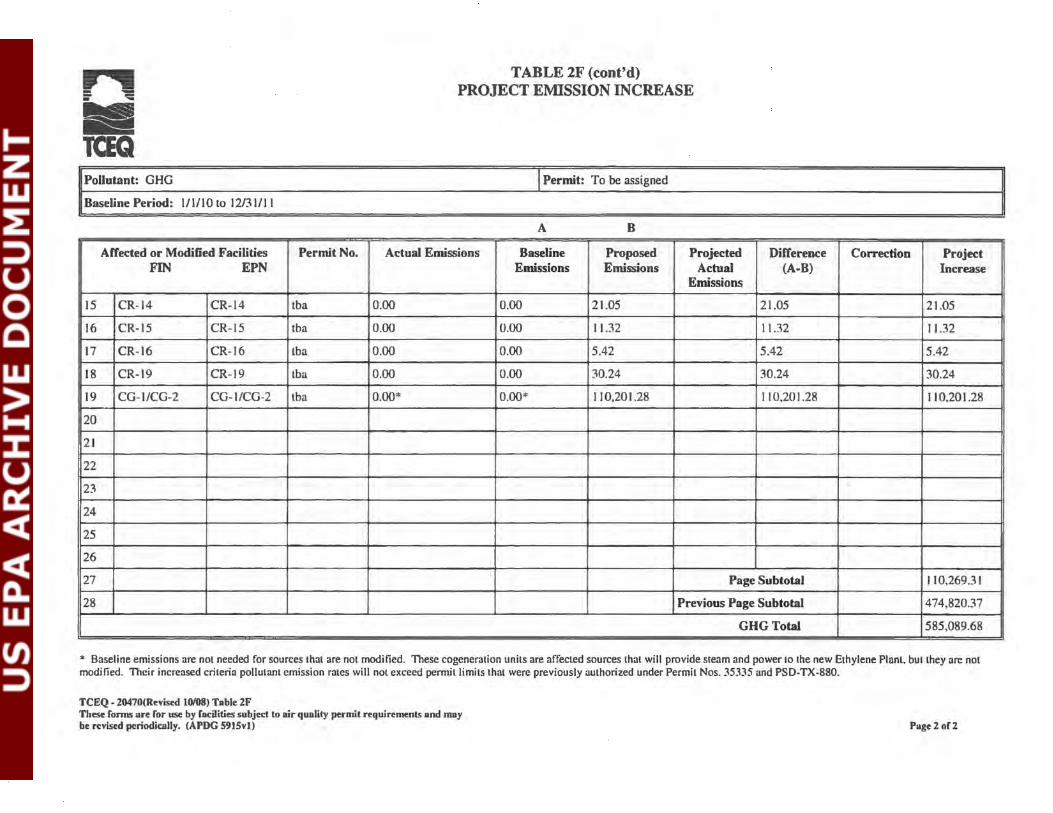
Pollutant: GHG
Baseline Period: 1/1/10 to 12/31/11
Affected or Modified Facilities Permit No. FIN EPN
15 CR-14 CR-14 tba
16 CR-15 CR-15 tba
17 CR-16 CR-16 tba
18 CR-19 CR-19 tba
19 CG-1/CG-2 CG-1/CG-2 tba
20
21
22
23
24
25
26
27
28
TABLE 2F (cont'd) PROJECT E:MISSION INCREASE
I Permit: To be assigned
A B
Actual Emissions Baseline Proposed Projected Difference Emissions Emissions Actual (A-B)
Emissions
0.00 0.00 21.05 21.05
0.00 0.00 11.32 11.32
0.00 0.00 5.42 5.42
0.00 0.00 30.24 30.24
0.00* 0.00* 110,201.28 110,201.28
Page Subtotal
Previous Page Subtotal
GHGTotal
Correction Project Increase
21.05
11.32
5.42
30.24
110,201.28
110.269.31
474,820.37
585,089.68
'" Baseline emissions are not needed for sources that are not modified. These cogeneration units are affected sources that will provide steam and power to the new Ethylene Plant. but they are not modified. Their increased criteria pollutant emission rates will not exceed permit limits that were previously authorized under Permit Nos. 35335 and PSD-TX-880.
TCEQ - 20470(Revised 10108) Table 2F These £onns are Cor use by £acilities subject to air quality permit requirements and may be revised periodicully. (APDG 591Svl) Page2o£2

.---.... TABLE3F = .. - - PROJECT CONTEMPORANEOUS CHANGES
Company: Occidental Chemical Corporation
Permit Application Number: To be assigned Criteria Pollutant GHG
A B
Project Date Facility at Which Emission Change Permit No. Project Name or Baseline Baseline Proposed Difference Creditable Occurred Activity Period Emissions Emissions (A-B) Decrease or
FIN EPN (tonsfyear) (tonsfyear) Increase
1 2/2017 CR-1 thru CR16; CR-1 thru CR16; To be Ethylene Plant 1/10-12/11 0.00 585,089.68 585,089.68 585,089.68 CG-1 and CG-2 CG-1 and CG-2 assigned
2 7/2014 NGL-1 thru 14; NGL-1 thru 14; PSD-TX- NGL Fractionation 1/10-12/11 0.00 243,367.87• 243,367.87 243,367.87 CG-1 and CG-2 CG-1 and CG-2 1292-GHG Facilities
3
4
5
6
7
8
9
10
11
PaRe Subtotal 828,457.55
Project Emission 828,457.55
Summary of Contemporaneous Changes Total 828,457.55
• The 243,367.87 tonslyr increase is the sum of242.536.30 tons/yr. indicated in the initial application. and 831.57 tons/yr. indicated in the deficiency response dated August I. 2012.
TCEQ- 10156 (Revised 10108) Table 3F These forms arc: for use by facilities subject to air quality permil requirements and may be revised periodically. (APDG 5913v1) Page 1 of 1
'
Occidental Chemical Corporation October 2013
APPENDIXB AREA MAP, PLOT PLAN AND OTHER SUPPORTING DOCUMENTS

,, / \ / \
' \
··.,.,. .,_,.. --- - -//
Nfl,~i.l
\
/ - ~ ~~-
/ ' : / 1-----N
"' I \ ,I ------- _,~~~~~:;#:~~~~
., ..... . ·~
cv ,, _ _,_____ M!
--------1---- -7,:: I ~ \.. ~ ~.~~ 1l I I , CD ·-. ~/
1 1
\ 2 - _ r _ ,,_ ~ I -}
I f ; ~~\
~ ...... . \ \ \ \ \
' '
i I.
Occidental Chemical ColporatJon (OxyChem) 2--ai~IIHHIIXI~:JIII Gnlgory. T-783511 Gnlgory, _,.. Paa, Parllond. ond Pall~. T-Quodnlnglol; UN l.ane 15
112
I I
d.i I /
/ I
/ /
/ i / a
~MILE IIXIO D IDOD 2IXXI 3000 40011 S0CXJ 68111 71100 Fl!!!T
I > IIULOMEI1!ll. jmr/j m m m.........,.
.
'• " -~ .. 1i. ~ .>
""".1"' ..
~
" 13
; !
Le2end
Property Owners • .... CD OxyCbcm • .... ®DuPont IX ,
@ ICLP I
Leaseholders ~ @DuPont . @ Air Liquidc " @ QxyMar
:z
0
...1
,..._. r.UIOSIIIID"rAul*l CAD ...... ......., T-
Q _...........,._
-'-"' !ii'IIMI~
-'-"'--.......... U1NC.Ifl).umi'U\~fiiOIIYW
OCCU*f'Of AI' Cllm." U(£1'

~ "" "' "" uo
I -0-
il
"' "' "' ~
"' 'i -··'f ~ ~
0.: u z Ow I
,. "' "' ~
-I I
c::
;11 "' "" :0
"" co
~ T
'" ~ ,_.;
}
i <D• I
0: u z
LiJ -=
I
~; Ji 7
- -~
:::-
__._ -7-r
.~
,_ .. _ !--
i\ ') eh
"' "' "" "' "" ,, ::-"'
~
H it~ lo ~ z ~; <:
~; LO
CJ ~
~~ 7. v w 0:
~ :::>
_jl 0
~-'" [;; Y.'
H w z
c!!~ Q i5 ~ n
<.:> z
(;) ;!; ~ i:; "' 0 ~
llORt. 11
0BBel N
u~•~rrr
0~90!'N
03821"11

Water
Ethane z ~I
Ethylene Fractionator
Ethylene to VCM & Ethylene Pipeline
EPN CR-19 Hydrogen Vent
Propane /Butane to C3/C4 storage
EPN CR-12 Regeneration
Ethane Cracking Facilities
Ammonia
5 Cracking Furnaces
Fuel Gas From De-Methanizer
Pipeline Natural Gas
Aefri1er.1nt Retum
EPN's CR-1, CR-2, CR-3, CR-4, CR-5
Quench Tower
Steam from Waste Heat to Compressor Steam Turbines
Thermal Oxidizers
3 Stage Compression
Regeneration Vent
Caustic
Caustic Tower
Spent Caustic
De-Methanizer Acetylene
Hydrogenation De-Ethanizer
Molecular Sieve Driers
Hydrogen Rich Vapor
Refrice~nt
Hydrogen Separation
Gasoline
Hydrogen
To Fuel Gas
Solid Waste
Occidental Chemical Corporation Ethane Cracking Facilities
Process Flow Diagram Ingleside, Texas
Page 1 of3 Originator: MRE Revision 1 bv: MRE
Date: 10/8/12 Date: 7/17/13

Ethane Cracking Facilities
Contaminated C: VVater 1 1
Tanks D-4520A/B/C I )I Contaminated Water 1-
w
• ,_
t Tank D-4851
Pyrolysis Gasoline
"' I I
- .... ' .,.
VVastewater ......t.......J Steam Treatment ~ Stripper
Truck Loading
De-Butanizer Bottoms
Off-spec~ Material
r
Tank 0-4852 Collected Oil
Steam to/from Ethylene Unit
Electricity to Ethylene Unit
y Caustic _ , .. J Quench Tower ~ LTower ~
~
• Truck
Loading
Tanks 0-4540A/B Heavy Oil Spent Caustic
.__ __ .... VVet Air
Oxidation
*EPNs CG-1, CG-2 CU-1, CG-FUG
Cog en Unit
VVater
Fuel
• Affected non-modified existing emission sources
t
Tank D-4850 Pyrolysis Gasoline
t
Tank 0-4853 Heavy Oil
~
., Truck
Loading
~
• Truck
Loading
EPN's CR-6 & CR-7
VVater
4 VentGas
Steam from --...,jL----.vvaste Heat
Pipeline Natural Gas
2 Thermal Oxidizers
~. ,_ Three Stage Compression ...----..,
Tank 0-4720 Wash Oil
Truck Unloading
Occidental Chemical Corporation Ethane Cracking Facilities
Process Flow Diagram Ingleside, Texas
Page 2 of 3 Originator: MRE Date: 10/8/12 Revision 1 bv: MRE Date: 7/17/13

NGL, Truck Loading, or Pipeline
Ammonia to Cracking Furnace
SCRs
EPN CR-13, CR-14, CR-15, CR-16, *CR-17, *CR-18
Fugitive Areas
From Hydrogenation
Truck Unloading
EPN CR-11
Cooling Tower
Ethane Cracking Facilities
NGL, Truck Loading, or Pipeline
Propylene Refrigeration
System
Tank D-4750 Sulfuric Acid
EPN CR-9
Multiple Uses
Truck Unloading
EPN CR-8
Truck Sulfide to Unloading Cracking Furnace
Tank D-4770 Methanol
Feed
Multiple Uses
Truck Unloading
Truck Unloading
~ Ground Flare
Pipeline Natural Gas
Occidental Chemical Corporation Ethane Cracking Facilities
Process Flow Diagram Ingleside, Texas
mergency nerator Upset &
Vent Gas Page 3 of 3
I *Note: CR-17 and CR-18~r~~~n-GHGs()u~~::J Originator: MRE Date: 10/8/12 Revision 1 bv: MRE Date: 7/17/13
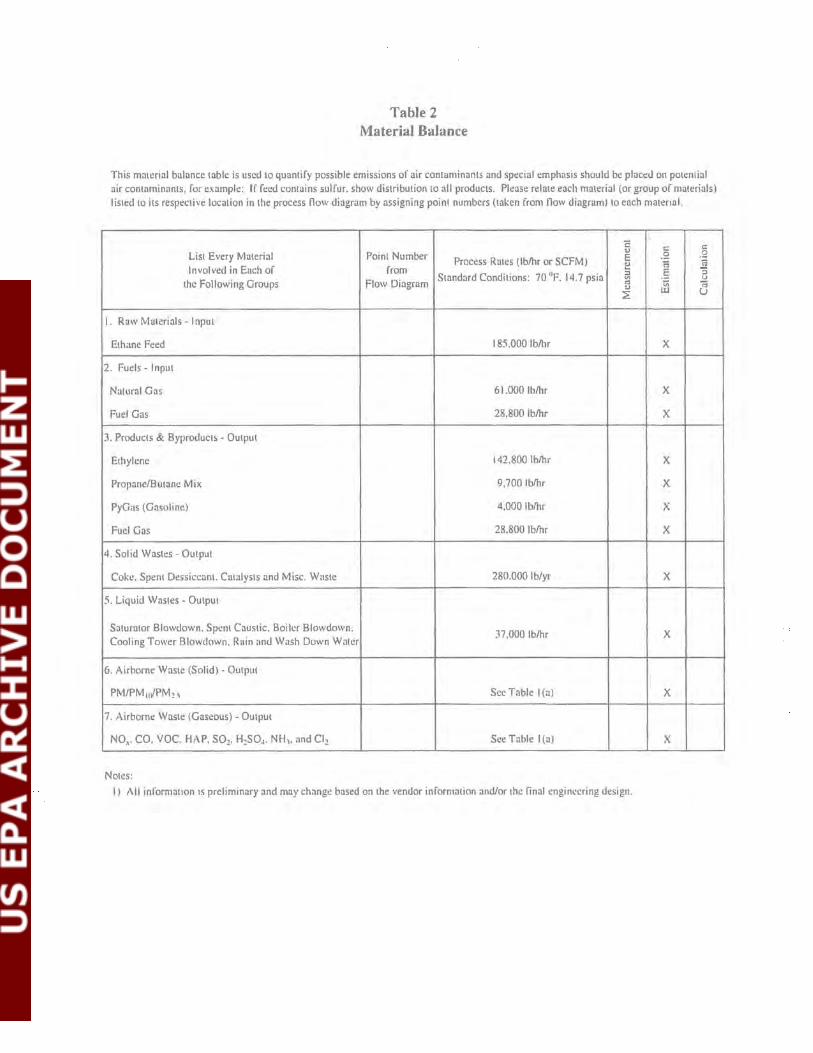
Table 2 Material Balance
This mmerial balance table is used to quantify possible emissions of air contaminants and special emphasis should be plact:d on potential air contaminants, for example: If f~:ed contains sulfur. show distribution to all products. Please relate each material (or group of materials) listed to its respective location in the process flow diagram by assigning point numbers (taken from !low diagram) to each matenal.
E c c ... List Every Material Point Number E 0 0
Process Rates (lblhr or SCFMJ !:! .E ·a
Involved in Each of from Standard Conditions: 70 "F. 14.7 psia :I .§ :;
"' u the Following Groups Flow Diagram "' ;;; ;:; .... UJ u ~
I. Raw Materials- Input
Ethane Feed 185,000 lblhr X
2. Fuels- Input
Natural Gas 61.000 lblhr X
Fuel Gas 28,800 lblhr X
3. Products & Byproducts - Output
Ethylene 142.800 lblhr X
Propane/Butane Mi11 9,700 lblhr X
PyGas (Gasoline) 4,000 lblhr X
Fuel Gas 28,800 lblhr X
4. Solid Wastes- Output
Coke. Spent Dessiccant. Catalysts and Misc. Waste 280.000 lb/yr X
5. Liquid Wastes- Output
SaturDtor Slowdown, Spent Caustic. Boiler Slowdown, 37.000 lblhr X
Cooling Tower Slowdown, Rain and Wash Duwn Water
6. Airborne Waste (Solid) - Output
PM/PM 11/PM 2 , See Table I (a) X
7. Airborne Waste (Gaseous)- Output
NO,. CO, VOC, HAP, S02, H~S04 • NH,, and Cl2 See Table I (a) X
Notes: I) All inform au on 1s preliminary and may change based on the vendor information and/or the final engineering design.
Occidental Chemical Corporation October 2013
APPENDIXC EMISSION CALCULATIONS

Occidental Chemical CorporatiOn October 20 13
EPN Sourcrs
CR-1 Ethane Crackongl'urnace No. I CR-2 Ethane Crackong Furnace No. 2 CR-3 Ethane Crackingl'umoce No 3 CR-4 Ethane Cr•ckong Furnace No.4 CR-5 Ethane Cracking Furnace No 5 CR-1-5-MSS Ethane Cr•ckong Fun101ce Nos 1-5- MSS Activitic> CR-h CR Thennul 0XIdt2er No. I CR-7 CR Thermal Oxidtzer No. 2 CR-8 CR Htgh l'res.,ur< Flare CR-8-MSS CR Htgh Pn:ssure Flore· MSS ActJvnJCS CR-9 CR Emergency Generator Otesel Engone CR-11 CR Cooling Tower CR-12-MSS C31C4 Hy<lmgenatton Regen Vent- MSS Actovnics CR-13 CR Fumacc Area Fugitives CR-14 CR Charge Gas Area Fugiuves CR-15 CR Recovery Area Fugiuvcs
CR-16 CR C3+ Area Fugitives CR-19 Hydrogen Vent CG-1 and CG-2 Co~enc:rn11on Units Totals
CR GIJG SuwLl~ Upd.:nc 102Jil1GIIG Em1~MWili Sunun.:~ty
GHG Emissions Summary
Annual GHG Emissions Global Wormin~ Potential Factors
(ton•iyr)
co, CH, N10 co, CH, N10
58,358.20 7 97 1.59 I 21 310 58,358.20 7.97 1.59 I 21 310 58,358.20 7.97 1.59 I 21 310 58,358.20 7.97 1.59 I 21 310 58,358.20 7 97 1.59 I 21 310
na na na I 21 310 53,938 77 2.31 11.45 I 21 310 53,938.77 2.31 1145 I 21 310
842.24 002 000 I 21 310 69,541.37 3.65 0.73 I 21 310
61.44 O.IJII 0.00 I 21 310 802 09 000 000 I 21 310 12.93 000 0.00 I 21 310 0 01 1.35 000 I 21 310 non 1.110 0.00 I 21 310 000 0.54 0.00 I 21 310 0.00 0.26 0.00 1 21 310 0.00 1.44 0.00 I 21 310
110,1)<13.30 2.118 0 21 I 21 310
----
P..rg-.: lllf 17
Annual C01e Emissions
(ton5/yr)
CH,. C01-r•lated
N,O-
co,. reloted reloted TotoiC01•
co,. co,.
58,358 20 167 43 494.31 59,019.93 58,358.20 1(.7.43 494 31 59,019 93 58,358 20 167.43 494.31 59.019.93 58,358 20 IIJ7 43 49431 59,019.93
I
58,358.20 167 43 494.31 59,019.93 0.00 0.00 000 000
53,938.77 4849 14076 54,128 02 53,938 77 48 49 140 76 54,128 02
842 24 0.33 049 843 07 69,541 37 76.65 226.29 69.844.31
bl.44 0.05 1115 61.1\5 R02 09 000 000 t«l209 12.93 003 o.oc. 13.02 001 28.39 000 28.40 000 21.05 0.00 21.05 0.00 11.32 0.00 11.32 0.00 5.42 0.00 5.42 0.00 30.24 0.00 30.24
110,093.30 43.61 64.37 110.201.27 581,021.94 1,15 I 19_ 3.044& _l_8~217.5(J_

Occidental Chemical Corporation October 2013
Basis:
co" CH4
N:!O
Ethane Cracking Furnace Nos. 1-5 EPN's CR-1, CR-2, CR-3, CR-4 and CR-5
Estimated Emissions Based on Maximum Natural Gas Firing (Worst-Case Calculations for Furnace C02)
275 MM Bru/hr, maximum, total narural gas fuel firing rate 116.91 lb/MM Btu, C02 factor for natural gas from 40 CFR 98, Subpart C,
Table C-1 (converted from 53.02 kg/MM Btu for use with Eq. C-1 b) 0.002 lb/MM Btu, CH4 factor for natural gas from 40 CFR 98, Subpart C,
Table C-2 (converted from 0.00 I kg/MM Btu for use with Eq. C-8b) 0.0002 lb/MM Btu, N20 factor for natural gas from 40 CFR 98, Subpart C,
Table C-2 (converted from 0.0001 kg/MM Btu for use With Eq. C-8b) 8, 760 hr/yr, hours of operation
Pollutant
Emission calculations below represent maximum emissions for each of the five furnaces
Emission Factor Hourly Emissions Annual Emissions (lb/MM Btu) (lb/hr) (tons/yr)
116.91 32,150.00 140,817.0 I
0.002 0.61 2.66
0.0002 0.06 0.27
Calculation methods:
Hourly emissions (lb/hr) =emission factor (lb/MM Btu) x fuel tiring rate (MM Btu/hr) Annual emiss10ns (tons/yr) = hourly emissions (lb/hr) x hours of operatiOn (hr/yr) x
I ton/2,000 lb
CR GHG Sources Update 102313 CR-1 thru CR-5 (Nat Gas) Page 2 of 27

Occidental Chemical Corporation October 20 13
Basis:
Ethane Cracking Furnace Nos. 1-5 EPN's CR-1, CR-2, CR-3, CR-4 and CR-5
Estimated Emissions Based on Maximum Process-Generated Fuel Gas (Hydrogen) Firing (Worst-Case Calculations for Furnace CH4 and N20)
275 MM Btu/hr, maximum process-generated fuel gas firing rate Calculation of C02 based on carbon balance for fuel gas (sec nominal fuel gas speciation below)
0.007 lb MM Btu, CH4 factor for petroleum fuel from 40 CFR 98, Subpart C, Table C-2 (converted from 0.003 kg/MM Btu for use with Eq. C-8b)
0.00 I lb MM Btu, N20 factor tor petroleum fuel from 40 CFR 98, Subpart C, Table C-2 (converted from 0.0006 kg/MM Btu for use with Eq. C-8b)
8, 760 hr yr, hours of operation EmissiOn calculations below represent maximum emissions for each of the five furnaces
Fuel Gas Molecular Higher Heating Max Firing Annual Fuel
No. of Carbons Component
Weight (lbllb Value Rate Firing Rate per Molecule
mole) (Btullb) (lb/hr) (MM Btu/yr)
Methane 16.04 23,900 4658.56 975,335 I
Ethane 30.07 22,336 4.76 931 2
Ethylene 28.10 21,651 108.64 20,605 2
l·lydro~en 2.00 60,828 2644.40 1,409,077 0
Carbon Monoxide 28.01 4,346 119.37 4,545 I
Totals 2.410,493
Emission Total Heating Pollutants Factor Value
(lb/MM Btu) (MM Btu/yr)
CH4 0.007 2,410,493
NP 0.001 2,410,493
Calculation methods:
Annual C01
Emissions (tons/yr)
55,985.15
61.03
1,490.52
0.00
821.50
58,358.20
Annual Emissions (tons/yr)
7.97
1.59
Annual C02 emissions (tons/yr) = fuel gas mass rate (lblhr) x MW em/ MWvoc x no. of carbons x I ton/2,000 lb x 8,760 hr yr Annual fuel gas emissions (tons/yr) =emission factor (lb/MM Btu) x annual fuel firing rate (MM Btu/yr) x I ton/2,000 lb
CR GHG Sourcos Update 102313 CR lthru CR-5 (lt2) Page J or 27

Occidental Chemical Corporation October 20 13
Basis:
Ethane Cracking Furnace Nos. 1-5- MSS Activities EPN's CR-1-MSS, CR-2-MSS, CR-3-MSS, CR-4-MSS and CR-5-MSS
Estimated Emissions Based on Expected Coke Burn-Off
Calculation of C02 based on Equation Y-8 of40 CFR 98.253 for coke bum-off Calculation of CH4 based on Equation Y-9 of 40 CFR 98.253 for coke bum-off
(the C02 estimate times the ration ofC02/CH4 default factors) Calculation ofN20 based on Equation Y -9 of 40 CFR 98.253 for coke bum-off
(the C02 estimate times the ration ofC02fN20 default factors) 5,000 lb coke removed during each dccokc event 0.94 default carbon content of coke per 40 CFR 98.253 Equation Y -8
I 02.04 kg C02/MM Btu default C02 factor for coke combustion from 40 CFR 98 Table C-1 0.0 II kg CH4/MM Btu default CH4 foetor for coke combustion from 40 CFR 98 Table C-2
0.0016 kg N20/MM Btu default N20 factor for coke combustion from 40 CFR 98 Table C-2 48 hr decoke event 36 decoke evcnts/yr
Annual emission calculations below represent max1mum emissions for all five furnaces
Coke Burn-Off Coke Molecular Annual Hourly
Pollutant (lb/decoke)
Weight Emissions Emissions (lb!lb mole) (tons/yr) (lb/hr)
C02 5,000 12.00 310.20 359.03
CH4 na na 0.033 0.039
N20 na na 0.005 0.006
Emission comparisons:
Annual Hours of Hourly Source of C02 Emissions Emissions Operation Emissions Comments
(tons/yr) (hr/event) (lb/hr)
C02 from Coke Combustion 310 1,728 359
C02 from Natural Gas 140,817 8,760 32,150 Worst-case hourly emissions
C02 from Process Fuel Gas 58,358 8,760 13,324
Calculation methods.
Annual C02 emissions (tons/yr) =coke mass rate (lb event) x MW em MW c x carbon content x no. of decoke events/yr x I ton/2,000 lb
Annual CH4 emtsstons (tons/yr) C02 emission rate (tons/yr) x default coke CH4 factor default coke C02 factor Annual N20 emissions (tons/yr) = C02 emission rate (tons/yr) x default coke N20 factor default coke C02 factor Hourly emissions (lblhr) =annual emissions (tons/yr) x 2,000 lb/ton x yr/no. of events (yr/event) x event/no of hr (eventlhr)
Conclusion:
Since hourly decoking C02 emissions are less than hourly normal C02 emissions, worst-case annual emissions do not include decokmg con.tributions. The same IS true for CH4 and N20 em1ssions.
CR GfiG Sources Update t02J I J CR·I thru CR-5 MSS Pogc 4 of 27
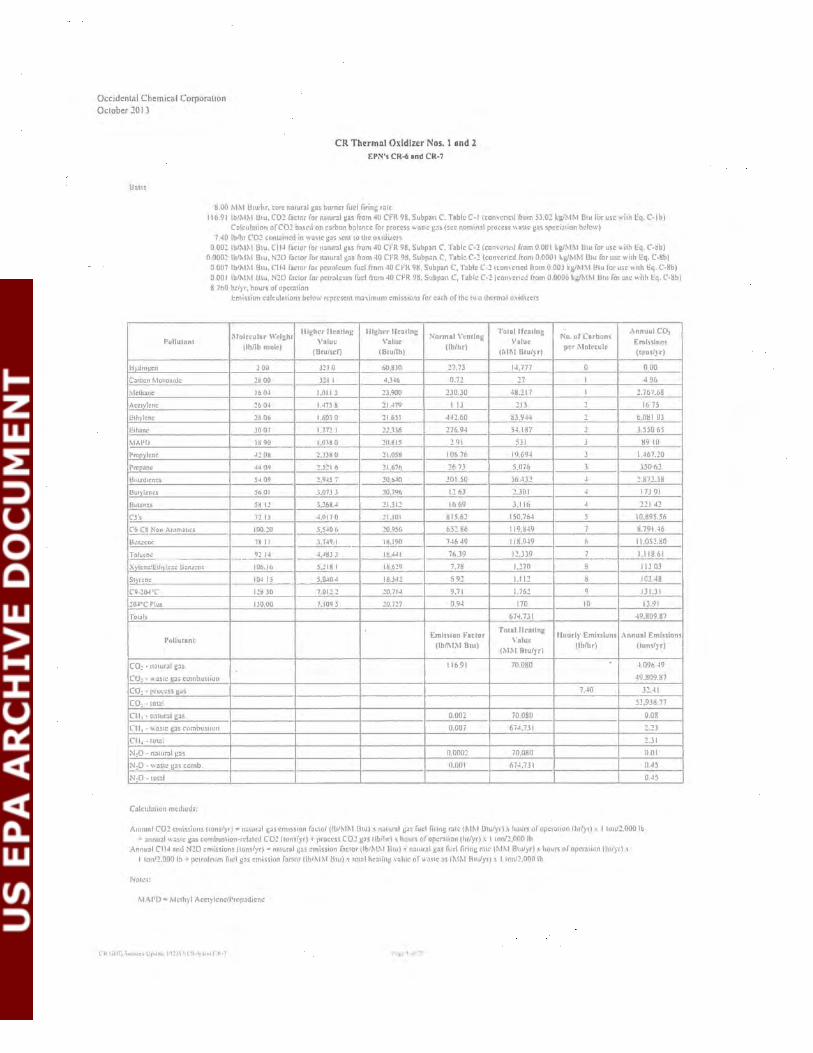
Occidental Chemical CorporatiOn Oclober 20 I J
BOIS IS
CR Thermnl Oxidizer Nos. 1 nnd 2 EPN's CR-6 and CR-7
8.00 MM Uaw11r, t"orc nnlur:ll g:u burner fuel firing ro:ate 116.91 lbiMM Btu, C02 factor for naturol gos from 40 CFR 98, Subpon C. Table C-1 (convened from 53.02 kgiMM Btu for usc with Eq. C-lbl
C::~lcul:uion of C02 b:tscd on c:ubon bJI:mcc for process waste g:1s (sec nomin.:ll process \\aste l:aS spcd;uion below) 7 40 Jb/hr (Q~ COOt.lincd in W:lSIC g:15 SCOt to the 0.\ldit:C:rS
0 002 lb/MM Btu. Cll4 foetor for natorol gas front 40 CFR 98, Subpon C. Tobie C-2 (convcrtL-rl from 0.001 kg/MM Btu for usc with Eq. C-8b) 0 0002 lb/MM Btu. N20 foetor for naturol gas from 40 CFR 98. Subpon C. Table C-2 (con,·cncd front 0.0001 kgiMM Btu for usc with Eq. C-8b)
0 007 lbiMM Btu. Cll4 foetor for petroleum fuel from 40 CFR 98. Subpart C, Table C-2(con,·cned from 0.003 kgiM~I Htu lor usc with Eq. C-8b) 0 001 lb!MM Utu, N20 foetor for petroleum fuel from 40 CfR 98. Subpon C, Tobie C-21convcncd from 0.0006 k!lii-IM Btu for usc with Eq. C-8b) s 760 hr/yr. hours or opcr.nion
l::mission calcuhuions below represent m.:r"'imum emissions for tilth of the two thcnnal o.xidilcrs
1\tol~cular Weight lll~hcr llcotfn~ IIIMhcr llcotlne
Normal Venting Totolllcotlng
No. or C1rbon1 Annual C01
Pullutanl \'aluc \'Diue \'1IUc Emluluns jlbllb mole)
(Btu/sci) (Btu/lb) (lblhr)
(M~I Btu/Jr) per Molecule
(tons/)'r)
H>dro~cn 2 00 mo 60.810 ~7.73 14.777 0 0.00
Carbon Mono:ude 26 00 111 I 4,H6 0.72 27 I 4 96
!\lcth:mc 16 04 1,0113 ~1.900 230.30 48.217 I ~.767.68
Acct~lcne ~6 0~ 1.47l8 21.479 IIJ ~13 2 16 75
Eth ·left( 28.06 1.603 0 21.631 442.60 83.944 2 6.081 03
Eth:IMc JO 07 un1 22..136 276.94 54,187 2 J.550 65
MAI'U IS 90 1,1118 0 :!fUi15 2 91 5JI J 89 10
Propylene -t! og 2.JJS 0 ~t.OSH 106.76 lq_694 J 1.467.20
rrop.:anc +I 09 2.,:!16 21,67b 26 73 5,076 3 JSO 62
Bu1.1dacn~:s S409 2,9-15 7 20.640 201.50 )6.432 4 2.872.38
Bu1 ·lcncs 56.01 ),073 J 20,796 12 6) ~.301 4 173 91
Butanes 58 I! 3.268.4 21.312 16 69 3.116 4 :!21 42
cs·, 72 IS 4,017 0 21,101 815.62 150,764 s 10.895.56
f!.f..~ Non Arom~hcs 100.20 S,S406 20,956 652 86 119,849 7 8.791.46
lJt:ru:cnc: 7i II ·-- ~_.I ___ 18.190 746 49 118.949 6 11.052.80
Tolucn~o: 92 1-1 4,48) J 18.+11 76.39 1~.))9 7 ---~---·--- ---· Xylcne!l.:1h ·ic:r.c Ucn.t:cnc 101i.l6 l.21H I 18.629 7.78 1.270 8 Ill OJ
Sltenc IQ.IIS S.Q.IO-l 18.342 6 92 1.11~ 8 102 48
C9<!.0·PC 12M JO 7.012! .20.71-1 9.71 1,76~ 9 131.31
204•c Plus 1)0.00 7.109 s 10.121 0.94 170 10 13.91
Toi:Jis 674.731 49.809.87
Emlnlon Facror Tnulllcotln~
Huurl)' Emluluns ,\nnual Emissions Pollutant \"alut
(lbll\1~1 Btu} (MM Btu/yrl
(lb/hr) (tuns/yr)
C01·11iliUCiJil:35 116.91 70,080 4,096.49
CO~· WilSh: g:JS combustion 49,809.87
CO: - process g01s 7.40 3~.41
CO: ·IDIOI 53,938.77
Cll ~ · n:llural g:Js 0.002 70,080 0.08
Ct I~ • w astc !;lS comhusuon 0.007 674.7.11 2.::!3
Cll, -toml 2.31
N20 - n:llurol ~os 0.000~ 70.080 0.01
i\120 · w:~stc GJS comb. 0.001 674.731 0.45
N:O -tot:II 0.45
Calcui:Ition methods:
Annual C01 emissions (lonslyr) • niltUrill gJS cm1ssion f:actor (lbiMM Otu) ·'natural g:15 fuel firing mtc (MM Dtulyr) :\hours of operation lhr/yr) :\ I ton!!.OOO lb + ilnnu:ll w.:~su: gas combustion·rcl:llcd CO! (tonsfyr) +process C02 g:~s (lbn1r) \hours ofopcrJtion (hr/yr} x I ton/2,000 lh
Annu:JI Cll4 ilnd N:!O emissions (tons/yr) • natural g:~.s emission f:~ctor (lbiM~t l:hu) ·' n~uurnl g::~s fuel firing rnlc IMM Btu/yr) ·'hours of opcrntion (hriyr) ·' I torV!.OOO lb +petroleum fuel !;:15 emission factor(lbiMM Btu)·' tot:~ I hc:;uin!; value ofw01stc as (MM Rtu/yrJ ·' ltonJ:!.OOO lb
Notes:
~1.'\PD ~Methyl Acctylcnc/Prop>dicnc
CR l.iHG ;";u\:.rce~ UpJ:~Ic lll:!l\.l,CHA•IInJCK·1
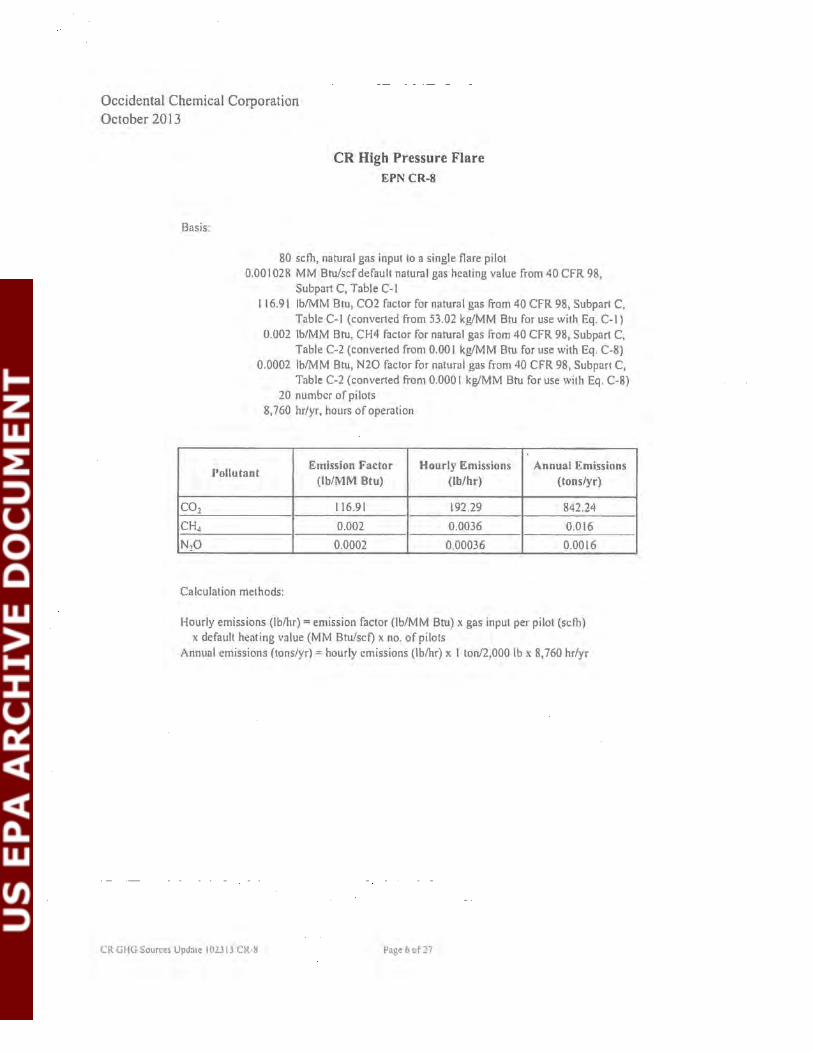
Occidental Chemical Corporation October 20 13
Basis:
C02
CH4
N20
CR High Pressure Flare EPN CR-8
80 seth, natural gas input to a single flare pilot 0.00 I 028 MM Btu/scf default natural gas heating value from 40 CFR 98,
Subpart C, Table C-1 116.91 lb/MM Btu, C02 factor for natural gas from 40 CFR 98, Subpart C,
Table C-1 (converted from 53.02 kg/MM Btu for use with Eq. C-1) 0.002 lb/MM Btu, CH4 factor for natural gas from 40 CFR 98, Subpart C,
Table C-2 (converted from 0.001 kg/MM Btu for use with Eq. C-8) 0.0002 lb/MM Btu, N20 factor for natural gas from 40 CFR 98, Subpart C,
Table C-2 (converted from 0.000 I kg/MM Btu for use with Eq. C-8) 20 number of pilots
8, 760 hr/yr, hours of operation
Pollutant Emission Factor Hourly Emissions Annual Emissions
(lb/MM Btu) (lb/hr) (tons/yr)
116.91 192.29 842.24
0.002 0.0036 0.016
0.0002 0.00036 0.0016
Calculation methods:
Hourly emissions (lblhr) =emission factor (lb/MM Btu) x gas input per pilot (seth) x default heating value (MM Btu/set) x no. of pilots
Annual emissions (tons/yr) = hourly emissions (lblhr) x I ton/2,000 lb x 8, 760 hr/yr
CR GHG Sources Update I 023 13 CR-8 Page 6 of 27
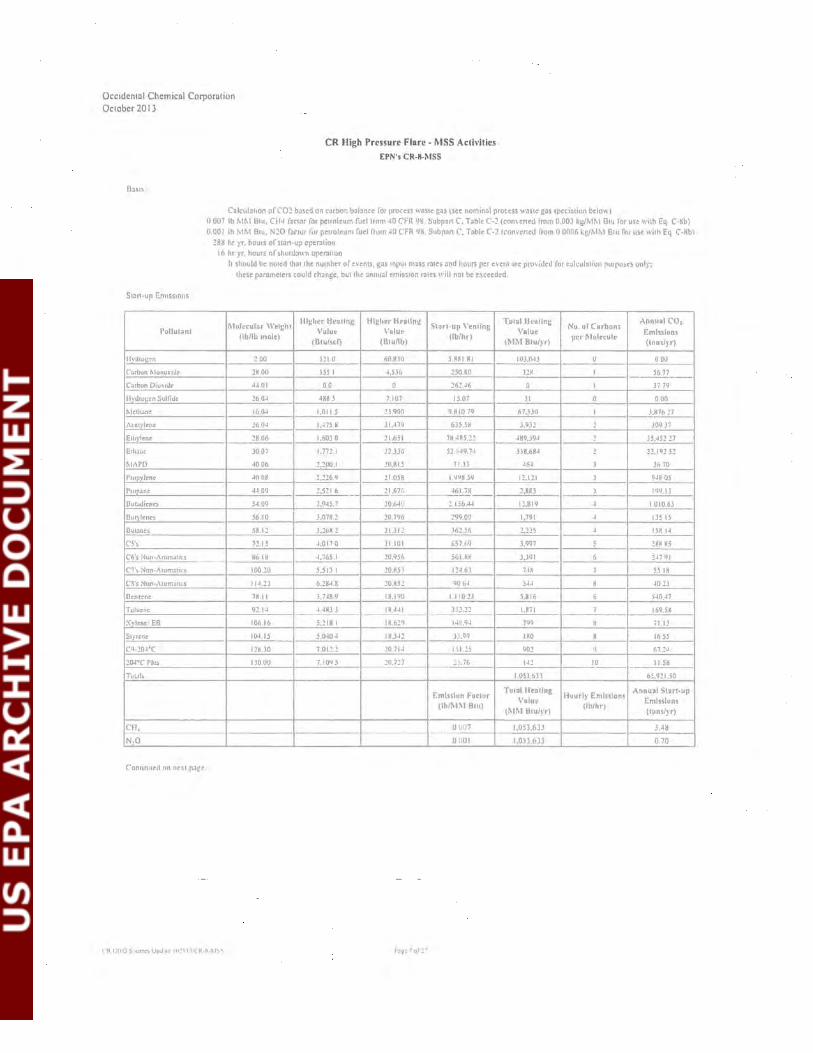
Occtdenlnl Chemicnl Co!Jlornlion Oclobcr 20 I 3
Stan-up Emtssmns
Pollutont
llvtlrot;en
Curbon /'.lonuxnle
Carbon Oiu,tde
llydru~en Sulfide
Mcrhane
r\celylcne
Eahylcnc
Erh.::me
MIIPD
Pm2llenc
rrop.lnc
Dutadienes
Duf)len~
Duunc.s
CS'>
C6':; NtJn-,\rom.tltcs
C1',. Non·Acunuti'"!l
C!'s Nun-Arum.uics
Benzene
Toluene
Xvh:ne .' EB
Stpcnc
CQ-20-l'C
2<W 11C' Plus
Tuwls
CH,
CR High Pressure Flare- MSS Aclivltles
EPN's CR-8-MSS
C31culallon of C02 based on carbon b::~lnnce for process waste c.as tsc:c nominal process waste GiiS speciation below) () 007 lb MM Btu, Cfl4 foetor for petroleum fuellrom 40 CFR 9H Subpon C. Tobie C-~ (oon\ertod limn 0.00) k!liMM Btu for use with Eq C·Hb) 0.001 lb MM Btu, NlO foetor for petroleum fuel from •10 CFR 9H Subpart C, Table C-2 (convened from 0 0006 k£1~1~1 Btu for u-. with Eq C-Nbl
188 hr )'r, hours of stom-up operation 16 hr yr. hours of shutdown O[lf!r.»lton
II should be noted that the number of eo,:c:nts, gas mput m;,.ss rates and houri per C\·cnt arc pro\'itJcd for co:~ll:ulotion purposes only; these pilrnmclers could change. but the annual emiss1on 1"'3IC$ will not be c~ccedcd.
Mr1lecuhlr \\'rlcht Ulghcr Hen ling Higher Ho•lln~
Soorl-up Venting Tulallleullng
Nu. of Corboos Annual C01
Volut: \'aluc Value Emlislon!o (lb/lb mole) (Btu/sci) (Brullb)
(lb/hr) (MM Btui)'r)
per Molecule (tnns/)'r)
2 00 l21 0 60.Hl0 5.881 81 IOJNJ 000
2H ()() JJS I 4,5)6 250.80 11~ 56.77
44.01 00 0 ~6~.46 37 79
26 04 488 j 7.107 15.07 )I 000
16.1).1 I,OII.S !).900 9.810 79 67,5)0 J.87b !7
~6 . 0J 1,475 8 21.·179 635.58 ),9)! )09 )7
28.06 1,60) 0 !1,651 7M..tR5.2! 489,394 35,45111 --~-·---··-
3007 1.7721 !2.))6 52 ,11 -19.7~ ))8,684 21,11J2 52
4006 2,200.1 20.815 7'.JJ 464 31) 70
4008 2.226q 21.058 I.~Q8.59 12.111 948 OS
44.09 2.521 6 ___ 21_ .. 6~(, . 461.78 2,81B 199.1)
54.09 2,945.7 20.64U 2.156.+-1 12,819 1,010.63
56.10 J,07H.2 20.796 299.09 1,791 135 IS
58.12 J.:!tiR 2 21.)1~ .162.56 2.21~ ISH 14
12.15 4,017 0 li.IOI 651.1>9 3,991 !81!! M5
86.18 4,765 .1 20,QS6 56i.HH ),)91 2~7 C)!
100.20 5.5lll 20 .1U~ 124.63 748 55 IH
11-'.23 6.211-' 8 20.1151 90 64 544 -'02)
18.11 3,748.9 18.190 1.1 10 l3 5.816 540.47
92.1-t , _ __ _:~iHJJ __ -- I H. HI ) 52.12 1,871 169.58
106 .16 5.21H I 18.629 14H.94 799 71.13
10·115 5.040 4 18.342 l l .Q9 IHO 16 55
128 30 7.01:!.2 20 .11--l 151.15 lj()J 67.2J
13000 7.109 5 _ ;_~·?l?. ·-· - ·- l ).16 1-12 10 11.58
1.053.633 6!.9:!1.50
Emission Factor Total H•atlng
Huurly Emls!lons Annual Start-up
Value Emission! (lh/!11~1 Blu)
(MM Btu/)'r) (lb/hr)
(tunsi)r)
0 IHJ 7 1,05J,6JJ J.4H -·----~··- --
N,O D DOl I.OSJ,6JJ 0.70
Conlinu~d on ne'l p3ge

Occidental Chemical Corporation October 20 13
Shutdown Emissions
Pullulanl Moltcular \\'eighl
(lb/lb mol<)
It ·dro •en 200
Carbon Muno:mle 28 .00
Carbon D•u~1tJe 44 01
Hp.Jru6en Sulfide 26.04 ---.
Meth:me 160-1
At:etylenr: 16 (W
Erhylene 28 06
Ethane 30 07
Mt\PD 4006
Prupy_!ene 40.0H
Prupane 44.0'1
HubdlenC) 54.09
Duty\enes 56.10
Dutane) 58.12
O's 72.15
(6's Non·,\rom:JIIc!i 86.18
C7's Non-,\rom:ui~.·s 100.~0
CB's Non·Arom.:ltiL's 114.23
Dcnzene 78.1 I
Toluene 92.14
,X\·Ienc/ ED 106.16
S~·rcnc 104.15
cq.rlu~ 1!8.)0
Totals
Pullulanl
CH,
N,O
Total MSS EmiSSions
Pullul•nl
co, CH,
N,O
Calculation mc!thods
CR High Pressure Flare -1\fSS Acli\'ities (cont'd)
EPN's CR-S-~ISS
Higher Healing Higher Htallng Shuldown Tolal Healing \'alue Value \'cnllng \'alur
(Biu/scl) (Biunb) (lb/hr) (MM Blu/}r)
321.0 60,830 3.81 4
lll . l 4,536 3.26 0
00 0 0.00 0
4H8J . 7,107_ ---
000 0
1,011 s 23,900 6.150.9H ~.35~
1,475 M :!1,479 0.00 0
1,603 0 21.651 46,676.73 16,170
1,772 I 21,336 30,482.69 IO,M94
2,200 I 20,815 58.53 19
2,226.9 21,058 56.379.14 IM,996
2.521.6 21,676 594.93 206
2.9-15.7 20.6-lO 1,621.Q3 536
3,018.2 20.796 2:!5.08 75
J,26R.2 21.312 27l.07 93
4,017.0 21.101 411.92 139
4,765.1 20,Q56 l.!.t.9R 109
5.513.1 ~0.853 65 .51 21 -6.!84.8 20,85.! 3K US 13
3.748.9 18.190 611.99 m 4.48J.l 18.441 162.16 4M
5,!18.1 18,6!9 J8 46 14
5,0-10.4 18,34! 0 Hl 3 ---
7,01.!.2 !0.714 2J :!2 8
144.166.39 49.87M
Eml5slon Factor Tolol Ht•tlng Valur
(lb/J\IM Btu) (Ml\1 Blu/yr)
0 007 49,87M
0 001 49,M7M
Annual Sturt-up Emissions (luns/yr)
65.921 50
34M
070
AnnuJI C02 emtss10ns (lon yrl• venl g•s tlbihr)' MIVc.,, I MW\'u< 'no of carbons' lton/2.!100 lb '8,760 hr yr
No. of Corbons per MolL·cuiL•
0
I
I
0
I
2
2
2
3
3
3
4
4
4
5
6
7
8
6
7
8
B
9
Hourly Emissions (lh/hr)
Annual Shutdul\n Emissions (lons/yr)
3.619.87
0.16
0.!13
Annu•l CH4 •nd N:!O emtSSions (lons/yr) = emimon lac tor (lbiMM BJu) ·' luel fir ng r.uc (MM Btu 'hr)' I loni!,OOU lb' 8, 760 hr yr
Noles
MAPD • Methyl Ac<lylene Propodiene
CR GIIG Soun:~ L'pdJlc: IU~ll.l CR-ll-MSS
Annual C01
Enli:nlons {lons/}r)
000
0.04
000
0 00
135 01
0 .00
1.171.34
71lM2
1.54
1.4M5.7M
14.25
42.23
5.65
6.62
10.05
7.97
1.61 -0.94
16.55
4.34
1.19
0.27
0.37
3.619.87
Annu•l Shuldo\1 n Emlulons (luns/yr)
0.16
0.03
Total Annuol
Emlnlon~
{lonsi)'rl
69.541.37
3.65
0.73

Occidental Chemical Corporation October 2013
Basis:
Engine
CR-9
CR Emergency Generator Diesel Engine EPN CR-9
I 05 gal/hr of diesel fired in 2,206 HP engine 0.138 MM Btu/gal diesel heating value
163.08 lb/MM Btu, C02 factor for diesel from 40 CFR 98, Subpart C, Table C-1 (converted from 73.96 kg!MM Btu)
0.007 lb/MM Btu, CH4 factor for diesel from 40 CFR 98, Subpart C, Table C-2 (converted from 0.003 kg/MM Btu)
0.00 I lb/MM Btu, N20 factor for diesel from 40 CFR 98, Subpart C, Table C-2 (converted from 0.0006 kg/MM Btu)
52 hr/yr, hours of operation
Pollutant Emission Factor
(lb/MM Btu)
C02 163.08
Emergency Generator CH4 0.007 Diesel Engine N20 0.001
Calcu I at ion methods:
Annual emissions (tons/yr) =emission factor (lb/MM Btu) x diesel consumption (gal/hr) x heat content (MM Btu/gal) x hours of operation (hr/yr) x I ton/2,000 lb
CR GHG Sources Update I 02313 CR·9 Page 9 of27
Emissions (tons/yr)
61.4394
0.0025
0.0005

Occidental Chemical Corporation October 2013
Basis:
C02
CH4
N20
CR Low Pressure Flare EPN CR-10
80 seth, natural gas input to a single flare pilot 0.00 I 028 MM Btu/scf default natural gas heating value from 40 CFR 98,
Subpart C, Table C-1 I 16.91 lb/MM Btu, C02 factor for natural gas !Tom 40 CFR 98, Subpart C,
Table C-1 (converted !Tom 53.02 kg/MM Btu for use with Eq. C-1) 0.002 lb/MM Btu, CH4 factor for natural gas !Tom 40 CFR 98, Subpart C,
Table C-2 (converted !Tom 0.001 kg/MM Btu for use with Eq. C-8) 0.0002 lb/MM Btu, N20 factor for natural gas from 40 CFR 98, Subpart C,
Table C-2 (converted from 0.000 I kg/MM Btu for use with Eq. C-8) 4 number of ptlots
8, 760 hr/yr, hours of operation
Pollutant Emission Factor Hourly Emissions Annual Emissions
(lb/MM Btu) (lb/hr) (tons/yr)
116.91 38.46 168.45
0.002 0.0007 0.003
0.0002 0.00007 0.0003
Calculation methods:
Hourly emissions (lb/hr) =emission factor (lb/MM Btu) x gas input per pilot (seth) x default heating value (MM Btu/scf) x no. of pilots
Annual emissions (tons/yr) =hourly emissions (lb/hr) x I ton/2,000 lb x 8,760 hr yr
CR GHG Sources Upda1c 102313 CR-10 Page 10 of27

Occidental Chemical Corporation October 20 13
CR Low Pressure Flurc MSS Aclh·ltics EP:-1 CR-10-MSS
1 •,, or lhennJI o"dm:r "missaons considered us possible MSS emissaons forthe r.ue occurrence lhal bmh otadiurs ru-e out of sen ice !tOO MM Bnllhr, core naturJI g:15 burner fuel firing role
116.91 lbiMM Btu, C02 foetor for nnmrnl gJS fmm 4ll CFR ~8. Suhpan C, Table C-1 (convened from ;J.02 kcJ\IM Aru for use with Eq. C-lh) Coslcui.:Hton of CO:!: based on carbon balnnce for process WOLSte g...ts (see norninnl process \\nste gas speca:~uon below)
7.40 lblhr C02 contumed In waste gas sent to lhe O\tdazers 0.002 lb•MM Btu, CH4 focror for nltural gas from 40 CFR 98. Subp:>rt C, Table C-2 (conl'cned from 0.001 kg/MM Bru for use with Eq. C-8b)
0.0002 lbiMM Btu, N:!O foCior for narurnl gas from 40 CFR 98 Subpan C. Table C-1 (cun1ertcd from U 0001 kg/MM Btu for use "ith Eq. C-8b) O.tltl7 lbiMM Bru, Cll4 factor for petroleum fuel from 40 CFR 98, Subpln C. Tnble C-2 (con1ened from ti.OOJ kgiM~I Btu for use with Eq. C-8b)
0.001 lb!MM Btu, NW factor for perrol<um fuel from 40 CFR 9~. Subpon C, Tnblc C-2 (convened from 0.00116 kg/MM Btu for usc" ith Eq. C-HI ~ 760 hr/}T, hours or oper:uion
TIJcnnal o ... u.JiZC'r EmiSSions:
Molecular Higher lleotlng lllgher lf•allng Normal \'en ling
Toto! lfcullng :"io. urCarbons
Annual C~ Pullulanl \\'right tlbnh \'olue \'alue
(lhlhr) Value
per Molf'cule Emissions mole) (81u/5Cf @;60 F) (Biunb) (MMBiui)'r) (lonsl)'r)
II droa:cn 1.00 311.0 60,8)0 27.7J 14,i77 0 000
Clltbon Moncn:it.ll! 2H.OO 321.1 J.H6 0.72 27 I Hb
Mrth~•nc 16 OJ 1,011.5 2),900 !Jo.JO 48,217 I 2,767.68
Act!}:ICnL' 26.GJ I,J1l.H 21..ti9 l.ll 213 2 16.75
Eth.ylcnc :!K.06 1,60)0 11.651 44!.611 H3.944 ! 6,oH I. OJ
Eth:mc )0.07 1,772.1 2:!.336 276.~4 54,187 2 J,55U.65
MAPO 18.90 I.OJH.O :!U,HI.~ 2.91 5Jl J 89 10
Prop>·lcnc -l:'.,OH l.lJH.U li.UlH 1116.76 19,694 J 1,467.20
flrurtanc 4-1.0':1 2 .. 'i:!l.6 !l,bi6 26 73 5,11i6 J 350.62
Bul:uli!!ncs S-l.UIJ 2,945.7 2D.6JO 2111.50 J6,4J2 4 :!.Hi2.3K
Butylcnc$ 56 01 J.07J.l :!0,796 12.63 2.301 4 173.91
Bulilncs 5K.1:! ).168.4 21.112 16 69 J.l16 4 2:!1.42
CS's 7!.15 4,017.0 :!1.101 Kl5.62 150.764 5 lo,K95.56
Cfi-CH Non-Arnnlallcs 100 20 lj40 6 :!0.9~6 652.86 119.K49 7 K.79l.46
BcnZI!n:: 18.11 J.NIJ.I lH.I90 146.49 118.949 6 11.052.80
Tulu ... nc 92.1-1 -1,-IHl.J IH.4JI 76J~ 12.JJ9 7 I.IIH.61
X')knl.':IElh)h:n~: Bc:llcnc 106.16 S~I!:U 1H.629 7.7H U70 8 113.03
St1tnt: IOJ.Il l,OJO.J l!l.l-1.2 6.92 1,112 K 10!.4H
l'9·20J c 12M JO 7,012 2 20,714 9.71 1.762 9 131.JI
20.S-2HH C IJO 00 7,109 5 20.717 0.94 170 lO IJ 91
T01ali 674,731 49.H09.H7
£mission Fador Total Ur.a.ling
Hourly Emissions Annual Emissions Pollutant Value (lb/~IM Btu)
tMM BtuiJr) (lblhr) (lon'l)r)
CO,- fuel gos 116 Yl 7U,Oij0 4,096 49
CO.: · wnstc gas combusuon 49,HU9.H7
CO.: . process cas 7.40 )!.41
CO. -totnl ;J,9J8.77
Cll, - fuel gos 0 002 70,0KU 0.08
CH~ - wnstr: gas combustion u 007 674,731 2 2J CH4 ·total 2.JI
N ,o - fuel gas 0 0002 7o,UKO 0.01
N:O- '-'3.Ste sa> comb. 0001 61<1,731 0.45
N,O-totol 0 •15
Olidiler .\nnuol Floro MSS Pollulnnt Emissions Annual Emission
(lonsl)'r) (tonslyr)
CO,- MSS only SJ,9JH.77 I,U7H.78
CH,- MSS only 2.31 0.05
N,O- MSS only 0.45 0.01
Calcul;uiun mc:thtlds:
Annu:llthermal O\idizer emiSsions (lonsi)T)- sc:e CR-6 and CR 7 Annu;~l emissions {lons/yrJ annualthenn:ll O\tdizer cmiss1ons (tonslyrl.\ 1~~
,.~1> · II _,{ '!'

Occidental Chemical Corporation October 2013
Basis:
C02
CR Cooling Tower EPN CR-11
1,154,000 lb/hr make-up water
Pollutant
220 ppmw bicarbonate (HC03) equivalent concentration representing make-up water alkalinity
61 lbllb mole, molecular weight of HC03 one mole of C02 released per mole of HC03
44 lbllb mole, molecular weight of C02 8, 760 hr/yr, hours of operation
HC03 Loading in C01 Hourly
Make-up Water Emissions (lb/hr) (lb/hr)
253.88 183.13
Calculation methods:
Annual C01
Emissions (tons/yr)
802.09
HC03 loading (lblhr) make-up water (lb/hr) x bicarbonate equivalent concentration (ppmw) Hourly C02 emissions (lblhr) = HC03 loading (lblhr) x MW C02 (lb lb mole) x
1/MW HC03 (lbllb mole) Annual C02 emissions (tons/yr) hourly emissions (lb hr) x I ton/2,000 lb x 8,760 hr yr
CR GHG Sources Update 102313 CR-11 Page 12 of27

Occidental Chemical Corporation October 2013
Basis:
Pollutant
C02
CH4
N20
C3/C4 Hydrogenation Regeneration Vent- MSS Activities EPN CR-12-MSS
Calculation of C02 based on Equation Y -8 of 40 CFR 98.253 for coke bum-otT Calculation of CH4 based on Equation Y -9 of 40 CFR 98.253 for coke bum-off
(the C02 estimate times the ration ofC02/CH4 default factors) Calculation of N20 based on Equation Y -I 0 of 40 CFR 98.253 for coke bum-off
(the C02 estimate times the ration ofC02/N20 default factors) 3,600 lb coke removed during each decoke event
0.94 default carbon content of coke per 40 CFR 98.253 Equation Y -8 I 02.04 kg C021MM Bru default C02 factor for coke combustion from 40 CFR 98 Table C-1 0.0 II kg CH4/MM Btu default CH4 factor for coke combustion from 40 CFR 98 Table C-2
0.0016 kg N20/MM Btu default N20 factor for coke combustion from 40 CFR 98 Table C-2 48 hr/decoke event
I 00 hr/yr, hours of operation per year
Coke Burn-Off Coke Molecular Weight Annual Emissions (lb/decoke) (lb!lb mole) (tons/yr)
3,600 12.00 12.93
na na 0.001
na na 0.000
Calculation methods:
Annual C02 emissions (tons/yr) =coke mass rate (lb/event) x MWc02 I MW c x carbon content x hr of decoke events/yr (hr/yr) x decoke eventlhr (event/hr) x I ton/2,000 lb
Annual CH4 emissions (tons/yr) = C02 emission rate (tons/yr) x default coke CH4 factor default coke C02 factor
Annual N20 emissions (tons/yr) = C02 emission rate (tons/yr) x default coke N20 factor default coke C02 factor
CR GHG Sources Update 102313 CR-12-MSS Page 13 of27

Occidcnlul Chemical Corpomlion Oclohcr ::!0 13
Consthurnls
llydroccn Carbon Monmtidc
Carbon llim.idc
llydro~en Sullide Mcth~nlt!'
Acetylene Ethylene Cthanc Methyl Acctylcncfi•ropadicnc
rropylcnc l,rop:mc
Uuladicncs
Butylcncs Uut:mcs CS's Cti-CK Non-Aromatics lJcn.a:nc Toluene Xylcnc/l:thyllJcn.t.cnc Styn:nc C'I-211.J C 204- 28K C 2HH C+ WOJtcr Nitrogen
DMS/DMDS Anunonin T01ol
Column Tolols , EPN CR·I3 Carbon Monoxide Carbon Dto)lltdc
II vdru •en Sulf ode
MctiUUlC l:.thum; llydfOt!cn. Water nnd Nttro •en
Ammonra Tnt:ll VOC
Tmols
l'lt GHU 'Klc:ru·• UpU.:11e IU~llliOt ll1hru CH. lt."lubl'
Ethane Fc~d (Camp 8):
4010 Pipeline Ethane Fc.-d
Wrlgbt Emhsloo1 Fnction (lb/hr)
1.6000 0.0783
11.000000 0,0000 O,IJO()(KIO O,IKKJO II.IKHIIOO O.IKKIO 0.000000 0.0000 II.O~SOIJO 0.0020 IJ,()(JO()(KI 0,110()(1 0,000000 0.00110 11.'149900 11.11744 0.000000 11.00110 0.000000 0.0000 0.025000 O.IKI~O
IJ.(KKKKJO 0.(1000 IJ,OIJO()(KJ O.(KKJO O,OIKKKKI 0 IKKJO II.OIHKKKI 0.11000 0 (JO()(JOO 0.00110 0,000000 0.00110 O.OIKJOOO O.OIKIO O,IJO()(KIO O,OIKJO II.OOOIKIO 0.11000 11,0110()(10 0,0000 O.(KJOOOO 0.0000 O,OIJO()(KI 11,11000 O.IJO()(KIO O.IKKIO O.OIKKJOO U,IKKIO O.IKHKKJO 0,00110 O.IJO()(KKI 0.00110
0.0783
O.IKKJO 0.0000 O.OIKJO 0.00::!0 0,0744 II 00011 0,0000 o.oo:!O 11.0783
Ethylene Plant Fugitive Emission Totals CR Furnace Aren Fugitives, CR-13
Saturaled C2 (Camp C): Qurncb 0\lt'rhcad (Cump
Nus. 1-5 Furnace Feeds; Furnan Outlet (Cump 0):
E): QucBC:h Column
Fcl'd Sdrurarur Vapor Nos. 1-5 Furnace Oullcls
Liquid Gosolinr
Wdght £minions Weight Eminiuns W<lght Emlsslons Fraction (lb/hr) Froc:don (lb/hr) Fnction (lhlhr)
1.0009 0.2038 1.0000 0.3586 I.OOIHI 0.0179
II,IJO()(HIO II.IHHHJ 11.269900 11.1~168 0.33901JO 1!.0061 IIIJO()(KIO 0.11000 0.000800 0.()(103 0.001000 0.00110 11.000100 0 00110 IJ.()(J0300 0.0001 0.0110300 0.0000 0.000000 0,0000 0.000000 O.OIKIO O.OIJOIOO 11.0000 0.1115000 0.0031 0.054500 110195 II.Oii84()(J OJlOt:!
0.000000 0.00110 0.002300 0.0008 0.002800 0.0001
0.00~000 0,01104 0.~593011 OO'l30 0.3!5800 11.0058 0.6339(10 0.1::!92 11.161700 0.11580 0.203100 O.OOJfi 0.000000 0.11000 0.000200 O.OIJOI 0.000200 0.00110
11.00~000 0.0004 O.OII.J600 0.0016 0.005800 0.0001 0.(1150110 0.(1031 11.0011100 IJ.OIKI.J 0.001200 11.0000
IJ.OIKIOOO O.IKKHJ 0,0113700 11.0013 0,0114700 IJ.OIJOI IJ.OIKKKJO O.(KKNJ 11.(100500 11 .000~ 11.000600 0.00110 II OIJOOOO 0,00011 IJ,OIK)f,(J() IJ.OIKJ2 IJ.IKJ0700 0.00011
O.OOOIKJO O,IKKJO II.(KKI71KJ 0.11003 O.OOIIIKI O.OOIHI
0.000000 O.IKKJO 11.()()06()(1 00002 O.OIJ09<10 0.00110 O,()(JO()(KI O.OIKJO 0.001200 0.0004 0.001700 0.01100 11.000000 O.OIKIO O.OIKJ~OO 11.01101 0 OIJ02110 0.00110 IJ.IKNKIOO II.OIKKI II.OOOIKJO 0.01100 0.0000110 0.0000 IJ.IKKKKIO 0.00110 0.000000 0.00110 0.000000 0.00110 IJ.IKJOOOO O.IKKJO O.OIJOIIIO 0.00110 0.000100 0.00110 0.000000 0.00110 11.000000 0.00110 O.OOOIKJO 0.00110 IJ.OINKKKJ O.()(KKI II,OIKJOOO 0.00110 0. IJO()(KJO O.OIKIO O.J321KJO 0.01•17 0.237800 II.OHSJ 0.042300 0.0008 U.IKJO()(KI U.IKKKI U.OOOIKJO 11.01100 U.IKKKKKJ O,IJO()(J 0. (JO()(KJO 0.00110 0. IJO()(JOO 0.00110 11.000000 11.0000 0.000000 0.00110 11.000000 0.00110 0.000000 0.00110
0.2038 0.3586 0.0179
0.00110 0.0003 O.IKKJO 0.00110 0.0001 0.00110 O.IKKJO O.OIKIO 0,0000
0.0031 11,0195 0.0012
0.1292 O.OSHO 0.0036 ll .llh77 U. IM20 IJ.IKJhK
0.00110 II.IHKJO 0.00110 0,01139 O.O'JH6 O.OOh::! 0.2038 0.3586 - --- O.D_I_79 _
l'a&;el4uf:!7
Quench Ga,ufinc (Cump Quench \\'arrr {Camp G):
F); Quench Column Fred Saruralur \VDicr:
Liquid Gasoline Qurnch \\'atn; Pnten5
\\'atcr Trutmcnt
Weight Embsluns Wright Emls:duns Fraction (lb/br) Fraction (lb/hr)
1.00011 0.0336 1.0000 0.1261
O.IHKKIOO 0,00110 O,OOOOIKJ O.OIKJO 0,0000110 0,00110 O,OIKKIOO 0.00110 0.0001100 11.00110 IJ.IKJOOOO 11.00110 11.000000 11.0000 0.000000 0.0000 II OIKKIOO 0.00110 0.000000 0,00110
0.000000 0.00110 0.000000 11.00110 11000000 0.00110 0.000100 0,00110 0000000 0.00110 0.000100 0.00110 IJ,(JO()(JOO 0.0000 0.0110000 11.00110 11.000000 0.00110 O.OIKKJOO 0.00110 0.000000 11.0000 O.OOOIKJO 0.0000 ll.OIJ0500 O.OIKIO 0.000000 0.00110 0 IKJOIIIO 0 00110 0000000 0.00110 0000000 0 OIKIO II OIKKKKJ IIIKKJO 0.135200 0.0045 0.000000 0.0000 0.21::!ft00 0.0071 0.000000 O.IKKIO 0.498500 0.11167 IJ.OIKJ400 0.0001 0 079400 0. 00~7 0.000100 0,00110
0.0086110 O.OIJ03 0,0000110 0.00110 0.016200 O.OIJOS 0.000000 O.IKKJO 11.030400 0.0010 0.000000 O.INHJO 0.010100 O.OIJ03 0.0000110 0,00011 0.0084110 0.11003 0.000000 0.00110 0. IJO()(JOO O,OIKJO 0.999300 0.1260 0.000000 0.00011 0.000000 0.00011 0.000000 0.00110 0.000000 0.0000 0.000000 O.IJO()(J O.IKHNKKI 11.11000
0.0336 0.1261
0.11000 11.0000 O.IKKJO 0,0001)
11.00110 0.00110 0.(1000 O.IKKJO 0,00110 0.11000 0 ()(Jill) 0 12ft()
0.00110 0.0000 O.OJ3h O,IKJOI 0 0336 0,1261

Occidental Chcm1cal Corporation Oc10bcr 1!1 13
Cunsttrucnts
Jlydrugtm Ct~rhon Mono.11tk
Carbon Dioxide llydrogcn Sulfide Mclh:mc Acetylene E1hyh.:nc E1hanc Methyl Acctytcnc/Prop;~dicnt: Propylene Pmp3nc UutaUicncs Butylcncs Bumm:s CS's C6-CK Non-Arom:uics Ucrul"nc
Toluene Xylcnd Ethyl licn.o:cnc Styrene C9-204C 204-2KSC 2KK C+ W:ucr Nitrogen IJMS/UMI>S Ammonia T01al
Cohunn T01als. EPN CR-13 Carbon Monoxide: C01rbon Dioxide II ydm~cn Sulf Klc Methane Eth:mc llvtlr~cn. W;ucr:md Nitrot;;cn Ammonia Total VOC Tot:tls
C.'K GilD Suun:~, U1kbl~: IICll.l•CK·IllhsuCK·IfiTvt.llo
OfT-Gas 10 Fu<l (Cump V): NU'S.. I·S Furnac~ Fuel
S)'srcms: Furl Gos Blrnd System
Woighl Emlniuns I' ruction (lb/hr)
1.11000 0.7952
II.KI9KOII 11.6519 U IK127fX1 0.0021 O.OlKKKlO O.!KKKl O.O!HKIOO 00000 0.175(l{l(] 0.1392 0.000000 O.IKKlO 0.00240!1 0.0019 O.(l{l(]IOO O.(l{l(]l O.OlKKHHJ O.(l{l(]O
O.O!HKKKI O,O(l{l(] 0 IKKKKHJ O.IKKlO 0000000 0,0000 O(l{KKXHJ 11.0000 O.OIKKKXI O.IKIOII O.IKIOO!KI 0, (){1011
O.OlHKKXI O,(l{l(]O
0 !KKKIOII 0,(){1011
II,!KIO!KIO ll,fi(HHJ
0.000000 0.0000 O.!KKKKKI O.O!HHJ O.IKKKKKI 0.0000 O,O!HKIOO 0.0000 II,O!HKKKI 0.0000 II,IKKHHKl O,IKKKI II,OlKKKKI O.O!HHJ II.IKKXKKI O,IKIOII O.O!HKXHJ O.O!HIO
11.7Q52
0.0021 11,(){1011 O.(l{l(]O 0.1392 0.!10111 0.6519 OO!HKI 11.01119 0.7952
Ethylene Plant Fugitive Emission Totals CR Furnace Areu Fugitives, CR-13 (cont'd)
lllmolhyl Sulfide (Comp Dimt.1h)'l Sulfide Vapor
Natural Gas (Camp AD): AE): Dlmolbyl Sulndc (Comp AF): Dimethyl
NG Dlst System Syslcm - Uquid Service Sulfide System - Vapur
(or lllmclbyl Disulfide) S.rvlco (or Dimolhyl
lllsulndo)
Wol=hl Emissions Wol~bl Emissions Wolghl Emi!Sions Fnctlon (lb/hr) Fraction Jlh/hr) Fnctlon tlbthn
1.0000 0.1521 1.11000 0.0177 1.11000 0.0370
II.!KIOOIIO 0.0000 O,O!HKIOII 0.0000 O,O!HKIOO O.!KKKI O.IKKKKKI O.IKKlO 0.000000 0.0000 O.O!XKKlO 0.0000 11.012(l{l(] O.IKIJK O.!KKKXHJ 0,(){1011 II,O!KKKKI 0,(){1011
0.000000 0.0000 0.000000 0.0000 0.000000 0.0000
0.945(l{l(] 0.1437 0.000000 0.(){1011 0.000000 0.0000 0.000000 11.0!1011 O.O!HKKlO O.O(l{l(] O.O!HIOOO O.(l{l(]O
O.O!HKKHJ O.O!HHJ II.O!HHIOII O.llOOO O.O!HKKHJ O.IKKKI 0.032(l{l(] 0,0049 0,000000 O,O(l{l(] O.O!HKKHJ 0.0000 O.OlKKHHJ O,O(l{l(] O.O!HKKlO 0.0000 O.IKXKKHl 0.0000
O.OlKKIOII O.O(l{l(] 0.000000 0.0000 O.OIKKKlO O,O(l{l(]
O,OOKOlHJ O.IKII2 0.000000 O.IKKXl 0.000000 0.0000 0,000000 O.O(l{l(] 0.000000 0.0000 0.000000 O,(l{l(]O
0.000000 O.OIKKl O.OllOO!HI II.!KIOII 0.000000 O.OlKKI
O.O!Hl500 O.O!Hll O,OlKKIOII 0.0000 0.000000 0,0000 O.IHI0400 O.O!HII O.IHJO!HlO O.IKIOII 11,0!101100 O.IKKXI
11.11011100 O.!KKKl O.OlKKIOII 0.0000 O,!KIO!KHJ 0.0000 O.O!HKKHJ O(l{l(]O 0.000000 0.0000 0.000000 0.0000 0.000000 0.0000 0,000000 11.11000 0.000000 0,(){1011
0.000000 0.0000 0.000000 0,(){1011 O.O!HKIOO 0.0000 O,OlKXKKI O,(l{l(]O O,IKKKIOO 0.0000 0.000000 0,0000
11.000000 0.0000 O.!KKKIOO 0.0000 0.000000 O,(l{l(]O
II.O!HHJOO 0.11000 O,OlKKIOII O,tlOOO 0.000000 0.0000
11.000000 O.flOOO O,fi(KXIOO 0.0000 0.000000 0.0000 fi.!KKKXIII O.IKKKI II.OIKKXHJ II,IKXIO O.OOIKKlO U,O!HIII 0.002(l{l(] O.(l{l(]3 0.000000 0,0000 0.3£.0000 0,0133 O.()(KXIOO O.O(l{l(] 1.000000 0.0177 0,640(l{l(] 0,0237 0,000000 0.0000 O,fi(KXIOO O,(l{l(]O O.IKHJO!lU 0,()(1011
--------- -- 0.1521 0.0177 0.0370
O.IKHIO 0.0000 O.IKIOII O.()(IIK ll ,(l{l(]O 0.0000 0.0000 0.0000 0.0000 0.1437 0,(){1011 O.OIHJO O.!K149 0.0000 0.0000 1Ul003 0,()(1011 0.0133 11 IKKlO OIHJO!I 0.0000 O.!HJ14 0.0177 0.0237 0.1521 o 0177 0.0370
t'oli&C 15u(~7
Wash Oil (Comp AG): Wash Oil Vopur (Cump
Wash Oil- Uquld Sorvlco AG): \\'a.1h 011- Vapur
Scrvkl·
Wolghl Emlssluas Wolghl Emissions Fracrlun (lb/hrl Fnu::rinn (lb/hr)
1.110110 0.0177 1.110110 0.0412
0.000000 0.0000 0.000000 0.0000 O.O!HKKKl 0.0000 O.OlKKKKI II.()(KXl O.O!HKIOO 0.0000 O.O!HKIOO 0.0000 0.000000 O,(l{l(]O II.IKKKIOO O.(l{l(]O
0.000000 0.0000 0.000000 0.0000 O.O!HKKHJ II,O(l{l(] O.fiOO(l{l(] O.IKKHJ O.!KKKKKl O.O(l{l(] O.IKKKIOO 0.0000 0.000000 0.0000 0.000000 0.0000 O.OIHKIOII 0.011011 0,000000 O,O(l{l(]
0.000000 0,0000 0.000000 0.0000 0.000000 O,(l{l(]O O.O!KXIOO II.(HJOO
0.000000 0.0000 0.000000 0.0000 O.O!HKKHJ 0.0000 O,OlKKIOII 0.0000 0.000000 0.0000 0.000000 O.!KKIO O,O!HKKHJ 0 (l{XHJ 0 IHKXIOO o rnKKl
0 O!HKKHJ 0.0000 0,000000 II (){1011
0000000 O(l{l(]O 0000000 00000 0000000 00000 0000000 O(l{l(]O
0 IKKKIOO O(l{l(]O 0000000 00000 0.000000 00000 0.000000 0 IKIOII I 000000 0.0171 0.007(l{H) 00lHJ3 o O!HKKHJ 0 (){1011 II IIOOO!HI 11 rnKKI o 000000 0,0000 0 O!HKIOO O!KKXl II ()(KKIOO II,IKKlU 0 IKKKIOII IIIKKKl o 000000 00000 09930lHJ 00409 o oooooo OO(l{l(] 0000000 0 IKKlO II O!HlOOO UO!HHJ 0 IKKKIOO 00000
11.0177 00412
O.O!HIO 00000 00000 ll(l{l(]O 00000 OO!HKI 0 !KIO!I OO(l{l(]
0 011011 OIHJO!I 00000 00409 OO!HlO 110000 011177 O.(l{l(]J
o 0111 00412

Occidental Chemical Corporation October 2013
Cit GIIG Snvn:r:~o Uf"b"' lll!.ll.l1CK·I111w1t CIC.·Irt'lubb
Cunstltut"nts
llydrugcn Cnrbon Monu,;idc Carbon DioJ.idc llydrogt."f1 Sulfide
Methane Acetylene Ethylene Eth:mc Methyl Acctylcnc/Propndicnc llropyh:nc Prup;anc Hutadic~s
Butylcnc:s Uutancs C5'• C6·CM Non-Aromatics Hcnzcnc Toluene X ylcnc/ Ethyl Hcntcnt• Styrene C9·204C 204-288 C 2HHC+ W:uc.-Ni1rugcn UMSIUMUS Ammoni:~
Toutl
Column Tollll5, EPN CR-13 C•ubon Monoxide C:ubon Din:4.idc llydro •en Sulfide Methane Eth:mc llydro •en, Water and Nitro •en Ammonin Toto! VOC Total!>
Ethylene Plant Fugitive Emission Totals CR Furnuce Arcu Fugitives, CR-13 (cunl'd)
Ammonia (Cump X.X): Propylene Hrfri~cratlun Dt..'-BUIPniur Overhead
Ammonia Systems (Cump ,\8•: Prop)'IL'Rl' (Cump \'): 0l"'-8Uianizcr
Rdrigtrntiun Onrhcud
W<i~ht Emissions Wd~ht Emissions \Voight Emissions FncUun (lblhrl Fncriun flblhrl Fraction (lblhrl
1.0000 O.OJIR 1.0000 0.0280 1.0000 0.0618
O.()(I(KI ll.!KKKl O.()(I(KKIO 0.0000 0.000000 0.0000 11.0000 ll.tKKHl fl.!HKKKIO O.fKKIO 0.000000 .0.0000 0.0000 !UKKIO 0.000000 O.fKKIO 0.000000 0.0000 O.fKKIO O.OfKKI ll.!KKKKIO 0.()(1()() 0.000000 00000 0,()(1()() O.OfKlO 0.000000 0,{}{100 O.{}{KIOO!l 0.0000 0.{}{100 0.{}{100 O.()(I(KKIO 0 {}{KIO 0.000000 0.0000 0.{}{100 0,{}{100 0.000000 0,()(1(10 ll,()(I(KKIO 0.0000 O.()(I(Kl 0,{}{100 O.!KKKKIO 0.{}{100 0.{}{)()200 (),{}{100
0.0000 ll.()(I(KJ O.!KKKKIO O.!KKIO 0.018400 0.0011 0.{}{100 0,{}{100 0.98()(1()() 0.0275 0.377700 0.0233 O,O!KKJ O.!KKIO 0.1120000 O.!KKlh O.IOJO!HI U.!KJ6.l O.O!MIO 0.0000 O,()(I(KIOO 0.0000 0,37190!1 0.0230 {l.{KK){) u.oooo O.lKKKKJO O.!KKJO 0.1150100 00031 0.0000 0.0000 0.000000 0.0000 0.058700 0.0036 O.IKKKl 0.0000 0.000000 0.0000 0.019100 0.0011 O,()(I(K) 0.0000 0.000000 O,O!KJO 0.!100400 0.0000 O.{KKIO 0.0!100 11.000000 0.0000 0.{}{)()500 0.0000 0.0000 0 ,(){)()() ll.()(I(KKIO 0.0000 0.000000 0,0000 O.O!KIO 0.0000 0.000000 0.{}{100 0,()(1()()()() 0.0000 O.lKKlO 0,{}{100 (),{}{)(){}{)() 0,{}{100 n. {}{)(){}{)() 0.0000 0.()(1()() 0.0000 O.lKKKKIO 0,()(1(10 0.000000 0.0000 0.0000 0.0000 0.000000 0.0000 O.llOO{}{)() 0.0000 0.0000 0.{}{100 0.000000 0,()(1()() O.!KKKKIO 0.0000 0.0000 0.0000 0.000000 O.!KKKJ 0.000000 O.IHKKI 0.0000 0.0000 0.000000 0.0000 O.O!KIOO!l 0.0000 O,O!KKJ 0.0000 0.{){)()(1(10 0.{}{100 0.000000 11.0000 ).(KKIO 0.0318 0.000000 0.0000 0.000000 0 {KK){)
O.OJIH 00280 0.0618
0.0000 O.O!KKJ U.!KKIO 0.0000 O.O!KKJ 0.0000 O.{KKIO 0.0000 0 !KKK I 0.0000 0.0000 O.()(I(KI O.lKKKl 0.0!100 0.0000 0.0000 0.0000 0.0000 !lllJIK 0,0000 0 {){)()() 0,()(1(){] 00280 0.0617 00318 0.0280 ll.061K
.. .,,c lfl ur!7
Dt..--Uutanltrr Buuoms (Cump \V): n~. .... Butanlur Buttum5- Liquid Service
Wd~ht Emissions Fraction (lblhrl
1.0000 D.OJ7S
O.O()(I(KIO 0.0000 0.000000 0.0000 0.000000 0,0000 0. ()(I(KKK) O.OfKlO 0,0()(1(100 0,0000
0.000000 0,0000 0.000000 0,0000 O.()(I(KKKJ 0,{}{100
0.000000 0,0!100
0.000000 0,0000 U,()(I(KKKJ O.!KKIO U,{}{)()JOO 0,0000 0.11001 nu O.OfKlO 0 {}{)()J{JO 0 {}{100
0.135800 0.0111 0.143600 0.0116 0.431300 0.0205 0.0574{){] 11.0027; 0.00550!1 0.{}{)()31 0.010000 0.{}{)()51 0.014600 0.{1007 0.001200 0.{}{)()1! 0.000000 o.ooooi 0.0()(1(100 o.ooool O.()(I(KKJO o.ooooj 0.000000
0.000::1 0.000000 0.0000
0.04751
O.O!KKI
O.!KKIO 0.0000 0.0000 O.O!KKI 0.0000 00000 0.0475 00475

Occidcnlal Chemical Corporn110o
October 20 I 3
Cunsdtucnts
llydrogcn C:ubon Monmw.ic Carbon Dtoxtdc llydrogcn Sulfide Methane Acetylene
l:.thylcnc Ethane Methyl Acctyl\!nc/Prop:sdicnc Propylene Propane Hutudu:m.s Hutylcncs
Hutancs C5's Cb-CM Non-Aromaucs lJcfiLl'llC
Tolucm: Xyk.•nc/ Ethyl Bcll.lcnc
Styrene C9·204C 204 • 2HH C 2KHCI W.:~lcr
N•troccn DMS/OMJJS Ammomil
TOI.:II
Column Tot.3l5, tPN CR-14 Carbon Monmudc Carbon Dio~ftk-~~~~roGcn Sulli~c
Methane l:.th:mc llydro •en, Water and Nnro •en
Ammo01o Tow! VOC
Totals
QuC"nc .. Ovcrhud (Cump [): Chur~< Gut
Cumprrsslun ond Chilling Vopor Sen Icc
Wcl~ht Emlssjons Fraction (lblhr)
J.IIUOO 0.30JJ
0.339000 11.1028 0.001000 11.!1003 U.IKKI301) 0.0001 II 000100 11.0000 11.06H400 0.02117 0 1102KIIO O.OOOK 0.325HIIO 0.119HK 0.203100 11.0616 O.IKKI2011 0.00111 11.005HOII II.OOJK 11.001200 0.0001 II 004700 0 0014 II tKXI600 II 011112 0 000700 000112 0001100 00003 () 0110'100 00003 0 0017011 II OIKI5 0 000200 0 001)1
0 OOIKIOO OIKKXI 0 000000 110000 0 0111111111 00000 (I 1100000 0 00110 II 000000 0 OOIXI II 04231NI II 1112K 0 000000 0 00110 0 IKNNIOO 00000 II 11110000 0 lXXXI
0 31133
0 0003 011001 00000 II 0207 llli6Jh 0 115(, 0 (I(HIO 0.1049 0 3033
C'K GJIG SHun.~:. UpWtc tm.lJliCR·Ilthna CK·lh luwb
Ethylene Plant Fugitive Emission Totals CR Charge Gns Arell Fugitives, CR-14
Char~c Gus Liquid (Cua~p lll"-Butanizer Burtoms
II): Char~c Got Quconch \\'tttl·r (Cump G): (Camp Wr. Cau"l<
Compnnlon and Chlllint= Couslic Towrr Uquid Ga!oUne \Va!lhlnl!;
Uquld Xrvicc Emcr~rncy Reller llcackr-
Liquid Senltl'
\\'right Emlssluns \\'dt:ht Emissions \Vd~ht Emissions Fraction {lb/hr) Fraction (lb/hr) Fraction (lb/hr)
1.0000 0.031R 1.0000 0.0222 J.lKKHl 0.0780
0.000000 0.0000 II,(JOO(J{){J 11.0000 11.000000 O.lKKHl II II(I(~KIO 110000 0.0001100 0.0000 0.000000 0.0000 11.0001100 0.0000 0.0001100 0.0000 0.0110000 0.0000 0.000000 0.0000 O.OOOIKIO 0.0000 11.11000110 0.0000
11.0011000 0.0000 0.000000 0.00110 11.000000 0,01100 O.IKKIOO!l 0.00110 0.000000 0.0000 0.0011000 0.0000 0.000100 0,0000 0.000100 0.0000 0.0011000 0.0000 0.000100 11.0000 11.000100 11.0000 0.0011000 0.0000 O.OOIKIOO 0.0000 0,000000 0.0000 0.000000 0.0000
11.1100!100 O.IKKHI 11.0011000 0.0000 0.0011000 0.0000 II,OOII(I(Kl II.I~KKI II.IKK~KKI 110000 IIIKK)OIIII 0,11000
01100000 0 01100 0 0011000 00000 01100400 0.0000 () 000000 III)OIXJ 011001100 00000 0000100 0 01100
0.0011000 00000 0.1100000 00000 () 000100 00000 0 000000 110000 II IIOO!HIO 110000 O.l35HOO 00184
0 000100 0 CHKXI II CHIOO!IO 110000 () 243600 00190 II 1100300 00000 0000100 00000 0431300 OOH6 0 000100 00000 0 000100 110000 0 057400 00045 0 OIK)OIJO 00000 00001100 00000 0 005500 011004 0 000100 00000 0 0000110 110000 II 010000 0 OOOR 0000400 111)0110 II OOIXKKI 110000 01114600 00011 0000400 0 01100 II IXIOOOII 011000 0 001200 00001
II 1100100 II IKNNI II 001100!1 110000 0 000000 00000 II'I'JH300 0 0317 0 999300 002::!2 0 IIIKNIOII II IKIOO 0000000 00000 0 0011000 000110 0 0000011 00000 0 0011000 00000 0 0011000 00000 0 1)011000 II 11000 0 OOIKIOO 0 OIKIII II 0011000 00000 00001100 00000
0 1131H 0 0222 0 0780
0 IKIOO II 00110 00000 II IKIOO 00000 00000 0 01100 {I 11000 1111000 110000 110000 00000 IIIKXKI 0 00110 00000 0 0317 002:!2 0 00011 0 00110 0.0000 0,0000 0.0001 0.00110 0,0780 () 0318 0022:! 0.0780
t'o11,'1: 11 u(:!7
No1ural Cos (Camp AD): Propylene Rcfri~cration Diauy Rdril!rrotfun Emrr~rncy Rrlkf lludrr - (Camp AB): Prupyl<nc (Camp A C): Bltlnr;·
Vapur Suvlcc Rcfrigcrarioa Rrfrl~;:cratlun
Weight Emiuluas Wclghl Emissions Wdght Emfssloas Fraction (lb/hr) Fraction (lb/hr) Fraction {lb/hr)
1.0000 O.OH03 1.0000 0.31135 J.OOIHl 0.3890
0.0001100 00000 0 0001100 0 0000 11.001000 00004 0.000000 11.0000 0 IKIOO!IO 0 00110 00001100 0 0000 0.012000 11.0010 0 000000 0 0000 0000000 0.0000 0000000 0 OIXIO 0 000000 OII(I(KI 0000000 0 110011 11.945000 11075H 0.000000 00000 0.340000 0.1323 0.00001111 110000 0.000000 0,00(1{) 0,011(1(1(1(1 0 0000 11.0001100 110000 0.000000 00000 0,659000 II 2563 0.032000 00026 0.000000 00000 0000000 0.0000 11.000000 11.0000 O.IIOOOIKI 110000 0 IXKKIOO 00000 0.0011000 11,0000 0,980000 113758 0 011(1(100 II 11000 II OIIKIKIII 1111006 11020000 110077 II tK)OIIOO 00000 01100000 00000 0.0011000 00000 0 11000110 00000 0 OOIKK~I 110000 0.0011000 00000 00011000 000110 01100500 110000 O,CHKIOOO 0 IKIOO II.IKK)OIIO II 00011 001111400 00000 0000000 00000 0000000 00000 0 CHJOJOO 0 0000 01100000 0 OIXIO 11000000 00000 01100000 110000 (I 11011000 1100110 II IMXKXIO 0111100 0 0000011 00000 01100000 0 1100!1 0000000 00000 0000000 00000 (1()01)01111 1111000 OCHIOO!IO 110000 0 0001100 0,0000 01100000 00000 II 0001100 0.0000 0 0001100 00000 01100000 00000 11000000 O.IXIOO 0000000 11.0000 0 0000011 00000 0000000 00000 0000000 II OIKIO II 0001100 00000 01100000 00000 01100000 00000 0 000000 00000 0000000 0 00110 0 002000 00002 0 0001100 00000 0 0011000 110000 01100000 00000 0000000 0 00110 0 0011000 00000 0 00001111 110000 0000000 0 IIIKIO 0 1100!)011 11.11000
110803 II 3835 II 3890
0 IKIOO OIIIKKI 111111110 00010 110000 II 00011 00000 00000 II IXIOO II 0758 00000 0.1323 11,0026 110000 110000 0000:! 00000 OIIIKJ.I O.OOIKI 000011 0,001101 0.11007 0.3835 0.2563 11.0803 II 3H35 0.3890
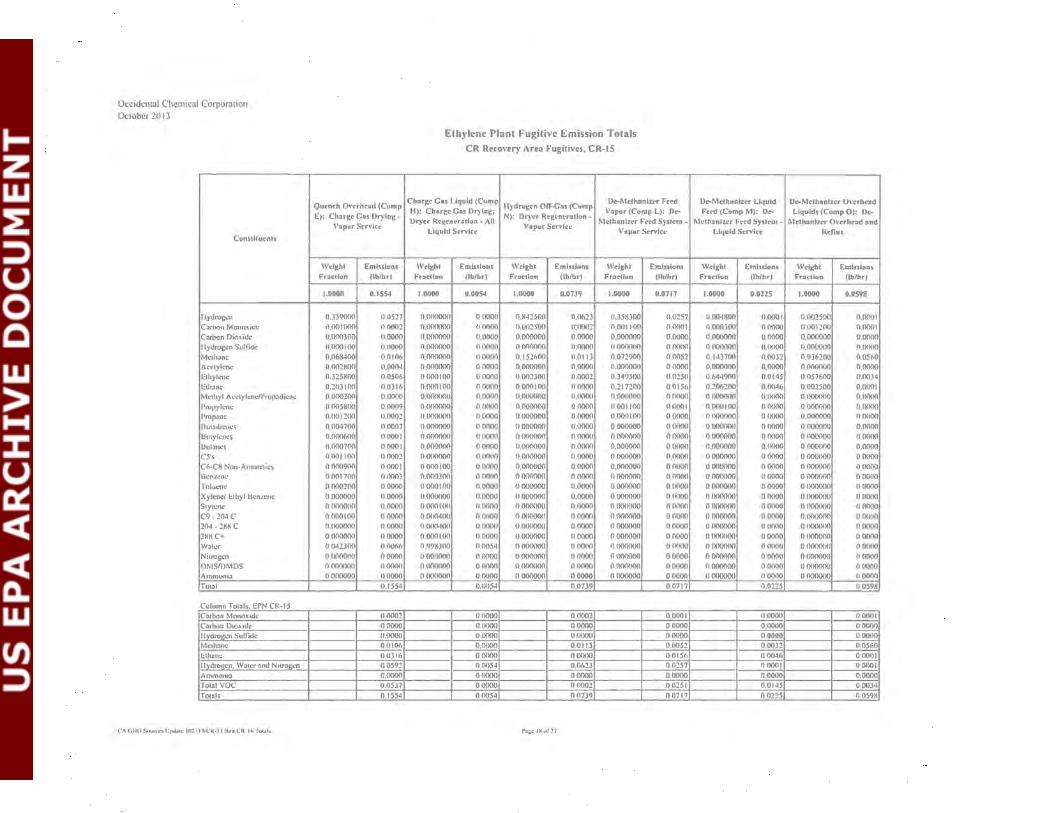
Occidcntnl Chemical Corporation October 20 13
Constituents
llydrogcn C:1rbon Mono:\ ide Cnrbon Dio:tidc Jlydrogcn Sulradc Methane Acetylene Ethylt.."UC Eth;mc Methyl Acctylcnc/l'rop;~dicne
PrupyiL"OC l'ropomc Butad1cnc~
Hutylcncs Butanes cs·, C6-CH Non-Aromatics Benzene Tolut.•tu.• Xylcnc/l:.thyl BcnLcnc
Styrene C9·204C 20-1-:!HHC 2HKC+ W:UL!r
Nitrogen DMS/DMDS Ammonm. ToU»I
Column Totol•. cPN Cll-15 C:~rbon Monox.tdc Carbon OlOAidc ll~droGcn Sulfttlc Mcthonc !:.thane ll~droGcn, Water nnd Nttr~~o:n Ammom:a TolD! VOC
Totals
CH.GJIUS.amol:pd;ltc IU!:llllf."H·I.lltv•Ck lbT~h
Quench 0\·crhcud (Cump E): Charge Gus Dl')·ln~-
\'a pur Scrvicr
Wdght Emissluns Fraction (lb/br)
1.0000 0.1554
0.339000 0.115::!7 0.001000 0 0002 0.000300 0.0000 0.000100 U.IHHIO O.ObH400 0.0101> O.OO:!KIKI 0.0004 O.J25KOO 0.0506 0.:!11311KI 0.0316 0,()(10200 11.1)(){)(1
0.005HIXI O.IHHI9 0.01112011 11.0001:
0.004700 0.0007 0.000600 0.0001 0.000700 00001 0.001 (00 0000:! 0 000900 00001 II 001700 Otl003 0 000200 00000 0 000000 0 0000 0 IHHHHIO 00000 0000100 00000 0 IHHHHJO II{)(){)()
0 0000{)(1 00000 o o42300 0{)(Jf>6
o IHHHIOO 00000 0 OIIOOIKJ 0 OOIKI (I 000000 OOIKJO
11.1554
00002 0 OIKIO U.OIKKJ 0.0101> 11.0316 00592 0.0000 0.05J7 0.1554
Ethylene Plant Fugitive Emission Totals CR Rerovery Area Fugitives, CR-15
Char~• Gas Liquid (Cump llydru~rn Olf-G•• (Cump
Dc-P.1rthanlzt•r Feed II): CharJ~o Gas Dl')·in~; Vopor (Comp L): Do-Orycr Rr):rn~raiJon- All
N): Dryer RrgL•ncroliun-MrthanizL·r Fred System-
Liquid Srrvlce Vapur Service
\'aper Service
Wright Emissions \\'cigbt Emluluns Wright Emlnlans Fraction (lblbr) Fraction (lbibr) Frocdun (ih/hrl
1.0000 tl.0054 1.0000 0.0739 1.0000 0.0717
0.1100000 0 IHIOO O.H42500 0.01>23 0.35H300 11.0::!57 0.000000 IIJHIOO 11.002500 0.0002 0.001100 O.IKHII II.IHHHIOO 11.0000 0.000000 0.0000 0.000000 0.0000 O.OOIKHIO 00000 0000000 11.0000 II 000000 OIKHIO 0.000000 110000 0 15~h00 0,0113 0 072900 0005~
0.000000 00000 0.000000 0.0000 U.IHHMHKI OIHIOO 0.000100 0 OOIKI 0002300 0.0002 0.3493{)(1 11.02511 0.000100 00000 0 000100 110000 0.217200 00156 O.IHHKHHI 0.0000 0.000000 O.IHIOO O.OIKHIOO IIIHHHI 0.1100000 O.IXHIO 0.000000 00000 0001100 O.OIKII O.IHHHKJO 0 01100 0000000 0.0000 0000100 00000 11.000000 noooo 0000000 n.oooo 0 000000 00000 0.000000 0 (HHJO UllOIKXIO 0 OIKXI 0 000000 00000
0.000000 00000 O.IHHHIOO 0.0000 0.000000 00000 O.OIKHIOO O.IHHIO 0.000000 0.0000 0.000000 0.0000 0 000100 00000 0.000000 00000 0.000000 00000 0.000300 0 IHHJO 0000000 00000 01100000 110000 11000100 0 OOIKI OIKHHIOO O.IKKJO 0 OIKHIOO 0 IHHHI
II IKHHIOO 0.0000 0000000 O.OIKJO 0000000 0 IHIOO OOOOIIKJ 00000 0 OOIKIOO 0 IKIOO 0 IHHKIOO OIHHHI 0 IKI041Xl 0 IXKJO 0 OIHHHHI 00000 0000000 00000 II IKI04110 II IKHKJ 0 IKKKKKI 0 OIKI!l 0000000 00000 0 0001110 00000 0 IKHHIOO 110000 0000000 00000 o 'l9H300 00054 o IKIOOOO IIOIKIO 0 tiOOIKIO 00000 0000000 00000 0000000 0 IKXJO 0 (100000 00000 01100000 00000 0000000 00000 0 OOIKIOO 110000 O(J()()()(JO 0 {)(100 0 OOIKHIO 00000 0 000000 00000
II .lXI 54 0.0739 0.0717
110000 0,0002 0.0001 00000 00000 0 (HHJO 110000 OIKHHJ noooo O.IKXIO 0.0113 0.(1052
00000 00000 00156 0 01154 11.0623 00::!57 OOIKJO 00000 0 (HHJO 00000 00002 00251
00054 00739 0 0717
flQI;C"IHttf:!7
Do-Mothunlzor Liquid Oc-Meth•nlzer 0\'crh~ad Fo<d (Camp M): Do- Liquids (Cump 0): u..~
1\trthanlur Fc.-cd Syslt>m ~ Mrthanizrr Overhead and Liquid Service RrOu1
Wright Emlulons Wdght Emissions Fncliun Clb/hr) F'rzacllun (lb/hr)
1.0000 0.02Z5 1.0000 0.0598
11.004800 11.0001 11.002500 11.0001 O.OOOJOO 0.0000 0001::!00 0.0001 O.IKHlOIKI 0.0000 0.000000 0.0000 0.000000 U.IKKIO II.OIKHHIO 0,01100 0.143700 0.0032 0.936200 0.051>() 0.000000 n.oooo O.OIKHHIO 0.0000 0.1>44900 0.0145 0.057600 0.0034 0.:!06200 0,{)(146 0.002500 O.IHIOI 0.000000 II.IKIOO II.IKKKKIO O.IHHIO O.OIKIIOO 00000 0000000 O.IKIOO OtlOIK){)() 0 IHKJO 11.000000 0 {)(JOO
0 (100000 0 OIHJO II OIKHHJO 0.0000 0000000 o ()(JOO 0000000 noooo 0.000000 O.IHHJO 0 OOIKJOO 0.0000 0000000 110000 0 OOIKIOO OIKHHI 0 IKHHIOO 00000 0 OOIKIOO 0 OOIKI 0000000 00000 0 OOIKIOO OOIKJO 0000000 00000 0 IIOOIKHI 00000 0 IKlOIKIO 0{)(){)() UIXlOIKKI 0 IHHIO 0 OOIKHIO 00000 0 OOIKHHI 110000 0000000 00000 O.OIKXIOO OIHKKI 0 000000 0 UOIMJ 0 IHHMHIO 110000 0 IHHHMMI 00000 0(100000 00000 0000000 0 OIKKJ OOOIKHHI 00000 0000000 00000 0000000 110000 0000000 0 OIHIO II IKHHIOO 0 (HHJO 110000011 110000 II OIKHIOO 110000
0.01:25 0 059H
0 OOIKI II OIKII O.IHHIO noooo 00000 00000 00032 o 0560 110046 00001 00001 0 {)(101
00000 0.0000 00145 00034
0 0225 0 059H

Occidcntul Chemical Corporation October 20 13
Constituents
tlydruucn Carbon Mono1tidc Carbon Uio:o~ ide llydrogcn SuiHdc Mcth:~nc
Acetylene-ethylene Ethnnc Methyl Act.-tylcncll'rupadicnc Propylene Prop:.nc Butadacncs l:lutylcncs Uutancs cs·s Cti-CK Non-Arom:uics Hcn1cnc Toluene Xylene/ Ethyl Bctucnc Slyrcnc C9·204C 204 • 2HH C 2HK c~ \V;l!Cf
Nitru~cn
OMSIUMDS Anunoni3 Total
Column Totals. f.PN CR-15 C:ubon Monn.tidc Curbon DH:n.idc ll~dro~cn Sutfode Methane Cth:mc llydro •en, \Voter and Nitro •en
Ammoni:J: Toml VOC Totals
('K GUU Su~om .. "CJo Ut>lhrc: lll!_ll'ltCK·Il ttwu CK lh'[tK.IIto
Dc-"-1cthanlnr Battums (Comp P): I>c-Ml'lhanl7t•r
Bunums
\Vd~ht Emissions Fraction (lblhr)
1.0000 0.0575
o.OIXlOOO II ,(}(XI()
ll ,OIKlOOO II,IHHHl
O,OIKlOOO O.OIKIO O,(J(XXHHI O,IHHIO
ti.(HXI300 0,(}(1()0 O.(J(XIOOO 0,(}(1()0
0.614600 0.0353 tUH31100 0 .0:!:!0
O.(J(XIOOO 11.0000 0,001900 0.11001 11.1100200 11.01100 ll.tHI()(J(IO 0.(}(1()0 O,IHKHIOO 011000 0 !HHHHHI 0(}(1()0 0,1100(}(1() O.IHIOO 0,000000 0.(1()(}(1
ti .OIKlOOO O.IKHIO 0.000000 II.OIKIO O.OIKlOOO 0.11000 ll.llOOOOO 11.11000 O.IKHHlOO ti.IHHIO ti.OIHHXIO O.(J(I()Q
O.IHHHHIO O.OIHIO IIIHXIOOO ti.IHIOO ti.IHHHHIO 0(}(1()0 O.tHHIOOO 0,(}(1()0
11,000000 O.OIKIO 011575
0,0000
0.0000 O.OIKIO O.(J(I()Q 0,0,.,0
0.0000 O,IHHIO 0.0354 0.0575
Ethylene Plant Fugitive Emission Totals CR Recovery Areu Fugitives, CR-15 (cont'd)
AC ltcaclur Feed (Cump De--Etbanlzcr Kcflu1 Oc-Eihanlzcr Bottoms J): Dr--Erbanizrr (Cump K): Dc-Erhanizcr (Camp 1): D~Etbaninr
Ovcrhud RcfluJ Dote om !I
\Vcl~ht EmlniunJ \Vrlgbt Emisskms Wright Embsluns Frncdun (lb/ltr) Fraction (lhlhr) Fracrion (lhlltr)
1.0000 0.3122 1.0000 0.0268 1.0000 0.1).198
0.330600 0.1032 0.110401KI 0.11001 O.OIKlOOO O,(J(I()Q ll .llOIIHlO 11,11003 II.OIKII 00 0,01100 II,(J(XXXIO 11.(}(1()0
O.OIKlOOO 11,11000 0,1100(}(1() 0,0000 0,1100(}(1() 0,(}(1()0
O,IHXIOOO O,OIHIO II,UIHHHIO 0,(}(1()0 II.IHHHHHI 0.(}(1()0
0,067700 0.0~11 0.013600 O.IH~ O.OIKlOOO O.OIKIO 0,002HOO II.OIH~J ti ,(I()(}(XIO O.OIHIO O.OIHHIOO II,OIKKI
0.355200 O. llti'J 11.45H2011 0.0123 0.1100100 0,(}(1()0
0 . 2~04011 0.0751 0.509500 0.0137 (),(}(X)(){)() () ,O(}(XI
11.000000 0.0000 0.1100(}(1() II.OIKIO 0,013900 0,01107
0.002100 0,0007 11,0129110 0.11003 0.2H~OO 0.0142 11.000200 0.11001 0.001700 0,(}(1()0 OMI HOO 11.01146 11,011()(}(10 0,(}(1()0 0.000000 O.OIKIO 0.280100 0.0140 II.IHXHHIO O.OIKIO 0,1100(}(1() 0.00011 11.1137700 0,0019 0 OIKlOOO 0.(}(1()0 0,1100(}(1() O.OIKIO 11.04991HI 0.0025 11,000000 O.IXHHI II OIXIOOO 0 tHIOO 0 066600 001133 11.1100000 0 tXIOO 111100(}(1() 0(}(1()0 O,OS~HOO 11.0027 O,ti()(J(KIO O(J(XHI 0 tHHIOOO 011000 11.1011100 00050 0,1100(}(1() ()(}(1()0 11000000 00000 0 013300 II OIKI7 ll.(l(J(HHIO 11,(}(1()0 0000000 0(}(1()0 0 001300 II IKIOI ().(HHI()(}(I 0,(}(1()0 01100(}(1() ()(}(1()0 0.002300 001101 0,1100(}(1() 0 0000 0 0000110 O.OIKIO OOOHIIO 0 IHI02 0.1100(}(1() 0 IHHHI tltHHlOOO 110000 0 000300 0(}(1()0
O.(J(XIOOO 0 OIKIO 0 (J(XIOOO OOIKIO () llOOOOO 0(}(1()0 O.(HHHHIO tl OIKHI t1 OIKHIOO () O(J(XI 0000000 0(}(1()0
O,OIHHIOO 0 OIKIO II O(J(XIOO ()(}(1()0 0(}(10(}(1() 0(}(1()0
ll.tHHHHIO IIIHHHI tl OIKHIOO 0 01K10 01100(}(1() 0(}(1()0
0,000000 00000 OOIKlOOO O.OIKIO O.OIKlOOO 0 OIKIO 0.312:! 011268 0049H
. ~
0.0003 0(}(1()0 001100 0.0000 O.OIKIO O.(J(I()Q 0 (}(HI() 0,()(){)() O.OIKIO 0,0211 0.~ 0.(}(1()0 0,0751 0 0137 O.OIHIO 0,1032 0.11001 O(J(I()Q
11.0000 O.!HIOO O.OIKIO 11.1125 0.11127 0.0498 0.31:!:! O.O:!f,K 0.049H
f'oap: I'~ uf ~7
I
Ethylene Pruduct (Cump Ethylene Side Rebulltr Q): Elhyl~nc Fracdunaror (Cump S): Ethylrne
Overhead Fractionalur Sldc Rcbufll·r
Wdght Emlnions Weight Embslons Fracliun (lblhr) Fractiun (lblhr)
1.0000 0.7779 1.011011 0.027~
O,(J(XI()(J(J O,OIXIO O.OIKlOOO 0.(}(1()0 0,1100(}(1() 0.01100 O.II()(J(XIO 0.(}(1()0
O.OIKlOOO 0,(}(1()0 O.O(J(XIOO O.OIKIO 0,011()(}(1() O,OIHIO O.OIHHIOO 0.0000 0.1100500 0.~ O.OIKlOOO 0.0000 ti.IKKHXHI 0,0000 0.000000 0.11000 0.?9900!1 0.7771 0.591 100 0.0162 0.000500 0.(1004 t1.40HIHIO 0.11112 0,1100(}(1() 0.(}(1()0 II.OIXIOOO 0.0000 O.OIIO(J(HI 0,(}(1()0 0.1100800 0,(}(1()0 O,(J(XIOOO 0.0000 O.(J(XIIOO 11.11000 0,1100(}(1() O,(J(I()Q ll.OIKIOOO II.OIKIO O.ti()(J(XIO 0.()(){)() ll.ti()(J(KIO 0.(}(1()0
O.OIKlOOO 0,0000 O.O(J(XKIO O,OIKIO O.tXKHIOO O.IKHHI (I,OO(}(XI() II.()(){)()
O.OIKlOOO O.OIKIO O.OO(J(XIO O,OIKIO 0.0001100 O.(HHIO O.O(J(XIOO O.O(J(XI O,II()(J(HIO 0.0000 O,(J(XlOOO 0.0000 0,(}(10(}(1() 0,(}(1()0 O.IHHHHIO ti,IHHHI 0,1100(}(1() ti,(J(I()Q O.tHXIOOO 11.0000 0.1100000 0.0000 0,01100(}(1 0,(}(1()0
O.OOOOIHI ti.OIKIO O.OIKlOOO 0.(}(1()0 O.(J(XHHIO 0.01100 O.OIKlOOO O.IHHIO O.O(J(XHIO 0,()(100 11,(100(}(10 ti.OIKIO 0,1100(}(1() (),(J(I()Q 0.000000 O.OIKIO O.(IO(}(HKI 0,(}(1()0 0.0000110 O,O(J(XI
O.IKHHIOO 0.01100 0,011()(}(1() 0,0000 11.7779 0.0274 ----
II.OIHIO 0.0000 !1,(}(1()0 0,0000 0.0000 O.OIKIO -0.~ 0,(}(1()0
0.~ 0.1111~
II.OIKIO II OIKIO 0.01100 O.OIKIO 11.7771 0.0162 11.7779 0.0274

Occodentnl Chemical Corporation October 2013
CH. GIIG StMIIlt"J tJJ'd,Jk Hl.!llllf.:K-1 1 thnl Ck·lh1uuh
Cunstilucnls
llyllru~o:cn
Corban Monox1d..: Carbon DID"-Idc I tydrot;cn Sulfide
Mc:th.lnc Acl"tylcnc
Ethylt..,1C Eth:mc Methyl Acctylcnc/Prop:Khcnc Propylene Prop~nc
HullldiL."ncS Hutylcnt!S liutancs CS's C6.CH Non·Aromotics l:knl.COl"
Toluene Xylene/ Ethyl Bcn:t.cnc
Styrene C9-21J.I C 204 • 2KH C 2HX C+ W:ucr
Ni1rol.ocn DMS/DMUS Ammonia Tntal
Col ~~········
Toonls. EPN CR-15 Carbon Mono" Ide Carbon Dm~idc ll~droccn Sulfide Methane Eth:mc
ll~dr~cn. \Vatt."T ;,nd Nltrot:cn Ammoma Toul YOC Touts
Ethylene Plant Fugitive Emission Totals CR Recovery Arcn Fugitives, CR-15 (cont'd)
Ethon• Rocy•le (Cump R): Propylrnc Rcfri.:cratlon
Elh)'lcnc Fncrlunulur BuHoms; Rreyclc Etb:mL'
(Comp AB): Prupylono
Sluract· Rdrlgcrauun
Wd~hr Emission! Wdghl Emissions Fnctiun (lbihrl l•rocrlun (lb/br)
1.0000 0.0967 1.0000 0.2191
() 000000 ()0000 0 000000 0.0000 II.IKKKKKJ 11.0000 fi.IKKKJOO OIJO(Kl
0.000000 u 110110 O.OOOIJOO 00000 0.000000 0 rnKKI 0000000 IIIKKKJ 0 (}(XKJOO 0110110 0000000 00000 0000000 OIKKJO 0 000000 0 IKJOO
0005(}()() OIKKI5 OIJO(KKJ() 0.0000
09K91\00 00957 OIKKKKJ() 00000 0 (}(KIOIIO ll.OOOO ll.IKKKlOO 00000 0 00490() 0 (){lOS fl.9KOOOO 0 2147 0(}()()500 0 (J{JOO 0 020000 00044 0 OO(J(JOO 0.0000 0 IKKKKlO 0.0000
11000000 0.110110 fl.IJO(KKKI 11.0000
0000000 0110110 OIKKKJ()Q 0.0000 fl.(){lOOOO 0.0000 0.000000 0.0000
0.000000 0.0000 0.000000 0.0000 II,(J()()IJO(J ll.OOOO fi.IKKKKlO 0.0000 0.000000 0.0000 0.000000 0.110110 0.000000 0.0000 0.000000 0.0(}()()
O.IJO(IOIIO 0.0000 0.000000 0.0000 0.(}()()(}()() O.(){KJ() O.IKKKKKl 0.0000 O,(){J()QOO 11.0000 O.OO(}(KlO 0.0000 0.000000 0.0000 fl.IKKKJOO fl.rnKHJ II.OOIKKJO o.rnKKI O.IKKKKKI O.IHlOO 0.000000 0.0000 O.IKKKJOO 0.110110 11000000 11,0(}()() IIIKKKKIO OIKKKI 0 (}(KIOIIO 0.110110 O.OO(}(J()Q 0.0000
0.0967 0 2191
00000 0,0(}()() O(}(J()Q 0 (J{JOO
0.0000 0.0000 O,(){HI() 0,0(}()()
O.O'J57 00(}()()
O.(){KIO 0.0000 0.0000 0,0(}()()
O.IKIIO 0.2191
00967 0 2191
P"-o4:C:!IIur:!.7
Bln•ry Rrfrl~nntiun (Comp A C): Blnory
Rdrlgcrafiun
\Voight Emissions Fnctiun (lb/hr)
1.0000 0.6436
ll.(){JIOOO O.IJO(KI 0 rnKKKKJ 0.0000 0000000 0.0000 0 fKKKKlO O,(){KlO
0.340000 0.014K 0 fKKKlOO 0.0000 O.fi59000 0.02K7 0000000 0.0000 0000000 0.0000 0.000000 0.0000 0 IKKKJOO O.IKKlO o.rnJOOOO 0.0000 0 000000 O.(){KKI
0000000 0.0000 0.000000 O(){KXJ
O.IJO(IOIIO IJOOOO O.fKKKKlO 00000 O,OOIKKJ() 00000 0.000000 O.IKKJO 11,000000 00000 O.IKKIOIIO OIKKKI 0.000000 0.00(}(1
0.000000 00000 ll.rnKIOIIO 0 (J{JOO O.IJO(KKJ() OO(}()() II (){KKKJO OIKKKI 0 ,IJO(IOIIO 00000
0043fi
0 IHlOO O.IJO(JO 0 00(}()
00148 II rnKKI 00000 0 (){KK)
0.0287 0.043fi
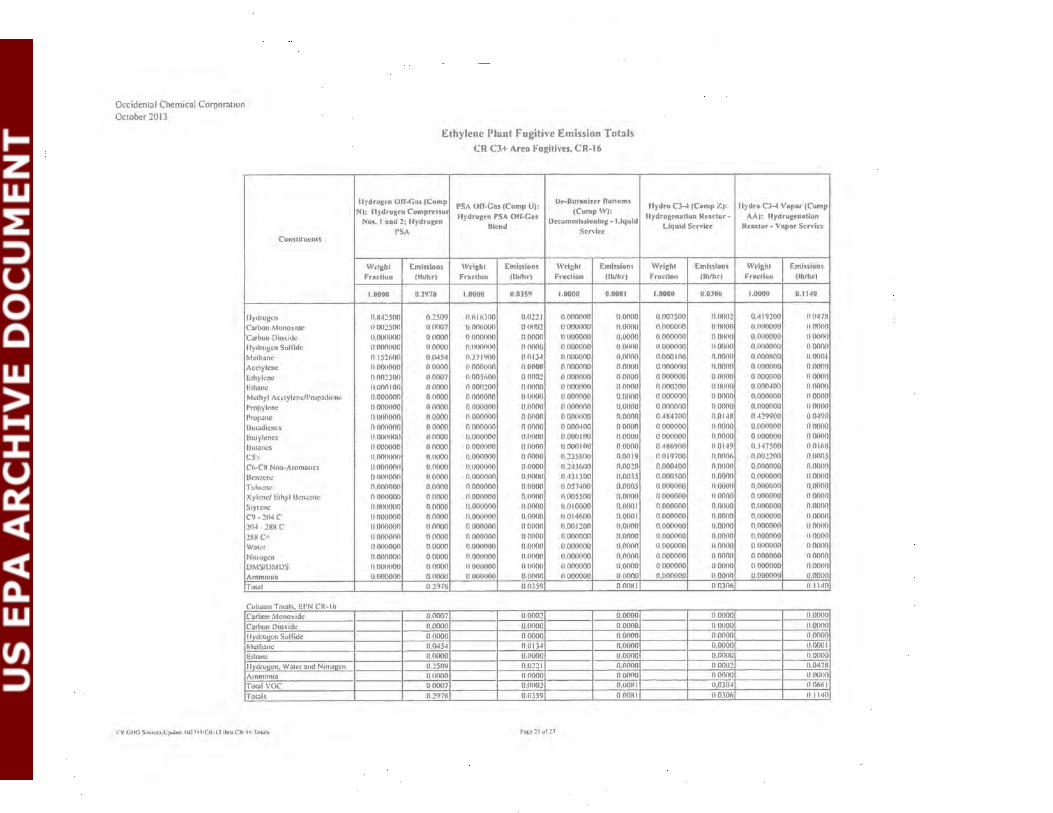
Occidental Chemical Corporntmn October ~013
Constir~nts
llyllrogcn Carbon Monoxtdc Carbon Dio.\tdc llydrugc:n Sulfide Methane Acetylene ~thyh:nc
Eth:mc Methyl Acctyh:ncll'rup<Jdicnc Propylene Prop 31M:
lJut:ldU .. "UCS
Hutylcncs I:Juumc."S C5's Ctl·CH Non~Arom<Jiics Benzene Toluene XylcncJ Ethyl H\."tllcnc Styrene C9. 204 C :!0-1 ~ :!HH C :!HKC+ Water
Nrtmgcn IJMS/IJMIJS Ammonia Total
Column Tot<Jis .. EI'N CR-Itl C11rbon Monox1dc C;~rbon Dtoxidc llvdro •en Sulfide Met home I: thane ll~dr~cn, Water :md Nitrogen Ammonia ToU>I VOC Tot<Jis
Ethylene Plant Fugitive Emission Totals CR CJ+ Area Fugitives, CR-16
llydro~cn Off..C.as (Curap PSA OIT-Gas (Cump U):
0f"-BuumJur Bunoms N): llydrugcn Cumpn=ssu (CumpW):
Nus. 1 and 2; llydroJ:cn llydrugcn PSA Olf-Gn
Oc-commtssioalng • Liquid rs,, Blrnd
Srn·h:c
Wei~ht Emi.,ions Wci;ht Emissions Wcl~ht Emlssiuns Fraction (lblhr) Fraction (lb/hr) Fnction Ub/hr)
1.11000 O.Z~78 1.0000 0.0359 1.0000 0.0081
O.K42500 0.2509 O.til6300 0.0.221 0.000000 0.0000
II.IXI25011 110007 0.006000 001102 (I 0110000 II.OIHHI
U.OfKHKKl 00000 O.OfHHHKl 11.0000 0 IKKXHI(I 0.0000 UOIHHKKl 00()(1(1 ll.lHKKHKl 00000 O.IKKKKI(I O.OOfKl
0 1521\1){1 00454 0.3719fl0 0 0134 O.OfKXHI(I 0.0000 II OfKXHI(I 0,0000 O.OIHHHKI 00000 0.000000 O.OIKHI
000231HI 0,0007 0.005600 0.0002 O.CKKKKKI 0.0000 11.1100100 OOIKKI O.OIKI200 II.OfHKl II OfKKKIO II OIHHl
0000000 0 IKIOO 0000000 O.UIKKI 0.000000 0.0000
0.000000 00000 0 (100(](11) O.IKIOO 0.000000 O,IXHI(I
O.IKKXHI(I 0.0000 0,000000 00000 0 OIKKHKI 0.0000
0.000000 0.0000 0,000000 00000 0000400 0.0000
O.IXKKKKI O,lXHI(I O.UIKKHKI O.IKKKI 0.000100 II.OfKKI
0.000000 00000 O.OIKKKKI 0.0000 0 000100 0.0000
O.OIKKKKI O.IKKKI 0.000000 0.0000 0.2358llll 0.0019
11.00000fl U,lllKKI 11.1KKKKIO 0.0000 0,243600 0.0020
0.000000 0.0000 O.liOOOflll O.OIKKI 0.431300 0.0035
0.000000 0,0000 0.000000 0.0000 0.057400 0.0005
0000000 00000 0.000000 0.0000 0.005500 O.OfHHl O,lKKKKKl 0.0000 11.0fKKIOO 11.0000 0.010000 O.lHKll
0000000 00000 li.OOfKKI(I 0.0000 11.0141\1){1 0.0001 II (KKKKI{I 00000 O.IKKKKI(I 0.0000 0.001200 11.0000
11000000 00000 0.000000 O.OIHHI 0.000000 0.0000 II (I(KKKIO 0.0000 11.00fKKKl 11.01KKI 0.000000 0.0000
0.000000 0.0000 O.OIKKKKI 0.0000 O.OIKKKIO 0.0000 111KKKHKI 0,0000 ll.IKHKKIO II OIKKI 11000000 11.0000
U.OIHHKIO O.OfKKI 111KKKKKI 11.0000 11,000000 O.IKIOO U297K 0.0359 O,OOKI
0,0007 110002 0.0000
11.0000 0.0000 0.0000 0,0000 0.0000 0,0000
0.0454 0.11134 11.0fKIO
O.OOfKI 11.0000 0.0000 0.2509 0.0:!:!1 0,0000
u 0000 110000 110000 00007 O.IKI02 O.OOKI
0.297H 0.11359 0 OOKI
C"k GHG Suun:t.~o l:pobk llt.!lll/C"H.·IJ ttvvCK·IttTueo~h f>OI\;c :!I u1:!7
llydru C3-l (Comp Z): llydru CJ-1 Vopor (Cump ltydrogrnattun Read or- AA): llydrugcnatlun
Liquid Service ReACtor- Vapor Service
Weight Eadsstuns Wcl~ht Emissiuas Fraction (lh/hr) Fr•ctlun (lb/hr)
l.tiOVtl 0.0306 1.0000 0.1140
0.007500 0 0002 0.419200 OU47H II.IIOOOfl(l II IXHI(I II.IHKXHI(I 11.0000 11,000000 O.UIKKl 0.0110000 II.IHKI(I O.IKKKKI(I 0 OIKI(I O,CKKKKI(I 00000
11.000100 O.OIHHI O.OOOHOO II OIKII U.OOOOOfl 0.0000 O.IKKKHKI 0 (XHI{I
0000000 0.0000 0 000000 OOOfH) 110()(1200 0 IKKKI 0.000400 0 OIHHI O.fKI{IOllO 00000 11.000000 00000
0.000000 0.0000 0.000000 0.0000 04H4700 0.014K 0 429900 0,0490 0000000 00000 O.OfKHKIO 0.0000 0000000 0.0000 0 IKKKKI(I 00000 0 4K6900 0.0149 0.147500 0 OlfoK
0.019700 0.0006 0.002200 O.CKI03
0.000400 O.lllKIO 0.000000 0,(1{1(){1
0.000500 0.0000 O.IKKXHI(I li,(I(KIIJ
11.000000 II IKKKI 0.000000 0,(1(){10
0.000000 110000 0 OIKKKIO 00000 0.000000 O.IKHIO O.IKIOOOO 0.0000
0.000000 O.OIKIO O,IKKKKI(I 11.0000 O.IKKKKlO II.OIKKI 0.000000 O.OIKKI
11.000000 O.OIKIO 11.000000 110000 O,OIHHKI(I 111KKI(I II IKKKKKI 00000
11.000000 0.0000 0.000000 00000 0.000000 0 OIKIO 11.000000 0.0000 O.IKIOfKIO 11.0000 11.000000 0.00110
0.030ti 0.1140
O.OIKKJ O.OfKIO O.IXHI(I 1I,()(KI(I
0.0000 0,0000
0.0000 11.0001 O.IKKIO 11.0000 II.OfK)2 11.047K 00000 0 IKKKI 11.0304 00661 110306 111140

Occidental Chemical Corporallon October 2013
Ck GIKi .'iuutrc·:. Uf"Uh: 111:!ll.l1Cit-ll1twu Cit· I" TuLih
Constituents
llydrogcn Carbon Mono.·udc
Carhon D10"idc I lydrogcn Sulfide Methane Acetylene Ethylene I: !hone Methyl A(ctyl!..,..c/Prop;~du:uc
Propylene Propane Buu,ilcncs 8utylcnes Butanes CS's Ch·CH Non·Arom:~tics
Bcm:cnc Toluene Xylcncl Ethyl BcnJ.Cnc Styn:nc C9-20-IC 21J.l- 2KK C 2XH C• Walcr Nitrogen DMSIDMDS Ammoma
Ethylene Plant Fugitive Emission Totals CR C3+ Arcu Fugitives, CR-16 (cont'd)
Py-Cus Scura~c Vapor (Comp '<): Quench Water (Comp G):
Dc.·cummlssionint:i Spent Spcal NaOH StoraJ:C' and Cou51ic und W AO- All WAO- Liquid Scn·lcc
Vapor SL'n•lcc
Wcl~bl EgJuioml Wcl~hl Emb!lions Frattiun (lblhrl Frocttun (lblhr)
1.1100() 0.~018 1.0000 0.0375
O.IHIOOOO 0.0000 O.OCIOOOO 0.0000 O.IHHHHHI O.tHIOO O.C)()(HlOO 11.0000 o.rn)()(HHI Jl.l)()(lO 0,0(){)()1){) 11.0000 O,()(J{HlOO 0.0000 0,0()()(100 0.0000 II,I){KK)()(I 0.0000 O,()()()(KlO 0.0000 0.1100000 0.(10(1() 0,1100000 0.0000 0 .I)()(HlOO 0.0000 O.IKIOJOO II.IKKHI O.OCIOOOO 0.0000 0,0(10(00 0,0000
0.1100000 0.0000 O.OCIOOOO 0,0(){10 0,1){10000 0.0000 II.CKIOOOO 11.0000 O.rnKKIOO 11.01100 O.OIKKKIO 0,0(){10
0.032900 00066 O.IIOOOIK1 0 ()()()()
11.000400 00(101 0.000000 00000 00(1()300 00(1()1 0.000000 00000 O.IH091KJ 0.036S 0,0110(100 0.0000 0,117HHOO 0.0159 O.IKKKIOO 0.0000 0.110000 0.01::!::! O.IKI0400 11,0000 0.008200 0.0017 0,0(10100 0,(10(1()
0,1){10700 00(){)) O.IKIOOOO 0,()()(1()
0.0(10300 0.0001 0,()(10()(1() 0.01100 O,()()()(KKl ll,()()()() 0,()(10(1()0 II,I){KIO
0.000000 O.IKIOO 0,000000 0.0000 O,IHHKKlll O.()(J{MJ 0.()()()()(1() 0,1)()(1()
o.rn10000 O.IKKIO 0.999300 0.0375 0587500 II.IIHS O.IHIOOOO 0.0000 0,()(10()(1() (l 0000 o rnKKHIO 00000 0 IK)()(KIO O()()()(J 0.000000 0.0000
~-----~------ 02018 0.0375
Column Tot:lls, EPN CU.-16 Coubun Munox1dc 0()()(1() 00000 Coubon D1oxadc 0 0000 00000 Ilydro~cn Sulfide 0 0000 00000 Melhanc 00000 00000 l:.thaoc 0(10(1() 110000 ll~droacn. Wo.lcr :md Nnm~cn o IlKS 0 0375 Ammoma 0 0000 0.0000 Toll!( VOC OOH32 0.0000 Tnll!ls 0.2018 0.0375
Pl1£.t:!:! uf':!7
i
Prupyh.-ne Rcfrf2cratlun (Comp AB): Propylene
Rdrlgcratlun
IV<IKhl Emissions Fnctiun (lhlbr)
1.0000 0.0280
0.000000 0,0000 II.OI)()(HHJ O.IHKIO ll.rnKKHHI II IKKIO O.OCIOOOO 0 0000 O.OCIOOOO 0 IKKIO 0.000000 0.0000 O.IH)()I){lO O,OIKIO 0.0110000 0,01)()(1
0.000000 0 0000 11.9HOOOO 11.0275 0.020000 0.0006 0000000 0 01100 0000000 00000 0000000 n 0()()(1
0.000000 0.0000 0.000000 () 0000
11.000000 O.OIKIO 0.000000 O.OIKHI 0.0()()(100 II.IKKIO 11.000000 0,0000 ll.rnKKHKl II.OIMK1 0.000000 0.0000 0,0()()(10() 0 ()()()()
OOIKHlOO 0.0000 0,000000 0 0000 0000000 0 OIKIO 0000000 0 0000
0.0280
O,OIKIO 0,0000 0,0000 II OIKKJ 00000 0.0000 0 01100 0.02KO 0 02KOi

Occidenlal Chemical Corporation October 20 13
CR Recovery Area Fugitives - Example Fugitive Calculations EPN CR-15
Binary Refrigeration (Comp AC)
TI1ese fugi11ve componems are assO<:ialed will11he Elhylene Plunl. Emissions are conlrolle< usin~ lhc TCEQ's 28MID pro~ram w11h quarterly monitoring of flanges and connectors
Bas1s:
Emiss1on faclors are Iuken from lhe TCEQ's fugill\'e guidance documem for average SOCMI speciaiiOI
Component Emission
Efficiency, F'ugili\·c Losses, A reo Component Foetor,
Count lh/hr-comp
% lh/hr
Equipment In VAL- G/V 40 0.0132 97 0.0158 VOC Sen·ice VAL - GIV uempl 0 0132 0
VAL-LL 44 0.0089 97 0.0117 VAL- LL exempl 0.0089 0 VAL- HL 0.0005 0 PS- LL- MS 0.0439 100 PS- LL 0.0439 93 PS-HL-MS 0.019 100 PS- HL 0.019 0 FL - G/V quarterly 120 0.0039 97 0.0140 FL - GfV annual 0 0039 75 FL - G/V weekly 0.0039 30 FL - GfV exempl 0 0039 0 FL - LL quarterly 132 0.0005 97 0.0020 FL - L L unnuol 0.0005 75 FL - L L weekly 0.0005 30 FL - L L exempt 0.0005 0 FL- HL 0.00007 30 PRV 0.2293 97 CS- BS 0 5027 100 AS-LLIV 0.0439 100
Toto! 336 0.0436
Calculalions Methods. Hourly Emissions • (component count)(emission factor)(cffic•ency) Annual Emissions= (componcnl counl)(emission fdctor)(efficlency)(8,760 hr yr)(IOn/2,000 lb)
Legend· VAL- GfV VAL - GfV exernpl VAL- LL VAL - LL c•crnpl VAL-HL PS- LL- MS PS- LL PS-HL-MS PS- HL FL • GIV qunrterly FL - G/V annual FL. G/V weekly FL - G/V exempl FL • LL quarterly FL • LL annual FL- LL weekly FL- LL e'empl FL- HL PRV CS-BS AS· LLIV
CR GIIG Sourm Up<la1c I OZJ iJICR·I S
Valves in Gas/Vapor Service Valves in Gus/Vapor Service lhal are D1fflcuh ur Unsafe lo Monilor Valves in Lighl Liqu1d Serv1ce Valves in Lighl Liqu1d Service 1ha1 are Difficult or Unsafe Ia Monuor Valves m Hea''Y L1qu1d Scrv1ce Pump Seals in L•glu L1qu1d Serv1ce w/Mechamcal Seal and Barrier FlUid Pump Seals m L1ght L1qu1d Serv1ce Pump Seals in Heavy L1qu1d Serv~ce w/Mechamcal Seal and Barrier Fluid Pump Seals in Heavy L1qu1d Scrv1ce Flanges/Connectors m Gas/Vupor Serv1ce Subject to Quarterly Monitonng Flanges/Connectors m Gas/Vapor Serv1ce Subject to Annual Moniloring Flanges/Conneclors m GasfVapor Scrv1ce Subjecllo Weekly Phys•callnspeclion Flanges/Conneclors m GasiVdpor Ser\'tce I hal are D1fficuh or Unsafe 10 Monilor Flnnges/Conneclors in Lighl Liquid Sen·ice Subjecl to Quarterly Monitoring Flangcs/Conneclors in Light Liquid Service Subject to Annual Monnonng Flanges!Conneclors in lighl Liquid Subjecl to Weekly Physicallnspeclion Flanges/Connectors in Lighl Liquid Service lhal are D1fticuh or Unsafe to Monllor Flanges/Conneclors in Hea\'Y Liquid Ser\·ice Pressure Relief Valves (w/ RupiUre Disks, Vcnled 10 a Conlrol Device, or Relieves Thermally) Compressor/Blower Seals wilh Burrier Seal Agi1a10r Seals in Lighl Liquid or Vapor Serv1ce w/Barrier Fluid
F'ugilive Losses, tons/yr
0 0694
0.0515
0.0615
0.0087
0.1910

Occ1denlal Chem1cal Cocpur.Jt&on O.:lubtr 2013
Elh-eFrrd
icaiUiitKnls, Cuhama Tutab rur I ErNCR·I~
(Cumplll
Embsians (lb/hr)
!Curbun Montt~ldc 0.0000 Cilfhon D1mudc UCMKHI
lt't'drua;cn ~u)(uic IUKKH) Mcth:u~ 0.0020
Elhonc 0.0744 Uzdtobocn WJJicf 11nd N••n$.cn n.nnoo Ammom11 O.IKKHI TDial VOC 11.()()20
TUicl~ 11.117Kl
Satun1~
Cl (CompC)
Embsionr jlblhr)
ti,OOOO
n.nooo o.uouo 0.0011
0.12'12 0.1~17
n.onno OUUJ~
U.:!llJK
F•raace Quncb Qurnch 'tutld lJ\·erbnd Guolinl'
lComp D) (CompEl (Comp F)
Embstons Emkd••s Emiuions (lblbr) tlblhr) (lblbr)
O.fNKl1 0.0000 o.onnn O.IKHII fi.INJCHI IUKlOO O.llllllll ----o:iiOiiii ----o:iiOiiii 0.011}5 II,IJOIZ IJUOUO
UOSNO UOOlft 0.0000 0 IK.:!IJ OOOhK 0.0000 o.nooo 00000 0.00110 O_IWMb O_OOt,.:! O.OHf•
11.3Sl'lf• OUI70 OO!Jl•
Ethylene I' Inn! Fugi!lve Emissions Summary CR Furnnce Area Fugilh·es, CR-13; Column Tolols
lJimellli~l Dln1r1h)l
Qucnc .. OfT-Gas lu SttiRdeJDl--Sulnlk/01·
\Valrr Fwd NahlniCas
tM1h)'l mrlh\1
tC .. mp,\01 Dbwlndto tC..cnp(;) (Cump\') Dkal .... \'apor
{Comp.\E) (Camp .\F)
Emlsdons Embrions Embslon• Embdons Emluleas (lhibrl (lblhr) (lblbr) (lblhr) (lblhr)
OOOIHl OUO!l 1)0000 noooo OJICXNJ 0.0000 0.0000 UOUIK 0_11000 U.OOOH
0.0000 OIKHHI 11001)0 IWOOO OO<MIO 00000 ~ ~ 0.0000 1)0000 O.llOOfl U()(HJI OIJO.I~ O()(KKI 011000 U.l.:!ftU flhSJ~ IIOUU\ nounn OIJI31 0.0000 o.onou 110000 001100 noouu 0,0001 ODUI~ 00014 0.0171 602.17 u I Ziti 079.5:! 0 I.S.:!.I 0 0171 110]70
Ethylene Pion! Fugitive Emissions Sumniory CR Charge Gos Area Fugitives, CR-1~; Column Tulais
Qut:nrh Char,:t:G111 Qu~nch 0.. l"rop,·lenr Dinar\'
0\rrbt'ad Uquld \Valrr BDim•lzu l'lalaniGu Mdrftt"n- Rrldc~n-
ErN CR-14 Tollll Dan•mt (Comp \OJ .... lion
Conslltllt"nls trompE) (Compll} (CompGJ (Comp \\} (Compt\BJ tCnmp .\C)
EmJniun' Emlsd•ns Embdens Embtkult Embdont Eml:st~n• Emisdons Emlsdotu Embdnns (lbl .. r) (lblhrl (lb/hr) l)hlb) (lb/br, (lb/hr) l)bltlr) (lklh<l ltonJI\r)
CartH.m Munmude II.OOCll flfKKK) flfHKH) IIUCIOO unoon onoon nonou r1UUt11 unnt) C:ubon Dm.udc 00001 fJINHK) ooonn ----oiiOOii 011010 000011 OOfHH) OUOJ I uncw. Hydro •en ~ullt.k ooocm 110000 0110110 n 00110 00000 uooon ounon 0110()(1 0 0001 Mcl~nc __ fi.II:!IH OfMJOO 00000 0 IKKHl 0.075H 11.0000 0 11.!1 n"",tlt~ 1 1'1111!1 Eth.uM: Ofllt1ft n IJOOO n 00110 01111110 ~ 0 IHMID OfkHH} 0()(,-12 ll.:!Mll II ·dro •en. Wrucr nod Nnro~~·n 0 1156 n nlt7 110.:!2:! 0 00110 OOiH11 n.nooo O()(lfl.l 0 1701 07451 ,\mmomll onncto 0.00110 OIIOIKI (I 1)000 II 00011 n noon n.ouon 0 00110 O_OfHHl To1n!VOC n 104'1 IIUOOI noono II U7KII IIINI07 0 1M IS 0 :!511\ II K:!.J.-1 1(-,0M,
Toc111~ II )0]1 OOJIK 002:!2 U07HU OUHOJ 111~35 n lK911 I 2K71,1 5 f..& I:!
t'll: ullt•!lo...,.n UP"bbr W.!tt l'hrtt,.a:..c-1'\· ' '.&-r ~~ .... :J
Wash 011 rrnp)lrnr n .. o ..
Wash Oil \apor
,\mmonf• Rdrtccra· D1nontzrr llufanlzrr ErN CR·IJ To1DI (Cump,\G) (Cnmp XX) .... U\'rrbrad Rat1nm" (Camp,\(;)
(Cnmp.\RJ (Cnmp \') (Camp\\')
Emlssions EmlnHnn Emlnloos Emtu!uns Emtninas Emisdon• Eminktm Eminiaas (lb/hr) (lhlhr) (lblhrl (lblbr) Clb/hrl (lblhrl (lb/hrl (lotnlnl
nonon 00000 0 00011 00000 00000 n.onoo nno2s 00107 00000 110000 uooon 1100011 ~ 0.0000 011020 UOUHft IIC'KKK) 1)0000 001)00 OIHIOO 0 IXJOO ounoo 011000 n.uoou 1111000 0 IKXHJ 011000 000110 00000 UIXMJO () JOH(t I J!'iiK nonnn 110000 OIKHNl 0()(1011 110000 0 IXJOO (I :!702 I IKll nnono 00-U~ IIIIOI'HI oonoo onooo uooon 10!1'111 4 7WI7 II fXHJO nnoou OOJIM nnnno OIMHKJ oooon UtlHH 0 1393 n otn 0 OOOJ llllllllll DO:!RO 1)0(,17 on.m 0 1442 I !i07K II 0171 ttn412 OJBll' OO'!KO ()[)(,JH on.m 21~K1 K~714
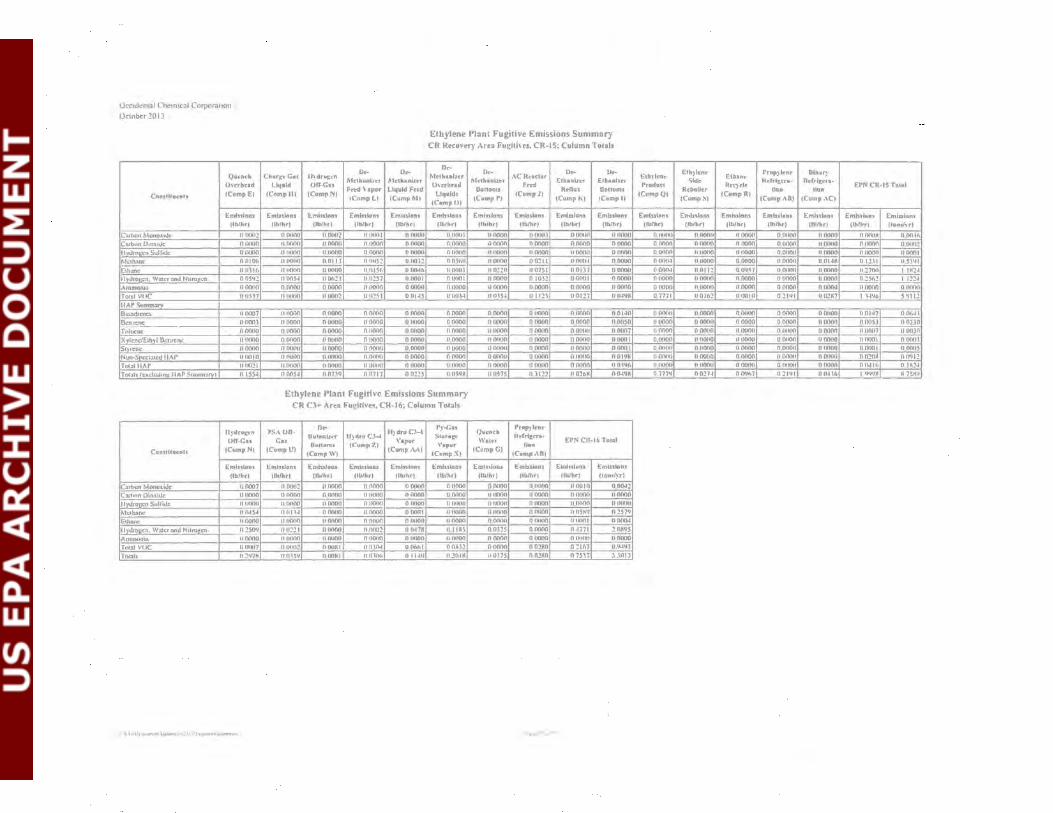
Orctdcnlal Chcmtc.,l Corpur.Jtton Oclobcr 2013
I
Qllt'ftCb On-rbc•d
Coaslltocats (Camp EJ
I Emininas
I tlb/hr) I 'C:!rbon Monoxuk n rxMl!
CDrbun DIDll&~Jc ouuun H~rolirn Sulftd~ ooooo ~ct~nc 0 DIDf•
ll1anc IHIJI6 illydro •c:n, Water IUltl Nuro en 005ll! !Anunorua 0 OO<Ml :'r01al VIIC 00511
'HAl' Sumnurv Duud1cno. 110007 Ucnt.mc 00001 ~~~------ o 00011
X~lcnc/Eih~llkntcnc nnuoo iSI~rt'PC (10000
Nun·SpcclOIU:d ltAr 111111111 Tm;~l UAP UCJU!l Tnc3l!li lr:Acludm • IJAP Summ:~rvl 0 1554
llydrot:~n
Off4Ga~
Constitue-nts 1 ICampN)
Emi.ulons (lblhrl
'C3rbun Mono\ ilk 110007
C:utW~nOioJ.itlc lliMHIO llyt.lro :cnSullhlr IIUUfKI
Mcth;Jnc nn.as.a Ethun~ 1100011
ll~drol;c:n, W~r:r nnd Nttrul:!cn II :!5&1
Anvnonia. uooon T01a1 vue OIKHI7
Toc:~ls. 02t17K
,_.R t..llti !lo. .. "" u~ lll!lt 1:Tuptn.n s ... -..w.
D.- o .. Ch•r-~c Gas ll}drUJ:;~:n
fttcthulnr A1t:lhaoitrr Llqald OfT-Ga~
Fctd \'apor Llq11ki Frrd tComplll (CompNI
!Cnmp LJ (Cumpl\l)
Embdons Emlnions Emkdoas Emisslaas (lb/hr) (lb/hr) llblhrJ (tb/hr)
n.nono n.onn2 II UUUI O.IMKHI
U.OOOO 110000 ----rriMiOO ~ UIHMK1 110000 O.llOilO o onnn ~ ~ n IHI5~ ~
IIUOOO II UOOO ----o:iii"56 11 004tt 00054 n [)(,:!.1 ti.O!S7 O.IKHII
0.111100 II 11000 n.nooo o.ouon IIIHNKl IIIKK12 1111:!51 unt.as
nnooo 0.0000 0 I}{}(I(J 00000 n.nonn 0,0(100 (I 00011 0_1)1100
II.UOOO o 01100 n noon 0.01100 0,0000 (ll}(lt){) o ooon ll (10(10
OfHKKI 1111000 0 (111(10 o.nnoo IU)U()O 110000 O.I}(HKJ 000011 11.0000 IIOOIHI II IHHICI OIM"KHI
n.ons.a 1107Jq CUI717 002:!5
Ethylene Plant Fugitive Emissions Summnry CR Rrcov•ry Area Fuglti\es, CR-15; Column Totals
Or-().- D.- 1><-
MdhaDiur 1\lt'lhanlnr
AC ltcaclar-Eth.anl.zu Etb.Aizcr
0\'trhrad Do noms
F=l Rrnux Oanoms Liquids
tCump PI (CompJI
tCump Kl !Cnmpl) (CampO)
Embdont Embsklns Emkslons Emluions Embdans flb/hr) (lb/br} llblhr) (lb/hr) (tblhr)
IJ.IMMil nnooo UIKMI.l OUIMHI IJIKkHI
0.0000 00000 011000 0.0000 011000 ouonn OIHKHI n.ooon nnono OIIIMHI
~ n.onnu 1)0:!11 UIMHI-1 0.0000 11.0001 UO!~O 00751 0.01)7 000011 O.IMK11 110000 o IOJ:! DlifKII 00000 II.IHIOO onuno U.OOOO OJKK)() 110000 IJII<Il4 110154 U.ll::!'i 001:!7 lltJ41JM
0 11000 00000 00000 0.0000 0.0140
ll 110011 n IXlOO 00000 0.0000 0.01150 110000 IIUOOO 0(10110 O.(MHHI O.llll07 11.0000 -~ noooo 000110 O.IHKII II UOOO OOIHHI OOilllll unooo 0.0001 011(1011 0111100 o_nooo fUKHKl O.OI'IH II_IMNIO 110000 nnono llOIHIO 001%
O.t159R 1111575 n 1122 IIO::!flM 0049M
Ethylene Plant Fugitive Emissions Summury CR CJ+ Ar•• Fugitlvr<~, CR-16; Column Totals
PS.\UO-n ..
ll)·draC.J-t ry.c.11s rrap~lcn~
Uutanl.z&-r fl)'dro C.l-a Slota~ ()u~ndr.
Rcfrigcra· I Gas \'apur \Valu ENol CU-lt. Total
Bun oms (CumpZ) \'apur ... fCompU)
(Camp W) (Comp,\1\)
(CompXJ fCompG}
jCampAB)
Emiulons Emiulatu Embslom Emlntnas Emissions Emtuloa.s Embsions EmttsiiHis Embdons
(lblhrl (lblhr) (lblhrl flblhr} (lblhr) (lblhr) HblhrJ (lb/hr} (lans/~'TI
II IHHI:! n noon 0 (lll(l(l o 00110 0 0000 oonoo 0.0000 O.IMJIO 0.004::! 0(111(1(1 0 IMMKI IIINNNl n OllOO n.oooa 1111000 00000 OIHKlO noooo ll.fMIOO IIOIMHI OIHMKI OIMHHI IWINHI UIIIMHt 110000 U,OOO(I fliMMMJ
O,fll;l-1 0 OOIKI n ooon ---oiiiiiil nnooo 0.11000 11.110110 OOS1l1' O!HQ
1100110 II OCKIO 0 00110 OfH)f}O "00110 O.OOCHI OIHNKI OHUOI -----n:ooo:; 1111:!21 110000 (IJ)II02 IIIIHH ~ 0.0!75 0 0000 04771 _ ::! . Ott~JS
IIIKHIO IIIMKKl 000<10 ~ ~ ~ ----rriMiOO --o:oooo __ I_U'HIOO
U.IKKJ! UOIIMI n nlo.t O.IIMI 00~32 00000 OO:!KO D ::!lfl7 ll,t,l.4'.1J
1103:511 OOOMI llliJOfi 0 11411 U..:!:OIM UUJ7S OO!KO nnn 1 JOIJ
r•jll ·• .... -~
Eth)lt:nt' rr-op}·kn~ l»nan· Ethyfrar
Sldt: Etbanr
h.drl,:cra- hdrltc;...-Pr-odurt
Reba Her Rcrydc
11ao Uan Et•N CK-15 Tolal
tCnmpQI ICutnpSI
tCumpR) CComp AD) tComp.\C)
Emissions Emlnkun Emktlons EmbsJoas Emlsdon• EmhtJon, Emissions (lblbr) (lb/hr) (lhlbr) (rb/hr) llblhr) (lb/hr~ (lonsl~·r,
U.tMNMI n.noou IIUOCHI O.fKlOO 110000 oonm~ O.fKHii 0.0000 00000 00000 O.IIDOO u.unno 011000 O.lkK12 0.0000 H.IKXHl nnnuo 0,0000 u.nnoo OfiOil(J IlOilO I OINHI4 IUKXKl ~ IIOIKlO O,Ol4R 0,1:!.11 ~
--oooo:i ~ 0.0957 II.OfiOO n.oooo ll.:!7lNI --i"'R2-i fl.OOOO OOCXHI 0.0000 00000 n.onoo 0.~51\:! 1.1::!:!4 OOCKKI U.IKXK) n_oooo O(lflO(l n.uoou 1)1)0()0 OIKKKl 0 7711 OOifl:? unnln n !I "'I llfi::!K7 1."\4% ~
0 OOCNI 11.0000 0,0000 0 0000 O.OCHlO 00147 OOf..a.l 110000 0 00011 0.01100 0.0000 n.nooo OliOS) 002Jf1 (I (10(10 n.oouo n.nuou OIMKKI n.nnoo ---T.*if CUKIJfl 0.0000 011()(1(1 110000 0.0000 II 0000 - OIKHH
O,O!HHI ~ 0 (10(10 0.000(1 onooo 0.0001 O.OIKI5 U OOCHI 0.0000 O.O!HMl U.OOOCI 0 OIHXI U.020M UO'JI2 n.noou U.IKKHI Of)Q{HI O.IHIOU OOIKlO 0 l).llf, O.IM24 0.7779 0027-1 00%7 n 21111 110-06 I"""" M 75Mll
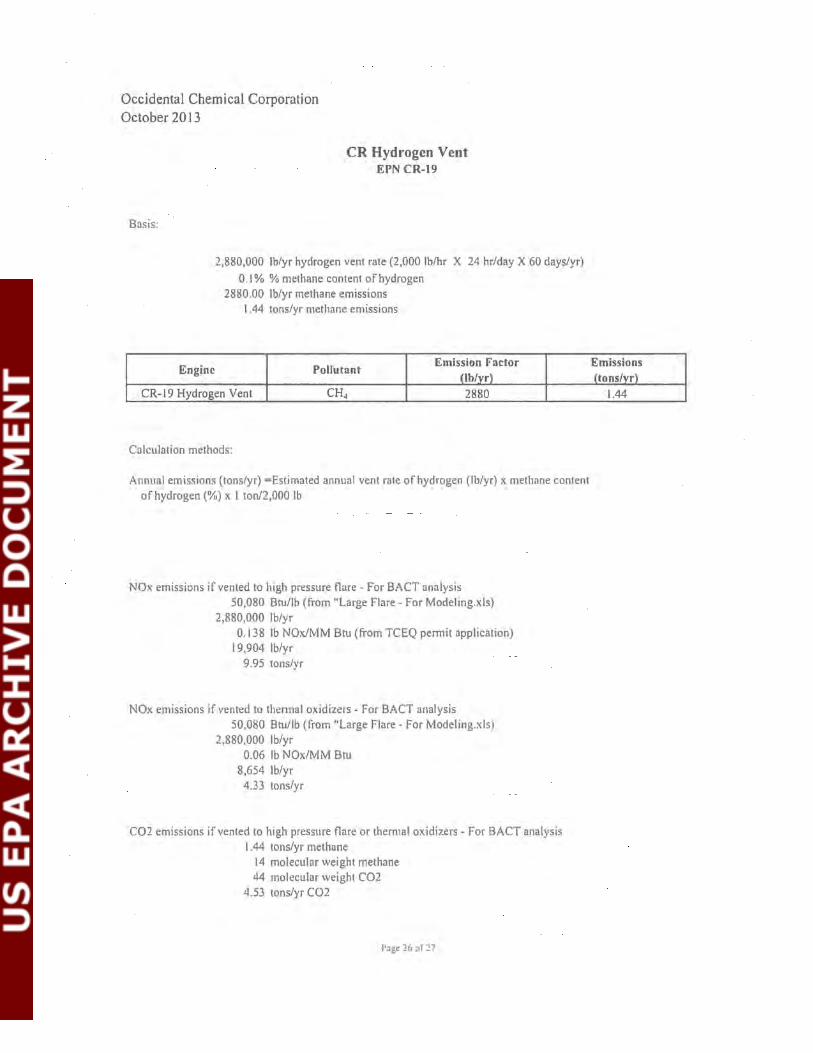
Occidental Chemical Corporation October 2013
Basis:
Engine
CR Hydrogen Vent EPN CR-19
2,880,000 lb/yr hydrogen vent rate (2,000 lblhr X 24 hr/day X 60 days/yr)
0.1% %methane content of hydrogen 2880.00 lb/yr methane emissions
1.44 tons/yr methane emissions
Pollutant Emission Factor
(lb/vr) CR-19 Hydrogen Vent CH4 2880
Calculation methods:
Annual emissions (tons/yr) =Estimated annual vent rate of hydrogen (lb/yr) x methane content of hydrogen(%) x I ton/2,000 lb
NOx emissions if vented to high pressure flare- For BACT analysis 50,080 Btu/lb (from "Large Flare- For Modeling.xls)
2,880,000 lb/yr 0.138 lb NOx/MM Btu (fi'om TCEQ permit application)
19,904 lb/yr 9.95 tons/yr
NOx emissions if vented to thennal oxidizers - For BACT analysis 50,080 Btu/lb (from "Large Flare- For Modeling.xls)
2,880,000 lb/yr 0.06 lb NOx/MM Btu
8,654 lb/yr 4.33 tons/yr
C02 emissions if vented to high pressure flare or them1al oxidizers- For BACT analysis 1.44 tons/yr methane
14 molecular weight methane 44 molecular weight C02
4.53 tons/yr C02
Page 26 of ~7
Emissions (tons/vr)
1.44

Occidental Chemical Corporation October 2013
Basis:
C02
CH4
N20
Cogeneration Units- Proposed GHG Increased Emissions EPN's CG-1 and CG-2
(Authorized by Permit Nos. 35335 and PSD-TX-880)
215 MM Btulhr, maximum, total fuel firing rate to provide steam and electrical power for the new NGL facilities
116.91 lb/MM Btu, C02 factor for natural gas from 40 CFR 98, Subpart C, Table C-1 (converted from 53.02 kg/MM Btu for use with Eq. C-1 b)
0.002 lb/MM Btu, CH4 factor for natural gas from 40 CFR 98, Subpart C, Table C-2 (converted from 0.00 I kg/MM Btu for use with Eq. C-8b)
0.0002 lb/MM Btu, N20 factor for natural gas from 40 CFR 98, Subpart C, Table C-2 (converted from 0.000 I kg/MM Btu for use with Eq. C-8b)
8, 760 hr/yr, hours of operation
Pollutant
Emission calculations below represent maximum emissions for both of the cogeneration units and assume worst-case fuel firing in the heat recover steam generators rather than in the higher efficiency gas turbines
Emission Factor Hourly Emissions Annual Emissions (lb/MM Btu) (lb/hr) (tons/yr)
116.91 25,135.46 110,093.30
0.002 0.47 2.08
0.0002 0.05 0.21
Calculation methods:
Hourly emissions (lb/hr) = emission factor (lb/MM Btu) x fuel firing rate (MM Btulhr) Annual emissions (tons/yr) = hourly emissions (lb/hr) x hours of operation (hr/yr) x
I ton/2,000 lb
CR GHG Sources Update 102313 CG-1 and CG-2 Page 27 of27

Occidental Chemical Corporation October 2013
APPENDIXD BEST AVAILABLE CONTROL TECHNOLOGY

Occidental Chemical Corporation October 2013
BEST AVAILABLE CONTROL TECHNOLOGY
New major stationary sources and major modifications must apply best available control technology for each regulated NSR pollutant subject to PSD review. The review of BACT using the EPA's five-step, top-down BACT approach typically includes the following items for each source category: 1) the identification of available control technologies; 2) the elimination of the technically infeasible alternatives; 3) the ranking of the remaining control technologies; 4) the evaluation of the most effective controls regarding cost-effectiveness, energy impacts and environmental effects; and 5) the selection of BACT.
For the sources associated with the proposed Ethylene Plant, this BACT review is applied to the five cracking furnaces, two thermal oxidizers, a high pressure ground flare, an emergency generator engine, a cooling tower, a C3/C4 hydrogenation regenerator vent, fugitive sources identified for four operating areas, and hydrogen vent.
It should be noted that the existing cogeneration units are not subject to BACT since they are not modified sources. The cogeneration units are included in this application only because they are affected facilities that influence PSD applicability.
EPN's CR-1 through CR-5; Ethane Cracking Furnaces Nos. 1 through 5
1) The identification of available control technologies. Potential GHG emission control technologies for the cracking furnaces were identified as the follows:
a) Low carbon fuels - Use of low carbon fuels to reduce the amount of carbon dioxide generated in the combustion process.
b) Furnace excess air control- Monitoring of oxygen in the flue gas for optimal efficiency.
c) Good operating and maintenance practices- Visual monitoring of flame patterns and periodic cleaning of burner and feed nozzles to assure complete combustion and efficiency. Also includes periodic refractory repair and cleaning of process heating and waste heat recovery systems when required to maximize thermal efficiency.
d) Energy efficient design- Use of waste heat recovery from the furnace flue gas and the furnace process effluent gases, thereby offsetting GHG emissions from other process heating sources.
e) Carbon dioxide capture and storage- Capture, compression, transport and geological storage of carbon dioxide in the cracking furnace flue gas exhaust.
Page I of 20

Occidental Chemical Corporation October 20 13
2) The elimination of the technically infeasible alternatives. All options identified in Step I are considered technically feasible. The use of low carbon fuels, stack gas oxygen monitors, good operating and maintenance practices and waste heat recovery are all practiced on other process furnaces and have been included into the design of the proposed cracking furnaces. Carbon capture and sequestration (CCS) of the flue gas from the cracking furnaces is considered technically feasible, but not demonstrated commercially on a similar combustion system.
3) The ranking of the remaining control technologies. Carbon dioxide emissions from the cracking furnaces could theoretically be completely absorbed in a conventional amine solvent. The carbon dioxide could then be concentrated in an amine regenerator vent stream, dried, compressed and routed to oil production facilities using carbon dioxide for enhanced oil recovery. The nearest location for this would be in Hastings, Texas which is located about 180 miles away. This would reduce GHG emissions from the cracking furnaces by 312,000 tons per year, and would be the most effective treatment for this individual source.
Waste heat recovery can reduce GHG emissions from both the furnace and the cogeneration unit by reducing the furnace firing rate and steam demand for the ethylene unit. This requires the installation of heat recovery exchangers on the process outlet gas and the flue gas from the cracking furnace, It is estimated that GHG emissions from the cracking furnaces will be reduced by 43,000 tons per year and GHG emissions from the cogeneration facility will be reduced by about 316,000 tons per year as a result of installing waste heat recovery on the cracking furnaces. This is considered the next most effective control technology.
The use of the hydrogen rich vent gas from the ethylene recovery section instead of natural gas for fuel in the cracking furnaces reduces amount of carbon dioxide generated in the cracking furnaces. It is estimated that the carbon dioxide emissions from the cracking furnaces is reduced by about 260,000 tons per year using this alternative low carbon fuel source. This is considered the next most effective control technology for this application.
Excess air control using stack gas oxygen monitors and good operating and maintenance practices are considered good engineering practice and have been included with the proposed furnace design. Evaluating their effectiveness and a subsequent evaluation of each technology is difficult to quantify and they are considered the least effective.
4) The evaluation of the most effective controls regarding cost-effectiveness, energy impacts and environmental effects. The capture, compression and sequestration of the carbon dioxide in the cracking furnace flue gas would reduce the GHG emissions from the cracking furnaces by up to 291,796 tons per year, but would require an additional 416 MMBtu/hr of thermal energy to strip the carbon dioxide from the capture solvent. This would require new natural
Page 2 of 20
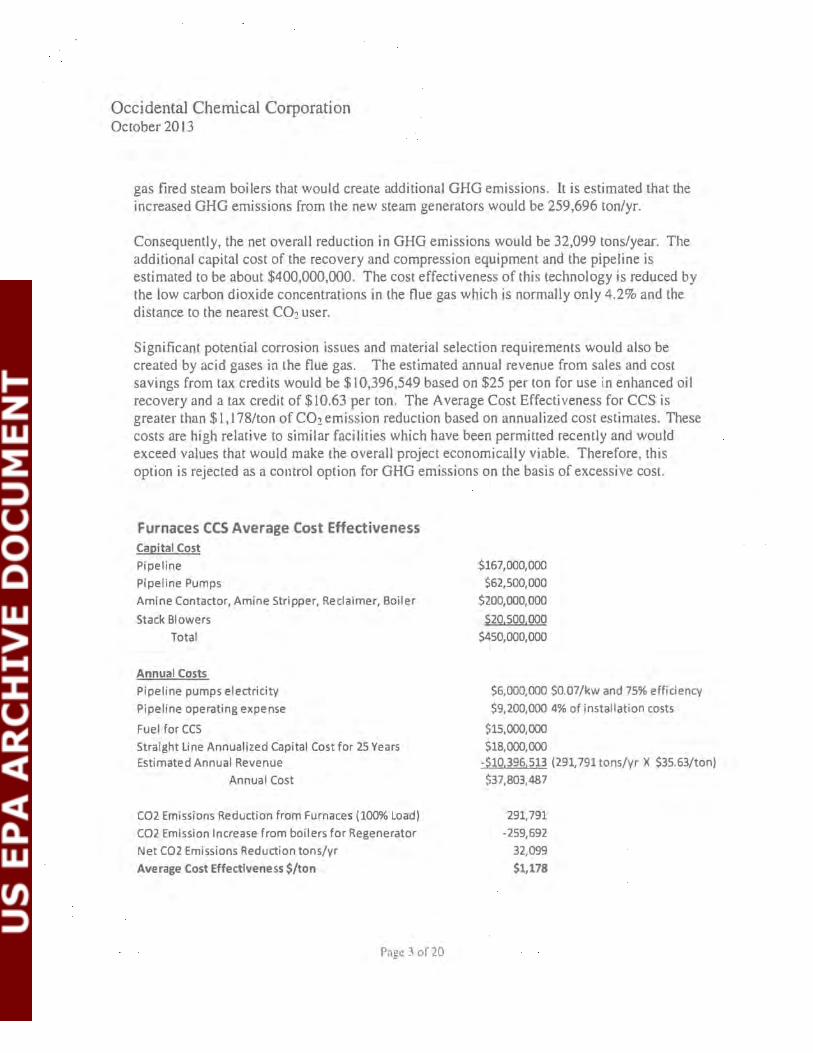
Occidental Chemical Corporation October 20 13
gas fired steam boilers that would create additional GHG emissions. It is estimated that the increased GHG emissions from the new steam generators would be 259,696 ton/yr.
Consequently, the net overall reduction in GHG emissions would be 32,099 tons/year. The additional capital cost of the recovery and compression equipment and the pipeline is estimated to be about $400,000,000. The cost effectiveness of this technology is reduced by the low carbon dioxide concentrations in the flue gas which is normally only 4.2% and the distance to the nearest C02 user.
Significant potential corrosion issues and material selection requirements would also be created by acid gases in the flue gas . The estimated annual revenue from sales and cost savings from tax credits would be $10,396,549 based on $25 per ton for use in enhanced oil recovery and a tax credit of $10.63 per ton. The Average Cost Effectiveness for CCS is greater than $1, 178/ton of C02 emission reduction based on annualized cost estimates. These costs are high relative to similar facilities which have been permitted recently and would exceed values that would make the overall project economically viable. Therefore, this option is rejected as a control option for GHG emissions on the basis of excessive cost.
Furnaces CCS Average Cost Effectiveness Capital Cost
Pipeline
Pipeline Pumps
Amine Contactor, Amine Stripper, Reclaimer, Boiler
Stack Blowers
Total
Annual Costs
Pipeline pumps electricity
Pipeline operating expense
Fuel for CCS
Straight Line Annualized Capital Cost for 25 Years Estimated Annual Revenue
Annual Cost
C02 Emissions Reduction from Furnaces (100% Load)
C02 Emission Increase from boilers for Regenerator
Net C02 Emissions Reduction tons/yr
Average Cost Effectiveness $/ton
Page~ of 20
$167,000,000
$62,500,000
$200,000,000
$20,500,000
$450,000,000
$6,000,000 $0.07/kw and 75% efficiency
$9,200,000 4% of installation costs
$15,000,000
$18,000,000 -$10,396,513 (291,791 tons/yr X $35.63/ton)
$37,803,487
291,791
-259,692
32,099
$1,178

Occidental Chemical Corporation October 20 13
Emissions Assuming Natural Gas Fired Boilers for new Amine Regenerator
Assume maximum firing for maximum C02 capture
Max C02 emissions from Furnaces (100% load)
C02 Capture (assuming 100% recovery)- 5 furnaces
Total C02 capture
13,324lb/hr perfurnace
291,791 ton/year
66,619 lb/hr
Use gas processing data on amine absorber-strippers from Campbell Gas Processing Books
From J.M. Campbell & Co Gas Processing Handbook (Table 4.10))
Energy Required per lb of C02 for Regeneration
Solvent SG
Factor per lb Solvent
Solvent Concentration (Aqueous DEA) factor per lb of DEA
Moles C02/Mole DEA
Energy Required per lb of C02 absorbed
Additional Steam Energy Required for Amine Regenerator
Boiler Efficiency
Fuel Required
C02 Factor
C02 Produced
C02 Produced from boilers for regenerator
72000 Btu/hr per gpm of DEA
1.1
130.8 Btu/lb of solvent
25% 523 Btu/1 b of DEA
0.2
6242.9 Btu/lb C02
415.9 MMBtu/hr
0.82
507.2 MMBtu/hr
116.9 lb/Mmbtu/hr
59,290 lb/hr
259,692 ton/year
The use of heat exchangers on the process and flue gas outlet of the cracking furnaces to recover waste heat is estimated to require an additional investment of $50,000,000 and save approximately $17,000,000 annually in fuel costs, while reducing GHG emissions by 359,000 tons per year. The investment cost is about $140 per annual ton of GHG. While these costs are considered excessive for GHG emission controls, when combined with the reduced energy costs this option is considered BACf for this project and is included in the proposed design.
The use of the hydrogen rich vent gas for furnace fuel is considered the most economical use of this vent gas for this site and has been included in the base design. Similarly, good operating and maintenance practices and stack gas oxygen monitors for controlling furnace excess air are considered good engineering practice and have been included with the proposed design. Evaluating their effectiveness and a subsequent evaluation of each technology was not considered necessary for the BACT determination.
5) The selection of BACT. BACT for this application will include the following: the use of
Page 4 of20

Occidental Chemical Corporation October 2013
low carbon fuel; good operating and maintenance practices; stack gas oxygen monitors for controlling excess air; waste heat recovery from the cracking furnaces in the form of heat exchangers on the furnace process outlets; and boiler feed water economizers in the furnace stacks. Oxygen analyzers will be provided in the stacks. The stack gas temperatures will be maintained at less than 400°F during normal operation and heat exchangers on the process outlet of the furnaces will be installed to reduce the outlet gas temperatures to 850°F or less.
EPN's CR-1-MSS through CR-5-MSS; Ethane Cracking Furnaces Nos. 1 through 5- MSS Activities
Carbon deposits or coke gradually build up on the tube walls of the furnaces . This coke interferes with heat transfer through the tubes, increasing furnace temperatures and reducing efficiency. The furnace deposits must periodically be removed or decoked. This decoking is accomplished with the introduction of steam and air at high temperatures to convert the deposits to gaseous carbon dioxide. The exhaust gas is discharged through the furnace with the flue gas. The carbon dioxide from decoking is included in the emissions from the cracking furnaces. This section will address the carbon dioxide that is generated from removing the coke deposits.
l) The identification of available control technologies. Potential GHG emission control technologies for the cracking furnaces were identified as the follows:
a) Mechanical cleaning- Use shot blast or hydro-lancing to mechanically remove coke from the tubes. The coke would then be disposed of in a solid waste landfill.
b) Reduced air- Limit the air feed to reduce carbon dioxide formation.
c) Low coking design and operation- Proper furnace design and operation will tend to reduce coke formation and minimize carbon dioxide formation.
2) The elimination of the technically infeasible alternatives. All of the identified alternatives are technically feasible.
3) The ranking of the remaining control technologies. Physical removal of the coke would provide the most effective control of carbon dioxide emissions. It is estimated that up to 640 tons/yr of carbon dioxide production could be eliminated. Reducing the air would result in some of the carbon being converted to carbon monoxide instead of carbon dioxide. It is estimated that potentially as much as 50% of the carbon could be converted to carbon monoxide instead of carbon dioxide which would reduce carbon dioxide emissions by 320 tons per year. Low coking design and operation is difficult to quantify, but is considered the least effective means of control. Assuming run life is extended by 25%, the reduction in carbon dioxide emissions is equivalent to about 160 tons per year.
Page 5 of 20

Occidental Chemical Corporation October 20 13
4) The evaluation of the most effective controls regarding cost-effectiveness, energy impacts and environmental effects. The cracking furnaces have vertical tube coils of varying diameters. Mechanical cleaning of the coils would require the cutting and physical removal of the furnace coils and bends during each decoke. The coils would then have to be rewelded after cleaning. The costs and potential safety issues with the re-welding of materials are excessive for the minimal reduction in GHG emissions. The operation would also generate additional PM emissions from the decoking. Mechanical cleaning is rejected as a control option for GHG emissions from decoking. Limiting the air feed would increase carbon monoxide while reducing carbon dioxide. Carbon monoxide is a criteria pollutant with higher toxicity than GHG, so this alternative is rejected as a control option for GHG emissions. Minimizing coke formation through the proper furnace coil design for the feedstock and the use of anti-coking agents will increase furnace run time between decoking and improve furnace efficiency, thereby reducing operating costs. These design features are included in the proposed furnace design.
5) The selection of BACT. The use of a proper furnace coil design for ethane together with the use of anti-coking agents in the furnace feed to maximize the furnace run time between decokes is commonly practiced and considered BACT for this application. The total number of furnace decokes is expected to be 36 per year.
EPN's CR-6 and CR-7; CR Thermal Oxidizer Nos. 1 and 2
l) The identification of available control technologies. Non-condensable vent streams from the ethane cracking process, storage and loading area are generally combusted to destroy VOC before the inert gases are released to the atmosphere. This control can be accomplished in elevated flares, enclosed flares and vapor combustors (thermal oxidizers). The destruction efficiency and the potential GHG control technologies will vary depending on the type of combustion device that is selected.
Since elevated flares and enclosed flares offer no opportunity for heat recovery and increased energy efficiency (i.e .• minimizing GHG emissions by using waste heat to create steam, and thereby, lessening fuel firing in other steam generating sources). the primary control technologies for the destruction of waste gas streams focus on the use of thermal oxidizers. Use of a thermal oxidizer for control of low pressure vents might be considered Best Available Control Technology relative to use of a flare. Potential GHG emission control technologies for VOC thermal oxidizers are identified as follows:
a) Combustor design- Design achieves good fuel and air mixing with sufficient temperatures to assure complete combustion and to maximize thermal efficiency.
b) Oxidizer air/fuel control -Monitoring of oxygen in the flue gas and firebox temperature for optimal efficiency.
Page 6 of20

Occidental Chemical Corporation October 20 13
c) Flame monitoring and periodic tune-up- Visual monitoring of flame patterns and periodically cleaning of burner and feed nozzles to assure complete combustion and efficiency. Also, includes periodic refractory repair and cleaning of waste heat recovery systems when required to maximize thermal efficiency.
d) Waste heat recovery- Use of thermal oxidizers with high firebox temperatures and waste heat recovery from the oxidizer exhaust to preheat the combustion air or produce steam for use at the site, thereby offsetting GHG emissions from other fuel combustion sources.
e) Combustion C02 capture and storage- Capture, compression, transport and geological storage or use of C02 in the thermal oxidizer flue gas exhaust.
2) The elimination of the technically infeasible alternatives. All options identified above are considered technically feasible. Periodic tune-ups, high combustor design efficiency, oxidizer air/fuel control and waste heat recovery are all practiced at other thermal oxidizers operated at the site and have been included into the design of the proposed thermal oxidizers. Compression, transport and storage of the C02 rich amine regenerator vent streams are also practiced at some sites. Carbon capture and sequestration (CCS) of the vent gas from the thermal oxidizer is considered technically feasible, but not demonstrated commercially on a similar, small combustion system.
3) The ranking of the remaining control technologies. C02 emissions from the thermal oxidizer flue gas could theoretically be completely absorbed in a conventional amine solvent. The C02 could then be concentrated in an amine regenerator vent stream, compressed and routed to oil production facilities using C02 for enhanced oil recovery. The nearest location for this enhanced oil recovery would be in Hastings, Texas which is located about 180 miles away. This C02 recovery would reduce GHG emissions from the thermal oxidizers by 107,879 tons/yr and would be the most effective treatment for this individual source.
Waste heat recovery can reduce GHG emissions from the cogeneration units by reducing steam demand for the Ethylene Plant. This approach requires the use of an enclosed combustion system such as a thermal oxidizer, instead of a less expensive elevated flare. It is estimated that GHG emissions from the cogeneration facilities will be reduced by about 18,200 tons/yr as a result of installing waste heat recovery on thermal oxidizers. This reduction is based on the more efficient cogeneration operation of raising gas turbine loads to maintain power output. This approach is considered the next most effective control technology.
Combustor design, oxidizer air/fuel with temperature control, stack gas oxygen monitors and flame monitoring are considered good engineering practice and have been included with the proposed design. Evaluating their effectiveness and a subsequent evaluation of each technology is difficult to quantify, but they are considered the least effective.
Page 7 of'20

Occidental Chemical Corporation October 20 13
4) The evaluation of the most effective controls regarding cost-effectiveness, energy impacts and environmental effects. The capture, compression and sequestration of the C02 in the thermal oxidizer flue gas would reduce the GHG emissions from the thermal oxidizers by 107,879 tons/yr, but would require an additional 154 MM Btu/hr of thermal energy to strip the C02 from the solvent. This approach would require new natural gas-fired steam boilers that would create additional GHG emissions. It is estimated that the increased GHG emissions from the new steam generators would be 96,012 tons/yr.
Consequently, the net overall reduction in GHG emissions would be II ,867 tons/yr. The additional capital cost of the recovery and compression equipment and the pipeline is estimated to be about $350,000,000. Significant potential corrosion issues and material selection requirements would be created by the sulfur dioxide in the flue gas. The capital cost represents about $29,494 per ton of GHG, and the additional operating costs in terms of fuel alone would be $5,000,000 per year. The estimated annual revenue from sales and cost savings would be $3,843,729 based on $25 per ton for use in enhanced oil recovery and a tax credit of $10.63 per ton . The Average Cost Effectiveness for CCS is greater than $2,558/ton of C02 emission reduction based on partial annualized cost estimates. These costs are high relative to similar facilities which have been permitted recently and would exceed values that would make the overall project economically viable . Therefore, this option is rejected as a control option for GHG emissions on the basis of excessive cost
Thermal Oxidizers CCS Average Cost Effectiveness Capital Cost
Pipeline
Pipeline Pumps
Amine Contactor, Amine Stripper, Reclaimer, Boiler
Stack Blowers
Total
Annual Costs
Pipeline pumps electricity
Pipeline operating expense
Fuel for CCS
Straight Line Annualized Capital Cost for 25 Years
Estimated Annual Revenue
Annual Cost
C02 Emissions Reduction from Thermal Oxidizers (100% Load)
C02 Emission Increase from boilers for Regenerator
Net C02 Emissions Reduction tons/yr
Average Cost Effectiveness $/ton
Page 8 of20
$167,000,000
$62,500,000
$100,000,000
$20.500.000
$350,000,000
$6,000,000 $0.07/kw and 75% efficiency
$9,200,000 4% of installation costs
$5,000,000
$14,000,000
-$3,843,729 ( 107,879 tons/yr X $35.63/ton)
$30,356,271
107,879
-96,012
11,867
$2,558

Occidental Chemical Corporation October 20 13
Emissions Assuming Natural Gas Fired Boilers for new Amine Regenerator
Assume maximum firing for maximum C02 capture
Max C02 emissions from Thermal Oxidizers (100"/o load)
C02 Capture (assuming 100% recovery)- 2 Thermal Oxidizers
Total C02 capture
12,315 lb/hr per the mal oxidizer
107,879 ton/year
24,630 lb/hr
Use gas processing data on amine absorber-strippers from Campbell Gas Processing Books
From J.M. Campbell & Co Gas Processing Handbook (Table 4.10))
Energy Required per lb of C02 for Regeneration
Solvent SG
Factor per lb Solvent
Solvent Concentration (Aqueous DEA)
Factor per lb of DEA
Moles C02/Mole DEA
Energy Required per lb of C02 absorbed
Additional Steam Energy Required for Amine Regenerator
Boiler Efficiency
Fuel Required
C02 Factor
C02 Produced
C02 Produced from boilers for regenerator
72000 Btu/hr per gpm of DEA
1.1
130.8 Btu/lb of solvent
25%
523 Btu/lb of DEA
0.2
6242.9 Btu/lb C02
153.8 MMBtu/hr
0.82
187.5 MMBtu/hr
116.9 lb/Mmbtu/hr
21,921 lb/hr
96,012 ton/year
The use of thermal oxidizers with waste heat recovery is estimated to require an additional investment of $5,500,000 and will save approximately $800,000 annually in fuel costs, while reducing GHG emissions by 18,200 tons/yr. The investment cost is about $300 per annual ton of GHG. While these costs are considered excessive for GHG emission controls, when combined with the reduced energy costs, this option is considered BACT for this project and is included in the proposed design.
Combustor design, oxidizer air/fuel with temperature control, stack gas oxygen monitors and flame monitoring are considered good engineering practice and have been included with the proposed design. Evaluating their effectiveness and a subsequent evaluation of each technology was not considered necessary for this BACT determination.
5) The selection of BACT. High oxidizer design efficiency, oxidizer air/fuel control and flame monitoring are all currently practiced on other thermal oxidizers operating on the site to maximize efficiency and are considered BACT for this application. The firebox temperature will be monitored and maintained at a temperature of l ,300 °F or more to assure complete combustion and improve energy recovery.
Page 9 of20

Occidental Chemical Corporation October 20 13
An oxygen analyzer in each stack will be provided to assure there is sufficient air. Vent gas feed, supplemental natural gas fuel and combustion air flow will be metered into each thermal oxidizer. The firebox will be lined with refractory to minimize heat losses to the atmosphere.
It is proposed that waste heat recovery in the form of steam generation also be included due to the energy savings and the reduction in GHG emissions.
EPN CR-8; CR High Pressure Flare
l) The identification of available control technologies. The high pressure flare is used to safely dispose of large volumes of non-condensable flammable hydrocarbon vapor streams during start-up and shutdown, emergency conditions and decommissioning of large volumes of hydrocarbons for maintenance. Under normal operation, the only GHG emissions associated with the flare are from the natural gas pilot burners.
The only viable control technologies for reducing GHG emissions from the flare are minimizing the size and number of the pilots. Potential GHG emission control technologies for the emergency flare are identified as follows:
a) Pilot reliability and sizing- The use of energy efficient pilots to minimize natural gas consumption.
b) Pilot flame monitoring and periodic cleaning- Monitoring of the pilots with temperature monitors and periodically cleaning of burner to assure proper combustion and efficiency.
2) The elimination of the technically infeasible alternatives. All options identified above are considered technically feasible.
3) The ranking of the remaining control technologies. Modern high efficiency pilots can reduce natural gas consumption by about 30% over larger traditional pilots. This approach will reduce GHG emissions by about 253 tons/yr. This option is considered the most effective technology.
Pilot flame monitoring is considered good engineering practice and has been included with the proposed design.
4) The evaluation of the most effective controls regarding cost-effectiveness, energy impacts and environmental effects. High efficiency pilots reduce natural gas consumption as well as GHG emissions and do not cost more than larger traditional pilots. Therefore, they are included in the proposed design. Pilot flame monitoring is considered good engineering
Page 10 of20

Occidental Chemical Corporation October 2013
practice for safety as well as environmental compliance and has been included with the proposed design.
5) The selection of BACT. The use of high efficiency pilots with pilot flame monitoring will be included for safety and performance. Total pilot duty for all stages will be minimized.
Each pilot will be monitored with a thermocouple. Both electronic and flame front generator systems will be provided for lighting the pilots.
EPN CR-8-MSS; CR High Pressure Flare - MSS Activities
I) The identification of available control technologies. The high pressure flare is used to safely dispose of large volumes of non-condensable flammable hydrocarbon vapor streams during start-up and shutdown, emergency conditions and decommissioning of equipment for maintenance.
Potential GHG emission control technologies for the emergency flare are identified as follows:
a) Staged flare design- the installation of a staged flare design with good combustion practices to minimize assist gas during low load operation will reduce GHG emissions from the flare when in operation.
b) Low carbon assist gas- The use of a low carbon fuel for assist gas will reduce GHG emissions from the flare when assist gas is required at low loads.
c) Waste heat recovery- Use of thermal oxidizers with waste heat recovery from the oxidizer exhaust to preheat the combustion air or produce steam for use at the site, thereby offsetting GHG emissions from other fuel combustion sources.
d) Combustion C02 capture and storage -Capture, compression, transport and geological storage or use of C02 in the thermal oxidizer flue gas exhaust.
2) The elimination of the technically infeasible alternatives. Thermal oxidizers with waste heat recovery and C02 capture and storage would require an enclosed combustion system. This is not technically feasible for safety reasons due to the potential for instantaneous high flow from the emergency relief system. Staged flare design and flare gas feed controls are technically feasible.
3) The ranking of the remaining control technologies. A staged flare design minimizes the use of supplemental assist gas required for complete combustion over a large operating range for the flare. The use of a low carbon assist gas such as natural gas will further reduce the GHG
Page II of20

Occidental Chemical Corporation October 20 13
emissions when assist gas is required at very low loads. This approach is considered the next most effective technology for GHG emission control for this application.
4) The evaluation of the most effective controls regarding cost-effectiveness, energy impacts and environmental effects. In addition to the reduction in GHG emissions, a staged flare with good combustion practices provides the most reliable and effective control of VOC emissions with the least amount of supplemental assist fuel, which also minimizes cost. Natural gas is also considered the most reliable and economical assist gas. Both of these options have been included in the proposed design.
5) The selection of BACT. The use of a staged flare with a high turndown, along with good combustion practices, and the use of low carbon natural gas as an assist gas are considered BACT for this application.
EPN's CR-9; CR Emergency Generator Diesel Engine
l) The identification of available control technologies. The diesel-fired emergency generator engine is included in this application for the Ethylene Plant because of GHG emissions that occur during the scheduled testing of the engine. Use of this engine for emergency conditions will not be authorized by this permit since these emergency events are not subject to permitting requirements.
A natural gas-fired and electrically driven engine is also a possibility to consider; however, its availability during emergency events is not as certain as a diesel-fired engine, and so, it is not considered as practical technology for this service.
Potential GHG emission control technologies for this engine are identified as follows:
a) EPA Tier 2 level of emission limitations for combustion products.
b) Change oil and filter every 500 hours of operation or annually, whichever comes first.
c) Inspect air cleaner every I ,000 hours of operation or annually, whichever comes first.
d) Inspect all hoses and belts every 500 hours of operation or annually, whichever comes first, and replace as necessary.
2) The elimination of the technically infeasible alternatives. All options identified above are considered technically feasible.
3) The ranking of the remaining control technologies. The ranking of the MACT, Subpart ZZZZ, Table 2d requirements for emergency diesel engines mentioned above are difficult to
Page 12 of20

Occidental Chemical Corporation October 20 13
determine relative to effectiveness of emissions control, but all are expected to be relevant for maintaining clean operations.
4) The evaluation of the most effective controls regarding cost-effectiveness, energy impacts and environmental effects. Again, the effectiveness of controls, energy impacts, and environmental effects for a diesel engine that is operated only a few hours a year is difficult to ascertain.
5) The selection of BACT. Due to the negligible amount of costs associated with the control techniques mentioned above and the positive effect of their implementation, all of the proposed efforts are considered as appropriate measures of BACT and will be utilized.
EPN CR-11; CR Cooling Tower
I) The identification of available control technologies. The cooling requirements for the Ethylene Plant are generally provided by evaporative cooling systems, but can also be provided by once through sea water cooling or air cooling. The make-up water can also be pre-treated for removal of the bicarbonates.
Potential GHG emission control technologies for the cooling system are identified as follows:
a) Low cycles of concentration- The tower could be operated at sufficiently low cycles of concentration so as to not require any acid addition.
b) Acid and blowdown control- Monitoring of circulating water pH and conductivity to control the acid addition and blowdown to control water chemistry.
c) Pretreatment of make-up water- Use a reverse osmosis system to remove bicarbonates in the make-up water.
d) Once through seawater cooling- Use of once through seawater for process cooling rather than an evaporative cooling system.
e) Air cooling- Use of air coolers rather than an evaporative cooling water system for process cooling.
2) The elimination of the technically infeasible alternatives. All options identified above are considered technically feasible.
3) The ranking of the remaining control technologies. The use of once through seawater cooling would eliminate the 668 tons per year of C02 emissions from the cooling tower with
Page 13 of20
Occidental Chemical Corporation October 20 13
minimal increase in power or thermal combustion related GHG emissions. This approach is considered the most effective control for GHG emissions.
The use of air cooling would also eliminate the 668 tons per year of C02 emissions from the cooling tower; however, it would significantly increase the power and thermal energy requirements for the Ethylene Plant. These greater power and energy requirements are due to higher operating temperature and pressure in the refrigeration and distillation column condensers. This approach would result in increased GHG emissions from the cogeneration facilities; however, this approach is considered the next most effective control for GHG emissions from the plant's cooling system.
Pretreatment of the make-up water in a reverse osmosis system could remove most of the bicarbonates from the cooling tower make-up and potentially eliminate the C02 emissions from the cooling tower. This pretreatment would result in increased GHG emissions from the cogeneration facilities for the additional power requirements for the reverse osmosis systems, which require high water pressure to operate effectively.
Operation of the cooling tower with a very heavy wastewater blowdown to reduce the bicarbonate concentration could reduce the C02 emissions by 80-90%. There is still some dissolved C02 in the make-up water that would be stripped out even if no acid were added. This approach is considered the next most effective control technology.
The effect on GHG emissions of using pH and specific conductivity monitoring to control the acid injection and blowdown is difficult to assess, but it is considered the least effective means of control.
4) The evaluation of the most effective controls regarding cost-effectiveness, energy impacts and environmental effects. The use of once through seawater cooling might be considered detrimental to fish and wildlife. Also, the use of seawater can lead to increased fouling of heat exchangers. Therefore, due to the minimal reduction in GHG emissions, this technology is not chosen as a control option for GHG emissions on the basis of these negative consequences .
The use of air cooling would eliminate the cooling tower GHG emissions, but increase emissions from the cogeneration facilities. It is difficult to assess, but air cooling for these facilities would generally be expected to increase energy consumption by 5-10%. This approach would represent 8,000 to 16,000 tons per year of increased GHG emissions from the cogeneration facilities. The increased emissions would certainly be significantly more than the 688 tons per year that would be eliminated from the cooling tower. Therefore, air cooling is rejected on the basis of overall energy consumption and the overall increase in GHG emissions.
Page 14 of20
Occidental Chemical Corporation October 20 13
Pretreatment of the make-up water in a reverse osmosis system would require increasing the water pressure by several hundred psig. The additional power requirements would add about 4 MM Btu/hr of natural gas firing at the cogeneration facilities, increasing the GHG emissions by 2,048 tons per year. These GHG emissions more than off-sets the elimination of the 668 tons per year of GHG emissions from the cooling tower. Therefore, pretreatment of the make-up water by reverse osmosis is rejected due to the overall increase in GHG emissions.
The blowdown rate from the cooling tower would need to be increased from 300 gallons per minute to at least 800 - 1200 gallons per minute to prevent scaling in the cooling water system without any acid addition. There is no other use for this water and it would have to be discharged as wastewater. This approach is considered extremely wasteful of fresh water, especially considering the minimal reduction in GHG emissions that would be realized, and therefore, this approach is rejected as a reasonable control option.
The use of pH and specific conductance monitoring of the cooling tower water to control acid addition and blowdown rate would be cost prohibitive for GHG emission control due to the minor reduction in GHG emissions. However, if pH and conductivity monitors are implemented to control scaling or corrosion, it will also result in some improved control of GHG emissions by maintaining consistent alkalinity in the cooling tower water. It is proposed that continuous pH and conductivity monitors be included on the cooling tower water.
5) The selection of BACT. Due to the negligible amount of GHG emissions, none of the available control technologies are considered cost effective. However, OxyChem intends to install pH and conductivity analyzers on the cooling water supply to control acid addition and blowdown. Laboratory instruments will be used to periodically check the accuracy of these devices and provide information when the on-line analyzers are out of service for an extended period of time due to maintenance. This approach will minimize the GHG emissions associated with the cooling tower and satisfy GHG BACT requirements.
EPN CR-12; C3/C4 Hydrogenation Reactor Regeneration Vent- MSS Activities
The unsaturated C3's and C4's are hydrogenated to propane and butane over a fixed bed catalyst in the C3/C4 Hydrogenation Reactor. Over time, carbon will deposit over the catalyst surface. Periodically the carbon deposits must be removed to maintain catalyst activity and reactor conversion. This is accomplished with the introduction of high temperature steam and air to convert the carbon deposits to gaseous carbon dioxide. The exhaust gas is discharged to the atmosphere during this operation. Eventually the catalyst can no longer be successfully regenerated and must be replaced.
Page 15 of20
Occidental Chemical Corporation October 20 13
1) The identification of available control technologies. Potential GHG emission control technologies for the C3/C4 Hydrogenation Reactor Regeneration Vent were identified as the follows:
a) Catalyst disposal- Dispose of catalyst and replace with new catalyst instead of regenerating the catalyst.
b) Reduced air- Limit the air feed to reduce carbon dioxide formation.
c) Low coking design and operation- Proper reactor design and operation will tend to reduce coke formation and minimize carbon dioxide formation.
2) The elimination of the technically infeasible alternatives. All of the identified alternatives are technically feasible.
3) The ranking of the remaining control technologies. Disposing of the catalyst by landfill would eliminate this GHG emission source ( 13 tons per year). This is the most effective control technology for GHG emissions from this source. Reducing the air would result in some of the carbon being converted to carbon monoxide instead of carbon dioxide. It is estimated that potentially as much as 50% of the carbon could be converted to carbon monoxide instead of carbon dioxide which would reduce carbon dioxide emissions by 6.5 tons per year. Low coking design and operation is difficult to quantify, but is considered the least effective means of control. Assuming run life is extended by 25%, the reduction in carbon dioxide emissions is equivalent to about 3 tons per year.
4) The evaluation of the most effective controls regarding cost-effectiveness, energy impacts and environmental effects. Disposing of the catalyst instead of regeneration would generate additional solid waste and represent a significant cost burden for replacement catalyst. Although the catalyst production methods are not known by OxyChem, it is believed that the additional GHG emissions from the production of the new catalyst would likely exceed those of regeneration, so this technology is not expected to be beneficial from a GHG perspective. Consequently, catalyst disposal is rejected as a control technology.
Limiting the air feed would increase carbon monoxide while reducing carbon dioxide. Carbon monoxide is a criteria pollutant with higher toxicity than GHG, so this alternative is rejected as a control option for GHG emissions.
Minimizing coke formation through the proper reactor design and operation will increase reactor run time between regeneration, thereby reducing operating costs. These design features are included in the proposed design.
Page 16 of20

Occidental Chemical Corporation October 20 13
5) The selection of BACT. A proper reactor design with good operating practices will minimize coke formation and is considered BACT for this application. The reactor will be fed a C3/C4 distillate and a purified hydrogen stream to minimize contaminants and catalyst fouling. The reactor will be loaded with hydrogenation catalyst per catalyst supplier recommendations. Reactor temperatures, pressures and hydrogen concentrations will be maintained within recommended levels.
EPN's CR-13, 14, 17 and 16; Ethylene Plant Fugitive Emissions
I) The identification of available control technologies. Fugitive leakage from process equipment piping components associated with the proposed project includes methane and C02. The controlled emissions associated with these components have been estimated to be less than a tonlyr of both methane and C02.
Potential GHG emission control technologies for the fugitive emissions are identified as follows :
a) Barrier sealing systems for pumps and compressors.
b) Installing rupture discs beneath pressure relieving devices discharging to the atmosphere.
c) Use of bellows sealed valves to eliminate valve stem packing leaks .
d) Administration of a leak detection and repair (LDAR) program for fugitive emissions.
2) The elimination of the technically infeasible alternatives. All options identified above are considered technically feasible.
3) The ranking of the remaining control technologies. The use of barrier sealing systems for pumps and compressors, rupture discs for relief devices and bellows sealed valves address separate sources. Each technology is capable of l 00% control for each source and each technology is considered the most effective control technology.
LDAR programs are typically used to control VOC emissions and can achieve up to 97% control of VOC emissions . Although not specifically designed for GHG emissions, they can be used to control GHG since VOC is generally present in the same components that would be included in an LDAR program for VOC. It is assumed that the same control factors can be applied to GHG emissions. This approach is considered the least effective control technology.
4) The evaluation of the most effective controls regarding cost-effectiveness, energy impacts
Page 17 of20

Occidental Chemical Corporation October 20 13
and environmental effects. Valves make up one of the largest sources of fugitive emissions and the use of bellows sealed valves can eliminate GHG emissions from the valve stems. These valves are generally only available on rising stem valves such as gate and globe valves. They are also commonly only available in the smaller sizes, and significantly more expensive. Consequently, their overall effectiveness is limited. The marginal additional level of control that is achieved over an LDAR program is minimal and not considered cost effective for VOC or GHG control.
The installation of rupture discs beneath relief valves, and barrier seals for pumps and compressors to control a negligible amount of GHG fugitive emissions that occur from these sources is considered cost prohibitive. However, if these controls are being implemented for VOC emission control purposes, they will also result in effective control of the small amount of GHG emissions associated with these fugitive emission sources.
The use of an LDAR program to control a negligible amount of GHG emissions that occur as process fugitives is also considered cost prohibitive. However, again, if an LDAR program is being implemented for VOC emission control purposes, it will also result in an effective control of the small amount of GHG emissions associated with the same piping components.
The TCEQ's most aggressive BACT-styled fugitive monitoring and maintenance program, 28MID with quarterly monitoring of flanges, is currently considered BACT for controlling fugitive VOC emissions at the existing site. It is more aggressive than the 28LAER program due to the quarterly flange monitoring. As part of this 28MID approach all pumps and compressor seals in light liquid service are vented to control or are designed with non-leaker technology. It has been proposed that this program be expanded to control VOC emissions from the new Ethylene Plant.
5) The selection of BACT. Due to the negligible amount of fugitive GHG emissions, none of the available control technologies are considered cost effective. However, OxyChem will install barrier seal systems on pumps and compressors in VOC services, and where technically feasible, will install rupture discs beneath relief valves in VOC service that discharge to the atmosphere. OxyChem will also implement a TCEQ-styled 28MID LDAR program for VOC control purposes. This program will satisfy GHG BACT requirements.
EPN CR-19 Hydrogen Vent
1) The identification of available control technologies. Potential GHG emission control technologies for the hydrogen vent were identified as the follows:
a. Vent hydrogen to the atmosphere- Hydrogen can be vented to the atmosphere at a safe
location to remove excess fuel from the fuel gas system.
Page 18 of20

Occidental Chemical Corporation October 20 13
b. Hydrogen venting to the Thermal Oxidizers- The hydrogen vent can be routed to the
thermal oxidizers to combust the stream and generate steam from the heat of combustion .
c. Reduce heater firing efficiency- Furnace firing efficiency can be reduced by adding
excess air to the furnaces which causes an increase in fuel consumption per unit of
production .
d. Hydrogen venting to the flares- The hydrogen vent can be routed to the flare systems to
combust the stream.
2) The elimination of the technically infeasible alternatives . Reducing heater firing efficiency is not technically feasible and has been eliminated as an alternative. Reducing the firing efficiency of the heaters would require changes to the heater design. These design changes would affect the firing efficiency of the heater for 100% of the operating time while the need to burn additional fuel is only needed for an estimated 60 days per year. The remaining alternatives are considered to be technically feasible.
3) The ranking of the remaining control technologies . Venting the hydrogen to the atmosphere
accomplishes the objective of removing fuel from the fuel gas system with low impact to the
operating equipment and environment. This option has the lowest impact to the environment
relative to criteria pollutants with minimal increase in GHG emissions relative to the project
total emissions. This option would be the most effective option of removing fuel from the
fuel gas system.
Venting hydrogen to the thermal oxidizers accomplishes the objective of removing fuel from
the fuel gas system and generates steam from the heat of combustion. This option would
increase C02 and NOx emissions from the thermal oxidizers. This option would be the
second most effective option as it would make use of the heat energy; however, NOx
emissions would be increased.
Hydrogen venting to the flare systems would be the least effective method of removing fuel
from the fuel gas system. The hydrogen would be combusted with no heat recovery and
emissions of C02 and NOx would increase.
Page 19 of20

Occidental Chemical Corporation October 20 13
4) The evaluation of the most effective controls regarding cost-effectiveness, energy impacts
and environmental effects. Venting hydrogen to the atmosphere will emit 1.44 tons/yr of
methane which is a Green House Gas and zero NOx. This option will have the lowest
environmental impact, however, it does not allow for cost savings from energy recovery.
Venting hydrogen to the thermal oxidizers will increase emissions of C02 by 4.53 tons/yr and
NOx by 4.33 tons/yr. This option does allow for energy recovery in the form of steam
production which would provide some economic return. Venting fuel gas to the flare system
would increase C02 emissions by 4.53 tons/yr and NOX emissions by 9.95 tons/yr. There is
no economic or energy advantage to this option.
5) The selection of BACT. Venting hydrogen to the atmosphere creates the lowest
environmental impact and is considered BACT for this application. The amount of fuel gas
generated by the process is based on engineering evaluation of the proposed plant design, and
the calculated fuel gas balance for this unit is very close to being in balance with no excess
fuel gas . With the potential that there will be excess fuel gas generation, the design must
anticipate this possibility and provide a means of handing the excess.
Page 20 of 20