the u.s. nursing workforce: trends in supply and … u.s. nursing workforce: trends in supply and...
TRANSCRIPT

Health Resources and Services AdministrationBureau of Health ProfessionsNational Center for Health Workforce Analysis
The U.S. Nursing Workforce: Trends in Supply and Education October 2013

The U.S. Nursing Workforce: Trends in Supply and Educationii

The U.S. Nursing Workforce: Trends in Supply and Education iii
The Health Resources and Services Administration (HRSA),
U.S. Department of Health and Human Services (HHS),
provides national leadership in the development, distribution,
and retention of a diverse, culturally competent health
workforce that can adapt to the population’s changing
health care needs and provide the highest quality care for all.
The agency, through the Bureau of Health Professions,
administers a wide range of training grants, scholarships,
loans, and loan repayment programs that serve as a catalyst to
advance changes in health professions training that respond
to the evolving needs of the health care system.
The National Center for Health Workforce Analysis (the National
Center) informs public and private-sector decision-making
related to the health workforce by expanding and improving
health workforce data, disseminating workforce data to the
public, improving and updating projections of the supply and
demand for health workers, and conducting analyses of issues
important to the health workforce.
For more information about the National Center, e-mail us
at [email protected], or visit our website at
http://bhpr.hrsa.gov/healthworkforce/index.html.

The U.S. Nursing Workforce: Trends in Supply and Educationiv

The U.S. Nursing Workforce: Trends in Supply and Education v
ContentsEXECUTIVE SUMMARY
. . . . . . . . . . . . . . . . . . . . . . . . . . .
. . . . . . . . . . . . .
. . . . . . . . . . . . . . . . . . . . . .
. . . . . . . . . . . . . . . . . . . . . . . . . .
. . . . . . . . . . .
. . . . . . . . . . . . . .
. . . . . . . . . . . . . . . . .
. . . . . . . . . . . . . .
. . . . . . . . . . . . . . . .
. . . . . . . . . . . .
. . . . . . . . . . . .
. . . . . . . . . . . . . . . . . . . . .
. . . . . . .
. . . . . . . .
. . . . . . .
. . . .
. . . . . . . . .
. . . . . . .
. . . .
. . . . . . . . . . . . . . . . . . .
. . . . . . . . . . . . . . . . . . .
. . . . . . . . . . . . . . . . . . . . . .
vii
INTRODUCTION 1
SECTION 1 The Registered Nurse and Licensed Practical Nurse Workforce 3
Workforce Size and Distribution 5
Trends in the Nursing Workforce During the Past Decade 18
SECTION 2 Nursing Pipeline and Nursing Education Capacity 35
New Entrants to the Nursing Profession 35
Post-Licensure Nurse Education 46
The U.S. Nursing Pipeline and Internationally Educated Nurses 52
FiguresFigure 1. The RN Workforce per 100,000 Population, by State 10
Figure 2. The per Capita RN Workforce, Ranked by State 11
Figure 3. The LPN Workforce per 100,000 Population, by State 12
Figure 4. The per Capita LPN Workforce, Ranked by State 13
Figure 5. Nurse Workforce Distribution in Rural and Urban Areas 14
Figure 6. Nurses per 100,000 Residents in Rural and Urban Areas 14
Figure 7. Growth in the U.S. Nursing Workforce 19
Figure 8. Highest Degree Held by RNs, Census 2000 and ACS 2008 to 2010 21
Figure 9. The Changing Age Distribution of RNs, in Five-Year Increments 22
Figure 10. Counts of RNs in the Workforce, by Age, in Five-Year Increments 23
Figure 11. Race/Ethnicity in the RN Workforce and Total Working-Age Population 24
Figure 12. Changing Age Distribution of LPNs, in Five-Year Increments 25
Figure 13. Counts of LPNs in the Workforce, by Age, in Five-Year Increments 26
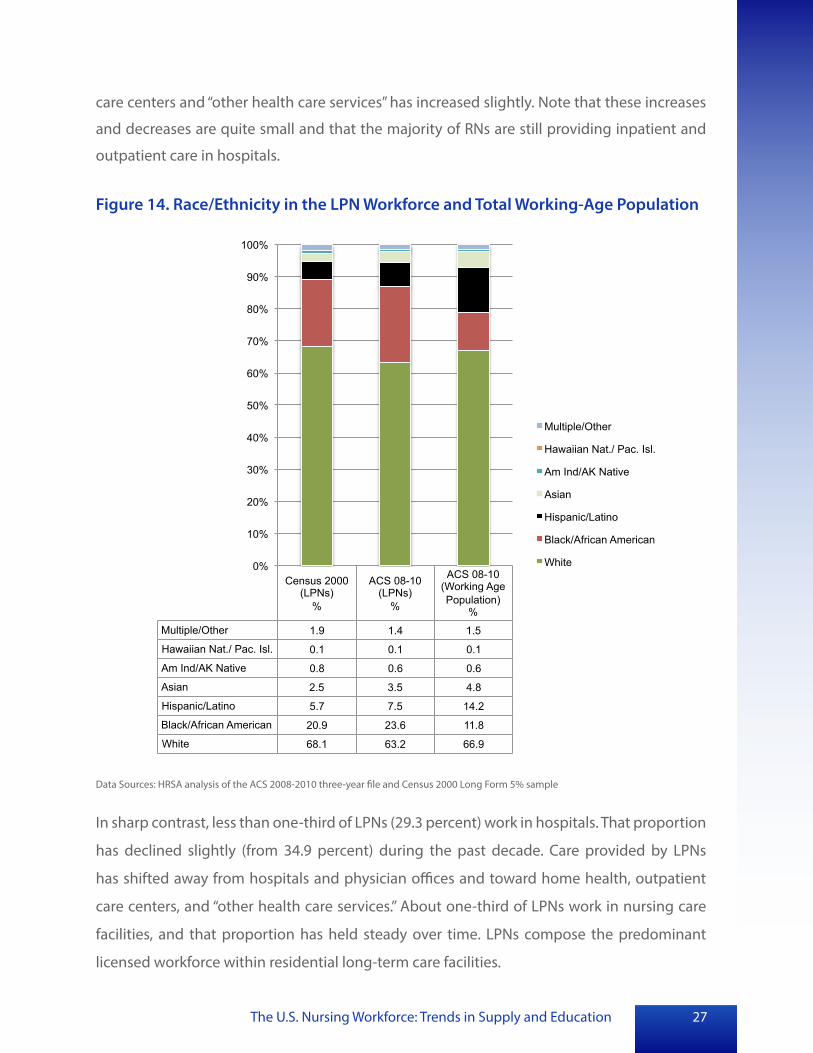
Figure 14. Race/Ethnicity in the LPN Workforce and Total Working-Age Population 27
Figure 15. Average Hours Worked by RNs, by Age 32
Figure 16. Average Hours Worked by LPNs, by Age 32
Figure 17. Growth in Full-Time Nurse Salaries 33

The U.S. Nursing Workforce: Trends in Supply and Educationvi
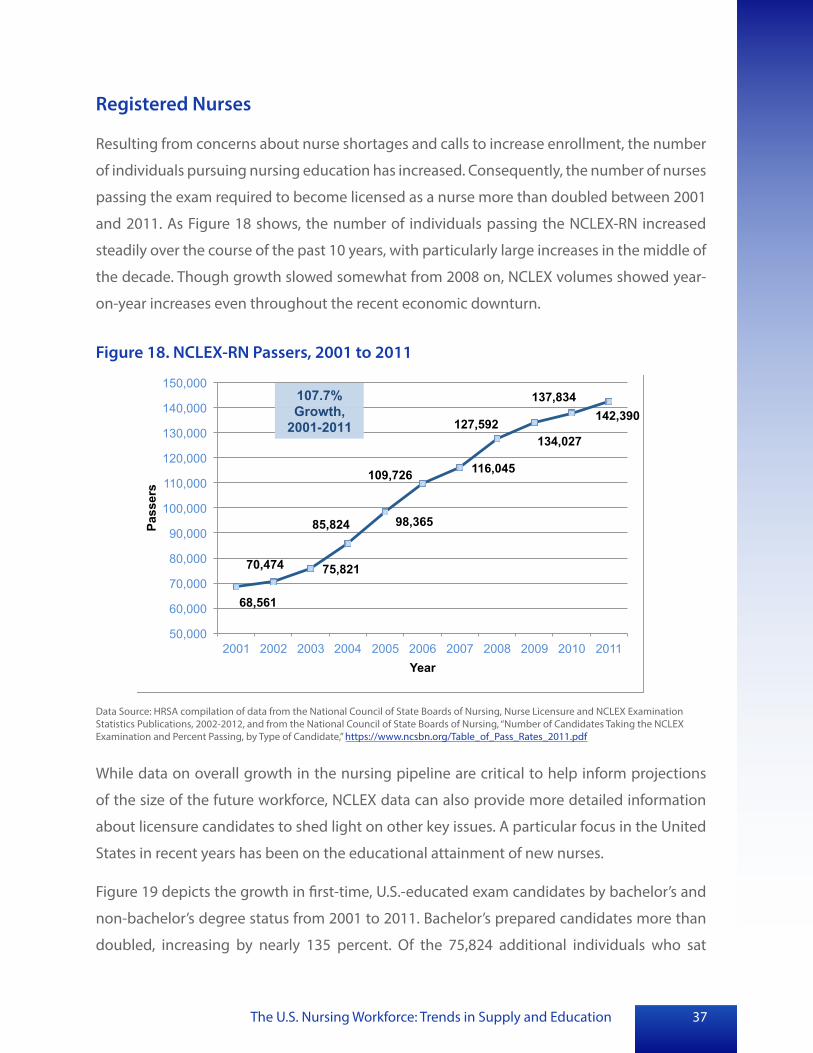
Figure 18. NCLEX-RN Passers, 2001 to 2011 . . . . . . . . . . . . . . . . . . . . . . .
. . . . . . . . . . . . . . . . . .
. . . . . . . . . . .
. . . . . . . . . . . . . . .
37
Figure 19. Growth in NCLEX-RN First-Time Test Takers, by Bachelor’s
and Non-Bachelor’s Degree Status, 2001 to 2011 38
Figure 20. Total Number and Percentage of NCLEX-RN First-Time Test Takers,
by Bachelor’s and Non-Bachelor’s Degree Status, 2001 vs. 2011 39
Figure 21. NCLEX-RN First-Time Test Takers per Capita, 2010 42
Figure 22. NCLEX-PN Passers, 2001 to 2011 . . . . . . . . . . . . . . . . . . . . . . .
. . . . . . . . . . . . . . .
43
Figure 23. NCLEX-PN First-Time Test Takers per Capita, 2010 46
Figure 24. Licensed RNs Graduating With BSN Qualification, 2007 to 2011 . . . . . . . .
. . . . . . . . . . . . . . . .
. . . . . . . . . . . . . . . . .
. . . . . . . . . . . . . . . . . .
48
Figure 25. Master’s and Doctoral Graduates, 2007 to 2011 49
Figure 26. Nurse Practitioner Graduates, 2001 to 2011 50
Figure 27. Nurse Anesthetist Graduates, 2001 to 2011 51
Figure 28. Newly Certified Nurse Midwives, 2001 to 2011 . . . . . . . . . . . . . . . .
. . . . .
. . .
. . . . .
. . .
52
Figure 29. Internationally Educated Nurses Passing the NCLEX-RN, 2001 to 2011 54
Figure 30. Internationally Educated Nurses Passing the NCLEX-RN, by Country, 2010 55
Figure 31. Internationally Educated Nurses Passing the NCLEX-PN, 2001 to 2011 56
Figure 32. Internationally Educated Nurses Passing the NCLEX-PN, by Country, 2010 56
TablesTable 1. The RN Workforce, by State, per 100,000 Population . . . . . . . . . . . . . . .
. . . . . . . . . . . . . . .
. . .
. .
. . . . . . . . . . . . . . .
5
Table 2. The LPN Workforce, by State, per 100,000 Population 7
Table 3. Residential Distribution of the RN Workforce Across Urban and Rural Areas 15
Table 4. Residential Distribution of the LPN Workforce Across Urban and Rural Areas 17
Table 5. Growth in the per Capita Supply of RNs and LPNs 19
Table 6. Setting of Employment for Nurses, Census 2000 and ACS 2008 to 2010 . . . . .
. . . . . . . . . . . . .
. . . . . . . . . . . . .
28
Table 7. Estimated Number of RNs, by Setting of Employment 30
Table 8. Estimated Number of LPNs, by Setting of Employment 31
Table 9. NCLEX-RN First-Time Test Takers, by State and Degree Type, 2010 . . . . . . . .
. . . . . . . . . . . . . . . .
40
Table 10. NCLEX-PN First-Time Test Takers, by State, 2010 44

The U.S. Nursing Workforce: Trends in Supply and Education vii
•
•
•
•
•
Executive Summary Understanding the supply and distribution of nurses is key to ensuring access to care and
an effective health care system. This report presents data on the supply, distribution, and
education/pipeline of the U.S. nursing workforce. The data come from a variety of sources
and present recent trends and the current status of the registered nurse (RN) and licensed
practical/vocational (LPN) workforces. The report is intended to be used by national and state
workforce planners, as well as educators, researchers, and policy makers.
The Current Supply of Nurses and Trends Over Time1
There were 2.8 million RNs (including advanced practice RNs) and 690,000 LPNs in
the nursing workforce—that is, working in the field of nursing or seeking nursing
employment in 2008 to 2010. About 445,000 RNs and 166,000 LPNs lived in rural areas
(about 16 percent of the RN workforce and 24 percent of the LPN workforce).
The nursing workforce grew substantially in the 2000s, with RNs growing by more than
500,000 (24.1 percent) and LPNs by more than 90,000 (15.5 percent).
Growth in the nursing workforce outpaced growth in the U.S. population. The number of
RNs per 100,000 population (per capita) increased by about 14 percent, and the number
of LPNs per capita increased by about 6 percent.
Owing to strong growth in new entrants, the absolute number of RNs younger than 30
has increased. Nevertheless, about one-third of the nursing workforce is older than 50.
The average age of nurses has increased over the past decade, by almost two years for
RNs and 1.75 years for LPNs, reflecting aging within the very large cohort of nurses aged
41 to 50 in 2000.
Currently, about 55 percent of the RN workforce holds a bachelor’s or higher degree.
An associate’s degree in nursing was the first nursing degree for many of these nurses.
RNs are more likely to hold bachelor’s or graduate degrees today than was true in 2000,
but only by 5 percentage points.
1Information on the nurse supply is based on data collected by the U.S. Census Bureau: the combined American Community Survey 2008 to 2010 and the Census 2000 Long Form. The sources cover a time period of approximately one decade.

The U.S. Nursing Workforce: Trends in Supply and Educationviii
•
•
•
•
•
The RN and LPN workforces are slowly becoming more diverse over time. The proportion
of non-white RNs and LPNs increased by about 5 percentage points during the past
decade. The proportion of men in the RN workforce increased by about a percentage
point and is currently 9 percent.
The majority of RNs (63.2 percent) are providing inpatient and outpatient care in
hospitals. The distribution of RNs across settings held relatively steady over the past
decade. However, while the proportion of RNs in hospitals held steady, the number of
RNs working in hospitals increased by more than 350,000 (about 25 percent). In contrast
to RNs, less than one-third of LPNs (29.3 percent) work in hospitals, and that proportion
has declined slightly over the past decade.
The RN and LPN Pipeline2
The nursing pipeline, measured by the annual number of individuals who pass national
nurse licensing exams, grew substantially from 2001 to 2011, with RN test passers
growing 108 percent and LPN passers growing 80 percent. In 2011, more than 142,000
new graduate RNs passed the NCLEX-RN®. This compares with 68,561 in 2001.
From 2001 to 2011, the number of bachelor’s prepared RN candidates taking the NCLEX
RN exam for the first time more than doubled, from 24,832 individuals in 2001 to 58,246
in 2011. Non-bachelor’s prepared RN candidates taking the NCLEX-RN exam for the first
time experienced a 96.5-percent growth, increasing from 43,927 in 2001 to 86,337 in
2011. Non-bachelor’s prepared RN candidates continue to constitute the majority of all
RN candidates (60 percent in 2011).
The number of internationally educated RNs passing the NCLEX fluctuated significantly
between 2001 and 2011. While not all enter the United States, passage of the NCLEX
is a prerequisite and sets the maximum number of internationally educated RNs that
can be licensed each year. From 2001 to 2007, the annual number of passers increased
steadily, from about 6,700 to nearly 23,000. Perhaps as a result of the growing number of
U.S. graduates and the recession, the annual number of internationally educated NCLEX
passers has dropped since 2007 and was only 6,100 in 2011.
2Information about new entrants to the field was obtained from the National Council of State Boards of Nursing, the organization administering the RN and LPN licensure exams.
The U.S. Nursing Workforce: Trends in Supply and Education ix
•
•
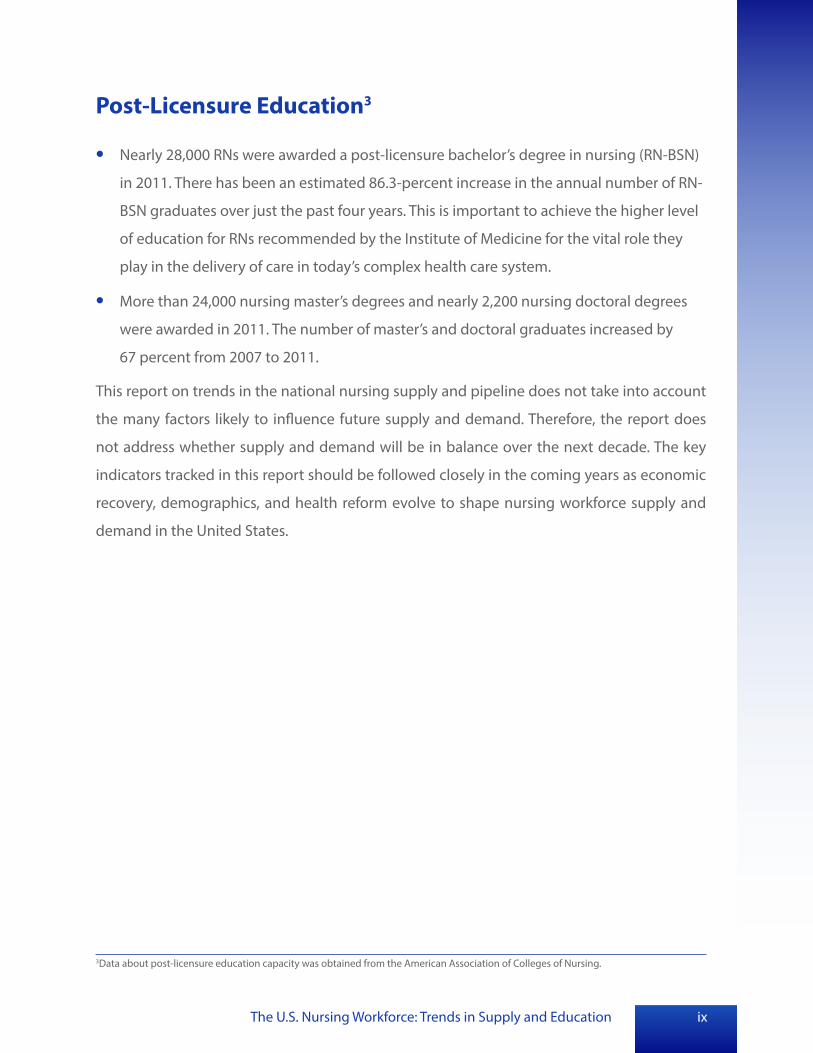
Post-Licensure Education3
Nearly 28,000 RNs were awarded a post-licensure bachelor’s degree in nursing (RN-BSN)
in 2011. There has been an estimated 86.3-percent increase in the annual number of RN
BSN graduates over just the past four years. This is important to achieve the higher level
of education for RNs recommended by the Institute of Medicine for the vital role they
play in the delivery of care in today’s complex health care system.
More than 24,000 nursing master’s degrees and nearly 2,200 nursing doctoral degrees
were awarded in 2011. The number of master’s and doctoral graduates increased by
67 percent from 2007 to 2011.
This report on trends in the national nursing supply and pipeline does not take into account
the many factors likely to influence future supply and demand. Therefore, the report does
not address whether supply and demand will be in balance over the next decade. The key
indicators tracked in this report should be followed closely in the coming years as economic
recovery, demographics, and health reform evolve to shape nursing workforce supply and
demand in the United States.
3Data about post-licensure education capacity was obtained from the American Association of Colleges of Nursing.

The U.S. Nursing Workforce: Trends in Supply and Educationx
The U.S. Nursing Workforce: Trends in Supply and Education 1
Introduction This report presents an overview of the trends in the supply and pipeline of nurses to assist
the work of national and state officials, policy makers, the nursing community, educators, and
researchers focused on the nursing workforce. Data and information are incorporated from
various sources covering both the registered nurse (RN) and licensed practical/vocational
nurse (LPN) workforces. The sources vary in the years of data available, but where possible,
trends over the past decade are analyzed.
Section 1, The Registered Nurse and Licensed Practical/Vocational Nurse Workforce, presents an
overview and analysis of recent trends in the nurse supply. This section includes estimates
of RNs and LPNs working in each state, rural/urban differences, and trends in educational
attainment, employment, and demographics of the nursing workforce such as age, race/
ethnicity and gender. Sources of data used for this section include the U.S. Census Bureau’s
American Community Survey 2008 to 2010 and the Census 2000 Long Form.
Section 2, Nursing Pipeline and Education Capacity, presents current information on the pipeline
for nursing (the production of new nurses) nationally and by state. Data are also presented
on the growth in newly licensed nurses, by degree type, the growth in internationally born/
educated nurses and trends in post-licensure education. The data used in this section were
obtained from the National Council of State Boards of Nursing and the American Association
of Colleges of Nursing.

The U.S. Nursing Workforce: Trends in Supply and Education2

The U.S. Nursing Workforce: Trends in Supply and Education 3
Section 1 The Registered Nurse and Licensed Practical Nurse Workforce
An analysis of recent trends in the nursing workforce is important to anticipate future
supply growth and identify likely changes in educational and demographic composition.
Information on the size of the U.S. nursing workforce and its distribution across states and
in rural and urban areas is presented. Growth in the workforce over time is measured against
growth in the general population. Next, key trends in educational attainment, racial/ethnic
composition, and gender are highlighted. The section concludes with an analysis of trends in
the setting and work hours of the nursing workforce.
Two sources of data from the U.S. Census Bureau were used to examine the current supply
of registered nurses (RNs) and licensed practical nurses (LPNs), as well as changes in the
workforce that have occurred during the past decade: the American Community Survey (ACS)
three-year combined file for 2008 to 2010 and the Census 2000 Long Form 5-percent sample.
(See “About the Data” below.)
Owing to the household sampling strategy of these Census surveys, all results presented
in this section are for the nursing workforce—those individuals who report their current
occupation as nursing and who currently have or are seeking a job. It is not possible to count,
with either data source, the number of individuals educated or licensed as nurses who are
working in another field or are out of the workforce entirely. Another important note is that
advanced practice registered nurses are included in results for RNs. The Census data sources
used here do not separate them.
The U.S. Nursing Workforce: Trends in Supply and Education4
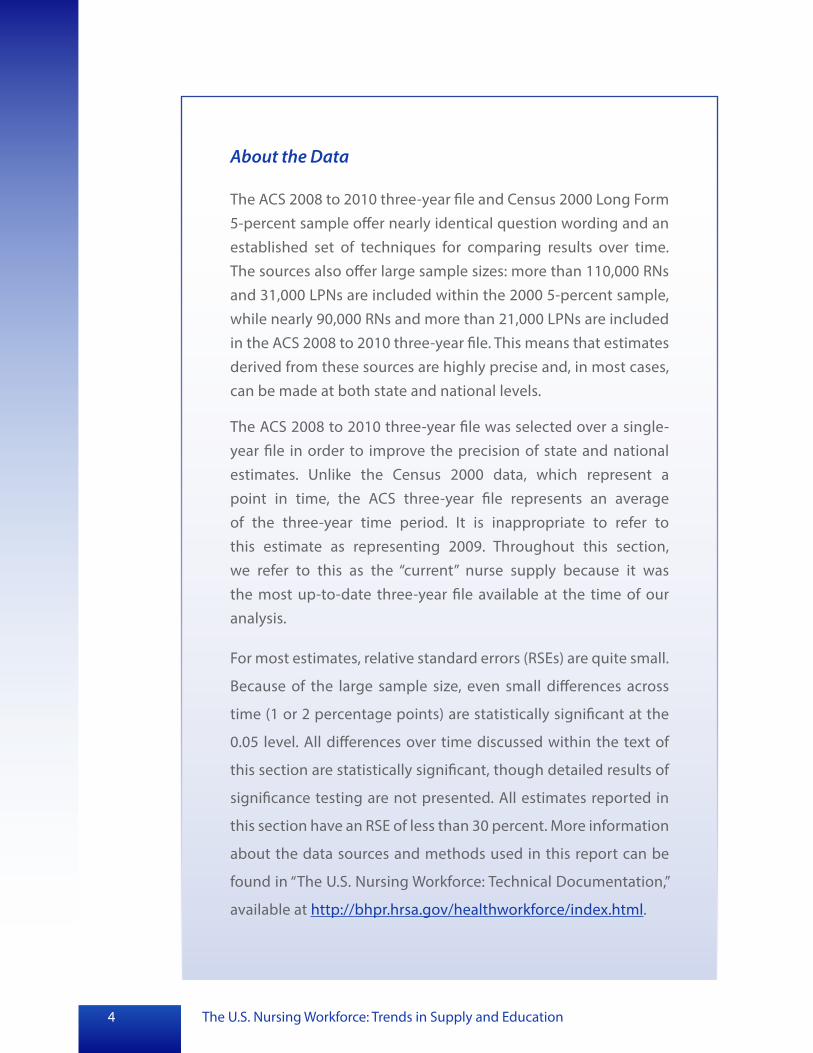
About the Data
The ACS 2008 to 2010 three-year file and Census 2000 Long Form 5-percent sample offer nearly identical question wording and an established set of techniques for comparing results over time. The sources also offer large sample sizes: more than 110,000 RNs and 31,000 LPNs are included within the 2000 5-percent sample, while nearly 90,000 RNs and more than 21,000 LPNs are included in the ACS 2008 to 2010 three-year file. This means that estimates derived from these sources are highly precise and, in most cases, can be made at both state and national levels.
The ACS 2008 to 2010 three-year file was selected over a single-year file in order to improve the precision of state and national estimates. Unlike the Census 2000 data, which represent a point in time, the ACS three-year file represents an average of the three-year time period. It is inappropriate to refer to this estimate as representing 2009. Throughout this section, we refer to this as the “current” nurse supply because it was the most up-to-date three-year file available at the time of our analysis.
For most estimates, relative standard errors (RSEs) are quite small.
Because of the large sample size, even small differences across
time (1 or 2 percentage points) are statistically significant at the
0.05 level. All differences over time discussed within the text of
this section are statistically significant, though detailed results of
significance testing are not presented. All estimates reported in
this section have an RSE of less than 30 percent. More information
about the data sources and methods used in this report can be
found in “The U.S. Nursing Workforce: Technical Documentation,”
available at http://bhpr.hrsa.gov/healthworkforce/index.html.
The U.S. Nursing Workforce: Trends in Supply and Education 5
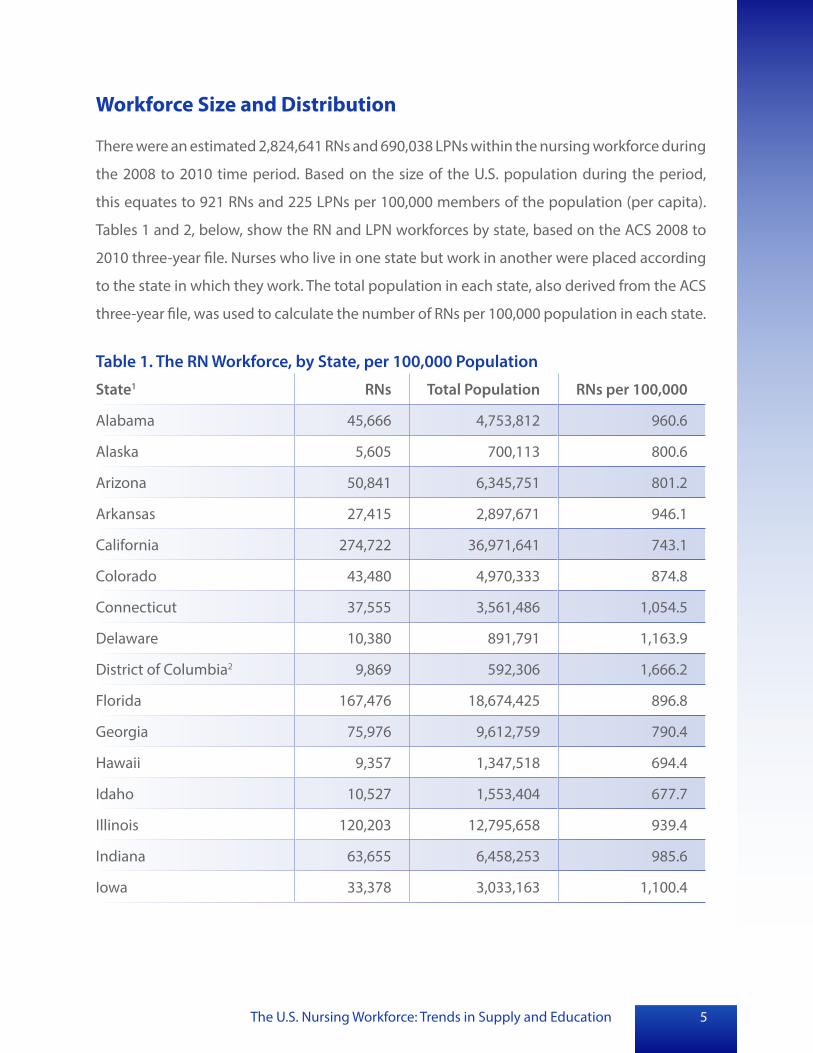
Workforce Size and Distribution
There were an estimated 2,824,641 RNs and 690,038 LPNs within the nursing workforce during
the 2008 to 2010 time period. Based on the size of the U.S. population during the period,
this equates to 921 RNs and 225 LPNs per 100,000 members of the population (per capita).
Tables 1 and 2, below, show the RN and LPN workforces by state, based on the ACS 2008 to
2010 three-year file. Nurses who live in one state but work in another were placed according
to the state in which they work. The total population in each state, also derived from the ACS
three-year file, was used to calculate the number of RNs per 100,000 population in each state.
Table 1. The RN Workforce, by State, per 100,000 Population
State1 RNs Total Population RNs per 100,000
Alabama 45,666 4,753,812 960.6
Alaska 5,605 700,113 800.6
Arizona 50,841 6,345,751 801.2
Arkansas 27,415 2,897,671 946.1
California 274,722 36,971,641 743.1
Colorado 43,480 4,970,333 874.8
Connecticut 37,555 3,561,486 1,054.5
Delaware 10,380 891,791 1,163.9
District of Columbia2 9,869 592,306 1,666.2
Florida 167,476 18,674,425 896.8
Georgia 75,976 9,612,759 790.4
Hawaii 9,357 1,347,518 694.4
Idaho 10,527 1,553,404 677.7
Illinois 120,203 12,795,658 939.4
Indiana 63,655 6,458,253 985.6
Iowa 33,378 3,033,163 1,100.4
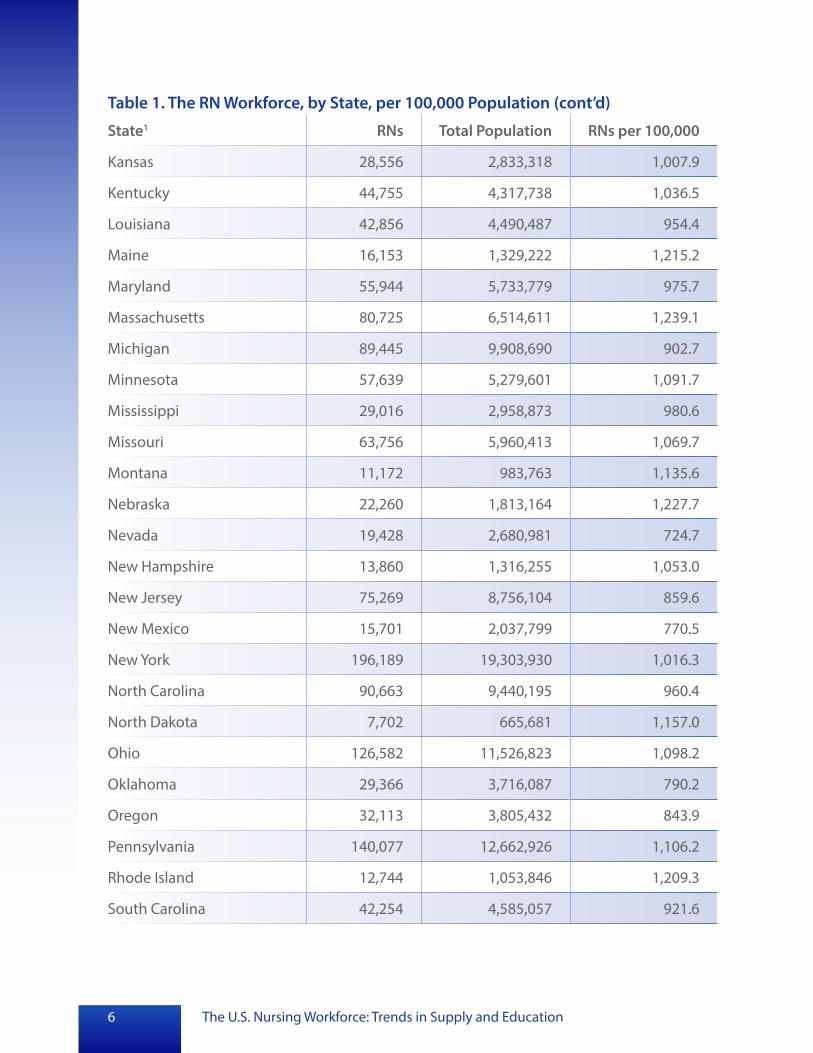
The U.S. Nursing Workforce: Trends in Supply and Education6
Table 1. The RN Workforce, by State, per 100,000 Population (cont’d)
State1 RNs Total Population RNs per 100,000
Kansas 28,556 2,833,318 1,007.9
Kentucky 44,755 4,317,738 1,036.5
Louisiana 42,856 4,490,487 954.4
Maine 16,153 1,329,222 1,215.2
Maryland 55,944 5,733,779 975.7
Massachusetts 80,725 6,514,611 1,239.1
Michigan 89,445 9,908,690 902.7
Minnesota 57,639 5,279,601 1,091.7
Mississippi 29,016 2,958,873 980.6
Missouri 63,756 5,960,413 1,069.7
Montana 11,172 983,763 1,135.6
Nebraska 22,260 1,813,164 1,227.7
Nevada 19,428 2,680,981 724.7
New Hampshire 13,860 1,316,255 1,053.0
New Jersey 75,269 8,756,104 859.6
New Mexico 15,701 2,037,799 770.5
New York 196,189 19,303,930 1,016.3
North Carolina 90,663 9,440,195 960.4
North Dakota 7,702 665,681 1,157.0
Ohio 126,582 11,526,823 1,098.2
Oklahoma 29,366 3,716,087 790.2
Oregon 32,113 3,805,432 843.9
Pennsylvania 140,077 12,662,926 1,106.2
Rhode Island 12,744 1,053,846 1,209.3
South Carolina 42,254 4,585,057 921.6

The U.S. Nursing Workforce: Trends in Supply and Education 7
Table 1. The RN Workforce, by State, per 100,000 Population (cont’d)
State1 RNs Total Population RNs per 100,000
South Dakota 10,076 807,563 1,247.7
Tennessee 67,159 6,303,437 1,065.4
Texas 186,573 24,789,312 752.6
Utah 18,771 2,720,974 689.9
Vermont 6,528 624,976 1,044.5
Virginia 64,268 7,928,022 810.6
Washington 56,607 6,658,052 850.2
West Virginia 19,220 1,847,352 1,040.4
Wisconsin 60,813 5,667,100 1,073.1
Wyoming 4,296 556,787 771.6
U.S. Total 2,824,641 306,738,434 920.9
Data Source: HRSA analysis of the ACS 2008-2010 three-year file 1All state estimates have a relative standard error (RSE) of less than 10%. 2The nursing workforce is likely denser in the District of Columbia (D.C.) in part because of the presence of several academic medical centers, like most cities, that require a large RN workforce. Many nurses and patients commute into D.C. for work and health services. Since most states include rural and/or suburban areas, it is not instructive to compare D.C. with states in terms of per capita supply.
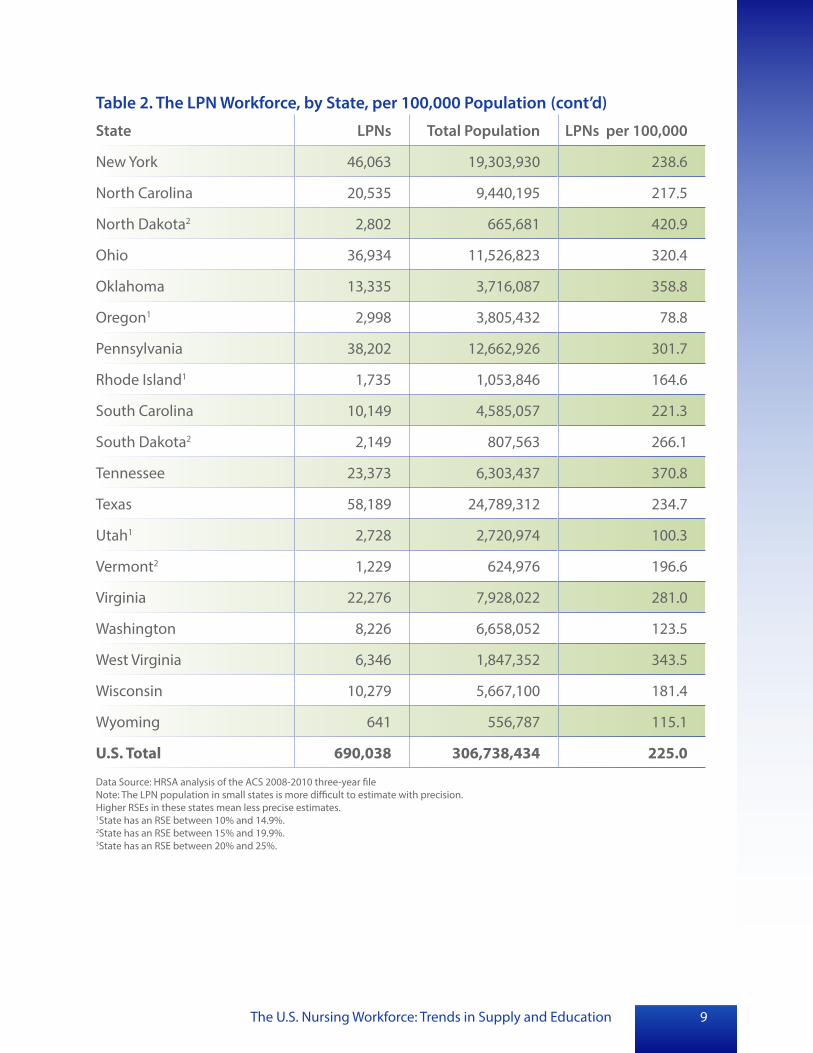
Table 2. The LPN Workforce, by State, per 100,000 Population
State LPNs Total Population LPNs per 100,000
Alabama 12,297 4,753,812 258.7
Alaska3 782 700,113 111.7
Arizona 7,853 6,345,751 123.8
Arkansas 10,734 2,897,671 370.4
California 54,817 36,971,641 148.3
Colorado 5,843 4,970,333 117.6
Connecticut 8,605 3,561,486 241.6
Delaware2 1,679 891,791 188.3
District of Columbia1 1,982 592,306 334.6

The U.S. Nursing Workforce: Trends in Supply and Education8
Table 2. The LPN Workforce, by State, per 100,000 Population (cont’d)
State LPNs Total Population LPNs per 100,000
Florida 45,686 18,674,425 244.6
Georgia 22,076 9,612,759 229.7
Hawaii2 2,107 1,347,518 156.4
Idaho1 2,880 1,553,404 185.4
Illinois 20,949 12,795,658 163.7
Indiana 17,114 6,458,253 265.0
Iowa 7,397 3,033,163 243.9
Kansas 7,056 2,833,318 249.0
Kentucky 9,857 4,317,738 228.3
Louisiana 17,457 4,490,487 388.8
Maine1 1,952 1,329,222 146.9
Maryland 11,733 5,733,779 204.6
Massachusetts 14,390 6,514,611 220.9
Michigan 19,196 9,908,690 193.7
Minnesota 15,462 5,279,601 292.9
Mississippi 9,719 2,958,873 328.5
Missouri 18,841 5,960,413 316.1
Montana2 1,737 983,763 176.6
Nebraska 5,882 1,813,164 324.4
Nevada 3,101 2,680,981 115.7
New Hampshire1 3,526 1,316,255 267.9
New Jersey 16,584 8,756,104 189.4
New Mexico1 2,555 2,037,799 125.4
The U.S. Nursing Workforce: Trends in Supply and Education 9
Table 2. The LPN Workforce, by State, per 100,000 Population (cont’d)
State LPNs Total Population LPNs per 100,000
New York 46,063 19,303,930 238.6
North Carolina 20,535 9,440,195 217.5
North Dakota2 2,802 665,681 420.9
Ohio 36,934 11,526,823 320.4
Oklahoma 13,335 3,716,087 358.8
Oregon1 2,998 3,805,432 78.8
Pennsylvania 38,202 12,662,926 301.7
Rhode Island1 1,735 1,053,846 164.6
South Carolina 10,149 4,585,057 221.3
South Dakota2 2,149 807,563 266.1
Tennessee 23,373 6,303,437 370.8
Texas 58,189 24,789,312 234.7
Utah1 2,728 2,720,974 100.3
Vermont2 1,229 624,976 196.6
Virginia 22,276 7,928,022 281.0
Washington 8,226 6,658,052 123.5
West Virginia 6,346 1,847,352 343.5
Wisconsin 10,279 5,667,100 181.4
Wyoming 641 556,787 115.1
U.S. Total 690,038 306,738,434 225.0
Data Source: HRSA analysis of the ACS 2008-2010 three-year file Note: The LPN population in small states is more difficult to estimate with precision. Higher RSEs in these states mean less precise estimates. 1State has an RSE between 10% and 14.9%. 2State has an RSE between 15% and 19.9%. 3State has an RSE between 20% and 25%.

The U.S. Nursing Workforce: Trends in Supply and Education
As Table 1 shows, the per capita supply of RNs varies substantially across states, from a high
of 1,248 in South Dakota to a low of 678 in Idaho. Per capita RN supply does not take into
account differences in population age, disease prevalence, or the number of hospital beds
that must be staffed. Still, it is informative because it illustrates that national-level information
masks substantial local-level differences. Figures 1 and 2 present the information graphically,
showing that states located in the West and West South Central Census areas tend to have a
lower per capita supply of RNs, whereas states in the Midwest and Northeast tend to have a
higher per capita supply.
Table 2 and Figures 3 and 4 present the same information for LPNs. Similar to the density of
RNs, LPN density is lowest in Western states. In general, areas of the country with a
comparatively dense population of RNs also have a comparatively dense population of LPNs.
Figure 1. The RN Workforce per 100,000 Population, by State
Washington
Oregon
California
Nevada
Idaho
Montana
Wyoming
Colorado Utah
New Mexico Arizona
Texas
Oklahoma
Kansas
Nebraska
South Dakota
North Dakota Minnesota
Wisconsin
Illinois
Iowa
Missouri
Arkansas
Louisiana
Alabama
Tennessee
Michigan
Pennsylvania
New York
Vermont
Georgia
Florida
Mississippi
Kentucky
South Carolina
North Carolina
Maryland Ohio Delaware
Indiana West Virginia
New Jersey
Connecticut
Massachusetts
Maine
Rhode Island
Virginia
New Hampshire
Alaska
Hawaii
Washington, DC
Data Source: HRSA analysis of the ACS 2008-2010 three-year file
10

The U.S. Nursing Workforce: Trends in Supply and Education 11
Figure 2. The per Capita RN Workforce, Ranked by State
0 200 400 600 800 1,000 1,200 1,400 South Dakota
Massachusetts Nebraska
Maine Rhode Island
Delaware North Dakota
Montana Pennsylvania
Iowa Ohio
Minnesota Wisconsin
Missouri Tennessee
Connecticut New Hampshire
Vermont West Virginia
KentuckyNew York
Kansas Indiana
MississippiMarylandAlabama
North Carolina Louisiana Arkansas
Illinois South Carolina
U.S. Average Michigan
Florida Colorado
New JerseyWashington
OregonVirginia Arizona Alaska
GeorgiaOklahoma Wyoming
New Mexico Texas
California Nevada Hawaii
Utah Idaho
Data Source: HRSA analysis of the ACS 2008-2010 three-year file

The U.S. Nursing Workforce: Trends in Supply and Education
Figure 3. The LPN Workforce per 100,000 Population, by State
Washington
Oregon
California
Nevada
Idaho
Montana
Wyoming
Colorado Utah
New Mexico Arizona
Texas
Oklahoma
Kansas
Nebraska
South Dakota
North Dakota Minnesota
Wisconsin
Illinois
Iowa
Missouri
Arkansas
Louisiana
Alabama
Tennessee
Michigan
Pennsylvania
New York
Vermont
Georgia
Florida
Mississippi
Kentucky
South Carolina
North Carolina
Maryland Ohio Delaware
Indiana West Virginia
New Jersey
Maine
Rhode Island
Virginia
New Hampshire
Alaska
Hawaii
Washington, DC
Data Source: HRSA analysis of the ACS 2008-2010 three-year file
Workforce Distribution Across Rural and Urban Areas
A large majority of nurses reside in urban areas, consistent with the distribution of the
total population.4 About 445,000 RNs and 166,000 LPNs reside in rural areas (see Figure 5).
Almost one-quarter of LPNs (24 percent) live in rural areas, whereas only 16 percent of RNs do
so. For comparison, about 17 percent of the U.S. population, or more than 52 million residents
(as estimated in the ACS 2008 to 2010), live in rural areas.
Urban areas have a somewhat higher number of RNs per capita than is true for the nation as a
whole, while rural areas have a lower per capita supply of RNs (see Figure 6). In contrast, rural
areas have a higher number of LPNs per capita, compared with the nation, while urban areas
have a lower per capita supply of LPNs.
4The geographic unit used for this analysis is the Public Use Microdata Area (PUMA). PUMAs, the smallest geographic unit available on the ACS public use files, are areas containing 100,000 people. In this report, an “urban” PUMA is one in which a majority of residents live in metropolitan areas, as defined by the Office of Management and Budget (OMB, 2003); “rural” PUMAs are those with a majority in non-metro counties. (See http://www.whitehouse.gov/omb/bulletins_b03-04.) The classification of PUMAs as rural or urban employed a coding scheme developed by the U.S. Department of Agriculture and based on the OMB metro/non-metro classification. PUMAs represent the household location of survey respondents. It is not possible to present a rural-urban distribution according to the work location of survey respondents.
12
Connecticut
Massachusetts

The U.S. Nursing Workforce: Trends in Supply and Education 13
Figure 4. The per Capita LPN Workforce, Ranked by State
North Dakota Louisiana
Tennessee Arkansas
Oklahoma West Virginia
MississippiNebraska
Ohio Missouri
PennsylvaniaMinnesota
Virginia New Hampshire
South Dakota Indiana
Alabama Kansas Florida
Iowa Connecticut
New York Texas
GeorgiaKentucky
U.S. Average South Carolina Massachusetts North Carolina
MarylandVermont Michigan
New JerseyDelaware
Idaho Wisconsin
Montana Rhode Island
Illinois Hawaii
California Maine
New Mexico Arizona
Washington Colorado
Nevada Wyoming
Alaska Utah
Oregon
0 50 100 150 200 250 300 350 400 450
Data Source: HRSA analysis of the ACS 2008-2010 three-year file

Figure 5. Nursing Workforce Distribution in Rural and Urban Areas
The U.S. Nursing Workforce: Trends in Supply and Education
100%
80%
60%
40%
20%
0%
Rural
Urban
RNs
444,688
2,379,953
LPNs
Rural 165,980
Urban Urban 524,058
U.S. Population
Rural 52,153,208
254,590,000
Data Source: HRSA analysis of the ACS 2008-2010 three-year file
Figure 6. Nurses per 100,000 Residents in Rural and Urban Areas
0
200
400
600
800
1,000
Per Capita Rural Per Capita Urban Per Capita U.S.
RNs
852.7 934.8 920.8
LPNs
318.3
205.8 225.0
Data Source: HRSA analysis of the ACS 2008-2010 three-year file
Tables 3 and 4 present key demographic and employment characteristics for rural, urban, and
all areas. In general, RNs in rural areas are more likely to be female and white non-Hispanic/
Latino and to hold an associate’s degree or less as their highest degree. RNs in rural areas are
14

The U.S. Nursing Workforce: Trends in Supply and Education 15
25 or younger 5.3 4.9 5.2
26-30* 9.7 9.0 9.6
31-35 11.0 10.7 11.0
36-40 12.5 12.6 12.5
41-45 12.2 12.5 12.3
46-50 14.4 14.9 14.5
51-55 15.1 15.3 15.1
56-60* 11.2 11.9 11.3
61-65 5.9 5.7 5.9
66-70 1.8 1.7 1.8
71 or older 0.8 0.8 0.8
Total 100 100 100
Average Age 44.6 44.9 44.6
Urban Areas (%)
Rural Areas (%)
All Areas (%)
Age
Education
RN Diploma* 6.8 7.8 6.9
Associate’s* 35.3 51.6 37.9
Bachelor’s* 46.6 33.9 44.6
Master’s and Doctoral* 11.4 6.8 10.6
Total 100 100 100
Race/Ethnicity
White* 72.4 91.2 75.4
Black/African American* 10.9 4.3 9.9
slightly less likely to work in hospitals and more likely to work in nursing care facilities when
compared with their urban counterparts. Similar demographic and setting differences were
found among LPNs. Each of these characteristics is charted over time for the nation (rural and
urban areas combined) in the next section.
Table 3. Residential Distribution of the RN Workforce Across Urban and Rural Areas

The U.S. Nursing Workforce: Trends in Supply and Education16
Table 3. Residential Distribution of the RN Workforce Across Urban and Rural Areas (cont’d)
Urban Areas (%)
Rural Areas (%)
All Areas (%)
Hispanic/Latino* 5.4 1.8 4.8
Asian* 9.6 0.9 8.3
American Indian/Alaska Native* 0.7 0.3 0.4
Multiple/Other* 1.4 1.1 1.3
Total 100 100 100
Percent Male* 9.4 7.8 9.1
Setting
Hospitals* 63.9 59.4 63.2
Nursing Care Facilities* 6.8 10.6 7.4
Offices of Physicians 4.8 4.5 4.8
Home Health Care Services* 3.6 4.6 3.8
Outpatient Care Centers* 4.5 5.3 4.6
Other Health Care Services* 5.6 4.6 5.4
Elementary and Secondary Schools 2.2 2.3 2.2
Employment Services 2.1 1.9 2.1
Insurance Carriers* 1.0 0.3 0.9
Administration of HR Programs1* 1.2 2.2 1.4
Justice, Public Order, and Safety2* 0.5 1.3 0.6
Offices of Other Practitioners* 0.3 0.2 0.3
Colleges and Universities* 0.6 0.4 0.6
Residential Facilities, w/o Nursing 0.3 0.5 0.4
All Other Settings3* 2.6 2.2 2.5
Total 100 100 100
Data Source: HRSA analysis of the ACS 2008-2010 three-year file Note: Not all totals equal 100 due to rounding. *Rural vs. urban proportions within the category are statistically significantly different at p<0.05. 1Category includes RNs whose jobs focus primarily on administration. 2Category includes the majority of nurses working in public health settings. 3For this analysis, all settings holding less than 1% of the RN population have been recoded to “Other.”
The U.S. Nursing Workforce: Trends in Supply and Education 17
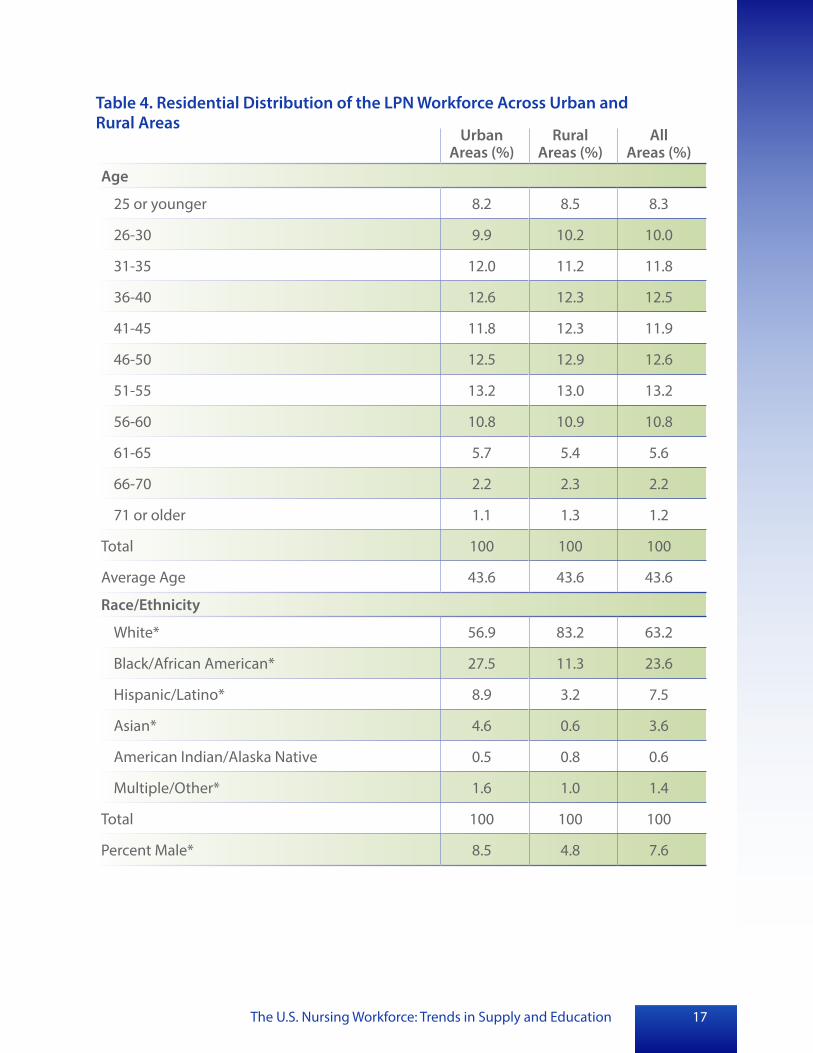
Table 4. Residential Distribution of the LPN Workforce Across Urban and Rural Areas
Urban Areas (%)
Rural Areas (%)
All Areas (%)
Age
25 or younger 8.2 8.5 8.3
26-30 9.9 10.2 10.0
31-35 12.0 11.2 11.8
36-40 12.6 12.3 12.5
41-45 11.8 12.3 11.9
46-50 12.5 12.9 12.6
51-55 13.2 13.0 13.2
56-60 10.8 10.9 10.8
61-65 5.7 5.4 5.6
66-70 2.2 2.3 2.2
71 or older 1.1 1.3 1.2
Total 100 100 100
Average Age 43.6 43.6 43.6
Race/Ethnicity
White* 56.9 83.2 63.2
Black/African American* 27.5 11.3 23.6
Hispanic/Latino* 8.9 3.2 7.5
Asian* 4.6 0.6 3.6
American Indian/Alaska Native 0.5 0.8 0.6
Multiple/Other* 1.6 1.0 1.4
Total 100 100 100
Percent Male* 8.5 4.8 7.6

The U.S. Nursing Workforce: Trends in Supply and Education18
Table 4. Residential Distribution of the LPN Workforce Across Urban and Rural Areas
Urban Areas (%)
Rural Areas (%)
All Areas (%)
(cont’d)
Setting
Hospitals* 29.5 28.8 29.3
Nursing Care Facilities 29.8 33.5 30.7
Offices of Physicians* 8.1 8.8 8.2
Home Health Care Services 6.2 6.9 6.3
Outpatient Care Centers* 5.6 6.0 5.7
Other Health Care Services 7.5 5.6 7.0
Elementary and Secondary Schools* 1.0 1.3 1.1
Employment Services 4.2 2.7 3.8
Administration of HR Programs1 0.9 1.0 0.9
Justice, Public Order, and Safety2 1.2 1.6 1.3
Residential Facilities, w/o Nursing* 1.4 1.0 1.3
All Other Settings3 4.8 2.8 4.3
Total 100 100 100
Data Source: HRSA analysis of the ACS 2008-2010 three-year file Note: Not all totals equal 100 due to rounding. *Rural vs. urban proportions within the category are statistically significantly different at p<0.05. 1Category includes RNs whose jobs focus primarily on administration. 2Category includes the majority of nurses working in public health settings. 3For this analysis, all settings holding less than 1% of the RN population have been recoded to “Other.” Settings for which estimates had greater than 30% RSE have been recoded to “Other,” including insurance carriers, colleges/universities, and offices of other health care practitioners.
Trends in the Nursing Workforce During the Past Decade
A comparison of estimates from the Census 2000 Long Form and the ACS 2008 to 2010 three-
year file shows that the RN workforce grew by nearly one-quarter and the LPN workforce
grew by 15.5 percent (see Figure 7). Over a period of approximately nine years, this equates to
an annual growth of approximately 61,000 RNs (2.7-percent compound annual growth rate)
and 10,300 LPNs (1.8-percent compound annual growth rate).

The U.S. Nursing Workforce: Trends in Supply and Education
Figure 7. Growth in the U.S. Nursing Workforce
Growth
Wor
kfor
ce
Growth
Census 2000 Long Form ACS 08-10 Three-Year File
0
500,000
1,000,000
1,500,000
2,000,000
2,500,000
3,000,000
3,500,000
LPN
15.5%
597,523 690,038
RN
24.1%
2,275,276
2,824,641
Data Sources: HRSA analysis of the ACS 2008-2010 three-year file and Census 2000 Long Form 5% sample
Over the past nine years, growth in the nursing workforce has surpassed that of the population.
As Table 5 shows, the per capita supply of both RNs and LPNs has increased over time, with RN
growth more than twice that for LPNs. The number of RNs per capita has increased by almost
14 percent, while the number of LPNs per capita has increased about 6 percent. Increasing
per capita supply does not necessarily indicate that the nurse supply is more adequate now
than it was in 2000. The measure does not account for other trends that have increased the
demand for nurses, such as an aging population, increasing patient acuity, and hospital
staffing and hiring preferences.
Table 5. Growth in the per Capita Supply of RNs and LPNs
19
Nurses (Census
2000)
Per Capita Supply (2000)
Nurses (ACS 08-10)
Per Capita Supply (08-10)
% Change in per Capita
Supply
RNs 2,275,276 808.5 2,824,641 920.9 13.9%
LPNs 597,523 212.3 690,038 225.0 6.0%
Data Sources: HRSA analysis of the ACS 2008-2010 three-year file and Census 2000 Long Form 5% sample
The U.S. Nursing Workforce: Trends in Supply and Education20
RN Workforce Education and Demographics
RNs can enter the workforce through education programs at multiple levels: diploma,5
associate’s, bachelor’s, and even “entry” graduate degree programs that produce new nurses
with master’s degrees (see Figure 8). After entering the RN workforce, many nurses attain
additional education to advance in their careers and to prepare them for advanced practice
and teaching or research roles.
The Institute of Medicine (IOM) nursing report, entitled “Future of Nursing: Leading
Change, Advancing Health,” recommended higher levels of education in the nursing field.
This recommendation was made to prepare nurses for the more complex care needed by
sicker patients and the sophisticated new technologies available for providing care.6 It was
followed with a specific goal to increase the proportion of nurses with a bachelor’s degree to
80 percent by 2020.
Analysis of Census data shows a small increase in the number of bachelor’s and graduate
degree holders—about 5 percentage points—over approximately nine years. Currently,
about 55 percent of the RN workforce holds a bachelor’s or higher degree. At this slow rate
of change, it would take several decades to reach the 80-percent recommendation of the
IOM. Rural areas have even further to go to meet the IOM recommendation: Only 34 percent
of RNs in rural areas hold a bachelor’s or higher degree (refer to Table 3). Section 2 presents
information on both pre- and post-licensure bachelor’s graduates.
The Age Structure of the RN Workforce
A key concern for workforce planners is the age distribution of the workforce, as an aging
workforce portends large numbers of retirements. Over the past decade, the average age
of RNs has increased by nearly two years, from 42.7 years in 2000 to 44.6 years in the
ACS 2008 to 2010. Figure 9 provides a graphical view of the changing age structure of
RNs over time. In 2000, a large proportion of RNs were 41 to 45 years old. In the ACS 2008
to 2010, the age distribution is flatter, and a larger proportion is older than age 50. Similar
proportions fall into the younger age categories in both time periods, however.
5Census data report the level but not the type of degree held by individuals with less than a bachelor’s degree. Therefore, RNs who reported a high school diploma or “some college, no degree” were assumed to hold an RN diploma. 6See http://www.iom.edu/Reports/2010/The-Future-of-Nursing-Leading-Change-Advancing-Health.aspx.

The U.S. Nursing Workforce: Trends in Supply and Education
Figure 8. Highest Degree Held by RNs, Census 2000 and ACS 2008 to 2010
RN Diploma,
12.3% Associate’s
38.0%
Bachelor’s40.8%
Master’s8.6%
Doctorate, 0.3%
Graduate, 8.9%
Census 2000
RN Diploma 6.9%Associate’s
37.9%
Bachelor’s 44.6% Master’s,
10.3%
Doctorate, 0.4%
Graduate, 10.6%
ACS 08-10 Data Sources: HRSA analysis of the ACS 2008-2010 three-year file and Census 2000 Long Form 5% sample
21

The U.S. Nursing Workforce: Trends in Supply and Education22
Figure 9. The Changing Age Distribution of RNs, in Five-Year Increments
20%
18%
16%
14%
12%
10%
8%
6%
4%
2%
0% 25 or 26-30 31-35 36-40 41-45 46-50 51-55 56-60 61-65 66-70 71-75 76 and
younger older
Census 2000 ACS 08-10
Data Sources: HRSA analysis of the ACS 2008-2010 three-year file and Census 2000 Long Form 5% sample
Another way to view the changing age structure of nurses is through a comparison of absolute
numbers in the workforce (see Figure 10). The workforce has grown overall, but this growth
is concentrated in the older and younger ends of the age spectrum, and there are actually
fewer RNs aged 36 to 45 working today, compared with nine years ago. Although the nursing
workforce has aged over the past decade, it is encouraging to see growth in the number aged
35 and younger. This finding suggests that young people continue to see nursing as a viable
career and predicts longer-term stability in the age distribution of the nursing workforce.
However, the tremendous growth of RN cohorts nearing retirement age is still a cause for
concern. Over the next 10 to 15 years, the nearly 1 million RNs older than 50—about one-
third of the current workforce—will reach retirement age. Retirement of large numbers of
RNs over the next two decades means a loss of experiential knowledge and leadership
brought to the workforce by seasoned RNs. Depending on the retirement decisions of this
older cohort, which may be influenced by the pace of economic recovery, sudden spikes in
retirement may exacerbate geographic and facility-level nursing shortages.

The U.S. Nursing Workforce: Trends in Supply and Education 23
Figure 10. Counts of RNs in the Workforce, by Age, in Five-Year Increments 500,000
450,000
400,000
350,000
300,000
250,000
200,000
150,000
100,000
50,000
0 25 or 26-30 31-35 36-40 41-45 46-50 51-55 56-60 61-65 66-70 71 and
younger older
Census 2000 ACS 08-10
Data Sources: HRSA analysis of the ACS 2008-2010 three-year file and Census 2000 Long Form 5% sample
At the same time, health care delivery settings will need to accommodate an older nursing
workforce over the next decade. As recommended by the Robert Wood Johnson Foundation
in its 2006 white paper, Wisdom at Work,7 employers will need to consider creative options
for retaining older nurses. Such options include more flexible scheduling and new roles
that take advantage of the older nurse’s experience.
RN Workforce Diversity
Diversity within the nursing workforce—in terms of race/ethnicity and sex—is desirable
because it can improve both access and care quality for minorities and medically
underserved populations.8 Nursing has historically been dominated by white females, and as
Figure 11 shows, the nursing workforce is still predominantly white. However, over time, the
proportion of racial/ethnic minorities has been increasing. Black/African Americans, Asians,
and Hispanics/Latinos9 make up greater proportions of the RN population, while whites have
7See http://www.rwjf.org/content/dam/supplementary-assets/2006/06/wisdomatwork.pdf. 8See http://bhpr.hrsa.gov/healthworkforce/reports/diversityreviewevidence.pdf. 9The Census Bureau collects Hispanic/Latino ethnicity in a separate question from race. For this analysis, we have coded all Hispanics as “Hispanic/Latino” regardless of their selection for race.

The U.S. Nursing Workforce: Trends in Supply and Education24
declined in proportion, from more than 80 percent in 2000 to about 75 percent in the ACS
2008 to 2010.
Figure 11. Race/Ethnicity in the RN Workforce and Total Working-Age Population 100%
0%
10%
20%
30%
40%
50%
60%
70%
80%
90%
Census 2000 (RNs) %
ACS 08-10 (RNs) %
ACS 08-10 (Wrk. Age Pop) %
Multiple/Other 1.3 1.3 1.5 Haw. Nat./ Pac. Isl. 0.1 0.1 0.1 Am Ind/AK Native 0.4 0.4 0.6 Asian 5.7 8.2 4.8 Hispanic/Latino 3.3 4.8 14.2 Black/African American 8.8 9.9 11.8 White 80.4 75.4 66.9
Multiple/Other
Haw. Nat./ Pac. Isl.
Am Ind/AK Native
Asian
Hispanic/Latino
Black/African American
White
Data Sources: HRSA analysis of the ACS 2008-2010 three-year file and Census 2000 Long Form 5% sample
Figure 11 also shows a comparison with the current U.S. working-age population (i.e., the
population aged 16 and older) for race/ethnicity. The working-age population has a lower
percentage of whites (67 percent vs. 75 percent for RNs). The RN workforce has a smaller
percentage of Hispanics/Latinos and Black/African Americans, and a larger percentage of
Asians, when compared with the total working-age population. The percentage difference
for Hispanics/Latinos is particularly notable: They compose 14 percent of the working-age
population but only 5 percent of the RN workforce.
Nursing remains a predominantly female profession, but the proportion of RNs who are
male has increased over time: from 7.7 percent in Census 2000 to 9.1 percent in the
ACS 2008 to 2010.

The U.S. Nursing Workforce: Trends in Supply and Education 25
LPN Workforce Demographics
Many of the demographic trends observed for RNs hold for LPNs as well. As Figure 12 shows,
the LPN age distribution has also flattened and shifted toward older ages. Also consistent
with the findings for RNs, the proportion of younger nurses appears to be holding reasonably
steady. During the time period covered by this analysis, the average age of LPNs increased by
about 1.75 years, from 41.9 in 2000 to 43.6 in the ACS 2008 to 2010.
Figure 12. Changing Age Distribution of LPNs, in Five-Year Increments
18%
16%
14%
12%
10%
8%
6%
4%
2%
0% 25 or 26-30 31-35 36-40 41-45 46-50 51-55 56-60 61-65 66-70 71-75 76 and
younger older
Census 2000 ACS 08-10
Data Sources: HRSA analysis of the ACS 2008-2010 three-year file and Census 2000 Long Form 5% sample
Similar to RNs, the absolute number of LPNs has grown overall, but this growth has occurred
only among those younger than 30 and older than 50 (see Figure 13). The number of LPNs
aged 31 to 50 has actually decreased over the past 10 years. More than one-third of the LPN
workforce is older than age 50.

The U.S. Nursing Workforce: Trends in Supply and Education26
Figure 13. Counts of LPNs in the Workforce, by Age, in Five-Year Increments
120,000
100,000
80,000
60,000
40,000
20,000
0 25 or 26-30 31-35 36-40 41-45 46-50 51-55 56-60 61-65 66-70 71 and
younger older
Census 2000 ACS 08-10
Data Sources: HRSA analysis of the ACS 2008-2010 three-year file and Census 2000 Long Form 5% sample
The proportion of LPNs from minority racial/ethnic groups has increased over time (from
about 32 percent to 37 percent), while the proportion reporting white race has declined
(see Figure 14). LPNs are more likely to identify as racial/ethnic minorities when compared
with RNs. In particular, the proportion of Black/African Americans is higher among LPNs (23.6
percent in the ACS 2008 to 2010 vs. 9.9 percent for RNs). As Figure 14 shows, the LPN workforce
has a substantially higher percentage of African Americans than does the total working-age
population. However, as was true for RNs, Hispanics/Latinos are notably underrepresented in
the LPN workforce.
Employment Characteristics of RNs and LPNs
The settings10 in which nurses are employed are shown in Table 6. The majority of RNs
(63.2 percent) continue to work in hospitals, and that proportion has not changed significantly
during the past decade. Over time, the proportion working in nursing care facilities, physician
offices, and home health has declined slightly, while the proportion working in outpatient
10The Census Bureau uses the North American Industry Classification System (NAICS) codes for recording employment setting, and though they are limited in the level of detail available, the data sources used here offer some insights into changes in the distribution of nurses across settings.
The U.S. Nursing Workforce: Trends in Supply and Education 27
care centers and “other health care services” has increased slightly. Note that these increases
and decreases are quite small and that the majority of RNs are still providing inpatient and
outpatient care in hospitals.
Figure 14. Race/Ethnicity in the LPN Workforce and Total Working-Age Population
100%
0%
10%
20%
30%
40%
50%
60%
70%
80%
90%
Census 2000 (LPNs)
%
ACS 08-10 (LPNs)
%
ACS 08-10 (Working Age Population)
%
Multiple/Other 1.9 1.4 1.5
Hawaiian Nat./ Pac. Isl. 0.1 0.1 0.1
Am Ind/AK Native 0.8 0.6 0.6
Asian 2.5 3.5 4.8
Hispanic/Latino 5.7 7.5 14.2
Black/African American 20.9 23.6 11.8
White 68.1 63.2 66.9
Multiple/Other
Hawaiian Nat./ Pac. Isl.
Am Ind/AK Native
Asian
Hispanic/Latino
Black/African American
White
Data Sources: HRSA analysis of the ACS 2008-2010 three-year file and Census 2000 Long Form 5% sample
In sharp contrast, less than one-third of LPNs (29.3 percent) work in hospitals. That proportion
has declined slightly (from 34.9 percent) during the past decade. Care provided by LPNs
has shifted away from hospitals and physician offices and toward home health, outpatient
care centers, and “other health care services.” About one-third of LPNs work in nursing care
facilities, and that proportion has held steady over time. LPNs compose the predominant
licensed workforce within residential long-term care facilities.

The U.S. Nursing Workforce: Trends in Supply and Education28
Table 6. Setting of Employment for Nurses, Census 2000 and ACS 2008 to 2010 RNs LPNs
Census 2000 %
ACS 08-10 %
Census 2000 %
ACS 08-10 %
Hospitals 62.7 63.2 34.9 29.3
Nursing Care Facilities1 8.3 7.4 30.2 30.7
Offices of Physicians 6.9 4.8 11.2 8.2
Home Health Care Services 4.5 3.8 5.6 6.3
Outpatient Care Centers 3.1 4.6 3.6 5.7
Other Health Care Services 2.9 5.4 2.3 7.0
Elementary and Secondary Schools 2.3 2.2 0.8 1.7
Employment Services 2.0 2.1 3.4 3.8
Insurance Carriers and Related Activities 1.0 0.9 0.3 0.2
Administration of Human Resource Programs2 0.9 1.4 0.3 0.9
Justice, Public Order, and Safety Activities3 0.7 0.6 1.0 1.3
Offices of Other Health Practitioners 0.6 0.3 0.9 0.4
Colleges and Universities, Including Junior Colleges 0.6 0.6 0.2 0.3
Residential Care Facilities, Without Nursing 0.5 0.4 1.8 1.3
All Other Settings4 3.1 2.5 3.6 3.4
Data Sources: HRSA analysis of the ACS 2008-2010 three-year file and Census 2000 Long Form 5% sample 1Category includes skilled nursing facilities, also called nursing homes. 2Category includes RNs whose jobs focus primarily on administration. 3Category includes the majority of nurses working in public health settings. 4For this analysis, all settings holding less than 1% of the RN population have been recoded to “Other.”

The U.S. Nursing Workforce: Trends in Supply and Education 29
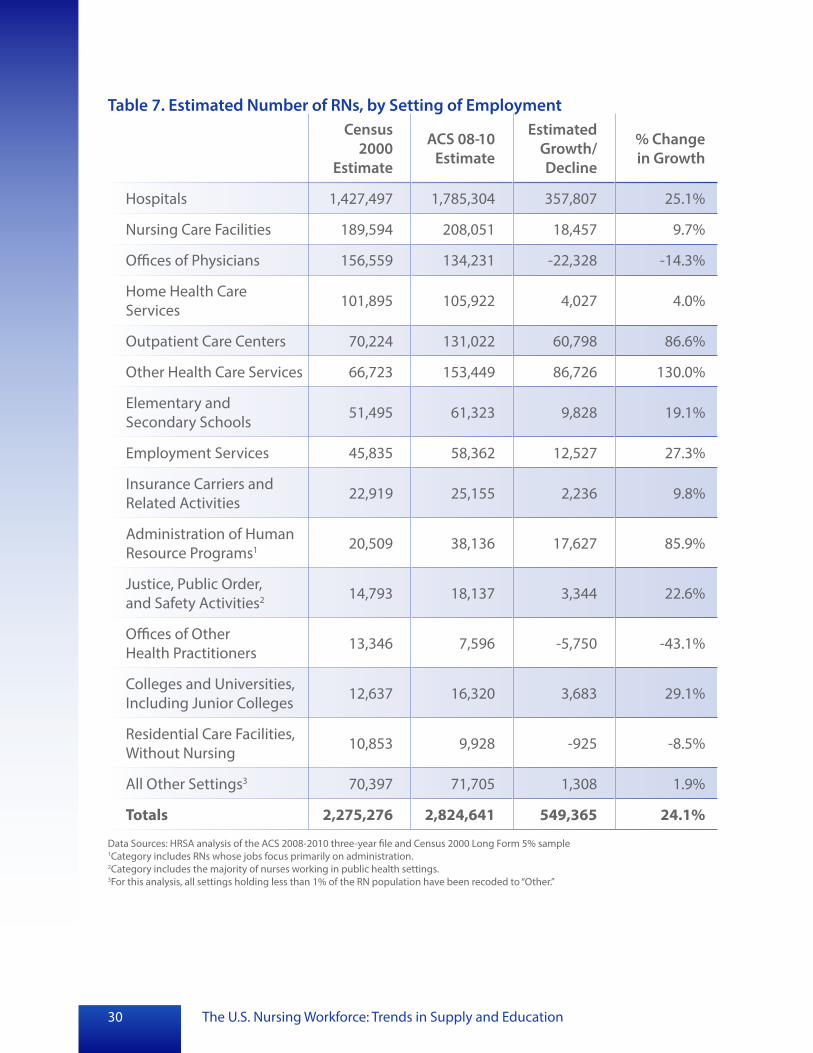
The largest
gains, as a percentage of growth in absolute numbers, occurred for outpatient care centers,
administration positions, and “other healthcare services.”
An alternative view is the growth or decline in the estimated number of workers, by setting,
as shown for RNs in Table 7. The RN workforce grew by 24 percent during the decade, and
most settings experienced increases in their RN workforces. Even though the percentage of
RNs working in hospitals did not increase significantly, the absolute number of RNs working
in hospitals increased by more than 350,000—about 25 percent. Despite the growth in the
RN workforce overall, three settings experienced absolute losses in RN employees: offices of
physicians, offices of other health practitioners, and residential care facilities.11
The LPN workforce grew by 15.5 percent over the past decade, but the growth was very
uneven across settings (see Table 8). The number of LPNs in hospitals actually decreased by
about 6,500, and the LPN workforce in the offices of physicians and other providers decreased
by 12,000 during the past decade. Large gains in absolute numbers occurred for nursing care
facilities (31,366), outpatient care centers (17,921), home health (10,374), and “other health
care services” (34,918).
The average number of hours worked by RNs held remarkably steady over the time period
covered by this analysis, hovering at about 37 hours per week. When examined by age (see
Figure 15), it is clear that older nurses are, as expected, working fewer hours than younger
nurses. Interestingly, nurses aged 60 and older are working more hours in the ACS 2008 to
2010 when compared with Census 2000. This finding may be due to the recession, which
anecdotal reports suggest has increased the amount of time nurses work, owing to spouses
who have suffered job losses and reductions in hours. It is unclear why the differences
are found primarily among those older than 60, although the impact of the recession on
retirement savings differentially impacts those who are closer to retirement.
11Employment distribution across settings over time was also assessed using data from the Bureau of Labor Statistics’ (BLS’s) Occupational Employment Statistics program. The results were generally similar, although the percentage decrease of RNs and LPNs in physicians’ offices was much smaller. As a result, the BLS employment estimates do not show absolute declines in the number of RNs and LPNs in physicians’ offices. The BLS data suggest that medical assistant employment growth has been rapid and that physicians’ offices are becoming more heavily staffed by medical assistants.
The U.S. Nursing Workforce: Trends in Supply and Education30
Table 7. Estimated Number of RNs, by Setting of Employment Census
2000 Estimate
ACS 08-10 Estimate
Estimated Growth/ Decline
% Change in Growth
Hospitals 1,427,497 1,785,304 357,807 25.1%
Nursing Care Facilities 189,594 208,051 18,457 9.7%
Offices of Physicians 156,559 134,231 -22,328 -14.3%
Home Health Care Services 101,895 105,922 4,027 4.0%
Outpatient Care Centers 70,224 131,022 60,798 86.6%
Other Health Care Services 66,723 153,449 86,726 130.0%
Elementary and Secondary Schools 51,495 61,323 9,828 19.1%
Employment Services 45,835 58,362 12,527 27.3%
Insurance Carriers and Related Activities 22,919 25,155 2,236 9.8%
Administration of Human Resource Programs1 20,509 38,136 17,627 85.9%
Justice, Public Order, and Safety Activities2 14,793 18,137 3,344 22.6%
Offices of Other Health Practitioners 13,346 7,596 -5,750 -43.1%
Colleges and Universities, Including Junior Colleges 12,637 16,320 3,683 29.1%
Residential Care Facilities, Without Nursing 10,853 9,928 -925 -8.5%
All Other Settings3 70,397 71,705 1,308 1.9%
Totals 2,275,276 2,824,641 549,365 24.1%
Data Sources: HRSA analysis of the ACS 2008-2010 three-year file and Census 2000 Long Form 5% sample 1Category includes RNs whose jobs focus primarily on administration. 2Category includes the majority of nurses working in public health settings. 3For this analysis, all settings holding less than 1% of the RN population have been recoded to “Other.”

The U.S. Nursing Workforce: Trends in Supply and Education 31
Table 8. Estimated Number of LPNs, by Setting of Employment Census
2000 Estimate
ACS 08-10 Estimate
Change Over Time
% Change in Estimates
Hospitals 208,757 202,247 -6,510 -3.1%
Nursing Care Facilities 180,228 211,594 31,366 17.4%
Offices of Physicians 66,915 56,874 -10,041 -15.0%
Home Health Care Services 33,225 43,599 10,374 31.2%
Outpatient Care Centers 21,613 39,534 17,921 82.9%
Other Health Care Services 13,612 48,530 34,918 256.5%
Elementary and Secondary Schools 4,907 7,312 2,405 49.0%
Employment Services 20,226 26,530 6,304 31.2%
Insurance Carriers and Related Activities 1,467 1,646 179 12.2%
Administration of Human Resource Programs1 2,039 6,426 4,387 215.2%
Justice, Public Order, and Safety Activities2 6,113 8,956 2,843 46.5%
Offices of Other Health Practitioners 5,084 2,565 -2,519 -49.5%
Colleges and Universities, Including Junior Colleges 1,255 2,291 1,036 82.5%
Residential Care Facilities, Without Nursing 10,715 8,721 -1,994 -18.6%
All Other Settings3 21,367 23,213 1,846 8.6%
Totals 597,523 690,038 92,515 15.5%
Data Sources: HRSA analysis of the ACS 2008-2010 three-year file and Census 2000 Long Form 5% sample 1Category includes RNs whose jobs focus primarily on administration. 2Category includes the majority of nurses working in public health settings. 3For this analysis, all settings holding less than 1% of the LPN population have been recoded to “Other.”

The U.S. Nursing Workforce: Trends in Supply and Education
Figure 15. Average Hours Worked by RNs, by Age
20
25
30
35
40
30 or younger
31–40 41–50 51–60 61–70 71 and older
Census 2000 ACS 08-10 Data Sources: HRSA analysis of the ACS 2008-2010 three-year file and Census 2000 Long Form 5% sample
Figure 16. Average Hours Worked by LPNs, by Age
20
25
30
35
40
30 or younger
31–40 41–50 51–60 51–60 71 and older
Census 2000 ACS 08-10 Data Sources: HRSA analysis of the ACS 2008-2010 three-year file and Census 2000 Long Form 5% sample
32

The average hours worked by LPNs also held quite steady over time, hovering around 37
hours per week across all ages. Similar to RNs, the ACS 2008 to 2010 data suggest that
LPNs are working more hours than in 2000 within older age categories (refer to Figure 16).
The difference is particularly noticeable in the 61 to 70 age category.
Figure 17 shows the average salary of a full-time nurse (36 or more hours per week). Full-time
salary has increased by about $20,000 for RNs and about $11,500 for LPNs over the past decade.
An increasing average salary can reflect the influence of many factors, including inflation, an
older (and more experienced) workforce, and wage hikes to stimulate employment interest
in areas facing a nursing shortage. Figure 17 presents the average salary within the ACS 2008
to 2010 adjusted to 2000 constant dollars to remove the impact of inflation (darker part of
the bar). As the figure also shows, once inflation has been accounted for, the salary increase
remains notable at nearly 15 percent ($6,600) over 10 years.
Figure 17. Growth in Full-Time Nurse Salaries
The U.S. Nursing Workforce: Trends in Supply and Education
2000 RNs LPNs 08-10
Inflation adjusted to 2000 constant dollars. Actual salary in the ACS 2008-2010, adjusted to 2010 dollars.
$0.00
$10,000.00
$20,000.00
$30,000.00
$40,000.00
$50,000.00
$60,000.00
$70,000.00
RNs
$43,906.46 $50,497.10
$63,944.22
LPNs
*
*
**
**
***
$27,809.77 $31,083.31
$39,360.64
2000 08-10
Data Sources: HRSA analysis of the ACS 2008-2010 three-year file and Census 2000 Long Form 5% sample
33

The U.S. Nursing Workforce: Trends in Supply and Education34

The U.S. Nursing Workforce: Trends in Supply and Education 35
Section 2 Nursing Pipeline and Nursing Education Capacity
A key driver of the nurse supply in the future is the nation’s capacity to produce new nurses
through our education system—the workforce pipeline. In general, the pipeline can be viewed
through a number of metrics, including the number of future students, current students, new
graduates, or new licensees. However, measuring the nursing pipeline presents a particular
analytic challenge for two reasons. First, new RNs enter the field from a variety of educational
levels, including diploma, associate’s, bachelor’s, and master’s degree programs. Second,
many graduates of diploma and associate’s degree programs return to school to earn higher
degrees; thus, reports of bachelor’s degree graduates often include both those entering
nursing for the first time as well as RNs seeking the additional degree qualification. Similarly,
while the vast majority of new master’s degrees represent continuing education for existing
nurses, some earning master’s degrees are new nurses. As a result, it can be difficult to separate
new nurses from existing nurses in data reported on the pool of nursing graduates.
Though there are different types of degrees awarded to those entering nursing, every
individual who wishes to practice as a nurse in the United States must pass a licensure
examination: the National Council Licensure Examination for Registered Nurses (NCLEX-RN®)
or the National Council Licensure Examination for Practical Nurses (NCLEX-PN®).
This section of the report presents data on the two major components of the nursing workforce
pipeline: new entrants to the profession and post-licensure education.
New Entrants to the Nursing Profession
Trends in U.S.-educated candidates both sitting for and passing the licensure exams are
presented in Figures 18 through 23.

The U.S. Nursing Workforce: Trends in Supply and Education36
About the Data
Data for NCLEX exams are published annually to provide descriptive
information, including pass rates by quarter, for licensure candidates
by country of education (U.S. or international). Summary charts and
tables in this section focus on U.S.-educated NCLEX exam passers.
Additional data, including the jurisdiction of the test taker and
educational attainment of NCLEX-RN candidates, are available only
for first-time, U.S.-educated test takers. Therefore, this section also
includes tables and figures that incorporate first-time test taker
data where appropriate.
First-time and repeat U.S.-educated candidates for the NCLEX-RN
have pass rates of 87.4 percent and 54.9 percent, respectively. First-
time and repeat U.S.-educated candidates for the NCLEX-PN have
pass rates of 87.1 percent and 40.6 percent, respectively.
Source: The National Council of State Boards of Nursing, Nurse
Licensure and NCLEX Examination Statistics Publications, 2002
2012, Volumes 4, 13, 19, 20, 25, 31, 35, 42, 50, and 52, available at
https://www.ncsbn.org/1236.htm
The U.S. Nursing Workforce: Trends in Supply and Education
Registered Nurses
Resulting from concerns about nurse shortages and calls to increase enrollment, the number
of individuals pursuing nursing education has increased. Consequently, the number of nurses
passing the exam required to become licensed as a nurse more than doubled between 2001
and 2011. As Figure 18 shows, the number of individuals passing the NCLEX-RN increased
steadily over the course of the past 10 years, with particularly large increases in the middle of
the decade. Though growth slowed somewhat from 2008 on, NCLEX volumes showed year
on-year increases even throughout the recent economic downturn.
Figure 18. NCLEX-RN Passers, 2001 to 2011
107.7% Growth,
2001-2011
Year
Pass
ers
150,000
140,000
130,000
120,000
110,000
100,000
90,000
80,000
70,000
60,000
50,000 2001
68,561
2002
70,474
2003
75,821
2004
85,824
2005
98,365
2006
109,726
2007
116,045
2008
127,592
2009
134,027
2010
137,834
2011
142,390
Data Source: HRSA compilation of data from the National Council of State Boards of Nursing, Nurse Licensure and NCLEX Examination Statistics Publications, 2002-2012, and from the National Council of State Boards of Nursing, “Number of Candidates Taking the NCLEX Examination and Percent Passing, by Type of Candidate,” https://www.ncsbn.org/Table_of_Pass_Rates_2011.pdf
While data on overall growth in the nursing pipeline are critical to help inform projections
of the size of the future workforce, NCLEX data can also provide more detailed information
about licensure candidates to shed light on other key issues. A particular focus in the United
States in recent years has been on the educational attainment of new nurses.
Figure 19 depicts the growth in first-time, U.S.-educated exam candidates by bachelor’s and
non-bachelor’s degree status from 2001 to 2011. Bachelor’s prepared candidates more than
doubled, increasing by nearly 135 percent. Of the 75,824 additional individuals who sat
37

:
The U.S. Nursing Workforce: Trends in Supply and Education
for the NCLEX-RN in 2011, compared with 2001, 33,414 had obtained a bachelor’s degree
in nursing (BSN). Thus, bachelor’s prepared candidates represented about 44 percent of the
overall growth exhibited from 2001 to 2011.
Figure 19. Growth in NCLEX-RN First-Time Test Takers, by Bachelor’s and Non-Bachelor’s Degree Status, 2001 to 2011
Can
dida
tes
Growth, 2001–2011
Year
10,000
0
2001 2002 2003 2004 2005 2006 2007 2008 2009 2010 2011
Associate’s Degree:99.1%
41,567
42,382 47,415
53,275 60,044
65,392 69,903
75,541 78,666 81,60290,000 82,763
Bachelor’s Degree134.6%
80,000
70,000
60,000
50,000
40,000
30,000
20,000 24,832
25,821 26,63230,628 35,496
41,346 45,772
49,736 52,260
55,407 58,246
Bachelor’s Associate’s
Data Source: HRSA compilation of data from the National Council of State Boards of Nursing, Nurse Licensure and NCLEX Examination Statistics Publications, 2002-2012, and from the National Council of State Boards of Nursing, “Number of Candidates Taking the NCLEX Examination and Percent Passing, by Type of Candidate,” https://www.ncsbn.org/Table_of_Pass_Rates_2011.pdf
Non-bachelor’s test takers, a group consisting of diploma, associate’s degree, and special
program code NCLEX-RN candidates, grew by over 96 percent, from 43,927 in 2001 to 86,337
in 2011.
The faster growth of bachelor’s prepared candidates over the course of the past decade
caused the overall distribution of RN licensure test takers to shift slightly toward bachelor’s
prepared candidates. These candidates increased from 36.1 percent of the licensure pipeline
in 2001 to just over 40 percent in 2011 (see Figure 20). Despite this shift, the majority of first-
time candidates for RN licenses have not obtained a bachelor’s degree. Of NCLEX-RN testers,
59.7 percent are not bachelor’s prepared, and the vast majority of these individuals (95.8
percent) are educated at the associate’s degree level.
Growth,2001–2011
38

Figure 20. Total Number and Percentage of NCLEX-RN First-Time Test Takers, by Bachelor’s and Non-Bachelor’s Degree Status, 2001 vs. 2011
The U.S. Nursing Workforce: Trends in Supply and Education
160,000
140,000
120,000
100,000
80,000
60,000
40,000
20,000
0
Total Candidates :
Non-Bachelor’s Bachelor’s
2001
68,759
43,927 63.9%
24,832 36.1%
2011
Total Candidates: 144,583
86,337 59.7%
58,246 40.3%
Data Source: HRSA compilation of data from the National Council of State Boards of Nursing, Nurse Licensure and NCLEX Examination Statistics Publications, 2002-2012
Although the majority of examinees in 2011 continued to be educated at the associate’s
degree level, trends in NCLEX-RN first-time test takers across the period studied suggest that
bachelor’s prepared candidates will slowly grow to represent an increasing proportion of
test takers over time. According to the American Community Survey (ACS), approximately
44.6 percent of the nursing workforce from 2008 to 2010 held a bachelor’s degree as their
highest degree. In combination with the data above, this finding suggests that many nurses
go on to earn additional educational degrees after beginning practice.
Table 9 provides first-time NCLEX candidate data, by jurisdiction of educational institution
and degree attainment in 2010, the most recent year for which state-level data are available.
Although candidates in a state are not necessarily converted to workers in that state, recent
evidence suggests that geographic mobility among newly licensed nurses is extremely
limited.
12
12
Kovner, C., Corcoran, S., & C. Brewer. (2011). “The Relative Geographic Immobility Of New Registered Nurses Calls For New Strategies To Augment That Workforce.” Health Affairs, 30(12): 2293-2300.
Therefore, it is reasonable to assume that the majority of NCLEX candidates
associated with a state will in fact join that state’s nursing workforce after the examination.
39

The U.S. Nursing Workforce: Trends in Supply and Education40
Table 9. NCLEX-RN First-Time Test Takers, by State and Degree Type, 2010
Jurisdiction Diploma Baccalaureate Associate Degree Total Per
Capita
Alabama 0 1,328 2,067 3,395 71.0
Alaska 0 101 88 189 26.6
Arizona 0 742 2,065 2,807 43.9
Arkansas 305 557 834 1,696 58.2
California 0 3,828 7,515 11,343 30.4
Colorado 0 984 908 1,892 37.6
Connecticut 139 655 506 1,300 36.4
Delaware 21 207 254 482 53.7
District of Columbia 0 224 83 307 51.0
Florida 0 2,211 5,350 7,561 40.2
Georgia 0 1,489 1,476 2,965 30.6
Hawaii 0 410 159 569 41.8
Idaho 0 145 481 626 39.9
Illinois 19 2,410 3,015 5,444 42.4
Indiana 44 1,709 2,328 4,081 62.9
Iowa 0 649 1,421 2,070 68.0
Kansas 0 743 1,116 1,859 65.2
Kentucky 0 853 1,879 2,732 63.0
Louisiana 37 1,317 917 2,271 50.1
Maine 0 355 308 663 49.9
Maryland 0 937 1,423 2,360 40.9
Massachusetts 66 1,779 1,486 3,331 50.9
Michigan 0 2,031 2,882 4,913 49.7
Minnesota 0 1,030 1,898 2,928 55.2
Mississippi 0 437 1,280 1,717 57.9
Missouri 63 1,831 1,517 3,411 57.0
Montana 0 215 181 396 40.0
The U.S. Nursing Workforce: Trends in Supply and Education 41
Table 9. NCLEX-RN First-Time Test Takers, by State and Degree Type, 2010 (cont’d)
Jurisdiction Diploma Baccalaureate Associate Degree Total Per
Capita
Nebraska 0 783 387 1,170 64.1
Nevada 0 402 406 808 29.9
New Hampshire 0 211 438 649 49.3
New Jersey 701 995 1,238 2,934 33.4
New Mexico 0 275 726 1,001 48.6
New York 14 2,975 6,696 9,685 50.0
North Carolina 148 1,308 2,496 3,952 41.4
North Dakota 0 367 85 452 67.2
Ohio 319 2,868 4,719 7,906 68.5
Oklahoma 0 968 1,313 2,281 60.8
Oregon 0 686 622 1,308 34.1
Pennsylvania 1,288 2,965 2,891 7,144 56.2
Rhode Island 32 316 207 555 52.7
South Carolina 0 844 1,350 2,194 47.4
South Dakota 0 344 363 707 86.8
Tennessee 0 1,660 1,399 3,059 48.2
Texas 144 3,547 5,392 9,083 36.1
Utah 0 366 1,094 1,460 52.8
Vermont 0 102 208 310 49.5
Virginia 428 1,243 1,874 3,545 44.3
Washington 0 794 1,692 2,486 37.0
West Virginia 0 665 564 1,229 66.3
Wisconsin 0 1,455 1,679 3,134 55.1
Wyoming 0 74 279 353 62.6
Total 3,768 55,390 81,555 140,713 45.6
Data Source: HRSA compilation of data from the National Council of State Boards of Nursing, Nurse Licensure and NCLEX Examination Statistics Publications, 2012 Note: Total excludes NCLEX-RN candidates from the American Samoa, Guam, Northern Mariana Islands, and the Virgin Islands, which accounted for 64 first-time test takers in 2010. Total also excludes 105 Special Program Code candidates. Per capita figures for the country are based on the sum of the total graduates and the sum of the individual state populations.
The U.S. Nursing Workforce: Trends in Supply and Education
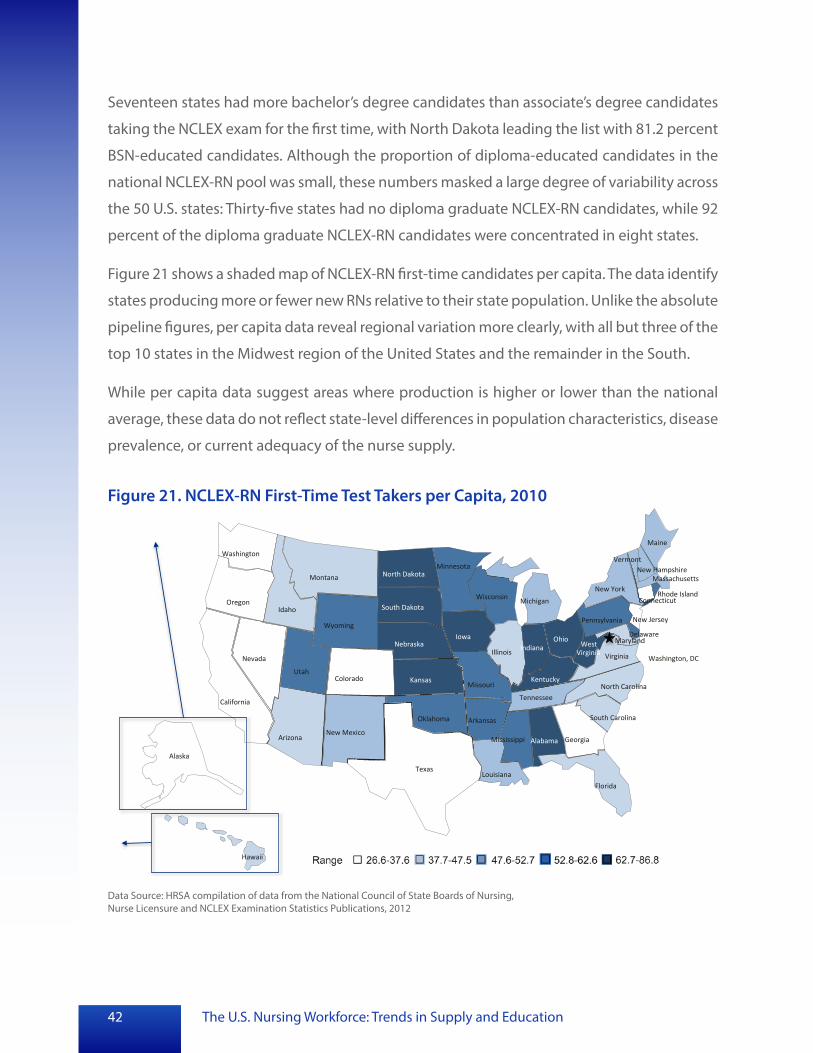
Seventeen states had more bachelor’s degree candidates than associate’s degree candidates
taking the NCLEX exam for the first time, with North Dakota leading the list with 81.2 percent
BSN-educated candidates. Although the proportion of diploma-educated candidates in the
national NCLEX-RN pool was small, these numbers masked a large degree of variability across
the 50 U.S. states: Thirty-five states had no diploma graduate NCLEX-RN candidates, while 92
percent of the diploma graduate NCLEX-RN candidates were concentrated in eight states.
Figure 21 shows a shaded map of NCLEX-RN first-time candidates per capita. The data identify
states producing more or fewer new RNs relative to their state population. Unlike the absolute
pipeline figures, per capita data reveal regional variation more clearly, with all but three of the
top 10 states in the Midwest region of the United States and the remainder in the South.
While per capita data suggest areas where production is higher or lower than the national
average, these data do not reflect state-level differences in population characteristics, disease
prevalence, or current adequacy of the nurse supply.
Figure 21. NCLEX-RN First-Time Test Takers per Capita, 2010
Washington
Oregon
California
Nevada
Idaho
Montana
Wyoming
Colorado Utah
New Mexico Arizona
Texas
Oklahoma
Kansas
Nebraska
South Dakota
North Dakota Minnesota
Wisconsin
Illinois
Iowa
Missouri
Arkansas
Louisiana
Alabama
Tennessee
Michigan
Pennsylvania
New York
Vermont
Georgia
Florida
Mississippi
Kentucky
South Carolina
North Carolina
Maryland Ohio Delaware
Indiana West Virginia
New Jersey
Connecticut
Massachusetts
Maine
Rhode Island
Virginia
New Hampshire
Alaska
Hawaii
Washington, DC
Data Source: HRSA compilation of data from the National Council of State Boards of Nursing, Nurse Licensure and NCLEX Examination Statistics Publications, 2012
42

The U.S. Nursing Workforce: Trends in Supply and Education
Licensed Practical Nurses
As shown in Figure 22, the LPN pipeline, defined here as the number of individuals passing
the NCLEX-PN, has grown substantially across the past decade. From 2001 to 2011, the
pipeline grew from 33,448 to 60,302, an 80-percent increase. Although growth was generally
consistent across the period studied, the growth rate declined slightly from 2007 to 2009. In
addition, there was a surprising decrease in the number of individuals passing the NCLEX
from 2010 to 2011. This finding is at least partly attributable to lower pass rates across NCLEX
candidates, as well as to a decrease in the number of first-time exam takers.
Figure 22. NCLEX-PN Passers, 2001 to 2011
80.3%80.3%GroGrowtwthh80.3% Growth
Year
Passers
70,000
65,000
60,000
55,000
50,000
45,000
40,000
35,000
30,000
25,000 2001
33,448
2002
36,662
2003
42,723
2004
48,155
2005
51,136
2006
54,464
2007
57,450
2008
58,209
2009
60,548
2010
63,777
2011
60,302
Data Source: HRSA compilation of data from the National Council of State Boards of Nursing, Nurse Licensure and NCLEX Examination Statistics Publications, 2002-2012
Table 10 displays NCLEX-PN first-time candidates, by state, for 2010, as well as the number
of candidates per capita, while Figure 23 examines the link between state population and
per capita LPN candidates graphically to highlight regional trends. With the single exception
of New Jersey, the top 10 states for the per capita LPN pipeline, which include Ohio, Iowa,
Delaware, Arkansas, Kansas, Oklahoma, New Jersey, Minnesota, Virginia, and Louisiana, are all
found in the Midwest and the South. Coastal states, including those in the Northeast and the
Pacific, are generally evenly distributed across the per capita rank list.
43

The U.S. Nursing Workforce: Trends in Supply and Education44
Table 10. NCLEX-PN First-Time Test Takers, by State, 2010 State Candidates Candidates per Capita
Alabama 863 18.1
Alaska 19 2.7
Arizona 539 8.4
Arkansas 1,163 39.9
California 8,865 23.8
Colorado 463 9.2
Connecticut 936 26.2
Delaware 376 41.9
District of Columbia 533 88.6
Florida 4,155 22.1
Georgia 1,407 14.5
Hawaii 138 10.1
Idaho 267 17.0
Illinois 1,964 15.3
Indiana 1,453 22.4
Iowa 1,365 44.8
Kansas 990 34.7
Kentucky 1,147 26.4
Louisiana 1,354 29.9
Maine 106 8.0
Maryland 285 4.9
Massachusetts 864 13.2
Michigan 1,444 14.6
Minnesota 1,631 30.8
Mississippi 823 27.7
Missouri 1,408 23.5
Montana 131 13.2
Nebraska 472 25.8

The U.S. Nursing Workforce: Trends in Supply and Education 45
Table 10. NCLEX-PN First-Time Test Takers, by State, 2010 (cont’d) State Candidates Candidates per Capita
Nevada 45 1.7
New Hampshire 284 21.6
New Jersey 2,935 33.4
New Mexico 188 9.1
New York 3,586 18.5
North Carolina 1,066 11.2
North Dakota 166 24.7
Ohio 5,226 45.3
Oklahoma 1,255 33.5
Oregon 419 10.9
Pennsylvania 2,343 18.4
Rhode Island 48 4.6
South Carolina 611 13.2
South Dakota 199 24.4
Tennessee 1,706 26.9
Texas 5,629 22.4
Utah 591 21.4
Vermont 168 26.8
Virginia 2,410 30.1
Washington 1,037 15.4
West Virginia 492 26.6
Wisconsin 1,051 18.5
Wyoming 118 20.9
Total 66,734 21.6
Data Source: HRSA compilation of data from the National Council of State Boards of Nursing, Nurse Licensure and NCLEX Examination Statistics Publications, 2012 Note: Total excludes NCLEX-PN candidates from the American Samoa, Guam, Northern Mariana Islands, and the Virgin Islands, which accounted for 76 first-time test takers in 2010.
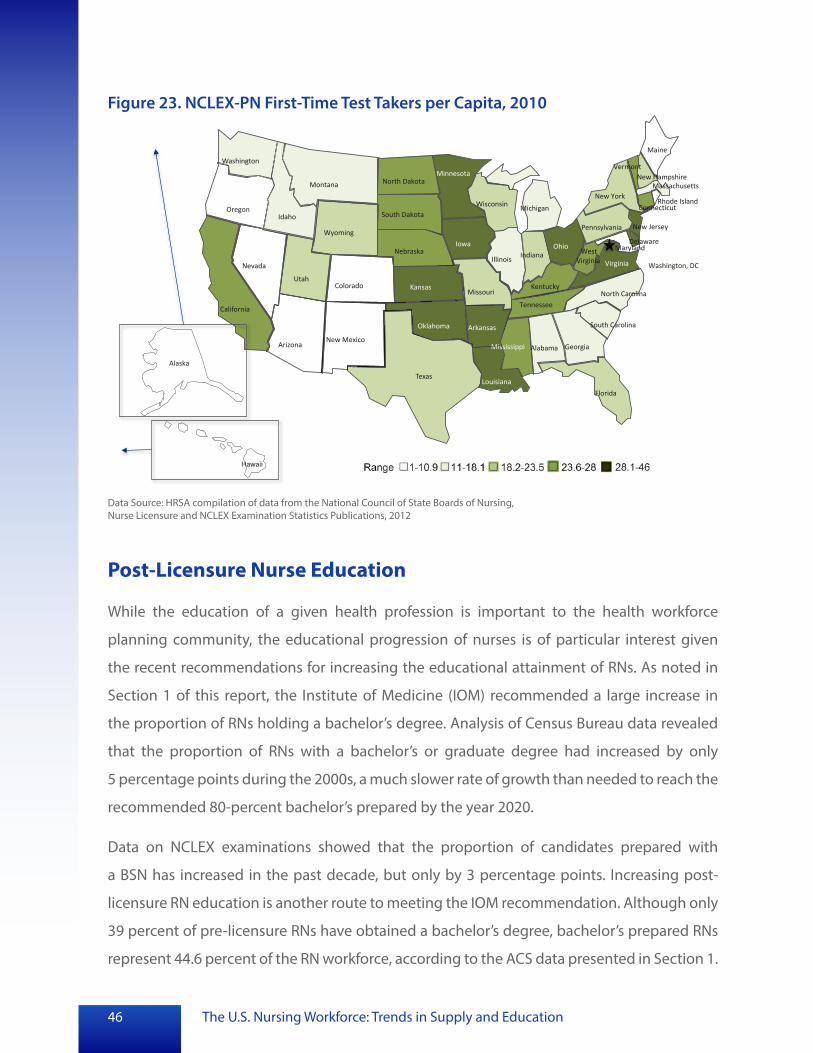
The U.S. Nursing Workforce: Trends in Supply and Education
Figure 23. NCLEX-PN First-Time Test Takers per Capita, 2010
Washington
Oregon
California
Nevada
Idaho
Montana
Wyoming
Colorado Utah
New Mexico Arizona
Texas
Oklahoma
Kansas
Nebraska
South Dakota
North Dakota Minnesota
Wisconsin
Illinois
Iowa
Missouri
Arkansas
Louisiana
Alabama
Tennessee
Michigan
Pennsylvania
New York
Vermont
Georgia
Florida
Mississippi
Kentucky
South Carolina
North Carolina
Maryland Ohio Delaware
Indiana West Virginia
New Jersey
Connecticut
Massachusetts
Maine
Rhode Island
Virginia
New Hampshire
Alaska
Hawaii
Washington, DC
Data Source: HRSA compilation of data from the National Council of State Boards of Nursing, Nurse Licensure and NCLEX Examination Statistics Publications, 2012
Post-Licensure Nurse Education
While the education of a given health profession is important to the health workforce
planning community, the educational progression of nurses is of particular interest given
the recent recommendations for increasing the educational attainment of RNs. As noted in
Section 1 of this report, the Institute of Medicine (IOM) recommended a large increase in
the proportion of RNs holding a bachelor’s degree. Analysis of Census Bureau data revealed
that the proportion of RNs with a bachelor’s or graduate degree had increased by only
5 percentage points during the 2000s, a much slower rate of growth than needed to reach the
recommended 80-percent bachelor’s prepared by the year 2020.
Data on NCLEX examinations showed that the proportion of candidates prepared with
a BSN has increased in the past decade, but only by 3 percentage points. Increasing post
licensure RN education is another route to meeting the IOM recommendation. Although only
39 percent of pre-licensure RNs have obtained a bachelor’s degree, bachelor’s prepared RNs
represent 44.6 percent of the RN workforce, according to the ACS data presented in Section 1.
46

The U.S. Nursing Workforce: Trends in Supply and Education 47
This finding suggests that an important minority of bachelor’s prepared RNs received
their bachelor’s degree after initial licensure. Educational data tracking the annual number
of post-licensure graduates can help inform projections of the future composition of the
RN workforce.
Several nursing organizations collect data on nursing program enrollments and graduations.
The American Association of Colleges of Nursing (AACN) is a national association
representing bachelor’s and graduate nursing education at over 600 public and private
universities and colleges. AACN conducts an annual survey of member and non-member
universities and publishes the most current statistics available on student enrollment and
graduations. Subsequent figures in this section explore data on post-licensure BSN, master’s,
and doctoral graduates.
About the Data
AACN annually distributes surveys requesting graduation numbers
from bachelor’s and higher-degree nursing education programs.
This section explores results from the 2007 to 2011 surveys, which
produced data for the scholastic years 2006 to 2007 through 2010
to 2011.
The 2011 to 2012 survey, which captured graduation data for the
2010 to 2011 scholastic year, was distributed to 838 institutions
in September 2011 and achieved a response rate of 87.5 percent.
The number of surveys distributed by AACN and the response rate
achieved on these surveys vary annually.
Source: Fang, D., Li, Y., & Bednash, G. D. (2012). 2011-2012 Enrollment
and Graduations in Baccalaureate and Graduate Programs in
Nursing. Washington, DC: American Association of Colleges of
Nursing; additional data provided upon request from AACN
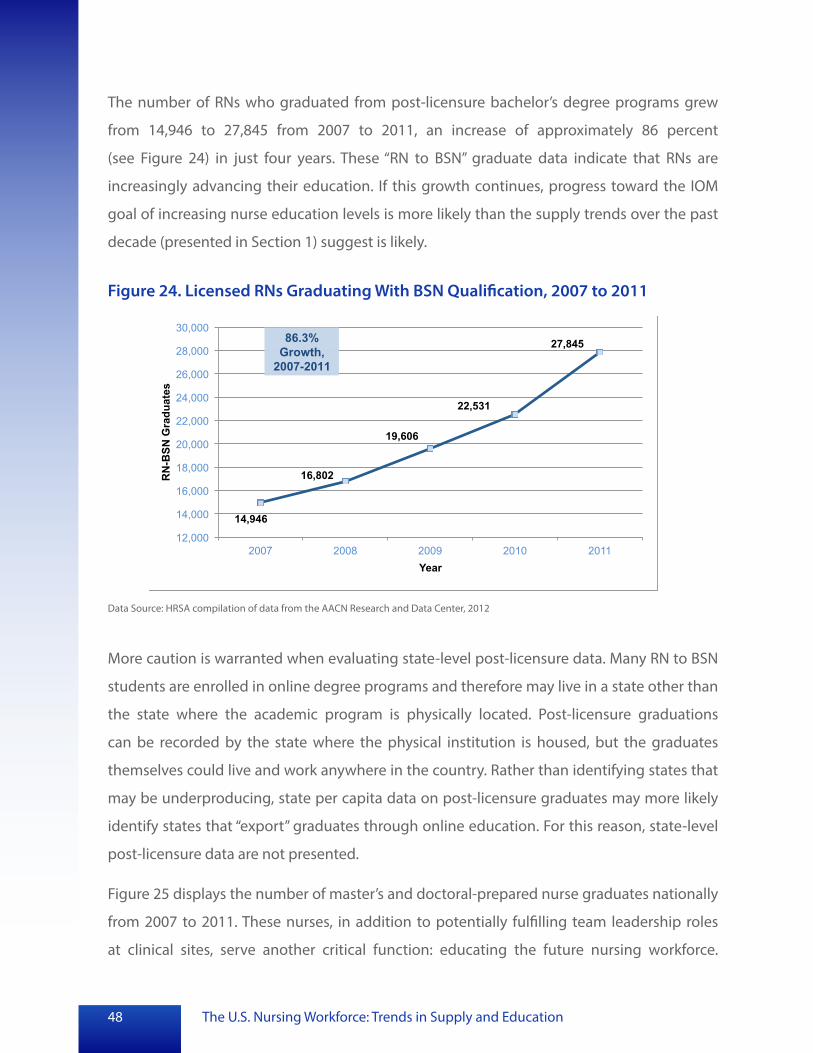
The number of RNs who graduated from post-licensure bachelor’s degree programs grew
from 14,946 to 27,845 from 2007 to 2011, an increase of approximately 86 percent
(see Figure 24) in just four years. These “RN to BSN” graduate data indicate that RNs are
increasingly advancing their education. If this growth continues, progress toward the IOM
goal of increasing nurse education levels is more likely than the supply trends over the past
decade (presented in Section 1) suggest is likely.
Figure 24. Licensed RNs Graduating With BSN Qualification, 2007 to 2011
The U.S. Nursing Workforce: Trends in Supply and Education48
86.3% Growth,
2007-2011
Year
RN
-BSN
Gra
duat
es
12,000
14,000
16,000
18,000
20,000
22,000
24,000
26,000
28,000
30,000
2007
14,946
2008
16,802
2009
19,606
2010
22,531
2011
27,845
Data Source: HRSA compilation of data from the AACN Research and Data Center, 2012
More caution is warranted when evaluating state-level post-licensure data. Many RN to BSN
students are enrolled in online degree programs and therefore may live in a state other than
the state where the academic program is physically located. Post-licensure graduations
can be recorded by the state where the physical institution is housed, but the graduates
themselves could live and work anywhere in the country. Rather than identifying states that
may be underproducing, state per capita data on post-licensure graduates may more likely
identify states that “export” graduates through online education. For this reason, state-level
post-licensure data are not presented.
Figure 25 displays the number of master’s and doctoral-prepared nurse graduates nationally
from 2007 to 2011. These nurses, in addition to potentially fulfilling team leadership roles
at clinical sites, serve another critical function: educating the future nursing workforce.

The U.S. Nursing Workforce: Trends in Supply and Education 49
The annual output of master’s graduates has increased by about 60 percent, while the
production of doctoral graduates has more than tripled, over the past four years. In total, the
annual number of nursing graduate degrees awarded has grown 67.4 percent.
Figure 25. Master’s and Doctoral Graduates, 2007 to 2011
2007 2008 2009 2010 2011
Master's Graduates
15,182 17,247
19,063
21,730 24,311
Doctoral graduates
653 916
1,227
1,815 2,196
Data Source: HRSA compilation of data from the AACN Research and Data Center, 2012
While the growth over the course of the past four years is impressive, anecdotal and survey
evidence indicates that nurse faculty shortages are a longstanding concern. In AACN’s most
recent survey, the national faculty vacancy rate was estimated at 7.6 percent. Therefore, almost
two-thirds of the nursing schools reported faculty vacancies as a reason for not accepting all
qualified applicants into the entry-level bachelor’s programs.
13
13
See http://www.aacn.nche.edu/media-relations/FacultyShortageFS.pdf.
Advanced Clinical Roles of Special Interest
Advanced Practice Registered Nurses (APRNs), nurses who are educated at the master’s
or doctoral level, are of particular interest to the workforce planning community in the
United States. APRNs are important providers of health care and are increasingly considered
as the country faces a growing and aging population and an expansion of health insurance
coverage. Both of these factors will cause increased demand for health care services,
particularly primary care.
25,000 5,000
Master’s Graduates 18,750
12,500
6,250
3,750
2,500
1,250 Doctoral Graduates
0 0

Nurse Practitioners (NPs) practice in primary care and acute care settings. NPs provide
initial, ongoing, and comprehensive care for patients, including assessment, diagnosis,
treatment, and management of patients with acute and chronic illnesses. While the degree
of independence or supervision required by a licensed (physician) provider for the NP to
practice varies with state law, NPs are widely considered a critical component of the patient
care workforce.
Figure 26 shows substantial growth in the production of NPs from 2001 to 2011. In 11 years,
the number of NP graduates grew from 7,261 to 12,273, a growth of approximately 69 percent.
Figure 26. Nurse Practitioner Graduates, 2001 to 2011
The U.S. Nursing Workforce: Trends in Supply and Education
69.0% Growth,
2001–2011
Year
NP G
radu
ates
5,500
6,500
7,500
8,500
9,500
10,500
11,500
12,500
13,500
2001
7,261
2002
6,979
2003
6,611
2004
6,526
2005
6,900
2006
7,583
2007
8,014
2008
8,865
2009
9,698
2010
11,135
2011
12,273
Data Source: HRSA compilation of data from the AACN Annual Survey (in collaboration with the National Organization of Nurse Practitioner Faculties for collection of nurse practitioner data) Note: Counts include master’s and post-master’s degree NP and NP/Clinical Nurse Specialist graduates as well as Bachelor’s-to-Doctorate of Nursing Practice graduates.
Certified registered nurse anesthetists practice in many settings, including academic medical
centers, community hospitals, outpatient surgery centers, pain clinics, or physician offices.
Similar to the NP, the degree of independence or supervision needed by a licensed provider
(physician, dentist, or podiatrist) for the nurse anesthetist to practice varies with state law.
Over the past 10 years, the number of nurse anesthetist graduates has increased substantially,
rising from 1,159 graduates in 2001 to 2,447 graduates in 2011 (see Figure 27).
50

The U.S. Nursing Workforce: Trends in Supply and Education
Figure 27. Nurse Anesthetist Graduates, 2001 to 2011
2,500
2,000
1,500
3,000
111.1% Growth,
2001-2011
Year
Nur
se A
nest
hetis
t Gra
duat
es
1,000
500 2001
1,159
2002
1,333
2003
1,474
2004
1,628
2005
1,709
2006
1,900
2007
1,995
2008
2,158
2009
2,231
2010
2,375
2011
2,447
Data Source: National Board of Certification and Recertification for Nurse Anesthetists
About the Data
Data on new-entrant certified registered nurse anesthetists
and certified nurse midwives were obtained from the American
Association of Nurse Anesthetists (AANA) and the American
Midwifery Certification Board (AMCB), respectively. Some certified
registered nurse anesthetists and certified nurse midwives are
educated outside of schools of nursing and are not captured in the
AACN annual survey. As a result, AACN data may underestimate the
total number of new-entrant certified registered nurse anesthetists
and certified nurse midwives.
The AANA provided data on certified registered nurse anesthetist
graduates on request. Information on the number of newly certified
nurse midwives was obtained from AMCB annual reports, available at:
http://www.amcbmidwife.org/c/104/about-us.
51

The U.S. Nursing Workforce: Trends in Supply and Education52
Certified nurse midwives play an important role in women’s health care throughout the
lifespan, providing gynecologic and perinatal care as well as other primary care services.
Nurse midwives work in a variety of settings, including private offices, the offices of other
health care practitioners, birth centers, hospitals, and public health.
Over the past 10 years, the number of newly certified nurse midwives has fluctuated. It
declined through the early 2000s, but has rebounded in the last four years. Their number has
grown from 285 newly certified nurse midwives in 2007 to nearly 400 in 2011 (see Figure 28).
Figure 28. Newly Certified Nurse Midwives, 2001 to 2011
150
250
350
450
550
650
New
ly C
ertif
ied
Nur
se M
idw
ives
2001
422
2002
400
2003
335
2004
341
2005
293
2006
291
2007
285
2008
318
2009
323
2010
339
2011
392
Data Source: HRSA compilation of data from the AMCB, 2010 and 2011 Annual Reports
The U.S. Nursing Pipeline and Internationally Educated Nurses
Internationally educated nurses are another source of pipeline for the U.S. nursing workforce,
especially in times of shortage in domestic supply. Health workforce migration, a critical
issue for many years, has received increased attention recently as a result of the 2010 World
Health Organization Global Code of Practice on the International Recruitment of Health
Personnel (“Global Code”). The Global Code represents an effort to promote ethical principles
in the recruitment of international health personnel, with a particular focus on minimizing

The U.S. Nursing Workforce: Trends in Supply and Education 53
recruitment from countries experiencing critical shortages. Because nurse migration is a topic
of interest to nursing workforce stakeholders in the United States, this section explores recent
trends in internationally educated RN and LPN licensure candidates.
Identifying data sources to track the migration of internationally educated nurses into
the United States is a challenge. Although some nurses may apply for visas based on their
professional status as health care workers, others may enter on a spousal visa or other
dependent visa, making professional visa data incomplete. Regardless of how a nurse enters
the United States, however, (s)he must pass the appropriate NCLEX exam in order to be
eligible for a state license (and thus, to work as a nurse). As such, the following information
explores trends in internationally educated nurses who pass the appropriate NCLEX exam.
About the Data
An individual may take the NCLEX exam at a U.S. testing facility or at one
of the international testing sites. International testing sites are located in
Australia, Canada, England, Germany, Hong Kong, India, Japan, Mexico,
the Philippines, Puerto Rico, and Taiwan. Those who seek to enter the
United States on the basis of their professional status as a nurse will take
the NCLEX exam prior to migrating. Others may enter the country using a
different type of visa and test after their entry to the United States.
NCLEX exam data are one indicator of the overall level of interest in
migrating to the United States. However, it is important to note that
these data cannot differentiate those nurses who ultimately migrated
from the pool of nurses who were exploring the possibility. These data
therefore represent the upper limit of the number that could become
licensed in the United States. They also are intended to serve only as a
relative gauge for the outcome of a critical checkpoint in the process
of an internationally educated nurse’s journey to U.S. licensure.

The U.S. Nursing Workforce: Trends in Supply and Education54
The number of internationally educated NCLEX-RN passers fluctuated significantly over the
past decade (see Figure 29). Steady increases in the earlier part of the decade were followed
by a substantial decrease after 2007, immediately following the economic recession. U.S
educated NCLEX-RN candidates, on the other hand, experienced steady and sustained
growth from 2001 to 2010, more than doubling their numbers by the end of the decade (as
shown in Figure 18). These data suggest that the in-migration of internationally educated
nurses may be sensitive to the effects of the macro-economic climate as well as the domestic
production of nurses. There are likely to be fewer U.S. job opportunities for internationally
educated nurses as a result of the doubling of domestic production over the past decade.
Figure 29. Internationally Educated Nurses Passing the NCLEX-RN, 2001 to 2011
Year
Passing Candidates
0
5,000
10,000
15,000
20,000
25,000
2001
6,682
2002
10,152
2003
12,870
2004
14,954
2005
14,760
2006
20,942
2007
22,879
2008
18,935
2009
13,808
2010
8,880
2011
6,108
Data Source: HRSA compilation of data from the National Council of State Boards of Nursing, Nurse Licensure and NCLEX Examination Statistics Publications, 2012
Figure 30 displays the top five countries of education for NCLEX-RN passers in 2010 and the
number of individuals passing the exam from each country. With 5,188 individuals passing
the NCLEX-RN, the Philippines contributed by far the highest number of individuals to the
U.S. pipeline of internationally educated nurses in 2010—almost seven times that of South
Korea, which ranked at number two.

The U.S. Nursing Workforce: Trends in Supply and Education
Figure 30. Internationally Educated Nurses Passing the NCLEX-RN, by Country, 2010
Country
Pass
ing
Can
dida
tes
PHILIPPINES
6,000
5,000
4,000
3,000
2,000
1,000
0
5,188
SOUTH KOREA
750
INDIA
640
CANADA
425
NIGERIA
166
Data Source: HRSA compilation of data from the National Council of State Boards of Nursing, data provided upon request
In contrast to both internationally educated RNs and domestic LPNs, the international
pipeline of LPNs experienced a net decline across the past decade (see Figure 31). Unlike
internationally educated RNs, which showed steady growth across the early portion of the
decade before declining in 2007, the internationally educated LPN pipeline experienced a
second period of decline in the earlier part of the decade followed by a brief resurgence in
2006. Like internationally educated RNs, international LPN supply declined from 2007 onward.
The volume of internationally educated LPNs sitting for and passing the NCLEX was, across
the time period as a whole, dramatically lower than the number of RNs.
Figure 32 displays the top five countries of education for NCLEX-PN passers in 2010 and
the number of individuals passing the exam from each country. As with the NCLEX-RN,
the Philippines contributed by far the highest number of individuals to the pipeline of
internationally educated LPNs in 2010.
55

Figure 31. Internationally Educated Nurses Passing the NCLEX-PN, 2001 to 2011
The U.S. Nursing Workforce: Trends in Supply and Education
Year
Pass
ing
Can
dida
tes
2,000
1,800
1,600
1,400
1,200
1,000
800
600
400
200
0 2001
1,097
2002
1,434
2003
1,717
2004
1,515
2005
1,276
2006
1,379
2007
1,270
2008
1,073
2009
836
2010
655
2011
507
Data Source: HRSA compilation of data from the National Council of State Boards of Nursing, Nurse Licensure and NCLEX Examination Statistics Publications, 2012
Figure 32. Internationally Educated Nurses Passing the NCLEX-PN, by Country, 2010
PHILIPPINES
400
350
300
250
200
150
100
50
0
348
INDIA
61
CANADA
38
CUBA
31
NIGERIA
26
Data Source: HRSA compilation of data from the National Council of State Boards of Nursing, data provided upon request
56

The U.S. Nursing Workforce: Trends in Supply and Education 57
