the us – peru fta: impact and perspectivesclai/perufta2008/us-peru fta (paz-soldan).pdf · the us...
TRANSCRIPT

DTB Associates, LLP
The US – Peru FTA: Impact and PerspectivesThe George Washington University
Elliott School of International Affairs
October 30, 2008
Mateo Paz Soldán, Attorney-at-Law

Peru at a Glance (2007)Population: 29.2 million.GNP: $82 billion.Annual GNI per Capita (PPP): $7,240Inflation Rate (Consumer Prices): 3.5%Total Exports: $27.5 billion.Total Imports: $20.4 billion.Exports to US: $5.2 billion. Imports from US: $4.1 billion.US-Peru TPA: 80% of US exports of consumer and industrial products and 67% of US farm exports will become duty-free immediately.
DTB Associates, LLP
Source: CIA (The World Factbook) and The World Bank
The US – Peru FTA: Impact and Perspectives
Historic events leading to US-Peru FTA
Overall US-Peru Trade
Case Studies on Future Impacts of FTA--Asparagus IndustryTextile and Apparel Industry

“Negative” Events Leading to FTA
70s and 80s experimentation with leftist, statist, and populist growth strategies, which largely failed in spurring growth and reducing poverty:
1968-1975 Velasco regime land reform, nationalization of major industries, inefficient import substitution policies.
1985-1990 1st Garcia govt confrontation with financial lending institutions over debt payments, policies leading to hyperinflation, effort at nationalization of banks.
Concurrently, Peru dealt with extremist Shining Path and Tupac Amaru guerrillas which were at their peak in late 80’s and early 90’s.
Globally: fall of the Berlin Wall and collapse of the Soviet Union.
DTB Associates, LLP

“Positive” Events Leading to FTA
Passage of NAFTA in 1993 and the success of the Chilean export-led growth model.In the 90s economic liberalization and privatizations under Fujimori regime. Success of the ATPA program in creating export dependent industries and generating jobs starting in 1991.Need of Peruvian industries to secure access to key markets in an increasingly competitive global marketplace.
DTB Associates, LLP
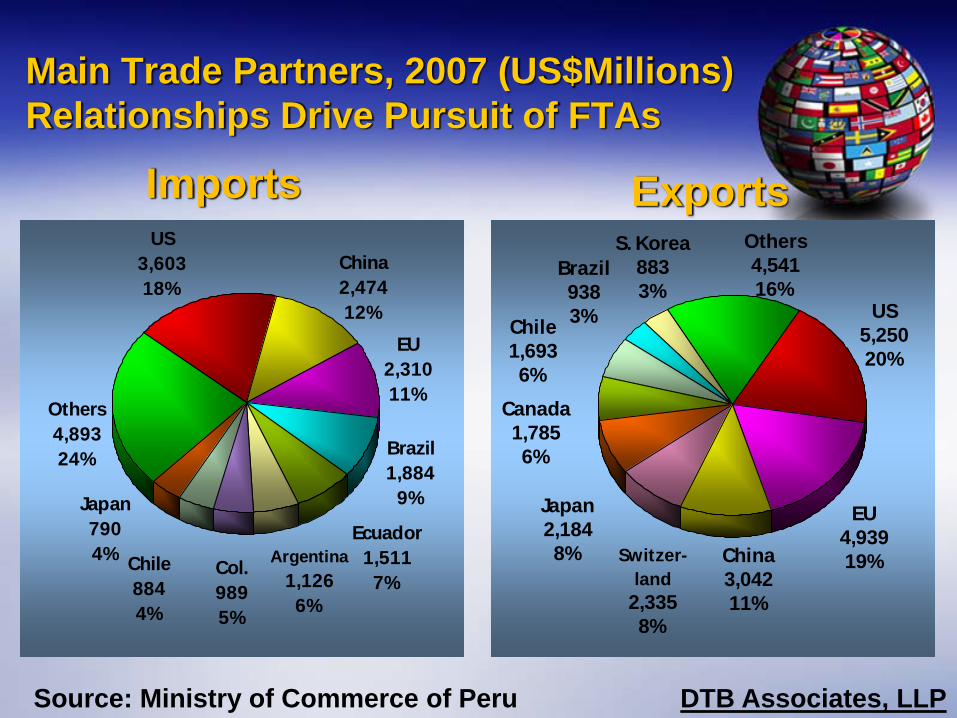
Main Trade Partners, 2007 (US$Millions) Relationships Drive Pursuit of FTAs
EU2,31011%
Others4,89324%
Col.9895%
Chile8844%
Japan7904% Argentina
1,1266%
Ecuador1,5117%
Brazil1,884
9%
China2,47412%
US3,60318%
US5,25020%
EU4,93919%
Brazil9383%Chile
1,6936%
Canada1,7856%
Japan2,1848% Switzer-
land2,3358%
China3,04211%
S. Korea8833%
Others4,54116%
DTB Associates, LLP
Imports Exports
Source: Ministry of Commerce of Peru

Peru’s Growing Web of Trade Relationships
Multilateral: WTO Doha Round.Regional: APEC, LAIA (ALADI), Andean Community.Bilateral:
FTAs with USA, Singapore, and Canada. Economic complementation agreements (ACE) with Chile, Mexico, and Mercosur.Pending: E.U., EFTA, China, Thailand, Chile, and Mexico (the latter two ACEs are being expanded). Peruvian proposal for APEC FTA?
Objectives 1) diversification of markets; 2) become a hub for Asian economies in South America; 3) a window for Brazilian trade with Asia-Pacific region.
DTB Associates, LLP

US-Peru Trade
DTB Associates, LLP

Peru’s Exports to World, 2006Traditional Exports = 78%. A Need to Diversify.
62%8%
6%
2%
7%
5%7%3%
Mining
Petroleum
Fishing
Agric. Trad
Tex/Apparel
Agric. Non-Trad.Metallurgic
Others
Source: SUNAT and Central Bank of Peru DTB Associates, LLP

US Exports to Peru, 2007 (US $Thousands)
1,064,92026%
366,5659%
232,1126%
183,1684%
160,7714%
128,1703%
113,6493%
90,8852%
408,84010%
503,80612%
866,64521%
84 - Nuclear Reactors and Machinery 27 - Mineral Fuel39 - Plastics and Articles 85 Electric Machinery and Equipment10 - Cereals 87 - Vehicles and Parts29 - Organic Chemicals 90 Optic, Photo and Medical Instruments98 Special Classification Provisions 52 - Cotton, Yarn and FabricOther
DTB Associates, LLPSource: US Department of Commerce

Total US Exports to and Imports from Peru (US$ Thousands) Since 2002
0
1,000,000
2,000,000
3,000,000
4,000,000
5,000,000
6,000,000
2002 2003 2004 2005 2006 2007
Exports Imports
DTB Associates, LLPSource: US Department of Commerce

Total US Imports from ATPDEA Countries (US$ Millions)
0
2,000
4,000
6,000
8,000
10,000
2002 2003 2004 2005 2006 2007
Bolivia Ecuador Peru Colombia
Source: US Department of Commerce DTB Associates, LLP

Total US Exports to ATPDEA Countries (US$ Millions)
01,0002,0003,0004,0005,0006,0007,0008,0009,000
2002 2003 2004 2005 2006 2007
Bolivia Ecuador Peru Colombia
DTB Associates, LLPSource: US Department of Commerce

The Case of the Peruvian Asparagus Industry
DTB Associates, LLP

Peru’s Asparagus IndustryOverview
Peru is the world’s top exporter of asparagus.Asparagus is Peru’s first agricultural export.In 2007 asparagus exports to US totaled $194 million.US-Peru FTA, will grant permanent duty free status to Peruvian asparagus and to 99% of total exports.
DTB Associates, LLP

Development of the AsparagusIndustry in Peru
50’s to 80’s:Industry began in northern Peru with white asparagus cultivated for canned products.In the late 80’s, green fresh asparagus was developed in the south with USAID support.Concurrently, the frozen asparagus industry developed and Spanish investment in the south led to the development of canned/jarred asparagus.
90’s:Growth spurred by ATPA in 1991.Heavy investment from U.S. and E.U.Approx. 24,000 hectares cultivated.
DTB Associates, LLP

Competitiveness: Peru has the World’sSecond Highest Productivity (2007)
6254800
283473 92900 62000 50620 36000 33093 29000 22500 22000
50,002
118,114
49,94641,333
32,742 37,894
61,92546,400
145,161
50,000
0
1,000,000
2,000,000
3,000,000
4,000,000
5,000,000
6,000,000
7,000,000
China
Peru
German
y
Mexico U.S.
Spain Ita
ly
Japan
Philip
pines
Chile
0
20,000
40,000
60,000
80,000
100,000
120,000
140,000
160,000
Production (MT) Yield (hectogram/ha)
Source: FAOSTAT DTB Associates, LLP

Benefits for Peru• 60,000 jobs (60% are held by
women).• From 2000-04 investments of
$100 million.• Industry is driving
infrastructure development and adoption of global business practices.
• Multiplier Effect: model for new industries--mangoes, paprika, peppers, onions.
• Total of 600,000 jobs in agroexport sector.
DTB Associates, LLP

U.S. Fresh Asparagus Imports by Major Country (US$ Thousands)* HTS 0709201, 0709209
0
50,000
100,000
150,000
200,000
250,000
300,000
1990
1991
1992
1993
1994
1995
1996
1997
1998
1999
2000
2001
2002
2003
2004
2005
2006
2007
Peru Mexico Canada Colombia Chile
Source: USDA DTB Associates, LLP

U.S. Canned Asparagus Imports from the World (US $Thousands)* HTS 200560
0
5,000
10,000
15,000
20,000
25,000
30,000
1990
1991
1992
1993
1994
1995
1996
1997
1998
1999
2000
2001
2002
2003
2004
2005
2006
2007
Peru China, Rep. of Spain New Zealand
Source: USDA DTB Associates, LLP

US Frozen Asparagus Imports by Country (US $ Thousands)* HTS 0710809510, 0710809710
0
2,000
4,000
6,000
8,000
10,000
12,000
1990
1991
1992
1993
1994
1995
1996
1997
1998
1999
2000
2001
2002
2003
2004
2005
2006
2007
Peru China, Rep of Chile Mexico
DTB Associates, LLPSource: USDA

Top World Producers of Asparagus(Hectares)The FTA will help secure the US market.
0
1,000,000
2,000,000
3,000,000
4,000,000
5,000,000
6,000,000
7,000,000
1997 1998 1999 2000 2001 2002 2003 2004 2005 2006 2007
China Peru Germany Mexico US
Source: FAOSTAT DTB Associates, LLP
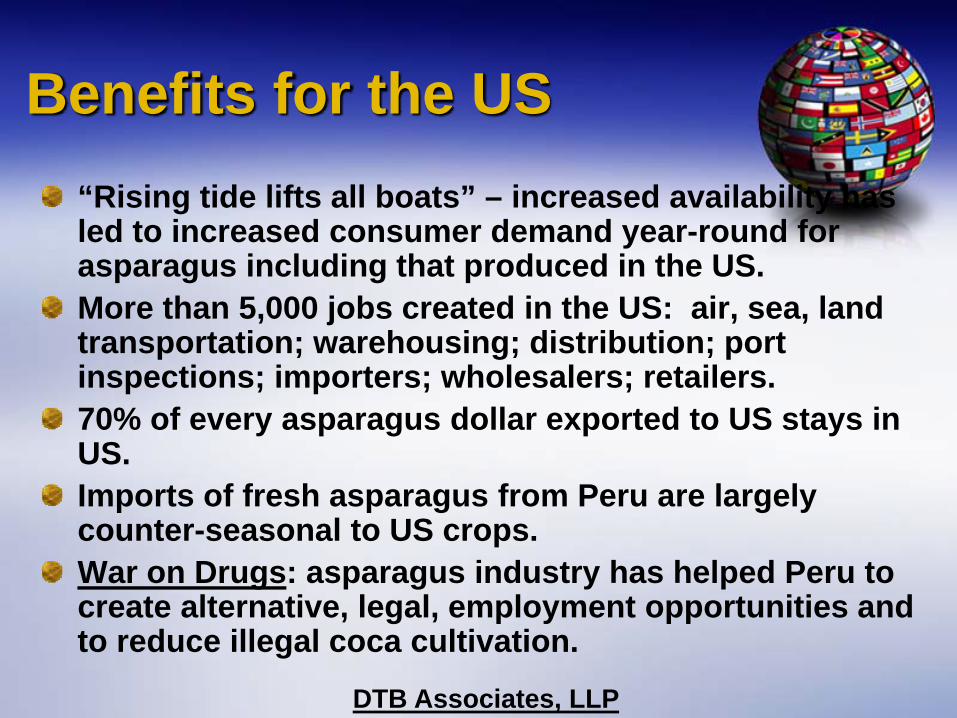
Benefits for the US“Rising tide lifts all boats” – increased availability has led to increased consumer demand year-round for asparagus including that produced in the US.More than 5,000 jobs created in the US: air, sea, land transportation; warehousing; distribution; port inspections; importers; wholesalers; retailers.70% of every asparagus dollar exported to US stays in US. Imports of fresh asparagus from Peru are largely counter-seasonal to US crops. War on Drugs: asparagus industry has helped Peru to create alternative, legal, employment opportunities and to reduce illegal coca cultivation.
DTB Associates, LLP

Fresh Asparagus Distribution Chain Job Creation
Growers
Packing House Processing/Quality Control Inspection
Cold Storage Air Pallet Clearance
Peru to Miami
Brokers
Miami Airport Clearance Cold Storage USDA
Insp. fumigation
Importers/Distributors Pre-
cooling Quality Inspection
Retailer
ConsumersLogistics
Warehousing
Sales
Wholesalers

Increased Exports and Declining Coca Leaf Production in Peru 1995-2006 (Has)
115,300
94,400
68,800
51,000
38,700 43,400 46,200 46,700 44,20050,300 48,200 51,400
0
20,000
40,000
60,000
80,000
100,000
120,000
1995 1996 1997 1998 1999 2000 2001 2002 2003 2004 2005 2006
HectaresSources: US Department of State and United Nations

*Agroexports such as asparagus create legal employment opportunities for impoverished highland agricultural workers.
*Geographic correlation between agroexport producing areas on the coast of Peru and coca-leaf cultivation areas in the Ceja de Selva region.

The Case of Peruvian Textile & Apparel Industry
DTB Associates, LLP

US Imports of Apparel from Peru (US $ Thousands)Total projected exports to world: $1.8 billion in 2008.
0100,000200,000300,000400,000500,000600,000700,000800,000900,000
1997 1998 1999 2000 2001 2002 2003 2004 2005 2006 2007
DTB Associates, LLPSource: US Department of Commerce

Competitiveness: Apparel Manufacturing Labor Costs 2008(US $/Hour, including social charges)
0.49 - 0.55
0.97 - 1.03
1.42
1.65
1.55 - 1.95
1.78
1.79
2.54
2.57
3.35
0.10 0.60 1.10 1.60 2.10 2.60 3.10
Haiti
Nicaragua
COLOMBIA
Guatemala
Dom. Rep.
PERU
El Salvador
Honduras
Mexico
BRAZIL
Costa Rica
USA Regional Import Supply Base
TPL
TPLTPL
FTA Completed
FTA/TPA
FTAA / 5 YR. ?
NAFTA/CAFTA ANDEAN / S. AMERICA
DTB Associates, LLPCourtesy: Pro-Nicaragua

Benefits to Peru’s Textile and Apparel Industry and Overall Economy
Competitive advantage due to unique raw materials such as pima and tanguis cottons and llama/alpaca fibers as well as ancient cultural tradition.Today, T&A make up close to 10% of Peru’s total exports.Direct/indirect employment of over 500,000 Peruvians, nearly 20% of Peru’s manufacturing jobs.Peru’s T&A industry is high in value-added and is creating a skilled workforce necessary for new industries. DTB Associates, LLP

U.S. Exports to Peru of Cotton, Yarns, Threads and Woven Fabrics (US$ Thousands)
010,00020,00030,00040,00050,00060,00070,00080,00090,000
1997 1998 1999 2000 2001 2002 2003 2004 2005 2006 2007
Cotton Cotton Yarns, Threads and Woven Fabrics
DTB Associates, LLPSource: US Department of Commerce

Benefits to US Cotton, Yarn and Fabric Industry
95% of Peru’s T&A exports are manufactured from cotton fiber. 70% of Peru’s cotton imports are from US.
Imports of cotton fiber from the US increased 80% in ten years, from $48 million in 1998 to $85 million in 2007.
US yarn and fabric exports to Peru grew from $4.5 to $12 million from 2002 and 2007. FTA is designed to foster use of US yarn and fabric inputs.
As a result, US cotton industry and various US textile industry sectors supported FTA. DTB Associates, LLP

Benefits to the US Apparel Value Chain and Other Considerations
Under the ATPDEA, apparel imports from Peru have generated benefits for US distribution networks and retailers, supporting thousands of US jobs along the chain. FTA-led growth will increase this benefit.
Most of value-added activities remain in US hands: article of clothing FOB Callao = $6.00, sold in US for $40-50.
War on Drugs: Peru’s growing apparel industry is an indispensable tool in US and Peruvian efforts to reduce illegal coca-leaf cultivation and combat narcotrafficking.
DTB Associates, LLP

US Total Imports of Apparel (US$ Thousands)
$1,226,8692%
$7,854,93611%
$23,375,60331%
$5,441,4787%
$18,963,74926%
$15,053,11320%
$2,237,4703%
$203,5250%
CAN CAFTA ASEAN EU-25 NAFTA GCC China Others
Source: US Department of Commerce DTB Associates, LLP

Displacement of Ag Workers? The Key is to Assist in Conversion
Low Job GenerationAnnual Jobs/100 Has
Yellow Corn 26
Barley 20
Wheat 20
White Corn 27
Broad Bean 20
Grain Pea 20
High Job GenerationAnnual Jobs/100 Has
Asparagus 65
Onions 97
Grapes 45
Paprika 52
Garlic 79
Artichokes 66
DTB Associates, LLP
Agricultural export products generate two to three times more jobs than traditional agricultural products (non-sensitive and sensitive)
Source: Peru Ministry of Agriculture

Concluding Observations
Global financial crisis has raised concern about stability of the US market for niche, high value, products such as those that Peru and other L.A. countries export. A prolonged drop in demand will impact exports and job creation and potentially erode support for FTA, especially if sensitive agricultural sectors are not assisted.However, in longer term, FTA should consolidate and spur further investment and growth of key, labor intensive, export sectors. The growth spurt that took place after expansion of the ATPA in 2002 is perfect example.The FTA by itself is not a silver bullet. The FTA must be accompanied by internal reforms such as the proposed ‘TLC Hacia Adentro’ (Internal FTA) and infrastructure development such as the ‘Sierra Exportadora’ (Exporting Highlands) program to ensure that the FTA has a positive impact on poverty reduction and economic growth.
DTB Associates, LLP

Questions?
Carlos Mateo Paz-Soldán, Esquire901 New York Av., N.W.Washington, DC 20001Phone: 202-661-7099Fax: 202-661-7093E-mail: [email protected] site: www.dtbassociates.com
… thank you!
DTB Associates, LLP