the us shale gas revolution and its impact on qatar’s ... us shale ga… · the us shale gas...
TRANSCRIPT
THE US SHALE GAS REVOLUTION AND ITS IMPACT ON QATAR’S POSITION IN GAS MARKETS
By Bassam Fattouh, Howard V. Rogers, and Peter StewartMARCH 2015
b | CHAPTER NAME
ABOUT THE CENTER ON GLOBAL ENERGY POLICY
The Center on Global Energy Policy provides independent, balanced, data-driven analysis to help policymakers
navigate the complex world of energy. We approach energy as an economic, security, and environmental concern.
And we draw on the resources of a world-class institution, faculty with real-world experience, and a location in
the world’s finance and media capital. Visit us at energypolicy.columbia.edu
facebook.com/ColumbiaUEnergy twitter.com/ColumbiaUEnergy
ABOUT THE SCHOOL OF INTERNATIONAL AND PUBLIC AFFAIRS
SIPA’s mission is to empower people to serve the global public interest. Our goal is to foster economic growth,
sustainable development, social progress, and democratic governance by educating public policy professionals,
producing policy-related research, and conveying the results to the world. Based in New York City, with a student
body that is 50 percent international and educational partners in cities around the world, SIPA is the most global
of public policy schools. For more information, please visit www.sipa.columbia.edu
ABOUT THE OXFORD INSTITUTE FOR ENERGY STUDIES
Founded in 1982, the Oxford Institute for Energy Studies is a recognized independent center of the University of
Oxford. Its unique multidisciplinary expertise allows it to examine the economics, the politics, and the sociology
of energy with a focus on oil and natural gas. Its research spans the international relations between producers
and consumers; the economic development of producing nations; and the geopolitical aspects of all these issues
alongside the economics and politics of the environment in relation to energy, including climate change. For more
information, visit: http://www.oxfordenergy.org
[email protected] | MARCH 2015 | 1
THE US SHALE GAS REVOLUTION AND ITS IMPACT ON QATAR’S POSITION IN GAS MARKETS
Columbia University in the City of New York
By Bassam Fa t touh, Howard V. Rogers , and Peter S tewar t*
MARCH 2015
* Bassam Fattouh is the director of the Oxford Institute for Energy Studies and leads the OIES Oil
and the Middle East Program. Howard V. Rogers is director of the natural gas program and senior
research fellow for OIES. Peter Stewart works as the chief energy analyst for Interfax Global Energy.

THE US SHALE GAS REVOLUTION AND ITS IMPACT ON QATAR’S POSITION IN GAS MARKETS
2 | CENTER ON GLObAL ENERGY POLICY | COLUMbIA SIPA
We would like to thank Ali Aissaoui, Christopher Allsopp, David Ledesma, Coby van der Linde,
Trevor Sikorski, Jonathan Stern, Ed Morse, Anthony Yuen, and Matthew Robinson for their valu-
able comments. All remaining errors are ours.
ACKNOWLEDGEMENTS
This working paper represents the research and views of the authors. It does not necessarily represent
the views of the Center on Global Energy Policy. The paper may be subject to further revision.
THE US SHALE GAS REVOLUTION AND ITS IMPACT ON QATAR’S POSITION IN GAS MARKETS
[email protected] | MARCH 2015 | 3
EXECUTIVE SUMMARY
Since the discovery of the massive wet gas North Field (the largest nonassociated gas field in the world) in 1971,1 Qatar has achieved a prominent position as the world’s current largest liquefied natural gas (LNG) exporter and a critical “swing supplier” or arbitrageur, optimizing its sales between Asian and European markets. It has also a major petrochemical industry and currently is the world’s fore-most manufacturer of Gas to Liquids (GTL) products.
Having achieved nothing less than spectacular levels of GDP per capita and wide public prominence, Qatar is still enforcing a moratorium on development of the North Field beyond projects already planned. In practical terms, this translates into no further LNG plant developments beyond those already operational in 2014 and no further GTL projects beyond the Pearl plant (which started sup-plying GTLs to the market in 2011). Power generation, desalination, and petrochemical plants that have already been committed to will continue to be developed.
At the same time, Qatar is facing new competition from conventional and unconventional gas resources being de-veloped around the world, and in particular by the up-coming LNG developments in North America, Australia, East Africa, and Russia. These supplies will put pressure on LNG prices and traditional pricing structures, globally and for Qatar in particular. This study examines how Qa-tar may be impacted by these major changes to the global LNG market, what they mean for Qatar’s revenues, the options it has to respond to this new competition, and what value chains it should focus on in the unlikely event the moratorium on North Field development is relaxed.
In particular, the study finds:
• Rising supply volumes globally over the 2018–23 period, both from US LNG projects and else-where, as well as Russian response to rising com-petition and Chinese demand, create uncertainty about Qatar’s ability to maximize revenues by di-verting volumes between Asia and Europe.
• The United States will be in a strong position to compete with Qatar to serve as a swing supplier between Asia and Europe/South America, as US LNG exports will not be destination-restricted. This implies that in addition to the absolute vol-ume of LNG exports that is allowed by the US, also important is the fact that the volumes can be flexibly traded, and could lead to a build out in the spot LNG market over time.
• LNG exporters will face pressure to offer more flexible price indexation from US LNG exports, which offer volumes on a Henry Hub–related basis, rather than on an oil-based index, as Asian customers seek more diversified pricing structures.
• While these changes to the global LNG market will likely have an impact on Qatar’s revenues, its fiscal buffers and huge resource base allows it to adjust to challenges. In addition, it is unlikely that prices in the Asia-Pacific will collapse for a protracted period, even with new supplies coming online from the United States and elsewhere.
• Qatar will very likely remain the lowest-cost pro-ducer relative to greenfield project competitors, especially given that Qatar produces significant volumes of condensates and natural gas liquids (NGLs) associated with its natural gas production.
• Should Qatar decide to lift the moratorium on further North Field development, it may benefit from waiting through the 2018–23 “soft market” or by trying to intimidate competitors into defer-ring competing projects by announcing a firm in-tent to bring on new volumes as soon as possible once an announcement of the lifting of the mora-torium is effected.
4 | CENTER ON GLObAL ENERGY POLICY | COLUMbIA SIPA
TABLE OF CONTENTS
ACKNOWLEDGEMENTS .................................................... 2
EXECUTIVE SUMMARY ..................................................... 3
INTRODUCTION ................................................................. 6
QATARI RESERVES, GAS SUPPLY, AND CONSUMPTION TRENDS .................................................. 9Qatar’s oil and gas reservesLNG projectsThe moratorium on additional productionDomestic gas consumption
The power and water desalination sectorsGas to liquids (GTL)Petrochemicals
Domestic consumption versus exports
THE DEVELOPMENT OF QATAR’S REGIONAL AND INTERNATIONAL GAS TRADE ................................ 17Regional gas demandQatar’s regional gas tradeQatari LNG sales patterns and pricing structure
THE DYNAMICS OF INTERNATIONAL GAS AND LNG MARKETS ....................................................... 22Global gas fundamentals, 2008 to 2014Future global LNG market dynamics
The level of US domestic gas production and LNG exportsAsian natural gas and LNG demandMore flexible pricing arrangements
Future price scenarios impacting Qatari LNG sales
GLOBAL GAS MARKET DYNAMICS POST-2015 AND IMPACT ON QATAR ................................................. 31Revenue outcomesImplications for Qatar’s pricing powerQatari investment choices: opportunities in the event the North Field moratorium is lifted
CONCLUSIONS ............................................................... 37
APPENDIX ....................................................................... 39Calculation of Qatar’s revenues under four scenarios
NOTES .............................................................................. 44
BIBLIOGRAPHY ............................................................... 46
FIGURES Figure 1: Qatar’s natural gas production 1990–2013 ........ 9Figure 2: Qatar’s liquid production 2012–2016 ............... 10Figure 3: Annual LNG supply by country 2004–2013 ...... 11Figure 4: Liquefaction plant unit costs ............................ 11Figure 5: Gas production forecast 2012–16 .................... 13 Figure 6: Natural gas consumption 2000–13 .................. 13 Figure 7: Dolphin pipeline and connections .................... 18Figure 8: Qatari LNG exports by regional destination 2006–13 ......................................................................... 20
Figure 9: Destination of Qatari LNG to Asia, Europe, and rest of world, 2010–30 ............................................ 21
Figure 10: Regional gas prices January 2007– October 2014 (monthly averages) ................................. 23
Figure 11: Asian LNG demand (including global marine bunkers), 2010–30 ............................................. 26
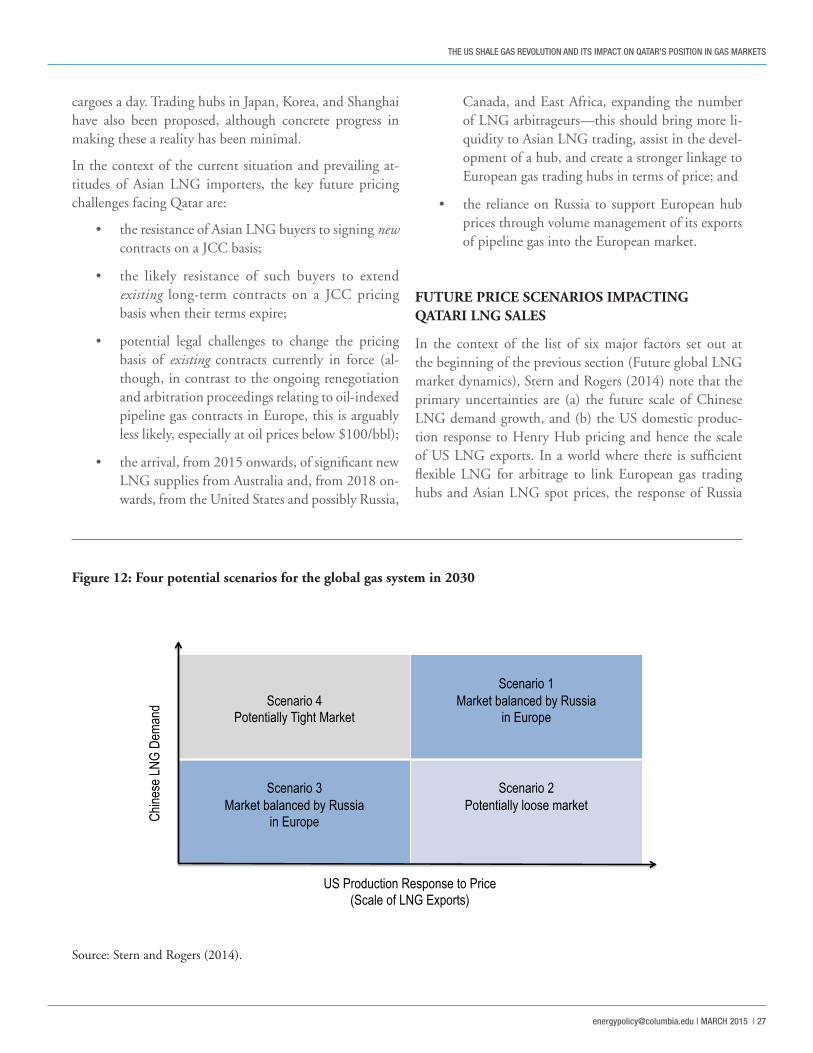
Figure 12: Four potential scenarios for the global gas system in 2030 ........................................................ 27
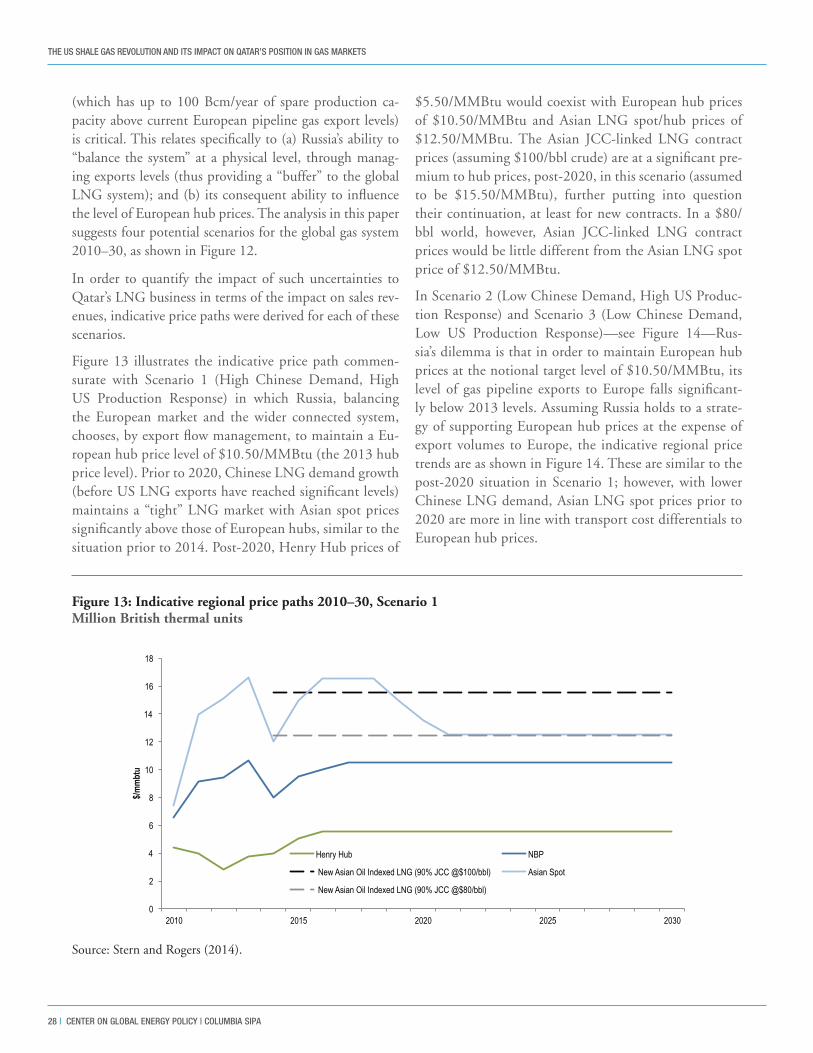
Figure 13: Indicative regional price paths 2010–30, Scenario 1 ...................................................................... 28
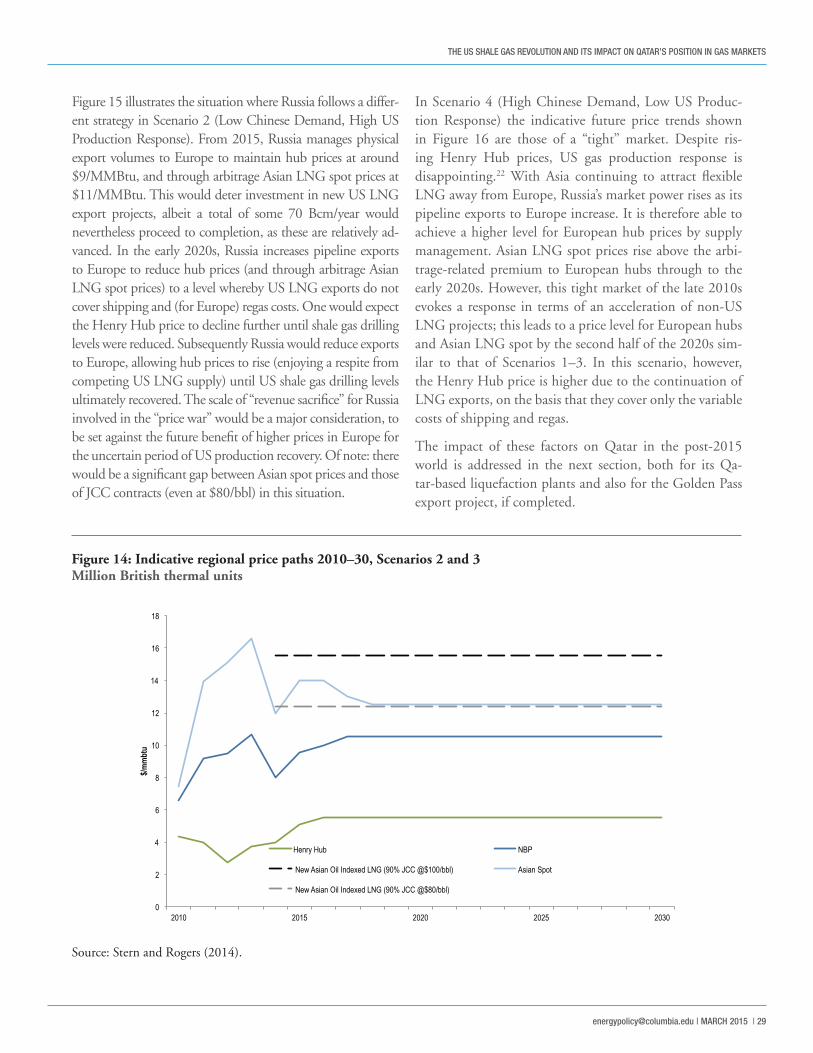
Figure 14: Indicative regional price paths 2010–30, Scenarios 2 and 3 .......................................................... 29
Figure 15: Indicative regional price paths 2010–30, “Scenario 2 with Price War” .......................................... 30
Figure 16: Indicative regional price paths 2010–30, Scenario 4 ...................................................................... 30
Figure 17: Qatari LNG reve nues ($ billion per year) in the four scenarios (oil price at $100/bbl) ....................... 31
Figure 18: Qatari LNG revenues ($ billion per year) in the four scenarios (oil price at $80/bbl) ......................... 32
THE US SHALE GAS REVOLUTION AND ITS IMPACT ON QATAR’S POSITION IN GAS MARKETS
[email protected] | MARCH 2015 | 5
Figure 19: Golden pass gross margin in the four scenarios ....................................................................... 33
TABLESTable 1: Capacity and start-up timing of Qatari LNG plants ..................................................................... 10
Table 2: Existing world GTL capacity in 2012 ................. 14Table 3: Production of gas by usage ............................... 16Table 4: Qatari LNG destination markets 2006–13 .......... 19Table 5: European supply, demand, and imports, 2008–13 ......................................................................... 23
BOX Developing an LNG project ............................................. 36

THE US SHALE GAS REVOLUTION AND ITS IMPACT ON QATAR’S POSITION IN GAS MARKETS
6 | CENTER ON GLObAL ENERGY POLICY | COLUMbIA SIPA
Despite efforts to diversify its economy and reduce its dependency on hydrocarbons, oil and gas still constitute the largest sectors of the Qatari economy. In 2013, Qa-tar’s estimated crude oil production was around 0.7 mil-lion barrels per day (b/d) and its LNG exports were 78 million tons per annum (mtpa) (GIIGNL, 2013). The extraction of natural gas from the North Field also results in the production of large volumes of condensates and NGLs, which in 2013 stood at 1.3 million b/d, exceeding the volume of crude oil production (QNB, 2013b). In 2013, the value of crude oil/refined petroleum product exports was $60.2 billion while that of LNG and related exports reached almost $85 billion, comprising around 93 percent of the total value of exports of goods (IMF, 2014a, p. 27). Additionally in 2013, the oil and gas sec-tor accounted for almost 54.2 percent of GDP (IMF, 2014a, p. 26). The dominance of oil and gas, however, extends beyond these direct contributions to GDP and export revenues. Government expenditure fuelled by oil and gas revenues is the main driver of public and private consumption and of Qatar’s economic growth. Between 2008 and 2012, Qatar was the world’s fastest growing economy with an annual average real GDP growth rate of 12 to 13 percent. The dominance of the oil and gas sectors has also been responsible for Qatar achieving the highest income per capita in the world, with GDP per capita at purchasing power parity (PPP) reaching $101,000 in 2012 (QNB, 2014).
Qatar is the world’s largest exporter of LNG. Its LNG ex-ports only began in December 1996, but they have risen rapidly, growing six-fold in the last 10 years. Because it is located roughly equidistant between the major consuming centers of Asia and Europe, Qatar sells its LNG to mar-kets in both the Atlantic and the Pacific Basins and has held a strategic role as a “swing supplier”2 or arbitrageur between these regions. This has given it an importance in world LNG markets even beyond that resulting from its large LNG export volumes. By arbitraging between Asian and European markets, Qatar is able to sell LNG into Eu-
rope when prices in Asia are low and to direct LNG to Asia when prices in Asia are high. This has enabled Qatar to exercise pricing power: by directing LNG to Europe, Qatar can keep prices in Asia high, thereby acting as a “discriminating monopolist.”3
The advent of shale development in North America, how-ever, could challenge Qatar’s special position in the global LNG market.4 Given that US LNG exports from the Gulf Coast can also head to Europe if the Asian markets are sat-urated, the level of US LNG exports that will be allowed by the US administration, and thus move to Final Invest-ment Decision (FID), is an issue of huge strategic impor-tance for Qatar, and indeed for global gas markets. Qatar also faces a potential challenge from the development of gas reserves outside North America. Australian LNG proj-ects already under construction mean that the country is likely to eclipse Qatar as the world’s largest LNG exporter sometime between 2018 and 2020. Meanwhile, LNG ex-ports from the west coast of Canada, or from the US Gulf Coast through the expanded Panama Canal, will compete with the Australian volumes in Asia. Plans for LNG ex-ports from East Africa and Russia, although still tentative in the case of the former, open the prospect that the cur-rently tight LNG market may face oversupply in the years ahead. If the US shale experiment were to be replicated in other regions, it would have significant implications for energy security and the geopolitical balance. Of course, this is a big if, and, in any case, the large-scale develop-ment of shale outside North America is unlikely until at least the end of the current decade.
The main questions addressed in this paper are: What is the potential impact of the recent dynamics in the LNG market on Qatar, and what is Qatar’s optimal strategy in the face of these challenges, particularly given the uncer-tainties surrounding shale gas availability and the level of competing LNG exports?
In terms of revenues, Qatar’s success in securing the sales of the majority of its LNG under long-term con-
INTRODUCTION
THE US SHALE GAS REVOLUTION AND ITS IMPACT ON QATAR’S POSITION IN GAS MARKETS
[email protected] | MARCH 2015 | 7
tracts linked to crude oil (Japan Customs-cleared crude or “JCC”) prices in Asia, and to oil or oil products in Europe, has resulted in (for an assumed oil price) a robust outlook for future global aggregate LNG sales revenues, over the range of price scenarios examined. This, however, assumes that buyers do not attempt (or are unable) to le-gally challenge (and then succeed in changing) the pricing terms of existing contracts away from oil and towards hub pricing. While the sales of LNG under oil-linked con-tracts has been advantageous relative to hub pricing in the 2010 to 2014 period, this advantage may not pertain in the current low oil price period of 2015.
In terms of Qatar’s marketing and pricing strategies, the advancement of US shale opens the prospect that the Unit-ed States and possibly other suppliers could compete with Qatar, undermining its ability to exercise pricing power. This could have profound implications for gas prices, gas pricing dynamics, and Qatar’s ability to influence prices. Rather than acting as a “discriminating monopolist,” Qa-tar may become a price taker in Europe and Asia.
In terms of strategic response, a key issue for Qatar is whether to keep in place the moratorium, established in 2005, on new projects using gas from the North Field. Qatar has a choice. If it removes the moratorium and seeks to export more LNG by adding a new train, it risks depressing LNG prices that may already be under pressure from the new LNG export projects identified above. But by doing so, it can deter its competitors from investing in new LNG projects. Given the low cost of developing its reserves, Qatar can generate rents even in a low-price
environment, enabling it to compete with other players. If Qatar keeps the moratorium in place, it may support LNG prices, but Qatar may see its role as an arbitrageur diminish through competition from new LNG suppli-ers; consequently, a more liquid and responsive arbitrage dynamic between Europe and Asia for spot cargoes may develop. The extent and timing of such changes are sub-ject to changing global gas fundamentals and hence will be addressed in this paper through analysis of different scenarios.
Qatar Petroleum and ExxonMobil are progressing a proj-ect to convert the Golden Pass US Gulf regas terminal into an LNG export terminal. If US government approv-al is forthcoming, this could become operational at the end of the decade. The requirement to source feed gas from the US transmission grid at market prices, however, will result in lower financial returns than those of Qatar’s North Field–sourced LNG plant in the scenarios consid-ered in this paper.
The paper is divided into the following parts:
The first section outlines the existing structure of the gas industry in Qatar, the historical evolution and develop-ment of gas reserves, the moratorium on new North Field gas projects that was put in place in 2005, and domestic gas consumption trends.
The next section outlines how Qatari gas is currently sold in regional and world markets. A brief review of Qatar’s gas trade within the Gulf Cooperation Council area is followed by a detailed explanation of the development of
The advent of shale development in North America could challenge Qatar’s special position in the global LNG market.
THE US SHALE GAS REVOLUTION AND ITS IMPACT ON QATAR’S POSITION IN GAS MARKETS
8 | CENTER ON GLObAL ENERGY POLICY | COLUMbIA SIPA
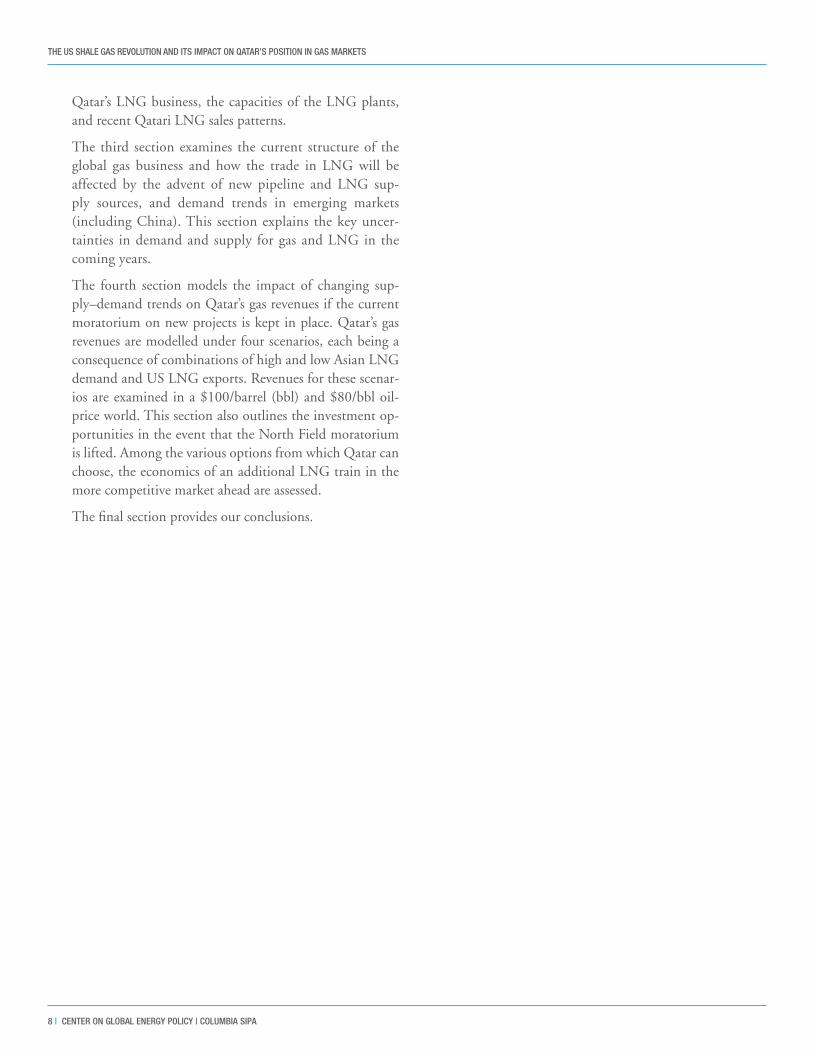
Qatar’s LNG business, the capacities of the LNG plants, and recent Qatari LNG sales patterns.
The third section examines the current structure of the global gas business and how the trade in LNG will be affected by the advent of new pipeline and LNG sup-ply sources, and demand trends in emerging markets (including China). This section explains the key uncer-tainties in demand and supply for gas and LNG in the coming years.
The fourth section models the impact of changing sup-ply–demand trends on Qatar’s gas revenues if the current moratorium on new projects is kept in place. Qatar’s gas revenues are modelled under four scenarios, each being a consequence of combinations of high and low Asian LNG demand and US LNG exports. Revenues for these scenar-ios are examined in a $100/barrel (bbl) and $80/bbl oil-price world. This section also outlines the investment op-portunities in the event that the North Field moratorium is lifted. Among the various options from which Qatar can choose, the economics of an additional LNG train in the more competitive market ahead are assessed.
The final section provides our conclusions.
THE US SHALE GAS REVOLUTION AND ITS IMPACT ON QATAR’S POSITION IN GAS MARKETS
[email protected] | MARCH 2015 | 9
QATAR’S OIL AND GAS RESERVES
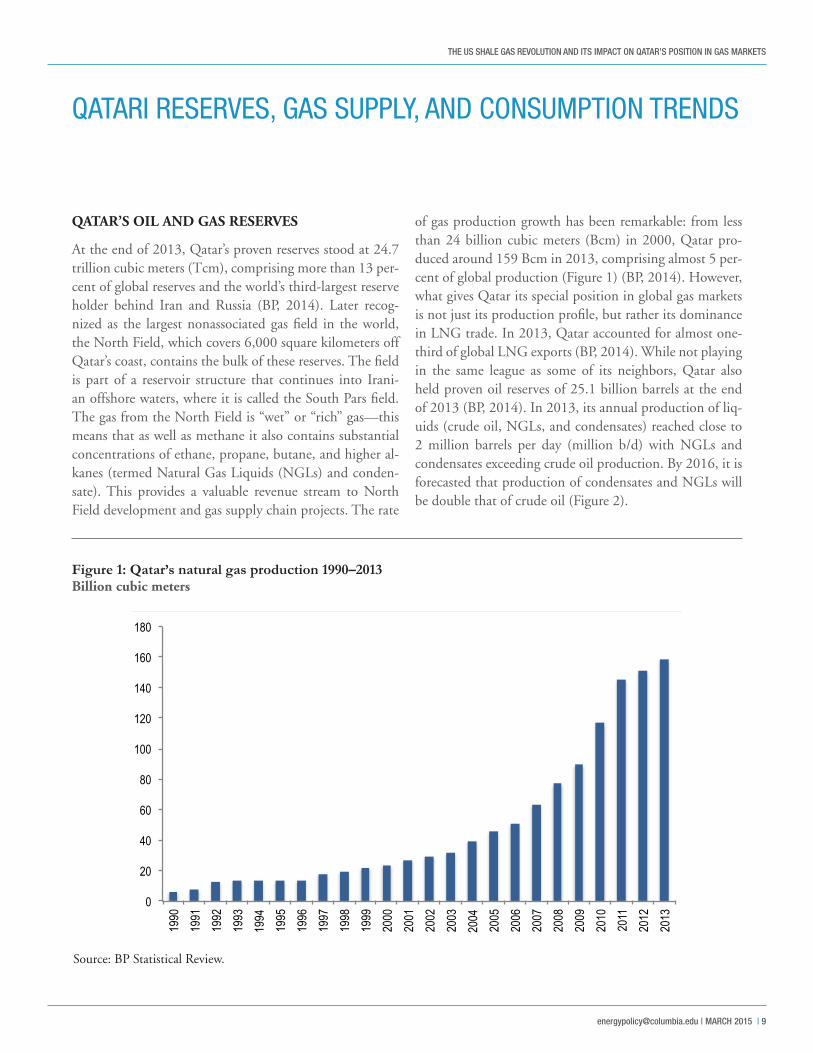
At the end of 2013, Qatar’s proven reserves stood at 24.7 trillion cubic meters (Tcm), comprising more than 13 per-cent of global reserves and the world’s third-largest reserve holder behind Iran and Russia (BP, 2014). Later recog-nized as the largest nonassociated gas field in the world, the North Field, which covers 6,000 square kilometers off Qatar’s coast, contains the bulk of these reserves. The field is part of a reservoir structure that continues into Irani-an offshore waters, where it is called the South Pars field. The gas from the North Field is “wet” or “rich” gas—this means that as well as methane it also contains substantial concentrations of ethane, propane, butane, and higher al-kanes (termed Natural Gas Liquids (NGLs) and conden-sate). This provides a valuable revenue stream to North Field development and gas supply chain projects. The rate
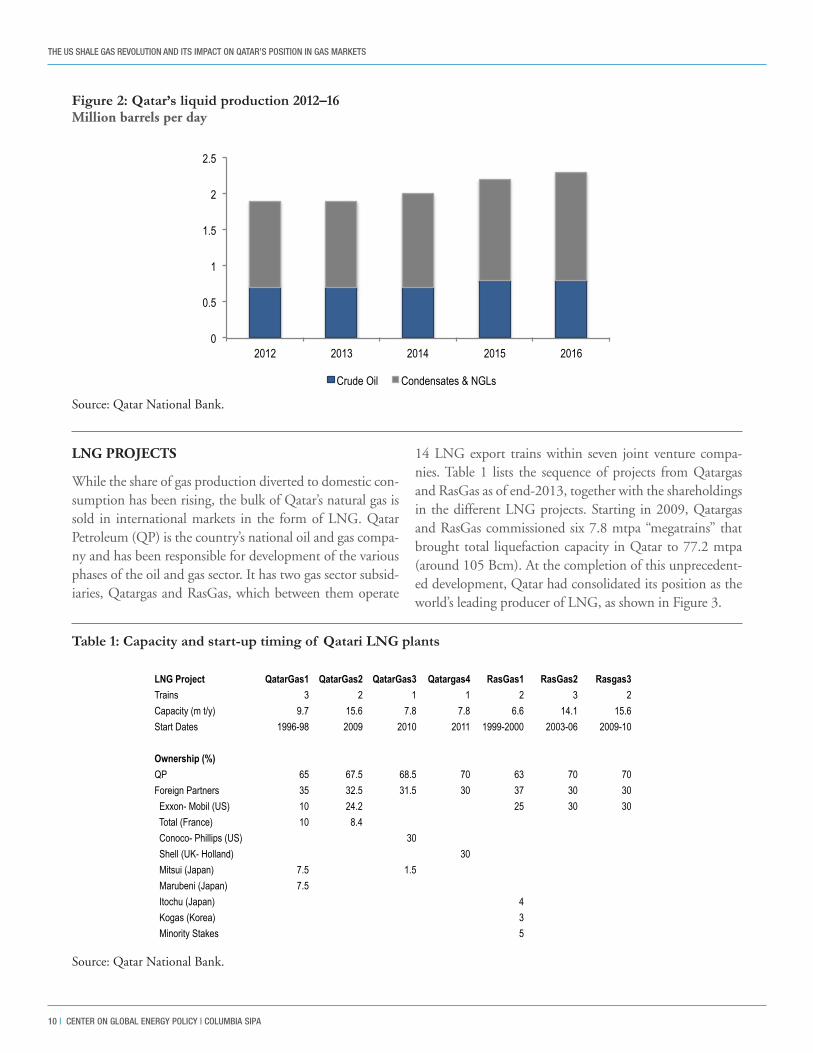
of gas production growth has been remarkable: from less than 24 billion cubic meters (Bcm) in 2000, Qatar pro-duced around 159 Bcm in 2013, comprising almost 5 per-cent of global production (Figure 1) (BP, 2014). However, what gives Qatar its special position in global gas markets is not just its production profile, but rather its dominance in LNG trade. In 2013, Qatar accounted for almost one-third of global LNG exports (BP, 2014). While not playing in the same league as some of its neighbors, Qatar also held proven oil reserves of 25.1 billion barrels at the end of 2013 (BP, 2014). In 2013, its annual production of liq-uids (crude oil, NGLs, and condensates) reached close to 2 million barrels per day (million b/d) with NGLs and condensates exceeding crude oil production. By 2016, it is forecasted that production of condensates and NGLs will be double that of crude oil (Figure 2).
0
20
40
60
80
100
120
140
160
180
1990
19
91
1992
19
93
1994
19
95
1996
19
97
1998
19
99
2000
20
01
2002
20
03
2004
20
05
2006
20
07
2008
20
09
2010
20
11
2012
20
13
Figure 1: Qatar’s natural gas production 1990–2013 Billion cubic meters
Source: BP Statistical Review.
QATARI RESERVES, GAS SUPPLY, AND CONSUMPTION TRENDS
THE US SHALE GAS REVOLUTION AND ITS IMPACT ON QATAR’S POSITION IN GAS MARKETS
10 | CENTER ON GLObAL ENERGY POLICY | COLUMbIA SIPA
LNG PROJECTS
While the share of gas production diverted to domestic con-sumption has been rising, the bulk of Qatar’s natural gas is sold in international markets in the form of LNG. Qatar Petroleum (QP) is the country’s national oil and gas compa-ny and has been responsible for development of the various phases of the oil and gas sector. It has two gas sector subsid-iaries, Qatargas and RasGas, which between them operate
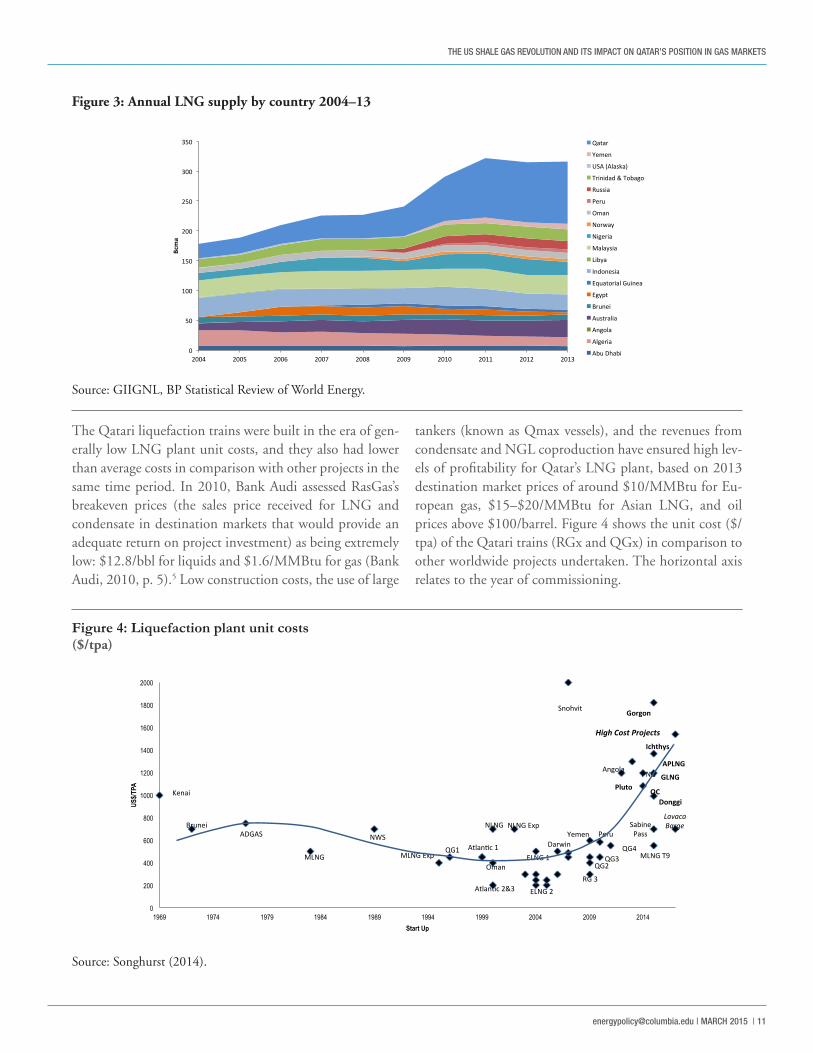
14 LNG export trains within seven joint venture compa-nies. Table 1 lists the sequence of projects from Qatargas and RasGas as of end-2013, together with the shareholdings in the different LNG projects. Starting in 2009, Qatargas and RasGas commissioned six 7.8 mtpa “megatrains” that brought total liquefaction capacity in Qatar to 77.2 mtpa (around 105 Bcm). At the completion of this unprecedent-ed development, Qatar had consolidated its position as the world’s leading producer of LNG, as shown in Figure 3.
0
0.5
1
1.5
2
2.5
2012 2013 2014 2015 2016
Crude Oil Condensates & NGLs
LNG Project QatarGas1 QatarGas2 QatarGas3 Qatargas4 RasGas1 RasGas2 Rasgas3Trains 3 2 1 1 2 3 2
Capacity (m t/y) 9.7 15.6 7.8 7.8 6.6 14.1 15.6
Start Dates 1996-98 2009 2010 2011 1999-2000 2003-06 2009-10
Ownership (%) QP 65 67.5 68.5 70 63 70 70
Foreign Partners 35 32.5 31.5 30 37 30 30
Exxon- Mobil (US) 10 24.2 25 30 30
Total (France) 10 8.4
Conoco- Phillips (US) 30
Shell (UK- Holland) 30
Mitsui (Japan) 7.5 1.5
Marubeni (Japan) 7.5
Itochu (Japan) 4
Kogas (Korea) 3
Minority Stakes 5
Figure 2: Qatar’s liquid production 2012–16Million barrels per day
Table 1: Capacity and start-up timing of Qatari LNG plants
Source: Qatar National Bank.
Source: Qatar National Bank.
THE US SHALE GAS REVOLUTION AND ITS IMPACT ON QATAR’S POSITION IN GAS MARKETS
[email protected] | MARCH 2015 | 11
The Qatari liquefaction trains were built in the era of gen-erally low LNG plant unit costs, and they also had lower than average costs in comparison with other projects in the same time period. In 2010, Bank Audi assessed RasGas’s breakeven prices (the sales price received for LNG and condensate in destination markets that would provide an adequate return on project investment) as being extremely low: $12.8/bbl for liquids and $1.6/MMBtu for gas (Bank Audi, 2010, p. 5).5 Low construction costs, the use of large
tankers (known as Qmax vessels), and the revenues from condensate and NGL coproduction have ensured high lev-els of profitability for Qatar’s LNG plant, based on 2013 destination market prices of around $10/MMBtu for Eu-ropean gas, $15–$20/MMBtu for Asian LNG, and oil prices above $100/barrel. Figure 4 shows the unit cost ($/tpa) of the Qatari trains (RGx and QGx) in comparison to other worldwide projects undertaken. The horizontal axis relates to the year of commissioning.
0
50
100
150
200
250
300
350
2004 2005 2006 2007 2008 2009 2010 2011 2012 2013
Bcma
Qatar
Yemen
USA (Alaska)
Trinidad & Tobago
Russia
Peru
Oman
Norway
Nigeria
Malaysia
Libya
Indonesia
Equatorial Guinea
Egypt
Brunei
Australia
Angola
Algeria
Abu Dhabi
0
200
400
600
800
1000
1200
1400
1600
1800
2000
1969 1974 1979 1984 1989 1994 1999 2004 2009 2014
US$/T
PA
Start Up
Snohvit Gorgon
Ichthys
QC Pluto GLNG
APLNG Angola
Sabine Pass
Lavaca Barge
PNG
Atlan3c 2&3
NLNG Peru
QG4
NLNG Exp Yemen
High Cost Projects
ELNG 2
Atlan3c 1
ADGAS
MLNG
NWS Brunei
QG1 MLNG Exp
Kenai
Oman ELNG 1
QG2
RG 3
QG3 MLNG T9 Darwin
Donggi
Figure 3: Annual LNG supply by country 2004–13
Figure 4: Liquefaction plant unit costs ($/tpa)
Source: GIIGNL, BP Statistical Review of World Energy.
Source: Songhurst (2014).
THE US SHALE GAS REVOLUTION AND ITS IMPACT ON QATAR’S POSITION IN GAS MARKETS
12 | CENTER ON GLObAL ENERGY POLICY | COLUMbIA SIPA
THE MORATORIUM ON ADDITIONAL PRODUCTION
In 2005, Qatar’s energy minister surprised the world by announcing a moratorium on further development of the North Field to allow an analysis to be made of its perfor-mance—production had been expected to approach 160 Bcm by 2013 (WGI, 2005). Initially, this moratorium was supposed to last only until 2006, but since then there has been a series of official announcements that have extend-ed the moratorium, or pause, for “technical issues.”6 At the end of 2009, Qatari officials indicated that the studies would not be completed before 2014, and there are re-cent indications that the study on reservoir depletion will not be completed before 2015. In March 2013, Qatar’s Energy and Industry Minister Mohammed al-Sada, who is also chairman of Qatar Petroleum, confirmed that the moratorium would remain in place (Platts, 2013). In an-other interview in 2014, he reiterated his position stating that “currently, the major objective for the North Field is to conduct a comprehensive evaluation of all the reservoir, well data and models in order to develop the optimum strategy for the long-term future of the field” (Telegraph, 2014). Qatar’s Deputy Prime Minister Abdallah al-Attiyah (formerly the country’s energy minister) reiterated in April 2014 that the moratorium will continue for as long as it is needed, and emphasized that Qatar’s priority was not to damage its reserve base.
With the moratorium in force, Qatar is prioritizing the development of gas sources other than the North Field. Qatar has four additional domestic sources of gas that are not constrained by the moratorium: production for the Barzan project which was approved before the mor-atorium was imposed, gas from the Khuff reservoir in Block 4N, gas from pre-Khuff reservoirs, and a 5.2 Bcm/year cushion field beneath the Dukhan oil field (Interfax, 2014). The 1.4 Bcf/d (around 14.5 Bcm/year) Barzan project is expected to come online by the end of 2015. Gas from the project is earmarked for new power and desalination plants. Meanwhile, gas from the Dukhan oil field provides emergency backup to LNG trains if their pipelines from the North Field develop technical issues. Production from Block 4N7 and pre-Khuff reservoirs will be used to feed domestic sectors such as petrochemicals. However, initial results from the pre-Khuff reservoirs have not been encouraging (MEES, 2014d). In 2013,
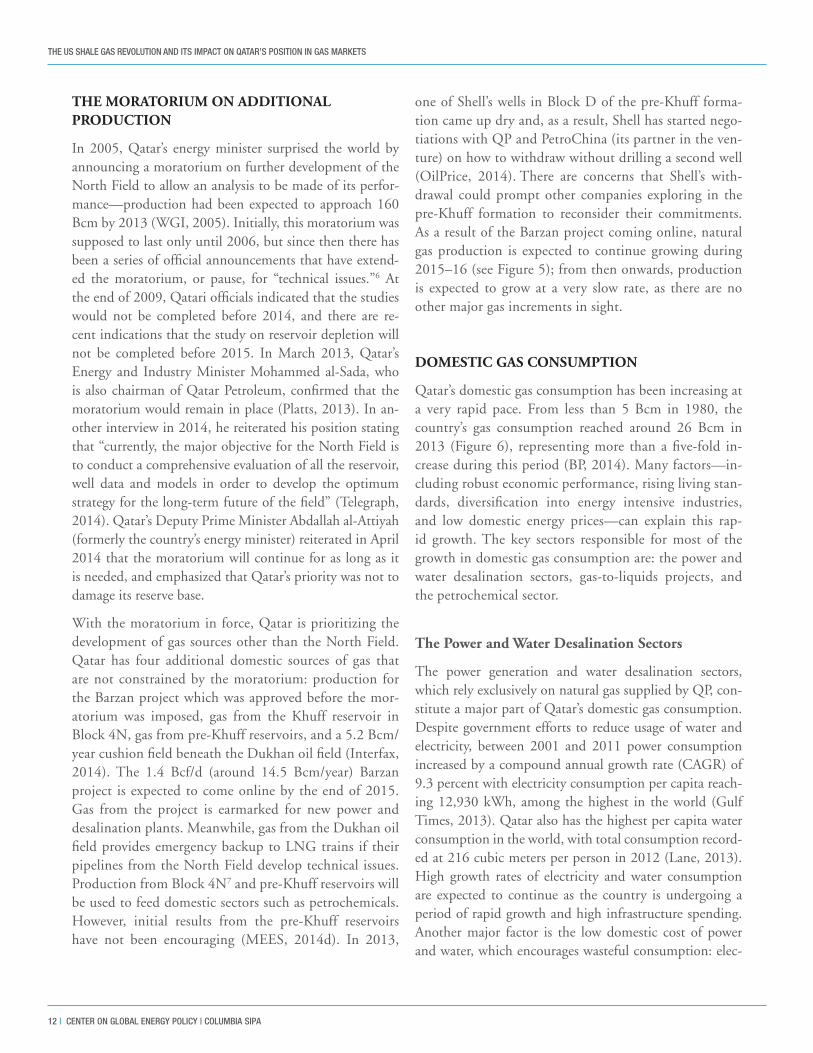
one of Shell’s wells in Block D of the pre-Khuff forma-tion came up dry and, as a result, Shell has started nego-tiations with QP and PetroChina (its partner in the ven-ture) on how to withdraw without drilling a second well (OilPrice, 2014). There are concerns that Shell’s with-drawal could prompt other companies exploring in the pre-Khuff formation to reconsider their commitments. As a result of the Barzan project coming online, natural gas production is expected to continue growing during 2015–16 (see Figure 5); from then onwards, production is expected to grow at a very slow rate, as there are no other major gas increments in sight.
DOMESTIC GAS CONSUMPTION
Qatar’s domestic gas consumption has been increasing at a very rapid pace. From less than 5 Bcm in 1980, the country’s gas consumption reached around 26 Bcm in 2013 (Figure 6), representing more than a five-fold in-crease during this period (BP, 2014). Many factors—in-cluding robust economic performance, rising living stan-dards, diversification into energy intensive industries, and low domestic energy prices—can explain this rap-id growth. The key sectors responsible for most of the growth in domestic gas consumption are: the power and water desalination sectors, gas-to-liquids projects, and the petrochemical sector.
The Power and Water Desalination Sectors
The power generation and water desalination sectors, which rely exclusively on natural gas supplied by QP, con-stitute a major part of Qatar’s domestic gas consumption. Despite government efforts to reduce usage of water and electricity, between 2001 and 2011 power consumption increased by a compound annual growth rate (CAGR) of 9.3 percent with electricity consumption per capita reach-ing 12,930 kWh, among the highest in the world (Gulf Times, 2013). Qatar also has the highest per capita water consumption in the world, with total consumption record-ed at 216 cubic meters per person in 2012 (Lane, 2013). High growth rates of electricity and water consumption are expected to continue as the country is undergoing a period of rapid growth and high infrastructure spending. Another major factor is the low domestic cost of power and water, which encourages wasteful consumption: elec-

THE US SHALE GAS REVOLUTION AND ITS IMPACT ON QATAR’S POSITION IN GAS MARKETS
[email protected] | MARCH 2015 | 13
0
50
100
150
200
250
2012 2013 2014 2015 2016
-
5.0
10.0
15.0
20.0
25.0
30.0
2000 2001 2002 2003 2004 2005 2006 2007 2008 2009 2010 2011 2012 2013
Figure 5: Gas production forecast 2012–16 Billion cubic meters
Figure 6: Natural gas consumption 2000–13 Billion cubic meters
Source: Qatar National Bank.
Source: BP (2014).

THE US SHALE GAS REVOLUTION AND ITS IMPACT ON QATAR’S POSITION IN GAS MARKETS
14 | CENTER ON GLObAL ENERGY POLICY | COLUMbIA SIPA
tricity and water are provided at no cost to Qatari nation-als and at highly subsidized prices to expatriates. To meet the rapid growth in electricity demand, Qatar continues to invest heavily in new power generation capacity. Ac-cording to some estimates, Qatar will require an additional power capacity of 8.2 Gigawatts (GW) by 2019, costing about $10 billion, to meet growing demand for electricity (QNB, 2013a). This will have important implications for domestic gas consumption. In 2010, the power sector con-sumed around 4.65 Bcm of natural gas. This is expected to almost double by 2016 and almost quadruple by 2020, when gas consumption in the power sector is expected to reach more than 16 Bcm (Dargin, 2011).
Gas to Liquids (GTL)
Qatar is a major player in GTL, accounting for near-ly three-quarters of global GTL capacity. The Fischer–Tropsch gas-to-liquid conversion process transforms nat-ural gas into synthetic liquid petroleum products, thus broadening the gas feedstock to other commercial appli-cations and commodity markets. It is seen as one of the routes for gas monetization, product diversification, and extending the value chain to capture more value added. For more details, see Brown (2013).
There are currently two GTL plants in operation in Qa-tar (Table 2). The first of these is Oryx GTL, owned by Qatar Petroleum (51 percent) and Sasol (49 percent). The plant has been in operation since 2006 with a de-sign capacity of around 34,000 b/d; it produces diesel, naphtha, and LPG. The premium GTL diesel, which has low sulphur, low aromatics, and high cetane number, is mainly used as diesel blending stock and to produce low-sulphur diesel, mainly for western Europe. GTL naphtha is used for the production of ethylene. The larger GTL project is Pearl, a joint venture between QP and Shell. Pearl GTL is the world’s largest GTL project and is located in Ras Laffan Industrial City. This inte-grated project started operating in 2011 and is now fully commissioned; in 2014, it was using about 1.6 Bcf/dof North Field gas to produce approximately 140,000 b/d of diesel and aviation fuel, oils for advanced lubricants, naphtha, and 120,000 boe/day of LPG, condensate, and ethane. The biggest component of the product mix is GTL gas oil (50,000 b/d), followed by GTL naphtha and paraffin (35,000 b/d), GTL base oil (30,000 b/d), and GTL kerosene (25,000 b/d). For the NGLs, the biggest component is condensate (60,000 b/d) followed by ethane and LPG (30,000 b/d each).
Plant Name Country Operator Start-up Nameplate Capacitybpd
Mossel Bay GTL South Africa PetroSA 1992 30,000
Bintulu GTL Malaysia Shell 1993 14,700
Mossel Bay GTL expansion South Africa PetroSA 2005 15,000
Oryx GTL Phase 1 Qatar Sasol/Qatar Petroleum 2006 32,400
Pearl GTL Phase 1 Qatar Shell/Qatar Petroleum 2011 70,000
Pearl GTL Phase 2 Qatar Shell/Qatar Petroleum 2011 70,000
Total existing capacity 232,100
NOTE: Capacity refers to large-scale GTL plants, and excludes pilot and demo plants
Table 2: Existing world GTL capacity in 2012
Source: Brown (2013).
THE US SHALE GAS REVOLUTION AND ITS IMPACT ON QATAR’S POSITION IN GAS MARKETS
[email protected] | MARCH 2015 | 15
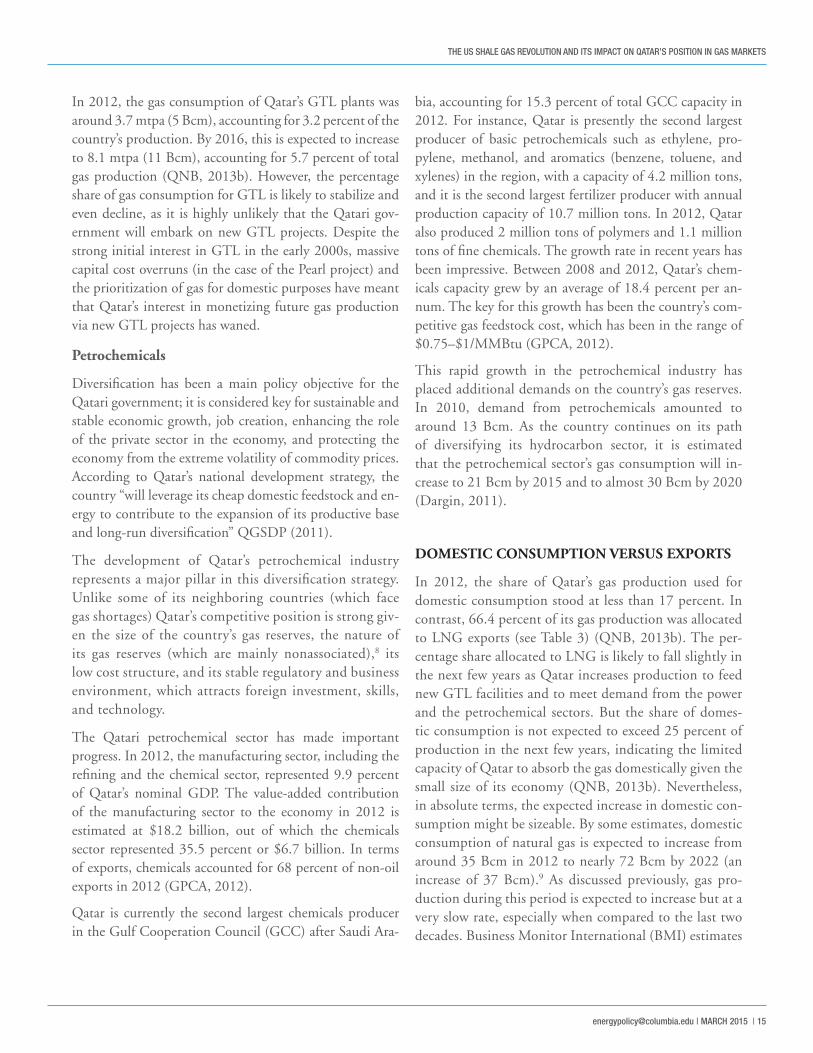
In 2012, the gas consumption of Qatar’s GTL plants was around 3.7 mtpa (5 Bcm), accounting for 3.2 percent of the country’s production. By 2016, this is expected to increase to 8.1 mtpa (11 Bcm), accounting for 5.7 percent of total gas production (QNB, 2013b). However, the percentage share of gas consumption for GTL is likely to stabilize and even decline, as it is highly unlikely that the Qatari gov-ernment will embark on new GTL projects. Despite the strong initial interest in GTL in the early 2000s, massive capital cost overruns (in the case of the Pearl project) and the prioritization of gas for domestic purposes have meant that Qatar’s interest in monetizing future gas production via new GTL projects has waned.
Petrochemicals
Diversification has been a main policy objective for the Qatari government; it is considered key for sustainable and stable economic growth, job creation, enhancing the role of the private sector in the economy, and protecting the economy from the extreme volatility of commodity prices. According to Qatar’s national development strategy, the country “will leverage its cheap domestic feedstock and en-ergy to contribute to the expansion of its productive base and long-run diversification” QGSDP (2011).
The development of Qatar’s petrochemical industry represents a major pillar in this diversification strategy. Unlike some of its neighboring countries (which face gas shortages) Qatar’s competitive position is strong giv-en the size of the country’s gas reserves, the nature of its gas reserves (which are mainly nonassociated),8 its low cost structure, and its stable regulatory and business environment, which attracts foreign investment, skills, and technology.
The Qatari petrochemical sector has made important progress. In 2012, the manufacturing sector, including the refining and the chemical sector, represented 9.9 percent of Qatar’s nominal GDP. The value-added contribution of the manufacturing sector to the economy in 2012 is estimated at $18.2 billion, out of which the chemicals sector represented 35.5 percent or $6.7 billion. In terms of exports, chemicals accounted for 68 percent of non-oil exports in 2012 (GPCA, 2012).
Qatar is currently the second largest chemicals producer in the Gulf Cooperation Council (GCC) after Saudi Ara-
bia, accounting for 15.3 percent of total GCC capacity in 2012. For instance, Qatar is presently the second largest producer of basic petrochemicals such as ethylene, pro-pylene, methanol, and aromatics (benzene, toluene, and xylenes) in the region, with a capacity of 4.2 million tons, and it is the second largest fertilizer producer with annual production capacity of 10.7 million tons. In 2012, Qatar also produced 2 million tons of polymers and 1.1 million tons of fine chemicals. The growth rate in recent years has been impressive. Between 2008 and 2012, Qatar’s chem-icals capacity grew by an average of 18.4 percent per an-num. The key for this growth has been the country’s com-petitive gas feedstock cost, which has been in the range of $0.75–$1/MMBtu (GPCA, 2012).
This rapid growth in the petrochemical industry has placed additional demands on the country’s gas reserves. In 2010, demand from petrochemicals amounted to around 13 Bcm. As the country continues on its path of diversifying its hydrocarbon sector, it is estimated that the petrochemical sector’s gas consumption will in-crease to 21 Bcm by 2015 and to almost 30 Bcm by 2020 (Dargin, 2011).
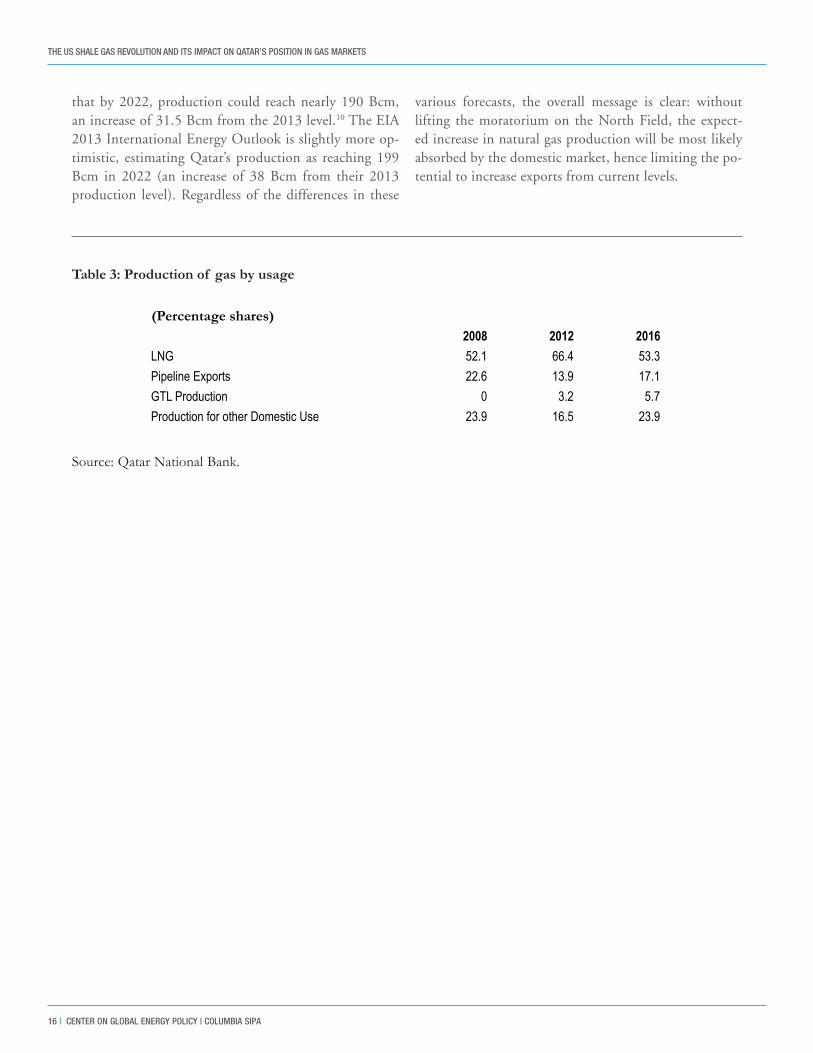
DOMESTIC CONSUMPTION VERSUS EXPORTS
In 2012, the share of Qatar’s gas production used for domestic consumption stood at less than 17 percent. In contrast, 66.4 percent of its gas production was allocated to LNG exports (see Table 3) (QNB, 2013b). The per-centage share allocated to LNG is likely to fall slightly in the next few years as Qatar increases production to feed new GTL facilities and to meet demand from the power and the petrochemical sectors. But the share of domes-tic consumption is not expected to exceed 25 percent of production in the next few years, indicating the limited capacity of Qatar to absorb the gas domestically given the small size of its economy (QNB, 2013b). Nevertheless, in absolute terms, the expected increase in domestic con-sumption might be sizeable. By some estimates, domestic consumption of natural gas is expected to increase from around 35 Bcm in 2012 to nearly 72 Bcm by 2022 (an increase of 37 Bcm).9 As discussed previously, gas pro-duction during this period is expected to increase but at a very slow rate, especially when compared to the last two decades. Business Monitor International (BMI) estimates
THE US SHALE GAS REVOLUTION AND ITS IMPACT ON QATAR’S POSITION IN GAS MARKETS
16 | CENTER ON GLObAL ENERGY POLICY | COLUMbIA SIPA
that by 2022, production could reach nearly 190 Bcm, an increase of 31.5 Bcm from the 2013 level.10 The EIA 2013 International Energy Outlook is slightly more op-timistic, estimating Qatar’s production as reaching 199 Bcm in 2022 (an increase of 38 Bcm from their 2013 production level). Regardless of the differences in these
various forecasts, the overall message is clear: without lifting the moratorium on the North Field, the expect-ed increase in natural gas production will be most likely absorbed by the domestic market, hence limiting the po-tential to increase exports from current levels.
(Percentage shares)2008 2012 2016
LNG 52.1 66.4 53.3
Pipeline Exports 22.6 13.9 17.1
GTL Production 0 3.2 5.7
Production for other Domestic Use 23.9 16.5 23.9
Table 3: Production of gas by usage
Source: Qatar National Bank.
THE US SHALE GAS REVOLUTION AND ITS IMPACT ON QATAR’S POSITION IN GAS MARKETS
[email protected] | MARCH 2015 | 17
REGIONAL GAS DEMAND
Since the 1970s, natural gas has become popular in the Gulf ’s domestic economies as a cheap and readily avail-able fuel for power generation and water desalination and as an increasingly popular feedstock for industry, particularly for petrochemicals production. Within the industrial sector, gas has often replaced crude oil as both fuel and feedstock, freeing up more valuable liquids for export markets. Gas is an important fuel for the region’s ambitious industrial diversification programs, which are based on energy-intensive industries, such as alumini-um and fertilizer production, and petrochemicals. Rap-id population growth in all of the Gulf States, coupled with large-scale urbanization and low regulated prices for electricity, have additionally contributed to the surge of domestic demand for gas. (For more details, see Fattouh and Stern, 2011.)
Domestic production of gas, on the other hand, has failed to keep pace with demand in most Gulf coun-tries. This is due to a combination of factors: reserves that are generally more difficult and more costly to ex-tract, and low regulated domestic gas prices. Upstream investments in the gas sector and infrastructure are thus rendered unattractive. The rise in domestic demand and the constrained supply response have meant that the de-mand–supply gap has continued to widen (Fattouh and Stern, 2011).
Towards the end of the last decade, a number of Arab Gulf states became net importers of natural gas. Kuwait became an importer of LNG in 200911 and currently it has plans to build a permanent LNG import terminal (to become operational by 2020). In 2010, it was joined by Dubai. The UAE became a net gas importer in 2008 as pipeline imports from Qatar exceeded its LNG exports. With a shortage of gas in Saudi Arabia requiring increased con-sumption of liquid fuel in the power sector, together with a wider recognition of the high opportunity cost involved in such a strategy, there is a significant possibility that Saudi
Arabia itself may become a net importer of gas between 2015 and 2020. Some of the Gulf countries have already experienced gas shortages at peak times in summer over the past years, resulting in power shortages and temporary industry closures. While Oman will not become a net im-porter, it will require swift development of additional sup-plies in order to maintain its LNG exports at current lev-els. Oman is already partly dependent on 1.5 Bcm/year of imported gas from Qatar and has requested more gas from Qatar on several occasions, to ease domestic gas shortages. In Bahrain, gas demand is closing in fast on gas supply and there are contingency plans for importing LNG in the event that plans for the development of tight gas resources are unsuccessful.
QATAR’S REGIONAL GAS TRADE
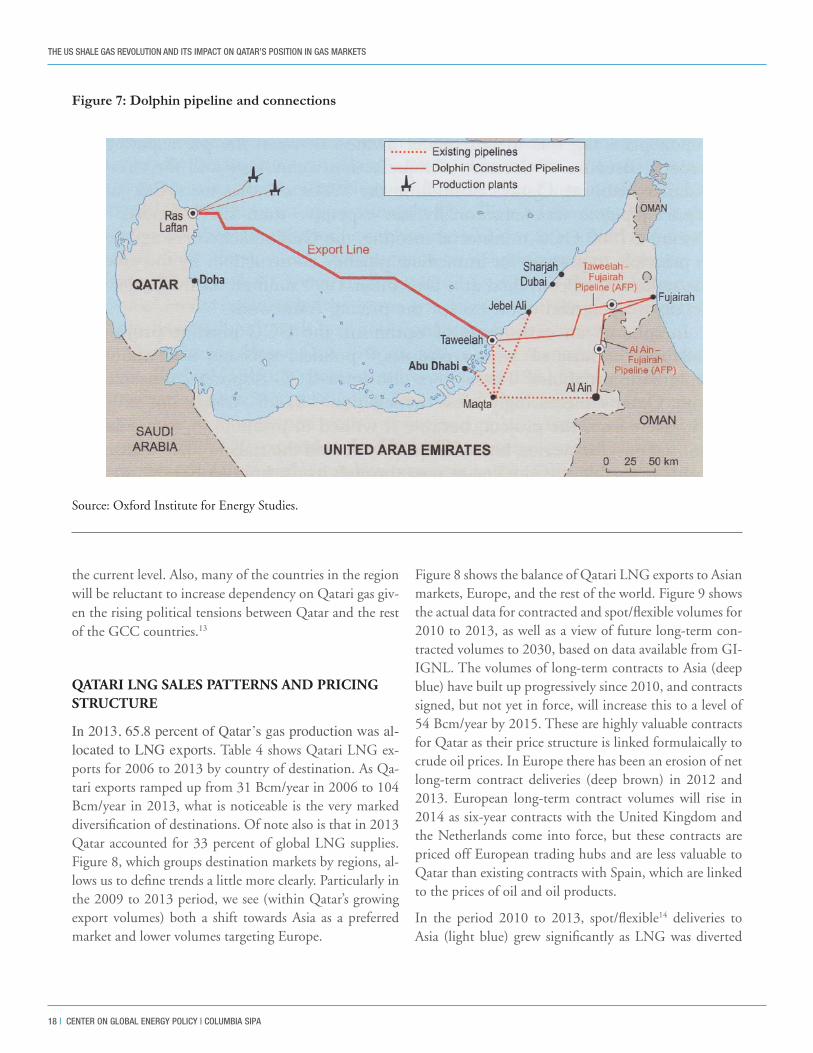
Despite Qatar’s massive gas production and its key role in satisfying growing demand from its neighbors, re-gional pipeline gas trade remains limited. Plans for a GCC-wide gas grid failed over a series of political rows and tensions and pricing issues. A smaller version of the gas grid concept has translated into the Dolphin pipe-line (see Figure 7), which transports Qatari gas at rela-tively low cost to the gas-hungry markets of Abu Dhabi, Dubai, and Oman. Dolphin now accounts for the bulk of intra-Arab gas trade, with an estimated 2 Bcf/d (21.7 Bcm/year) in 2012.12
While there is potential to divert additional large gas vol-umes to Qatar’s Gulf neighbors, this option is highly un-likely. With far higher netbacks for internationally sold LNG, Qatar finds it unattractive to sell cheap pipeline gas to its next-door neighbors. From Qatar’s perspective, the answer to the economic choice, between supplying rapidly growing domestic and regional markets at low prices or an international market at much higher prices, is an obvious one. Hence, given current prices, it is unlikely that Qatar will expand its gas export volumes to the region beyond
THE DEVELOPMENT OF QATAR’S REGIONAL AND INTERNATIONAL GAS TRADE
THE US SHALE GAS REVOLUTION AND ITS IMPACT ON QATAR’S POSITION IN GAS MARKETS
18 | CENTER ON GLObAL ENERGY POLICY | COLUMbIA SIPA
the current level. Also, many of the countries in the region will be reluctant to increase dependency on Qatari gas giv-en the rising political tensions between Qatar and the rest of the GCC countries.13
QATARI LNG SALES PATTERNS AND PRICING STRUCTURE
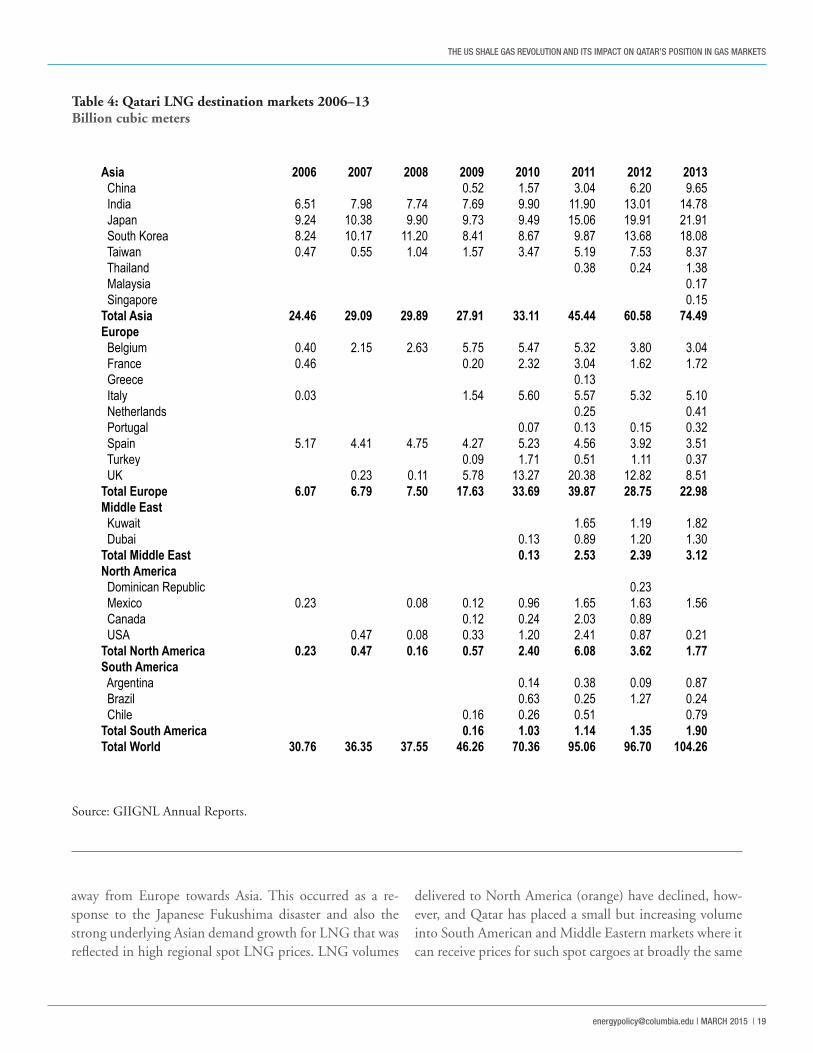
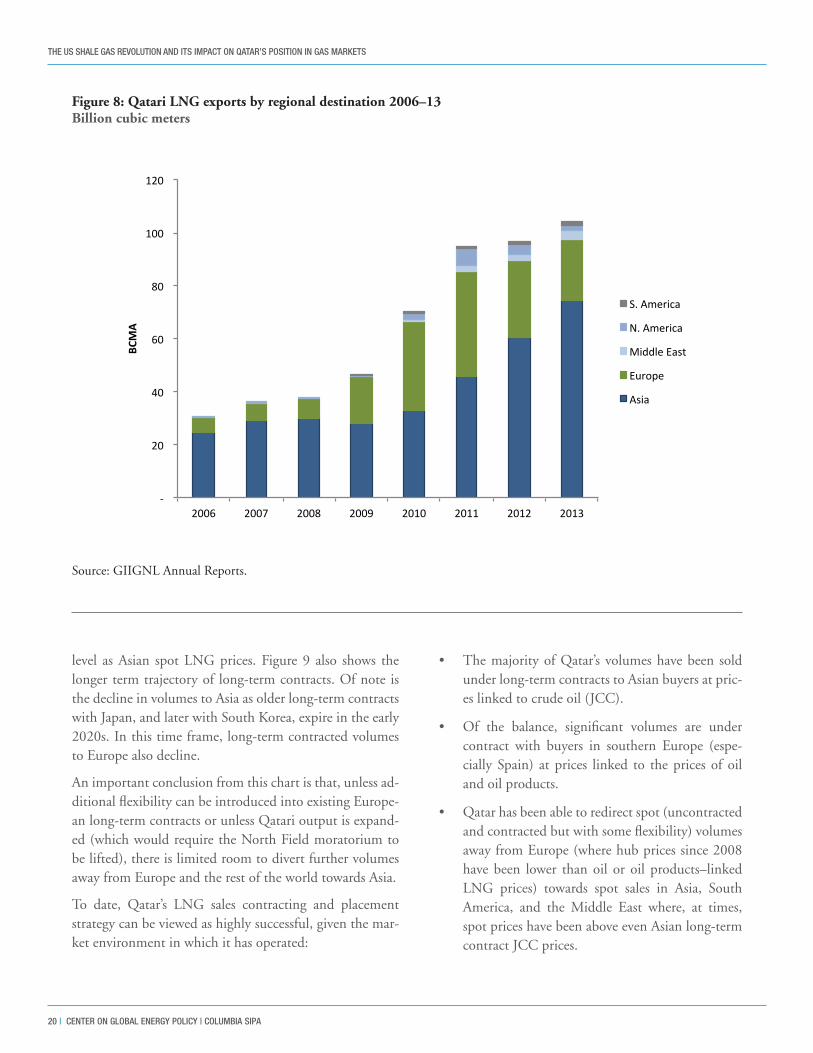
In 2013, 65.8 percent of Qatar’s gas production was al-located to LNG exports. Table 4 shows Qatari LNG ex-ports for 2006 to 2013 by country of destination. As Qa-tari exports ramped up from 31 Bcm/year in 2006 to 104 Bcm/year in 2013, what is noticeable is the very marked diversification of destinations. Of note also is that in 2013 Qatar accounted for 33 percent of global LNG supplies. Figure 8, which groups destination markets by regions, al-lows us to define trends a little more clearly. Particularly in the 2009 to 2013 period, we see (within Qatar’s growing export volumes) both a shift towards Asia as a preferred market and lower volumes targeting Europe.
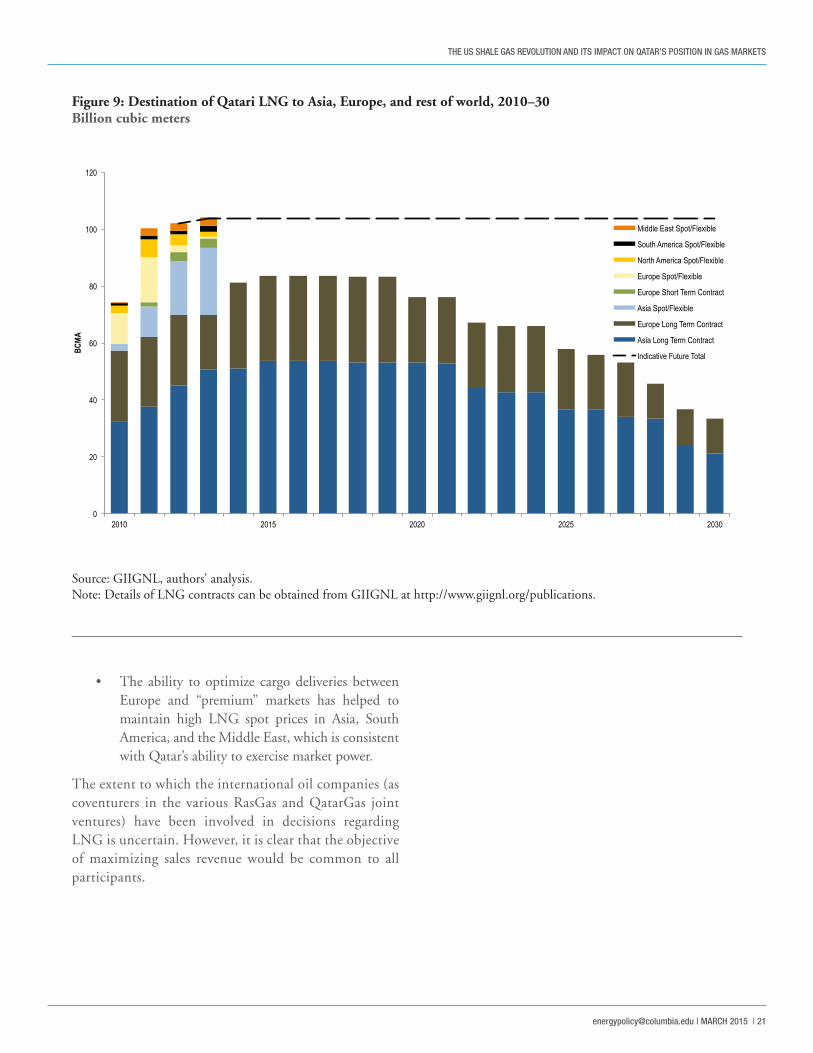
Figure 8 shows the balance of Qatari LNG exports to Asian markets, Europe, and the rest of the world. Figure 9 shows the actual data for contracted and spot/flexible volumes for 2010 to 2013, as well as a view of future long-term con-tracted volumes to 2030, based on data available from GI-IGNL. The volumes of long-term contracts to Asia (deep blue) have built up progressively since 2010, and contracts signed, but not yet in force, will increase this to a level of 54 Bcm/year by 2015. These are highly valuable contracts for Qatar as their price structure is linked formulaically to crude oil prices. In Europe there has been an erosion of net long-term contract deliveries (deep brown) in 2012 and 2013. European long-term contract volumes will rise in 2014 as six-year contracts with the United Kingdom and the Netherlands come into force, but these contracts are priced off European trading hubs and are less valuable to Qatar than existing contracts with Spain, which are linked to the prices of oil and oil products.
In the period 2010 to 2013, spot/flexible14 deliveries to Asia (light blue) grew significantly as LNG was diverted
Figure 7: Dolphin pipeline and connections
Source: Oxford Institute for Energy Studies.
THE US SHALE GAS REVOLUTION AND ITS IMPACT ON QATAR’S POSITION IN GAS MARKETS
[email protected] | MARCH 2015 | 19
away from Europe towards Asia. This occurred as a re-sponse to the Japanese Fukushima disaster and also the strong underlying Asian demand growth for LNG that was reflected in high regional spot LNG prices. LNG volumes
delivered to North America (orange) have declined, how-ever, and Qatar has placed a small but increasing volume into South American and Middle Eastern markets where it can receive prices for such spot cargoes at broadly the same
Asia 2006 2007 2008 2009 2010 2011 2012 2013 China 0.52 1.57 3.04 6.20 9.65 India 6.51 7.98 7.74 7.69 9.90 11.90 13.01 14.78 Japan 9.24 10.38 9.90 9.73 9.49 15.06 19.91 21.91 South Korea 8.24 10.17 11.20 8.41 8.67 9.87 13.68 18.08 Taiwan 0.47 0.55 1.04 1.57 3.47 5.19 7.53 8.37 Thailand 0.38 0.24 1.38 Malaysia 0.17 Singapore 0.15Total Asia 24.46 29.09 29.89 27.91 33.11 45.44 60.58 74.49Europe Belgium 0.40 2.15 2.63 5.75 5.47 5.32 3.80 3.04 France 0.46 0.20 2.32 3.04 1.62 1.72 Greece 0.13 Italy 0.03 1.54 5.60 5.57 5.32 5.10 Netherlands 0.25 0.41 Portugal 0.07 0.13 0.15 0.32 Spain 5.17 4.41 4.75 4.27 5.23 4.56 3.92 3.51 Turkey 0.09 1.71 0.51 1.11 0.37 UK 0.23 0.11 5.78 13.27 20.38 12.82 8.51Total Europe 6.07 6.79 7.50 17.63 33.69 39.87 28.75 22.98Middle East Kuwait 1.65 1.19 1.82 Dubai 0.13 0.89 1.20 1.30Total Middle East 0.13 2.53 2.39 3.12North America Dominican Republic 0.23 Mexico 0.23 0.08 0.12 0.96 1.65 1.63 1.56 Canada 0.12 0.24 2.03 0.89 USA 0.47 0.08 0.33 1.20 2.41 0.87 0.21Total North America 0.23 0.47 0.16 0.57 2.40 6.08 3.62 1.77South America Argentina 0.14 0.38 0.09 0.87 Brazil 0.63 0.25 1.27 0.24 Chile 0.16 0.26 0.51 0.79Total South America 0.16 1.03 1.14 1.35 1.90Total World 30.76 36.35 37.55 46.26 70.36 95.06 96.70 104.26
Table 4: Qatari LNG destination markets 2006–13 Billion cubic meters
Source: GIIGNL Annual Reports.
THE US SHALE GAS REVOLUTION AND ITS IMPACT ON QATAR’S POSITION IN GAS MARKETS
20 | CENTER ON GLObAL ENERGY POLICY | COLUMbIA SIPA
level as Asian spot LNG prices. Figure 9 also shows the longer term trajectory of long-term contracts. Of note is the decline in volumes to Asia as older long-term contracts with Japan, and later with South Korea, expire in the early 2020s. In this time frame, long-term contracted volumes to Europe also decline.
An important conclusion from this chart is that, unless ad-ditional flexibility can be introduced into existing Europe-an long-term contracts or unless Qatari output is expand-ed (which would require the North Field moratorium to be lifted), there is limited room to divert further volumes away from Europe and the rest of the world towards Asia.
To date, Qatar’s LNG sales contracting and placement strategy can be viewed as highly successful, given the mar-ket environment in which it has operated:
• The majority of Qatar’s volumes have been sold under long-term contracts to Asian buyers at pric-es linked to crude oil (JCC).
• Of the balance, significant volumes are under contract with buyers in southern Europe (espe-cially Spain) at prices linked to the prices of oil and oil products.
• Qatar has been able to redirect spot (uncontracted and contracted but with some flexibility) volumes away from Europe (where hub prices since 2008 have been lower than oil or oil products–linked LNG prices) towards spot sales in Asia, South America, and the Middle East where, at times, spot prices have been above even Asian long-term contract JCC prices.
-‐
20
40
60
80
100
120
2006 2007 2008 2009 2010 2011 2012 2013
BCMA
S. America
N. America
Middle East
Europe
Asia
Figure 8: Qatari LNG exports by regional destination 2006–13Billion cubic meters
Source: GIIGNL Annual Reports.
THE US SHALE GAS REVOLUTION AND ITS IMPACT ON QATAR’S POSITION IN GAS MARKETS
[email protected] | MARCH 2015 | 21
• The ability to optimize cargo deliveries between Europe and “premium” markets has helped to maintain high LNG spot prices in Asia, South America, and the Middle East, which is consistent with Qatar’s ability to exercise market power.
The extent to which the international oil companies (as coventurers in the various RasGas and QatarGas joint ventures) have been involved in decisions regarding LNG is uncertain. However, it is clear that the objective of maximizing sales revenue would be common to all participants.
0
20
40
60
80
100
120
2010 2015 2020 2025 2030
BCMA
Middle East Spot/Flexible
South America Spot/Flexible
North America Spot/Flexible
Europe Spot/Flexible
Europe Short Term Contract
Asia Spot/Flexible
Europe Long Term Contract
Asia Long Term Contract
Indicative Future Total
Figure 9: Destination of Qatari LNG to Asia, Europe, and rest of world, 2010–30Billion cubic meters
Source: GIIGNL, authors’ analysis.Note: Details of LNG contracts can be obtained from GIIGNL at http://www.giignl.org/publications.
THE US SHALE GAS REVOLUTION AND ITS IMPACT ON QATAR’S POSITION IN GAS MARKETS
22 | CENTER ON GLObAL ENERGY POLICY | COLUMbIA SIPA
GLOBAL GAS FUNDAMENTALS, 2008 TO 2014
Since 2008 the gas market has been characterized by ro-bust demand and an excess of supply in the United States, declining demand in Europe, and (up to mid-2014) soar-ing demand and increasing tightness in Asia, in part as a result of the Fukushima tragedy which required Japan to seek some 20 Bcm/year of additional LNG supply to com-pensate for the shutdown of its nuclear generation fleet. Given the imperfect arbitrage between gas markets, Qatar has enjoyed the ability to optimize its flexible LNG sales by moving cargoes to Europe at times of low spot prices in Asia and towards Asia when demand pushed spot prices higher.
The financial crisis of 2008, and the resulting impact on economic activity in all regions, saw a 2.4 percent year-on-year fall in LNG demand in Asia in 2009,15 although Asian LNG demand recovered rapidly. There was a surge of supply as the new Qatari megatrains came on stream in mid-2009, broadly reaching full capacity in 2011 (in addition to projects in Yemen, Sakhalin, Australia, Nige-ria, Norway, Peru, and Indonesia). Some of these volumes had originally been intended for the US market where, by 2012, some 186 Bcm/year (GIIGNL, 2013) of LNG im-port capacity had been built. However, the requirement for US LNG imports was undermined from 2006 onwards by the growth in shale gas production, such that US LNG imports, which had been expected to reach 70 Bcm by 2010, were reduced from nearly 18 Bcm in 2005 to 4.2 Bcm in 2012.16
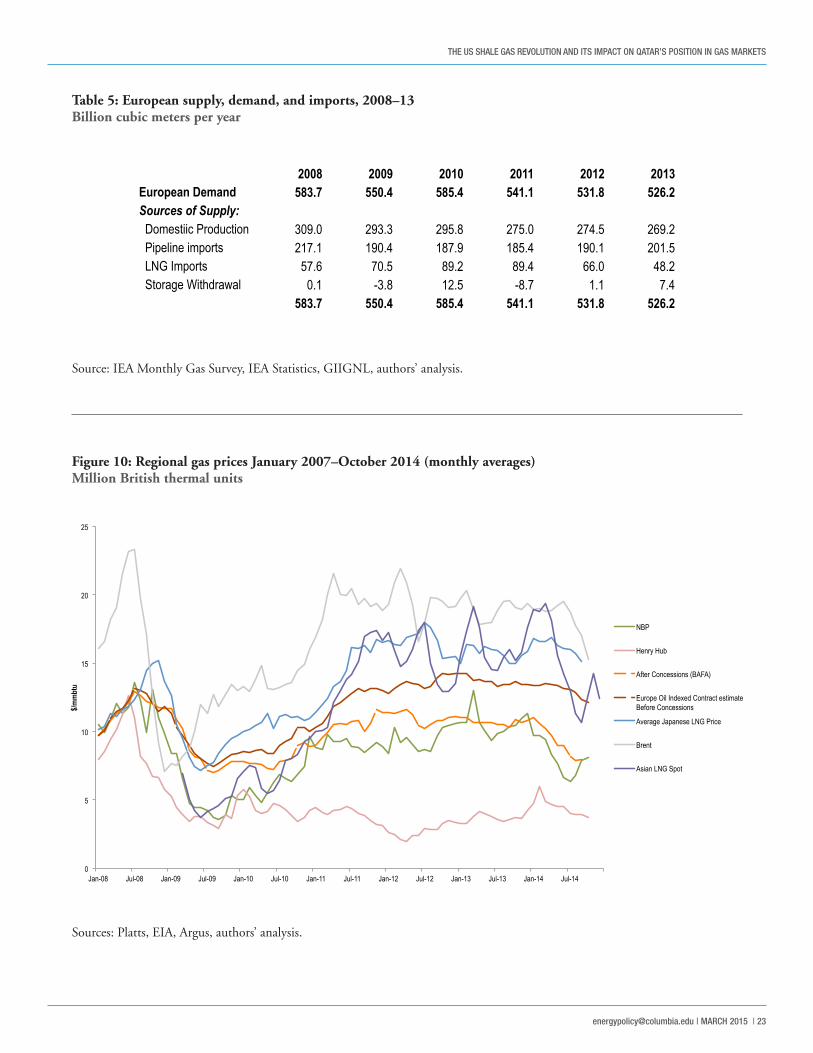
This led to a boost in LNG deliveries to Europe during 2009–11. However, gas demand was low in both 2009 and 2011, such that these European LNG imports re-sulted in a reduction in pipeline imports, mainly from Russia, despite the increase in demand in 2010 due to abnormally cold weather (Table 5). This coincided with rapidly rising demand in emerging markets in Asia, Latin America, and elsewhere. From Figure 9, it is apparent that from 2011 onwards, growth in Asian LNG consumption
has resulted in spot/flexible LNG being redirected away from Europe.
The period 2009–13 demonstrated that Russia—with its European supply delivery system geared to responding to buyer-nominated contract quantities (subject to take-or-pay minima) and having growing surplus production ca-pacity—has become the “shock absorber” of an increasing-ly “globally connected” system. In addition, the contractual delivery of cargoes to buyers such as Spain who (due to the recession and the growth of renewables generation capacity in the power sector) have “over contracted” LNG, has led to the phenomenon of LNG “re-loads”—where LNG is transferred back out of storage tanks, loaded onto LNG tankers, and sent as spot cargoes to the high-price-paying Asian and South American LNG markets.
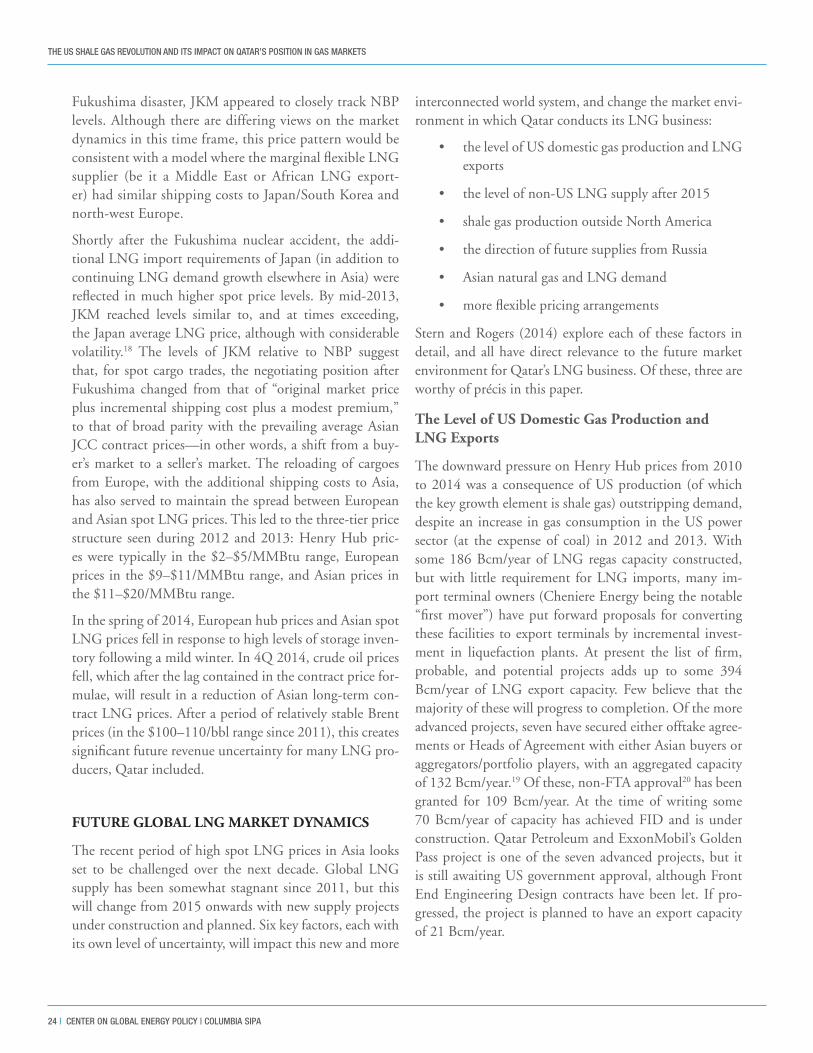
In anticipation of the 2010–11 LNG supply “surge” (re-sulting from the Qatari megatrains coming on stream) it had been assumed that LNG that could not be absorbed by Asia and Europe would “overspill” into the United States as the market of last resort. This explains the similar levels of Henry Hub and NBP prices in 2009 (Figure 10). In any event, two abnormally cold periods in Europe at the beginning and end of 2010, together with the Asian LNG demand rebound, led to this situation being avoided, and prices subsequently diverged. The gap between US and all other prices was particularly striking, as the Henry Hub price remained below $4/MMBtu for most of the two years to September 2013.
In Figure 10, the Japanese LNG price (blue) is the av-erage of some 60 individual JCC-linked contracts,17 all of which have differing formulaic linkages with crude oil prices, and spot cargo deliveries. The direct, lagged relationship to Brent crude prices is evident. Oil prices recovered to over $100/barrel by 2011, and subsequent-ly Asian LNG contract prices have remained at histor-ic high levels. The purple line in Figure 10 is the Asian LNG spot and short-term contract price—specifically the Platts JKM (Japan Korea Marker) price. Prior to the
THE DYNAMICS OF INTERNATIONAL GAS AND LNG MARKETS
THE US SHALE GAS REVOLUTION AND ITS IMPACT ON QATAR’S POSITION IN GAS MARKETS
[email protected] | MARCH 2015 | 23
2008 2009 2010 2011 2012 2013European Demand 583.7 550.4 585.4 541.1 531.8 526.2Sources of Supply: Domestiic Production 309.0 293.3 295.8 275.0 274.5 269.2 Pipeline imports 217.1 190.4 187.9 185.4 190.1 201.5 LNG Imports 57.6 70.5 89.2 89.4 66.0 48.2 Storage Withdrawal 0.1 -3.8 12.5 -8.7 1.1 7.4
583.7 550.4 585.4 541.1 531.8 526.2
0
5
10
15
20
25
Jan-08 Jul-08 Jan-09 Jul-09 Jan-10 Jul-10 Jan-11 Jul-11 Jan-12 Jul-12 Jan-13 Jul-13 Jan-14 Jul-14
$/mm
btu
NBP
Henry Hub
After Concessions (BAFA)
Europe Oil Indexed Contract estimate Before Concessions
Average Japanese LNG Price
Brent
Asian LNG Spot
Table 5: European supply, demand, and imports, 2008–13 Billion cubic meters per year
Figure 10: Regional gas prices January 2007–October 2014 (monthly averages)Million British thermal units
Source: IEA Monthly Gas Survey, IEA Statistics, GIIGNL, authors’ analysis.
Sources: Platts, EIA, Argus, authors’ analysis.
THE US SHALE GAS REVOLUTION AND ITS IMPACT ON QATAR’S POSITION IN GAS MARKETS
24 | CENTER ON GLObAL ENERGY POLICY | COLUMbIA SIPA
Fukushima disaster, JKM appeared to closely track NBP levels. Although there are differing views on the market dynamics in this time frame, this price pattern would be consistent with a model where the marginal flexible LNG supplier (be it a Middle East or African LNG export-er) had similar shipping costs to Japan/South Korea and north-west Europe.
Shortly after the Fukushima nuclear accident, the addi-tional LNG import requirements of Japan (in addition to continuing LNG demand growth elsewhere in Asia) were reflected in much higher spot price levels. By mid-2013, JKM reached levels similar to, and at times exceeding, the Japan average LNG price, although with considerable volatility.18 The levels of JKM relative to NBP suggest that, for spot cargo trades, the negotiating position after Fukushima changed from that of “original market price plus incremental shipping cost plus a modest premium,” to that of broad parity with the prevailing average Asian JCC contract prices—in other words, a shift from a buy-er’s market to a seller’s market. The reloading of cargoes from Europe, with the additional shipping costs to Asia, has also served to maintain the spread between European and Asian spot LNG prices. This led to the three-tier price structure seen during 2012 and 2013: Henry Hub pric-es were typically in the $2–$5/MMBtu range, European prices in the $9–$11/MMBtu range, and Asian prices in the $11–$20/MMBtu range.
In the spring of 2014, European hub prices and Asian spot LNG prices fell in response to high levels of storage inven-tory following a mild winter. In 4Q 2014, crude oil prices fell, which after the lag contained in the contract price for-mulae, will result in a reduction of Asian long-term con-tract LNG prices. After a period of relatively stable Brent prices (in the $100–110/bbl range since 2011), this creates significant future revenue uncertainty for many LNG pro-ducers, Qatar included.
FUTURE GLOBAL LNG MARKET DYNAMICS
The recent period of high spot LNG prices in Asia looks set to be challenged over the next decade. Global LNG supply has been somewhat stagnant since 2011, but this will change from 2015 onwards with new supply projects under construction and planned. Six key factors, each with its own level of uncertainty, will impact this new and more
interconnected world system, and change the market envi-ronment in which Qatar conducts its LNG business:
• the level of US domestic gas production and LNG exports
• the level of non-US LNG supply after 2015
• shale gas production outside North America
• the direction of future supplies from Russia
• Asian natural gas and LNG demand
• more flexible pricing arrangements
Stern and Rogers (2014) explore each of these factors in detail, and all have direct relevance to the future market environment for Qatar’s LNG business. Of these, three are worthy of précis in this paper.
The Level of US Domestic Gas Production and LNG Exports
The downward pressure on Henry Hub prices from 2010 to 2014 was a consequence of US production (of which the key growth element is shale gas) outstripping demand, despite an increase in gas consumption in the US power sector (at the expense of coal) in 2012 and 2013. With some 186 Bcm/year of LNG regas capacity constructed, but with little requirement for LNG imports, many im-port terminal owners (Cheniere Energy being the notable “first mover”) have put forward proposals for converting these facilities to export terminals by incremental invest-ment in liquefaction plants. At present the list of firm, probable, and potential projects adds up to some 394 Bcm/year of LNG export capacity. Few believe that the majority of these will progress to completion. Of the more advanced projects, seven have secured either offtake agree-ments or Heads of Agreement with either Asian buyers or aggregators/portfolio players, with an aggregated capacity of 132 Bcm/year.19 Of these, non-FTA approval20 has been granted for 109 Bcm/year. At the time of writing some 70 Bcm/year of capacity has achieved FID and is under construction. Qatar Petroleum and ExxonMobil’s Golden Pass project is one of the seven advanced projects, but it is still awaiting US government approval, although Front End Engineering Design contracts have been let. If pro-gressed, the project is planned to have an export capacity of 21 Bcm/year.
THE US SHALE GAS REVOLUTION AND ITS IMPACT ON QATAR’S POSITION IN GAS MARKETS
[email protected] | MARCH 2015 | 25
However, unlike all other existing LNG projects worldwide, the US LNG export projects will take their feed gas from the transmission grid of a large, liberalized market with highly liquid trading hubs. Thus the long- and short-term incen-tives to export LNG critically depend upon the price dif-ferential (or spread) between US hub price and destination market price. The FID decision will critically rest upon the expectation (on the part of investors and/or parties making offtake commitments) that prices for spot LNG in Asia or Europe will exceed feed gas costs by a margin that will cov-er LNG export facility tolling fees, shipping costs, and (for Europe) regas fees. An estimate of this margin or “spread” is $5/MMBtu for Europe and $7/MMBtu for Asia. However, once an export terminal is operational, the capital cost and tolling fee commitment that underwrites it are both “sunk” or “fixed” costs and LNG exports will continue, provided that the margin (spread) exceeds shipping costs and (for Eu-rope) regas fees. Thus, once operational, LNG facilities will export US LNG, provided that European hub prices are at least some $2/MMBtu higher than Henry Hub prices and Asian LNG spot (or hub) prices are $4/MMBtu higher than Henry Hub prices.
The main “known unknown” in terms of the likely future scale of US LNG exports is the “volume–price response” of US gas production. Apart from the early 2014 Henry Hub price spike (due to abnormally cold weather in the United States) prices have been below the generally ac-cepted “break-even” band for some of the major dry shale gas plays—between $5 and $6/MMBtu. However, US gas production in recent months has continued to slowly in-crease. In the main this is due to (a) a “backlog” of wells drilled in the Marcellus shale achieving delayed pipeline hookup, and (b) the coproduction of gas in wells drilled primarily to produce NGLs and to a lesser extent shale (or tight) oil. Once US LNG exports commence in late 2015 (from Cheniere Energy’s Sabine Pass facility) and grow substantially beyond 2018, it is likely that much of the additional production required to meet domestic demand and export volumes will need to be met by dry shale gas plays. The Henry Hub price will need to rise sufficiently to incentivize such a shift from the current “wet gas” drilling play focus.
Although it is claimed that dry gas plays such as the Haynesville have plentiful gas resources that would be eco-nomic above $5/MMBtu, the key question for US LNG
exports is: “What additional volume of US gas production will be brought onstream by an increase in the Henry Hub price to (say) $5.50?” This depends on a number on factors but chiefly on the degree to which viable wells are tightly concentrated in “sweet spots” on shale plays, the flexibility of the industry to move back onto dry shale plays from “wet” or NGL plays, and possibly on the rate at which rigs capable of horizontal drilling can be manufactured to meet the demands for both types of play drilling. It is possible that an initial Henry Hub price “overshoot” may occur, prior to a new industry momentum being established, to provide sufficient US production to satisfy the additional gas for LNG exports.
Asian Natural Gas and LNG Demand
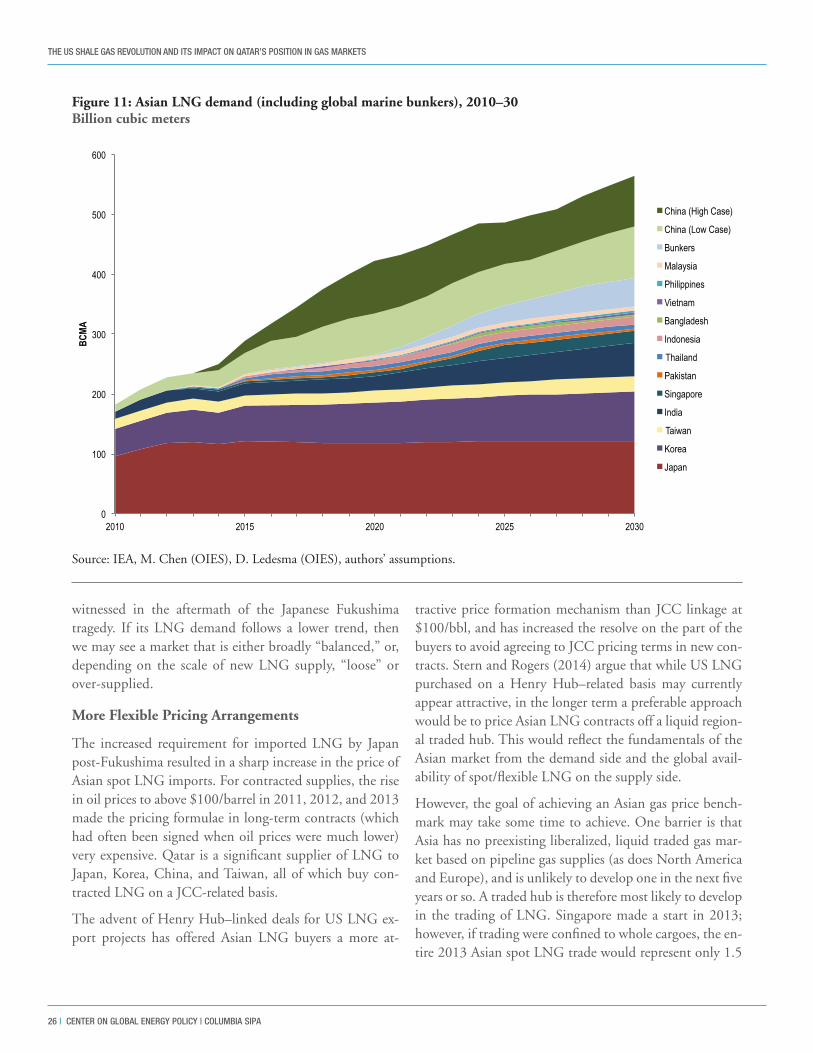
On the LNG demand side, uncertainty around the rate of LNG demand growth in Asia is a key factor that will determine the required pace of LNG supply growth (Fig-ure 11). In addition to the medium-term question of the speed at which Japan’s nuclear plant will be brought back on line (thus reducing consumption of both fuel oil and LNG in the power sector) and the possible rise in future demand for LNG as a marine fuel (bunkers), a major uncertainty throughout the time period being considered is China’s requirement for LNG imports. For 2020, Chi-na’s natural gas demand ranges from 295 Bcm/year (IEA, 2014) to 400 Bcm/year (Chinese government planning target). The LNG component of supply meeting this re-quirement is subject to additional uncertainties around the scale of (a) Chinese domestic gas production (includ-ing conventional gas, coal bed methane, shale gas, and synthetic natural gas—from coal); and (b) pipeline im-port volumes from Myanmar, Turkmenistan and Central Asia, and from East Siberia, following the recent signing of an agreement with Gazprom for 38 Bcm/year of pipe-line gas beginning in 2018.21 A consequent range in LNG import requirements for China for 2020 is from 69 Bcm/year to 157 Bcm/year.
China is the key global natural gas growth market. Its fu-ture import requirement is likely to be large but uncertain. In LNG terms it is the “key enabler” of planned and pro-posed projects, but as is the case with most high growth “emerging markets” for energy, the lack of data transpar-ency makes future demand requirements difficult to judge. If China’s LNG demand follows a high growth trajectory, it may result in a recurrence of the “tight” LNG market
THE US SHALE GAS REVOLUTION AND ITS IMPACT ON QATAR’S POSITION IN GAS MARKETS
26 | CENTER ON GLObAL ENERGY POLICY | COLUMbIA SIPA
witnessed in the aftermath of the Japanese Fukushima tragedy. If its LNG demand follows a lower trend, then we may see a market that is either broadly “balanced,” or, depending on the scale of new LNG supply, “loose” or over-supplied.
More Flexible Pricing Arrangements
The increased requirement for imported LNG by Japan post-Fukushima resulted in a sharp increase in the price of Asian spot LNG imports. For contracted supplies, the rise in oil prices to above $100/barrel in 2011, 2012, and 2013 made the pricing formulae in long-term contracts (which had often been signed when oil prices were much lower) very expensive. Qatar is a significant supplier of LNG to Japan, Korea, China, and Taiwan, all of which buy con-tracted LNG on a JCC-related basis.
The advent of Henry Hub–linked deals for US LNG ex-port projects has offered Asian LNG buyers a more at-
tractive price formation mechanism than JCC linkage at $100/bbl, and has increased the resolve on the part of the buyers to avoid agreeing to JCC pricing terms in new con-tracts. Stern and Rogers (2014) argue that while US LNG purchased on a Henry Hub–related basis may currently appear attractive, in the longer term a preferable approach would be to price Asian LNG contracts off a liquid region-al traded hub. This would reflect the fundamentals of the Asian market from the demand side and the global avail-ability of spot/flexible LNG on the supply side.
However, the goal of achieving an Asian gas price bench-mark may take some time to achieve. One barrier is that Asia has no preexisting liberalized, liquid traded gas mar-ket based on pipeline gas supplies (as does North America and Europe), and is unlikely to develop one in the next five years or so. A traded hub is therefore most likely to develop in the trading of LNG. Singapore made a start in 2013; however, if trading were confined to whole cargoes, the en-tire 2013 Asian spot LNG trade would represent only 1.5
0
100
200
300
400
500
600
2010 2015 2020 2025 2030
BCMA
China (High Case)
China (Low Case)
Bunkers
Malaysia
Philippines
Vietnam
Bangladesh
Indonesia
Thailand
Pakistan
Singapore
India
Taiwan
Korea
Japan
Figure 11: Asian LNG demand (including global marine bunkers), 2010–30Billion cubic meters
Source: IEA, M. Chen (OIES), D. Ledesma (OIES), authors’ assumptions.
THE US SHALE GAS REVOLUTION AND ITS IMPACT ON QATAR’S POSITION IN GAS MARKETS
[email protected] | MARCH 2015 | 27
cargoes a day. Trading hubs in Japan, Korea, and Shanghai have also been proposed, although concrete progress in making these a reality has been minimal.
In the context of the current situation and prevailing at-titudes of Asian LNG importers, the key future pricing challenges facing Qatar are:
• the resistance of Asian LNG buyers to signing new contracts on a JCC basis;
• the likely resistance of such buyers to extend existing long-term contracts on a JCC pricing basis when their terms expire;
• potential legal challenges to change the pricing basis of existing contracts currently in force (al-though, in contrast to the ongoing renegotiation and arbitration proceedings relating to oil-indexed pipeline gas contracts in Europe, this is arguably less likely, especially at oil prices below $100/bbl);
• the arrival, from 2015 onwards, of significant new LNG supplies from Australia and, from 2018 on-wards, from the United States and possibly Russia,
Canada, and East Africa, expanding the number of LNG arbitrageurs—this should bring more li-quidity to Asian LNG trading, assist in the devel-opment of a hub, and create a stronger linkage to European gas trading hubs in terms of price; and
• the reliance on Russia to support European hub prices through volume management of its exports of pipeline gas into the European market.
FUTURE PRICE SCENARIOS IMPACTING QATARI LNG SALES
In the context of the list of six major factors set out at the beginning of the previous section (Future global LNG market dynamics), Stern and Rogers (2014) note that the primary uncertainties are (a) the future scale of Chinese LNG demand growth, and (b) the US domestic produc-tion response to Henry Hub pricing and hence the scale of US LNG exports. In a world where there is sufficient flexible LNG for arbitrage to link European gas trading hubs and Asian LNG spot prices, the response of Russia
Scenario 4 Potentially Tight Market
Scenario 1
Market balanced by Russia in Europe
Scenario 3
Market balanced by Russia in Europe
Scenario 2
Potentially loose market
US Production Response to Price (Scale of LNG Exports)
Chine
se LN
G De
mand
Figure 12: Four potential scenarios for the global gas system in 2030
Source: Stern and Rogers (2014).
THE US SHALE GAS REVOLUTION AND ITS IMPACT ON QATAR’S POSITION IN GAS MARKETS
28 | CENTER ON GLObAL ENERGY POLICY | COLUMbIA SIPA
(which has up to 100 Bcm/year of spare production ca-pacity above current European pipeline gas export levels) is critical. This relates specifically to (a) Russia’s ability to “balance the system” at a physical level, through manag-ing exports levels (thus providing a “buffer” to the global LNG system); and (b) its consequent ability to influence the level of European hub prices. The analysis in this paper suggests four potential scenarios for the global gas system 2010–30, as shown in Figure 12.
In order to quantify the impact of such uncertainties to Qatar’s LNG business in terms of the impact on sales rev-enues, indicative price paths were derived for each of these scenarios.
Figure 13 illustrates the indicative price path commen-surate with Scenario 1 (High Chinese Demand, High US Production Response) in which Russia, balancing the European market and the wider connected system, chooses, by export flow management, to maintain a Eu-ropean hub price level of $10.50/MMBtu (the 2013 hub price level). Prior to 2020, Chinese LNG demand growth (before US LNG exports have reached significant levels) maintains a “tight” LNG market with Asian spot prices significantly above those of European hubs, similar to the situation prior to 2014. Post-2020, Henry Hub prices of
$5.50/MMBtu would coexist with European hub prices of $10.50/MMBtu and Asian LNG spot/hub prices of $12.50/MMBtu. The Asian JCC-linked LNG contract prices (assuming $100/bbl crude) are at a significant pre-mium to hub prices, post-2020, in this scenario (assumed to be $15.50/MMBtu), further putting into question their continuation, at least for new contracts. In a $80/bbl world, however, Asian JCC-linked LNG contract prices would be little different from the Asian LNG spot price of $12.50/MMBtu.
In Scenario 2 (Low Chinese Demand, High US Produc-tion Response) and Scenario 3 (Low Chinese Demand, Low US Production Response)—see Figure 14—Rus-sia’s dilemma is that in order to maintain European hub prices at the notional target level of $10.50/MMBtu, its level of gas pipeline exports to Europe falls significant-ly below 2013 levels. Assuming Russia holds to a strate-gy of supporting European hub prices at the expense of export volumes to Europe, the indicative regional price trends are as shown in Figure 14. These are similar to the post-2020 situation in Scenario 1; however, with lower Chinese LNG demand, Asian LNG spot prices prior to 2020 are more in line with transport cost differentials to European hub prices.
0
2
4
6
8
10
12
14
16
18
2010 2015 2020 2025 2030
$/mm
btu
Henry Hub NBP
New Asian Oil Indexed LNG (90% JCC @$100/bbl) Asian Spot
New Asian Oil Indexed LNG (90% JCC @$80/bbl)
Figure 13: Indicative regional price paths 2010–30, Scenario 1Million British thermal units
Source: Stern and Rogers (2014).
THE US SHALE GAS REVOLUTION AND ITS IMPACT ON QATAR’S POSITION IN GAS MARKETS
[email protected] | MARCH 2015 | 29
Figure 15 illustrates the situation where Russia follows a differ-ent strategy in Scenario 2 (Low Chinese Demand, High US Production Response). From 2015, Russia manages physical export volumes to Europe to maintain hub prices at around $9/MMBtu, and through arbitrage Asian LNG spot prices at $11/MMBtu. This would deter investment in new US LNG export projects, albeit a total of some 70 Bcm/year would nevertheless proceed to completion, as these are relatively ad-vanced. In the early 2020s, Russia increases pipeline exports to Europe to reduce hub prices (and through arbitrage Asian LNG spot prices) to a level whereby US LNG exports do not cover shipping and (for Europe) regas costs. One would expect the Henry Hub price to decline further until shale gas drilling levels were reduced. Subsequently Russia would reduce exports to Europe, allowing hub prices to rise (enjoying a respite from competing US LNG supply) until US shale gas drilling levels ultimately recovered. The scale of “revenue sacrifice” for Russia involved in the “price war” would be a major consideration, to be set against the future benefit of higher prices in Europe for the uncertain period of US production recovery. Of note: there would be a significant gap between Asian spot prices and those of JCC contracts (even at $80/bbl) in this situation.
In Scenario 4 (High Chinese Demand, Low US Produc-tion Response) the indicative future price trends shown in Figure 16 are those of a “tight” market. Despite ris-ing Henry Hub prices, US gas production response is disappointing.22 With Asia continuing to attract flexible LNG away from Europe, Russia’s market power rises as its pipeline exports to Europe increase. It is therefore able to achieve a higher level for European hub prices by supply management. Asian LNG spot prices rise above the arbi-trage-related premium to European hubs through to the early 2020s. However, this tight market of the late 2010s evokes a response in terms of an acceleration of non-US LNG projects; this leads to a price level for European hubs and Asian LNG spot by the second half of the 2020s sim-ilar to that of Scenarios 1–3. In this scenario, however, the Henry Hub price is higher due to the continuation of LNG exports, on the basis that they cover only the variable costs of shipping and regas.
The impact of these factors on Qatar in the post-2015 world is addressed in the next section, both for its Qa-tar-based liquefaction plants and also for the Golden Pass export project, if completed.
0
2
4
6
8
10
12
14
16
18
2010 2015 2020 2025 2030
$/mm
btu
Henry Hub NBP
New Asian Oil Indexed LNG (90% JCC @$100/bbl) Asian Spot
New Asian Oil Indexed LNG (90% JCC @$80/bbl)
Figure 14: Indicative regional price paths 2010–30, Scenarios 2 and 3Million British thermal units
Source: Stern and Rogers (2014).

THE US SHALE GAS REVOLUTION AND ITS IMPACT ON QATAR’S POSITION IN GAS MARKETS
30 | CENTER ON GLObAL ENERGY POLICY | COLUMbIA SIPA
0
2
4
6
8
10
12
14
16
18
2010 2015 2020 2025 2030
$/mm
btu
Henry Hub NBP
New Asian Oil Indexed LNG (90% JCC @$100/bbl) Asian Spot
New Asian Oil Indexed LNG (90% JCC @$80/bbl)
0
2
4
6
8
10
12
14
16
18
2010 2015 2020 2025 2030
$/mm
btu
Henry Hub
NBP
New Asian Oil Indexed LNG (90% JCC @$100/bbl)
Asian Spot Scenario 4
New Asian Oil Indexed LNG (90% JCC @$80/bbl)
Figure 15: Indicative regional price paths 2010–30, “Scenario 2 with Price War”Million British thermal units
Figure 16: Indicative regional price paths 2010–30, Scenario 4Million British thermal units
Source: Stern and Rogers (2014).
Source Stern and Rogers (2014).

THE US SHALE GAS REVOLUTION AND ITS IMPACT ON QATAR’S POSITION IN GAS MARKETS
[email protected] | MARCH 2015 | 31
New LNG capacity in Australia, North America, and probably also in Russia, Africa, and the Mediterranean, represents a competitive challenge for Qatar after 2015. In this section, we examine the likely impact of these capacity additions on the global LNG market and the implications of this for Qatar. Specifically, we focus on three such impli-cations: the impact on Qatar’s gas revenues; the impact on its pricing power; and Qatar’s investment choices.
REVENUE OUTCOMES
The scenarios introduced in the previous section (Future price scenarios impacting Qatar LNG sales) have been used to inform the evolution of pricing. The impact on Qatar’s gas revenues23 under the four scenarios is presented in the Appendix, based on an assumption of continued
Asian JCC-linked contract prices in Asia and oil product contracts in Europe at $100/bbl and $80/bbl, and spot price developments as shown in Figures 13–16. Total LNG sales revenue trends assuming an oil price of $100/bbl are shown in Figure 17.
In Figure 17, the annual sales revenue for Qatari LNG in destination markets is shown for the four scenarios de-scribed in the previous section, assuming $100/bbl oil. Clearly the highest revenue case is Scenario 4, where in 2022 revenues are 7 percent above the average of all cases in that year. The “Scenario 2 with Price War” case shows a marked dip around 2025, when annual revenue is 12 per-cent below the average of all cases in that year.
In Figure 18, the annual sales revenue for Qatari LNG in destination markets is shown for the four scenarios de-scribed, assuming $80/bbl oil. Compared to the $100/bbl
0
10
20
30
40
50
60
2010 2015 2020 2025 2030
$ Billi
ons p
er ye
ar
Scenario 1 Scenarios 2 and 3 Scenario 2 with Price War Scenario 4
Figure 17: Qatari LNG revenues ($ billions per year) in the four scenarios (oil price at $100/bbl)
Source: Authors’ calculations.
GLOBAL GAS MARKET DYNAMICS POST-2015 AND IMPACT ON QATAR
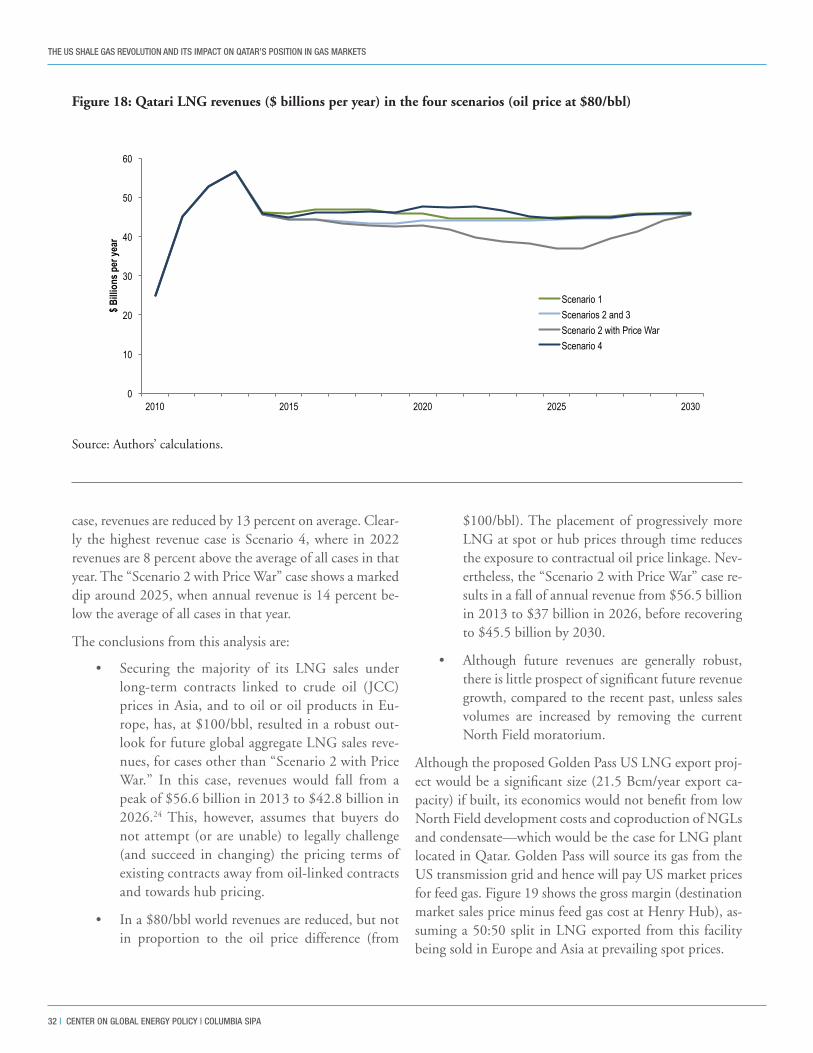
THE US SHALE GAS REVOLUTION AND ITS IMPACT ON QATAR’S POSITION IN GAS MARKETS
32 | CENTER ON GLObAL ENERGY POLICY | COLUMbIA SIPA
case, revenues are reduced by 13 percent on average. Clear-ly the highest revenue case is Scenario 4, where in 2022 revenues are 8 percent above the average of all cases in that year. The “Scenario 2 with Price War” case shows a marked dip around 2025, when annual revenue is 14 percent be-low the average of all cases in that year.
The conclusions from this analysis are:
• Securing the majority of its LNG sales under long-term contracts linked to crude oil (JCC) prices in Asia, and to oil or oil products in Eu-rope, has, at $100/bbl, resulted in a robust out-look for future global aggregate LNG sales reve-nues, for cases other than “Scenario 2 with Price War.” In this case, revenues would fall from a peak of $56.6 billion in 2013 to $42.8 billion in 2026.24 This, however, assumes that buyers do not attempt (or are unable) to legally challenge (and succeed in changing) the pricing terms of existing contracts away from oil-linked contracts and towards hub pricing.
• In a $80/bbl world revenues are reduced, but not in proportion to the oil price difference (from
$100/bbl). The placement of progressively more LNG at spot or hub prices through time reduces the exposure to contractual oil price linkage. Nev-ertheless, the “Scenario 2 with Price War” case re-sults in a fall of annual revenue from $56.5 billion in 2013 to $37 billion in 2026, before recovering to $45.5 billion by 2030.
• Although future revenues are generally robust, there is little prospect of significant future revenue growth, compared to the recent past, unless sales volumes are increased by removing the current North Field moratorium.
Although the proposed Golden Pass US LNG export proj-ect would be a significant size (21.5 Bcm/year export ca-pacity) if built, its economics would not benefit from low North Field development costs and coproduction of NGLs and condensate—which would be the case for LNG plant located in Qatar. Golden Pass will source its gas from the US transmission grid and hence will pay US market prices for feed gas. Figure 19 shows the gross margin (destination market sales price minus feed gas cost at Henry Hub), as-suming a 50:50 split in LNG exported from this facility being sold in Europe and Asia at prevailing spot prices.
0
10
20
30
40
50
60
2010 2015 2020 2025 2030
$ Billi
ons p
er ye
ar
Scenario 1 Scenarios 2 and 3 Scenario 2 with Price War Scenario 4
Figure 18: Qatari LNG revenues ($ billions per year) in the four scenarios (oil price at $80/bbl)
Source: Authors’ calculations.

THE US SHALE GAS REVOLUTION AND ITS IMPACT ON QATAR’S POSITION IN GAS MARKETS
[email protected] | MARCH 2015 | 33
The gross margin trends in Figure 19 take no account of capital cost recovery or shipping costs, which would sig-nificantly reduce the net cash contribution in all scenari-os. This project would be most exposed in Scenario 4 and in “Scenario 2 with Price War.” In Scenario 4, a low US production response would cause Henry Hub prices to rise as US LNG exporters continue to export while only covering variable costs. In “Scenario 2 with Price War,” the project would be exposed due to Russia depressing European hub prices (and through arbitrage Asian spot prices in the 2020s).
Projections of possible lower revenues come at a time when the Qatari government has embarked on a very ambitious public infrastructure investment program (new airport, port, metro, road, and railway) and other projects (pet-rochemical plants) to diversify its economy. According to the IMF (2014b), the investment projects amount to some $210 billion over 2014–21. A large part of the spending would come out of the government budget, as the gov-ernment is expected to provide an estimated $160 billion towards these projects (IMF, 2014b). Given Qatar’s heavy dependency on hydrocarbon revenues, rising government spending has increased breakeven oil prices over the years.
The IMF estimates that increased spending would drive fiscal breakeven prices even higher in the medium term to $78 by 2017, higher than the current oil price assump-tions for the budget (IMF, 2013). A decline in revenues (shown in all cases apart from Scenario 4 at $100/bbl), where LNG revenues fall in the rest of this decade, implies that the breakeven price could be even higher and Qatar could eventually run fiscal deficits.25
However, even if Qatar’s fiscal surplus turns into a defi-cit, it is important to note that the government would still be in a position to finance the gap. Qatar has low foreign and domestic debt, as well as large reserves of foreign currency (both at its Central Bank and the Sov-ereign Wealth Fund) that provide a large fiscal buffer; this means that Qatar is in a good position to deal with lower revenues for a considerable period of time. In 2013, Qatar’s gross total domestic debt was estimated at 24.3 percent of GDP, while its net domestic debt ratio was much lower, at 8.2 percent. Government external debt stood at 9.9 percent of GDP in 2013 (IMF, 2014a, Table 4). Also, Qatar does not have to balance its bud-get on an annual basis and has recourse to international markets, given its high sovereign credit rating. Finally,
0
1
2
3
4
5
6
2010 2015 2020 2025 2030
$ billi
ons p
er Y
ear
Scenario 1 Scenarios 2 and 3 Scenario 2 with Price War Scenario 4
Figure 19: Golden pass gross margin in the four scenarios ($ billions per year)
Source: Authors’ assumptions and calculations.
THE US SHALE GAS REVOLUTION AND ITS IMPACT ON QATAR’S POSITION IN GAS MARKETS
34 | CENTER ON GLObAL ENERGY POLICY | COLUMbIA SIPA
Qatar can always adjust its expenditure downwards if faced with lower revenues, especially if there are increas-ing concerns about the efficiency of public spending in Qatar (IMF, 2014b).26 In IMF projections where Qa-tar’s export revenues from LNG are expected to fall by $6.2 billion between 2013 and 2019, the overall fiscal deficit is projected to be at –0.5 percent of GDP while the current account balance will remain healthy at 6.5 percent in 2019—though this is a significant decline from the figure of 30 percent in 2013.
IMPLICATIONS FOR QATAR’S PRICING POWER
In recent years, Qatar has been able to balance the LNG market between the Atlantic and Pacific Basins, selling vol-umes to Europe when Asian prices are low and directing them eastwards at times of market tightness, but continu-ing to place LNG cargoes in Europe to support Asian pric-es. Allsopp and Stern (2012) regard such behavior as acting as a “discriminating monopolist” where a monopolist (or equally a like-minded oligopoly) has the freedom to dis-tribute its supply between a high priced, low price elastici-ty market (Asia) and a lower priced, higher price elasticity market (Europe). Its optimal solution is to restrict supply to the high price market (Asia) to secure higher margins. Diversion of a greater quantity from the low price market (Europe) would significantly reduce the premium market price (Asia) with little compensating increase in the Euro-pean market price.27 This is consistent with Qatar exercis-ing pricing power.
Various new arrivals are expected post-2015:
• LNG volumes from Australia, which will both displace spot volume imports in Japan and pro-vide additional supply that is not contracted un-der long-term contracts
• Volumes from the United States contracted by aggregators and portfolio players, much of which may be sold on the spot market
• Volumes from Russia, Canada, and East Africa, which, although mainly under long-term contracts (though not necessarily oil indexed in terms of price), might significantly increase the volume of spot LNG and the liquidity of LNG spot markets
These supplies all conspire to undermine Qatar’s future ability to continue the “discriminating monopolist” role described above (except for periods in Scenarios 1 and 4 where high Chinese demand creates a tight market, though in Scenario 1 this is eased by 2020). With other spot suppliers adding liquidity to the Europe–Asia spot LNG arbitrage dynamic, Qatar, with the objective of maximizing its revenue, would be driven to maximizing its spot sales in Asia, given its advantaged position (in terms of shipping costs between Europe and Asia) relative to the United States as the future marginal supplier of flexible LNG.
QATARI INVESTMENT CHOICES: OPPORTUNI-TIES IN THE EVENT THE NORTH FIELD MORA-TORIUM IS LIFTED
In the section on revenue outcomes, Qatar’s gas revenues were modelled on the basis that the current moratorium on North Field projects would remain in place. In this sec-tion, we examine which opportunities hold most promise for Qatar if the moratorium is lifted. It is assumed that Qatar is primarily motivated by maximizing its net cash flow/margin over the long term, given the options it has in terms of the use of its gas. The opportunities facing Qatar can be broken down into:
• existing projects/investments (gas consumption and marketed products already developed or planned); and
• potential future LNG projects, whose develop-ment would require a lifting of the current North Field moratorium.
Despite the rapid growth in domestic gas demand in the last few years, the share of gas production used for domestic consumption stood at less than 17 percent in 2012. There are limits to how fast the share of domestic consumption could rise. While Qatar has very ambitious plans to devel-op its petrochemical industry and has a strong comparative advantage in the petrochemical sector, it should be noted that many nations (such as Algeria and Trinidad and To-bago), on discovering substantial gas and NGL resources, seek to add value and provide skilled employment oppor-tunities by developing a domestic petrochemical industry. Thus, further investment in this sector would require a

THE US SHALE GAS REVOLUTION AND ITS IMPACT ON QATAR’S POSITION IN GAS MARKETS
[email protected] | MARCH 2015 | 35
product-specific, global supply–demand balance and com-petitor analysis to avoid margin erosion.28 Other sectors such as power and water would also constitute additional sources of domestic consumption. However, most of these sources of domestic demand are likely to be met by exist-ing upstream projects that are not subject to the mora-torium. Overall, it is forecast that domestic consumption will reach 23 percent of Qatar’s gas production in 2016. This represents an important rise, but it is not big enough to absorb additional sources of supply if the North Field moratorium is lifted.
Despite the strong initial interest in GTL in the early 2000s, massive capital cost overruns in the case of the Pearl project—Shell’s initial estimate for the project was $5 billion (Reuters, 2007), which increased to $19 bil-lion on project completion—and prioritizing the use of gas for domestic purposes have led to waning interest in monetizing gas via new GTL projects. It is highly unlike-ly the Qatari government will embark on new GTL proj-ects any time soon. Some of the planned projects, such as the Palm Project with ExxonMobil, were cancelled, while other projects have not moved beyond the expres-sion-of-interest phase. In fact, many industry analysts question the project economics of such large-scale plants if oil prices remain weak and/or if the cost of gas feed-stock increases even to current US levels. For large-scale, complex, capital intensive GTL projects, the differential between oil prices and gas feedstock prices must be very wide and this wide differential must persist for the entire life of the project for it to be economically viable. Given the wide uncertainties surrounding oil and gas markets, this is a risky proposition for many players including QP (Brown, 2013).
In terms of regional trade opportunities, the prospects are also weak. With far higher netbacks for internationally sold LNG, Qatar finds it unattractive to sell cheap pipeline gas to its next-door neighbors.
The most realistic option is to use the additional gas for developing future LNG projects. LNG economics in Qa-tar will depend on the following key factors:
• What is the (current) project cost of new up-stream units and facilities for wet gas production from the North Field?
• What is the current cost of new liquefaction trains in Qatar?
• To what extent does the coproduction of NGLs and condensate aid these investment economics?
• What is the attraction of the de-bottlenecking project of existing trains to Qatar?
Given the significant cost escalation incurred in upstream unit costs in general and (as shown in Figure 4) in LNG liquefaction costs in particular, it is important to take these factors into account when assessing the economics of future LNG projects. As discussed in the box below, “Developing an LNG Project,” in the event of the North Field moratorium being lifted, the construction of addi-tional LNG trains would be highly attractive investments. A project to de-bottleneck the existing trains fed by a new phase of North Field development would be even more ro-bust, due to the relatively low incremental capex required. With a successful track record in project management, an advantaged project location, and the ability to attract skilled labor, Qatar has a very strong comparative advan-tage relative to competitors such as Australia, Canada, East Africa, and Russia.
What will be the implications of Qatar increasing its LNG capacity? The earlier discussion of uncertainties around the six key drivers of the LNG and natural gas business en-vironment post-2015 highlights the difficulty of selecting the optimal timing for new LNG investment. In Stern and Rogers (2014), the period with the highest risk of LNG oversupply is seen as being between 2018 and 2023, but with some of the uncertainties (such as Chinese demand and US shale gas performance) the timing is difficult to predict well in advance. Qatar’s investment in new LNG projects would put pressure on prices, as this would inten-sify the extent of the oversupply. On the other hand, with such a high comparative advantage in LNG, investment in new capacity and expanding output could provide Qatar with more strategic choices. Qatar could follow a policy of deterring high-cost competitors by announcing post-mor-atorium projects in the near term and living with the con-sequences of a four- to five-year period where the risk of a price war yields lower prices.
In summary, while there is much uncertainty in global gas fundamentals and the possibility of a wide range of region-
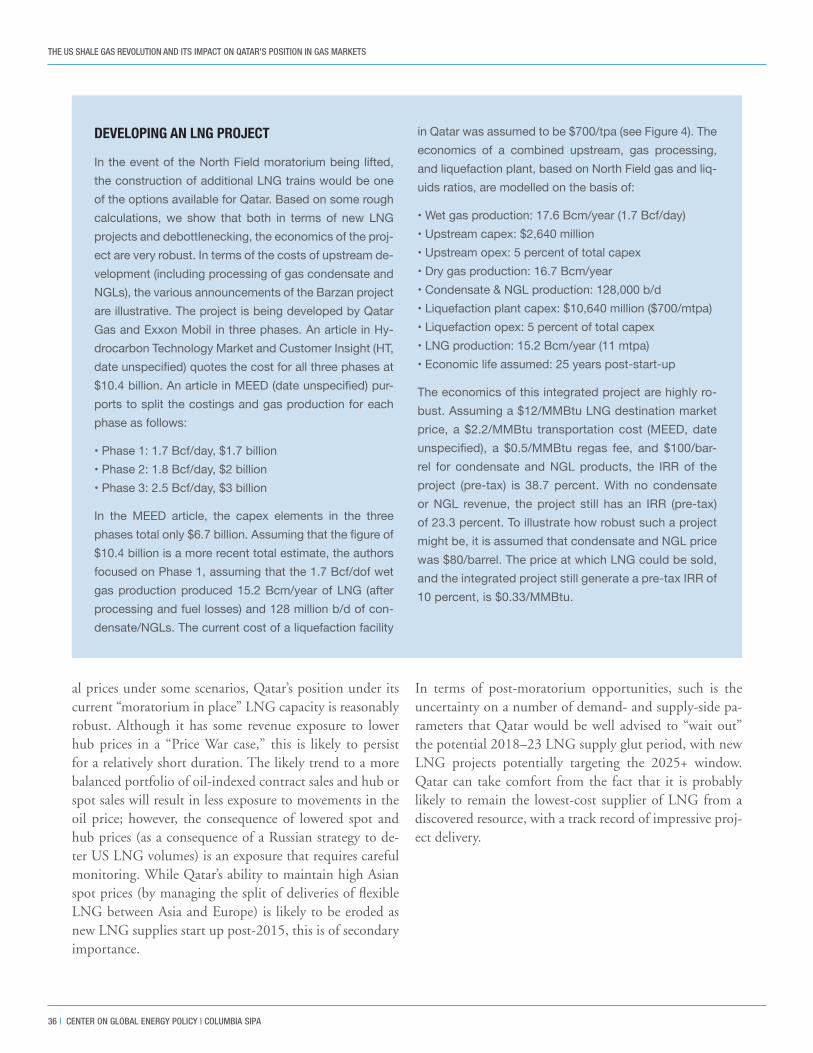
THE US SHALE GAS REVOLUTION AND ITS IMPACT ON QATAR’S POSITION IN GAS MARKETS
36 | CENTER ON GLObAL ENERGY POLICY | COLUMbIA SIPA
al prices under some scenarios, Qatar’s position under its current “moratorium in place” LNG capacity is reasonably robust. Although it has some revenue exposure to lower hub prices in a “Price War case,” this is likely to persist for a relatively short duration. The likely trend to a more balanced portfolio of oil-indexed contract sales and hub or spot sales will result in less exposure to movements in the oil price; however, the consequence of lowered spot and hub prices (as a consequence of a Russian strategy to de-ter US LNG volumes) is an exposure that requires careful monitoring. While Qatar’s ability to maintain high Asian spot prices (by managing the split of deliveries of flexible LNG between Asia and Europe) is likely to be eroded as new LNG supplies start up post-2015, this is of secondary importance.
In terms of post-moratorium opportunities, such is the uncertainty on a number of demand- and supply-side pa-rameters that Qatar would be well advised to “wait out” the potential 2018–23 LNG supply glut period, with new LNG projects potentially targeting the 2025+ window. Qatar can take comfort from the fact that it is probably likely to remain the lowest-cost supplier of LNG from a discovered resource, with a track record of impressive proj-ect delivery.
DEVELOPING AN LNG PROJECT
In the event of the North Field moratorium being lifted, the construction of additional LNG trains would be one of the options available for Qatar. Based on some rough calculations, we show that both in terms of new LNG projects and debottlenecking, the economics of the proj-ect are very robust. In terms of the costs of upstream de-velopment (including processing of gas condensate and NGLs), the various announcements of the Barzan project are illustrative. The project is being developed by Qatar Gas and Exxon Mobil in three phases. An article in Hy-drocarbon Technology Market and Customer Insight (HT, date unspecified) quotes the cost for all three phases at $10.4 billion. An article in MEED (date unspecified) pur-ports to split the costings and gas production for each phase as follows:
• Phase 1: 1.7 Bcf/day, $1.7 billion• Phase 2: 1.8 Bcf/day, $2 billion• Phase 3: 2.5 Bcf/day, $3 billion
In the MEED article, the capex elements in the three phases total only $6.7 billion. Assuming that the figure of $10.4 billion is a more recent total estimate, the authors focused on Phase 1, assuming that the 1.7 Bcf/dof wet gas production produced 15.2 Bcm/year of LNG (after processing and fuel losses) and 128 million b/d of con-densate/NGLs. The current cost of a liquefaction facility
in Qatar was assumed to be $700/tpa (see Figure 4). The economics of a combined upstream, gas processing, and liquefaction plant, based on North Field gas and liq-uids ratios, are modelled on the basis of:
• Wet gas production: 17.6 Bcm/year (1.7 Bcf/day)• Upstream capex: $2,640 million• Upstream opex: 5 percent of total capex• Dry gas production: 16.7 Bcm/year• Condensate & NGL production: 128,000 b/d• Liquefaction plant capex: $10,640 million ($700/mtpa)• Liquefaction opex: 5 percent of total capex• LNG production: 15.2 Bcm/year (11 mtpa)• Economic life assumed: 25 years post-start-up
The economics of this integrated project are highly ro-bust. Assuming a $12/MMBtu LNG destination market price, a $2.2/MMBtu transportation cost (MEED, date unspecified), a $0.5/MMBtu regas fee, and $100/bar-rel for condensate and NGL products, the IRR of the project (pre-tax) is 38.7 percent. With no condensate or NGL revenue, the project still has an IRR (pre-tax) of 23.3 percent. To illustrate how robust such a project might be, it is assumed that condensate and NGL price was $80/barrel. The price at which LNG could be sold, and the integrated project still generate a pre-tax IRR of 10 percent, is $0.33/MMBtu.
THE US SHALE GAS REVOLUTION AND ITS IMPACT ON QATAR’S POSITION IN GAS MARKETS
[email protected] | MARCH 2015 | 37
Qatar’s pattern of LNG sales has given it a diversified port-folio, which it has been able to optimize, particularly in diverting volumes to Asia, benefitting from high spot pric-es, while not collapsing the spread with European prices. However, the scope for further optimization is limited by (a) long term contractual commitments with European buyers, and (b) the changing dynamics of the world LNG business environment as new supply comes onstream (from the United States and Australia in particular, but also po-tentially from East Africa, Canada, and Russia) post-2015.
Looking ahead, it is likely that arbitrage will erode the recent high Asian LNG spot prices and there is a risk of oversupply in the 2018–23 period. However, the difficulty in forecasting the following factors makes the future sup-ply–demand balance uncertain:
• US production performance (and hence LNG ex-port volumes)
• The volume and timing of LNG supply from new projects outside the United States
• The impact of shale gas development outside the United States
• Russia’s response to increased competition
• Chinese gas and LNG demand
The US LNG export projects that look most likely to go ahead are all on the US Gulf or East Coasts, and LNG car-goes will be able to sail both westwards into Asia (through the expanded Panama Canal) or eastwards or southwards to buyers in the Atlantic basin. This will put the United States in a strong position to become the “swing supplier” between Asia and Europe/South America. This swing role has traditionally been held by Qatar, which can send car-goes west into Europe or eastwards into Asia.
A key factor is that LNG exports from the United States will not be destination-restricted, and therefore buyers will be able to sell cargoes to other destinations if they do not need them for their own use. This will allow buyers to
cooperate together and optimize the availability of LNG. Therefore the absolute volume of LNG exports that is al-lowed by the United States may be less important than the fact that the volumes can be flexibly traded.
Russia’s response to an “overspill” of excess LNG volumes into Europe could also exacerbate the situation and give rise to a “price war,” which would impact not only Euro-pean hub prices but also potentially Henry Hub prices and Asian LNG spot prices.
The US volumes will also increase pressure on LNG ex-porters to offer more flexible price indexation. Several US LNG export projects have already offered volumes on a Henry Hub–related basis rather than the traditional oil in-dexation, in response to buyers in northeast Asia seeking more diversified pricing. Many of the other projects being developed prefer oil indexation to gas-on-gas pricing, how-ever, and the development of an Asian gas hub remains a distant goal. US LNG exports are likely, therefore, to encourage a gradual movement towards more flexible and diverse pricing systems, rather than lead to any immediate overturning of the traditional system of oil indexation.
The availability of freely tradable LNG is likely over time to encourage the further development of a spot market in LNG cargoes, and to lead to more flexible price indexation. This may in turn encourage the evolution of an Asian hub. There is no certainty as to when this will come about, nor where, with Shanghai, Singapore, and Japan/Korea having competing claims to become the pricing benchmark.
These changes in the global LNG scene are likely to have an impact on Qatar’s revenues. In a recent report the IMF notes that, “while the U.S. shale gas boom has not meaningfully affected revenues so far, it is starting to put downward pressure on prices negotiated for future LNG supplies.” Our analysis and calculations based on various scenarios tend to support this view. However, it is import-ant to stress that Qatar has fiscal buffers and is endowed with huge natural resources, which will allow it to adjust to these challenges. Furthermore, although there is con-
CONCLUSIONS
THE US SHALE GAS REVOLUTION AND ITS IMPACT ON QATAR’S POSITION IN GAS MARKETS
38 | CENTER ON GLObAL ENERGY POLICY | COLUMbIA SIPA
cern that US LNG exports will depress gas prices in the Asia–Pacific region, it is not likely that prices will “fall off a cliff ’; the rents extracted from the gas sector will remain high given the low cost of developing Qatar’s gas reserves. The official view that Qatar “does not consider the US shale gas revolution to be a game changer but rather a validation of Qatar’s strategy” and that “Qatar’s role as an undisputed leader in the global energy market is set to re-main for years to come” contains some elements of truth, as Qatar will remain prosperous for many years to come. However, this view tends to underestimate the dramatic transformations in the global scene and the challenges that these would pose for Qatar’s marketing strategy and for its pricing power.
It is also important to stress that Qatar still retains the power to act strategically. Despite the growing competi-tion, Qatar has a very strong comparative advantage in LNG based on its track record, advantageous geographical position, accessible project sites, and the shallow, benign offshore field locations. Even accounting for the escalation in upstream and LNG costs in the late 2000s, these attri-butes make it probably the lowest-cost producer of all its new greenfield project competitors (Australia, East Africa, Canada, Russia) and Qatar will continue to have a cost advantage over many of the new projects. Furthermore, since Qatar produces and exports significant quantities of condensate and NGLs in association with natural gas, its effective average cost of producing LNG is lower than that of its competitors. If Qatar intends to lift the moratorium, it is likely that the best investment opportunities for Qa-tar are (a) de-bottlenecking of existing LNG trains, and (b) additional new LNG trains—both with associated up-stream development of new North Field phases. In terms of timing, Qatar may wish to await further clarification of the scale of US exports and Chinese demand growth and aim to start up new trains at the end of the 2018–23 po-tential “soft market” window. Alternatively, it might seek to intimidate competitors into deferring competing proj-ects by announcing a firm intent to bring on new volumes as soon as possible once an announcement of the lifting of the moratorium is effected. Thus, the decisions that Qatar takes in the next few years will remain key to future global LNG market dynamics.
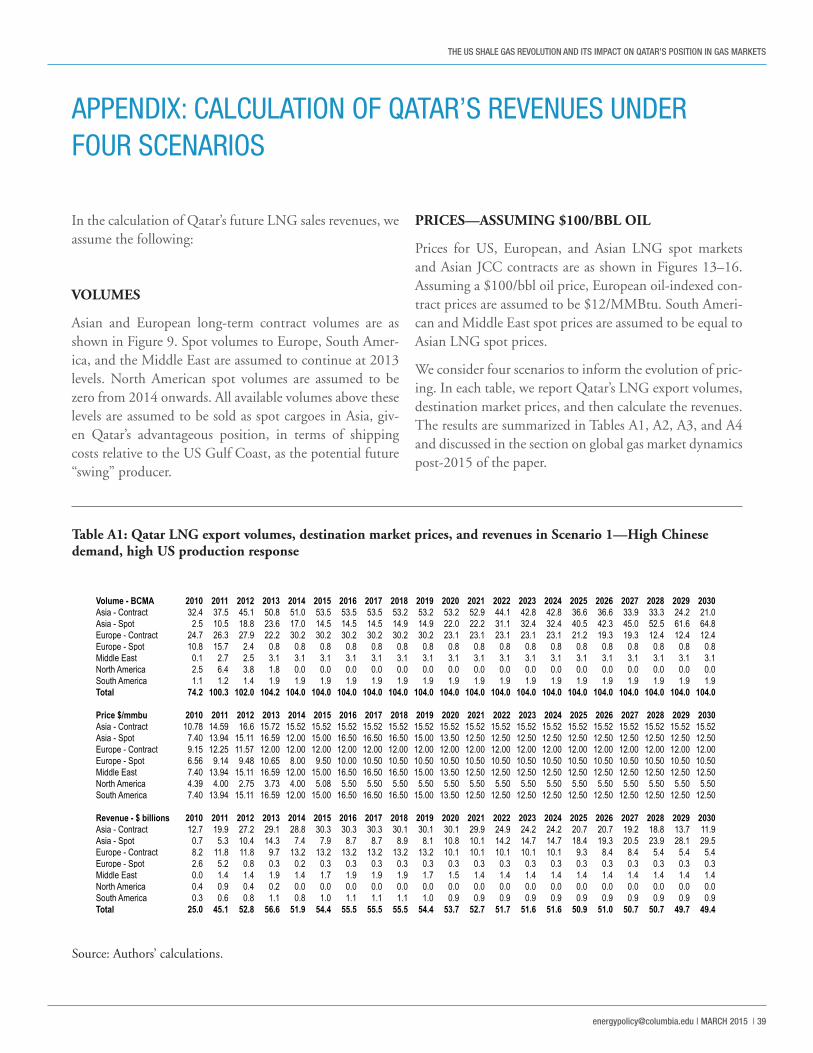
THE US SHALE GAS REVOLUTION AND ITS IMPACT ON QATAR’S POSITION IN GAS MARKETS
[email protected] | MARCH 2015 | 39
In the calculation of Qatar’s future LNG sales revenues, we assume the following:
VOLUMES
Asian and European long-term contract volumes are as shown in Figure 9. Spot volumes to Europe, South Amer-ica, and the Middle East are assumed to continue at 2013 levels. North American spot volumes are assumed to be zero from 2014 onwards. All available volumes above these levels are assumed to be sold as spot cargoes in Asia, giv-en Qatar’s advantageous position, in terms of shipping costs relative to the US Gulf Coast, as the potential future “swing” producer.
PRICES—ASSUMING $100/BBL OIL
Prices for US, European, and Asian LNG spot markets and Asian JCC contracts are as shown in Figures 13–16. Assuming a $100/bbl oil price, European oil-indexed con-tract prices are assumed to be $12/MMBtu. South Ameri-can and Middle East spot prices are assumed to be equal to Asian LNG spot prices.
We consider four scenarios to inform the evolution of pric-ing. In each table, we report Qatar’s LNG export volumes, destination market prices, and then calculate the revenues. The results are summarized in Tables A1, A2, A3, and A4 and discussed in the section on global gas market dynamics post-2015 of the paper.
APPENDIX: CALCULATION OF QATAR’S REVENUES UNDER FOUR SCENARIOS
Volume - BCMA 2010 2011 2012 2013 2014 2015 2016 2017 2018 2019 2020 2021 2022 2023 2024 2025 2026 2027 2028 2029 2030Asia - Contract 32.4 37.5 45.1 50.8 51.0 53.5 53.5 53.5 53.2 53.2 53.2 52.9 44.1 42.8 42.8 36.6 36.6 33.9 33.3 24.2 21.0Asia - Spot 2.5 10.5 18.8 23.6 17.0 14.5 14.5 14.5 14.9 14.9 22.0 22.2 31.1 32.4 32.4 40.5 42.3 45.0 52.5 61.6 64.8Europe - Contract 24.7 26.3 27.9 22.2 30.2 30.2 30.2 30.2 30.2 30.2 23.1 23.1 23.1 23.1 23.1 21.2 19.3 19.3 12.4 12.4 12.4Europe - Spot 10.8 15.7 2.4 0.8 0.8 0.8 0.8 0.8 0.8 0.8 0.8 0.8 0.8 0.8 0.8 0.8 0.8 0.8 0.8 0.8 0.8Middle East 0.1 2.7 2.5 3.1 3.1 3.1 3.1 3.1 3.1 3.1 3.1 3.1 3.1 3.1 3.1 3.1 3.1 3.1 3.1 3.1 3.1North America 2.5 6.4 3.8 1.8 0.0 0.0 0.0 0.0 0.0 0.0 0.0 0.0 0.0 0.0 0.0 0.0 0.0 0.0 0.0 0.0 0.0South America 1.1 1.2 1.4 1.9 1.9 1.9 1.9 1.9 1.9 1.9 1.9 1.9 1.9 1.9 1.9 1.9 1.9 1.9 1.9 1.9 1.9Total 74.2 100.3 102.0 104.2 104.0 104.0 104.0 104.0 104.0 104.0 104.0 104.0 104.0 104.0 104.0 104.0 104.0 104.0 104.0 104.0 104.0
Price $/mmbu 2010 2011 2012 2013 2014 2015 2016 2017 2018 2019 2020 2021 2022 2023 2024 2025 2026 2027 2028 2029 2030Asia - Contract 10.78 14.59 16.6 15.72 15.52 15.52 15.52 15.52 15.52 15.52 15.52 15.52 15.52 15.52 15.52 15.52 15.52 15.52 15.52 15.52 15.52Asia - Spot 7.40 13.94 15.11 16.59 12.00 15.00 16.50 16.50 16.50 15.00 13.50 12.50 12.50 12.50 12.50 12.50 12.50 12.50 12.50 12.50 12.50Europe - Contract 9.15 12.25 11.57 12.00 12.00 12.00 12.00 12.00 12.00 12.00 12.00 12.00 12.00 12.00 12.00 12.00 12.00 12.00 12.00 12.00 12.00Europe - Spot 6.56 9.14 9.48 10.65 8.00 9.50 10.00 10.50 10.50 10.50 10.50 10.50 10.50 10.50 10.50 10.50 10.50 10.50 10.50 10.50 10.50Middle East 7.40 13.94 15.11 16.59 12.00 15.00 16.50 16.50 16.50 15.00 13.50 12.50 12.50 12.50 12.50 12.50 12.50 12.50 12.50 12.50 12.50North America 4.39 4.00 2.75 3.73 4.00 5.08 5.50 5.50 5.50 5.50 5.50 5.50 5.50 5.50 5.50 5.50 5.50 5.50 5.50 5.50 5.50South America 7.40 13.94 15.11 16.59 12.00 15.00 16.50 16.50 16.50 15.00 13.50 12.50 12.50 12.50 12.50 12.50 12.50 12.50 12.50 12.50 12.50
Revenue - $ billions 2010 2011 2012 2013 2014 2015 2016 2017 2018 2019 2020 2021 2022 2023 2024 2025 2026 2027 2028 2029 2030Asia - Contract 12.7 19.9 27.2 29.1 28.8 30.3 30.3 30.3 30.1 30.1 30.1 29.9 24.9 24.2 24.2 20.7 20.7 19.2 18.8 13.7 11.9Asia - Spot 0.7 5.3 10.4 14.3 7.4 7.9 8.7 8.7 8.9 8.1 10.8 10.1 14.2 14.7 14.7 18.4 19.3 20.5 23.9 28.1 29.5Europe - Contract 8.2 11.8 11.8 9.7 13.2 13.2 13.2 13.2 13.2 13.2 10.1 10.1 10.1 10.1 10.1 9.3 8.4 8.4 5.4 5.4 5.4Europe - Spot 2.6 5.2 0.8 0.3 0.2 0.3 0.3 0.3 0.3 0.3 0.3 0.3 0.3 0.3 0.3 0.3 0.3 0.3 0.3 0.3 0.3Middle East 0.0 1.4 1.4 1.9 1.4 1.7 1.9 1.9 1.9 1.7 1.5 1.4 1.4 1.4 1.4 1.4 1.4 1.4 1.4 1.4 1.4North America 0.4 0.9 0.4 0.2 0.0 0.0 0.0 0.0 0.0 0.0 0.0 0.0 0.0 0.0 0.0 0.0 0.0 0.0 0.0 0.0 0.0South America 0.3 0.6 0.8 1.1 0.8 1.0 1.1 1.1 1.1 1.0 0.9 0.9 0.9 0.9 0.9 0.9 0.9 0.9 0.9 0.9 0.9Total 25.0 45.1 52.8 56.6 51.9 54.4 55.5 55.5 55.5 54.4 53.7 52.7 51.7 51.6 51.6 50.9 51.0 50.7 50.7 49.7 49.4
Table A1: Qatar LNG export volumes, destination market prices, and revenues in Scenario 1—High Chinese demand, high US production response
Source: Authors’ calculations.
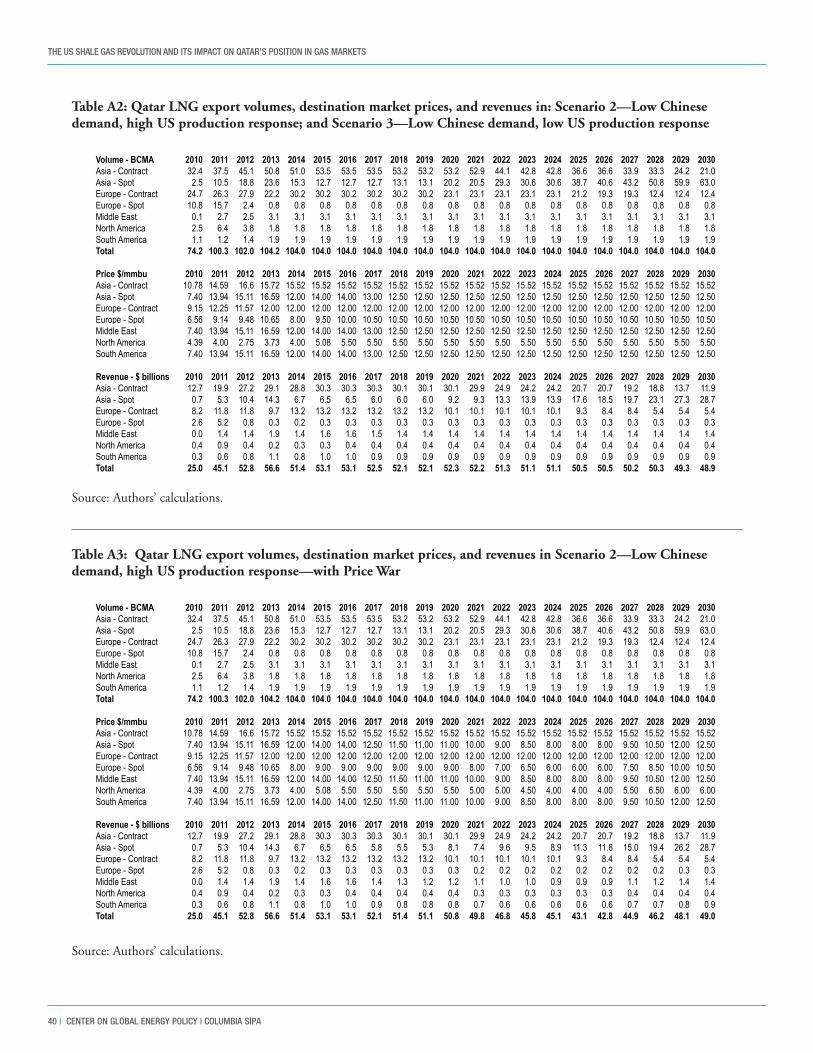
THE US SHALE GAS REVOLUTION AND ITS IMPACT ON QATAR’S POSITION IN GAS MARKETS
40 | CENTER ON GLObAL ENERGY POLICY | COLUMbIA SIPA
Volume - BCMA 2010 2011 2012 2013 2014 2015 2016 2017 2018 2019 2020 2021 2022 2023 2024 2025 2026 2027 2028 2029 2030Asia - Contract 32.4 37.5 45.1 50.8 51.0 53.5 53.5 53.5 53.2 53.2 53.2 52.9 44.1 42.8 42.8 36.6 36.6 33.9 33.3 24.2 21.0Asia - Spot 2.5 10.5 18.8 23.6 15.3 12.7 12.7 12.7 13.1 13.1 20.2 20.5 29.3 30.6 30.6 38.7 40.6 43.2 50.8 59.9 63.0Europe - Contract 24.7 26.3 27.9 22.2 30.2 30.2 30.2 30.2 30.2 30.2 23.1 23.1 23.1 23.1 23.1 21.2 19.3 19.3 12.4 12.4 12.4Europe - Spot 10.8 15.7 2.4 0.8 0.8 0.8 0.8 0.8 0.8 0.8 0.8 0.8 0.8 0.8 0.8 0.8 0.8 0.8 0.8 0.8 0.8Middle East 0.1 2.7 2.5 3.1 3.1 3.1 3.1 3.1 3.1 3.1 3.1 3.1 3.1 3.1 3.1 3.1 3.1 3.1 3.1 3.1 3.1North America 2.5 6.4 3.8 1.8 1.8 1.8 1.8 1.8 1.8 1.8 1.8 1.8 1.8 1.8 1.8 1.8 1.8 1.8 1.8 1.8 1.8South America 1.1 1.2 1.4 1.9 1.9 1.9 1.9 1.9 1.9 1.9 1.9 1.9 1.9 1.9 1.9 1.9 1.9 1.9 1.9 1.9 1.9Total 74.2 100.3 102.0 104.2 104.0 104.0 104.0 104.0 104.0 104.0 104.0 104.0 104.0 104.0 104.0 104.0 104.0 104.0 104.0 104.0 104.0
Price $/mmbu 2010 2011 2012 2013 2014 2015 2016 2017 2018 2019 2020 2021 2022 2023 2024 2025 2026 2027 2028 2029 2030Asia - Contract 10.78 14.59 16.6 15.72 15.52 15.52 15.52 15.52 15.52 15.52 15.52 15.52 15.52 15.52 15.52 15.52 15.52 15.52 15.52 15.52 15.52Asia - Spot 7.40 13.94 15.11 16.59 12.00 14.00 14.00 12.50 11.50 11.00 11.00 10.00 9.00 8.50 8.00 8.00 8.00 9.50 10.50 12.00 12.50Europe - Contract 9.15 12.25 11.57 12.00 12.00 12.00 12.00 12.00 12.00 12.00 12.00 12.00 12.00 12.00 12.00 12.00 12.00 12.00 12.00 12.00 12.00Europe - Spot 6.56 9.14 9.48 10.65 8.00 9.00 9.00 9.00 9.00 9.00 9.00 8.00 7.00 6.50 6.00 6.00 6.00 7.50 8.50 10.00 10.50Middle East 7.40 13.94 15.11 16.59 12.00 14.00 14.00 12.50 11.50 11.00 11.00 10.00 9.00 8.50 8.00 8.00 8.00 9.50 10.50 12.00 12.50North America 4.39 4.00 2.75 3.73 4.00 5.08 5.50 5.50 5.50 5.50 5.50 5.00 5.00 4.50 4.00 4.00 4.00 5.50 6.50 6.00 6.00South America 7.40 13.94 15.11 16.59 12.00 14.00 14.00 12.50 11.50 11.00 11.00 10.00 9.00 8.50 8.00 8.00 8.00 9.50 10.50 12.00 12.50
Revenue - $ billions 2010 2011 2012 2013 2014 2015 2016 2017 2018 2019 2020 2021 2022 2023 2024 2025 2026 2027 2028 2029 2030Asia - Contract 12.7 19.9 27.2 29.1 28.8 30.3 30.3 30.3 30.1 30.1 30.1 29.9 24.9 24.2 24.2 20.7 20.7 19.2 18.8 13.7 11.9Asia - Spot 0.7 5.3 10.4 14.3 6.7 6.5 6.5 5.8 5.5 5.3 8.1 7.4 9.6 9.5 8.9 11.3 11.8 15.0 19.4 26.2 28.7Europe - Contract 8.2 11.8 11.8 9.7 13.2 13.2 13.2 13.2 13.2 13.2 10.1 10.1 10.1 10.1 10.1 9.3 8.4 8.4 5.4 5.4 5.4Europe - Spot 2.6 5.2 0.8 0.3 0.2 0.3 0.3 0.3 0.3 0.3 0.3 0.2 0.2 0.2 0.2 0.2 0.2 0.2 0.2 0.3 0.3Middle East 0.0 1.4 1.4 1.9 1.4 1.6 1.6 1.4 1.3 1.2 1.2 1.1 1.0 1.0 0.9 0.9 0.9 1.1 1.2 1.4 1.4North America 0.4 0.9 0.4 0.2 0.3 0.3 0.4 0.4 0.4 0.4 0.4 0.3 0.3 0.3 0.3 0.3 0.3 0.4 0.4 0.4 0.4South America 0.3 0.6 0.8 1.1 0.8 1.0 1.0 0.9 0.8 0.8 0.8 0.7 0.6 0.6 0.6 0.6 0.6 0.7 0.7 0.8 0.9Total 25.0 45.1 52.8 56.6 51.4 53.1 53.1 52.1 51.4 51.1 50.8 49.8 46.8 45.8 45.1 43.1 42.8 44.9 46.2 48.1 49.0
Volume - BCMA 2010 2011 2012 2013 2014 2015 2016 2017 2018 2019 2020 2021 2022 2023 2024 2025 2026 2027 2028 2029 2030Asia - Contract 32.4 37.5 45.1 50.8 51.0 53.5 53.5 53.5 53.2 53.2 53.2 52.9 44.1 42.8 42.8 36.6 36.6 33.9 33.3 24.2 21.0Asia - Spot 2.5 10.5 18.8 23.6 15.3 12.7 12.7 12.7 13.1 13.1 20.2 20.5 29.3 30.6 30.6 38.7 40.6 43.2 50.8 59.9 63.0Europe - Contract 24.7 26.3 27.9 22.2 30.2 30.2 30.2 30.2 30.2 30.2 23.1 23.1 23.1 23.1 23.1 21.2 19.3 19.3 12.4 12.4 12.4Europe - Spot 10.8 15.7 2.4 0.8 0.8 0.8 0.8 0.8 0.8 0.8 0.8 0.8 0.8 0.8 0.8 0.8 0.8 0.8 0.8 0.8 0.8Middle East 0.1 2.7 2.5 3.1 3.1 3.1 3.1 3.1 3.1 3.1 3.1 3.1 3.1 3.1 3.1 3.1 3.1 3.1 3.1 3.1 3.1North America 2.5 6.4 3.8 1.8 1.8 1.8 1.8 1.8 1.8 1.8 1.8 1.8 1.8 1.8 1.8 1.8 1.8 1.8 1.8 1.8 1.8South America 1.1 1.2 1.4 1.9 1.9 1.9 1.9 1.9 1.9 1.9 1.9 1.9 1.9 1.9 1.9 1.9 1.9 1.9 1.9 1.9 1.9Total 74.2 100.3 102.0 104.2 104.0 104.0 104.0 104.0 104.0 104.0 104.0 104.0 104.0 104.0 104.0 104.0 104.0 104.0 104.0 104.0 104.0
Price $/mmbu 2010 2011 2012 2013 2014 2015 2016 2017 2018 2019 2020 2021 2022 2023 2024 2025 2026 2027 2028 2029 2030Asia - Contract 10.78 14.59 16.6 15.72 15.52 15.52 15.52 15.52 15.52 15.52 15.52 15.52 15.52 15.52 15.52 15.52 15.52 15.52 15.52 15.52 15.52Asia - Spot 7.40 13.94 15.11 16.59 12.00 14.00 14.00 13.00 12.50 12.50 12.50 12.50 12.50 12.50 12.50 12.50 12.50 12.50 12.50 12.50 12.50Europe - Contract 9.15 12.25 11.57 12.00 12.00 12.00 12.00 12.00 12.00 12.00 12.00 12.00 12.00 12.00 12.00 12.00 12.00 12.00 12.00 12.00 12.00Europe - Spot 6.56 9.14 9.48 10.65 8.00 9.50 10.00 10.50 10.50 10.50 10.50 10.50 10.50 10.50 10.50 10.50 10.50 10.50 10.50 10.50 10.50Middle East 7.40 13.94 15.11 16.59 12.00 14.00 14.00 13.00 12.50 12.50 12.50 12.50 12.50 12.50 12.50 12.50 12.50 12.50 12.50 12.50 12.50North America 4.39 4.00 2.75 3.73 4.00 5.08 5.50 5.50 5.50 5.50 5.50 5.50 5.50 5.50 5.50 5.50 5.50 5.50 5.50 5.50 5.50South America 7.40 13.94 15.11 16.59 12.00 14.00 14.00 13.00 12.50 12.50 12.50 12.50 12.50 12.50 12.50 12.50 12.50 12.50 12.50 12.50 12.50
Revenue - $ billions 2010 2011 2012 2013 2014 2015 2016 2017 2018 2019 2020 2021 2022 2023 2024 2025 2026 2027 2028 2029 2030Asia - Contract 12.7 19.9 27.2 29.1 28.8 30.3 30.3 30.3 30.1 30.1 30.1 29.9 24.9 24.2 24.2 20.7 20.7 19.2 18.8 13.7 11.9Asia - Spot 0.7 5.3 10.4 14.3 6.7 6.5 6.5 6.0 6.0 6.0 9.2 9.3 13.3 13.9 13.9 17.6 18.5 19.7 23.1 27.3 28.7Europe - Contract 8.2 11.8 11.8 9.7 13.2 13.2 13.2 13.2 13.2 13.2 10.1 10.1 10.1 10.1 10.1 9.3 8.4 8.4 5.4 5.4 5.4Europe - Spot 2.6 5.2 0.8 0.3 0.2 0.3 0.3 0.3 0.3 0.3 0.3 0.3 0.3 0.3 0.3 0.3 0.3 0.3 0.3 0.3 0.3Middle East 0.0 1.4 1.4 1.9 1.4 1.6 1.6 1.5 1.4 1.4 1.4 1.4 1.4 1.4 1.4 1.4 1.4 1.4 1.4 1.4 1.4North America 0.4 0.9 0.4 0.2 0.3 0.3 0.4 0.4 0.4 0.4 0.4 0.4 0.4 0.4 0.4 0.4 0.4 0.4 0.4 0.4 0.4South America 0.3 0.6 0.8 1.1 0.8 1.0 1.0 0.9 0.9 0.9 0.9 0.9 0.9 0.9 0.9 0.9 0.9 0.9 0.9 0.9 0.9Total 25.0 45.1 52.8 56.6 51.4 53.1 53.1 52.5 52.1 52.1 52.3 52.2 51.3 51.1 51.1 50.5 50.5 50.2 50.3 49.3 48.9
Table A3: Qatar LNG export volumes, destination market prices, and revenues in Scenario 2—Low Chinese demand, high US production response—with Price War
Table A2: Qatar LNG export volumes, destination market prices, and revenues in: Scenario 2—Low Chinese demand, high US production response; and Scenario 3—Low Chinese demand, low US production response
Source: Authors’ calculations.
Source: Authors’ calculations.
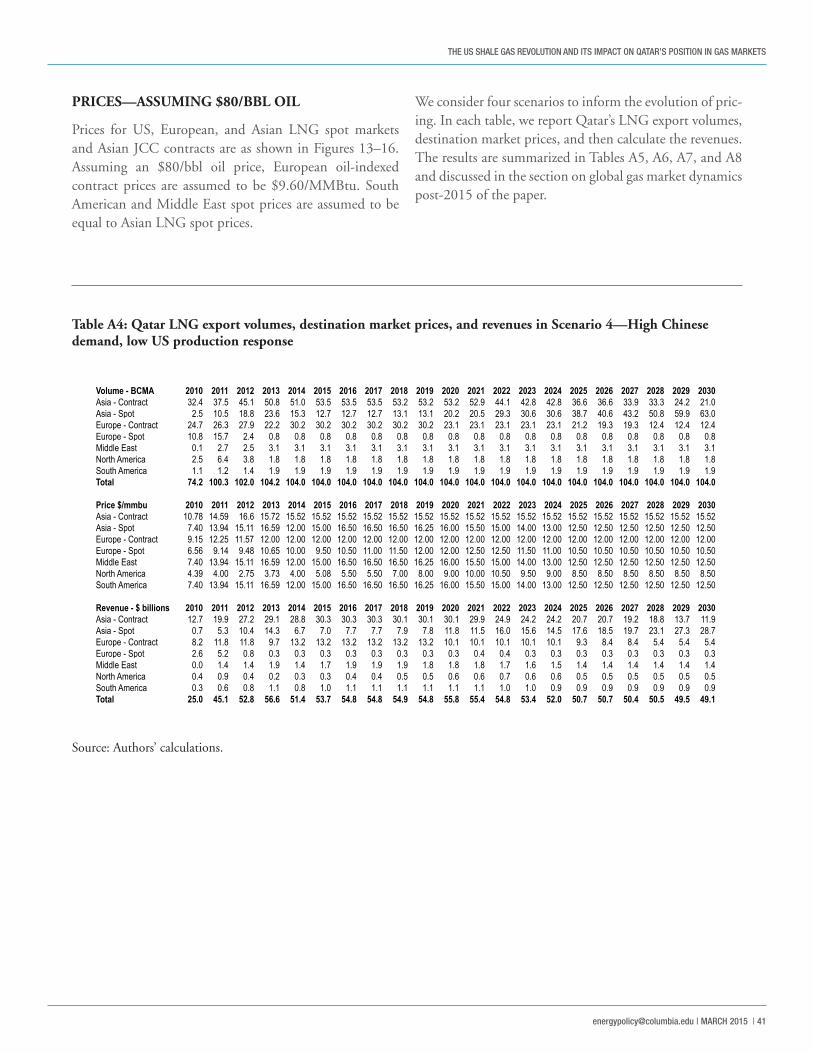
THE US SHALE GAS REVOLUTION AND ITS IMPACT ON QATAR’S POSITION IN GAS MARKETS
[email protected] | MARCH 2015 | 41
PRICES—ASSUMING $80/BBL OIL
Prices for US, European, and Asian LNG spot markets and Asian JCC contracts are as shown in Figures 13–16. Assuming an $80/bbl oil price, European oil-indexed contract prices are assumed to be $9.60/MMBtu. South American and Middle East spot prices are assumed to be equal to Asian LNG spot prices.
We consider four scenarios to inform the evolution of pric-ing. In each table, we report Qatar’s LNG export volumes, destination market prices, and then calculate the revenues. The results are summarized in Tables A5, A6, A7, and A8 and discussed in the section on global gas market dynamics post-2015 of the paper.
Volume - BCMA 2010 2011 2012 2013 2014 2015 2016 2017 2018 2019 2020 2021 2022 2023 2024 2025 2026 2027 2028 2029 2030Asia - Contract 32.4 37.5 45.1 50.8 51.0 53.5 53.5 53.5 53.2 53.2 53.2 52.9 44.1 42.8 42.8 36.6 36.6 33.9 33.3 24.2 21.0Asia - Spot 2.5 10.5 18.8 23.6 15.3 12.7 12.7 12.7 13.1 13.1 20.2 20.5 29.3 30.6 30.6 38.7 40.6 43.2 50.8 59.9 63.0Europe - Contract 24.7 26.3 27.9 22.2 30.2 30.2 30.2 30.2 30.2 30.2 23.1 23.1 23.1 23.1 23.1 21.2 19.3 19.3 12.4 12.4 12.4Europe - Spot 10.8 15.7 2.4 0.8 0.8 0.8 0.8 0.8 0.8 0.8 0.8 0.8 0.8 0.8 0.8 0.8 0.8 0.8 0.8 0.8 0.8Middle East 0.1 2.7 2.5 3.1 3.1 3.1 3.1 3.1 3.1 3.1 3.1 3.1 3.1 3.1 3.1 3.1 3.1 3.1 3.1 3.1 3.1North America 2.5 6.4 3.8 1.8 1.8 1.8 1.8 1.8 1.8 1.8 1.8 1.8 1.8 1.8 1.8 1.8 1.8 1.8 1.8 1.8 1.8South America 1.1 1.2 1.4 1.9 1.9 1.9 1.9 1.9 1.9 1.9 1.9 1.9 1.9 1.9 1.9 1.9 1.9 1.9 1.9 1.9 1.9Total 74.2 100.3 102.0 104.2 104.0 104.0 104.0 104.0 104.0 104.0 104.0 104.0 104.0 104.0 104.0 104.0 104.0 104.0 104.0 104.0 104.0
Price $/mmbu 2010 2011 2012 2013 2014 2015 2016 2017 2018 2019 2020 2021 2022 2023 2024 2025 2026 2027 2028 2029 2030Asia - Contract 10.78 14.59 16.6 15.72 15.52 15.52 15.52 15.52 15.52 15.52 15.52 15.52 15.52 15.52 15.52 15.52 15.52 15.52 15.52 15.52 15.52Asia - Spot 7.40 13.94 15.11 16.59 12.00 15.00 16.50 16.50 16.50 16.25 16.00 15.50 15.00 14.00 13.00 12.50 12.50 12.50 12.50 12.50 12.50Europe - Contract 9.15 12.25 11.57 12.00 12.00 12.00 12.00 12.00 12.00 12.00 12.00 12.00 12.00 12.00 12.00 12.00 12.00 12.00 12.00 12.00 12.00Europe - Spot 6.56 9.14 9.48 10.65 10.00 9.50 10.50 11.00 11.50 12.00 12.00 12.50 12.50 11.50 11.00 10.50 10.50 10.50 10.50 10.50 10.50Middle East 7.40 13.94 15.11 16.59 12.00 15.00 16.50 16.50 16.50 16.25 16.00 15.50 15.00 14.00 13.00 12.50 12.50 12.50 12.50 12.50 12.50North America 4.39 4.00 2.75 3.73 4.00 5.08 5.50 5.50 7.00 8.00 9.00 10.00 10.50 9.50 9.00 8.50 8.50 8.50 8.50 8.50 8.50South America 7.40 13.94 15.11 16.59 12.00 15.00 16.50 16.50 16.50 16.25 16.00 15.50 15.00 14.00 13.00 12.50 12.50 12.50 12.50 12.50 12.50
Revenue - $ billions 2010 2011 2012 2013 2014 2015 2016 2017 2018 2019 2020 2021 2022 2023 2024 2025 2026 2027 2028 2029 2030Asia - Contract 12.7 19.9 27.2 29.1 28.8 30.3 30.3 30.3 30.1 30.1 30.1 29.9 24.9 24.2 24.2 20.7 20.7 19.2 18.8 13.7 11.9Asia - Spot 0.7 5.3 10.4 14.3 6.7 7.0 7.7 7.7 7.9 7.8 11.8 11.5 16.0 15.6 14.5 17.6 18.5 19.7 23.1 27.3 28.7Europe - Contract 8.2 11.8 11.8 9.7 13.2 13.2 13.2 13.2 13.2 13.2 10.1 10.1 10.1 10.1 10.1 9.3 8.4 8.4 5.4 5.4 5.4Europe - Spot 2.6 5.2 0.8 0.3 0.3 0.3 0.3 0.3 0.3 0.3 0.3 0.4 0.4 0.3 0.3 0.3 0.3 0.3 0.3 0.3 0.3Middle East 0.0 1.4 1.4 1.9 1.4 1.7 1.9 1.9 1.9 1.8 1.8 1.8 1.7 1.6 1.5 1.4 1.4 1.4 1.4 1.4 1.4North America 0.4 0.9 0.4 0.2 0.3 0.3 0.4 0.4 0.5 0.5 0.6 0.6 0.7 0.6 0.6 0.5 0.5 0.5 0.5 0.5 0.5South America 0.3 0.6 0.8 1.1 0.8 1.0 1.1 1.1 1.1 1.1 1.1 1.1 1.0 1.0 0.9 0.9 0.9 0.9 0.9 0.9 0.9Total 25.0 45.1 52.8 56.6 51.4 53.7 54.8 54.8 54.9 54.8 55.8 55.4 54.8 53.4 52.0 50.7 50.7 50.4 50.5 49.5 49.1
Table A4: Qatar LNG export volumes, destination market prices, and revenues in Scenario 4—High Chinese demand, low US production response
Source: Authors’ calculations.
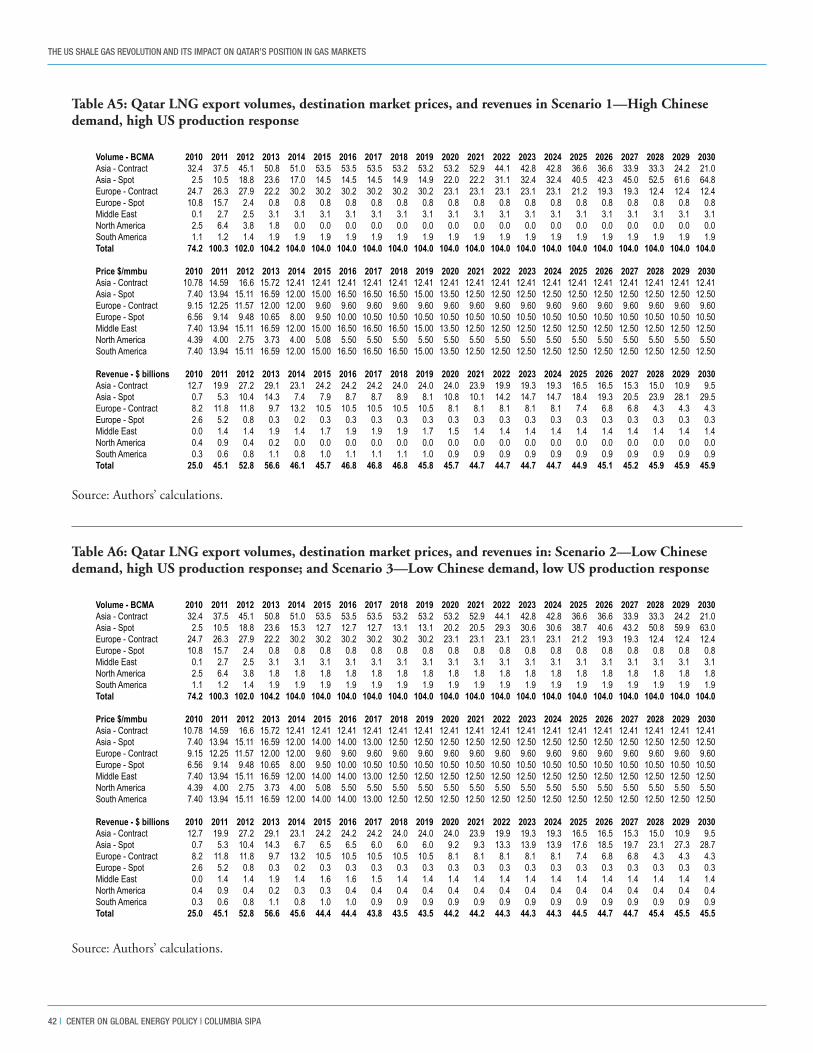
THE US SHALE GAS REVOLUTION AND ITS IMPACT ON QATAR’S POSITION IN GAS MARKETS
42 | CENTER ON GLObAL ENERGY POLICY | COLUMbIA SIPA
Volume - BCMA 2010 2011 2012 2013 2014 2015 2016 2017 2018 2019 2020 2021 2022 2023 2024 2025 2026 2027 2028 2029 2030Asia - Contract 32.4 37.5 45.1 50.8 51.0 53.5 53.5 53.5 53.2 53.2 53.2 52.9 44.1 42.8 42.8 36.6 36.6 33.9 33.3 24.2 21.0Asia - Spot 2.5 10.5 18.8 23.6 15.3 12.7 12.7 12.7 13.1 13.1 20.2 20.5 29.3 30.6 30.6 38.7 40.6 43.2 50.8 59.9 63.0Europe - Contract 24.7 26.3 27.9 22.2 30.2 30.2 30.2 30.2 30.2 30.2 23.1 23.1 23.1 23.1 23.1 21.2 19.3 19.3 12.4 12.4 12.4Europe - Spot 10.8 15.7 2.4 0.8 0.8 0.8 0.8 0.8 0.8 0.8 0.8 0.8 0.8 0.8 0.8 0.8 0.8 0.8 0.8 0.8 0.8Middle East 0.1 2.7 2.5 3.1 3.1 3.1 3.1 3.1 3.1 3.1 3.1 3.1 3.1 3.1 3.1 3.1 3.1 3.1 3.1 3.1 3.1North America 2.5 6.4 3.8 1.8 1.8 1.8 1.8 1.8 1.8 1.8 1.8 1.8 1.8 1.8 1.8 1.8 1.8 1.8 1.8 1.8 1.8South America 1.1 1.2 1.4 1.9 1.9 1.9 1.9 1.9 1.9 1.9 1.9 1.9 1.9 1.9 1.9 1.9 1.9 1.9 1.9 1.9 1.9Total 74.2 100.3 102.0 104.2 104.0 104.0 104.0 104.0 104.0 104.0 104.0 104.0 104.0 104.0 104.0 104.0 104.0 104.0 104.0 104.0 104.0
Price $/mmbu 2010 2011 2012 2013 2014 2015 2016 2017 2018 2019 2020 2021 2022 2023 2024 2025 2026 2027 2028 2029 2030Asia - Contract 10.78 14.59 16.6 15.72 12.41 12.41 12.41 12.41 12.41 12.41 12.41 12.41 12.41 12.41 12.41 12.41 12.41 12.41 12.41 12.41 12.41Asia - Spot 7.40 13.94 15.11 16.59 12.00 14.00 14.00 13.00 12.50 12.50 12.50 12.50 12.50 12.50 12.50 12.50 12.50 12.50 12.50 12.50 12.50Europe - Contract 9.15 12.25 11.57 12.00 12.00 9.60 9.60 9.60 9.60 9.60 9.60 9.60 9.60 9.60 9.60 9.60 9.60 9.60 9.60 9.60 9.60Europe - Spot 6.56 9.14 9.48 10.65 8.00 9.50 10.00 10.50 10.50 10.50 10.50 10.50 10.50 10.50 10.50 10.50 10.50 10.50 10.50 10.50 10.50Middle East 7.40 13.94 15.11 16.59 12.00 14.00 14.00 13.00 12.50 12.50 12.50 12.50 12.50 12.50 12.50 12.50 12.50 12.50 12.50 12.50 12.50North America 4.39 4.00 2.75 3.73 4.00 5.08 5.50 5.50 5.50 5.50 5.50 5.50 5.50 5.50 5.50 5.50 5.50 5.50 5.50 5.50 5.50South America 7.40 13.94 15.11 16.59 12.00 14.00 14.00 13.00 12.50 12.50 12.50 12.50 12.50 12.50 12.50 12.50 12.50 12.50 12.50 12.50 12.50
Revenue - $ billions 2010 2011 2012 2013 2014 2015 2016 2017 2018 2019 2020 2021 2022 2023 2024 2025 2026 2027 2028 2029 2030Asia - Contract 12.7 19.9 27.2 29.1 23.1 24.2 24.2 24.2 24.0 24.0 24.0 23.9 19.9 19.3 19.3 16.5 16.5 15.3 15.0 10.9 9.5Asia - Spot 0.7 5.3 10.4 14.3 6.7 6.5 6.5 6.0 6.0 6.0 9.2 9.3 13.3 13.9 13.9 17.6 18.5 19.7 23.1 27.3 28.7Europe - Contract 8.2 11.8 11.8 9.7 13.2 10.5 10.5 10.5 10.5 10.5 8.1 8.1 8.1 8.1 8.1 7.4 6.8 6.8 4.3 4.3 4.3Europe - Spot 2.6 5.2 0.8 0.3 0.2 0.3 0.3 0.3 0.3 0.3 0.3 0.3 0.3 0.3 0.3 0.3 0.3 0.3 0.3 0.3 0.3Middle East 0.0 1.4 1.4 1.9 1.4 1.6 1.6 1.5 1.4 1.4 1.4 1.4 1.4 1.4 1.4 1.4 1.4 1.4 1.4 1.4 1.4North America 0.4 0.9 0.4 0.2 0.3 0.3 0.4 0.4 0.4 0.4 0.4 0.4 0.4 0.4 0.4 0.4 0.4 0.4 0.4 0.4 0.4South America 0.3 0.6 0.8 1.1 0.8 1.0 1.0 0.9 0.9 0.9 0.9 0.9 0.9 0.9 0.9 0.9 0.9 0.9 0.9 0.9 0.9Total 25.0 45.1 52.8 56.6 45.6 44.4 44.4 43.8 43.5 43.5 44.2 44.2 44.3 44.3 44.3 44.5 44.7 44.7 45.4 45.5 45.5
Volume - BCMA 2010 2011 2012 2013 2014 2015 2016 2017 2018 2019 2020 2021 2022 2023 2024 2025 2026 2027 2028 2029 2030Asia - Contract 32.4 37.5 45.1 50.8 51.0 53.5 53.5 53.5 53.2 53.2 53.2 52.9 44.1 42.8 42.8 36.6 36.6 33.9 33.3 24.2 21.0Asia - Spot 2.5 10.5 18.8 23.6 17.0 14.5 14.5 14.5 14.9 14.9 22.0 22.2 31.1 32.4 32.4 40.5 42.3 45.0 52.5 61.6 64.8Europe - Contract 24.7 26.3 27.9 22.2 30.2 30.2 30.2 30.2 30.2 30.2 23.1 23.1 23.1 23.1 23.1 21.2 19.3 19.3 12.4 12.4 12.4Europe - Spot 10.8 15.7 2.4 0.8 0.8 0.8 0.8 0.8 0.8 0.8 0.8 0.8 0.8 0.8 0.8 0.8 0.8 0.8 0.8 0.8 0.8Middle East 0.1 2.7 2.5 3.1 3.1 3.1 3.1 3.1 3.1 3.1 3.1 3.1 3.1 3.1 3.1 3.1 3.1 3.1 3.1 3.1 3.1North America 2.5 6.4 3.8 1.8 0.0 0.0 0.0 0.0 0.0 0.0 0.0 0.0 0.0 0.0 0.0 0.0 0.0 0.0 0.0 0.0 0.0South America 1.1 1.2 1.4 1.9 1.9 1.9 1.9 1.9 1.9 1.9 1.9 1.9 1.9 1.9 1.9 1.9 1.9 1.9 1.9 1.9 1.9Total 74.2 100.3 102.0 104.2 104.0 104.0 104.0 104.0 104.0 104.0 104.0 104.0 104.0 104.0 104.0 104.0 104.0 104.0 104.0 104.0 104.0
Price $/mmbu 2010 2011 2012 2013 2014 2015 2016 2017 2018 2019 2020 2021 2022 2023 2024 2025 2026 2027 2028 2029 2030Asia - Contract 10.78 14.59 16.6 15.72 12.41 12.41 12.41 12.41 12.41 12.41 12.41 12.41 12.41 12.41 12.41 12.41 12.41 12.41 12.41 12.41 12.41Asia - Spot 7.40 13.94 15.11 16.59 12.00 15.00 16.50 16.50 16.50 15.00 13.50 12.50 12.50 12.50 12.50 12.50 12.50 12.50 12.50 12.50 12.50Europe - Contract 9.15 12.25 11.57 12.00 12.00 9.60 9.60 9.60 9.60 9.60 9.60 9.60 9.60 9.60 9.60 9.60 9.60 9.60 9.60 9.60 9.60Europe - Spot 6.56 9.14 9.48 10.65 8.00 9.50 10.00 10.50 10.50 10.50 10.50 10.50 10.50 10.50 10.50 10.50 10.50 10.50 10.50 10.50 10.50Middle East 7.40 13.94 15.11 16.59 12.00 15.00 16.50 16.50 16.50 15.00 13.50 12.50 12.50 12.50 12.50 12.50 12.50 12.50 12.50 12.50 12.50North America 4.39 4.00 2.75 3.73 4.00 5.08 5.50 5.50 5.50 5.50 5.50 5.50 5.50 5.50 5.50 5.50 5.50 5.50 5.50 5.50 5.50South America 7.40 13.94 15.11 16.59 12.00 15.00 16.50 16.50 16.50 15.00 13.50 12.50 12.50 12.50 12.50 12.50 12.50 12.50 12.50 12.50 12.50
Revenue - $ billions 2010 2011 2012 2013 2014 2015 2016 2017 2018 2019 2020 2021 2022 2023 2024 2025 2026 2027 2028 2029 2030Asia - Contract 12.7 19.9 27.2 29.1 23.1 24.2 24.2 24.2 24.0 24.0 24.0 23.9 19.9 19.3 19.3 16.5 16.5 15.3 15.0 10.9 9.5Asia - Spot 0.7 5.3 10.4 14.3 7.4 7.9 8.7 8.7 8.9 8.1 10.8 10.1 14.2 14.7 14.7 18.4 19.3 20.5 23.9 28.1 29.5Europe - Contract 8.2 11.8 11.8 9.7 13.2 10.5 10.5 10.5 10.5 10.5 8.1 8.1 8.1 8.1 8.1 7.4 6.8 6.8 4.3 4.3 4.3Europe - Spot 2.6 5.2 0.8 0.3 0.2 0.3 0.3 0.3 0.3 0.3 0.3 0.3 0.3 0.3 0.3 0.3 0.3 0.3 0.3 0.3 0.3Middle East 0.0 1.4 1.4 1.9 1.4 1.7 1.9 1.9 1.9 1.7 1.5 1.4 1.4 1.4 1.4 1.4 1.4 1.4 1.4 1.4 1.4North America 0.4 0.9 0.4 0.2 0.0 0.0 0.0 0.0 0.0 0.0 0.0 0.0 0.0 0.0 0.0 0.0 0.0 0.0 0.0 0.0 0.0South America 0.3 0.6 0.8 1.1 0.8 1.0 1.1 1.1 1.1 1.0 0.9 0.9 0.9 0.9 0.9 0.9 0.9 0.9 0.9 0.9 0.9Total 25.0 45.1 52.8 56.6 46.1 45.7 46.8 46.8 46.8 45.8 45.7 44.7 44.7 44.7 44.7 44.9 45.1 45.2 45.9 45.9 45.9
Table A6: Qatar LNG export volumes, destination market prices, and revenues in: Scenario 2—Low Chinese demand, high US production response; and Scenario 3—Low Chinese demand, low US production response
Table A5: Qatar LNG export volumes, destination market prices, and revenues in Scenario 1—High Chinese demand, high US production response
Source: Authors’ calculations.
Source: Authors’ calculations.
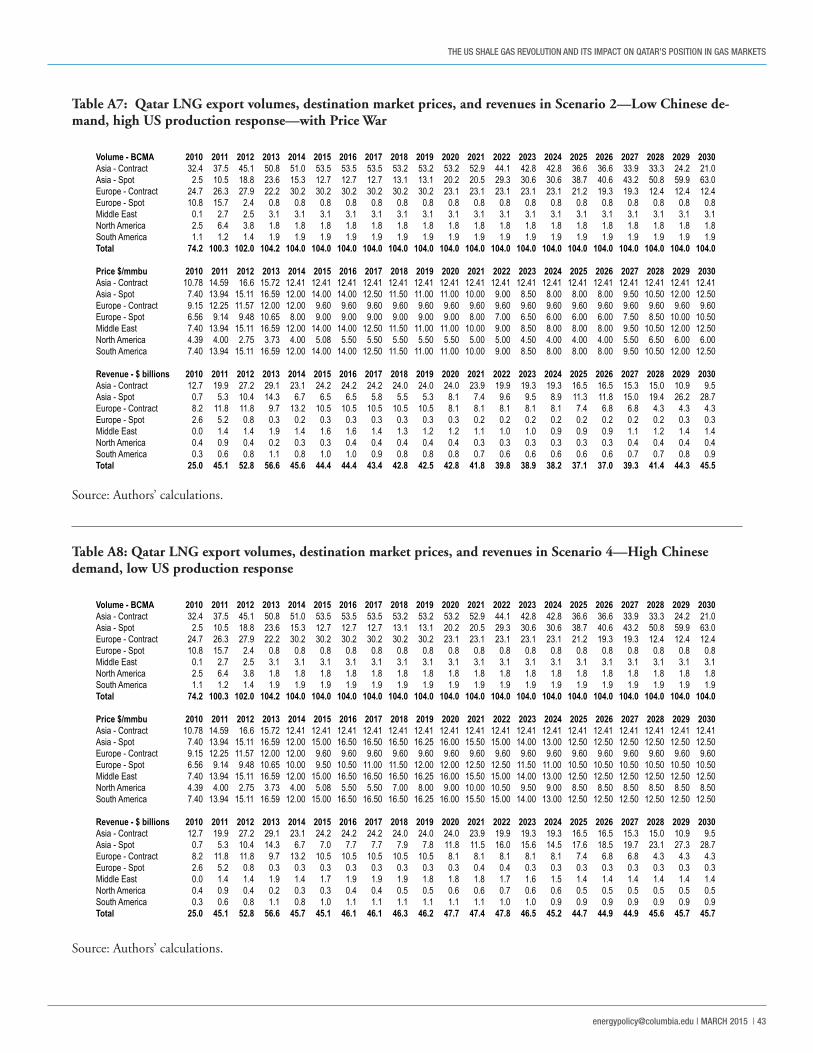
THE US SHALE GAS REVOLUTION AND ITS IMPACT ON QATAR’S POSITION IN GAS MARKETS
[email protected] | MARCH 2015 | 43
Volume - BCMA 2010 2011 2012 2013 2014 2015 2016 2017 2018 2019 2020 2021 2022 2023 2024 2025 2026 2027 2028 2029 2030Asia - Contract 32.4 37.5 45.1 50.8 51.0 53.5 53.5 53.5 53.2 53.2 53.2 52.9 44.1 42.8 42.8 36.6 36.6 33.9 33.3 24.2 21.0Asia - Spot 2.5 10.5 18.8 23.6 15.3 12.7 12.7 12.7 13.1 13.1 20.2 20.5 29.3 30.6 30.6 38.7 40.6 43.2 50.8 59.9 63.0Europe - Contract 24.7 26.3 27.9 22.2 30.2 30.2 30.2 30.2 30.2 30.2 23.1 23.1 23.1 23.1 23.1 21.2 19.3 19.3 12.4 12.4 12.4Europe - Spot 10.8 15.7 2.4 0.8 0.8 0.8 0.8 0.8 0.8 0.8 0.8 0.8 0.8 0.8 0.8 0.8 0.8 0.8 0.8 0.8 0.8Middle East 0.1 2.7 2.5 3.1 3.1 3.1 3.1 3.1 3.1 3.1 3.1 3.1 3.1 3.1 3.1 3.1 3.1 3.1 3.1 3.1 3.1North America 2.5 6.4 3.8 1.8 1.8 1.8 1.8 1.8 1.8 1.8 1.8 1.8 1.8 1.8 1.8 1.8 1.8 1.8 1.8 1.8 1.8South America 1.1 1.2 1.4 1.9 1.9 1.9 1.9 1.9 1.9 1.9 1.9 1.9 1.9 1.9 1.9 1.9 1.9 1.9 1.9 1.9 1.9Total 74.2 100.3 102.0 104.2 104.0 104.0 104.0 104.0 104.0 104.0 104.0 104.0 104.0 104.0 104.0 104.0 104.0 104.0 104.0 104.0 104.0
Price $/mmbu 2010 2011 2012 2013 2014 2015 2016 2017 2018 2019 2020 2021 2022 2023 2024 2025 2026 2027 2028 2029 2030Asia - Contract 10.78 14.59 16.6 15.72 12.41 12.41 12.41 12.41 12.41 12.41 12.41 12.41 12.41 12.41 12.41 12.41 12.41 12.41 12.41 12.41 12.41Asia - Spot 7.40 13.94 15.11 16.59 12.00 15.00 16.50 16.50 16.50 16.25 16.00 15.50 15.00 14.00 13.00 12.50 12.50 12.50 12.50 12.50 12.50Europe - Contract 9.15 12.25 11.57 12.00 12.00 9.60 9.60 9.60 9.60 9.60 9.60 9.60 9.60 9.60 9.60 9.60 9.60 9.60 9.60 9.60 9.60Europe - Spot 6.56 9.14 9.48 10.65 10.00 9.50 10.50 11.00 11.50 12.00 12.00 12.50 12.50 11.50 11.00 10.50 10.50 10.50 10.50 10.50 10.50Middle East 7.40 13.94 15.11 16.59 12.00 15.00 16.50 16.50 16.50 16.25 16.00 15.50 15.00 14.00 13.00 12.50 12.50 12.50 12.50 12.50 12.50North America 4.39 4.00 2.75 3.73 4.00 5.08 5.50 5.50 7.00 8.00 9.00 10.00 10.50 9.50 9.00 8.50 8.50 8.50 8.50 8.50 8.50South America 7.40 13.94 15.11 16.59 12.00 15.00 16.50 16.50 16.50 16.25 16.00 15.50 15.00 14.00 13.00 12.50 12.50 12.50 12.50 12.50 12.50
Revenue - $ billions 2010 2011 2012 2013 2014 2015 2016 2017 2018 2019 2020 2021 2022 2023 2024 2025 2026 2027 2028 2029 2030Asia - Contract 12.7 19.9 27.2 29.1 23.1 24.2 24.2 24.2 24.0 24.0 24.0 23.9 19.9 19.3 19.3 16.5 16.5 15.3 15.0 10.9 9.5Asia - Spot 0.7 5.3 10.4 14.3 6.7 7.0 7.7 7.7 7.9 7.8 11.8 11.5 16.0 15.6 14.5 17.6 18.5 19.7 23.1 27.3 28.7Europe - Contract 8.2 11.8 11.8 9.7 13.2 10.5 10.5 10.5 10.5 10.5 8.1 8.1 8.1 8.1 8.1 7.4 6.8 6.8 4.3 4.3 4.3Europe - Spot 2.6 5.2 0.8 0.3 0.3 0.3 0.3 0.3 0.3 0.3 0.3 0.4 0.4 0.3 0.3 0.3 0.3 0.3 0.3 0.3 0.3Middle East 0.0 1.4 1.4 1.9 1.4 1.7 1.9 1.9 1.9 1.8 1.8 1.8 1.7 1.6 1.5 1.4 1.4 1.4 1.4 1.4 1.4North America 0.4 0.9 0.4 0.2 0.3 0.3 0.4 0.4 0.5 0.5 0.6 0.6 0.7 0.6 0.6 0.5 0.5 0.5 0.5 0.5 0.5South America 0.3 0.6 0.8 1.1 0.8 1.0 1.1 1.1 1.1 1.1 1.1 1.1 1.0 1.0 0.9 0.9 0.9 0.9 0.9 0.9 0.9Total 25.0 45.1 52.8 56.6 45.7 45.1 46.1 46.1 46.3 46.2 47.7 47.4 47.8 46.5 45.2 44.7 44.9 44.9 45.6 45.7 45.7
Volume - BCMA 2010 2011 2012 2013 2014 2015 2016 2017 2018 2019 2020 2021 2022 2023 2024 2025 2026 2027 2028 2029 2030Asia - Contract 32.4 37.5 45.1 50.8 51.0 53.5 53.5 53.5 53.2 53.2 53.2 52.9 44.1 42.8 42.8 36.6 36.6 33.9 33.3 24.2 21.0Asia - Spot 2.5 10.5 18.8 23.6 15.3 12.7 12.7 12.7 13.1 13.1 20.2 20.5 29.3 30.6 30.6 38.7 40.6 43.2 50.8 59.9 63.0Europe - Contract 24.7 26.3 27.9 22.2 30.2 30.2 30.2 30.2 30.2 30.2 23.1 23.1 23.1 23.1 23.1 21.2 19.3 19.3 12.4 12.4 12.4Europe - Spot 10.8 15.7 2.4 0.8 0.8 0.8 0.8 0.8 0.8 0.8 0.8 0.8 0.8 0.8 0.8 0.8 0.8 0.8 0.8 0.8 0.8Middle East 0.1 2.7 2.5 3.1 3.1 3.1 3.1 3.1 3.1 3.1 3.1 3.1 3.1 3.1 3.1 3.1 3.1 3.1 3.1 3.1 3.1North America 2.5 6.4 3.8 1.8 1.8 1.8 1.8 1.8 1.8 1.8 1.8 1.8 1.8 1.8 1.8 1.8 1.8 1.8 1.8 1.8 1.8South America 1.1 1.2 1.4 1.9 1.9 1.9 1.9 1.9 1.9 1.9 1.9 1.9 1.9 1.9 1.9 1.9 1.9 1.9 1.9 1.9 1.9Total 74.2 100.3 102.0 104.2 104.0 104.0 104.0 104.0 104.0 104.0 104.0 104.0 104.0 104.0 104.0 104.0 104.0 104.0 104.0 104.0 104.0
Price $/mmbu 2010 2011 2012 2013 2014 2015 2016 2017 2018 2019 2020 2021 2022 2023 2024 2025 2026 2027 2028 2029 2030Asia - Contract 10.78 14.59 16.6 15.72 12.41 12.41 12.41 12.41 12.41 12.41 12.41 12.41 12.41 12.41 12.41 12.41 12.41 12.41 12.41 12.41 12.41Asia - Spot 7.40 13.94 15.11 16.59 12.00 14.00 14.00 12.50 11.50 11.00 11.00 10.00 9.00 8.50 8.00 8.00 8.00 9.50 10.50 12.00 12.50Europe - Contract 9.15 12.25 11.57 12.00 12.00 9.60 9.60 9.60 9.60 9.60 9.60 9.60 9.60 9.60 9.60 9.60 9.60 9.60 9.60 9.60 9.60Europe - Spot 6.56 9.14 9.48 10.65 8.00 9.00 9.00 9.00 9.00 9.00 9.00 8.00 7.00 6.50 6.00 6.00 6.00 7.50 8.50 10.00 10.50Middle East 7.40 13.94 15.11 16.59 12.00 14.00 14.00 12.50 11.50 11.00 11.00 10.00 9.00 8.50 8.00 8.00 8.00 9.50 10.50 12.00 12.50North America 4.39 4.00 2.75 3.73 4.00 5.08 5.50 5.50 5.50 5.50 5.50 5.00 5.00 4.50 4.00 4.00 4.00 5.50 6.50 6.00 6.00South America 7.40 13.94 15.11 16.59 12.00 14.00 14.00 12.50 11.50 11.00 11.00 10.00 9.00 8.50 8.00 8.00 8.00 9.50 10.50 12.00 12.50
Revenue - $ billions 2010 2011 2012 2013 2014 2015 2016 2017 2018 2019 2020 2021 2022 2023 2024 2025 2026 2027 2028 2029 2030Asia - Contract 12.7 19.9 27.2 29.1 23.1 24.2 24.2 24.2 24.0 24.0 24.0 23.9 19.9 19.3 19.3 16.5 16.5 15.3 15.0 10.9 9.5Asia - Spot 0.7 5.3 10.4 14.3 6.7 6.5 6.5 5.8 5.5 5.3 8.1 7.4 9.6 9.5 8.9 11.3 11.8 15.0 19.4 26.2 28.7Europe - Contract 8.2 11.8 11.8 9.7 13.2 10.5 10.5 10.5 10.5 10.5 8.1 8.1 8.1 8.1 8.1 7.4 6.8 6.8 4.3 4.3 4.3Europe - Spot 2.6 5.2 0.8 0.3 0.2 0.3 0.3 0.3 0.3 0.3 0.3 0.2 0.2 0.2 0.2 0.2 0.2 0.2 0.2 0.3 0.3Middle East 0.0 1.4 1.4 1.9 1.4 1.6 1.6 1.4 1.3 1.2 1.2 1.1 1.0 1.0 0.9 0.9 0.9 1.1 1.2 1.4 1.4North America 0.4 0.9 0.4 0.2 0.3 0.3 0.4 0.4 0.4 0.4 0.4 0.3 0.3 0.3 0.3 0.3 0.3 0.4 0.4 0.4 0.4South America 0.3 0.6 0.8 1.1 0.8 1.0 1.0 0.9 0.8 0.8 0.8 0.7 0.6 0.6 0.6 0.6 0.6 0.7 0.7 0.8 0.9Total 25.0 45.1 52.8 56.6 45.6 44.4 44.4 43.4 42.8 42.5 42.8 41.8 39.8 38.9 38.2 37.1 37.0 39.3 41.4 44.3 45.5
Table A8: Qatar LNG export volumes, destination market prices, and revenues in Scenario 4—High Chinese demand, low US production response
Table A7: Qatar LNG export volumes, destination market prices, and revenues in Scenario 2—Low Chinese de-mand, high US production response—with Price War
Source: Authors’ calculations.
Source: Authors’ calculations.
THE US SHALE GAS REVOLUTION AND ITS IMPACT ON QATAR’S POSITION IN GAS MARKETS
44 | CENTER ON GLObAL ENERGY POLICY | COLUMbIA SIPA
1 Discovered by Shell in 1971, B. Fattouh and J. Stern (2011, eds.), p. 308.
2 The term “swing supplier” relates to the destination of its exports, not a variation in LNG production levels.
3 This ability to discriminate can in part explain the observed price differentials across the two markets and the willingness of Qatar to sell LNG in Europe even when prices are low.
4 This view, however, is not shared by Qatari officials. In a recent interview, Saleh Al-Sada, Qatar’s energy minister, stat-ed that “we do not consider the US shale gas revolution to be a game changer but rather a validation of Qatar’s strategy … Qatar’s role as an undisputed leader in the global energy market is set to remain for years to come.” Telegraph (2014).
5 The same source quoted Fitch’s separate assessment as $17.8/bbl and $2.3/MMBtu.
6 MEES (2014a). In addition to technical issues, Qatar may be wary about any potential Iranian response to a rapid develop-ment of the North Field. On many occasions, Iran has accused Qatar of producing more gas than “her right share” from the field and that Iran “will not allow” its wealth to be used by oth-ers. See Katzman, 2014. Qatar has also offered assistance to help develop its share of the field so that both countries can reap the maximum long-term rewards. (Reuters, 2013).
7 Germany’s Wintershall has made a 2.5 trillion cubic feet (Tcf ) find in the shallower Khuff formation at Block 4N, and the firm has yet to work out with QP how to develop the discov-ery (MEES, 2014d).
8 Hence their production rates are not constrained by associ-ated oil production rates (and potentially OPEC quotas) and a requirement for gas reinjection to sustain oil reservoir operating pressure.
9 This is based on BMI (2013); Gupta (2013).
10 BMI (2013).
11 Utilizing a floating import terminal.
12 Qatar National Bank. The pipeline has a nameplate capac-ity of 3.2 Bcf/day, but actual supplies average around 2 Bcf/day. To boost effective pipeline capacity, the Dolphin Energy con-sortium last year began a $370m project to increase the number of compressors from six to nine. While this will increase effec-tive capacity, it is not clear where additional gas for the Dolphin pipeline would come from (see MEES, 2014b).
13 In early 2014, the withdrawal by Bahrain, Saudi Arabia, and the UAE of their ambassadors from Qatar exposed a serious rift amongst the GCC members. Rifts within the Gulf Cooper-ation Council relate to a number of issues; these include Qatar’s support of Muslim Brotherhood and different views on how to deal with the repercussions of the Arab Spring. As MEES notes, “the differences this time around were fundamental and not easy to sweep under the carpet, as is the usual practice” MEES (2014c). Although relations between Qatar and the rest of the GCC have recently seen some improvement, GCC countries will be reluctant to increase dependency on Qatar’s gas.
14 The term “Flexible Contract” refers to volumes contracted by ExxonMobil and others on trains for which export destina-tions are left flexible in order to secure the highest netback.
15 BP 2014 and earlier BP Statistical Reviews of World Energy.
16 In 2011 and 2012, US LNG net imports decreased to 7.9 and 4.2 Bcm respectively. GIIGNL (2012).
17 Based on analysis of the GIIGNL dataset.
18 For further discussion of these trends, see Flower and Liao (2012).
19 This is based on several individual energy media announce-ments from the projects.
20 Non-FTA Approval—relating to countries with which the United States does not have a Free Trade Agreement. The impor-tance of gaining non-FTA approval is that permission is granted to export to the major current and future LNG importing coun-tries. Of countries with which the United States has a free trade agreement, only South Korea is a major LNG importer.
NOTES
THE US SHALE GAS REVOLUTION AND ITS IMPACT ON QATAR’S POSITION IN GAS MARKETS
[email protected] | MARCH 2015 | 45
21 Also the possibility of Russian gas being supplied from West Siberia via the proposed Altai line—potentially building up to 30 Bcm/year from 2020.
22 This could be due, for example, to higher unit production costs for dry shale gas than envisaged, a reluctance for players to redirect drilling from tight oil/wet shale plays, or a limitation imposed by skilled personnel/rig availability to do both.
23 Note that revenue is based purely on LNG sales; no ac-count is taken of NGL/condensate coproduction revenues.
24 Our estimations for the base case scenario are very similar to Table 1 in IMF (2014a) where LNG revenues decline from $50.7 billion in 2013 to $ 44.5 billion in 2019. Nevertheless, by 2019, LNG export revenues will still constitute around 43 percent of hydrocarbon revenues.
25 For instance, the IMF estimates that a downside scenar-io, based on a one-standard-deviation ($28) drop in oil pric-es, implies that from 2015 Qatar would run fiscal deficits over 2015–17, amounting cumulatively to US$34 billion, constitut-ing about 80 percent of the combined projected capital expendi-tures for FY 2016 and FY 2017, IMF (2013).
26 MEES reports based on QP official sources that “QP thinks it is too strong to say the US is a threat because there’s plenty of demand, and if Qatar has to renegotiate prices the worst case scenario is a lower revenue stream than now.”
27 Especially as an increase in European hub prices would encourage increased pipeline exports from Russia, thus placing a “ceiling” on European prices.
28 For instance, the Al Karaana petrochemicals project, initi-ated with a Heads of Agreement (HOA) between QP and Shell in December 2011, was canceled in January of this year. Accord-ing to Shell’s press release, “the decision came after a careful and thorough evaluation of commercial quotations from EPC (engi-neering, procurement, and construction) bidders, which showed high capital costs rendering it commercially unfeasible.”http://www.shell.com/global/aboutshell/media/news-and-me-dia-releases/2015/qatar-petroleum-and-shell-not-to-pur-sue-al-karaana-petrochemicals-project.html
THE US SHALE GAS REVOLUTION AND ITS IMPACT ON QATAR’S POSITION IN GAS MARKETS
46 | CENTER ON GLObAL ENERGY POLICY | COLUMbIA SIPA
Allsopp, C., and J. Stern (2012). “The Future of Gas: What Are the Analytical Issues Relating to Pricing?” In The Pricing of Internationally Traded Gas. Edited by J. Stern. Oxford: Oxford University Press.
Bank Audi (2010). “Ras Laffan Liquefied Natural Gas Co.” Bank Audi, December 13, 2010. http://research.banqueaudi.com/documents/FixedIncome-RasGasFixedIncomeNote (Dec10).pdf, p. 5.
BMI (2013). “Qatar Oil & Gas Report, Q3.” Business Monitor International.
BP (2014). BP Statistical Review of World Energy 2014.
Brown, C. (2013). “Gas-to-Liquid: A Viable Alternative to Oil Derived Transport Fuels?” OIES Working Paper WPM 50, May.
Dargin, J. (2011). “Qatar’s Gas Revolution.” In Natural Gas Markets in the Middle East and North Africa. Edited by B. Fat-touh and J. Stern. Oxford University Press.
Fattouh, B., and J. Stern, eds. (2011). Natural Gas Markets in the Middle East and North Africa. Oxford University Press.
Flower, A., and J. Liao (2012). “LNG Pricing in Asia.” In The Pricing of Internationally Traded Gas. Edited by J. Stern. Oxford: Oxford University Press.
GIIGNL (2012). “The LNG Industry in 2012.” Interna-tional Group of Liquefied Natural Gas Importers, p. 28.
GIIGNL (2013). “The LNG Industry in 2013.” Interna-tional Group of Liquefied Natural Gas Importers, p. 8.
GPCA (2012). GCC Petrochemicals and Chemical Indus-try: Facts and Figures. Gulf Petroleum and Chemicals As-sociation, 2012.
Gulf Times (2013). “Qatar’s installed power capacity dou-bles in 2 years as demand rises.” Gulf Times, April 2013. http://www.gulf-times.com/business/191/details/347661/qatar%E2%80%99s-installed-power-capacity-doubles-in-2-years-as-demand-rises.
Gupta, R. (2013). “Qatar could lose largest LNG suppli-er status by end of decade.” BQDOHA.com, 18 August. http://www.bqdoha.com/2013/08/watar-could-lose-largest-lng-supplier-status-by-end-of-decade.
HT (date unspecified). “Barzan Gas Project, Ras Laffan Industrial City, Qatar.” HydrocarbonsTechnology.com. http://www.hydrocarbons-technology.com/projects/bar-zan-gas-project-ras-laffan-qatar/.
IEA (2014). “New Policies Scenario.” World Energy Out-look. International Energy Agency.
IMF (2013). “Qatar: 2012 Article IV Consultation.” IMF Country Report No. 13/14, January. http://www.imf.org/external/pubs/ft/scr/2013/cr1314.pdf.
IMF (2014a). “Qatar: 2014 Article IV Consultation.” IMF Country Report No.14/108, May. http://www.imf.org/external/pubs/ft/scr/2014/cr14108.pdf.
IMF (2014b). “Qatar: Selected Issues.” IMF Country Re-port No.14/109, May. https://www.imf.org/external/pubs/ft/scr/2014/cr14109.pdf.
Interfax (2014). “Qatar to Maintain North Dome Morato-rium.” Interfax Global Gas Analytics, May.
Katzman, K. (2014). “Iran: U.S. Concerns and Policy Re-sponses.” Congressional Research Service, July.
Lane, A. (2013). “Qatar water consumption ‘highest in the world.’” Utilities-me.com, 6 March. http://www.util-ities-me.com/article-2309-qatar-water-consumption-high-est-in-the-world/1/print/.
MEED (date unspecified). “Barzan Gas Development.” Middle East Economic Digest. http://www.meed.com/knowledge-bank/top-100-projects/Barzan-Gas-Develop-ment#.
MEES (2014a). “Qatar Searches for New Gas as North Field Moratorium Set to Continue.” Middle East Economic Survey, 57:15, April 11, 2014.
MEES (2014b). “Dolphin Upgrade Scheduled for End-2014 Completion.” Middle East Economic Survey, 57:19, May 9, 2014.
MEES (2014c). “Qatari-GCC Rift Surfaces Again.” Middle East Economic Survey, 57:19, May 9, 2014.
MEES (2014d). “Qatar’s Deep Gas Drive In Trouble.” Middle East Economic Survey, 57:30, July 25, 2014.
BIBLIOGRAPHY
THE US SHALE GAS REVOLUTION AND ITS IMPACT ON QATAR’S POSITION IN GAS MARKETS
[email protected] | MARCH 2015 | 47
OilPrice (2014). “Qatar’s LNG Dominance Threatened by Shell’s Reported Withdrawal.” OilPrice, 21 July. http://oilprice.com/Energy/Natural-Gas/Qatars-LNG-Dominance-Threatened- by-Shells-Reported-Withdrawal.html.
Platts (2013). “Qatar holds talks with ConocoPhillips as gas strategy evolves.” Platts, 24 March 2013. http://www.platts.com/latest-news/natural-gas/dubai/qatar-holds-talks-with-con-ocophillips-as-gas-6283698.
QGSDP (2011). “Qatar National Development Strategy: 2011–2016.” Qatar General Secretariat for Development Planning, p. 8.
QNB (2013a). “Qatar Monthly Monitor.” Qatar National Bank, February.
QNB (2013b). “Qatar Economic Insight.” Qatar National Bank, September.
QNB (2014). “Qatar Economic Insight.” Qatar National Bank, April.
Reuters (2007). “Shell says on schedule with Qatar Pearl GTL plant.” Reuters, 30 October 2007.
Reuters (2013). “Qatar says can help Iran get more from world’s biggest gas field.” Reuters, 23 December 2013.
Songhurst, B. (2014). “LNG Plant Cost Escalation.” OIES Working Paper NG 83, http://www.oxfordenergy.org/2014/02/lng-plant-cost-escalation.
Stern, J., and H. Rogers (2014). “The Dynamics of a Liberalised European Gas Market: Key determinants of hub prices, and roles and risks of major players.” OIES Working Paper NG 94, http://www.oxfordenergy.org/2014/12/dynamics-liberalised-eu-ropean-gas-market-key-determinants-hub-prices-roles-risks-ma-jor-players/.
Telegraph (2014). “US shale no ‘game changer’ for LNG, say Qatar energy minister.” The Telegraph, 2 February 2014.
WGI (2005). “Qatari Delays.” World Gas Intelligence, Vol. XVI, No. 18, 4 May 2005.

THE US SHALE GAS REVOLUTION AND ITS IMPACT ON QATAR’S POSITION IN GAS MARKETS
48 | CENTER ON GLObAL ENERGY POLICY | COLUMbIA SIPA