the use of big data in nowcasting and forecasting of ... · forecasting of macroeconomic variables...
TRANSCRIPT

The Use of Big Data in Nowcasting and Forecasting of Macroeconomic VariablesStefan Bender, Research Data and Service Center (RDSC), Deutsche Bundesbank
BCB's Workshop: Measuring and Analyzing the Economy using Big Data9– 10 November 2017, Brasilia
(The views expressed here do not necessarily reflect the opinion of the Deutsche Bundesbank or the Eurosystem.)

Arguments for Moving into Big Data
Use of big data for research and policy advices will increase.
Big data represent additional data sources we need.
Additional arguments (topics of the presentation) Nature of found data (big data). Data generating process. (“Paradigm shift” in research.)
9-10 November 2017, BrasiliaStefan Bender, Research Data and Service Center, Deutsche Bundesbank
Page 2

Arguments against Moving into Big Data
Enough own data.
Too risky, too many uncertainties (data quality, ownership, ...).
Loss of reputation or trust.
Page 39-10 November 2017, BrasiliaStefan Bender, Research Data and Service Center, Deutsche Bundesbank

Mobility
-Movement of people-From home to work
assume all go by car
THX to Piet Daas, Statistics Netherlands
9-10 November 2017, BrasiliaStefan Bender, Research Data and Service Center, Deutsche Bundesbank
4

Overview
Big Data (but not the common definition)
Central Banks Policy Areas and the Use of Big Data
Two “new” Examples of Bundesbank research with Big Data
Google Data in Bridge Equation Models for German GDP by
Thomas Götz and Thomas Knetsch
Capturing depositors’ expectations with Google and Twitter Data
by Falko Fecht, Stefan Thum and Patrick Webe
Conclusion
59-10 November 2017, BrasiliaStefan Bender, Research Data and Service Center, Deutsche Bundesbank

Big Data are not just Data (AAPOR-definition)
Imprecise description of a rich and complicated set of
characteristics,
practices,
techniques,
ethical issues, and
outcomes
all associated with data.
Page 69-10 November 2017, BrasiliaStefan Bender, Research Data and Service Center, Deutsche Bundesbank

Definition of Big Data – But (at least) one more V
Page 79-10 November 2017, BrasiliaStefan Bender, Research Data and Service Center, Deutsche Bundesbank

One of my Preferred Definitions of Big Data
Page 89-10 November 2017, BrasiliaStefan Bender, Research Data and Service Center, Deutsche Bundesbank
Aspirational Transactional

Big Data Generating Process
Big Data are often selective, incomplete and erroneous.
It makes a difference to use Big Data for forecast/nowcast or for detecting causality
Big Data are typically from disparate sources at various points in time and integrated into new data sets.
Thus in statistically valid ways, using Big Data is increasingly challenging.
Blending / Linking Big Data with Administrative Bundesbank Data
Page 99-10 November 2017, BrasiliaStefan Bender, Research Data and Service Center, Deutsche Bundesbank

Available microdata at the RDSC
Page 109-10 November 2017, BrasiliaStefan Bender, Research Data and Service Center, Deutsche Bundesbank
Households
CompaniesBanks
Securities

External Data
Bureau van Dijk (like Amadeus, Dafne)
Kantwert: contacts and business networks / balance information (in
real time)
Immobilienscout24 (real estate)
(Patent data)
Other data (big data) on the way
Page 119-10 November 2017, BrasiliaStefan Bender, Research Data and Service Center, Deutsche Bundesbank

kantwert
Central Bank Policy Areas
Main Tasks of CBs: Preserve monetary and financial stability
This involves:
1.Monitoring of monetary and financial developments
2.Evaluation of monetary policy and financial regulations
3.Structural analysis/research to assess counterfactuals
9-10 November 2017, BrasiliaStefan Bender, Research Data and Service Center, Deutsche Bundesbank
Page 13
THX to Falko Fecht

Big Data in Monitoring Macro Developments
Nowcasting and Forecasting
Google searches timely available Searches often in preparation for a certain event (jobloss, purchase
etc.)
Sentiments
Searches in the different categories can also captures sectoralconsumer sentiment
Index of searches for ’Recession’,’Unemployment’, ’Bankruptcy’ etc. can serve as a household sentiment indicator complementingconsumer surveys
Page 149-10 November 2017, BrasiliaStefan Bender, Research Data and Service Center, Deutsche Bundesbank
THX to Falko Fecht

Big Data in Monitoring Financial Stability I
Household sentiment indices in predicting financial market developments: abnormal stock market returns increases in market volatility fund flows from equity to bond markets
(see Da/Engelberg/Goa RFS 2014)
Fears and Financial Institutions Financial institutions (in particular banks) susceptible to self-
enforcing liquidity crises Google searches (for banks stability related terms) capture
investors’ worries and help predict outflows of funds from financialinstitutions Twitter data allow text analysis to better grasp context Early warning indicator
Page 159-10 November 2017, BrasiliaStefan Bender, Research Data and Service Center, Deutsche Bundesbank
THX to Falko Fecht

Big Data in Monitoring Financial Stability II
Housing bubbles
Searches and tweets of ’housing bubble’ useful indicator forinvestors’ worries
ImmoScout24 data offers comprise very detailedcharacteristics of the individual real estate (our hope)
Allows to use market microstructure ’indicators for anoverheating, such as market liquidity time on the market of average houses price adjustment etc.
Page 169-10 November 2017, BrasiliaStefan Bender, Research Data and Service Center, Deutsche Bundesbank
THX to Falko Fecht

Big Data and Monetary Policy Evaluation
Timely availability of Big Data allows for a faster policyevaluation
More granular set of proxies for anticipation, expectations,worries etc. allows to better assess policy effects on attitudes
Examples: In assessing monetary policy effectiveness important to know if
policy measure was anticipated Event studies of news releases and bond yields Twitter data on unconventional policy measures allows to proxy
anticipation
Page 179-10 November 2017, BrasiliaStefan Bender, Research Data and Service Center, Deutsche Bundesbank
THX to Falko Fecht

Google Data in Bridge Equation Models for German GDP Thomas Götz and Thomas Knetsch, Deutsche Bundesbank
Bundesbank Project Group Conference on “Big Data”
Frankfurt am Main: 24 October, 2017

Motivation
Increased interest in the use of Big Data in general, and Google Search data in
particular, for forecasting purposes.
Instead of a specific (often monthly) indicator, we consider aggregate GDP for
Germany, one of the variables predominantly focused on in our division
Instead of a tailored choice of (or method to combine) search terms, we analyze
the performance of a range of Google variable selection tools
We incorporate Google data into a set of Bridge Equations, one of our workhorse
models for short-term forecasts of German GDP
Appealing structure
Direct incorporation of Big Data into the current model suite (low
implementation costs, preservation of outcome communication, ...)
9-10 November 2017, BrasiliaStefan Bender, Research Data and Service Center, Deutsche Bundesbank
Page 19

Our Example-BEM
Page 209-10 November 2017, BrasiliaStefan Bender, Research Data and Service Center, Deutsche Bundesbank

ECB Google Data
Page 219-10 November 2017, BrasiliaStefan Bender, Research Data and Service Center, Deutsche Bundesbank

Motivating Example I
Page 229-10 November 2017, BrasiliaStefan Bender, Research Data and Service Center, Deutsche Bundesbank

Motivating Example II
Page 239-10 November 2017, BrasiliaStefan Bender, Research Data and Service Center, Deutsche Bundesbank

Conclusion
“Big data” in the form of Google search data incorporated into an
example Bridge Equation Model
Treating them like survey indicators, they affected forecasts of GDP
growth and its components through the underlying monthly indicator
Potential for improving forecast accuracy for GDP growth detected,
mostly when added instead of survey indicators and for PLS and
Lasso
Transfers only partly to GDP components and monthly indicators:
some indicators do benefit quite a lot (e.g., Industrial Production),
others not (e.g., Production in Construction)
Page 249-10 November 2017, BrasiliaStefan Bender, Research Data and Service Center, Deutsche Bundesbank

Capturing depositors’ expectations with Google and Twitter DataFalko Fecht, Stefan Thum and Patrick WeberBundesbank Conference on "Big Data", 25 October 2017
1. MotivationStrategic complementarities and financial crises
Motivation Can Google searches or Twitter messages be used as a predictor for a
deposit run on banks (time series and cross section)?
Many financial institutions exposed to self-fulfilling liquidity crises Financial institutions performing liquidity transformation are exposed to runs
by depositorsWorries that others excessively withdraw induce investors to withdraw
How to measure investors’ expectations?
Google searches might serve as a proxy for investors' worries Searches serve as an early warning indicator for liquidity crises
Page 269-10 November 2017, BrasiliaStefan Bender, Research Data and Service Center, Deutsche Bundesbank

2. DataGoogle and Twitter data
We obtain Google Trends Data via www.google.com/trends
Relevant data: Relative search interest in search terms related to deposit insurance in Germany at the local level Transformations:
Data is winsorized and transformed into monthlyfrequency using different specifications: monthly average (avrg), first (fObs) and last (lObs) observation
Twitter Data
Relevant data:Tweets and Retweets containing terms related to deposit insurance
Page 279-10 November 2017, BrasiliaStefan Bender, Research Data and Service Center, Deutsche Bundesbank

2. DataAugment the Google data set with central bank data sources
We augment Google data with…
1. Bundesbank Balance Sheet Items statistics
Outstanding Euro amounts of overnight deposits at a monthly frequency at bank level (census approach)
2. Bundesbank MFI Interest Rate statistics
Interest rates on outstanding amounts of overnight deposits at a monthly frequency at bank level for roughly 230 German banks (sample approach)
Page 289-10 November 2017, BrasiliaStefan Bender, Research Data and Service Center, Deutsche Bundesbank

3. Descriptive StatisticsGoogle search interest versus deposit shifts
Page 299-10 November 2017, BrasiliaStefan Bender, Research Data and Service Center, Deutsche Bundesbank
-0.1
-0.08
-0.06
-0.04
-0.02
0
0.02
0.04
-6
-4
-2
0
2
4
6
8
10
12
14
200412 200511 200610 200709 200808 200907 201006 201105 201204 201303 201402 201501 201512
Google search for 'deposit insurance' (winsorized) (LHS) ∆(Savings Banks / Cooperatives - 1) (RHS)
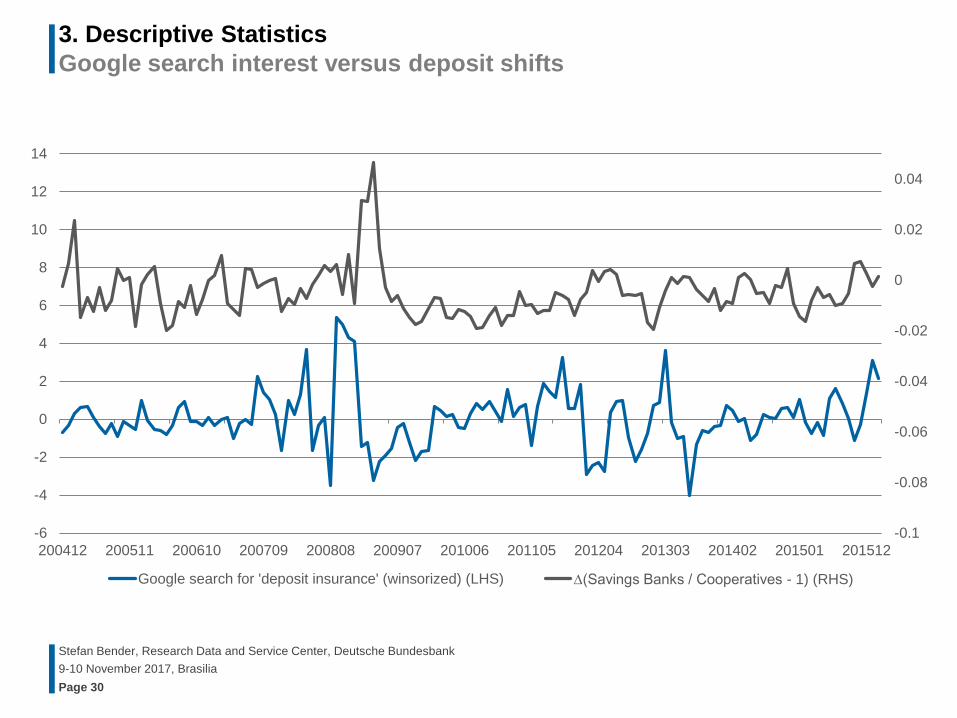
3. Descriptive StatisticsGoogle search interest versus deposit shifts
Page 309-10 November 2017, BrasiliaStefan Bender, Research Data and Service Center, Deutsche Bundesbank
-0.1
-0.08
-0.06
-0.04
-0.02
0
0.02
0.04
-6
-4
-2
0
2
4
6
8
10
12
14
200412 200511 200610 200709 200808 200907 201006 201105 201204 201303 201402 201501 201512
Google search for 'deposit insurance' (winsorized) (LHS) ∆(Savings Banks / Cooperatives - 1) (RHS)

3. Descriptive StatisticsGoogle search interest versus deposit shifts
Page 319-10 November 2017, BrasiliaStefan Bender, Research Data and Service Center, Deutsche Bundesbank
-0.1
-0.08
-0.06
-0.04
-0.02
0
0.02
0.04
-6
-4
-2
0
2
4
6
8
10
12
14
200412 200511 200610 200709 200808 200907 201006 201105 201204 201303 201402 201501 201512
Google search for 'deposit insurance' (winsorized) (LHS) ∆(Savings Banks / Cooperatives - 1) (RHS)
Google searches time series shifted by six
months

4. SummaryGoogle/Twitter data are a valuable measure for depositors’ expectations
Google searches (and Twitter messages) can be used as a
measure for the concern of depositors
Indication of run-type phenomena in local deposit markets
Google/Twitter data capture expectations relevant to financial
stability analysis
Work shows the value added for central bankers to combine
proprietary central bank data with unconventional data
Page 329-10 November 2017, BrasiliaStefan Bender, Research Data and Service Center, Deutsche Bundesbank

Conclusion
Policy advises and research is about answering questions.
There is a strong need for granular data.
Start by utilizing all of the information that is available, including surveys, admin data and big data
Big data offers new possibilities: we can take best of all worlds big data, surveys, admin data and combine them.
Big data is not only data, it is a new thinking with data.
Page 339-10 November 2017, BrasiliaStefan Bender, Research Data and Service Center, Deutsche Bundesbank

Summing Up: New Challenges
Define a research question (what are we measuring?): Do not fall in love with the Data. Love the questions it can answer.
Think about what data are available (transactional versus aspirational) and the measurement error (how are we measuring it?): The size of the data reduces the estimation error, not its biases. Quality is what matters.
Link datasets (what are we missing?)
Statistical approaches (how can we draw inference?)
Address Privacy and Confidentiality/Ethics (are we protecting human subjects?)
Need for access and training
Page 349-10 November 2017, BrasiliaStefan Bender, Research Data and Service Center, Deutsche Bundesbank
THX to Julia Laneand Roberto Rigobon
