the use of computer competencies of students in the
TRANSCRIPT

CORRESPONDENCE İlyas OKAN [email protected]
© 2016 The Author(s). Open Access terms of the Creative Commons Attribution 4.0 International License (http://creativecommons.org/licenses/by/4.0/) apply. The license permits unrestricted use, distribution, and reproduction in any medium, on the condition that users give exact credit to the original author(s) and the source, provide a link to the Creative Commons license, and indicate if they made any changes.
Introduction
In today’s world, education and using technology in education have become two
concepts that are dependent on each other. Technology is a field that contains
the entire social and economic facilities and organizations that sets forth to
adapt technical information into life. With an optimistic definition, technology is
to apply the scientific principles and innovations on the resolve of the problems
INTERNATIONAL JOURNAL OF ENVIRONMENTAL & SCIENCE EDUCATION
2016, VOL. 11, NO. 15, 8470-8490
ABSTRACT This study aims to reveal the levels of the use of computer, which is nowadays one of the most
important technologies, of teacher candidate studying in the departments of Physical Education and
Sport Teaching, and School teaching; also aims to research whether there is differences according to
various criteria or not. In research, data were collected via the survey “Specifying The Use of
Computer Competencies of Students in the Departments of Physical Education and Sport Teaching,
and School Teaching” with researcher adapting this to Departments of Physical Education and Sport
Teaching, and School Teaching. The sample of this study consists of 210 students studying in Gazi
University Faculty of Education School Teaching and Physical Education and Sport Teaching
Departments in 2014-2015 academic years. Statistical package program was used for research data.
Statistic technics such as ANOVA for class variable, t-test for the other variables and mean standard
deviation were used. As a result of analysis conducted, the use of computer competencies of students
in the departments of physical education and sport teaching, and school teaching was researched and
it was figured out that students who have computers at home or who benefits from the computers in
school lab use many computer program menus meaningfully a lot at the level of p<0,05. Based on the
research results, suggestions for using computer effectively in Physical Education and Sport classes
were presented.
The Use of Computer Competencies of Students in the Departments of Physical Education and Sport Teaching,
and School Teaching
Ilyas Okana
Gazi University, TURKEY
OPEN ACCESS
KEYWORDS ARTICLE HISTORY Technology, computer, use of computer, sport, physical
education Received 10 June 2016
Revised 28 July 2016 Accepted 11 August 2016

INTERNATIONAL JOURNAL OF ENVIRONMENTAL & SCIENCE EDUCATION 8471
and is a simplification of life (Cited Gümüşdağ et al., 2013). At the same time, it
also changes the relationships between fields and disciplines and has effect on
increase of information. In terms of society future, education is one of the most
important fields where the technology is used. Therefore, especially the
developed countries, the whole societies are in a struggle for gaining individuals
a quality education by using technology (Erdemir and Bakırcı, 2009: 99-108).
Education which is everyone’s fundamental right is defined as a process of
showing purposely a change in an intended way in thoughts and behaviors of
human. By thinking the future and advantages of human and society, main
purpose with education is to provide an increase of social welfare and
productivity by providing the intra-society harmony (Cited Gümüşdağ et al.,
2013).
One of the most important features and perhaps chances of last three decades is
the incredible progression of technology. In last decade, particularly the
computer technology has attracted the biggest attention around the world. In
parallel with this change, schools have started to use the computers in education
for the purpose of increasing the quality in education. Technology is considered
as a sign for high quality in education by many educators, teachers and
researchers. Thus, it is observed that the importance of integration of technology
in schools has increased. To raise individuals who reach knowledge and use this
knowledge, it is needed that teachers should use effectively the technological
equipments (computer, internet, etc.) and should have these skills. On the other
hand, when examined the national and international studies, it is appeared that
there is no standardized definition for technology integration. On this topic,
studies conducted recently contain usage of desktop software programs such as
word processor and calculation table in laptops or desktop computers with
purpose of education, or usage of internet technology with purpose of education
in schools, existing information about technology integration in schools (Erdemir
and Bakırcı, 2009: 99-108).
As for that the level of making real the purpose of a system is dependent on
qualification of factors forming itself and on interaction with each other, it can
be said that the success of education system is dependent mostly on behaviors
and qualifications of teachers who have the power of effect on students in school
or outside of school. Since they are executers of education programs, teachers
have responsibility for determining the quality of education system and
education service and whether the system is successful or not. The fact that
teachers develop a positive attitude for teaching profession is dependent on
many variables without doubt. As one of these variables can be the use of
computer and skill level, another can be the level of using the teaching
technologies in class. In the process of education, it is known that self-confidence
and competencies of individuals caring and sparing time more for the technology
and use of computer are positive (Cited Gümüşdağ et al., 2013). Thus, there is a
transformation on raising a teacher and definition of his/her competencies from
behavioral understanding to techno pedagogy (technological pedagogical field
information) where field information, pedagogy and technology are integrated.
Gaining the skills of the use of computer to teacher can be accepted as an

8472 OKAN
important variable that affects the quality of education system. It is emphasized
that these skills of teachers are important in terms of effectiveness and
productivity of education process (Usta and Korkmaz, 2010: 1335-1339).
The more information technologies become common, the more computer literacy
and the importance of technology use skills increase and it becomes a very
important characteristic of human resource. Necessity of students being
competent computer users is accepted by educators and public opinion. In order
to use the technology in education environments, both teachers and students
should be computer literate. However, in educational environments the
discussions on what is the computer literacy are continuing. In many schools,
computer is used for only either surfing on internet or playing games. Suitability
of computer applications to curriculum and intra-class practices is generally
ignored. What reveals the technology is human. Human-being reveals the
technology as a result of scientific studies. Shortly, the efforts of human-beings
are needed for revealing of technology. Effort, labor and request are needed to
use and spread the technology in education environment. For this purpose,
scientific studies should be done with the whole educators taking in private
necessary precautions in the field of physical education and sport science to
activate the use of technology (Cited Yaman, 2008). It is thought that on
selection of students in the department of physical education and sport teaching;
beside some physical, physiological performances (Çolakoğlu. 2014), researching
the use of computer skills can affect the students’ academic successes. For this
purpose; by specifying the level of use of computer, the most common product of
technology, of students in the departments of physical education and sport
teaching and school teaching, suggestions for popularizing this are presented.
METHODOLOGY, OBJECTIVES AND RESEARCH DESIGN
Method
Research was done with scanning method. The sample of study consists of the
students in Gazi University Faculty of Education School Teaching and Physical
Education and Sport Teaching Departments, who did or didn’t take the
computer classes in previous semesters in university. With the purpose of
collecting data, the survey “The Use of Computer Competencies of Education
Manager Candidate Teachers” developed by İşman et al. (2006) was adapted
into physical education and form teachers and the validity and reliability was
done again under the name of “Specifying The Use of Computer Competencies of
Students in the Departments of Physical Education and Sport Teaching, and
School Teaching”, and it was applied by researcher on the sample group
consisting of 210 students in the departments of physical education and sport
teaching and school teaching. In survey form it was asked from sample group to
answer 43 questions about the use of Windows, Office and Multimedia programs
menu by handling in 4 dimensions according to states of existence of computer
at home, existence of computer lab in school, the ability of computer use of
family, whether or not students can benefit from computer lab.

INTERNATIONAL JOURNAL OF ENVIRONMENTAL & SCIENCE EDUCATION 8473
Purpose of Research
This study aims to reveal the computer, one of the present-day’s most important
technologies, level of the use of Physical Education and Sport Teacher and Form
Teacher candidates and to research resources of differences in use according to
criteria of existence of computer at home, existence of computer lab in school,
the ability of using computer of family, whether or not students can benefit from
computer lab.
Population of Research
While population of research consists of students in Gazi University Faculty of
Education School Teaching and Physical Education and Sport teaching in 2014-
2015 academic years, . the sample is consisted of 210 students studying in first,
second, third and fourth grades in Gazi University Faculty of Education School
Teaching and Physical Education and Sport Teaching Departments, who did or
didn’t take the computer classes in previous semesters.
Research Survey
With the purpose of collecting data, the survey “The Use of Computer
Competencies of Education Manager Candidate Teachers” developed by İşman
et al. (2006) was adapted by researcher into physical education and form
teachers, and the validity was provided again by taking expert opinion under the
name of “Specifying The Use of Computer Competencies of Students in the
Departments of Physical Education and Sport Teaching, and School Teaching”.
For reliability, internal consistency was found as cronbach alfa = ,9844. Survey
was applied by researcher on the sample group consisting of 210 students in the
departments of physical education and sport teaching and school teaching.
Physical Education and Sport Teaching, and School Teaching candidates
participated in research chose one of the choices that are I Have No Experience
(1), I Have A Little Experience (2), I have Experience (3) and I Have Top-Level
Experience and then they were given points from 1 to 4. Survey is composed of 6
categories. In first category, there are questions about whether there are
computers at home, whether there are computer labs in schools, whether family
use computer and the chances of benefiting from labs, and there are articles that
measure the skills of using Windows in second category, Word in third category,
Excel in fourth category, PowerPoint in fifth category and multimedia programs
in sixth category. For research, questions that measure different skill fields with
computers. In survey, there are totally 43 articles; 9 about Windows, 9 about
Word, 9 about Excel, 8 about PowerPoint and 8 about multimedia programs
(Cited Yaman, 2008).
Research Data
Data used in this research was obtained with the scale “Specifying the Use of
Computer Competencies of Students in the Departments of Physical Education
and Sport Teaching, and School Teaching” applied on the students in the
Departments of Physical Education and Sport Teaching, and School Teaching.

8474 OKAN
Research survey was applied on 500 students, but surveys of 210 students were
evaluated.
Statistical Method of Research
Point means belonging to levels of the use of programs determined from the
answers of students participated in research for questions in surveys were
obtained and analyses were done according to these point means. For evaluation
of research data, as a statistical method; percentage distributions values and
frequency belonging to socio-demographic characteristics of students were
calculated. Normality test and variances’ homogeneity tests were conducted to
variables. As a result of these tests, it was seen that related variables didn’t
provide the normality assumption and nonparametric analysis methods were
used. Kruskal-Wallis test and Mann-Whitney test were used to test the
differences among the levels of use of programs determined in terms of socio-
demographic characteristics of teachers included in research. In used
nonparametric tests, Z distribution statistic for Mann-Whitney test and X-
Square distribution statistic for Kruskal-Wallis test were determined pursuant
to central limit theorem and because of the fact that research example diameter
is big. In applied statistical tests, meaningful level was determined as α=.05 and
hypotheses were tested at the level ol %95 trust. Statistical analyses were done
with SPSS 21 for Windows package program.
RESULTS
Table 1: Frequency Distributions related to Demographic Characteristics of
Students Participated in Research
VARIABLES SUB-DIMENSIONS N % TOTAL
Gender Female 122 58,1
210 Male 88 41,9
Grade
1.Grade 50 23,8
210 2.Grade 66 31,4
3.Grade 51 24,3
4.Grade 43 20,5
Age
19-21 116 55,2
210 22-24 75 35,7
25+ 19 9,0
Department
Physical Education
Teaching
90 42,9
210
School Teaching 120 57,1

INTERNATIONAL JOURNAL OF ENVIRONMENTAL & SCIENCE EDUCATION 8475
Income
400- 4 1,9
210
401-800 5 2,4
801-1000 16 7,6
1001-1500 51 24,3
1500+ 134 63,8
State of Existence of
Computer at Home
Exists 190 90,5 210
Doesn’t Exist 20 9,5
State of Existence of
Internet
Exists 172 81,9 210
Doesn’t Exist 38 18,1
State of Existence of
Computer Labs in
School
Exists 198 94,3
210 Doesn’t Exist 12 5,7
State of Family’s Use of
Computer
They do 156 74,3 210
They don’t 54 25,7
State of Benefiting
Always from Computer
Labs
It is benefitted 118 56,2
210 It isn’t benefitted 92 43,8
In the scope of research, there are 210 students, 58,1% of which are female and
41,9% of which are male. When considered the grade levels of students
participated in research, 23,8% are 1.grade, 31,4% are 2.grade, 24,3% are
3.grade and 20,5% are 4.grade. 55,2% of students are in a range of 19-21 age,
35,7% are in a range of 22-24 age and 9% are 25 or older. 42,9% of students
participated in research study Physical Education Teaching and 57,1% study
School Teaching. 1,9% of students’ income is 400 TL or less, income of 2,4% is
between the range of 401-800, income of 7,6% is between the range of 801-1000
TL, income of %24,3 is between the range of 1001-1500 and income of 63,8% is
1500 TL or more. While %90,5% of students have computer at home, 9,5% of
students don’t have. 81,9% of students participated in research have internet
connectivity, 18,1% don’t have. 94,3% of students have computer labs in school,
5,7% of students don’t have. 74,3% of students’ family use computer, 25,7%
students’ family don’t use. 56,2% of students said that they can benefit always
from computer labs in school, 43,8% of students said that they cant benefit
always.

8476 OKAN
Table 2: Mann-Whitney U Test for Diffirence, according to “Gender” Variable, of
Students’ Levels of Use of Determined Computer Programs
Gender N
Ordinal Number
Mean Z p
Windows
Female 122 110,83
-1,541 ,124
Male 88 98,11
Word
Female 122 107,47
-,564 ,574
Male 88 102,77
Excel
Female 122 103,45
-,588 ,558
Male 88 108,35
Power Point
Female 122 104,50
-,293 ,771
Male 88 106,89
Multimedia
Female 122 97,15
-2,395 ,016 ̽
Male 88 117,08
Statistically meaningful difference according to “gender” variable isn’t seen at
the students’ levels of use of windows, word, excel and power point. ( Z1= -1.541
p=.124>.05, Z2= -.564 p=.574>.05, Z3= -.588 p=.558>.05, Z4= -.293
p=.771>.05 ).
Statistically meaningful difference according to “gender” variable is seen at the
students’ levels of use of multimedia programs. ( Z5= -2.395 p=.016<.05 ).

INTERNATIONAL JOURNAL OF ENVIRONMENTAL & SCIENCE EDUCATION 8477
Table 3: Mann-Whitney U Test for Diffirence, according to “Department”
Variable, of Students’ Levels of Use of Determined Computer Programs
Department N
Ordinal Number
Mean Z p
Windows
Physical Education
Teaching
90 106,54
-,222 ,825
School Teaching 120 104,72
Word
Physical Education
Teaching
90 109,33
-,807 ,421
School Teaching 120 102,63
Excel
Physical Education
Teaching
90 113,08
-1,597 ,111
School Teaching 120 99,81
Power
Point
Physical Education
Teaching
90 107,87
-,511 ,611
School Teaching 120 103,72
Multimedia
Physical Education
Teaching
90 103,09
-,508 ,612
School Teaching 120 107,31
Statistically meaningful difference according to “department” variable isn’t seen
at the students’ levels of use of windows, word, excel, power point and
multimedia programs.
( Z1= -.222 p=.825>.05, Z2= -.807 p=.421>.05, Z3= -1.597 p=.111>.05, Z4= -
.511 p=.611>.05, Z5= -2.395 p=.016<.05 ).

8478 OKAN
Table 4: Kruskall-Wallis Test for Diffirence, according to “Age” Variable, of
Students’ Levels of Use of Determined Computer Programs
Age N
Ordinal Number
Mean 𝑥2 p
Windows
19-21 116 97,87
4,969 ,083 22-24 75 117,37
25+ 19 105,21
Word
19-21 116 96,87
5,477 ,065 22-24 75 116,67
25+ 19 114,08
Excel
19-21 116 92,83
13,523 ,001 ̽ 22-24 75 125,30
25+ 19 104,71
Power
Point
19-21 116 95,50
9,149 ,010 ̽ 22-24 75 121,57
25+ 19 103,11
Multimedia
19-21 116 101,04
1,534 ,464 22-24 75 111,87
25+ 19 107,61
Statistically meaningful difference according to “age” variable isn’t seen at the
students’ levels of use of windows, word and multimedia programs (𝑥12= 4,969
p=.083>.05, 𝑥22= 5,477 p=.065>.05, 𝑥5
2= 1,534 p=.464>.05).

INTERNATIONAL JOURNAL OF ENVIRONMENTAL & SCIENCE EDUCATION 8479
Statistically meaningful difference according to “age” variable is seen at the
students’ levels of use of excel and power point. ( 𝑥32= 13,523 p=.001<.05, 𝑥4
2=
16,901 p=.010<.05.
Table 5: Kruskall-Wallis Test for Diffirence, according to “Grade” Variable, of
Students’ Levels of Use of Determined Computer Programs
Grade N
Ordinal Number
Mean 𝑥2 p
Windows
1 50 105,64
7,201 ,066
2 66 91,36
3 51 120,36
4 43 109,41
Word
1 50 95,60
7,998 ,046 ̽
2 66 96,96
3 51 124,51
4 43 107,57
Excel
1 50 90,18
9,781 ,021 ̽
2 66 99,96
3 51 125,67
4 43 107,90
Power
Point
1 50 96,41
11,515 ,009 ̽
2 66 93,73
3 51 127,94
4 43 107,51
Multimedia
1 50 89,89
5,707 ,127
2 66 109,62

8480 OKAN
3 51 117,02
4 43 103,66
Statistically meaningful difference according to “grade” variable isn’t seen at the
students’ levels of use of windows and multimedia programs. (𝑥12= 7,201
p=.066>.05, 𝑥52= 5,707 p=.127>.05 )
Statistically meaningful difference according to “grade” variable is seen at the
students’ levels of use of word, excel and power point. ( 𝑥22= 7,998 p=.046<.05,
𝑥32= 9,781 p=.021<.05, 𝑥4
2= 11,515 p=.009<.05)
Table 6: Kruskall-Wallis Test for Diffirence, according to “Income” Variable, of
Students’ Levels of Use of Determined Computer Programs
Income N
Ordinal Number
Mean 𝑥2 p
Windows
400- 4 66,25
8,305 ,081
401-800 5 98,10
801-1000 16 104,22
1001-1500 51 88,88
1500+ 134 113,43
Word
400- 4 125,63
1,594 ,810
401-800 5 119,00
801-1000 16 98,53
1001-1500 51 99,55
1500+ 134 107,49
Excel
400- 4 126,00
4,190 ,381
401-800 5 55,40
801-1000 16 100,94
1001-1500 51 106,53

INTERNATIONAL JOURNAL OF ENVIRONMENTAL & SCIENCE EDUCATION 8481
1500+ 134 106,91
Power
Point
400- 4 81,00
3,545 ,471
401-800 5 89,50
801-1000 16 113,00
1001-1500 51 95,53
1500+ 134 109,73
Multimedia
400- 4 131,25
2,246 ,691
401-800 5 107,80
801-1000 16 116,53
1001-1500 51 110,31
1500+ 134 101,50
Statistically meaningful difference according to “income” variable isn’t seen at
the students’ levels of use of windows, word, excel, power point and multimedia
programs.
( 𝑥12= 8,305 p=.081>.05, 𝑥2
2= 1,594 p=.810>.05, 𝑥32= 4,190 p=.381>.05, 𝑥4
2=
3,545 p=.471>.05, 𝑥52= 2,246 p=.691>.05).

8482 OKAN
Table 7: Mann-Whitney U Test for Diffirence, according to “State of Existence of
Computer at Home” Variable, of Students’ Levels of Use of Determined
Computer Programs
State of
Existence of
Computer at
Home
N Ordinal Number
Mean Z p
Windows
Yes 190 111,61
-4,622 ,000 ̽
No 20 47,45
Word
Yes 190 109,84
-3,257 ,001 ̽
No 20 64,28
Excel
Yes 190 108,65
-2,359 ,018 ̽
No 20 75,60
Power
Point
Yes 190 108,05
-1,954 ,051
No 20 81,28
Multimedia
Yes 190 106,37
-,656 ,515
No 20 97,20
Statistically meaningful difference according to “state of existence of computer
at home” variable isn’t seen at the students’ levels of use of power point and
multimedia programs( Z4= -1.954 p=.051>.05, Z5= -.656 p=.515>.05 ).
Statistically meaningful difference according to “state of existence of computer
at home” variable is seen at the students’ levels of use of windows, word and
excel ( Z1= -4.622 p=.000<.05, Z2= -3.257 p=.001<.05, Z3= -2.359 p=.018<.05 ).

INTERNATIONAL JOURNAL OF ENVIRONMENTAL & SCIENCE EDUCATION 8483
Table 8: Mann-Whitney U Test for Diffirence, according to “State of Existence of
Internet” Variable, of Students’ Levels of Use of Determined Computer
Programs
State of
Existence Of
Internet
N
Ordinal
Number
Mean
Z p
Windows
Yes 172 110,42
-2,571 ,010 ̽
No 38 83,21
Word
Yes 172 110,51
-2,598 ,009 ̽
No 38 82,80
Excel
Yes 172 110,28
-2,470 ,013 ̽
No 38 83,88
Power
Point
Yes 172 108,97
-1,833 ,067
No 38 89,82
Multimedia
Yes 172 106,74
-,640 ,524
No 38 99,91
Statistically meaningful difference according to “state of existence of internet”
variable isn’t seen at the students’ levels of use of power point and multimedia
programs.
( Z4= -1.833 p=.067>.05, Z5= -.640 p=.524>.05 )
Statistically meaningful difference according to “state of existence of internet”
variable is seen at the students’ levels of use of windows, word and excel.
( Z1= -2.571 p=.010<.05, Z2= -2.598 p=.009<.05, Z3= -2.470 p=.013<.05 ).
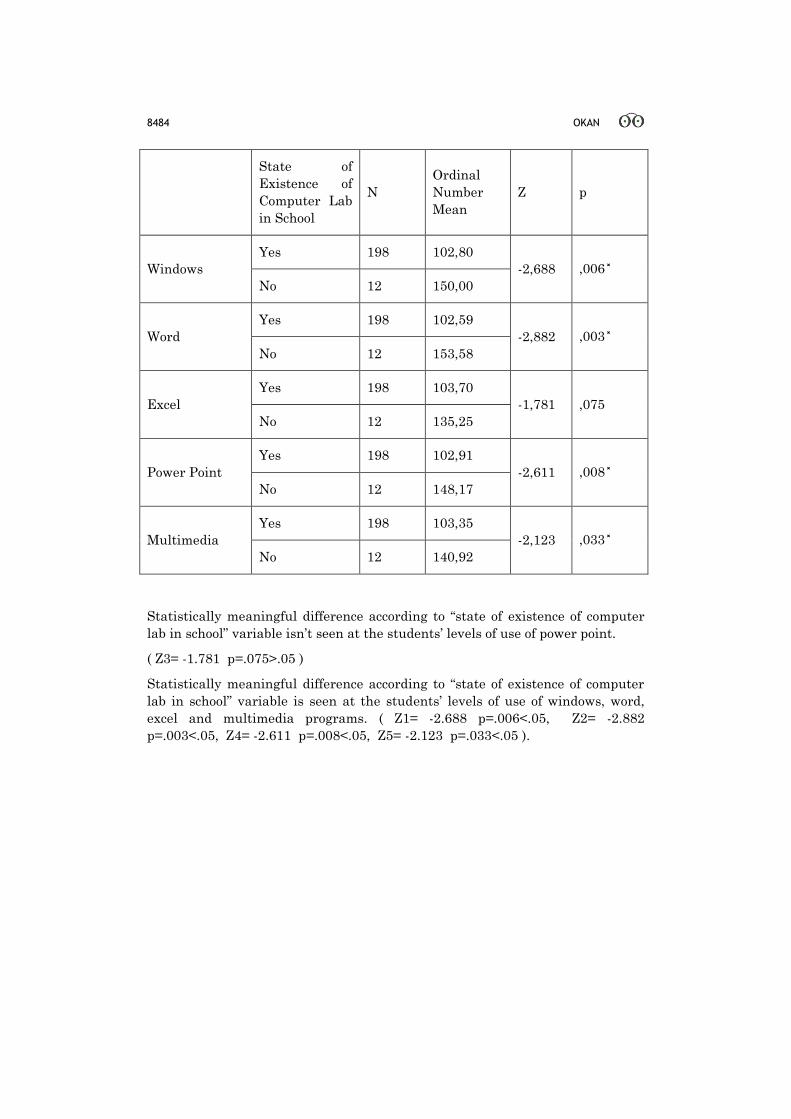
Table 9: Mann-Whitney U Test for Diffirence, according to “State of Existence of
Computer Lab in School” Variable, of Students’ Levels of Use of Determined
Computer Programs
8484 OKAN
State of
Existence of
Computer Lab
in School
N
Ordinal
Number
Mean
Z p
Windows
Yes 198 102,80
-2,688 ,006 ̽
No 12 150,00
Word
Yes 198 102,59
-2,882 ,003 ̽
No 12 153,58
Excel
Yes 198 103,70
-1,781 ,075
No 12 135,25
Power Point
Yes 198 102,91
-2,611 ,008 ̽
No 12 148,17
Multimedia
Yes 198 103,35
-2,123 ,033 ̽
No 12 140,92
Statistically meaningful difference according to “state of existence of computer
lab in school” variable isn’t seen at the students’ levels of use of power point.
( Z3= -1.781 p=.075>.05 )
Statistically meaningful difference according to “state of existence of computer
lab in school” variable is seen at the students’ levels of use of windows, word,
excel and multimedia programs. ( Z1= -2.688 p=.006<.05, Z2= -2.882
p=.003<.05, Z4= -2.611 p=.008<.05, Z5= -2.123 p=.033<.05 ).

INTERNATIONAL JOURNAL OF ENVIRONMENTAL & SCIENCE EDUCATION 8485
Table 10: Mann-Whitney U Test for Diffirence, according to “State of Family’s
Use of Computer” Variable, of Students’ Levels of Use of Determined Computer
Programs
State of
Family’s Use
of Computer
N Ordinal Number
Mean Z p
Windows
Yes 156 113,08
-3,160 ,001 ̽
No 54 83,61
Word
Yes 156 111,21
-2,362 ,018 ̽
No 54 89,01
Excel
Yes 156 111,09
-2,309 ,021 ̽
No 54 89,36
Power
Point
Yes 156 107,99
-1,052 ,294
No 54 98,31
Multimedia
Yes 156 106,48
-,405 ,687
No 54 102,68
Statistically meaningful difference according to “state of family’s use of
computer” variable isn’t seen at the students’ levels of use of power point and
multimedia programs (Z4= -1.052 p=.294>.05, Z5= -.405 p=.687>.05 )
Statistically meaningful difference according to “state of family’s use of
computer” variable is seen at the students’ levels of use of windows, word and
excel.
( Z1= -2.571 p=.010<.05, Z2= -2.598 p=.009<.05, Z3= -2.470 p=.013<.05 ).
Table 11: Mann-Whitney U Test for Diffirence, according to “State of Benefitting
Always from Computer Lab” Variable, of Students’ Levels of Use of Determined
Computer Programs

8486 OKAN
State of
Benefitting
Always
from
Computer
Lab
N Ordinal
Number Mean Z p
Windows
Yes 118 102,38
-,868 ,386
No 92 109,51
Word
Yes 118 107,84
-,646 ,519
No 92 102,49
Excel
Yes 118 111,83 -
1,743 ,081
No 92 97,38
Power
Point
Yes 118 109,25 -
1,056 ,292
No 92 100,69
Multimedia
Yes 118 103,77
-,477 ,635
No 92 107,72
Statistically meaningful difference according to “state of benefitting always from
computer lab” variable isn’t seen at the students’ levels of use of windows, word,
excel, power point and multimedia programs ( Z1= -.868 p=.386>.05, Z2= -.646
p=.519>.05, Z3= -1.743 p=.081>.05, Z4= -1.056 p=.292>.05, Z5= -.477
p=.635>.05 ).
DISCUSSION and CONCLUSION
Developing skills of the use of computer is needed for university students to
be successful in their academic education and career programs (Furst-Bowe &
Boger, 1996). When doing the literature research; in the studies on university
students’ skills of the use of computer, it was seen that a lot of factors such as
job experience, interest in use of computer, course successes completed
throughout academic and education and levels of use of internet were researched
(Smith & FurstBowe, 1993; Güçlü, 2010; Yaman, 2007a; Yaman, 2007b, Hunt
and Bohlin, 1993, Levine and Donitsa-Schmidt, 1998). Ayrıca araştırmalarda
bilgisayar kullanım yeteneklerinin yaş, cinsiyet, deneyim ve ilgi gibi

INTERNATIONAL JOURNAL OF ENVIRONMENTAL & SCIENCE EDUCATION 8487
faktörlerden etkilenebileceği bildirilmektedir(Morahan-Martin, 1992, Necessary
and Parish, 1996).
In the scope of research done by looking at literature research information, there
are 210 students, 58,1% of which are female and 41,9% of which are male. When
considered the grade levels of students participated in research, 23,8% are
1.grade, 31,4% are 2.grade, 24,3% are 3.grade and 20,5% are 4.grade. 55,2% of
students are in a range of 19-21 age, 35,7% are in a range of 22-24 age and 9%
are 25 or older. 42,9% of students participated in research study Physical
Education Teaching and 57,1% study School Teaching. 1,9% of students’ income
is 400 TL or less, income of 2,4% is between the range of 401-800, income of 7,6%
is between the range of 801-1000 TL, income of %24,3 is between the range of
1001-1500 and income of 63,8% is 1500 TL or more. While %90,5% of students
have computer at home, 9,5% of students don’t have. 81,9% of students
participated in research have internet connectivity, 18,1% don’t have. 94,3% of
students have computer labs in school, 5,7% of students don’t have. 74,3% of
students’ family use computer, 25,7% students’ family don’t use. 56,2% of
students said that they can benefit always from computer labs in school, 43,8%
of students said that they cant benefit always.
When considering students’ levels of use of windows, word, excel, power point
and multimedia programs, statistically meaningful difference isn’t seen
according to “gender, department, income and state of benefitting always from
computer lab” variables. Also, when examined students’ levels of use of
multimedia programs; statistically meaningful difference is seen according to
“gender and state of existence of computer lab in school” variables.
When considered students’ levels of use of excel and power point, statistically
meaningful difference is seen according to “age” variable. When compared with
levels of use of windows, word and multimedia programs, there is no statistically
meaningful difference.
While there is no statistically meaningful difference when examined, according
to “grade” variable, students’ levels of use of windows and multimedia programs;
in terms of levels of the use of word, excel and power point, statistically
meaningful difference is seen.
When considered students’ levels of use of power point and multimedia
programs; statistically meaningful difference isn’t seen according to “state of
existence of computer at home” variable. When considered the levels of use of
windows, word and excel; statistically meaningful difference is seen.

8488 OKAN
In the study of Güçlü (2010), it was reported that the use of computer skills of
individuals who have private computer or can reach computer from faculty lab
are influenced positively. Also the skill of family’s use of computer has a positive
effect. This result shows parallel with our presented study.
When examined students’ levels of use of power point and multimedia programs;
statistically meaningful difference isn’t seen according to “state of existence of
internet” variable. In terms of levels of use of windows, word and excel;
statistically meaningful difference is seen.
When examined students’ levels of use of power point; statistically meaningful
difference isn’t seen according to “state of existence of computer lab in school”
variable. On the other hand, when considered students’ levels of use of windows,
word, excel and multimedia programs, statistically meaningful difference is seen
according to “state of existence of computer lab in school” variable.
When considered, according to “state of family’s use of computer, students’ levels
of use of windows, word and excel, there is statistically meaningful difference.
When examined the levels of use of power point and multimedia programs,
statistically meaningful difference isn’t seen.
Suggestions for Researchers
• The effect of raising awareness of families about education and use of
computer upon the use of computer competency of physical education teacher
can be examined.
• The effect of use of computer competency of physical education teacher
on professional competency can be researched.
• The effect of teaching technical information about physical education
and sport in computer environment upon the success of students can be
examined.
• The computer equipment competency of schools in our country can be
researched.
• The effect of in service training given to physical education teachers for
the use of computer on the use of computer competency of teacher can be
examined.
Suggestions for Educators
• Educators can participate in various course programs in order to
improve themselves about use of computer.

INTERNATIONAL JOURNAL OF ENVIRONMENTAL & SCIENCE EDUCATION 8489
• Educators can make the lessons more interesting by increasing the use
of computer in lessons.
• Since the fact that educators increase the use of computer will be a
positive model for students, use of computer in lessons can be increased.
• Educators can request for help from various institutions to have enough
computer equipment in schools.
• Educators can examine the books written in this field in order to improve
themselves about the use of computer.
References
Erdemir, E., Bakırcı B., (2009).Öğretmen Adaylarının Eğitimde Teknolojiyi
Kullanabilme Özgüvenlerinin Tespiti. TÜFEDTUSED.6(3), 99-108
Gümüşdağ H.,Cerit E.,Gönülateş S., Arslanoğlu C.,Bastık C.,Şahin S., Ünlü C.(2013).
Beden Eğitimi Öğretmenlerinin Bilgisayar Kullanım Yeterlikleri Ve Tutumlarının
Belirlenmesi. Uluslar arası. Hakemli Beşeri ve Akademik Bilimler Dergisi.2(4)
İşman, A. (2005), Öğretim Teknolojileri ve Materyal Geliştirme, Pegem A.Yayıncılık,
Ankara
Usta, E., Korkmaz, Ö., (2010). Öğretmen Adaylarının Bilgisayar Yeterlikleri ve Teknoloji
Kullanımına İlişkin Algıları İle Öğretmenlik Mesleğine Yönelik Tutumları.
Uluslararası İnsan Bilimleri Dergisi. 7 (1),1335-1349
Çolakoglu, T., Er, F., Ipekoğlu, G., Karacan, S., Colakoglu, F. F., Zorba, E. (2014).
Evaluation of physical, physiological and some performance parameters of the
Turkish elite orienteers. Procedia-Social and Behavioral Sciences, 152, 403-408.
Yaman, Ç., Yaman, M.(2008). Beden Eğitimi Ve Spor Bölümü Öğrencilerinin Bilgisayar
Kullanma Yeterlilikleri. Akademik İncelemeler 3(1).
Yaman, M. (2007). The competence of physical education teachers in computer use.
TOJET: The Turkish Online Journal of Educational Technology, 6(4).
Güçlü, M. (2010). University students' computer skills: A comparative analysis.TOJET:
The Turkish Online Journal of Educational Technology, 9(2).
Furst-Bowe, J. & Boger, C. (1996). An analysis of required computer competencies for
university students. Journal of Research on Computing in Education, 08886504,
Winter95/96, 28 (2).
Smith, M., & Furst-Bowe, J. (1993). An assessment of computer skills of incoming
freshmen at two University of Wisconsin campuses. Paper presented at the
Association for Educational Communications and Technology Annual Conference,
New Orleans, LA.
Yaman, M., & Yaman, Ç. (2014). The use of social network sites by prospective physical
education and sports teachers (Gazi University sample). TOJET: The Turkish
Online Journal of Educational Technology, 13(1).
Yaman, M. (2007). The attitudes of the physical education students towards internet.
TOJET: The Turkish Online Journal of Educational Technology, 6(3).
Morahan-Martin, J. (1992). Gender differences in computer experience, skills and
attitudes among incoming college students. Collegiate Microcomputer, 10, 1-7.
Levine, T.; Donitsa-Schmidt, S. (1998). “Computer Use, Confidence, Attitudes and
Knowledge : A Casual Analysis”. Computers in Human Behavior. 14 (1), 125-146.
Hunt, N.P.; Bohlin R.M. (1993). “Teacher Education Students’ Attitudes Toward Using
Computers”. Journal of Research on Computing in Education. 25 (4), 487-497.

8490 OKAN
Necessary, J. R.; Parish, T. S. (1996). “The Relationships Between Computer Usage and
Computer-Related Attitudes and Behaviors”. Education. 116 (3). 384-386.