the use of information technology in environmental...
TRANSCRIPT

1
The Use of Information Technology in Environmental
Management: The Case of PPCDAM
Rodrigo M Pereira – IPEA
Celso Vila Nova de Souza Júnior - UnB
Abstract
In the mid 2000´s the Brazilian Government introduced a new environmental policy to
reduce deforestation in the Amazon forest, the PPCDAM. With 14 years of track record, heavily
relying on technological innovation, the policy is nowadays considered a major example of
success in the overall war waged against the deforestation of tropical rainforests. In this paper we
quantify this success. The results suggest that the policy not only had a direct effect of reducing
deforestation, but also rendered deforestation less sensitive to fluctuations in the Amazon
commodity production. We also perform a counterfactual exercise, estimating the levels of
deforestation that would have been registered, had the policy not existed. We estimate that the
plan saved a total of 196 thousand square kilometers of forest between 2005 and 2015,
corresponding to almost twice the total amount of deforestation observed during this period, and
4.9% of the entire Brazilian Amazon forest.
Resumo
Em meados dos anos 2000 o governo brasileiro introduziu uma nova política ambiental
para combater o desmatamento na floresta Amazônica, o PPCDAM. Passados 14 anos de
registros, e baseando-se fortemente em inovações tecnológicas, a política é considerada hoje um
exemplo de sucesso no combate ao desmatamento de florestas tropicais. Nesse artigo nós
quantificamos esse sucesso. Os resultados sugerem que a política não apenas teve um efeito
direto de redução do desmatamento, mas também tornou o desmatamento menos sensível a
flutuações na produção de commodities na Amazônia. Realizamos também um exercício contra
factual em que estimamos os níveis de desmatamento que ocorreriam caso a política ambiental
não tivesse sido implementada. Estimamos que a política salvou um total de 196 mil quilômetros
quadrados de floresta entre 2005 e 2015, o que corresponde a quase duas vezes o total de
desmatamento observado no período, e a 4,9% de toda a floresta amazônica brasileira.
Keywords: deforestation; commodity boom; environmental policy; Brazilian Amazon
Palavras-chave: desmatamento; boom de commodities; política ambiental; Amazônia
brasileira
Área 11: Economia Agrícola e do Meio Ambiente
Classificação JEL: C33; Q50

2
1 - Introduction
Unprecedented global technological changes in the last three decades have significantly
altered the process of economic transformation as well as its impacts on the environment. In
recent years it has been observed the ever-increasing use of information technology as a tool for
governmental action and public policy management.
The Amazon Forest encompasses more than 6 million square kilometers, in 9 countries,
and 60% of it is in Brazilian territory. With its notoriously complex and diverse environments,
the Amazon has close to 10% of the planet's biodiversity. The Brazilian Amazon has gone
through a historical pattern of occupation and unsustainable use if its natural resources, mainly in
the 70 's and 80 's. That is when military governments adopted certain standards of economic
development, integrating the territorial occupation policies.
In the first decade of the century there was a large worldwide expansion in the demand
for all kinds of commodities. With prices going up, commodity exporters strongly benefited from
those market conditions, unleashing an intense run for minerals, oil, pasture, cattle, and
agricultural land. In spite of the positive consequences for economies largely relying on primary
goods, such as Brazil, this event raised environmental concerns due to the increase in the
pressure on tropical forests like the Amazon. This relationship between commodity expansion
and deforestation is in the forefront of empirical research on the Brazilian Amazon. Specifically,
cattle ranching and soybean crops have been pointed out by a number of studies as the key
driving forces behind the Amazon deforestation (Barona et al., 2010; Fearnside, 2005; Margulis,
2004; Ferraz, 2001; Andersen, 1996; Walker et al., 2000).
The deforestation issue is, however, a lot more complex, and the literature has expanded
in several directions. Araújo et al. (2014) show that off-farm incomes increase the opportunity
cost of farming, reducing deforestation. Hargrave and Kis-Katos (2013) show that soybean prices
as well as increases in the availability of official agricultural credit are associated with increases
of deforestation rates in the Brazilian Amazon. Andersen and Granger (2007), Kirby et al.(2006),
and Barber et al. (2014) highlight the effect of roads on the Amazon deforestation. Chomitz and
Thomas (2003) relate deforestation to precipitation. They show that higher rainfall decreases the
probability of the forest being converted for agriculture or pasture. Pfaff (1999) shows that the
presence of roads and development projects, the soil quality, and the distance from consumer
markets affect deforestation. Faria, W. and Almeida, A. (2016) find that openness to trade
enhances deforestation in the Brazilian Amazon. Some authors also point out that land ownership
conflicts are an important cause of deforestation in the Brazilian Amazon (Alston et al.,2000 and
Araujo et al. 2009). Land reforms promoted by the federal agency INCRA would typically
render forested areas vulnerable to invasion by squatters. Since productive land is off the limits
of these reforms, a perverse incentive for land owners to deforest is then created.
More recent data on deforestation suggests the presence of new elements that may have
changed the way deforestation relates to fluctuations in commodity markets. Most notably, after
2004 there was a sharp and persistent decline of deforestation rates in the Brazilian Amazon, in
spite of hefty increases on prices of all commodities. Precisely when deforestation was expected
to increased, during the peak of the worldwide commodity boom, there was a remarkable change
of trajectory. Not coincidently, it that same year of 2004 the Brazilian government launched a
federal plan for the conservation of the Brazilian Amazon, the PPCDAM (Plano de Prevencao e

3
Controle do Desmatamento da Amazonia Legal). Since its introduction, the plan has been the
major federal environmental policy for the Amazon. It was based on subsidies to sustainable
farming, land use planning, the creation of conservation units, and most importantly, the
enforcement of environmental laws through new technologies that allowed the instantaneous
detection of new deforested areas. Assuncao et al. (2012) investigate the role played by the
PPCDAM and other conservation policies that were implemented in the Brazilian Amazon after
2004. They show that these policies were highly effective in reducing deforestation.
One of the most important questions today in order to understand the deforestation
process in the Brazilian Amazon is what drove deforestation down after 2004. What explains a
fivefold reduction of deforestation in the Brazilian Amazon, notwithstanding a simultaneous
expansion of worldwide commodity markets? In addition, when commodity markets sunk, and
prices collapsed after 2012, deforestation slightly increased in the Brazilian Amazon. Was there
a reversal in a relationship that has been well stablished by evidence and common sense? Was
the new policy so effective that it overwhelmed the effect of the commodity boom? Or did it
change the way the forest structurally relates to fluctuations in the commodity markets?
In this paper we investigate the determinants of deforestation in the Brazilian Amazon,
with particular emphasis given to the role played by this specific environmental policy of 2004,
the PPCDAM. We use a panel of 760 Amazon municipalities and 15 years. The results suggest
that municipal population growth, cattle grazing, total areas of permanent and temporary crops,
as well as soybean crops significantly affect deforestation. Moreover, the new environmental
policy significantly reduced deforestation in the Brazilian Amazon. The policy also rendered
deforestation less sensitive to fluctuations in crop areas and cattle herds in the Amazon. The
estimation of a deforestation equation allows us to perform an interesting exercise of policy
evaluation. We address the question of how effective has PPCDAM been to reduce deforestation
in the Brazilian Amazon. The model predicts that a much higher level of deforestation would
have taken place from 2005 to 2015 had the PPCDAM not been implemented. Our results
indicate that the policy avoided 196 thousand square kilometers of accumulated deforestation
through these 11 years, which is almost twice the amount of actual deforestation that occurred in
the period, and approximately 4.9% of the remaining forested areas in the Brazilian Amazon.
The paper is organized as follows. Section 2 presents a descriptive overview of the
Brazilian Amazon deforestation, underlining how it relates to commodity markets. Section 3 we
provide a discussion about the PPCDAM case and the use of Information Technology in
Environmental Management. Section 4 introduces a theoretical model of deforestation in which
increases in the environmental policy stringency such as the launching of PPCDAM affect the
farmer´s decision in terms of land use, consequently leading to deforestation. In section 5 we use
a panel data of 760 Amazon municipalities observed through 15 years to estimate a deforestation
equation, with special attention on the effect of the environmental policy. Section 6 presents
some counterfactual exercises that can be used for policy evaluation purposes. Section 7
concludes the paper highlighting the key findings and their policy implications.

4
2 - An Overview of the Amazon Deforestation
Deforestation in the Brazilian Amazon has been monitored with satellite data since the
late 1980's by INPE (Instituto Nacional de Pesquisas Espaciais), a National Institute for Space
Research, funded by the Federal Government. The institute monitors cleared forested areas in
what is defined as the Legal Amazon (Amazonia Legal). The area comprises the whole northern
region (states of Amazonas, Para, Acre, Rondonia, Roraima, Tocantins and Amapa) plus the
center-western state of Mato Grosso, and around two thirds of the territory of the northeastern
state of Maranhao. There are a total of 760 municipalities in the Legal Amazon. INPE provides
aggregate deforestation data, in deforested square kilometers, since 1988. In 2000 the institute
also began providing municipal data on deforestation. Unlike the aggregate data, the local data is
presented by INPE as the total cumulative cleared areas in square kilometers for all the 760
municipalities. Deforestation that took place in a particular year would then be the difference
between the total cleared areas in that year and the year before. Deforested areas are forever
considered as such in INPE's methodology, no matter if the forest is eventually regenerated in
those areas.1
The municipal data was a very important step because of the impossibility of gathering a
large amount of aggregate time series data, through higher observation frequencies. In fact,
deforestation data are always annual observations. The presence of large clouds during the whole
Amazon rainy season prevents any attempt to get monthly or quarterly data on deforestation.
Aggregate deforestation is relatively volatile from the late 1980's up to 2004. From then
on a steady decline begins, with current annual aggregate deforestation corresponding to
approximately 20% of its peak value. The big boom in commodity prices occurred between 2004
and 2012. Beef prices in 2014, for example, doubled if compared to the 2005 value. Soybeans
were 2.5 times more expensive in 2012 as compared to 2004. Figure 1 depicts those trajectories,
where the index of annual deforestation in the Brazilian Amazon is plotted against some IMF's
commodity price indexes, namely maize, soybean, beef, and a bundle for all commodities (fuel
and non-fuel).2
Figure 2 presents the same aggregate deforestation series, along with cattle herd and the
total of crop areas in the Legal Amazon allocated to permanent crops, temporary crops
(including soybean), and soybean crops. Areas for soybeans and other temporary crops had
substantial increases from 2005 to 2015 (around 50%), the cattle herd had a moderate increase
(around 12%), and there was a reduction of roughly 12% in the areas aimed for permanent crops.
Those trajectories by themselves cannot explain the almost fivefold reduction in deforestation
observed through the period. If nothing else, they would be consistent with increases in
deforestation.
1 It is a conventional wisdom for forest engineers that it would take more than 100 years for a full restoration of
biodiversity in regenerated rain forests such as the Amazon. Even though, they might have their canopy layers very
close to an untouched forest in a matter of a few years, with both types of forest looking identical from a satellite
perspective. 2 Nominal prices, in US dollars.

5
Figure 1: Amazon Deforestation and Commodity Prices
Figure 2: Aggregate Deforestation, Crop Areas and Cattle Herd at the Legal Amazon
Figure 1 suggests that after 2004 the relationship between commodity prices and
deforestation has changed. It seems that the early positive correlations gave way to negative
correlations. This fact can be confirmed by splitting the sample in two segments: one that goes
until 2004, and another that begins in 2005. We can then calculate Pearson correlation
coefficients between the Amazon deforestation and the prices of several commodities, for the
two consecutive time spans. The results are presented in Table 1. Again, we use IMF commodity
price indexes, based on nominal US dollars. The changes in the correlation coefficients are quite
remarkable. Most of them were positive until 2004, and became negative thereafter, suggesting a
substantial change in the way fluctuations in commodity markets would affect the deforestation
of the Amazon forest.
But how can increases in soybean crops and cattle ranching in the Legal Amazon coexist
with sharp reductions in deforestation? One possibility is to think of two alternative technologies
available for the farmer, one that requires deforestation and another that does not. In the absence
of monitoring and punishment for bad behavior, the first, forest unfriendly technology is
preferred. When authorities start monitoring deforestation as well as enforcing the law, there is a
migration of farmers from the bad to the good technology. So even with a booming market, with
prices and profits increasing, raises in production are compatible with reductions in
deforestation, as long as there are farmers changing their technologies.

6
Another possibility is to consider a technology in which land is an input with substitutes.
So, if the markets for the commodities produced by the farm are booming, the farmer would
naturally increase production, hiring more inputs. That includes more land, which may increase
deforestation. However, if there is a simultaneous increase of environmental sanctions, the
expected cost of land would increase for the farmer. That could be either because he faces
harsher penalties if caught illegally deforesting, or because the probability of being caught
becomes higher. In any case, the substitution of land for other inputs may be profit maximizing.
Therefore, the combination of booming commodity markets and a lower level of deforestation
may not be as unfamiliar as it seems. Those questions are addressed in more detail in section 3.
Table 1: Pearson Correlation Coefficients between Amazon Deforestation and
Commodity Prices **
The local level of deforestation for every municipality within the Legal Amazon can be
seen with the help of quantile maps. Because there is a wide variation on the size of Amazon
municipalities, using raw deforestation as the variable to be represented on the map would not be
Corrrelation Coefficients
1988/2004 2005/2015
deforestation 1 1
corn 0.3748 -0.689
metals 0.4727 -0.4225
commodity price index * 0.6591 -0.5248
Food price index * 0.1429 -0.837
raw materials 0.0391 -0.677
oil 0.492 -0.4205
beef -0.1244 -0.7963
coal 0.3657 -0.5266
coffe -0.1357 -0.5979
iron 0.0382 -0.6401
logs -0.0718 -0.4237
swine 0.0668 -0.5881
poultry 0.6285 -0.7837
rice 0.024 -0.56
rubber 0.5515 -0.3887
salmon -0.4144 -0.653
hardwood 0.0207 -0.7979
softwood 0.228 0.5793
soybean meal 0.2576 -0.791
soybean oil 0.1295 -0.5983
soybean 0.2878 -0.7688
aluminum 0.4368 0.3873
cocoa 0.3189 -0.7453
* Commodity Price Index starts in 1992; Food Price Index starts in 1991.
** Souce: INPE (Amazon deforestation) and IMF (commodity prices)

7
a very accurate procedure. In fact, gigantic municipalities would tend to have more deforested
areas than the tiny ones. So, we will rather divide deforestation by the municipal area, which
gives us an idea of the intensity of deforestation in a particular location. Figure 3 presents the
quantile map of deforestation as a share of municipal area for 2015. The map shows the
municipalities that were being more intensely deforested in 2015. The darker areas, where
deforestation took place in 2015, are right in the center of the Legal Amazon. The lighter areas in
the north and northwest are relatively preserved, and the light areas in the south and southeast are
transitional areas, where Cerrados (Central Savanas) are the prominent type of environment. So,
without the thick Amazon forest, deforestation is not registered in those areas, by definition.
Figure 3: 2015 Deforestation as a Share of Municipal Area
Another picture worth analyzing is the cumulative deforestation. Some of the dark areas
of the previous map indicate intense deforestation, but it may be a recent activity, in which case
the area would still be relatively preserved. On the other hand, there may be light areas with low
instantaneous activity because, say, it was already deforested in the past, and there is not many
forested areas left over. Figure 4 presents the quantile map of cumulative deforestation as a share

8
of municipal area, up to 2015. The map represents the overall damage that was made to the
Amazon up to date. The Arc of Deforestation is easily noticeable, with the darker areas forming
an arc that comprises the northeast of the Legal Amazon (States of Maranhao, eastern Para and
the northern tip of Tocantins), the north and southwest of Mato Grosso, the whole Rondonia, and
the eastern part of Acre. In some municipalities in Maranhao, eastern Para and Roraima almost
100% of the forest is already gone.
Figure 4: Cumulative Deforested Areas as a Share of Total Municipal Area up to 2015
Besides INPE's deforestation data described on the previous section, we use here several
other economic data of the Legal Amazon municipalities. Brazil's IBGE (Instituto Brasileiro de
Geografia e Estatistica) provides annual data on municipal GDP in thousand reais of 2014,
municipal cattle herd in heads, municipal permanent and temporary crops in hectares, and
municipal soybean crops in hectares. Soybean is a temporary crop, and is included in the
aggregation of all temporary crops. The data consists of areas that were planted (but not
necessarily harvested). So we have a panel of 15 years, from 2001 to 2015, and 760

9
municipalities.3 Population data might also be useful to explain deforestation. It is available in
two points of time, the 2000 and the 2010 censuses. Based on these observations we can
construct cross section variables to be used in a panel data estimation. So we take population
growth observed in every municipality within these ten years, and the share of rural population in
the total population for every municipality. The idea is to investigate if municipalities with a
higher share of rural settlements tend to be more forest unfriendly than the more urbanized ones.
3 – Technological Innovation in Public Administration: the Case of PPCDAM
The Amazon Forest encompasses more than 6 million square kilometers, in 9 countries, and 60%
of it is in Brazilian territory. With its notoriously complex and diverse environments, the
Amazon has close to 10% of the planet’s biodiversity. That is why the region is so prominent and
is always on the forefront of international preservation efforts.
The Brazilian Amazon has gone through a historical pattern of occupation and unsustainable use
if its natural resources, mainly in the 70’s and 80’s. That is when military governments adopted
certain standards of economic development, integrating the territorial occupation policies.
According to IBGE (Instituto Brasileiro de Geografia e Estatistica) around 20% of the Brazilian
Amazon has already been deforested. This is a result of territorial occupation, deliberate forest
burnings, agribusiness4,, logging, use of the soil for the production of other commodities,
grabbing of public lands, and infrastructure expansion.
The July of 2003 report named Plano de Ação para a Prevenção e Controle do Desmatamento
na Amazônia Legal (Plan for the prevention and control of the Legal Amazon deforestation)
found that between August 2001 and August 2002 25.500 km2 of Amazon forest were wiped out.
Deforestation was 40% higher than in the previous period. That mark was the second highest
ever registered, second only to 1995’s 29059 km2.
Since 1988 Brazil’s Environmental Ministry (MMA) teams up with Inpe (Instituto Nacional de
Pesquisas Espaciais) to monitor the Amazon deforestation with the use of satellite images. The
mapping of deforested areas is traditionally made with the images of the satellite Landasat. From
1998 until 2002 these mappings used low quality images, in the form of colored compositions in
the scale 1:250.000. With these maps it was possible to compare the images of each year, and
detect the new deforested areas. The updates of the deforested areas usually had a lag of two or
more years, mostly due to budget and organizational limitations. The number of observations
done by the satellite would depend on the weather, basically the occurrence of clouds, and the
rate at which the satellite would “revisit” each area.
3 INPE’s municipal data starts in 2000, but the first observation in the time series is lost because deforestation is defined as the first difference of the total cleared areas. 4 IBGE reports that around 80% of all the deforestation in the Brazilian Amazon originates from cattle ranching.

10
The PPCDAM Plan
Phase I (The early years – 2004-2008)
On the 3rd of July of 2003 a presidential decree established a permanent, multidisciplinary task
force aiming to introduce new ideas and to coordinate actions that would reduce the alarming
deforestation rates in the Amazon. It was named PPCDAM, or Plan of Actions to Prevent and
Control the Amazon Deforestation. With PPCDAM came the introduction of four working
groups, one for each of the plan’s four structural axis 5. The idea was to discuss and implement
emergency measures that could effectively reduce deforestation in the short run, as well as to
kick start the actions with long run effects.
In april of 2004 PPCDAM is enacted. Besides the aforementioned goals of reducing
deforestation and environmental degradation, the plan also envisioned social inclusion and the
enhancement of economic activities with a sustainable use of natural resources and with an
ecological balance (PPCDAM, 2004, p. 2007). An integrated set of 10 structural actions,
including some emergencies, were behind ten strategic guidelines6. The results of this first stage
were quite substantial. To name a few: (a) enactment of conservation units totaling more than 25
million hectares; (b) approval of more than 10 million hectares of indigenous territory; (c)
restraints on more than 60 thousand deeds of rural property; (d) creation of DETER, the system
of real time alerts of deforestation; (e) improvement of PRODES, the satellite measurement of
deforestation rates; (f) introduction of the Brazilian Forestry Service.
PPCDAM – Phase II (2009-2011)
Changes in how the soil was being used and in the dynamics of the deforestation were taking
place throughout PPCDAM’s first phase. These updates were incorporated in the definition of
new strategic guidelines. In this period a new National Plan for the Climate Change (PNMC) was
enacted, with four-year targets of reduction in the Amazon deforestation. This plan also focused
on the reduction of deforestation rates, alongside PPCDAM’s efforts.
The key achievements of Phase II can be summarized as follows: (a) set up of conservation unit
perimeters; (b) georeferencing of 25.618 rural deeds with the Terra Legal action; (c) execution of
649 joint inspection operations; (d) more than 7 billion reais (US$ 3.1 billion) in fines; (e)
seizure of more than 800.000 cubic meters of logs; (f) embargoes in more than 600.000 hectares
of land; (g) technological improvements on the technology to monitor the forest, with the
detection of deforestation in the presence of clouds.
The most substantial achievements came from the monitoring and control axis, in both first and
second phases. In spite of the good results, some recommendations were made in order to
5 (i) Land and Territorial Planning; (ii) Environmental Control and Monitoring; (iii) Promotion of Sustainable
Production; e (iv) Sustainable Environmental Infrastructure.
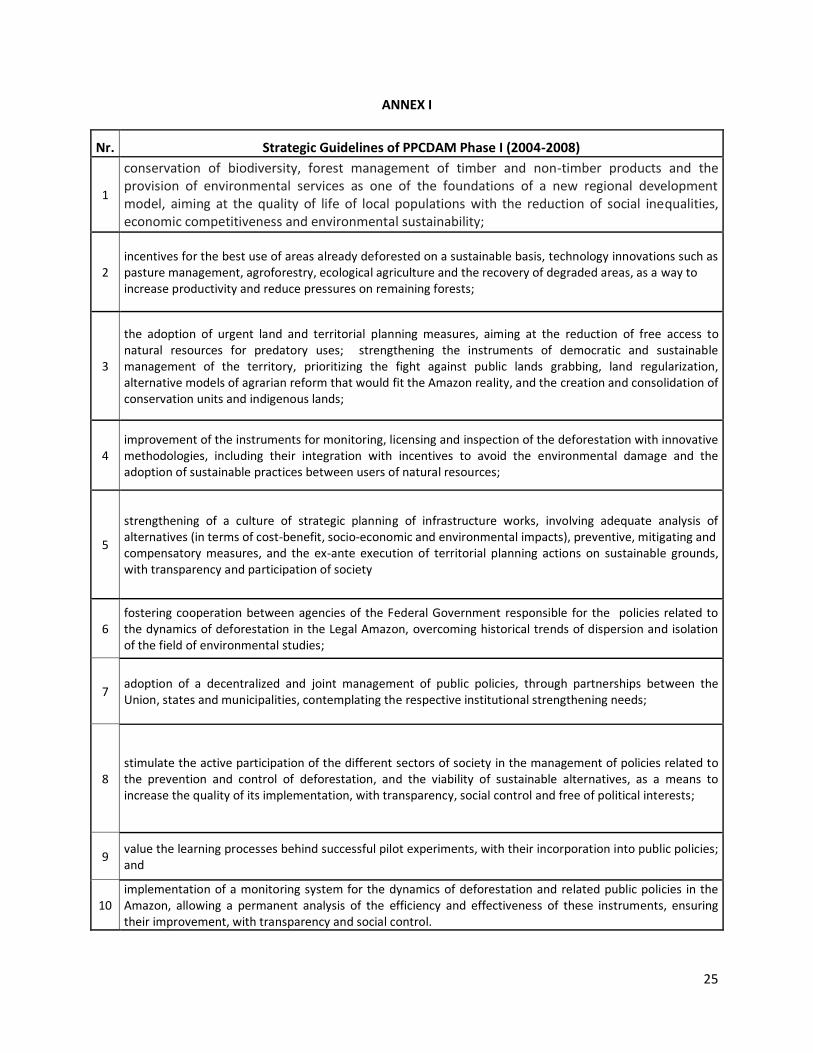
6 The ten strategic guidelines of PPCDAM are listed in Annex I.

11
improve PPCDAM. Hence the third phase of the plan was launched in 2012, with the
cooperation of additional public agencies7.
PPCDAM – Phase III (2012-2015)
From 2004 up to 2011 the most efficient actions in reducing deforestation were in the axis
“monitoring and control”, with the DETER system working in conjunction with an integrated
surveillance (Mello and Artacho, 2016).
The third phase begins with the challenge of carrying out actions that were in line with the new
dynamics of deforestation, capable of deceiving the satellites8. Farmers didn’t take long to
realize that deforestation in small polygons would pass through undetected by the satellites that
monitored the region, Additionally, it would make surveillance more expensive, due to the small
staff available for such a large area. Thus, increasing the effectiveness of the monitoring and
control of deforestation is an important strategic objective in this third phase. To this end, seven
new guidelines have been set out (see Annex III).
A new PPCDAm governance model has been introduced, divided into three spheres: Executive,
Advisory and Transparency. This new model facilitates the continuous monitoring of the plan
and how its actions are being executed, as well as of eventual corrections in the program and of
MMA’s decision-making process.
The third phase also had positive results, such as additional 50 million hectares of conservation
units, the creation of the Amazon Protected Areas Program (ARPA), additional 10 million
hectares of indigenous areas, the strengthening of forest concessions, the improvement of
monitoring systems PRODES, DETER, DEGRAD, DETEX and TerraClass, among others.
PPCDAM – Phase IV (2012-2015)
In this phase, one more axis is added: ordering, monitoring, development and infrastructure. It
deals with normative and economic acts related to deforestation. The goal is to enhance a forest-
based economy with an input-output matrix that, in spite of being economically competitive
would have the least possible impact on the forest. But overall, the previous guidelines were
kept, only smaller adjustments were made in face of the new dynamics of deforestation.
The use of Information Technology in Environmental Management
Changes in the forest cover of the Legal Amazon are monitored by different government systems
(DETER, PRODES, DEGRAD and DETEX) operated by INPE, and by an independent
7 Secretaria de Planejamento e Investimentos Estratégicos (SPI), Ministério do Planejamento, Orçamento e Gestão. 8 Over the years, illegal logging have used some tactics to trick the satellites, among which we highlight: (i) preserving the tallest treetops while knocking down lower trees; (ii) deforesting small areas, a practice called multipoint deforestation; (iii) deforestation in the rainy season when there is cloud formation that impairs the detection of spots of deforestation.

12
Deforestation Alert System (SAD) operated by the non-governmental organization Imazon9. All
of these systems give support to PPCDAM. Let's see now how each of them works:
Real Time Deforestation Detection System - DETER
Carried out by INPE, DETER issues daily notifications to IBAMA and its results are released to
the public every three months (February, May, August and November). This system allows the
identification of two types of deforestation: forest degradation (removal of some commercially
valuable trees) and shallow cutting (total removal of vegetation cover).
DETER uses 3 types of images: the modis sensor of satellite earth that has the spatial resolution
of 250 meters and detects deforestation of 25 hectares, the equivalent of 25 football fields. Its
optical system can be hampered by cloud cover while reading the images. To tackle the issue,
DETER also has the SAR radar of the terraSAR-X satellite. This radar covers 17% of the Legal
Amazon, monitoring areas that have a high incidence of clouds. It works with electromagnetic
waves that can cross the clouds and get the results without interference. To increase resolution,
the system is using images of the IRS satellite, with a resolution of 56 meters, capable of
identifying deforestation as small as 6.25 hectares.
DETER-B
The DETER-B Project is introduced as an answer to the new deforestation pattern. It’s main
leverage in the struggle against deforestation lies in the ability to identify and map almost in real
time, deforestation and changes in forest cover, in areas as small as one hectare. Indeed, most of
the deforestation mapped by PRODES by then had areas smaller than 25 hectares. For these
cases, the DETER project is unable to detect this new pattern of deforestation.
To do so, the system was reinforced with images of the WFI sensors, the CBERS-4 satellite
(Sino-Brazilian Satellite of Earth Resources, and of the Indian Remote Sensing Satellite (IRS),
with 64 and 56 meters of spatial resolution, respectively. The two satellites have the temporal
resolution of five days, meaning that it takes them this time span to go around the globe,
improving the receptivity of the images. The data are sent daily to Ibama. The identification of
forest cover change is done by visual interpretation based on five elements: color, tonality,
texture, shape and context.
PRODES System
The PRODES system was created in 1988 to organize, monitor and make public official annual
deforestation rate of the Brazilian Amazon. It is considered the largest forest monitoring program
in the world, covering 4 million hectares per year. It detects shallow cutting, in which there is
total loss of vegetation cover. The system uses the images of the Landsat, IRS and DMC
(Disaster Monitoring Constellation), resulting in a resolution of 25 meters, which allows the
detection of cuttings as small as 6.25 hectares. Despite being an optical system, the images the
9 Foundation created in July 1990 with national and international sponsors, which intended to promote the
sustainable development in the Brazilian Amazon through studies, public policies, broad dissemination of
information and professional training.

13
images coming from different satellites overcomes the obstruction of the clouds by combining
different images of the same area throughout the year.
DEGRAD System
The selective and persistent cutting of certain trees, or the cleaning or burning of part of the
understory of a forest so that its canopy remains reasonably conserved are examples of forest
degradation. This type of deforestation has been widely used in the Amazon as means to fool the
satellites and, consequently circumvent inspection. When the DETER System identified an
increased degradation of the Amazon forest, INPE decided to develop a system able to map areas
of forest degradation: they were still suffering deforestation and their vegetation cover had not
yet been totally wiped out. This system is called DEGRAD, and since 2007 has been mapping
areas through the use of images that are obtained by the LANDSAT and CBERS satellites. Like
PRODES, the minimum area mapped by DEGRAD is 6.25 hectares.
DETEX System
The Monitoring System for Selective Exploitation of Wood, known as DETEX, is the fourth
monitoring system that is being developed by INPE in partnership with the Brazilian Forest
System (SFB) 10. DETEX monitors and controls the selective logging. It does so identifying
forest clearings, roads and tracks, areas for storage of logs, and individual cuttings. DETEX
relies on images of size 20X20 meters obtained by the Sino-Brazilian CBERS II satellite and by
airborne radars of the Protection System of the Amazon (Sipam) 11. The system is fully
operational, but the data has not yet become public.
SAD (DEFORASTATION ALERT SYSTEM)
SAD is an independent system carried out by the non-governmental organization Imazon
(Amazon Institute of People and Enviroment). It detects both the degradation of the forest
(partial deforestation) as well as the total loss of the vegetation cover. The reports are released on
a monthly basis, essentially built upon the images of the Modis sensor of the Terra satellite,
which allows the detection of deforestation as small as 10 hectares. However, unlike DETER it
relies on methods such as digital classification and visual interpretation.
Because SAD is an optical system, clouds can impair the reading of images. In addition, the
system cannot differentiate illegal deforestation from the legal one, allowed by the forest code.
So, one important requirement of this deforestation alert system is to combine the data obtained
by the monitoring systems with the data on the legal deforestation, usually under the auspices of
state governments.
Although all these systems (PRODES, DETER, DEGRADE, DETEX and SAD) have their own
limitations, over the years the joint effort to reduce deforestation in the Brazilian Amazon
achieved remarkable results. Information Technology has been an important ally in the
10 Agency established by Law nr. 11.284 / 2006, the Brazilian Forestry Service is financed by the National Treasury and has the mission of promoting knowledge, sustainable use and expansion of the forest cover, making the forest agenda strategic for the country's economy 11 PRODES images have size of 30X30 meters and DETER images of 250X250 meters.

14
improvement of public services. The combination of these systems and all of their improvements
allowed the gathering of different types of images that ultimately led to a greater effectiveness in
the deforestation control operations.
4 - Theoretical Framework
In this section we introduce a simple model of deforestation. We assume a representative
farm that produces a single output Y, using two inputs: labor N, and land L. The government
imposes a limit of land use of �̅�. Deforestation is allowed only within the limits of �̅�. Labor and
land have unitary costs of w and x, respectively, and the product is sold at the price of q per unit.
We assume that markets are competitive. If the farmer abides by the law, his total cost is wN +
xL. The farmer can, however, choose to use more land than �̅� , in which case he enters a lottery. If the extra forest clearing is not detected by the authorities, then every unit of extra land simply
costs x. But, if the illegal deforestation is detected, sanctions are imposed on the farmer. They
can be environmental fines, seizure of property, machines, or even jail time. To make things
simple, we just assume an extra cost of z per unit of deforested land above the legal limit �̅�.12 So,
if detected, the farmer pays x for the first �̅� units of land, and x + z on every unit thereafter. If p
is the probability of detection when the farmer decides to extend his farming area beyond �̅�, his expected profit is given by:
𝜋(𝑞,𝑤, 𝑥, 𝑦, 𝑝) = 𝑞𝑌 − 𝑤𝑁 − 𝑥𝐿 −𝑀𝑎𝑥{0, 𝑝𝑧(𝐿 − �̅�)} (1)
s. t. 𝐹(𝑁, 𝐿) ≥ 𝑌
where 𝐹(𝑁, 𝐿) is a standard technology with positive and decreasing marginal
productivities. The farmer’s objective is to maximize his expected profit. The first order
optimality conditions are given by:
𝑞𝐹𝑁(𝑁, 𝐿) = 𝑤 (2)
𝑞𝐹𝐿(𝑁, 𝐿) = 𝑥 if 𝐿 ≤ �̅� (3)
𝑞𝐹𝐿(𝑁, 𝐿) = 𝑥 + 𝑝𝑧 if 𝐿 > �̅� (4)
So, the value of labor’s marginal productivity is equal to the wage, and the value of
land’s marginal productivity is equal to the expected marginal cost of land. If the farmer decides
to use more than �̅� of land, that cost includes the regular price of land, x, plus what could be
defined as policy stringency, which is based in two measures: the probability p of being caught
deforesting more than the legal threshold �̅�, and the associated penalty cost per unit of land, z.
12 The idea is that any type of cost, no matter how prohibitive, has its equivalent in monetary terms.

15
When the market for the commodity produced by this farmer is booming, there are
increases in the price q. The profit maximizing response is to increase labor and land, reducing
their marginal productivity in such a way that the left-hand side of equations (2), (3) and (4)
remain constant.
A policy designed to reduce deforestation amidst a commodity boom would naturally
target the policy stringency pz in such a way that increases in the commodity price q (and
consequently in the labor force N) would be matched by an increase in the expected cost of land
x + pz, keeping land use L constant, or even reducing it. That’s exactly what PPCDAM did in
2004. The plan comprised a series of actions designed to reduce deforestation. The war against
deforestation would no longer be waged only by environmental agencies, but rather it would be
in the forefront of Brazil's top policy priorities. Among other things, PPCDAM created subsidies
to sustainable activities within the forest, and land use planning, with the creation of several
conservation units. Most importantly, the plan relied on new technologies to launch a system
called DETER, allowing almost real time detection of new deforested areas, streamlining the
enforcement of the existing environmental laws. That changed the pattern of deforestation.
Ranchers begun cutting small pockets of forest, enough to be below DETER's detection
threshold (although detected by the regular annual monitoring). Overall, deforestation rates fell
sharply. In fact, the data suggests that the plan was so effective in raising policy stringency that
even with the steep rise in commodity prices there was a remarkable, never before seen,
reduction in the deforestation of the Brazilian Amazon.
5 – Estimation
We want to evaluate the quantitative effects of variables that are commonly listed as
determinants of the Amazon deforestation, such as cattle herd, crop areas, population, municipal
GDP, etc. We also want to investigate if the policies adopted in 2004 in the form of the
PPCDAM can explain the massive reduction of deforestation observed afterwards. The empirical
strategy is to use a panel of 760 municipalities and 15 years, totaling 11400 observations, to
estimate the following deforestation equation.
𝐷𝑒𝑓𝑖𝑡 = 𝛽0 + 𝛽1𝐺𝐷𝑃𝑖𝑡−1 + 𝛽2𝐶𝑎𝑡𝑡𝑙𝑒𝑖𝑡 + 𝛽3𝑃𝐶𝑟𝑜𝑝𝑖𝑡 + 𝛽4𝑇𝐶𝑟𝑜𝑝𝑖𝑡 + 𝛽5𝑆𝑜𝑦𝑖𝑡 + 𝛽6𝐴𝑟𝑒𝑎𝑖 + 𝛽7𝑃𝑜𝑝𝐺𝑖 +𝛽8𝑅𝑢𝑃𝑜𝑝𝑖 + 𝛾1𝐷𝑡 + 𝛾2𝐷𝑡𝐶𝑎𝑡𝑡𝑙𝑒𝑖𝑡 + 𝛾3𝐷𝑡𝑃𝐶𝑟𝑜𝑝𝑖𝑡 + 𝛾4𝐷𝑡𝑇𝐶𝑟𝑜𝑝𝑖𝑡 + 𝛾5𝐷𝑡𝑆𝑜𝑦𝑖𝑡 + 𝛼𝑖 + 𝜀𝑖𝑡 (5)
Differently from the maps presented in section 2, the variable Defit here is raw
deforestation, rather than deforestation as a share of municipal area. The reason is that we can
control for the municipal area, by adding that variable in the regression equation. It would be a
cross-sectional variable, time invariant, hence the absence of the sub-index t in Areai. Based on
the 2000 and 2010 censuses, two other cross-sectional variables are created, namely, municipal
population growth, and rural population as a share of total population on every municipality. The
population growth calculates the percentual growth in the population of every municipality in the
legal Amazon between the years 2010 and 2000. The rural population ratio is calculated with the
data of the latest census of 2010. The term αi captures unobserved variables that are time
invariant, not included in the model. When we perform fixed effects estimation all these time

16
invariant variables disappear from the model. We also perform a random effects estimation,
along with a standard pooled OLS. In these cases the observed time invariant variables are
present, while the unobserved ones in αi mingle with the error term, and there is a well-known
possibility of inconsistencies.
There are five explanatory variables with a panel structure, namely, municipal GDP
(GDPit), cattle herd (Cattleit), total areas of permanent crops (PCropit), total areas of temporary
crops (TCropit), and total areas of soybean crops (Soyit).13 These agricultural areas are measured
in hectares, while deforestation is measured in square kilometers (100 hectares = 1 km2). Cattle
herd is measured in heads, and municipal GDP in thousands of reais of 2014. The reason we use
the lag of GDP rather than current GDP is that the most recent available data on GDP is usually
one year behind all the others. So, instead of losing 2015 and all of its 760 observations, we use
lagged GDP, which is usually highly correlated and a very good proxy for current GDP.
In order to assess the effect of policy we introduce a dummy variable Dt, that has a value
of 0 up to 2004, when the policy was implemented, and a value of 1 from 2005 on. This dummy
is also interacted with cattle herd, permanent and temporary crops, and soybean crops. The idea
is to analyze whether the PPCDAM plan changed the way these economic activities affect
deforestation.
Table 2 presents the results of three different panel data estimations of equation (5):
pooled ordinary least squares, fixed effects (without time dummies), and random effects. The
three variables in the model that are time-invariant disappear when fixed effects are used. We
also exclude lagged GDP in the fixed effects estimation due to lack of statistical significance. For
both pooled OLS and random effects estimations, the lagged municipal GDP and the share of
rural population do not significantly affect deforestation. Population growth, however, is highly
significant. The pooled OLS coefficient of 0,33 (0.34 with random effects) states that on average
every 3% of population growth accounts for an extra deforested square kilometer every year in
that particular municipality. Municipal area is also highly significant, and here it controls for the
fact that larger municipalities tend to be more deforested. So every extra thousand square
kilometers of municipal area imply 1.1 extra square kilometer of deforestation on average (1.2
with random effects).
13 Soybean is a temporary crop. So when we aggregate all the temporary crops we can either include or exclude the soybean crop areas from this number. We decide to include it. So our measure of temporary crops does include soybean crops. That would be a problem if soybean crops were a major component of temporary crops in most Amazon municipalities, which could be a source of multicollinearity. It is definitely not the case. We also did all the regressions with a measure of permanent crops that excluded soybeans, and the results were very similar.

17
Table 2: Estimation of the Deforestation Equation
Overall, the results of the three estimations are similar. The estimated coefficient signals
are roughly the same on all models, the exception being the reversal of the cattle herd coefficient
when fixed effects are used. Cattle herd having a negative effect on deforestation is not so
Variable Pooled OLS Fixed Effects Random Effects
constant -3.187 68.0644 *** 4.6763
(-1.457) (29.60) (1.382)
Municipal GDP (-1) 0.000000129 -0.000000301
(0.527) (-0.7131)
Cattle Herd 0.000233941 *** -0.000341682*** 0.000175460 ***
(21.85) (-15.81) (14.28)
Perm Crops 0.00572287 *** 0.00117298 0.00585836 ***
(10.33) (1.284) (9.363)
Temp Crops 0.00142011 *** 0.000569926 *** 0.00116923 ***
(8.602) (3.420) (7.131)
Soybean Area -0.00153351 *** -0.000558516 ** -0.00122621 ***
(-6.984) (-2.468) (-5.611)
Municipal Area 0.00110229 *** 0.00122673 ***
(24.31) (14.61)
Pop Growth 0.328893 *** 0.344911 ***
(13.57) (7.715)
Rural Pop Ratio 6.13533 * -1.12941
(1.827) (-0.1827)
Dppcdam -12.1402 *** -11.0060 *** -10.1828 ***
(-6.766) (-7.214) (-6.390)
Dcattle -0.00014758 *** -0.0000823197 *** -0.000161665 ***
(-12.61) (-7.667) (-15.27)
Dperm -0.00432997 *** -0.00183936 *** -0.00404661 ***
(-6.7864) (-3.324) (-7.080)
Dtemp -0.00128222 *** -0.000782371 *** -0.00122763 ***
(-7.175) (-4.867) (-7.441)
Dsoy 0.00134607 *** 0.000768355 *** 0.00132887 ***
(5.551) (3.527) (5.984)
observations 11400 11400 11400
municipalities 760 760 760
Fit R2 = 0.2268 Within R2 = 0.1587
Note: t-ratio statistics are presented within brackets, and the usual symbols ***, ** and * denote
significance at the 1%, 5%, and 10% levels, respectively.

18
strange as it seems. Indeed, the typical frontier deforestation has loggers extracting the most
valuable timber before farmers burn the remaining vegetation to get agricultural land. Within a
few years of crops the soil becomes so poor that the land has to be converted to pasture
(Andersen, 1996). So, if large cattle herds tend to be in places where deforestation has long
occurred, and there is nothing left to deforest, that negative coefficient is perfectly reasonable.
The same argument holds true for the negative coefficients of soybean crops. They simply mean
that larger areas of soybean crops are located in municipalities that have long been deforested, so
that current deforestation might be low.
The coefficient for the PPCDAM dummy is highly significant in all models, with values
ranging from -10 to -12. So after the policy is implemented the annual deforestation is reduced
on average in 11 square kilometers per municipality (fixed effects), controlling for other
attributes. That means a total of 8.36 thousand square kilometers per year for the 760
municipalities, and a total of 92 thousand square kilometers for the whole period of 2005 up to
2015. But this is only a partial effect, because we interact the dummy with four other variables.
The highly significant coefficients of all four interactions suggest that PPCDAM did change the
way cattle grazing and agriculture affect deforestation. Before the plan was introduced every
extra square kilometer of permanent crops and temporary crops accounted for an extra 0.57 and
0.14 extra annual square kilometer of deforestation, respectively, for every municipality (using
the pooled OLS results). After the plan these numbers change to 0.14 and 0.01, respectively.
Those numbers are obtained by adding the coefficients of the interactions to the original
coefficients of the respective variables. These results suggest that the plan forced farmers to find
ways to increase crop areas without cutting down the forest. By the same token, every additional
10 thousand cows would increase annual municipal deforestation by 2.3 square kilometers, on
average, before the plan. That number shrunk to 0.86 after the plan, still using the pooled OLS
regression.
5 – Policy evaluation
In this section we perform a counterfactual exercise that measures the overall effect of the
PPCDAM. The idea is to find out the numbers for the Amazon deforestation if the PPCDAM
was not implemented. Based on the three estimation procedures presented in Table 2, we
calculate the predicted value for deforestation, with the dummy for the PPCDAM having a value
of zero throughout the whole period. Then we sum for all 760 municipalities and all 11 years
since 2005, the first full year in which the policy is effective, up to 2015, the last year of the
dataset. The result is an estimate of the amount of forest that was saved as a direct result of the
policy. The estimates are 338194, 229187 and 324841, with the pooled OLS, fixed effects, and
random effects models, respectively. Those are quite large numbers when compared with the
100425 square kilometers of deforestation that was observed for the period. From now on we
will work with the most conservative of these numbers, which is the one obtained with the fixed
effects estimation. So, based on the estimates in Table 2, we get:
𝐷𝑒�̂�𝑖𝑡 = 68.06 − 0.00034𝐶𝑎𝑡𝑡𝑙𝑒𝑖𝑡 + 0.0012𝑃𝐶𝑟𝑜𝑝𝑖𝑡 + 0.00057𝑇𝐶𝑟𝑜𝑝𝑖𝑡 − 0.00056𝑆𝑜𝑦𝑖𝑡 (6)

19
Equation (6) gives the predicted deforestation of every municipality, for every year from
2005 to 2015, had the government not implemented the PPCDAM plan. These numbers can be
aggregated on the time and/or cross-sectional dimensions.
There is no upper bound on the levels of deforestation predicted. Therefore, the values
predicted by equation (6) for municipalities with critical levels of deforestation are sometimes
higher than the total municipal area, which obviously makes no sense. If we correct for that, and
establish that the maximum value for prediction is the correspondent municipal area, we find
lower values than the ones listed above. Specifically, with fixed effects, the total saved forest in
square kilometers becomes 196512, around 14.4% lower than the original estimate.
Putting this number in perspective, 196 thousand square kilometers corresponds to almost
twice the amount of actual deforestation observed in the period. The total predicted cumulative
deforestation without the policy is 297 thousand square kilometers. So, according to this result,
the amount of forest that was saved by the policy corresponds to 66% of the total deforestation
that would have occurred in the period from 2005 to 2015, had the PPCDAM not been
implemented. The only other similar number for the PPCDAM´s effectiveness found in the
literature, to the best of our knowledge, was provided by Assunção et al. (2012). They found a
slightly smaller figure of 52.1%, but their time span is also smaller, from 2005 to 2009.14 So,
notwithstanding the fact that the reduction in aggregate deforestation flattened out after 2011, our
results suggest that the share of deforestation avoided by the policy on the total predicted
deforestation kept rising.
If we aggregate the data in the cross-section dimension, we can compare the two time
series that together capture the effect of the policy, namely, the observed aggregate deforestation,
and the predicted deforestation without the policy. Figure 5 presents these series. The first graph
on the left-hand side presents the original estimate with fixed effects, and the graph on the right-
hand side presents the estimates corrected to the fact that municipalities cannot deforest more
than 100% of their own area.
Figure 5: Observed and Predicted Deforestation without PPCDAM
14 According to these authors the environmental policies saved 62 thousand square kilometers of forest between 2005 and 2009.

20
Another interesting exercise is to aggregate the data on the time series dimension. So, for
every municipality we calculate the difference between the observed deforestation, and the
deforestation without policy, predicted with equation (6). We then sum those numbers for the
whole time for which the plan has been operational, from 2005 to 2015. The result is the
predicted cumulative area of forest saved by the policy, for each municipality. In order to present
those numbers on a map, we take them as a share of the municipality area. These results are
shown in Figure 6. Most of the forested areas saved by the PPCDAM are on the deforestation
arch. There is also a visible projection of darker areas following the course of the Amazon River.
The predictions of non-deforested areas south and southeast of the deforestation arch are
certainly an overshoot. Those are areas in which the Amazon forest meets the Cerrado (Central
Savannas), and there is a high proportion of municipal areas that are originally non-forested. So,
the fact that observed deforestation was low does not necessarily mean that the PPCDAM plan
was effective, but rather that there is not much forest to be deforested. That suggests that the
actual number of square kilometers saved by the plan for the entire Amazon might be slightly
lower than the number we have been working with.
Figure 6: Forested Areas Saved by PPCDAM as a Share of Municipal Area

21
We can also use the predictions of the forested areas saved by the plan and compare the
2015 picture of cumulative deforestation with the cumulative deforestation that would exist had
the plan not been enacted. Figure 7 depicts the results. The graph on the left-hand side shows the
actual cumulative deforestation in the Amazon in 2015. The graph on the right-hand side shows
the counterfactual cumulative deforestation: how Amazon would look like by 2015 if the
PPCDAM was never implemented.
Figure 7 : Actual (left) Versus Counterfactual (right) Cumulative Deforestation
7 - Conclusion
Understanding the recent movements in the deforestation of the Brazilian Amazon is
crucial in the effort to preserve this important, biodiverse, rainforest. The Brazilian Amazon
covers an area of approximately 4 million square kilometers (Olson et al., 2001), and accounts
for 13% of the world´s biota (Lewinsohn and Prado, 2005). By the mid 2000’s it was being
deforested at an annual rate of 0.65%. The succeeding reduction in the deforestation brought this
number down to approximately 0.15%, a remarkable result that was believed to be achievable
only if accompanied by a considerable cutback in the Amazon’s economic activity. Surprisingly,
it was achieved amidst a major worldwide expansion of commodity markets, including the
markets of major commodities produced in the Amazon region.
The high deforestation rates of the Brazilian Amazon in the years 2001 and 2002
provided the reasoning behind a new presidential decree signed in July 2003 that would create a
permanent group of inter-ministerial work, whose objective was to draw up a new set of joint
actions to fight the deforestation of the Amazon, ultimately giving rise to PPCDAM. After its
implementation in April 2004, there was a noticeable reversal in the trends, with sharp reductions

22
in the deforestation rates of the Amazon. Over the years, new guidelines and strategies have been
added to PPCDAM to adjust it to the new dynamics of deforestation.
This paper analyses the determinants of deforestation in the Brazilian Amazon, with
particular focus on the role played by this bold conservation policy introduced by the federal
government in 2004, the PPCDAM. To do so, it relies on a panel of 760 Amazon municipalities
and 15 years that is used to estimate the effects of traditional deforestation drivers, like cattle
herd and soybean crops, as well as the effect of the conservation policy. The main findings are
that population growth, cattle herd, permanent and temporary crops, and soybean crops
significantly affect deforestation. Moreover, the conservation policy significantly reduced
deforestation. It changed the way the forest structurally relates to fluctuations in the commodity
markets. With PPCDAM, deforestation became less sensitive to fluctuations in crop areas and
cattle herds in the Amazon. In a counterfactual exercise the results suggest that the policy
prevented 196 thousand square kilometers of Amazon forest from being wiped out between 2005
and 2015. That number is 4.9% of the entire Brazilian Amazon forest. It is almost twice the
amount of actual deforestation that occurred in the same period.
Considering the dimension and complexity of the Amazon, new efforts to curb
deforestation have always faced some skepticism. No matter how officials tried to enforce the
environmental laws, ranchers and loggers performing illegal cuttings were always one step
ahead. The introduction of new monitoring technologies this time around seems to have been the
real game changer, when we look at the recent Amazon deforestation numbers.
The results obtained here suggest that a well-designed conservation policy can be very
effective in curbing the deforestation process of rain forests. In fact, the Brazilian Amazon
experience should be investigated, improved, and perhaps the main structure of a plan such as
PPCDAM could be replicated in other rain forests that are going through deforestation processes.
After all, 4.9% of the Amazon, along with all the biodiversity that has been preserved, in just 11
years is a formidable gift to the future generations.
References
Abdala, G.; (2008) Plano de Ação para Prevenção e Controle do Desmatamento na Amazônia
Legal (PPCDAm) Documento de Avaliação. Brasília, DF: Ministério do Meio Ambiente, 2008.
Alston, L.J., Libecap, G.C.; Muller, B. (2000) Land reform policies, the sources of violent
conflict, and implications for deforestation in the Brazilian Amazon. Journal of Enviromnental
Economics and Management, vol. 39, 162-188.
Andersen, L. (1996). The Causes of Deforestation in the Brazilian Amazon, Journal of
Environment & Development, Vol. 5, no. 3, 309-328.
Andersen, L. and Granger, C. (2007). Modeling Amazon deforestation for policy purposes:
reconciling conservation priorities and human development. Environmental Economics and
Policy Studies, Vol. 8, n. 3, 201-210.
Araujo, C., Araujo-Bonjean, C., Combes, J., Motel-Combes, P. and Reis, E. (2009). Property
rights and deforestation in the Brazilian Amazon. Ecological Economics, 68, 2461-2468.

23
Araújo, C., Combes, J-L., and Feres, J. (2014) Determinants of Amazon Deforestation: The Role
of Off-Farm Income, Etudes Et Documents Du Cerdi, n. 23.
Assuncao, J. et al (2012) Deforestation Slowdown in the Legal Amazon: Prices or Policies? CPI
Working Paper, PUC/Rio.
Barber, C., Cochrane, M., Souza, C., and Laurance, W. (2014). Roads, deforestation, and the
mitigating effect of protected areas in the Amazon, Biological Conservation, 177, 203-209.
Barona, E., Ramankutty, N., Hyman G., and Coomes O., (2010) The role of pasture and soybean
in deforestation of the Brazilian Amazon, Environmental Research Letters, 5.
Brasil (2013). Ministério do Meio Ambiente – MMA & Serviço Florestal Brasileiro – SFB.
Florestas do Brasil em resumo (Relatório). Dados de 2007-2012. Brasília, DF: MMA e SF.
Chomitz, K. and Thomas, T. (2003). Determinants of land use in Amazonia: a fine-scale spatial
analysis, American Journal of Agricultural Economics, 85, 1016-1028.
Faria, W. and Almeida, A. (2016). Relationship between openness to trade and deforestation:
Empirical evidence from the Brazilian Amazon. Ecological Economics, Vol. 121, 85-97.
Fearnside, P.M. (2005) Deforestation in Brazilian Amazonia: history, rates and consequences.
Conservation Biology, vol. 19, n.3, 680-688.
Ferraz, C. (2001) Explaining agriculture expansion and deforestation: evidence from the
Brazilian Amazon 1980/98. Texto para Discussão 828, IPEA.
Hargrave, J. & Kis-Katos, K. (2013). Economic causes of deforestation in the Brazilian Amazon:
a panel data analysis of the 2000’s Environmental and Resource Economics, 54(4), 471-494.
IBGE, INSTITUTO BRASILEIRO DE GEOGRAFIA E ESTATÍSTICA. Mapa de Biomas do
Brasil e de Vegetação do Brasil. Mar/2004. Disponível em: <
https://ww2.ibge.gov.br/home/presidencia/noticias/21052004biomashtml.shtm>. Accessed on:
02/29/2018.
INPE, INSTITUTO NACIONAL DE PESQUISAS ESPACIAIS. Monitoramento da Floresta
Amazônica por Satélite 1998-1999, separata. Rio de Janeiro, 2000.
INPE, INSTITUTO NACIONAL DE PESQUISAS ESPACIAIS. Monitoramento da Cobertura
Florestal da Amazônia por Satélites. Sistema PRODES, DETER, DEGRAD e Queimadas 2007-
2008. SP: São José dos Campos, Dez/2008a. Disponível em: <
http://www.obt.inpe.br/deter/avaliacao/2008/Avaliacao_DETER_2008_05.pdf> Accessed on:
03/02/2018.
INPE, INSTITUTO NACIONAL DE PESQUISAS ESPACIAIS. Monitoramento da Cobertura
Florestal da Amazônia por Satélites. Sistema de Detecção do Desmatamento em Tempo Real na
Amazônia – DETER: aspectos gerais, metodológicos e plano de desenvolvimento. SP: São José
dos Campos, Jun/2008b. Disponível em: <
http://www.obt.inpe.br/OBT/assuntos/programas/amazonia/deter> Accessed on: 03/02/2018.

24
IPEA; GIZ; CEPAL. (2011). Avaliação do Plano de Ação para Prevenção e Controle do
Desmatamento da Amazônia Legal: PPCDAM 2007-2010. Brasília: Ipea, GIZ; Cepa.
Disponível em: <http://combateaodesmatamento.mma.gov.br/images/conteudo/Avaliacao-do-
PPCDAm-2007-2010.pdf>. Accessed on March 12, 2018.
Kirby, K. at al. (2006). The future of deforestation in the Brazilian Amazon, Futures, Vol. 38, n.
4, 432-453.
Lewinsohn, T.M. and Prado, P.I., (2005). How many species are there in Brazil? Conservation
Biology, 19, 619-624.
Margulis, S. (2004). Causes of Deforestation of the Brazilian Amazon, World Bank Working
Paper n. 22.
Melo, N.G.R. & Artaxo, P. (2017). Evolução do Plano de Ação para Prevenção e Controle do
Desmatamento na Amazônia Legal. Revista do Instituto de Estudos Brasileiros, 66, 108-129.
Olson, D.M. et al. (2001). Terrestrial ecoregions of the world: a new map of live on earth.
Bioscience, 51, 933-938.
Pfaff, A. (1999). What drives deforestation in the Brazilian Amazon? Evidence from satellite and
socioeconomic data, Journal of Environmental Economics and Management, 37, 26-43.
PPCDAM (2004). Plano de Ação para Prevenção e Controle do Desmatamento da Amazônia
Legal. Fase I. Brasília, DF: Casa Civil.
PPCDAM (2009). Plano de Ação para Prevenção e Controle do Desmatamento da Amazônia
Legal. Fase I. Brasília, DF: Casa Civil.
PPCDAM (2012). Plano de Ação para Prevenção e Controle do Desmatamento da Amazônia
Legal. Fase I. Brasília, DF: Casa Civil.
PRODES. Programa de Monitoramento da Floresta Amazônica Brasileira por Satélite. Ministério
do Meio Ambiente – MMA, Instituto Nacional de Pesquisas Espaciais – Inpe do Ministério da
Ciência e Tecnologia. Disponível em: <http: //
http://www.obt.inpe.br/OBT/assuntos/programas/amazonia/prodes>. Accessed on March 19,
2018.
Walker, R., Moran E., Anselin, L. (2000). Deforestation and Cattle Ranching in the Brazilian
Amazon: External Capital and Household Processes, World Development, Vol. 28, n. 4, 683-699.
25
ANNEX I
Nr. Strategic Guidelines of PPCDAM Phase I (2004-2008)
1
conservation of biodiversity, forest management of timber and non-timber products and the provision of environmental services as one of the foundations of a new regional development model, aiming at the quality of life of local populations with the reduction of social inequalities, economic competitiveness and environmental sustainability;
2 incentives for the best use of areas already deforested on a sustainable basis, technology innovations such as pasture management, agroforestry, ecological agriculture and the recovery of degraded areas, as a way to increase productivity and reduce pressures on remaining forests;
3
the adoption of urgent land and territorial planning measures, aiming at the reduction of free access to natural resources for predatory uses; strengthening the instruments of democratic and sustainable management of the territory, prioritizing the fight against public lands grabbing, land regularization, alternative models of agrarian reform that would fit the Amazon reality, and the creation and consolidation of conservation units and indigenous lands;
4 improvement of the instruments for monitoring, licensing and inspection of the deforestation with innovative methodologies, including their integration with incentives to avoid the environmental damage and the adoption of sustainable practices between users of natural resources;
5
strengthening of a culture of strategic planning of infrastructure works, involving adequate analysis of alternatives (in terms of cost-benefit, socio-economic and environmental impacts), preventive, mitigating and compensatory measures, and the ex-ante execution of territorial planning actions on sustainable grounds, with transparency and participation of society
6 fostering cooperation between agencies of the Federal Government responsible for the policies related to the dynamics of deforestation in the Legal Amazon, overcoming historical trends of dispersion and isolation of the field of environmental studies;
7 adoption of a decentralized and joint management of public policies, through partnerships between the Union, states and municipalities, contemplating the respective institutional strengthening needs;
8 stimulate the active participation of the different sectors of society in the management of policies related to the prevention and control of deforestation, and the viability of sustainable alternatives, as a means to increase the quality of its implementation, with transparency, social control and free of political interests;
9 value the learning processes behind successful pilot experiments, with their incorporation into public policies; and
10 implementation of a monitoring system for the dynamics of deforestation and related public policies in the Amazon, allowing a permanent analysis of the efficiency and effectiveness of these instruments, ensuring their improvement, with transparency and social control.
26
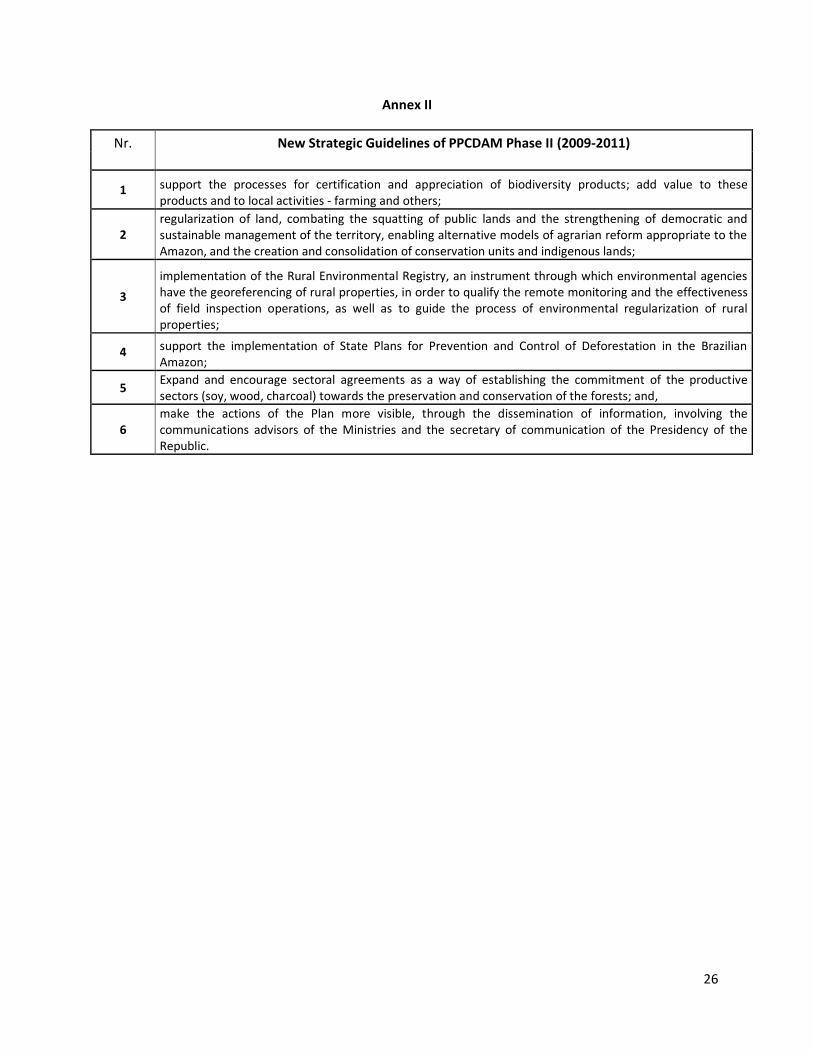
Annex II
Nr. New Strategic Guidelines of PPCDAM Phase II (2009-2011)
1 support the processes for certification and appreciation of biodiversity products; add value to these products and to local activities - farming and others;
2 regularization of land, combating the squatting of public lands and the strengthening of democratic and sustainable management of the territory, enabling alternative models of agrarian reform appropriate to the Amazon, and the creation and consolidation of conservation units and indigenous lands;
3
implementation of the Rural Environmental Registry, an instrument through which environmental agencies have the georeferencing of rural properties, in order to qualify the remote monitoring and the effectiveness of field inspection operations, as well as to guide the process of environmental regularization of rural properties;
4 support the implementation of State Plans for Prevention and Control of Deforestation in the Brazilian Amazon;
5 Expand and encourage sectoral agreements as a way of establishing the commitment of the productive sectors (soy, wood, charcoal) towards the preservation and conservation of the forests; and,
6 make the actions of the Plan more visible, through the dissemination of information, involving the communications advisors of the Ministries and the secretary of communication of the Presidency of the Republic.