the use of nondestructive testing methods for the
TRANSCRIPT

The Use of Nondestructive Testing Methods for theCondition Assessment of Concrete Bridge Girders
by
Richard Cornelius Unruh, III
B.A. MathematicsColby College, 1997
B.S. Civil EngineeringNortheastern University, 2003
SUBMITTED TO THE DEPARTMENT OF CIVIL AND ENVIRONMENTALENGINEERING IN PARTIAL FULFILLMENT OF THE REQUIREMENTS FOR
THE DEGREE OF
MASTER OF ENGINEERING IN CIVIL AND ENVIRONMENTALENGINEERING
AT THE
MASSACHUSETTS INSTITUTE OF TECHNOLOGY
JUNE 2004
0 2004 Richard C. Unruh, 1II. All rights reserved.
The author hereby grants to MIT permission toreproduce and to distribute publicly paper and
electronic copies of this thesis in whole or in part.
Signature of Author:Dep fC in ironmental Engineering
May 7, 2004
Certified by:
Accepted by:
Jerome J. ConnorProfeor of Civil and Environmental Engineering
fl Thesis Supervisor
Heidi M. NepfAssociate Professor of Civil and Environmental Engineering
Chairman, Committee for Graduate Students
MASSACHUSETTS INS1TflTEOF TECHNOLOGY
JUN 0 7 2004
LIBRARIES
BARKER

The Use of Nondestructive Testing Methods for theCondition Assessment of Concrete Bridge Girders
by
Richard Cornelius Unruh, III
Submitted to the Department of Civil and Environmental Engineering onMay 7, 2004 in Partial Fulfillment of the Requirements for the Degree of
Master of Engineering in Civil and Environmental Engineering
ABSTRACTThere are over 594,000 publicly controlled bridges in the United States. Concreteand pre-stressed concrete bridges account for nearly 50% of the bridges in the USinventory. This proportion is increasing each year, as new bridges tend to beconstructed of concrete. This trend makes it vital for engineers to be able toaccurately assess the condition of concrete for maintenance and repair decisions.
The use of nondestructive testing methods can help reduce the backlog of deficientbridges in two ways. First, these techniques will allow inspectors to get a moreaccurate view of the condition of a bridge. The second way by which NDT can helpis by allowing inspectors to locate damage earlier.
This thesis is an attempt to capture the most current ideas for a very specificapplication of NDT: determining the condition of reinforced concrete bridges overalland bridge girders, in particular. To this end, attention is given to why NDT isneeded and what aspects of concrete condition can be addressed with NDT. SomeNDT methodologies that are, or may soon be, promising for concrete applicationsare discussed. Case studies are presented to demonstrate how NDT can be applied toconcrete bridge girders and proposals are made for future areas of study anddevelopment.
Thesis Supervisor: Jerome J. ConnorTitle: Professor of Civil and Environmental Engineering


Acknowledgements & Dedication
There are many people who have provided support and assistance during the writingof this thesis.
Professor Jerome Connor has been a source of advice on all matters, great and small.His insights have been invaluable and are greatly appreciated.
I need to thank my parents, Richard & Dawne Unruh, for their unwavering love andsupport in all of my endeavors. They have never questioned my path, only helped meto the next milestone.
I want to thank my parents-in-law, Jeff & Mary Smith. They have welcomed me intotheir family and hearts and provided love and support in all I do. I am fortunate tohave two families of which I am proud to be part.
Finally, and most importantly, I dedicate this thesis to my wife, Jenny. Without herlove and encouragement, I would not be where I am today. She has given me thestrength and courage to achieve goals that I never knew I had. This work is alsodedicated to my daughter, Rebecca. She has been an everlasting source of inspirationduring my many stressful moments over the past year and a half.
5

6
Table of ContentsA B STR A C T ..................................................................................................................... 3A cknow ledgem ents & D edication.................................................................................. 5List of Figures......................................................................................................................8List of Tables ....................................................................................................................... 91. Introduction................................................................................................................11
1.1. Scope and Purpose of Thesis ...................................................................... 121.2. State of Bridges in U S ............................................................................... 121.3. How N D T Can H elp .................................................................................. 16
2. Background on N D T.............................................................................................. 192.1. Issues & Barriers to U se of N D T................................................................ 19
3. Concerns for Reinforced Concrete Bridge G irders ............................................... 233.1. Rebar Corrosion......................................................................................... 243.2. Cracking..................................................................................................... 273.3. Chem ical Attack ........................................................................................ 273.4. H oneycom bing........................................................................................... 293.5. Creep, Shrinkage & V olum e Changes....................................................... 293.6. Strength of Concrete .................................................................................. 313.7. Condition of Post Tensioning Tendons .................................................... 313.8. Freeze-Thaw Dam age................................................................................ 31
4. Selected NDT Methods with Applications to Concrete Bridge Girders................334.1. Pulse V elocity........................................................................................... 344.2. Im pulse Response ...................................................................................... 354.3. Spectral Analysis of Surface W aves (SA SW )........................................... 364.4. M odal Testing........................................................................................... 374.5. A coustic Em issions M ethods.................................................................... 374.6. Im pact Echo ............................................................................................... 384.7. Fiber Optics ............................................................................................... 384.8. G alvanostatic Pulse Technique.................................................................. 39
5. Case Studies...............................................................................................................415.1. 1-40 Overpass: a W ork-in-Progress ........................................................... 415.2. NDT Corporation: Assessment of Concrete Arch Bridges........................495.3. Evaluation of Concrete Quality in a Bridge Deck and Detection of Voidsin Tendon D ucts in a Pre-stressed Slab ................................................................. 49
6. Future of N DT in Bridge M aintenance.................................................................. 556.1. H ealth M onitoring System s ...................................................................... 556.2. D ata Fusion................................................................................................ 586.3. Research N eeds......................................................................................... 606.4. Funding Needs ........................................................................................... 62
7. Conclusions................................................................................................................657.1. Benefits of NDT Use with Concrete Bridge Girders.................................657.2. K ey Barriers Still to Be A ddressed........................................................... 657.3. Research Recom m endations...................................................................... 66
References .......................................................................................................................... 68
7

List of FiguresFigure 1-1 :Bridge Proportions by Material Type [Chase & Washer, 1997].............. 11Figure 1-2: Bridge Age Distribution by Type [Chase & Washer, 1997]............... 14Figure 1-3: Material Proportions for Bridges, Total and Deficient [Chase & Washer,
19 9 7 ] .................................................................................................................. 15Figure 1-4: Deficiency Distribution by Age [Chase & Washer, 1997] .................. 15Figure 1-5: Location of Structural Deficiencies in Bridges [Chase & Washer, 1997]
.............................................16Figure 2-1: Concrete NDT Usage [Rolander, et al, 2001]..................................... 21Figure 2-2: Changes in NDT Usage over Time [Rolander, et al, 2001]................ 22Figure 5-1: Sketch of Overpass [adapted from Stubbs, et al, 1999 (2)] ................ 41Figure 5-2: Schematic of Approach Used to Identify Stiffness Properties of Baseline
and Existing Structures [Stubbs, et al (2), 1999].......................................... 43Figure 5-3: Damage Detection Model [Stubbs, et al, 1999 (2)] ............................ 43Figure 5-4: Surface Crack Pattern on the Deck [Stubbs, et al, 1999 (2)] .............. 46Figure 5-5: Comparison of Surface Crack Locations and Damage Localization
Results from the Field Measurements in December 1997 [Stubbs, et al, 1999(2 )]......................................................................................................................4 7
Figure 5-6; Comparison of Surface Crack Locations and Damage LocalizationResults from the Field Measurements in September 1998 [Stubbs, et al, 1999(2 )]......................................................................................................................4 7
Figure 5-7: Mobility x Mobility Slope Plot from the Impulse Response Test [YongH ao, et al, 2003]............................................................................................. 50
Figure 5-8: Core Sample Showing a Large Void [Yong Hao, et al, 2003] ........... 51Figure 5-9: Impact Echo Test Output for Same Location. Amplitude Spikes Indicate
Anomalous Areas [Yong Hao, et al, 2003].................................................... 51Figure 5-10: Fibrescope View of Void in Tendon Duct [Yong Hao, et al, 2003].....52Figure 5-11: Impact Echo Output Showing Void in Tendon Duct [Yong Hao, et al,
2 0 0 3] .................................................................................................................. 5 3Figure 6-1: Bridge Management System Flow Chart [Chase & Washer, 1997].......56Figure 6-2: Risk-Informed Expenditure Allocation Flowchart [Ayyub, et al, 2003] 57Figure 6-3: Factors to Consider in the Development of a Data Fusion System [Gros,
19 9 7 ] .................................................................................................................. 5 8Figure 6-4: Schematic for Development of a NDT Fusion Engine [Gros, 1997]...... 59Figure 6-5: Design of an Expert System to Assist in NDT Investigations [Gros,
19 9 7 ] .................................................................................................................. 6 0Figure 6-6: Research Needs for NDT [Rolander, et al, 2001]............................... 61Figure 6-7: Percentage of Inspections Teams with a PE [Rolander, et al, 2001]......63
8

List of TablesTable 3-1: Concrete Deterioration Diagnostics [Heckroodt, 2002].............................24Table 3-2: The Manifestation of Reinforcement Corrosion [Heckroodt, 2002]............25Table 3-3: Condition Surveys to Evaluate Reinforcement Corrosion [Heckroodt,
2 0 0 2 ] .......................................................................................................................... 2 6Table 5-1: Member Properties [Stubbs, et al, 1999 (2)]...............................................42Table 5-2: Identified Material Properties of the Baseline Structure (December 1997)
[Stubbs, et al, 1999 (2)] ........................................................................................ 43Table 5-3: Predicted Damage Magnitudes (December 1997) [Stubbs, et al, 1999 (2)] ...44Table 5-4: Bending Stiffnesses of the Structure (December 1997) [Stubbs, et al,
19 9 9 (2 )] .................................................................................................................... 4 4Table 5-5: Identified Material Properties of the Baseline Structure (September 1998)
[Stubbs, et al, 1999 (2)] ........................................................................................ 45Table 5-6: Predicted Damage Magnitudes (September 1998) [Stubbs, et al, 1999 (2)] ... 45Table 5-7: Bending Stiffnesses of the Structure (September 1998) [Stubbs, et al,
19 9 9 (2 )] .................................................................................................................... 4 6Table 6-1: Proposed Allocation for Additional Funding [Rolander, et al, 2001]..........62Table 6-2: Bridge Inspection Policy & Procedural Change Suggestions [Rolander, et
al, 2 0 0 1] ..................................................................................................................... 64
9

10
1. Introduction
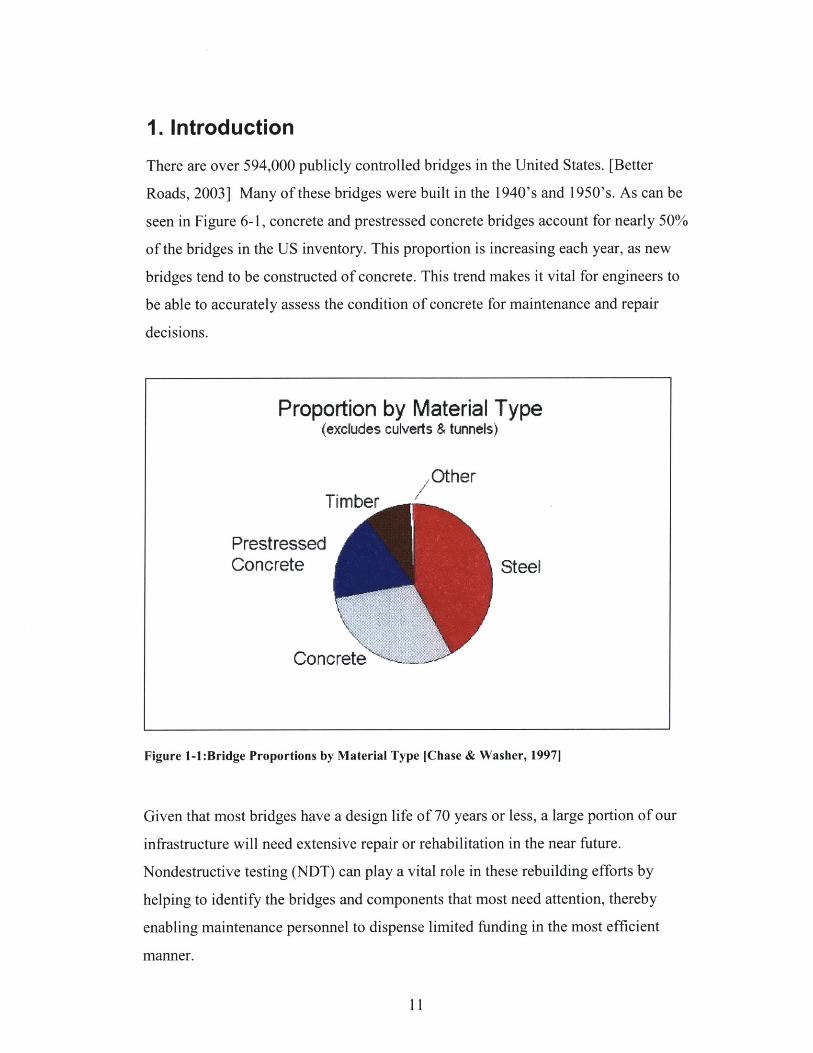
There are over 594,000 publicly controlled bridges in the United States. [Better
Roads, 2003] Many of these bridges were built in the 1940's and 1950's. As can be
seen in Figure 6-1, concrete and prestressed concrete bridges account for nearly 50%
of the bridges in the US inventory. This proportion is increasing each year, as new
bridges tend to be constructed of concrete. This trend makes it vital for engineers to
be able to accurately assess the condition of concrete for maintenance and repair
decisions.
Figure 1-1:Bridge Proportions by Material Type [Chase & Washer, 19971
Given that most bridges have a design life of 70 years or less, a large portion of our
infrastructure will need extensive repair or rehabilitation in the near future.
Nondestructive testing (NDT) can play a vital role in these rebuilding efforts by
helping to identify the bridges and components that most need attention, thereby
enabling maintenance personnel to dispense limited funding in the most efficient
manner.
11
Proportion by Material Type(excludes culverts & tunnels)
OtherTimber
PrestressedConcrete Steel
Concrete

1.1. Scope and Purpose of Thesis
NDT is a dynamic field with frequent developments of new technologies and new
uses for existing technologies. As such, any attempt to fully explore the current
literature would be outdated almost as soon as it was completed. This thesis is an
attempt to capture the most current ideas for a very specific application of NDT:
determining the condition of reinforced concrete bridges overall and bridge girders,
in particular. To this end, attention is given to why NDT is needed and what aspects
of concrete condition can be addressed with NDT. Some NDT methodologies that
are, or may soon be, promising for concrete applications are discussed. Case studies
are presented to demonstrate how NDT can be applied to concrete bridge girders and
proposals are made for future areas of study and development.
1.2. State of Bridges in US
According to the 2001 ASCE "Report Card for America's Infrastructure", the US
bridge inventory rated a grade of 'C', or fair. The reasons for this low rank were a
combination of structural deficiencies and functional obsolescence. The Report Card
states that, as of 1998, 29% of the bridges in the US were structurally deficient or
functionally obsolete. To bring all of these bridges up to date would have cost an
estimated $10.6 billion per year for 20 years. [ASCE, 2001] The only positive note
provided in the report was that the 29% marked an improvement from 31% in 1996.
Popovics noted at this time that simply maintaining the current condition of the
bridge inventory and eliminating the backlog would require $80 billion. [Popovics,
2001] In 2003, ASCE released a 'Progress Report', with updated figures. In this
report, bridges still earned a 'C' rating, with a note that "The nation is failing to even
maintain the substandard conditions we currently have..." There was incremental
improvement (again) in the volume of sub-par bridges, with 27.5% rated as deficient
or obsolete. This level would require expenditures of $9.4 billion each year for 20
years. [ASCE, 2003] Better Roads Magazine [Better Roads, 2003] painted a picture
that was only slightly better with their inventory of the bridges in the U.S. Overall,
12

Better Roads found 25.8% of the bridges to be functionally obsolete or structurally
deficient. When broken down, this results in 22.3% of all state and federal bridges
and 29.10% of local bridges (county, town, city, etc.). Better Roads provided statistics
for each state, as well. The states with the worst record were West Virginia (70% of
local bridges), Delaware (67% of local bridges), Washington, DC (58% of bridges)
and Rhode Island (50% of local, 55% of federal/state). Considering that most of the
problems are with locally managed bridges, finding inexpensive and reliable
solutions to bridge maintenance are vital. Especially in predominantly rural states,
such as West Virginia, the tax base is very low, providing little funding to repair or
replace aging bridges. Thus the development of NDT methods to help better target
available funds will be beneficial to struggling transportation departments.
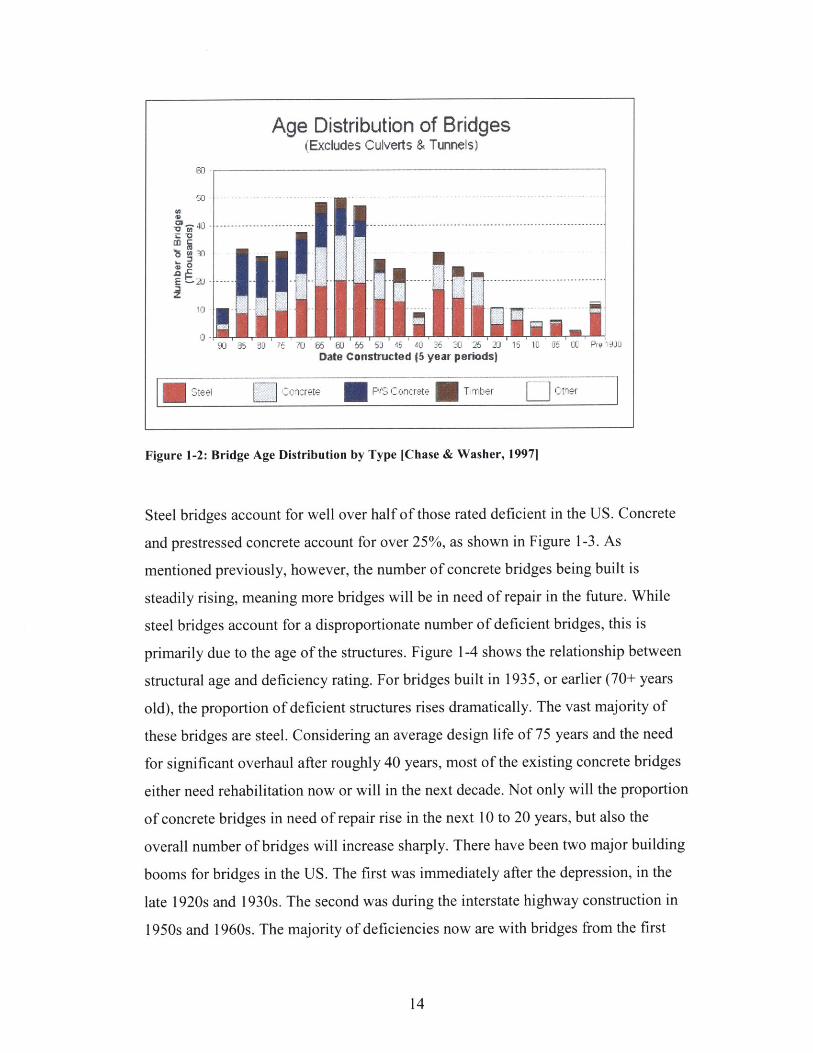
Figure 1-2 shows the age distribution for bridges, broken down by material. It is
clear from this figure that concrete is gaining steadily on steel as the material of
choice for bridges. Steel bridges vastly outnumber concrete now, but relatively few
new steel bridges have been constructed since 1975 due to high maintenance costs.
The number of new concrete and prestressed concrete bridges has matched or
exceeded the number of new steel bridges built since roughly 1965. This trend is
expected to continue due to material and maintenance costs.
13
Age Distribution of Bridges(Excludes Culverts & Tunnels)
0
9: 3 o 80 70 66 W 5 5 10 -O 26 15 10 -C P 30Date Constructed 15 year periods)
C L , cc- te PF Cna-at- T rber L tir<
Figure 1-2: Bridge Age Distribution by Type [Chase & Washer, 19971
Steel bridges account for well over half of those rated deficient in the US. Concrete
and prestressed concrete account for over 25%, as shown in Figure 1-3. As
mentioned previously, however, the number of concrete bridges being built is
steadily rising, meaning more bridges will be in need of repair in the future. While
steel bridges account for a disproportionate number of deficient bridges, this is
primarily due to the age of the structures. Figure 1-4 shows the relationship between
structural age and deficiency rating. For bridges built in 1935, or earlier (70+ years
old), the proportion of deficient structures rises dramatically. The vast majority of
these bridges are steel. Considering an average design life of 75 years and the need
for significant overhaul after roughly 40 years, most of the existing concrete bridges
either need rehabilitation now or will in the next decade. Not only will the proportion
of concrete bridges in need of repair rise in the next 10 to 20 years, but also the
overall number of bridges will increase sharply. There have been two major building
booms for bridges in the US. The first was immediately after the depression, in the
late 1920s and 1930s. The second was during the interstate highway construction in
1950s and 1960s. The majority of deficiencies now are with bridges from the first
14

boom period. The bridges from the second boom will start to deteriorate in the next
few decades.
Proportion by Material Type(excludes culverts and tunnels)
Other (3493)-Timber (43446)
P/S Conc. (84400) -
Steel (196741)
Other (1171)Timber (20886)
PIS Conc. (3170) -
-Concrete (141658)
T All bridges
Concrete (19421)
Structurally deficientbridges
Steel (639301)
Figure 1-3: Material Proportions for Bridges, Total and Deficient [Chase & Washer, 19971
Age Distribution of Structures
70 t
Date Constructed (5 year perlodsj
Figure 1-4: Deficiency Distribution by Age [Chase & Washer, 19971
15

For concrete bridges, the most common reasons for a 'deficient' rating are flaws with
the substructure followed closely by superstructure (see Figure 1-5, below). These
are the most difficult locations to reach for an in depth inspection. Emerging
technologies in NDT and embedded sensing will help inspectors in these areas.
Portable sensors and in situ monitoring systems will make it much easier for
engineers to assess the condition of key components as well as the overall structure
itself.
Structurally Deficient BridgesComparison of ratings for key items
40
--------------------------------I- ---
I.--------II-----
.)Ijb5t
I- ---------------St Fe4 Concreate M Timber SCn
Figure 1-5: Location of Structural Deficiencies in Bridges [Chase & Washer, 19971
1.3. How NDT Can Help
The use of nondestructive testing methods can help reduce the backlog of deficient
bridges in two ways. First, these techniques will allow inspectors to get a more
accurate view of the condition of a bridge. A large number of bridges listed as
16
:Z.~
?M
C-
S20 -
10 41
0 -Deck Sup9r
... ................. -----------------
--- ----------------- --------------
S/A 'OVMA
-----------------------------------
deficient are so classified based on a low load rating. The capacity of a bridge is
currently determined based on theoretical calculations that may not be accurate. The
use of NDT methods such as deflection measurements using laser technology will
increase the accuracy of these calculations. [Washer, 1999] NDT also can improve
bridge evaluations by reducing the subjectivity of condition assessment. Bridge
inspectors tend to base the classification of a bridge on their own experience, leading
to high variance in assessments. A bridge may be the worst case one inspector has
seen, resulting in a low rating, while another inspector may rate the bridge as 'fair'.
In one such situation, a bridge had received a rating of 'poor' by inspectors. Two
separate NDT tests were run on the bridge: an impact test and a truck load test. Both
tests yielded deflections that were well within AASHTO limits. The bridge was
displaying unexpected (and un-designed) composite action between the girders and
the deck, giving it a much higher capacity than the inspectors had predicted. [Lennet,
et al., 1999]
The second way in which NDT can help is by allowing inspectors to locate damage
earlier. Many forms of deterioration, such as reinforcement corrosion, are not visible
in their early stages. With corrosion in particular, by the time the problem is visible,
extensive structural damage has generally occurred. Technology is available that can
detect and evaluate many anomalies that are not visible on the surface of a structure.
Ultrasonics, radar and other wave propagation methods all provide inspectors with
information regarding the internal flaws in a concrete structure. The reliability of this
information is dependent on the nature of the flaw (size, depth and orientation), as
well as the testing method itself. Reliability of the various methods will be discussed
in Chapters 2 and 4. Other methods can also help will early detection of anomalies.
Fiber optics and health monitoring systems with embedded or permanently affixed
sensors can also provide information on existing flaws. Locating these problems
early will reduce the cost of repairs and increase the reliability and safety of the
structure.
17

18

2. Background on NDT
In the past, development of NDT methods was driven primarily by military research.
From the 1950s through the 1990s, this research was heavily influenced by Cold War
concerns, with the benefits being enjoyed across many fields. Since the 1990s, with
the end of the Cold War, the research driving NDT development has shifted to
private industry, particularly the manufacturing industries. While the automobile and
aerospace industries have been using NDT methods for several decades, use of NDT
on civil infrastructure projects is a relatively new application. NDT for concrete, in
particular, is still a very young field. Significant use of NDT methods for concrete
has been occurring only for the last decade or so. The reasons for this lag compared
to other industries include both scientific concerns and practical considerations.
2.1. Issues & Barriers to Use of NDT
There are three main barriers to the development of a rational, global NDE method
for concrete bridges. [Atkan, et al., 1996] These barriers are:
- Lack of quantitative knowledge of as built state parameters (i.e. initial
stresses & strains) and the variation of these parameters over time
- Lack of clear, quantitative definitions for performance parameters
" Lack of a clear and complete understanding of the phenomena which
influence the state-of-force in a bridge, which lead to a change of state and/or
which lead to a decline in performance
Before NDT methods can be perfected, scientists and engineers must first gain a full
understanding of concrete bridge behavior. This includes not only an understanding
of the material characteristics of concrete itself, but also an understanding of how
stresses are distributed through a bridge structure. This understanding will allow the
development of a set of parameters to govern the ideal behavior of a bridge and all of
19

its components. These parameters can then be used to evaluate the performance of
the structure at different stages in its service life.
In addition to the barriers to developing NDT methods, there are obstacles to using
the systems in the field. These obstacles can be organized into three areas:
accessibility, environment and operator skills. [Prine, 1995]
Accessibility is of particular concern with bridges. Bridge inspections are hampered
on several fronts in terms of access. Height, interior access for girders, and the
location over water all contribute to accessibility concerns and often result in
lowered productivity and reduced reliability. Lifts are often employed to evaluate the
superstructure of a bridge. Space limitations in lifts and inside the girders prohibit
the use of large equipment. Especially on heavily traveled roadways, lane closures
can often be done only during very limited timeframes, forcing inspectors to work at
night or around high-speed traffic.
By their nature, bridges are located in harsh environments. They are generally very
exposed, leaving inspectors with little protection from high winds and inclement
weather. Temperature extremes and precipitation combine with wind to make
inspections very challenging and, often, impossible. Vibrations and noise from traffic
further inhibit effective inspections. When lane closures are required, nighttime
inspections can add the additional hardship of darkness. Rust and dirt often coat
connections and members, requiring extensive cleaning and scraping for any
technique that requires a direct connection to the structure.
Operator skills are also a limiting factor for field inspections. Especially for firms
and agencies with limited budgets, training and certification are difficult to obtain for
inspectors. Without training, most inspectors can perform a visual inspection and
only very basic NDT techniques, such as sounding. Figure 2-1, on the following
page, shows the results of a survey conducted by the Federal Highway
Administration on the use of NDT. This figure shows the number of respondents
20
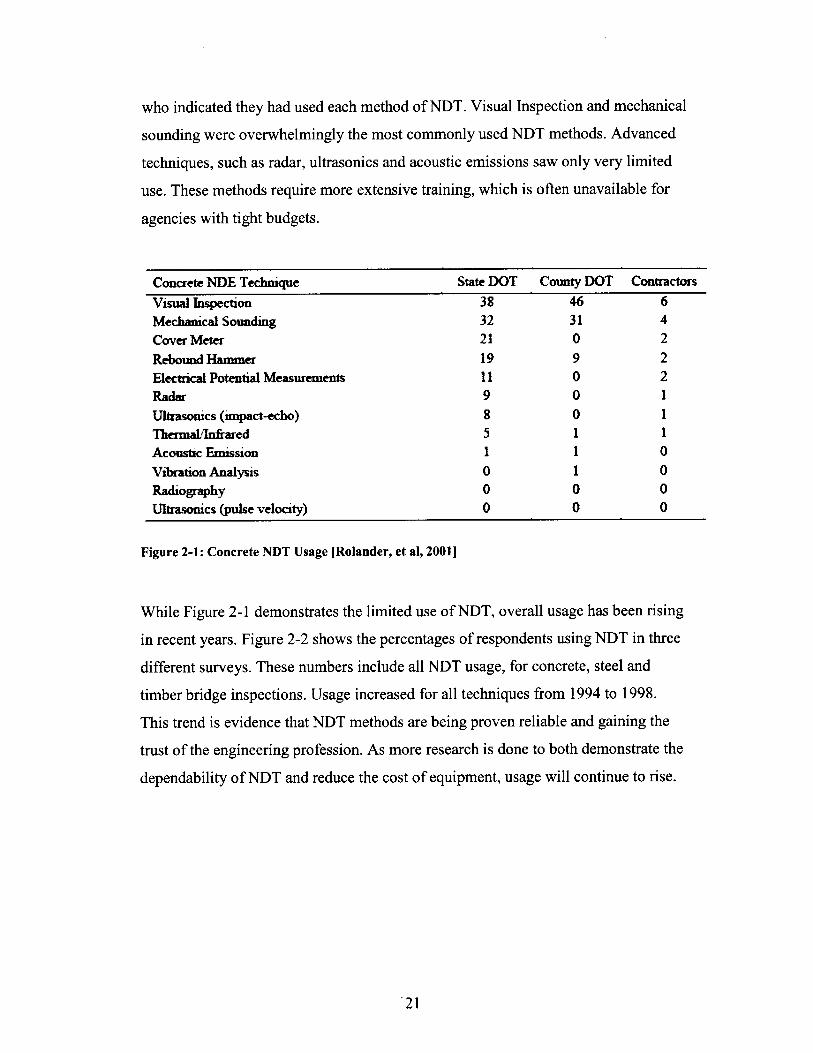
who indicated they had used each method of NDT. Visual Inspection and mechanical
sounding were overwhelmingly the most commonly used NDT methods. Advanced
techniques, such as radar, ultrasonics and acoustic emissions saw only very limited
use. These methods require more extensive training, which is often unavailable for
agencies with tight budgets.
Concrete NDE Technique
Visual InspectionMechanical SoundingCover Meter
Rebound HammerElectrical Potential MeasurementsRadarUltrasonics (impact-echo)Thermal/InfraredAcoustic Emission
Vibration AnalysisRadiographyUltrasonics (pulse velocity)
State DOT County DOT Contractors
38 46 632 31 421 0 219 9 211 0 29 0 18 0 15 1 11 1 00 1 00 0 00 0 0
Figure 2-1: Concrete NDT Usage [Rolander, et al, 2001]
While Figure 2-1 demonstrates the limited use of NDT, overall usage has been rising
in recent years. Figure 2-2 shows the percentages of respondents using NDT in three
different surveys. These numbers include all NDT usage, for concrete, steel and
timber bridge inspections. Usage increased for all techniques from 1994 to 1998.
This trend is evidence that NDT methods are being proven reliable and gaining the
trust of the engineering profession. As more research is done to both demonstrate the
dependability of NDT and reduce the cost of equipment, usage will continue to rise.
'21

NDE Technique
Ultrasonic Testing
Liquid Penetrant Testing
Magnetic Particle Testing
Radiographic Testing
Eddy Current Testing
NDEVC, 1998
81%81%
64%17%13%
Caltrans, 19942]
70%68%
46%14%3%
Rens, et al., 1993141
69%25%40%
12%12%
Figure 2-2: Changes in NDT Usage over Time [Rolander, et al, 20011
22

3. Concerns for Reinforced Concrete Bridge Girders
Concrete can deteriorate in many ways, due to a multitude of causes. Environment,
vehicle collision, poor placement techniques, errors in mix design, chemical
reactions, and poor materials can all affect concrete in deleterious ways.
Deterioration of concrete is generally due to some combination of causes, further
complicating an already difficult inspection process. As shown in Table 3-1, a visual
inspection of a structure can give many clues as to the nature of the damage. These
clues can help guide the engineer in the selection of appropriate NDT methods to
clarify and quantify the extent of the damage.
Some of the indicated deterioration mechanisms are of particular concern with
reinforced concrete bridge girders. The girders of a bridge are a vital component of
the substructure. Compared to the deck, and even the superstructure, girders are very
difficult to access for inspections and repairs. Box girders, in particular, present
difficulties due to the problems with inspecting the inside. NDT methods have the
potential to make inspections easier and more accurate. With current technology,
NDT methods can be used to assess corrosion of rebar, cracking, chemical attacks,
voiding and honeycombing, condition of tendon ducts and many other problems.
The following are problems that may arise in any concrete structure, bridge girders
included. These issues are selected for discussion for several reasons. The first
reason is that these are some of the more common problems that may occur with
concrete. The inspection of any structure is likely to produce evidence of several of
these issues, at least on a small scale. These problems also either are difficult to
detect by visual inspection alone, or the full extent of the problem cannot be
determined in this manner. Finally, there are NDT techniques that are available to
detect these issues, or have shown the likelihood of being able to do so.
23

Table 3-1: Concrete Deterioration Diagnostics [Heckroodt, 20021
Visual appearance of Type of detedortion Confirmatory testingdetedoation and causes
Large areas of rwtsiir rakigalog
pe iem ot renreffent,spalling of coverconcrete, delaminationof cover concrete
Expanave mapcracking, remmrined-mdn kilowingreinibr62eank whitesilica gel at cocks
Deep parallel crackig,pattern aelectsreinforcement positions
Deterkratn of surface,sah deposits on surface,
cadiu sed bybnteapadvereactions
Surface leaching ofconcrete, exposed.arete, no salt-tps
Surface disokxoat,cocrete 11--inbuc"dn, loisstrength, micoacking
Major cracling andlocalied crushing,excssive deformationsand defiections ofstructural members
R",fovWmet comion:expoure to adimatic conditions, withcydic wetting anddrying
Alkdj-aMgggae ,wtion:concrete made withreactive aggeegates
Dryng dr.Ai#ag*W:initial too rapid drjkattesm wettingdryingycles
Chemikal aUt eposure
to ag va ters(e.& cfWMm!Nc andihdust"a effuenk)
SVgXater hfde MOeZxo1ft to movtiLfresh waters k41h yacidic) in conduits
Ae dmge: exposure toopen fires sufkien tocause damage
StrMrIuMsi isWagrstructure subjected toovedoad
Cover depth of rebarCarlbxation andchloride testingExploratory coringElectnchei testing
Core analysis for gel andrimning of aggegabesPetrographic analyisAggregate testing
Conceete core analysiLoading and stuctural
A r te and binder
Chemical analysis ofconcreteCore eumintian fordepth of attack andinternal distress
Chemical analysis ofwaterCore exaznatinn forleaching
Aq$e and binder
Core eaamieation forcoourvardaions, stedconditionPetrographic analysis
Specialist teichniques
Loading and structuralanyisCore testing forcompresive strenhand elastic mocbalus
3.1. Rebar Corrosion
Corrosion of rebar is the single most common cause of maintenance, rehabilitation or
replacement of reinforced concrete structural elements. [Jackson, 1999] [Klinghoffer,
et al., 2000] [Heckroodt, 2002] It has been estimated that the cost of repairing
damage due to rebar corrosion from de-icing salts alone in the United States is
24

between 325 and 1000 million Euros ($386 - 1200 million). In the UK, the cost is
estimated at 1 billion Euros. Corrosion repairs need to be performed on 10% of the
bridges in the UK. [Klinghoffer, et al., 2000] With such high costs to repair
corrosion damage, it is vital that engineers have the ability to evaluate the extent of
the damage.
Particularly in cold climates or in coastal areas, chloride attack can cause rebar to
corrode relatively rapidly. Unlike the bridge deck, however, the damage may not be
evident with girders, until the problem has reached the critical stage. Deicing salts
wash down from the deck and collect in any cracks or joints in the girders,
accelerating the ingress of chlorides. In coastal zones, salt from ocean spray
penetrates in the same manner.
Table 3-2: The Manifestation of Reinforcement Corrosion [Heckroodt, 2002]
Factor Influence
Geometry of the element
Cover depth
Moisture condition
Age of structure
Rebar spacing
Crack distribution
Service stresses
Quality of concrete
Large-diameter bars at low covers allow easyspalling
Deep cover may prevent full oxidation of corrosionproduct
Conductive electrolytes encourage well-definedmacro-cells
Rust stains progress to cracking and spalling
Closely spaced bars encourage delamination
Cracks may provide low resistance paths to thereinforcement
Corrosion may be accelerated in highly stressedzones
Severity of damage depends on the concretequality
Depending on the age and condition of the girders, rebar corrosion can be manifested
in several ways, as shown in Table 3-2. Because of the many causes of rebar
corrosion and the variety of indicators, it is important that a full survey be completed
to ascertain the exact nature, as well as the extent, of the damage present in a
25
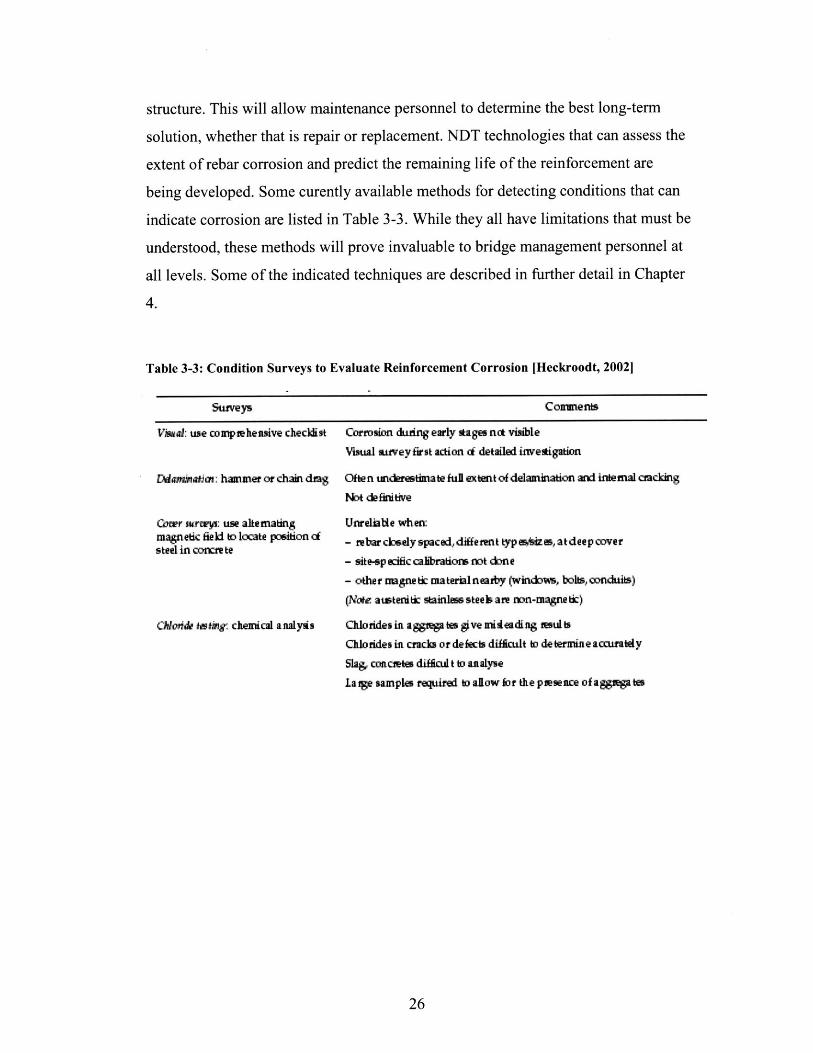
structure. This will allow maintenance personnel to determine the best long-term
solution, whether that is repair or replacement. NDT technologies that can assess the
extent of rebar corrosion and predict the remaining life of the reinforcement are
being developed. Some curently available methods for detecting conditions that can
indicate corrosion are listed in Table 3-3. While they all have limitations that must be
understood, these methods will prove invaluable to bridge management personnel at
all levels. Some of the indicated techniques are described in further detail in Chapter
4.
Table 3-3: Condition Surveys to Evaluate Reinforcement Corrosion [Heckroodt, 2002]
Suveys
Vhisl: use camprehensive checklist
Dwsitatki: hanmer or chain dagS
Cowr wrtV: use ahematingm netic field to kcxate position ofsteel in coKyrute
C*Ionda tting. clwinlcal anlyss
Conmenbs
Cwrrosion dudng early stages nct visible
Visual auveyfirst action ef detailed invetigatIon
Often underesthnate ful extent of delamdnation and internal cracking
MNot defkitive
Unrelkbe when:
- raet c sely spaced, different typ esmires, atdeep cover- ite-sp edfic cabratios Mt cbne- other nugne tic materialneaby (windoiw, bols, conduits)
(Note atstenitic sinlms steeb are rn-migne tic)
Chkorides in aggmrgates gve mideading zetdhs
Chlotides in cracks or defects difMcut to deternine accwatdy
Slag, concattes difkl t to analyse
1a ge sample required to alh w tor the pesence of a ggmpgtea
26

Carbomnia dAV& chemical method(pH indicator)
Rewr powrais potentineter(vo tmeter) using coppevcopperadphatereference electrode
RMtsiuhy Wenner prcbes andsis tV me*er
corm rate liwnear pola 6a3 o nresistance (ipva nos laic linearpola sa oniesta nce with guaid-ndgsensor)
Slightlyunderemimates carbonation depth
Difficult to discern colour change caused by pH indicator in dark-coloured concrete
Indicator ineffective at very high pH levls (e.g. after electrochemical re-alkalisation)
Testing must be done cnly on very resdily expoted cocrete surfaces (before atmosphericcarbonation occurs)
Not recommendd tor carbonation-induced corrosion
Interpretation is a specialist tak
Delamination could dirupt potential field, and thus produce fale readings
Environmental effects (temperaturehumidty) influence potentials
No direct correlation between rebar potential and corroion rates
Stray currents influence measured potentials
Carbonation and wetting fronts alfect measurements
Concrete with high contact resistance at surface results in unstable readings
Rebar directly beow probe influences readings
Sophistica ted technique, requires considerable expertise to operate
En sion mental and ma terial condi tions have large inrluence on masurements and angleteadis e genealyun iabie
3.2. Cracking
There are several reasons why concrete will crack. Causes can include improper
pouring or curing methods, water loss during curing, settlement, rebar corrosion,
shrinkage and freeze-thaw damage. While some cracking is normal (and impossible
to avoid), excessive cracking or the formation of large cracks can impact the strength
and durability of the concrete. [NRMCA, 1998] These concerns can be magnified in
girders due to the many stresses that are present. The girders in a bridge are
subjected to bending forces, shears, axial forces and sometimes torsion. Because of
this combination, any weakness in the girders is of utmost concern. NDT can aid
with crack detection, especially for internal cracks that are not visible from the
exterior of the structure. Monitoring crack formation is important to assessing the
overall health of a structure and for determining repair and maintenance needs.
3.3. Chemical Attack
There are three basic mechanisms by which a chemical will affect concrete. The first
is a dissolution reaction or "acid attack." Portland cement is very basic (alkaline),
27

with a pH between 12 and 12.5. Because of this, it is common for acids suspended in
water or air to react with the calcium compounds in the cement paste to form salts
and water, following a typical acid-base reaction:
ACID + BASE = SALT + WATER
If the attacking acids are strong, and highly concentrated, the damage to the concrete
can be severe. Under these conditions, the reaction results in material loss, as the de-
calcification leaves behind a matrix of silica with no binder remaining. [Letourneux,
2001]
The second form of chemical attack is sulphate intrusion. This attack is based on the
reaction of the sulphate ion (S4-2) with components of the cement binder. These
reactions form sulphate hydrates such as ettringite and thaumasite. Because these
hydrates have larger molecular volumes than the original compounds, there is a net
expansion of the cement matrix, causing cracks. Of the two sulphate intrusion
mechanisms, ettringite attack is more common. Both modes of attack require the
presence of water, with ettringite needing higher temperatures (above 70" F) than
thaumasite. Thaumasite attacks almost always involve groundwater with a high
sulphate concentration. [Letoumeux, 2001] [SCI, 2000]
The final form of chemical attack on concrete is the Alkali-Aggregate Reaction
(AAR). Alkali-silica Reaction (ASR) is the most common form of AAR. When the
aggregate used in the mix is a silica-based rock (granite, argillite, etc.), alkali pore
solution can react with the silica to form a gel that expands with water. If there is
enough free water in the matrix, the expansion of the gel will exceed the tensile
strength of the concrete, causing cracking. These cracks normally will not be visible
until 5 or more years have gone by, but the cracks can expand to more than 1 mm
wide over time. [Heckroodt, 2002]
28
As mentioned in the discussion of rebar corrosion, any situation that can lead to
internal deterioration is of particular concern for girders. There are NDT methods
that can detect chemical attack on concrete, some of which will be discussed in the
next chapter.
3.4. Honeycombing
Honeycombing, and a related problem known as 'bug holes', can both be caused by
improper vibration or poor formwork. Honeycombing is pockets of coarse aggregate,
which can form as the mix settles. This can be a result of poor mix (slump too high,
coarse aggregate proportion too high, lack of air entrainment), poor placement
technique (lift height too high, delay between lifts too long, more vibration needed),
or poor formwork (joints too loose). Honeycombing reduces the strength of the
concrete and can also increase porosity and reduce durability. 'Bug Holes' are air
pockets that form against the formwork. Poor vibration or improper form release
agents generally cause these pockets. [Prairie] While bug holes generally do not
impact the structural properties of the concrete directly, they can increase the
porosity, potentially leading to problems over time. Honeycombing is often
impossible to see on the exterior of the member, but there are several NDT methods
that can detect problem areas.
3.5. Creep, Shrinkage & Volume Changes
Volume changes in concrete can have many long-term implications, especially with
reinforced concrete. During the early curing stage, the concrete is still plastic, so
volume changes due to settlement (which can amount to 1% or more) do not cause
the formation of large internal stresses. After the concrete cures and becomes more
rigid, the reinforcing steel restrains expansion and shrinkage. This restraint induces
the formation of tensile stresses within the matrix, which may ultimately lead to
cracking. Cracking causes both structural problems and aesthetic concerns. Even
during the curing phase, however, the settlement can lead to surface water and water
layers under reinforcement if the concrete is not properly finished and vibrated. The
29

layers of water can result in debonding of rebar and flaking and scaling on the
surface. After settlement ends, if the rate of water loss exceeds the rate of bleeding,
hydrostatic tension can build up in the pores of the concrete, causing shrinkage.
There are three mechanisms that can ultimately lead to plastic shrinkage [Feldman,
1969]:
- The unstable nature of newly formed calcium silicate hydrate results in
shrinkage as drying occurs. This phenomenon is not fully understood, but is
permanent and irreversible.
- Compressive stresses are set up in the concrete due to menisci forming in the
capillaries during drying.
- Energy changes occur at the surface of calcium silicate as the water
evaporates.
At least 30% of plastic shrinkage is unrecoverable. In an environment with 50%
relative humidity, reaching the equilibrium state for water loss can be accompanied
by up to 0.1% volume loss due to shrinkage. As this shrinkage occurs, reinforcement
and aggregate resist the volume changes, leading to potentially large internal stresses
in the concrete matrix. 30-60% of volume loss due to shrinkage is irreversible.
Shrinkage may be increased with the use of certain admixtures, such as water-
reducers. If concrete experiences high shrinkage, it is likely also to undergo high
creep.
Creep is a long-term effect, which can continue for as long as 30 years. 75% of the
creep has been completed after the first year. Creep does not ultimately affect the
strength of the concrete. Instead, the creep causes large strains as the concrete adjusts
to reduce stresses. This can lead to early achievement of limiting strains, and,
subsequently, failure.
NDT can help to detect shrinkage and creep behavior in concrete by identifying
indicators of the phenomenon. By using NDT to monitor the stresses, strains and
30
deformations in a structure, engineers can identify and potentially rectify any
structural problems.
3.6. Strength of Concrete
Determining the compressive strength of concrete is important to assessing the
condition of a structure. It is also one of the most difficult characteristics to measure.
The only reliable method is to take a sample of the concrete (coring) and perform a
crush test on it. Even this method is not fully accurate as the properties of concrete
can vary dramatically over a short distance. There is currently no reliable NDT
method for determining the strength of concrete. [Popovics, 2001] Two methods that
have shown promise for estimating the strength are ultrasonic pulse velocity and
rebound hammer.
3.7. Condition of Post Tensioning Tendons
There are two main concerns for post-tensioned structures. The tendons must be
monitored for corrosion and tension, and the condition of the grout in the tendon
ducts must be assessed. These are closely related, as the grout is intended to keep
moisture from penetrating the tendons. [Duke, 2002] There are several NDT methods
that have been shown to be effective for assessing the condition of both the ducts and
the cables. Some of the stress wave methods have been particularly promising.
3.8. Freeze-Thaw Damage
Damage due to freezing is not an issue unless the concrete maintains high free water
content after curing. When free water in the pores freezes, it expands by 12%,
causing cracking. As the water cycles through freezing and thawing over time, the
result is flaking and possibly crumbling of the structure. This problem would be most
prevalent in the areas of a bridge structure that hold standing water during the cold
months, such as drains (especially clogged), or cracks in the driving surface. Girders
may be subjected to this action if there is an accumulation of soil or debris that may
31

hold moisture on the surface of the concrete. Ducts for post-tensioning cables are
also vulnerable, if there is any leakage in the grouting.
32

4. Selected NDT Methods with Applications to
Concrete Bridge Girders
There are essentially two 'types' of NDT for concrete. [Malhotra & Carino, 1991]
The first category, which focuses mainly on strength properties, would be more
accurately labeled as 'mildly destructive'. These include pullout tests, surface
hardness tests and break-off and maturity techniques. The second category measures
all the other properties. These methods can measure moisture content, density,
thickness and uniformity, among other characteristics. Methods in this category
include pulse velocity, stress wave, infrared, and radar methods. This thesis will
focus on some of the 'true' nondestructive methods from the second category.
The Federal Highway Administration (FHWA) has done extensive research on NDT
and the application of these methods to structural health monitoring. [Jackson, 1999]
As part of the Strategic Highway Research Program (SHRP), specific methods were
identified for use on several issues. These methods were selected based on several
criteria:
1. Ability to perform the required function at an acceptable level of performance
2. Simplicity of operation
3. 'Field ready' and rugged equipment
4. High degree of reliability
Using these criteria as a guide, a list of techniques was selected for discussion in the
following sections. Not all of the methods meet all of these requirements at this time.
Those that do not, however, have shown the potential to meet the criteria with further
research.
33

4.1. Pulse Velocity
Much research has been done on the use of the Pulse Velocity (PV) method to
evaluate the strength of concrete. Because of the non-homogeneous nature of
concrete, there are no physical relationships that directly link pulse velocity and the
strength of the material. Research suggests, however, that a link can be found
through mathematical modeling methods. Using these concepts, empirical formulas
have been found and supported by experimentation. It has been found that PV
methods can be a good indicator of early age concrete (few days). [Landis, et al,
1994] This research is still not complete and several factors need further exploration
to see the full benefit of this NDT methodology [S. Popovics, 2001]:
- The complexity of the internal structure of concrete
" Factors that affect the strength of concrete may affect pulse velocity
differently, especially since the strength of a typical concrete structure is
controlled by the strength of the cement paste, whereas the pulse velocity os
controller by the properties of the aggregate
- The insensitivity of the longitudinal pulse velocity to small but important
changes in the internal structure of concrete
- The lack of a theoretically justifiable relationship be strength and wave
velocity.
The research suggests that these barriers can be overcome by the use of certain
simplifying assumptions and a multivariable formulation of the controlling
equations. Popovics notes, "...there is no theoretically justifiable relation between
strength and pulse velocity even for homogeneous, linearly elastic materials, let
alone for concrete. Considerable value can, however, still be derived from formulas
for improved nondestructive strength estimation obtained by circumventing the lack
of scientific approach and selecting an engineering approach: mathematical
modeling." [Popovics, 2001] Recent advances in technology have also made
progress in overcoming the aggregate-defect size issues and attenuation problems.
By using multiple transducers, new reconstruction algorithms (SAFT), and
34

transducer arrays at fixed positions, researchers have had good results in strength
evaluation, as well as with void location, crack depth determination and slab
thickness measurements. [Kroggel, 2000] An extensive discussion of this research is
beyond the scope of this thesis. It is sufficient at this point to state that with further
research, it is likely that, using Pulse Velocity techniques, improvement can be made
to the current strength estimation methods that yield results with ± 20% accuracy.
Further uses of PV may be to qualitatively evaluate the uniformity of concrete and
determine the extent and intensity of damage to a structure after an earthquake or
other large event. In this way, PV could be used to guide the repair efforts on a
structure. [Landis, et al, 1994] [Fdciouro, 2000]
4.2. Impulse Response
The Impulse Response method is a stress wave test. A hammer with a built-in load
cell is used to create a low-strain impact to send stress waves through the member
being tested. The response of the structure is measured using a velocity transducer.
Fast Fourier Transforms are used to process the time records of both the impact and
the response. Plots of dynamic stiffness and mobility and damping are generated
from this analysis.
This method has many applications to the evaluation of concrete structures.
Conditions that can be detected include [Davis & Petersen, 2003]:
- Voiding caused by slab curling
- Delamination around steel reinforcement
- Low-density concrete (honeycombing) and cracking
- Depth of alkali-silica reaction
- Debonding of asphalt and concrete overlays
" Shear transfer across joints
35

While there are other methods to detect many of these conditions, IR has the benefits
of yielding rapid results through on-site testing, which yields an immediate
identification of problem areas. This results in both economic benefits and increased
confidence.
4.3. Spectral Analysis of Surface Waves (SASW)
SASW techniques, based on the dispersion variances for different material
properties, hold promise in several areas. These methods are particularly useful for
characterization of damping and response parameters (elastic profile). During repair
operations, the member can be monitored after each step to evaluate the effectiveness
of repair efforts. The method is based on a significant velocity change of surface
waves (also called Rayleigh waves) in damaged areas of concrete. In tests, there has
been excellent consistency between SASW results and visual observations. In
addition, SASW revealed more areas that were not evident under visual inspections.
Studies have shown potential for SASW to determine the depth of cracking as well.
One advantage to SASW is the need to access only one side of the member, versus
the two sides needed for many other wave propagation techniques. If a crack is
between the two receivers, a drop in velocity will be seen for all wavelengths,
increasing the odds of detection. When a multiple ray wave model is used, the
superposition method allows for an exact formulation to be used, with no simplifying
assumptions. This results in a more accurate characterization of the system. There
are some limitations to the method, however. If the depth of a crack is less than half
the depth of the beam from the opposite side, it may not be detected by all of the
wavelengths. Also, if the wavelength is more than the depth of the beam, the lamb
wave effect may prevent the waves from detecting flaws. There is also a 'threshold'
crack area for detection, which is dependent on the wavelength. Cracks smaller than
this minimum will not be detected. [Kalinski, 1997] [Landis, et al, 1994] [Popovics
& Bystrom, 2000]
36
4.4. Modal Testing
Like, PV, Modal Testing is a method that shows much promise, but requires further
research before it can be fully implemented. Modal testing uses the global response
of a structure to an excitation to determine the elastic properties of the structure.
When concrete cracks, there is a shift in the structure's response. The decrease in
stiffness due to the crack causes the resonant frequency to decrease, while the modal
displacements increase. Tests have been performed using impact hammer and
electromagnetic shakers as excitation sources. The shaker has been used with both
pseudorandom and swept sine signals. Processing the response using the Frequency
Domain Direct Parameter ID (FDPI) technique, the study team was able to determine
eigenfrequencies and modal damping ratios for the test structure. [Ndambi, et al,
2000] Because the eigenfrequencies are very sensitive to any change in stiffness, this
is a very effective method to determine elastic properties of a structure. The method
also has the potential to be an indicator of impending failure, given the sensitivity of
the slope of the damping versus vibration amplitude to crack damage. While these
tests are currently very time consuming and tedious, recent technological
improvements are reducing this issue. However, there are still two significant issues
with using Modal Testing. The first is the sensitivity of the technique to excitation
and data processing methods. The second is how to perform the method in the field,
given the need to excite measurable responses in large structures with portable
equipment. Further research is needed to resolve these two issues before Modal
Testing can be used on a more widespread basis. [Ndambi, et al., 2000] [Visscher, et
al, 2000]
4.5. Acoustic Emissions Methods
Acoustic Emissions methods can be used to detect corrosion of reinforcing steel. As
the steel corrodes and expands, cracking occurs in the concrete matrix and in the
interface between the steel and concrete. This cracking generates stress waves in the
structure. These waves can be detected at the surface by various sensors. The
37

effectiveness of AE methods are limited, however by the high attenuation of concrete
and the low intensity of the generated waves. [Landis, et al, 1994]
A quantitative method for using AE has been developed based on a moment tensor
approach. This method can be used to evaluate the size, orientation and mode of
microcracks in concrete. The location is determined from the arrival time of the first
P-wave. The other values are found by deconvoluting the AE signals to find the
moment tensors (dipole forces) and evaluating the eigenvalues. [Ouyang, et al, 1992]
This method will be very difficult to apply in field situations due to the high level of
sophistication.
4.6. Impact Echo
The impact echo method is based on the use of impact generated stress waves that
propagate through the test specimen and reflect from internal flaws. Thee flaws can
then be located and identified by evaluating the timing, intensity and orientation of
the reflected waves. This method is useful for determining the thickness of a
member, and for determining the depth of a void or delamination. The effectiveness
is limited to larger flaws, however, due to the low frequencies generated by the
impact, which cause smaller flaws to blend in with the aggregate. [Landis, et al,
1994] Field studies with IE have shown the method to be effective for locating and
determining the extent of honeycombing or voids in box girder walls, performing
quality assurance on repairs and locating cracks and other internal damage in post
tensioned segmental bridges. [Olson, 1992]
4.7. Fiber Optics
Fiber optic sensors have seen growing use in structural health monitoring. Embedded
fiber optics can be used to sense a wide variety of physical perturbations, making
them particularly useful for concrete structures. With the ability to detect acoustic,
magnetic, and temperature fluctuations, as well as rotational and extensional strains,
these systems are ideal for long term monitoring of structures. Fiber optic sensors
38

have been used to evaluate air content, detect cracks, monitor deflections and
measure strain (polarimetry). They have also been applied for monitoring curing and
evaluating earthquake damage. Because fiber optics are not affected by most adverse
conditions, the sensors are ideal for use in bridges. [Ansari, 1992] [Huston, et al,
1992] Fiber optics are most useful in new bridges, or those undergoing significant
retrofit, due to the need to embed the sensors in the concrete.
One type of fiber optic sensors, called Bragg Grating Sensors, has been used in many
field studies. These sensors have been shown effective for a variety of applications,
including:
" Measuring strains in rebar under tension
- Measuring strains in rebar under bending of a concrete prism
" Evaluating shrinkage and creep
For all of these applications, the researchers noted one important limitation, which is
easily overcome. The sensors are very sensitive to temperature fluctuations. There
are established methods for accounting for temperature when using Bragg sensors.
[Moerman, et al, 1999]
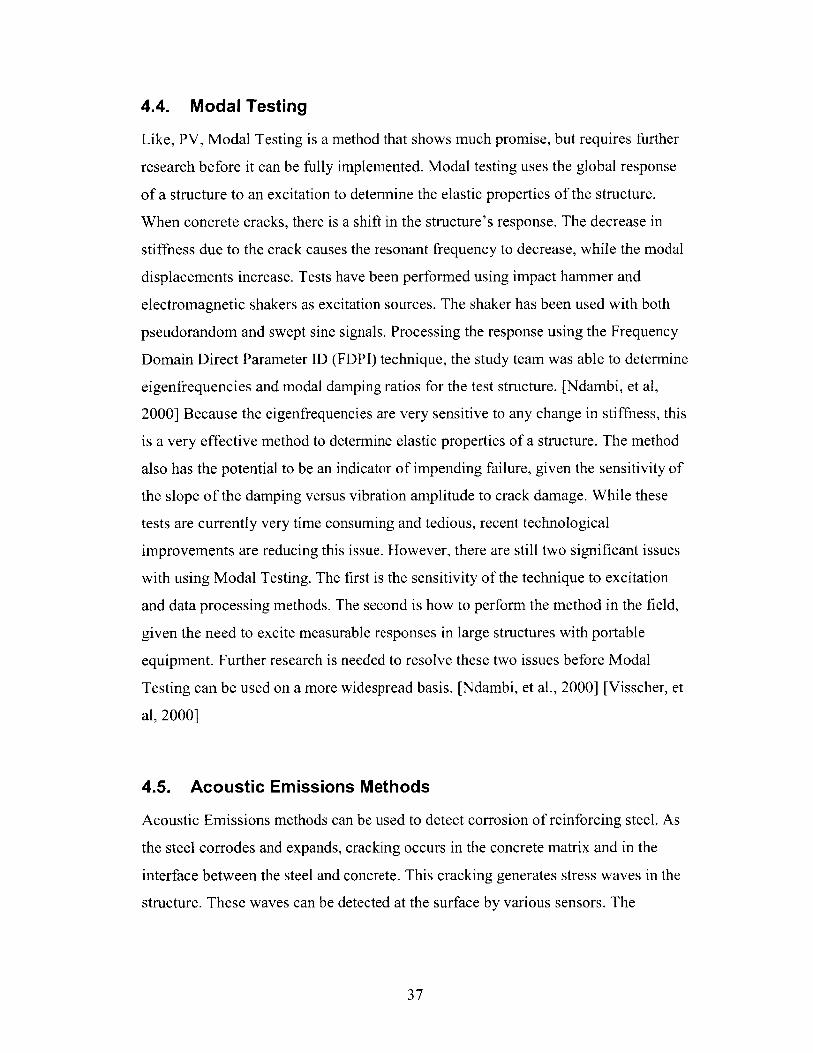
4.8. Galvanostatic Pulse Technique
This technique is used to determine the rate of rebar corrosion, allowing the
assessment of the current condition, as well as an estimate of the remaining life of
the structure. This method is a transient polarization technique. An anodic current
pulse is generated galvanostatically on the surface of the structure. This induces a
polarization of the reinforcement in the anodic direction compared to the free
corrosion potential. A reference electrode records the resulting change of the
electrochemical potential of the reinforcement as a function of polarization time.
[Klinghoffer, et al., 2000] Researchers have established a relationship between the
measured corrosion rate and the expected time to corrosion damage:
39
" Less than 6 ptm/year - no damage predicted
- Between 6 and 30 pm/year - damage predicted in 10-15 years
" Between 30 and 300 ptm/year - damage predicted in 2-10 years
- Greater than 300 pm/year - damage predicted in less than 2 years
These estimates are based on a linear change of corrosion rate with time, as well as a
uniform corrosion rate over the surface of the rebar. As neither of these assumptions
is valid, there is an inherent error in the method. Promising results have been
obtained using a correction factor to account for these non-uniformities. Advantages
to the method are the rapid results (corrosion rate measurement can be made in less
than 10 seconds) and the easy transfer of data to a PC, as well as the ability to predict
a structure's remaining life. Limitations include the aforementioned issues with non-
uniformity, as well as the dependence of measurements on environmental conditions
such as temperature and humidity. [Klinghoffer, et al., 2000]
40

5. Case Studies
The following case studies have been selected to demonstrate the effectiveness for
NDT for detecting anomalies in reinforced concrete structures. While the cases do
not all deal directly with concrete bridge girders, the methods demonstrated all can
be applied readily to girders.
5.1. 1-40 Overpass: a Work-in-Progress
The following case study has been adapted from "Verification of a Methodology to
Nondestructively Evaluate the Structural Properties of Bridges," [Stubbs, et al, 1999
(2)] All information in this section has been excerpted from that report.
The overpass, shown in Figure 5-1, below, is a reinforced concrete box girder bridge,
originally constructed in 1960. It crosses Interstate 1-40, a four lane highway, and is
oriented North-South. The bridge consists of two spans. The North span is 118 feet
long, and the South is 123 feet. The superstructure consists of a seven-foot deep box
girder with a 34-foot wide deck (with overhangs). The girder has eight-inch wide
webs, spaced eight feet, nine inches apart. The south abutment is called Abutment
#1; the North is Abutment #2. Bent #2 supports the bridge approximately at the mid-
span. The bent is a five-foot diameter column on a spread footing, which rests on
sand. The abutments are essentially end diaphragms supported by beams resting on
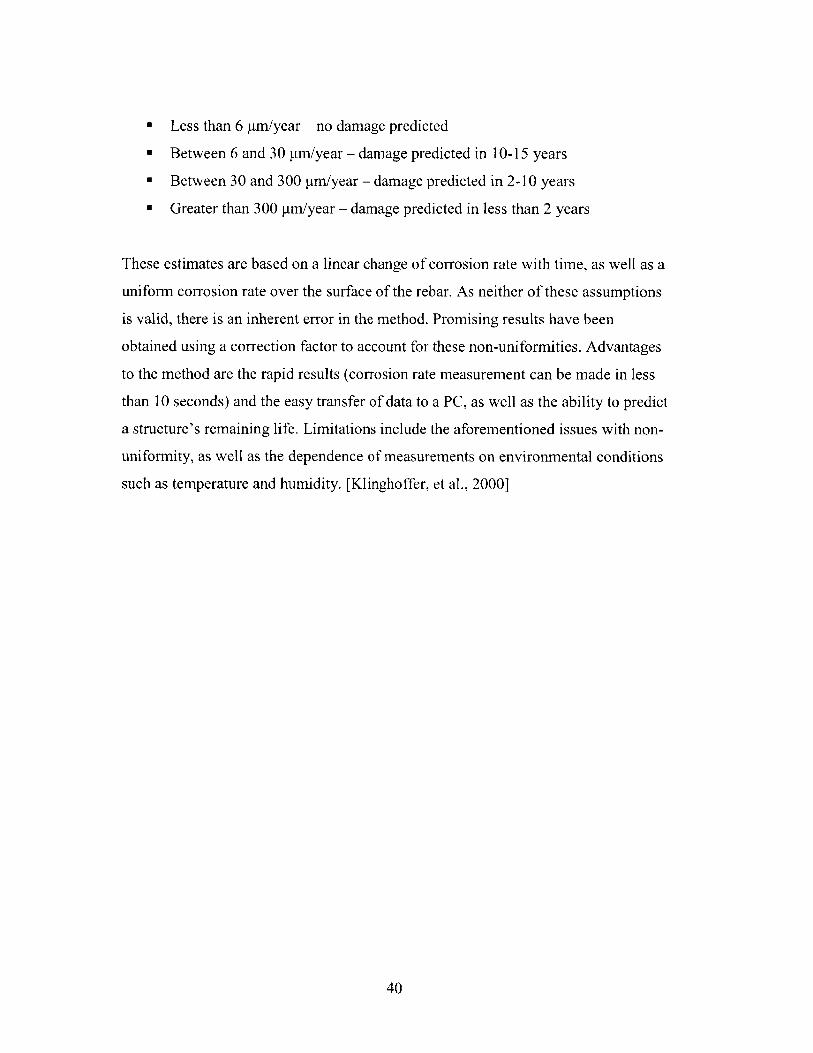
strip footings. Member properties for the bridge are given in Table 5-1.
BAIbutmeiflhtlbbMW
Bent#2
Figure 5-1: Sketch of Overpass [adapted from Stubbs, et al, 1999 (2)]
41
Table 5-1: Member Properties [Stubbs, et al, 1999 (2)]
Member No. iy- (ft4) La (ft4)4-23,50-69 347 2877
Concrete 1-3, 24-26, 47-49, 70-72 354 3084
Box Girder 27-29,44-46 362, 329330-32, 41-43 370 350033-35, 38-40 374 3605
___ _ 36, 37 750 10551
Column 73-82 31 -
The bridge was initially surveyed on December 22, 1997. Figure 5-2 provides a
schematic representation of the approach used to evaluate the bridge. The research
team used the modal parameters of the existing structure, information gained from
the as-built plans and a sensitivity-based systems identification (SID) procedure to
determine the modal parameters for an idealized structure. The two sets of modal
parameters (ideal and existing) are used with the Damage Index Method to predict
the possible locations and severity of damage in the existing structure relative to the
idealized model. The Damage Index Method (DIM) provides information on the
stiffness properties of a structure using modal strain energy stored in the pre- and
post-damaged models. The method can be used even when no baseline modal data
are available. Stiffness properties of the existing structure are determined from the
information generated by the DIM.
The first modal test, performed on December 22, 1997, provided an initial estimate
of material properties to use as a baseline. These properties are listed in Table 5-2. It
is beyond the scope of this thesis to detail the entire analysis procedure used to
determine these properties. Details of the procedure can be found in [Bolton, et al,
1999] and [Stubbs, et al, 1999 (1)].
42

Existin Modal Experimental __ DamageStructu Testing Modal Detection
Parameters Model
Plans, 1Parameters ModalField lnspection SID of Baseline Para-
Structure meters Location andSeverity ofDamage
SpatialParameters Updating Stiffnqss
Algorithm Properties ofExisting Structure
Figure 5-2: Schematic of Approach Used to Identify Stiffness Properties of Baseline and
Existing Structures [Stubbs, et al (2), 19991
Table 5-2: Identified Material Properties of the Baseline Structure (December 1997) [Stubbs, et
al, 1999 (2)]
Group I Group 2 Group 3
(Deck) (Column) kFoatin ________
E (lb/fl2 ) 457.12 x 10⁶ 361.02 x 10⁶ - -
(3174 ksi) (2507 ksi)
k (1b/ft) - - 6.764 x 10⁶ 38.28 x 10⁶
[email protected] = 5.5 ft (Elements 36, 37)
[email protected] = 120.25 ft 35@31293ft = 115.25 ft
(Element 1 - Element 35) (Element 38 - Element 72)
Element Numberky (Element 84)
' 2
-- k (Element 83) k (Element 84)
1 [email protected] = 35ftz
Y
p r (Element 73 - Element 82)
Figure 5-3: Damage Detection Model [Stubbs, et al, 1999 (2)]
43
k, (Element 83)

A finite element model of the structure was created (Figure 5-3) and used to predict
the location and severity of damage. The model has 84 elements. 1 through 72 model
the deck; 73 through 82 are for Bent #2, and 83 and 84 model Abutments #1 and #3,
respectively. Member properties are given in Table 5-1 (above), with the calculated
material properties given in Table 5-2. Predictions for damage locations and severity
are given in Table 5-3. These predictions were made using the five lowest modes of
the structure. These predictions were then used to calculate the bending stiffness
values for the members, which are summarized in Table 5-4.
Table 5-3: Predicted Damage Magnitudes (December 1997) [Stubbs, et al, 1999 (2)]
Table 5-4: Bending Stiffnesses of the Structure (December 1997) [Stubbs, et al, 1999 (2)]
Member No. Elyy (Ib-ft2) Elq (Ib-ft2 )
12 1.0469 x 10¹¹ 1.3151 x 10¹²
13 1.1103 x 101 1.3151 x 10¹²
48 1.6182 x 10" 0.9164 x 10¹²
49 1.6182 x 10" 0.9305 x 10¹²
59 1.2531 x 10¹¹ 0.8680 x 10¹²
60 1.1738 x 10" 0.7891 x 10¹²
Concrete 61 1.1421 x 101 0.7891 x 10¹²
Box Girder 62 1.2372 x 101 0.8285 x 10 12
4-11, 14-23, 50-58, 63-69 1.5862 x 10" 1.3151 x 10¹²
1-3, 24-26, 47, 70-72 1.6182 x 10" 1.4098 x 10¹²
27-29, 44-46 1.6548 x 10" 1.5053 x 10¹²
30-32, 41-43 1.6913 x 10" 1.5999 x 10¹²
33-35, 38-40 1.7096 x 101 1.6479 x 10¹²
36, 37 3.4284 x 101 4.8231 x 10¹²
Column 73-82 1.1192 x 10¹⁰ -
44
Element No. Damage Severity, a
about Y-axis about Z-axis
12 -0.34 -
13 -0.30 -
48 - -0.35
49 - -0.34
59 -0.21 -0.34
60 -0.26 -0.40
61 -0.28 -0.40
62 -0.22 -0.37

The testing sequence was run again on September 26, 1998, with the same
accelerometer layout. Table 5-5 provides the material properties determined from
that test. Table 5-6 shows the predicted damage locations and magnitudes and Table
5-7 gives the bending stiffnesses of the members.
Table 5-5: Identified Material Properties of the Baseline Structure (September 1998) [Stubbs,
et al, 1999 (2)]
Group 1 Group 2 Group
(Deck) (Column) krooutng kAbut+SoilE (lb/ft2) 591.88 x 10⁶ 254.52 x 10⁶ - -
(4110 ksi) (1768 ksi)
k (lb/ft) - - 4.941 x 10⁶ 27.97 x 10⁶
Table 5-6: Predicted Damage Magnitudes (September 1998) [Stubbs, et al, 1999 (2)]
Element No. Damage Severity, o,
about Y-axis about Z-axis
23 -0.31 -0.4024 -0.37 -0.44
25 -0.37 -0.44
26 -0.28 -0.4029 -0.36 -0.4230 -0.41 -0.4731 -0.39 -0.4873 -0.4674 -0.46 -
45

Table 5-7: Bending Stiffnesses of the Structure (September 1998) [Stubbs, et al, 1999 (2)]
On May 22, 1999, the research team mapped the pattern of surface cracks on the
deck of the bridge (Figure 5-4). As can be seen, the patterns tend to run transversely,
with the exception of the group of cracks over Bent #2. This pattern was then
compared with the predicted damage zones from the 1997 and 1998 evaluations.
~r
Abutment #1AbumntBent #2
Crack Locatlons
Figure 5-4: Surface Crack Pattern on the Deck [Stubbs, et al, 1999 (2)]
46
Member No. EIyy (lb-ft2) EIz (lb-ft2)
23 1.4171 x 10¹¹ 1.0217 x 10¹²
24 1.3200 x 10¹¹ 1.0222 x 10¹²
25 1.3200 x 10 1.0222 x 10¹²
26 1.5086 x 10 11 1.0952 x 10 12
29 1.3713 x 10 1 1 1.1305 x 10¹²
Concrete 30 1.2921 x 10" 1.0979 x 10¹²
Box Girder 31 1.3359 x 10" 1.0772 x 10¹²
4-22, 50-69 2.0538 x 10" 1.7028 x 10¹²
1-3, 47-49, 70-72 2.0953 x 10" 1.8254 x 10¹²
27-28,44-46 21426 x 10" 1.9491 x 10¹²
32,41-43 2.1900 x 10¹¹ 2.0716 x 10¹²
33-35, 38-40 2.2136 x 10¹¹ 2.1337 x 10¹²
36,37 4.4391 x 10" 6.2449 x 10¹²
Column 73, 74 4.2607 x 10⁹ -
75-82 7.8901 x 10⁹ -

It can be seen in Figures 5-5 and 5-6 that the crack locations correlated closely with
the predicted damage zones from both years. This provides strong evidence to
validate the testing procedure used by the team. Further work is underway to
establish a correlation of the visible damage with results from pulse echo and
Schmidt hammer tests on the structure.
Abutment #3jjl1
Abutment #1
Bent #2
Damage Locations:Crack Locations
Figure 5-5: Comparison of Surface Crack Locations and Damage Localization Results from the
Field Measurements in December 1997 [Stubbs, et al, 1999 (2)]
JIFk~n .I .-
Abutment #1rIil -ljlY -Li
Bent #2
Abutment #3
Damage Locations
- :Crack Locations
Figure 5-6; Comparison of Surface Crack Locations and Damage Localization Results from the
Field Measurements in September 1998 [Stubbs, et al, 1999 (2)1
47

48
5.2. NDT Corporation: Assessment of Concrete Arch Bridges
The NDT Corporation is based in Worcester, MA and provides NDT services for a
wide variety of infrastructure applications. This particular case relates to the use of
sonic/ultrasonic and ground penetrating radar methods to determine the location and
spacing of rebar as well as assess the strength of the concrete in arch bridges. The
bridges are 80 to 100 years old. The procedure followed was as follows:
- GPR data were acquired along both longitudinal and transverse lines to cover
the roadway
- GPR data were also acquired on the underside of the arches
- Sonic/Ultrasonic data are acquired along parallel transverse lines on the
underside of the arches
- Results from the GPR tests are used to locate the rebar based on the reflection
of the radar signals
- Results from the sonic/ultrasonic tests are used to locate delaminations and
concrete thickness based on the frequency of resonance
- Sonic/Ultrasonic data is also used to estimate concrete strength based on
compressional velocity
- Transmission velocities of the sonic/ultrasonic tests can also be used to
estimate Young's moduli and Poisson's ratio of the concrete
The results of the testing are then presented along with visual observations on a plan
of the bridge. [NDT Corporation, 2004]
5.3. Evaluation of Concrete Quality in a Bridge Deck and
Detection of Voids in Tendon Ducts in a Pre-stressed Slab
The following cases are excerpted from "Evaluation of Concrete Structures by
Advanced Nondestructive Test Methods - Impact Echo Test, Impulse Response Test
and Radar Survey," [Yong Hao, et al, 2003]
49

Case 1: Evaluation of Concrete Quality in a Bridge Deck
The structure involved in this case is a pre-stressed segmental concrete bridge. A
tendon reportedly slipped during the pre-stressing process, causing a crack in the
deck surface near the stressing block area. A series of destructive and nondestructive
tests were conducted on the affected area (approximately 4 meters by 4 meters). The
tests included:
" Impulse response test
" Impact echo test
- Core samples
o Compressive strength test
o Chemical composition analysis
o Petrography examination
These tests were also run on an undamaged section of concrete from the deck. The
results were then compared to evaluate the effectiveness of the NDT methods.
The impulse response test was run first to determine the general locations of any
anomalies. Each test point was evaluated based on average mobility and mobility
slope. Those areas showing higher values for both criteria were selected for further
testing. Figure 5-6 shows the plot from one of the test locations. Flaws can be
detected easily with the contrasting colors.
Figure 5-7: Mobility x Mobility Slope Plot from the Impulse Response Test [Yong Hao, et al,
20031
50
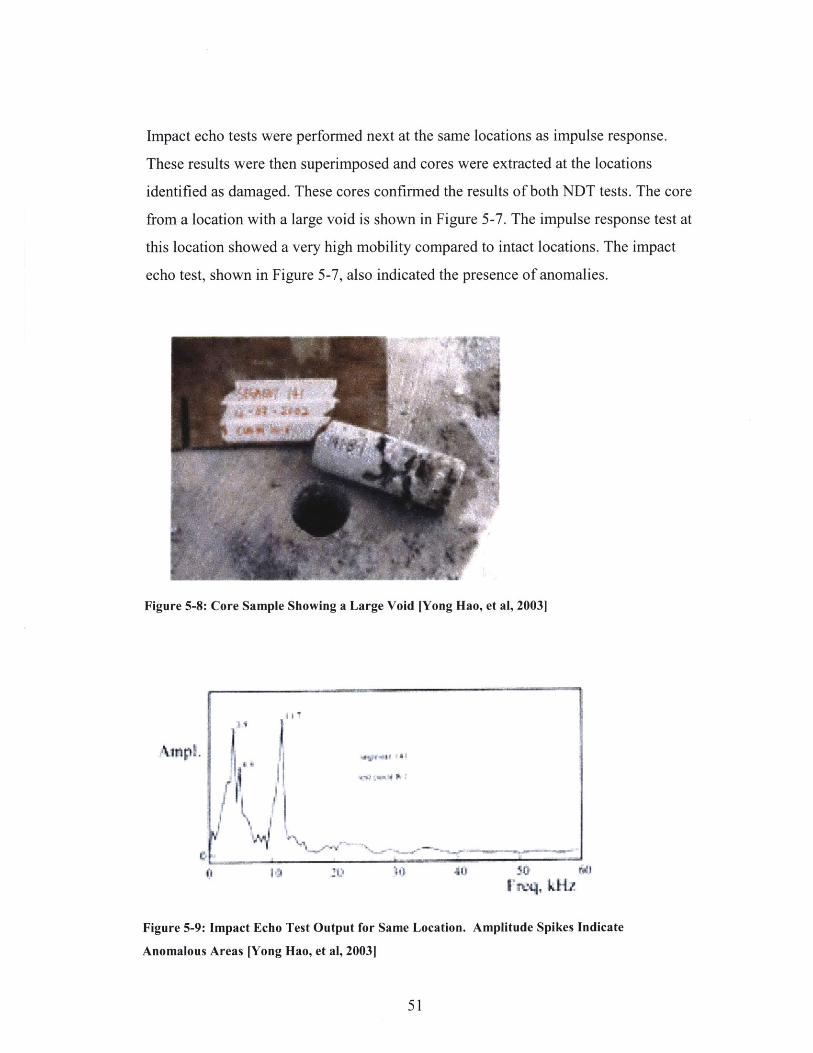
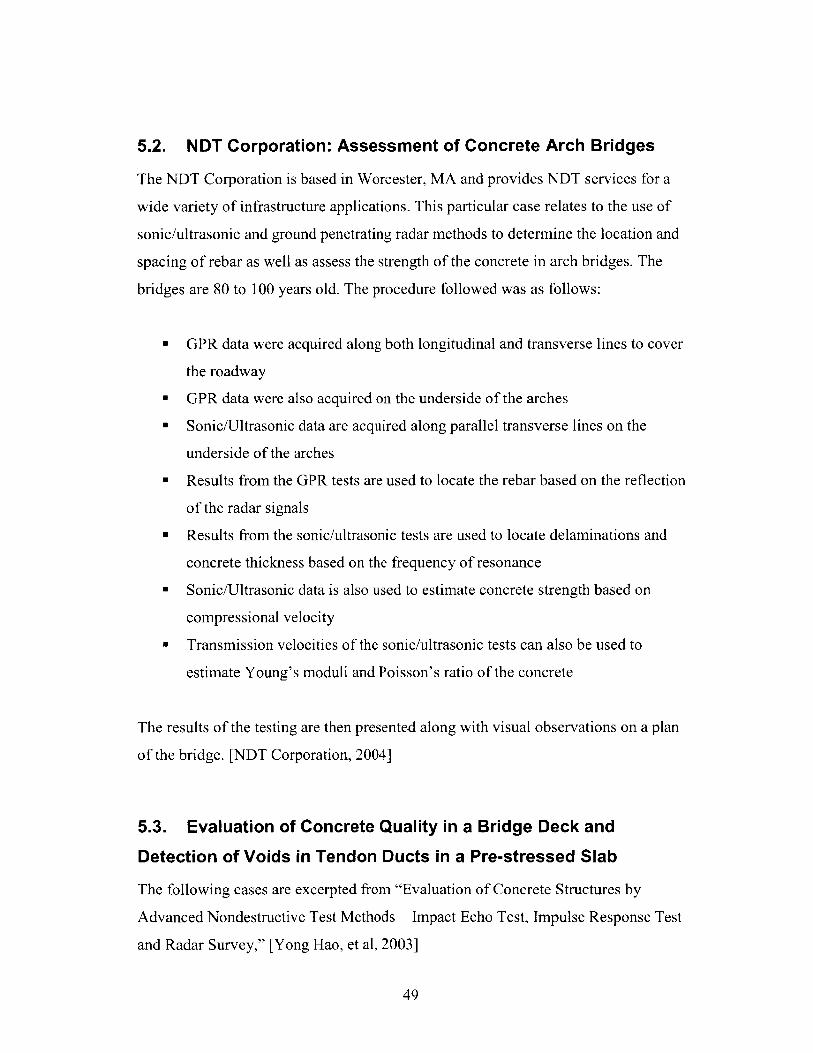
Impact echo tests were performed next at the same locations as impulse response.
These results were then superimposed and cores were extracted at the locations
identified as damaged. These cores confirmed the results of both NDT tests. The core
from a location with a large void is shown in Figure 5-7. The impulse response test at
this location showed a very high mobility compared to intact locations. The impact
echo test, shown in Figure 5-7, also indicated the presence of anomalies.
Figure 5-8: Core Sample Showing a Large Void [Yong Hao, et al, 20031
4%k1np~.
r~I
I iq, kHiz
Figure 5-9: Impact Echo Test Output for Same Location. Amplitude Spikes Indicate
Anomalous Areas [Yong Hao, et al, 20031
51
I 1~ F a
1~11 I~
C,
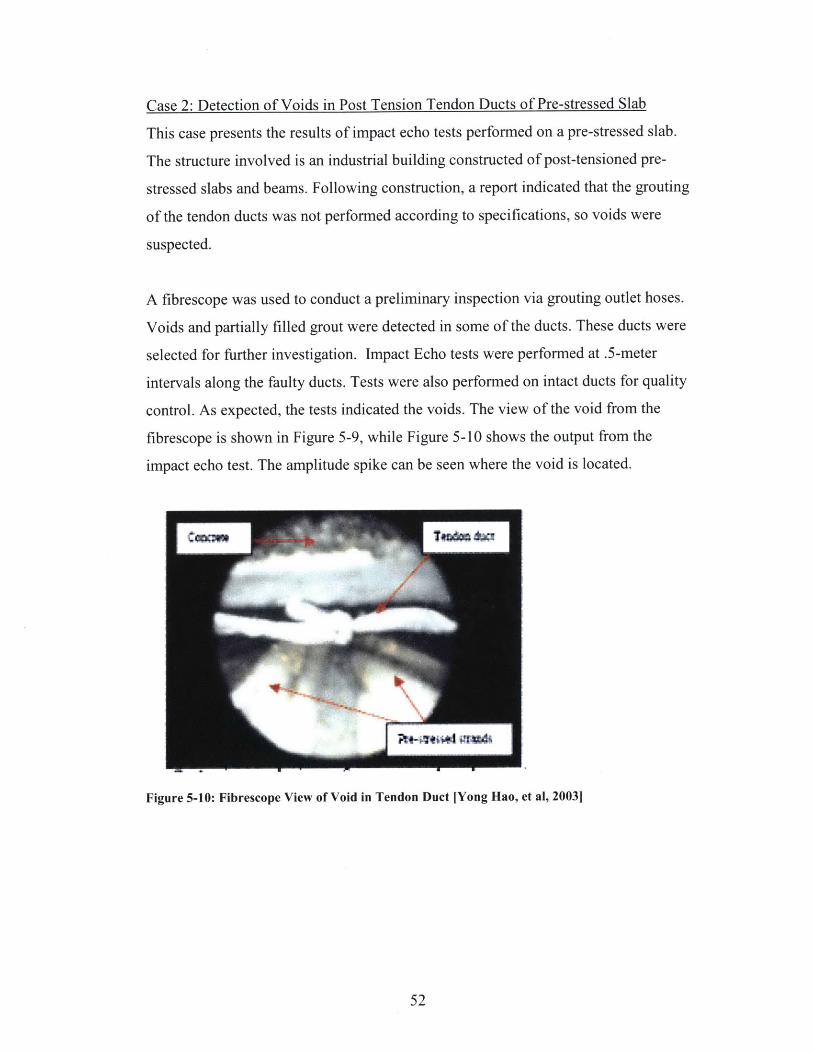
Case 2: Detection of Voids in Post Tension Tendon Ducts of Pre-stressed Slab
This case presents the results of impact echo tests performed on a pre-stressed slab.
The structure involved is an industrial building constructed of post-tensioned pre-
stressed slabs and beams. Following construction, a report indicated that the grouting
of the tendon ducts was not performed according to specifications, so voids were
suspected.
A fibrescope was used to conduct a preliminary inspection via grouting outlet hoses.
Voids and partially filled grout were detected in some of the ducts. These ducts were
selected for further investigation. Impact Echo tests were performed at .5-meter
intervals along the faulty ducts. Tests were also performed on intact ducts for quality
control. As expected, the tests indicated the voids. The view of the void from the
fibrescope is shown in Figure 5-9, while Figure 5-10 shows the output from the
impact echo test. The amplitude spike can be seen where the void is located.
Figure 5-10: Fibrescope View of Void in Tendon Duct [Yong Hao, et al, 20031
52
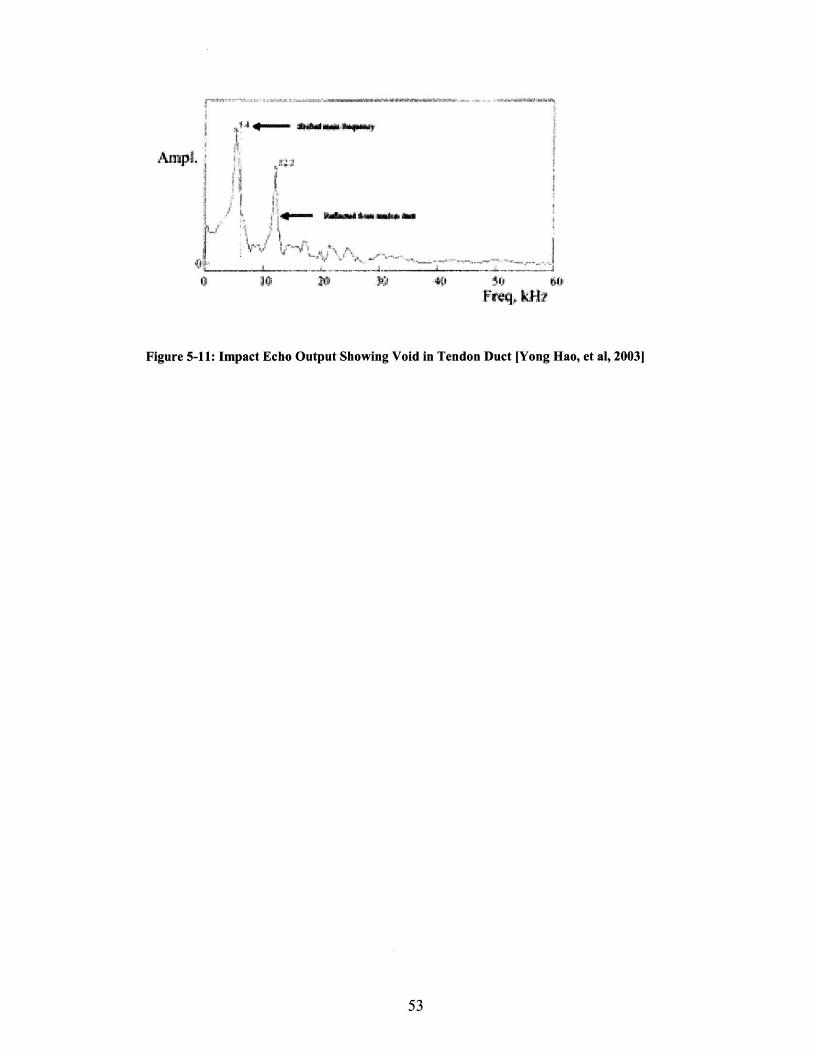
I-- masm-ws1 II
viY1 t Eo Od i T 0 6
Figure 5-11: Impact Echo Output Showing Void in Tendon Duct [Yong Hao, et al, 2003]
53

54

6. Future of NDT in Bridge Maintenance
Nondestructive testing methods are being used more and more for the assessment of
bridges. Engineers and maintenance personnel have found the technologies to be
useful in many applications and situations. With concrete bridges, in particular, NDT
can aid inspectors in getting a clear, complete picture of the condition of the
structure, both inside and out. Because of the heterogeneous nature of concrete,
visual inspection alone cannot provide a full understanding of the characteristics of a
member. Without NDT, it is almost impossible to determine the extent of
degradation without using coring or other highly destructive evaluation techniques,
which can further damage an already weakened structure. The use of NDT methods
will reduce, or even remove, the need to further damage the concrete. Work can be
targeted to only those areas needing repair, providing further cost savings. This
potential makes NDT an integral component of a bridge maintenance plan.
6.1. Health Monitoring Systems
Structural Health Monitoring can be defined as "...the measurement of the operating
and loading environment and the critical responses of a structure to track and
evaluate the symptoms of operational incidents, anomalies and/or deterioration or
damage indicators that may impact operation, serviceability or safety reliability."
[Aktan, et al, 1999] Effective bridge maintenance plans utilize some form of
structural health monitoring system. These systems gather data from multiple sensors
attached to, or embedded in, various structural elements. This data is then used to
assess the condition of the bridge and make maintenance decisions. Health
monitoring systems tend to measure the global condition of the structure. More
narrowly focused techniques are then required to identify and classify the problem(s)
more precisely and determine a course of action. [Chang & Liu, 2003]
Historically, health monitoring has involved heuristic approaches such as visual
inspection. Recent studies have shown that this approach is not effective, prompting
55
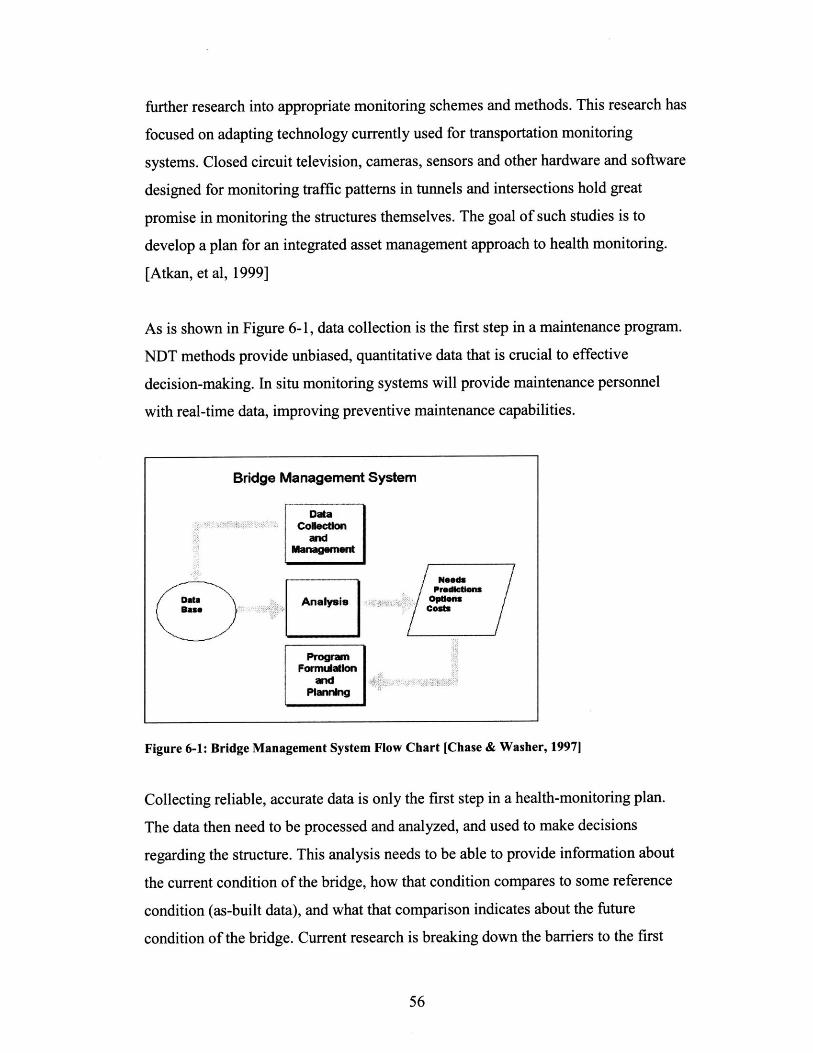
further research into appropriate monitoring schemes and methods. This research has
focused on adapting technology currently used for transportation monitoring
systems. Closed circuit television, cameras, sensors and other hardware and software
designed for monitoring traffic patterns in tunnels and intersections hold great
promise in monitoring the structures themselves. The goal of such studies is to
develop a plan for an integrated asset management approach to health monitoring.
[Atkan, et al, 1999]
As is shown in Figure 6-1, data collection is the first step in a maintenance program.
NDT methods provide unbiased, quantitative data that is crucial to effective
decision-making. In situ monitoring systems will provide maintenance personnel
with real-time data, improving preventive maintenance capabilities.
Bridge Management System
DataICoblctonI
and
Needs
AnlsIs Ope a
ProdamFormtdadon
and IPiannrng"
Figure 6-1: Bridge Management System Flow Chart [Chase & Washer, 1997]
Collecting reliable, accurate data is only the first step in a health-monitoring plan.
The data then need to be processed and analyzed, and used to make decisions
regarding the structure. This analysis needs to be able to provide information about
the current condition of the bridge, how that condition compares to some reference
condition (as-built data), and what that comparison indicates about the future
condition of the bridge. Current research is breaking down the barriers to the first
56
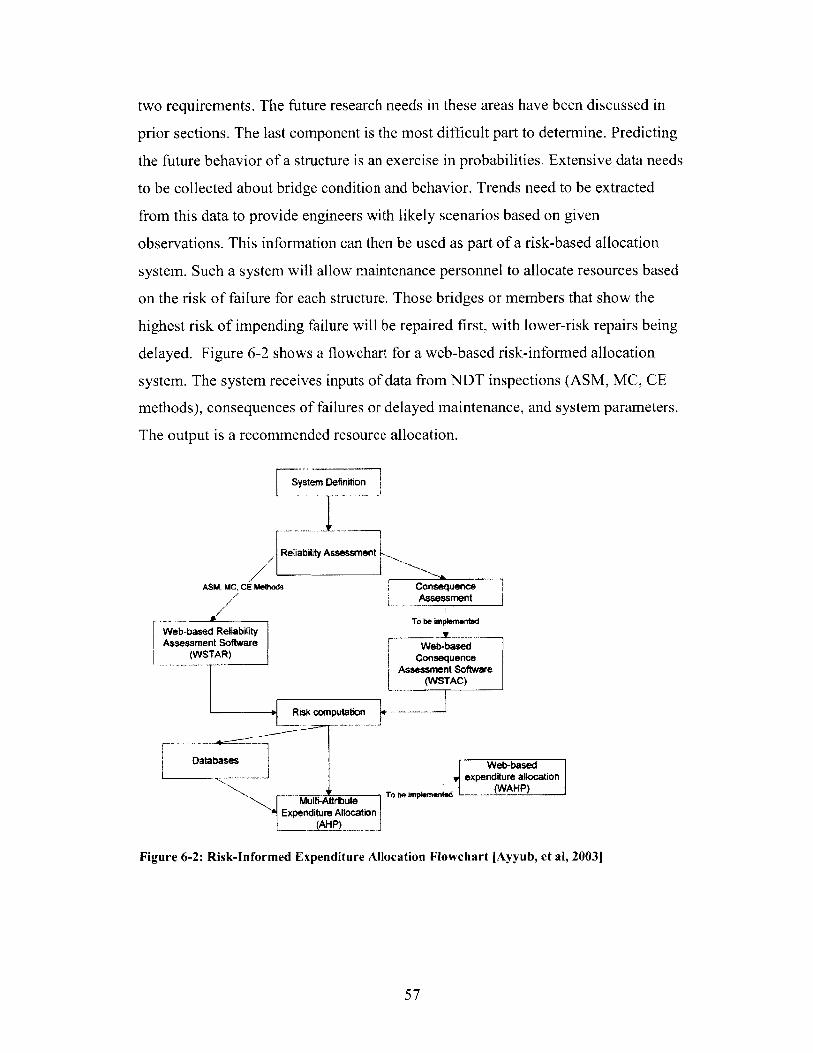
two requirements. The future research needs in these areas have been discussed in
prior sections. The last component is the most difficult part to determine. Predicting
the future behavior of a structure is an exercise in probabilities. Extensive data needs
to be collected about bridge condition and behavior. Trends need to be extracted
from this data to provide engineers with likely scenarios based on given
observations. This information can then be used as part of a risk-based allocation
system. Such a system will allow maintenance personnel to allocate resources based
on the risk of failure for each structure. Those bridges or members that show the
highest risk of impending failure will be repaired first, with lower-risk repairs being
delayed. Figure 6-2 shows a flowchart for a web-based risk-informed allocation
system. The system receives inputs of data from NDT inspections (ASM, MC, CE
methods), consequences of failures or delayed maintenance, and system parameters.
The output is a recommended resource allocation.
ystem Definition
/ Reliability Assessnent
ASM, MC, CE Methods Consequence/ Assessment
To be implenientedWeb-based Reliability TAssessment Software Web-based
(WSTAR) ~ConsequenceAssessment Software
(WSTAC)
Risk computation --
Databases Web-basedexpenditure allocation
Muli-Atriute To be implemented -. AHP)Multi-Altnbute
(AP
Expenditure Allocation
Figure 6-2: Risk-Informed Expenditure Allocation Flowchart [Ayyub, et al, 20031
57
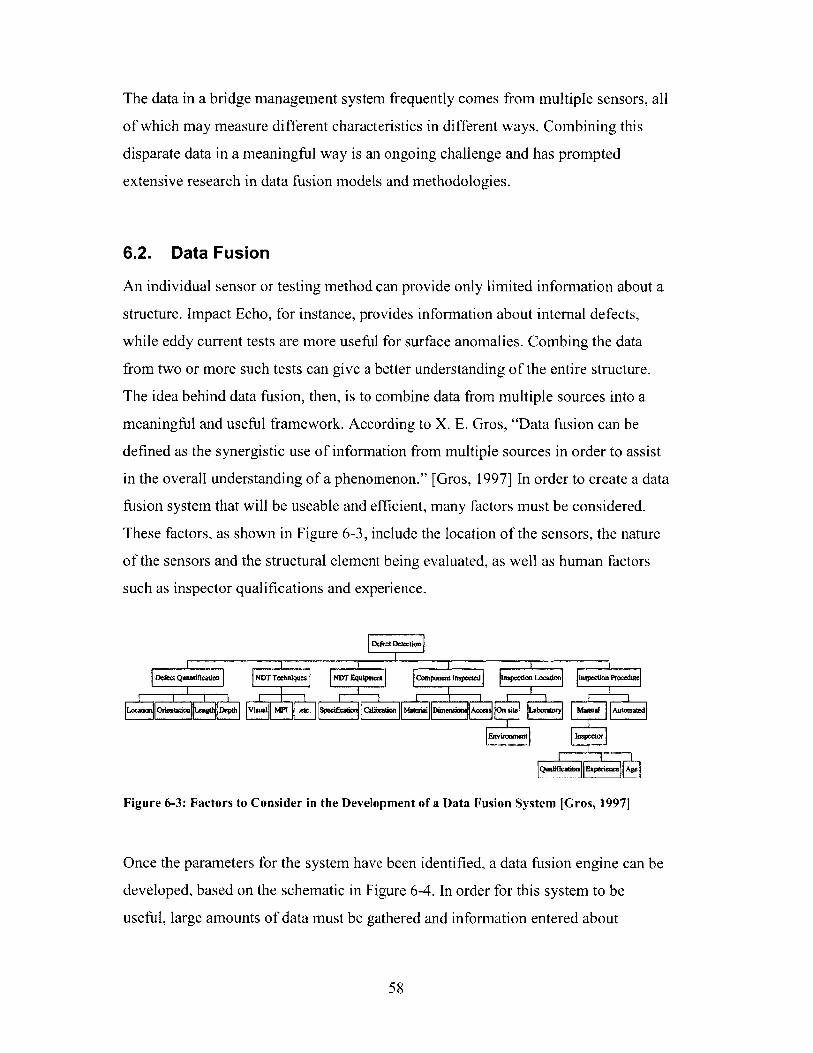
The data in a bridge management system frequently comes from multiple sensors, all
of which may measure different characteristics in different ways. Combining this
disparate data in a meaningful way is an ongoing challenge and has prompted
extensive research in data fusion models and methodologies.
6.2. Data Fusion
An individual sensor or testing method can provide only limited information about a
structure. Impact Echo, for instance, provides information about internal defects,
while eddy current tests are more useful for surface anomalies. Combing the data
from two or more such tests can give a better understanding of the entire structure.
The idea behind data fusion, then, is to combine data from multiple sources into a
meaningful and useful framework. According to X. E. Gros, "Data fusion can be
defined as the synergistic use of information from multiple sources in order to assist
in the overall understanding of a phenomenon." [Gros, 1997] In order to create a data
fusion system that will be useable and efficient, many factors must be considered.
These factors, as shown in Figure 6-3, include the location of the sensors, the nature
of the sensors and the structural element being evaluated, as well as human factors
such as inspector qualifications and experience.
Defect Qmantificadio NDTTechniques NDT Equipment Camponent Inspected lacion Locaion Inupection Procedaze
Figure 6-3: Factors to Consider in the Development of a Data Fusion System [Gros, 19971
Once the parameters for the system have been identified, a data fusion engine can be
developed, based on the schematic in Figure 6-4. In order for this system to be
useful, large amounts of data must be gathered and information entered about
58
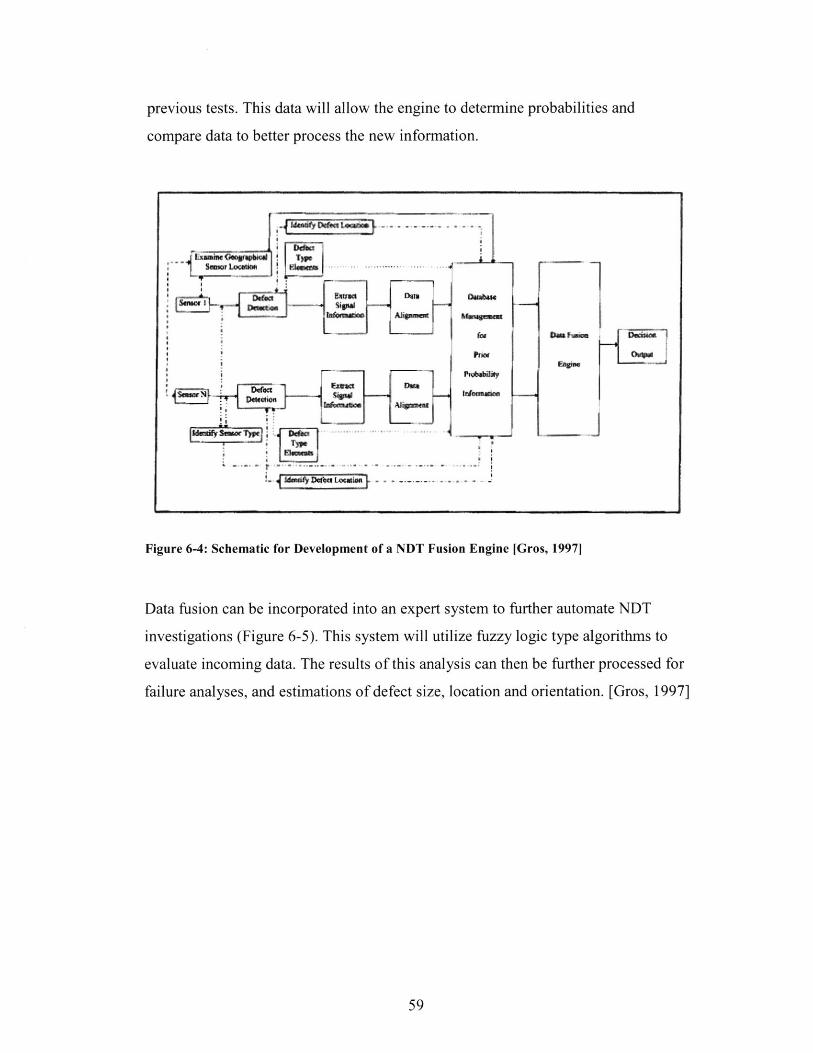
previous tests. This data will allow the engine to determine probabilities and
compare data to better process the new information.
iI
Figure 6-4: Schematic for Development of a NDT Fusion Engine [Gros, 19971
Data fusion can be incorporated into an expert system to further automate NDT
investigations (Figure 6-5). This system will utilize fuzzy logic type algorithms to
evaluate incoming data. The results of this analysis can then be further processed for
failure analyses, and estimations of defect size, location and orientation. [Gros, 1997]
59
j Ir TWO
* I
** IDfaLNI
OM
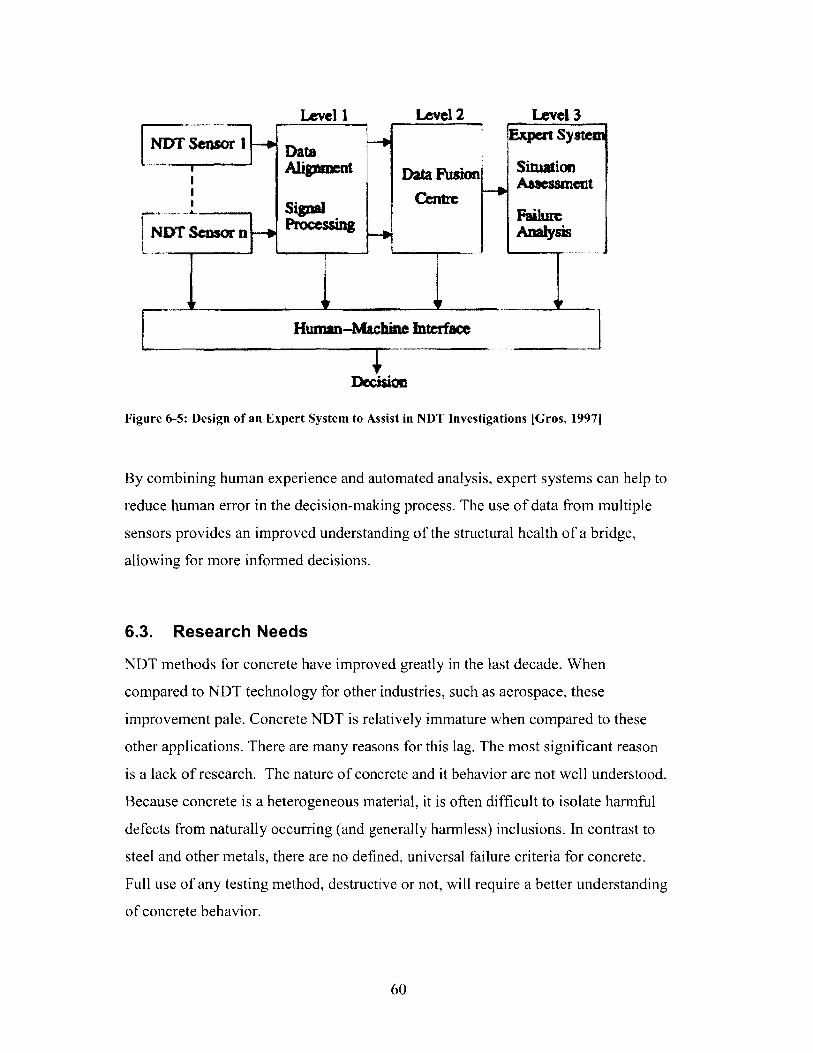
NDT Sensor n
Level I
Date
SignalF
1F
Level 2
Data Fusion
Cantm
rocessing
Human-Machine Interface
Level 3Expert Syste
SituationAssessment
FailuitAnalysis
Dc~isioc
Figure 6-5: Design of an Expert System to Assist in NDT Investigations [Gros, 19971
By combining human experience and automated analysis, expert systems can help to
reduce human error in the decision-making process. The use of data from multiple
sensors provides an improved understanding of the structural health of a bridge,
allowing for more informed decisions.
6.3. Research Needs
NDT methods for concrete have improved greatly in the last decade. When
compared to NDT technology for other industries, such as aerospace, these
improvement pale. Concrete NDT is relatively immature when compared to these
other applications. There are many reasons for this lag. The most significant reason
is a lack of research. The nature of concrete and it behavior are not well understood.
Because concrete is a heterogeneous material, it is often difficult to isolate harmful
defects from naturally occurring (and generally harmless) inclusions. In contrast to
steel and other metals, there are no defined, universal failure criteria for concrete.
Full use of any testing method, destructive or not, will require a better understanding
of concrete behavior.
60
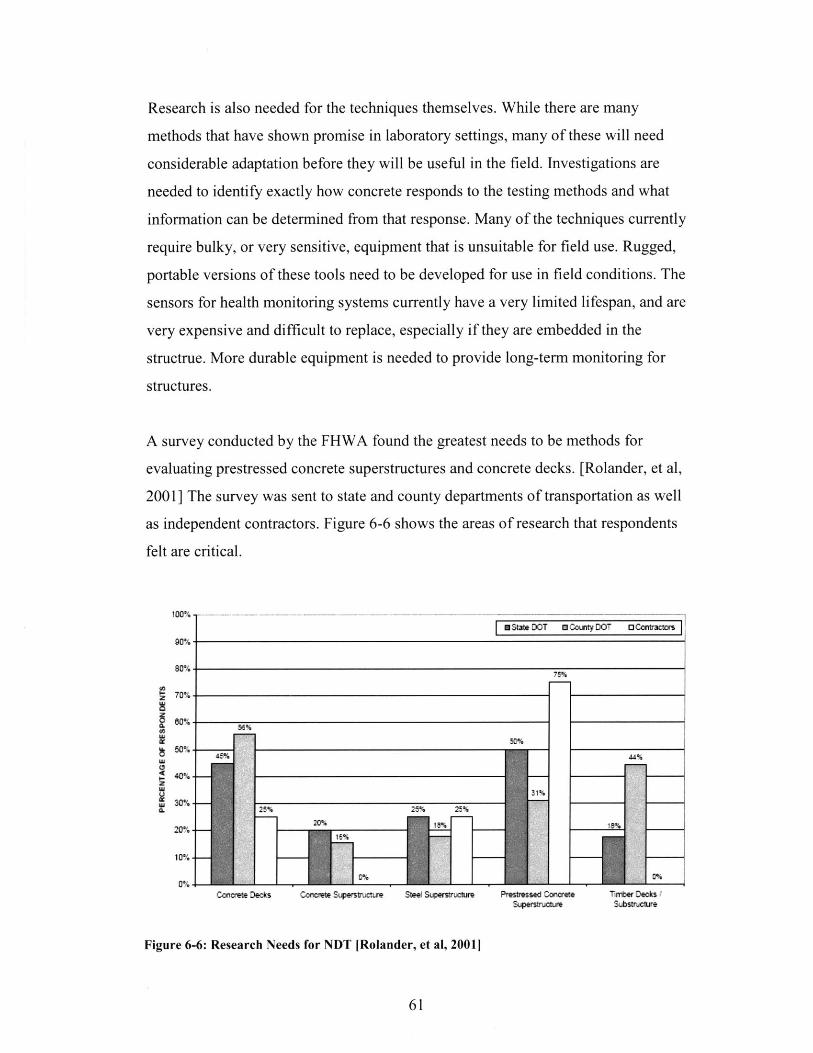
Research is also needed for the techniques themselves. While there are many
methods that have shown promise in laboratory settings, many of these will need
considerable adaptation before they will be useful in the field. Investigations are
needed to identify exactly how concrete responds to the testing methods and what
information can be determined from that response. Many of the techniques currently
require bulky, or very sensitive, equipment that is unsuitable for field use. Rugged,
portable versions of these tools need to be developed for use in field conditions. The
sensors for health monitoring systems currently have a very limited lifespan, and are
very expensive and difficult to replace, especially if they are embedded in the
structrue. More durable equipment is needed to provide long-term monitoring for
structures.
A survey conducted by the FHWA found the greatest needs to be methods for
evaluating prestressed concrete superstructures and concrete decks. [Rolander, et al,
2001] The survey was sent to state and county departments of transportation as well
as independent contractors. Figure 6-6 shows the areas of research that respondents
felt are critical.
E Sute DOT a Counvty DOT O Coniracters
00%
80%
70%--
40%
20%-
Concrete Decks Concrete Supfrstructtre Steel Superszruclure Prestressed Concrete Tinter Decks
Figure 6-6: Research Needs for NDT [Rolander, et al, 2001]
61

The results of this survey question are representative of the trend in bridge
construction. As more and more bridges are built using concrete, the need for
condition assessment tools and techniques will also grow. The development and
implementation of these new technologies will require funding at all levels.
6.4. Funding Needs
Funding is an ongoing need for NDT. Universities, state agencies, private companies
and federal agencies such as the FHWA and NSF as well as organizations such as
ASCE and ACI all fund research laboratories and provide grant monies. Research
alone is not enough, however. Funding is also needed for agencies to purchase
equipment and train inspection teams in their use.
Table 6-1: Proposed Allocation for Additional Funding [Rolander, et al, 20011
State DOT County DOT
Increase use of NDE 15 20
Increase personnel 15 6
Increase equipment 14 4
Improvements to Bridge Management System 12 23
Increase time per inspection 10 17
Increase training 5 1
Maintenance improvements 2 -
Remote bridge monitoring 2 2
Improve QA/QC 2
Perform inspections in-house 2
Inspect "bridges" shorter than 20 ft 1
Increase scope of scour surveys 1
Improve repair recommendations 1
Table 6-1 shows the areas where state and county departments of transportation
would spend additional funding for NDT. These responses were obtained as part of
an FHWA survey on NDT use in 1998. [Rolander, et al, 2001] For state agencies,
more personnel and equipment ranked very highly. Improvements to a management
system are the highest priority for county agencies. These improvements would
likely be in the area of data handling and resource allocation. Increasing the use of
62

NDT methods and allotting additional time for each inspection were also listed as
priorities for both state and county departments. All of these changes will require
additional funding.
As bridges, and the methods for assessing them, become more complex, inspection
teams will need more training. As part of the FHWA survey, respondents were asked
about the training required of team members at their organization. Figure 6-8 shows
the frequency that a licensed engineer (PE) was included on the inspection team.
Overwhelmingly, for state and county DOTs, there is no PE present for bridge
inspections. Independent contractors, who tend to have comparatively larger budgets,
have a PE on site for 83% of inspections. Experienced, knowledgeable personnel are
critical to determining the condition of bridges, and evaluating the maintenance
needs.
100% - -- ---- ---- - ---- ---
M State DOT ElCounty DOT 0 Contractors
30%
0%
70%
40% -
S50% -0LU
40%-
W 9o30%
20%- 7 7
10%-
0%0-20% 21-40% 41-60% 61-80% 81-100%
Figure 6-7: Percentage of Inspections Teams with a PE [Rolander, et al, 20011
In the same survey, respondents were asked to list changes and improvements that
should be made to policies and procedures. A key issue for county agencies is federal
funding. Other responses indicated a need for more training for team leaders and
63
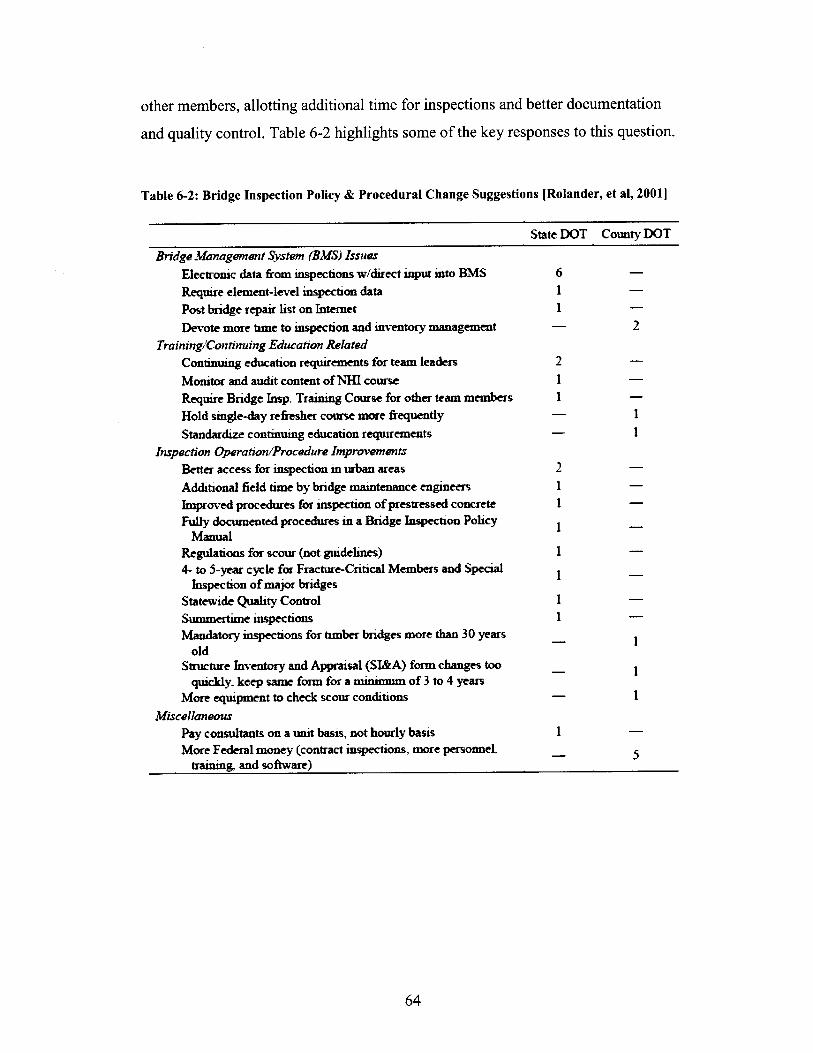
other members, allotting additional time for inspections and better documentation
and quality control. Table 6-2 highlights some of the key responses to this question.
Table 6-2: Bridge Inspection Policy & Procedural Change Suggestions [Rolander, et al, 20011
State DOT County DOT
Bridge Management System (BMS) Issues
Electronic data from Inspections w/direct mput into BMS 6Require element-level inspection data 1Post bridge repair list on Internet 1 -
Devote more time to inspection and inventory management - 2
Training/Continuing Education Related
Continuing education requirements for team leaders 2 -
Momtor and audit content of NHI course 1Require Bridge Insp. Training Course for other team members 1Hold single-day refresher course more frequently - 1Standardize continuing education requirements - 1
Inspection Operation/Procedure ImprovementsBetter access for inspection in urban areas 2 -
Additional field time by bridge maintenance engineers 1 -Improved procedures for inspection of prestressed concrete 1 -Fully documented procedures in a Bridge Inspection Policy 1
ManualRegulations for scour (not guidelines) 14- to 5-year cycle for Fracture-Critical Members and Special 1
Inspection of major bridgesStatewide Quality Control 1Summertime inspections 1Mandatory inspections for timber bridges more than 30 years
oldStructure Inventory and Appraisal (SI&A) form changes too
quickly, keep same form for a minimum of 3 to 4 yearsMore equipment to check scour conditions 1
MiscellaneousPay consultants on a unit basis, not hourly basis 1More Federal money (contract inspections, more personnel, - 5
training, and software)
64
7. Conclusions
Concrete continues to be the material of choice for bridge construction. Since the
1970s, new concrete bridges have outnumbered new steel bridges by a significant
margin. With the increase in concrete bridges comes a growing need for tools and
technology to evaluate the structures for maintenance decisions. While steel behavior
is well understood and NDT methods for steel are fairly well established, concrete
lags in both areas. There are many potential benefits to the use of NDT with concrete
bridge girders. These benefits will be realized with further research.
7.1. Benefits of NDT Use with Concrete Bridge Girders
NDT technology can improve the inspection of concrete bridge girders in several
ways. The data obtained from NDT methods is unbiased and, with the use of
multiple sensors, relatively complete. NDT technologies are available that can
provide information about the size, location and orientation of voids, the condition of
reinforcing steel and post-tensioning tendons, and the condition of grout in tendon
ducts. Some methods can also predict elastic properties of the concrete such as
Young's moduli and Poisson's ratio. The Pulse Velocity method has shown promise
for predicting compressive strength, as well. When evaluated by an experienced,
knowledgeable inspector, this data will allow for a more complete understanding of
the behavior and condition of the bridge members than is possible with more
traditional inspection methods. With the more portable methods, or embedded
sensors, NDT can make the inspection process easier, faster and safer. The use of
embedded sensors will provide real-time data that can be incorporated into a bridge
management system to streamline maintenance and repair decisions. All of these
advantages will lead to the additional benefit of reduced expenses.
7.2. Key Barriers Still to Be Addressed
Before the full benefits of NDT can be realized, there are several barriers to be
overcome. Engineers need a more complete understanding of the behavior of
65

concrete under service loads. The response of concrete to the various NDT methods
needs to be better understood, as well, to allow inspectors to properly interpret the
readings obtained from the tests. Capabilities and limitations of the techniques must
also be established; documenting what can and cannot be learned from their use.
Data is needed on the long-term behavior of bridges, particularly relating to the
effects of damage on this behavior. This information can then be used to predict
remaining bridge life and possible failure modes. Finally, additional funding is
needed to properly staff, equip, and train inspection teams. Financial constraints are
consistently cited as an important factor in decisions to implement or expand the use
of NDT methods in bridge inspections. This funding is especially urgent for the
public transportation agencies that oversee the majority of the bridges in the U.S.
Private corporations tend to claim broader use of NDT, as well as more stringent
training requirements. Additional funding will allow public agencies to adopt
guidelines and policies to ensure accurate and reliable inspections.
7.3. Research Recommendations
In order for NDT to become a reliable, functional tool for bridge girder assessment,
several areas of research need to be addressed. This research will support the needs
addressed in section 7.2. Based on these needs, research recommendations can be
broken down into four categories:
- Material behavior under service loads & extreme events* Material response to NDT tests" Development of field-ready testing equipment- Data collection of bridge failure modes for risk assessment
The order in which this research is undertaken is controlled in part by prerequisite
needs for knowledge. The material behavior and response to NDT must be
understood before equipment needs can be assessed and data collection performed.
Predictions can be made based on current knowledge, but continuing research must
be focused to address the validity of any assumptions being made. Solving
66

equipment needs will require cooperation among civil, electrical and computer
engineers, as well as materials scientists and many other contributors. Data collection
must be an ongoing process. As more data is added to knowledge banks, predictions
of failure risks will become more accurate and assumptions will be verified or
corrected.
67
References
Aidoo, John, Kent Harries & Michael Petrou, "Fatigue Behavior of CFRP-Strengthened Reinforced Concrete Bridge Girders", AZ-ICCI Conference Paper,June 2002.
American Society of Civil Engineers, "2001 Report Card for America'sInfrastructure", ASCE, Reston, VA, 2001, access at http://www.asce.org/reporteard
American Society of Civil Engineers, "2003 Progress Report, an Update to the 2001Report Card for America's Infrastructure", ASCE, Reston, VA, 2003, access athttp://www.asce.org/reportcard
Ansari, Farhad, ed., Condition Monitoring of Materials and Structures, ASCE, NewYork, NY, 2000.
Ansari, Farhad, "Ral-Time Monitoring of Concrete Structures by Embedded OpticalFibers", in Nondestructive Testing of Concrete Elements and Structures, FarhadAnsari & Stein Sture, eds., ASCE, New York, NY, 1992.
Atkan, A. E., C. J. Tsikos, F. N. Catbas, K. Grimmelsman & R. Barrish, "Challengesand Opportunities in Bridge Health Monitoring", in Structural Health Monitoring,2000, Chang, Fu-Kuo, ed., Technomic Publishing Co., Inc., Lancaster, PA, 1999.
Ayyub, Bilal M. & Clara Popescu, "Risk-Based Expenditure Allocation forInfrastructure Improvement", Journal of Bridge Engineering, November/December2003, ASCE, Washington, DC, 2003.
Azizinamini, Atorod, Aaron Yakel & Magdy Abdelrahman, eds., High PerformanceMaterials in Bridges, ASCE, New York, NY, 2003.
Better Roads Magazine, "2003 Bridge Inventory", Better Roads Magazine, DesPlaines, IL, November 2003. Available:http://www.betterroads.com/articles/bridgeinv.htm
Bolton, R., N. Stubbs, S. Park, S. Choi, & C. Sikorsky, "Measuring Bridge ModalParameters for Use in Nondestructive Damage Detection and PerformanceAlgorithms", Proc. of the 17th International Modal Analysis Conf. Orlando, FL,1999.
Chajes, Michael J., Harry W. Stanton, III & Dennis O'Shea, "Bridge-ConditionAssessment and Load Rating Using Nondestructive Evaluation Methods", paper no.5B0058 in Transportation Research Record 1696, Transportation Research Board,National Research Council, Washington, DC, 2000.
68

Chang, Peter C. and S. Chi Liu, "Recent Advances in Nondestructive Evaluation ofCivil Infrastructures", Journal of Materials in Civil Engineering, May/June 2003,ASCE, Reston, VA, 2003.
Chase, Stephen B. & Glenn Washer, "Nondestructive Evaluation for BridgeManagement in the Next Century", Public Roads, July 1997, U.S. Department ofTransportation, Federal Highway Administration, Washington, DC. Available:http://www.tfhrc.gov/pubrds/july97/ndeiuly.htm
Davis, Allen G. & Claus Germann Petersen, "Nondestructive Evaluation ofPrestressed Concrete Bridges Using Impulse Response", presented at theInternational Symposium on Non-Destructive Testing in Civil Engineering 2003,Berlin, Germany, September 2003.
Duke, John C., Jr., "Final Contract Report: Health Monitoring of Post TensionTendons", report of contract research sponsored by Virginia Transportation ResearchCouncil, project no. 02-0178-07, VTRC, Charlottesville, VA, October 2002.
Fdcdoaru, I., "Evaluation of Damage in Concrete Units Due to Earthquake Action,and Repair by Ultrasonic Technique", in Emerging Technologies in NDT, DannyVan Hemelrijck, Athanassios Anastassopoulos & Theodore Philippidis, eds., A.A.Balkema, Rotterdam, Netherlands, 2000.
Feldman, R.F., "CBD- 119 Volume Change and Creep of Concrete", CanadianBuilding Digest, National Research Council Canada, November 1969,available: http://irc.nrc-cnrc.gc.ca/cbd/cbd 119e.html
Gros, X.E., NDT Data Fusion, John Wiley & Sons, Inc., New York, NY, 1997.
Heckroodt, Renier Oelof, Guide to Deterioration and Failure of Building Materials,Thomas Telford Books, London, UK, 2002.
Huston, D., P. Fuhr, P. Kajenski & D. Snyder, "Concrete Beam Testing with OpticalFiber Sensors", in Nondestructive Testing of Concrete Elements and Structures,Farhad Ansari & Stein Sture, eds., ASCE, New York, NY, 1992.
Jackson, Donald R. "Time for a Physical: TE-42 Assessment of Physical Conditionof Reinforced Concrete Structures", HighwayTECHNET, 1999.available: http://www.library.unt.edu/gpo/OTA/tech/struct/te42.htm
Kalinski, Michael E., "Nondestructive Characterization of Damaged and RepairedAreas of a Concrete Beam Using the SASW Method", in Innovations inNondestructive Testing of Concrete, Stephen Pessiki & Larry Olson, eds., ACI,Farmington Hills, MI, 1997.
69

Klinghoffer, Oskar, Thomas Frolund, & Ervin Poulsen, "Rebar Corrosion RateMeasurements for Service Life Estimates", ACI Fall Convention presentation,Toronto, Canada, 2000.
Kroggel, 0., "Ultrasound Application in Civil Engineering - Future Steps", inEmerging Technologies in NDT, Danny Van Hemelrijck, AthanassiosAnastassopoulos & Theodore Philippidis, eds., A.A. Balkema, Rotterdam,Netherlands, 2000.
Landis, Eric, Michael Peterson, Scott Selleck, Surendra Shah, Zongjin Li, AlanZdunek and David Prine, "Developments in NDE of Concrete", NorthwesternUniversity Center for Advanced Cement-Based Materials and BIRL IndustrialResearch Laboratory, June 1994. Accessed online April 7, 2004 athttp://iti.acns.nwu.edu/pubs/landis.html
Lenett, Michael S., Ann Greisman, Arthur J. Helmicki & A. Emin Aktan,"Subjective and Objective Evaluations of Bridge Damage", paper no. 99-0411 inTransportation Research Record 1688, Transportation Research Board, NationalResearch Council, Washington, DC, 1999.
Letoureux, R., "Bacteriogenic Corrosion of Concrete", conference paper, BiarritzColloque 2001, Biarritz, France, October, 2001.
Malhotra, V.M. & N.J. Carino, CRC Handbook on Nondestructive Testing ofConcrete, CRC Press, Boca Raton, FL, 1991.
Moerman, W., L. Taerwe, W. De Waele, J. Degrieck & R. Baets, "RemoteMonitoring of Concrete Elements by Means of Bragg Gratings"., ", in StructuralHealth Monitoring, 2000, Chang, Fu-Kuo, ed., Technomic Publishing Co., Inc.,Lancaster, PA, 1999.
Ndambi, J. M., W.P. De Wilde, J. De Visscher, J. Vantomme, B. Peewters, M.A.Wahab, & G. De Roeck, "Modal Testing as a Tool for Non-Destructive Testing ofConcrete Structures", in Emerging Technologies in NDT, Danny Van Hemelrijck,Athanassios Anastassopoulos & Theodore Philippidis, eds., A.A. Balkema,Rotterdam, Netherlands, 2000.
NDT Corporation, "Nondestructive Testing of Arch Bridges", accessed online April29, 2004, available: http://www.ndtcorporation.com/ArchBridge.htm
Nemati, Kamran M., "CM5 10- Advanced Construction Techniques: VolumeChanges and Creep of Concrete", course material, University of Washington, Seattle,WA, 2003
NRMCA, "What, Why & How? Cracking Concrete Surfaces", National ReadyMixed Concrete Association, Silver Spring, MD, 1998.
70

Olson, Larry D., "Sonic NDE of Structural Concrete", in Nondestructive Testing ofConcrete Elements and Structures, Farhad Ansari & Stein Sture, eds., ASCE, NewYork, NY, 1992.
Ouyang, C., E. Landis & S. P. Shah, "Damage Assessment in Concrete UsingAcoustic Emission", in Nondestructive Testing of Concrete Elements and Structures,Farhad Ansari & Stein Sture, eds., ASCE, New York, NY, 1992.
Popovics, John. S. & Maja Bystrom, "Effective Use of Surface Waves for NDE ofConcrete", in Proceedings of the 14th ASCE Engineering Mechanics Conference,Austin, Texas, May 21-24, 2000, ASCE, Reston, VA, 2000.
Popovics, Sandor, "Analysis of the Concrete Strength versus Ultrasonic PulseVelocity Relationship" Back to Basics, American Society for NondestructiveTesting, February 2001. Accessed online April 7, 2004 at:http://www.asnt.org/publications/materialscvaI/basics/feb0 I basics/febO I basics.htm
Prairie Group, The, "Bug Holes & Honeycombing",http://www.prairiegroup.com/text/bugholes.pdf
Prine, David W., "Problems Associated with Nondestructive Evaluation of Bridges",in Proceedings of SPIE - The International Society for Optical Engineering, v 2456,June 1995, Proceedings from the Nondestructive Evaluation of Aging Bridges andHighways Conference, Oakland, CA, 1995.
Rolander, D. D., B.M. Phares, B.A. Graybeal, M.E. Moore, and G.A. Washer,"Highway Bridge Inspection: State-of-the-Practice Survey," paper no. 01-2867 inTransportation Research Record, no. 1749, pp 73 - 81, 2001.
SCI, "Sulphate Attack in Concrete", Sulphur, No. 270, September-October 2000,Society of Chemical Industry, Chatham, NJ, 2000.
Stubbs, N., C. Sikorsky, S. Park, S. Choi & R. Bolton, "A Methodology toNondestructively Evaluate the Structural Properties of Bridges" Proc. of the 17th
International Modal Analysis Conf. Orlando, FL, 1999 (1).
Stubbs, N., C. Sikorsky, S. Park, S. Choi & R. Bolton, "Verification of aMethodology to Nondestructively Evaluate the Structural Properties of Bridges" inStructural Health Monitoring, 2000, Chang, Fu-Kuo, ed., Technomic Publishing Co.,Inc., Lancaster, PA, 1999 (2).
Tanaka, Yohiki, Hirotaka Kawano, Hiroshi Watanabe & Tomoyoshi Nakajo, "Studyon Required Cover Depth of Concrete Highway Bridges in Coastal Environment",presented at the 17th U.S.-Japan Bridge Engineering Workshop 2001, Tsukuba,Japan, November 2001.
71

Uomoto, Taketo, ed., Non-Destructive Testing in Civil Engineering, 2000, Elsevier,New York, NY, 2000.
De Visscher, J., W.P. De Wilde, J.M. Ndambi, J. Vantomme, B. Peeters, & G DeRoeck, "Damage Evaluation in Reinforced Concrete Using DampingMeasurements", in Emerging Technologies in NDT, Danny Van Hemelrijck,Athanassios Anastassopoulos & Theodore Philippidis, eds., A.A. Balkema,Rotterdam, Netherlands, 2000.
Washer, Glenn A., "Developing NDT Technologies for Highway Bridges", inMaterials Evaluation, November 1999, American Society for NondestructiveTesting, Columbus, OH, 1999.
Yong Hao, Zheng, Ng Kee Ee & Ong John Wei, "Evaluation of Concrete Structuresby Advanced Nondestructive Test Methods - Impact Echo Test, Impulse ResponseTest and Radar Survey", presented at the International Symposium on Non-Destructive Testing in Civil Engineering 2003, Berlin, Germany, September 2003.
72