the use of pro-active versus re-active risk management practices for managing supply chains
TRANSCRIPT

UNIVERSITEIT GENT
FACULTEIT ECONOMIE EN BEDRIJFSKUNDE
ACADEMIEJAAR 2013 – 2014
The use of pro-active versus re-active risk management practices for managing
supply chains
Masterproef voorgedragen tot het bekomen van de graad van
Master of Science in de
Toegepaste Economische Wetenschappen: Handelsingenieur
Pieterjan Tilleman
onder leiding van
Prof. Ann Vereecke
Begeleider: Evelyne Vanpoucke

I
UNIVERSITEIT GENT
FACULTEIT ECONOMIE EN BEDRIJFSKUNDE
ACADEMIEJAAR 2013 – 2014
The use of pro-active versus re-active risk management practices for managing
supply chains
Masterproef voorgedragen tot het bekomen van de graad van
Master of Science in de
Toegepaste Economische Wetenschappen: Handelsingenieur
Pieterjan Tilleman
onder leiding van
Prof. Ann Vereecke
Begeleider: Evelyne Vanpoucke

II
CLAUSE OF CONFIDENTIALITY
PERMISSION Ondergetekende verklaart dat de inhoud van deze masterproef mag geraadpleegd en/of gereproduceerd worden, mits bronvermelding. Pieterjan Tilleman

III
Acknowledgements
Vooreerst wil ik Evelyne Vanpoucke van harte bedanken voor de volle steun, de vele raad, de nodige
tijd en de snelle beantwoording van vele emails die mij op het goede pad hebben geleid.
Vervolgens mag ik een dank aan mijn vriendin Louise uiten voor de hulp met de bibliografie en de
steun en toeverlaat wanneer het eens wat minder vlotte.
Ook mag ik de medewerking van de vele operations en supply chain managers van de deelgenomen
Belgische bedrijven aan dit onderzoek niet vergeten. Al was het soms een niet voor de hand liggende
opdracht om een vragenlijst van een dergelijke omvang ingevuld te krijgen, doch zonder deze data
zou dit werk niet tot stand gekomen zijn.
Tenslotte, dank ik mijn familie voor de volharding en de enorme steun en in het bijzonder mijn vader
voor het nalezen van dit werk.
IV
Table of Contents Table of Contents ................................................................................................................................. IV
List of Tables....................................................................................................................................... VIII
List of Formulas .................................................................................................................................. VIII
List of Figures ......................................................................................................................................... 1
1 Introduction ................................................................................................................................... 1
2 Literature research ......................................................................................................................... 3
2.1 Risk Management ................................................................................................................... 3
2.1.1 The Nature of Supply Chain Risk ..................................................................................... 3
2.1.2 Risk management ......................................................................................................... 11
2.2 Supply Chain Management ................................................................................................... 22
2.3 Supply Chain Risk Management ........................................................................................... 27
2.4 Supply Chain Security Management ..................................................................................... 30
2.5 Conclusion ............................................................................................................................ 32
3 Conceptual framework ................................................................................................................. 33
3.1 Environment ......................................................................................................................... 33
3.2 Risk perception or representation of risk ............................................................................. 35
3.3 Proactive versus Reactive Risk Strategies ............................................................................. 36
3.4 Moderators and Mediators .................................................................................................. 39
3.4.1 Supply chain management practices. ........................................................................... 39
3.4.2 Design and complexity of the supply chain................................................................... 41
3.4.3 Continental differences ................................................................................................ 46
3.4.4 Comparison with 3 years ago........................................................................................ 46
3.5 Model diagram ..................................................................................................................... 47
4 Data Collection ............................................................................................................................. 48
4.1 Introduction .......................................................................................................................... 48
4.2 Results .................................................................................................................................. 49
4.3 Variables and constructs ...................................................................................................... 50
4.4 Exploratory factor analysis (EFA) .......................................................................................... 52
5 Methodology and Analysis ........................................................................................................... 53
5.1 General model ...................................................................................................................... 53
5.1.1 Confirmatory Factor Analysis (CFA) of the general model ............................................ 53
5.1.2 Comparison with alternative frameworks .................................................................... 56
5.1.3 Descriptive statistics ..................................................................................................... 57

V
5.1.4 Hypothesis testing ........................................................................................................ 58
5.1.5 Multicollinearity ........................................................................................................... 59
5.2 Input from mediator variables .............................................................................................. 60
5.2.1 Framework ................................................................................................................... 60
5.2.2 Confirmatory factor analysis ......................................................................................... 61
5.2.3 Descriptive statistics with mediator variables .............................................................. 61
5.2.4 Structural path significance .......................................................................................... 62
5.2.5 Mediating effect and hypothesis testing ...................................................................... 62
5.3 Input from moderator variables ........................................................................................... 64
5.3.1 Descriptive statistics and differences for the moderator variables .............................. 64
5.3.2 Moderating effect and moderated mediation .............................................................. 67
5.4 Some comparison with 3 years ago ...................................................................................... 71
5.5 Hypothesis summary ............................................................................................................ 72
6 Overall Conclusion ........................................................................................................................ 73
7 Limitations and possibilities for future research .......................................................................... 75
8 References .................................................................................................................................... 76
9 Appendices ................................................................................................................................... 80
Appendix 1: PWC results .................................................................................................................. 80
Appendix 2: Participated Belgian companies ................................................................................... 81
Appendix 3: Internal consistency scale measurement ..................................................................... 82
Appendix 4: Descriptive statistics ..................................................................................................... 85
Appendix 5: Different frameworks ................................................................................................... 88
Appendix 6: Confirmatory Factor analysis for alternative framework formulations ........................ 89
Appendix 6: T-statistics for mediators .............................................................................................. 93
Appendix 7: Sobel test ...................................................................................................................... 94
Appendix 8: Paired Sampled T-statistics ........................................................................................... 96
Appendix 9: Multi-group moderation and moderated mediation .................................................. 100
Appendix 10: Statistics for differences with 3 years ago ................................................................ 102
Variable paired samples t-test .................................................................................................... 102
Paired sample t-tests for relationships ....................................................................................... 105
VI
Abbreviations list
DV: Dependent Variable
ERM: Enterprise Risk Management
FMEA: Failure Mode and Effect Analysis
IV: Independent Variable
PEST- variable: variable that signifies Political, Economical, Social & Technological trends in the
environment
PORTER-variable: variable that takes a look at the company’s competitive forces
RM: Risk Management
SC: Supply Chain
SCD&C: Supply Chain Design and Complexity
SCM: Supply Chain Management
SCRM: Supply Chain Risk Management
SCSM: Supply Chain Security Management
SCVM: Supply Chain Vulnerability Map
SME: Small and Medium Enterprise
TQM: Total Quality Management

VII
List of Figures Figure 1: risk aspects ............................................................................................................................. 5
Figure 2: Dimensions of risk ................................................................................................................... 6
Figure 3: risk sources .............................................................................................................................. 7
Figure 4: vulnerability - efficiency relation (left), vulnerability - simplicity (right) .................................. 9
Figure 5: risk management framework ................................................................................................ 11
Figure 6: fault tree analysis for the AVIA example ............................................................................... 13
Figure 7: risk matrix for the additional probability of detecting risks ................................................... 14
Figure 8: risk mitigations strategies ...................................................................................................... 19
Figure 9: the concept of Supply Chain Risk Management (Blos et al., 2009) ........................................ 27
Figure 10: a SCRM framework .............................................................................................................. 29
Figure 11: PEST anlysis ......................................................................................................................... 34
Figure 12: Porter's Five Forces Model .................................................................................................. 35
Figure 13: Supply Chain ........................................................................................................................ 41
Figure 14: Supply Network ................................................................................................................... 42
Figure 15: a more complex and adaptive network ............................................................................... 42
Figure 16: supply information network ................................................................................................ 44
Figure 17: Model diagram .................................................................................................................... 47
Figure 18: proportion of participated industries .................................................................................. 49
Figure 19: proportion of participated countries ................................................................................... 49
Figure 20: General Model ..................................................................................................................... 53
Figure 21: framework with general SCM mediator between environment and risk perception (first
framework) .......................................................................................................................................... 60
Figure 22: Framework with general SCM mediator between risk perception and risk management
(second framework) ............................................................................................................................. 61
Figure 23: Mediating effect .................................................................................................................. 63
Figure 24: Environmental factors between Europe and Asia ............................................................... 64
Figure 25: Risk Probability and Impact for Europe and Asia ................................................................. 65
Figure 26: calculation for the multi-group moderation t-statistic and p-value..................................... 68

VIII
List of Tables Table 1: risk criticality matrix ............................................................................................................... 14
Table 2: risk management actions ........................................................................................................ 17
Table 3: the business from a biological view ........................................................................................ 43
Table 4: Environmental constructs ....................................................................................................... 50
Table 5: Risk perception variables ........................................................................................................ 50
Table 6: Proactive and Reactive Management ..................................................................................... 50
Table 7: Supply Chain Management Practices ...................................................................................... 51
Table 8: Supply Chain design and complexity ....................................................................................... 52
Table 9: CFA summary table ................................................................................................................. 54
Table 10: Discriminant validiy .............................................................................................................. 55
Table 11: CFA summary table for comparison with other frameworks ................................................ 57
Table 12: outer model T-statistics ........................................................................................................ 58
Table 13: inner model loadings and T-statistics ................................................................................... 58
Table 14: Multicollinearity ................................................................................................................... 59
Table 15: Risk management for Europe and Asia ................................................................................. 65
Table 16: Risk management for lower and higher complex networks.................................................. 66
Table 17: determination coefficients ................................................................................................... 67
Table 18: Mean, standard errors and T-statistics for the two groups for moderation ......................... 70
Table 19: hypothesis summary table .................................................................................................... 72
List of Formulas Formula 1: Sobel test statistic .............................................................................................................. 62
Formula 2: t-test for multi-group moderation and moderated mediation ........................................... 68
1
1 Introduction
In many business environments, networking in supply chains is almost an inevitable solution to help
companies respond fast to market changes. A lot of opportunities are accompanied with networking.
Examples are lower transaction costs, ability to concentrate on core skills, lower capital investments,
sharing sunk costs, greater flexibility and access to key technologies. So the use, the meaning and the
practices of the concept supply chain management became important.
However, increased network cooperation does increase the dependency between organizations and
as a consequence of the advantages above companies become more exposed to the risks of other
companies. Hence networking causes transfer of risks between several companies from a supplier-
customer viewpoint. It may decrease some risks but unfortunately increase others. Inevitably
partners must share their risk among them as a solution to mitigate their risks and to succeed in their
operations. Therefore today’s industries must operate under extreme caution and the concept of
supply chain risk management was born.
The need of the concept became useful after series of crises and catastrophes had attracted public
attention like natural disasters, political and economic instabilities, terrorist attacks and many more.
Secondly modern supply chains seem to be more vulnerable than ever: increased competitive
pressure in the business environment and globalization of markets. Counterfeiting products has
increasingly entered the supply chain and harms a company’s product and reputation. The financial
crisis has brought companies to be very suspicious and seek to ensure their business and operations
continuity. Nowadays they struggle more than ever from facts like supplier insolvency and less access
to credit that especially impact the less financially stable companies.
There are plenty number of relevant examples. Automobile manufacturer Land Rover found itself in
serious trouble after its only supplier of chassis frames, UPF-Thomson, suddenly and unexpectedly
folded further supply delivery (Sheffi & Rice Jr, 2005; Wagner & Bode, 2009). Electronic company
Ericsson faced dramatic problems with a huge impact, after a fire at a sub-supplier and has
implemented an entire new organization with new supplier risk management tools (Norrman &
Jansson, 2004). Ford, Toyota and DaimlerChrysler experienced massive disruptions to the flow of
materials into their North-American assembly plants within a few days after the terrorist attack of
9/11 due to border shut-downs (Sheffi & Rice Jr, 2005).
Globalization compelled firms to make their supply chains more efficient, resilient or more
responsive by outsourcing or off shoring activities, sourcing in low-cost countries, collaborations with
2
other partnerships, decreasing inventory and so on. But all these activities can be associated with a
higher level of risk and supply chain sensitivity.
A report stated that companies suffering from supply chain disruptions experienced 33-40% lower
stock returns relative to their industry benchmarks. Consequently it can also negatively impact a
firm’s brand image and reputation. In addition severe disruptions like the Fukushima nuclear disaster
have healthy and safety risk consequences.
So concluded we feel the need for risk management in a relatively unstable world on the one hand
and an increasingly flexible supply chain on the other hand.
This work gives an introduction into the risk management world. We will discuss the main concepts
of risk, the perceptions, the difference between proactive and reactive mitigation strategies, the
supply chain practices that are needed to stay resilient and many more on the basis of existing
literature. Secondly we will employ our gained knowledge to build and test a framework that make
use of several aspects of the environment, risk concepts and supply chain practices and complexity.
Data was collected in many industries to achieve this goal. Additionally we will try to do some
investigation for progressions in the past three years and compare continents, in particular European
and Asian countries. In the end we will come up with some meaningful conclusions that fit with our
model and outcomes, give some limitations and suggestions for future research.
3
2 Literature research
First we will dig in to the world of risk management with all his facets. Thereafter we will consider
supply chain management concept and finally we will end up with the meaning of supply chain risk
management and some thoughts of supply chain security management.
2.1 Risk Management
2.1.1 The Nature of Supply Chain Risk
Introductory case
Consider a random company; named AVIA. AVIA is a manufacturing company that produces metallic
aircraft components for the aviation industry. It is operating its activities since a long time. Through
these years it has maintained its supplier base, the metal industry and reached its few customers
from the aircraft assembly industry. Suppose now that because of tensions in the commodity market,
the company that is responsible for the supply on metal parts has defaulted to deliver the needed
products. Company AVIA can appeal on a few minor companies but this amount is not sufficient. You
as a company decide to produce further your semi-finished goods with the little supply of metal parts.
Suppose then a major customer refuse to do further business with you because you have augmented
your prices due to your increased variable costs per part produced. Or you are unable anymore to
deliver the requested components on time because time goes by until you receive your parts. On top
of that a fire caught your plant and a third of your machinery capacity has been demolished.
Reinvesting in new assembly equipment is accompanied with a lot of costs. As a consequence you
see your benefits declining and you end the year with a very negative profit and loss account for the
AVIA Company.
Risk
Functions which generate the possibility of beneficial effects or profit often include risks. This is
certainly the case with business activities. So risk can here be for example:
1) Your supplier fails in delivering the needed metal parts such that you operate under capacity.
2) Problems in fulfilling customer deliveries arise because you cannot deliver your aircraft
components on time.
3) Because of cost considerations you increase your prices. Customers quit business with AVIA
which results in a too low or inappropriate demand.
4) Due to a fire at the production plant, it is difficult to get back on track which resides in the
difficult re-management of its costs, resources, development and flexibility.

4
The above situations are all examples that contain risk. We can already make a first distinction
between demand side risks and supply side risks. The third risk is an example of the first category and
the first risk is an example of the latter. These are risk categories that are internal to the supply chain
whereas the fourth risk is an example of an external to the supply chain risk. But what is risk actually?
Risk is a characteristic of decisions that is defined as the extent to which there is uncertainty about
whether potentially significant and/or disappointing outcomes of decisions will be realized (Sitkin &
Pablo, 1992). So risks suggest variation in the distribution of possible outcomes, their likelihoods and
their subjective values (Wagner & Bode, 2008). According to Kahneman & Tversky’s “prospect theory”
individual risk behavior is determined how the situation is framed. For example if individuals are
protecting prior gains will be more risk averse.
In financial risk management, risk is considered as having an upside and downside potential of
possible outcomes according to a normal distribution with a two-sided variance. In contrast the aim
of this work is to approach risks in supply chains which can be better stated, considering the severe
impact of disruptions, as being purely negative. According to several authors, risk is considered in this
manner and that corresponds best from a supply chain consideration (Wagner & Bode, 2009).
Zsidisin (2003) contains a broad definition of risk applied to the supply chain: the probability of an
incident associated with inbound supply from individual supplier failures (quality, delivery,
relationships and price) or the supply market occurring, in which its outcomes result in the inability
of the purchasing firm to meet customer demand or cause threats to customer life and safety. What
is good in this definition is that it mentions the distinction between supply and demand side risks. It
mentions some supply risks but these are not exhaustive. Production capacity constraints on the
supply market, technological changes with the supplier, product design features, to mention a few
can also play a role. It also assesses the risk aspects which are important to understand risk.
Risk aspects
In the former definition we find 2 important aspects that constitute risk namely the extent or the
impact of outcomes and the possibility or potentially significance that may or may not be
disappointing of these outcomes. These are convenient aspects of risk because according to the
Bayesian theory when you multiply these two figures for each outcome you get the distribution and
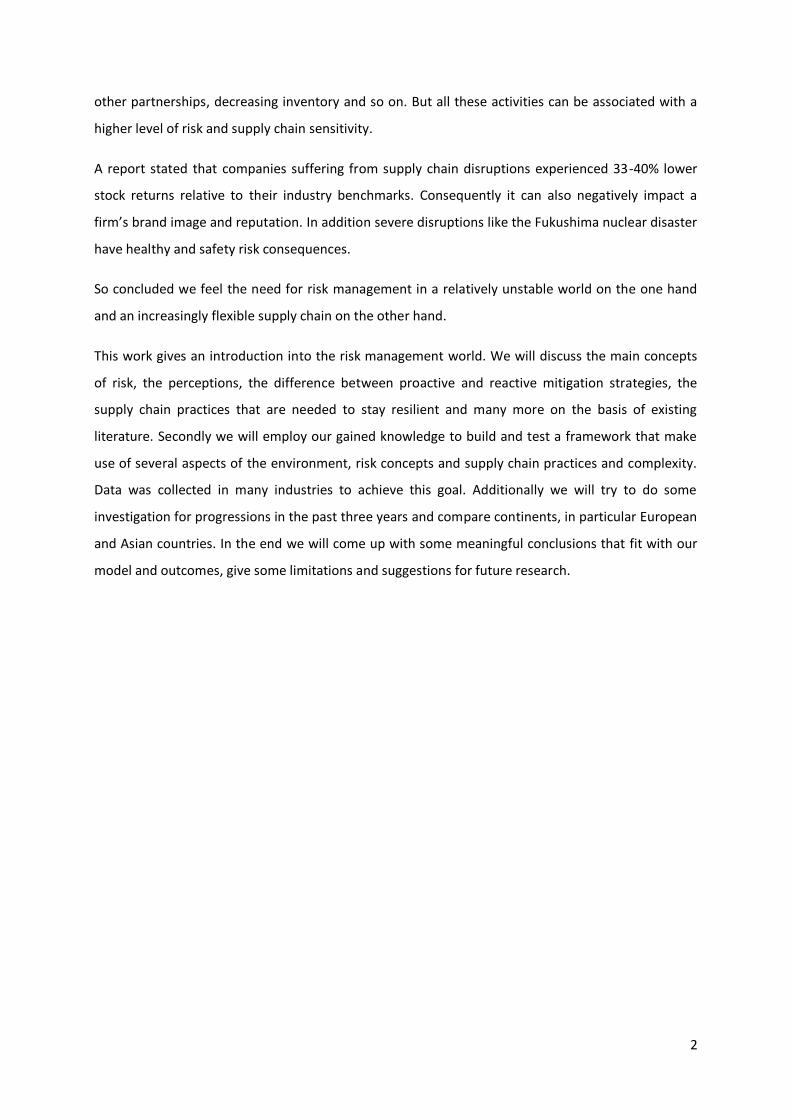
thus the severity of each possible outcome. Therefore we can split risk in 4 categories shown in figure
1 below. We consider the enterprise’s vulnerability the highest when both the likelihood and the
impact of disruption are high whereas rare, low impact events require less action to mitigate.
Furthermore disruptions that combine high probability and low impact are part of the daily
operations in the normal flow of business. On the other hand risks with low likelihoods but high
5
consequences need a concrete planning and interference that is outside the daily business
operations. The fire at our plant is an example of a low probability, high impact risk. A reduced
demand of your aircraft assemblies could be an example of high probability low impact risk. It is
important that you recognize this risk in function of your company because the probability and
impact differs among different corporations. A strike in one plant of the Airbus corporations has a
lower impact on a big multinational with several aviation plants than the same strike in our little AVIA
plant.
Figure 1: risk aspects
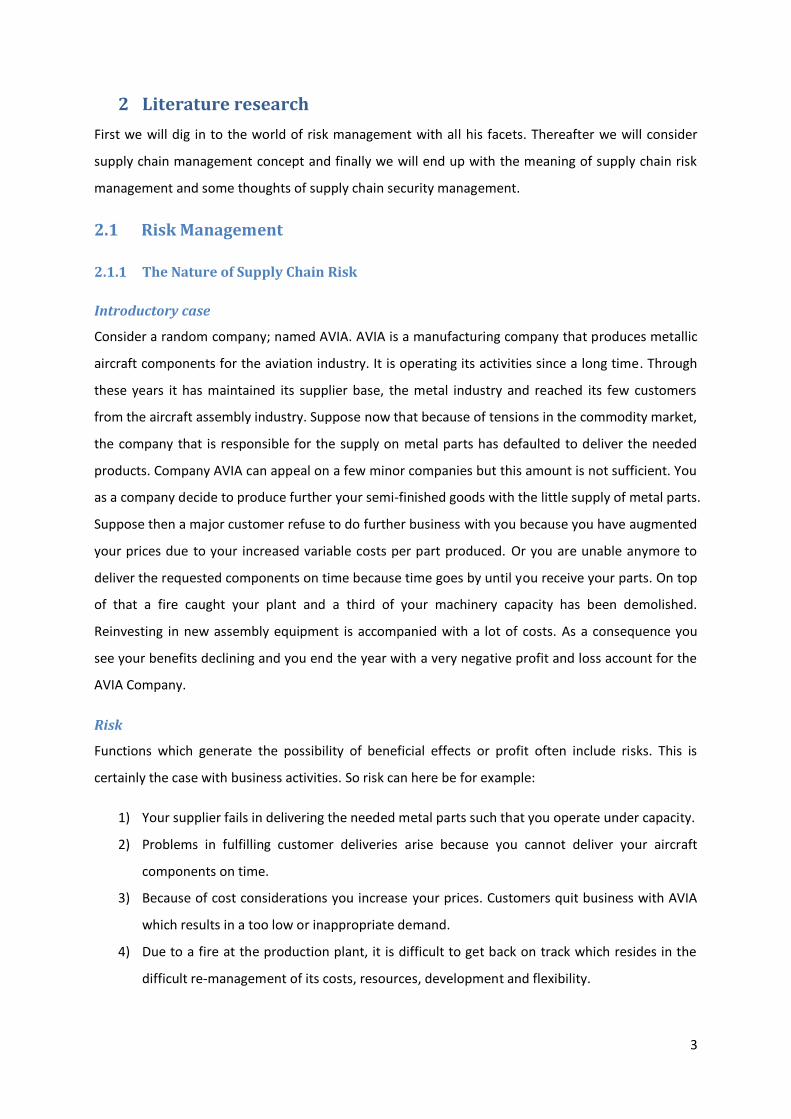
Kleindorfer and Saad (2005) suggest besides impact and probability, the speed of the possible risk
can also play a role. Speed can be understood as the rate at which the event leading to loss happens,
the rate at which these losses happen and how quickly the risk event is discovered by the company.
Furthermore the frequency or how often a similar kind of risk event happens. In our situation how
often will our major supplier fail to deliver our metal parts? If this occurs too frequently our company
may lose his reputation, several customers will abandon AVIA and in the long run our company may
be even going out of business.
At last, Griffis and Whipple (2012)consider the probability of risk detection as an additional aspect of
risk and adds a third dimension besides impact and probability. For instance, a high-likelihood/high-
impact risk that is also extremely difficult to detect, warrants a substantially different risk
management strategy than a high-likelihood/high-impact risk that can be more readily detected (see
further).
Low impact
High probability
High impact
High probability
Low impact
Low probability
High impact
Low probability

6
Figure 2: Dimensions of risk
Risk Drivers and Risk Natures
At some point you as a manager believe something exists in your business operations environment
and will lead to a particular risk event and a serious impact could occur (P. G. Smith & Merritt, 2002).
This is what we call risk drivers. Risk drivers can further increase the risk experienced by the supply
chain participants (Jüttner, Peck, & Christopher, 2003). The tensions on the commodity market in
metal parts supply or serious changes in a foreign currency exchanges rate are examples of risk
drivers. They can lead to a serious risk event and it’s important to watch out and keep in mind that
such events, although at first sight these seems to be far from your business, can cause problems to
your firm. Competition and globalization increase risk indirectly whereas outsourcing which can
results in increasing complexity can have a direct effect on risks (Jüttner et al., 2003). In essence, risk
drivers are the start of causal pathways that ends up in risks.
A further distinction can be made according to Kleindorfer and Saad (2005) on the nature of the risks
or risk sources. These are variables (networking, environmental and operational) which cannot be
predicted with certainty and which impact on the supply chain outcome variables (Jüttner et al.,
2003). We can make a distinction on risks that come from coordinating supply and demand e.g.
supplier fails in delivering the needed part, on the one hand. On the other hand risk arises from
normal activities. These can be further subdivided in operational risk and risk arising from natural
hazard, terrorism or political instability or called disruptive risks. These latter are risks with low
probability, high-consequence of outcomes whereas the former has a higher probability of outcomes.
However, most of the quantitative models are designed for managing operational risk. So there is a
need towards more disruption risk models. Examples of the former are equipment malfunctions or
human centered issues from strikes to fraud. An example of the latter is the fire at AVIA Company. A
summary of risk sources can be found in the figure taken from Jüttner et al. (2003). Environmental

7
and organizational risk sources have an impact towards the supply chain whereas network risk
sources are the risk sources of the supply chain (Jüttner et al., 2003).
Figure 3: risk sources
Manuj and Mentzer (2008) on the other hand divides the sources of risk in 4 categories (Supply,
Demand, Operational and Security Risk) each with their risk event examples. Supply risks can contain
besides the above examples supplier opportunism and inbound product quality. Or the supplier can
default in flexibility to deliver the metal parts for AVIA just-in-time. Demand risk can be that our
aircraft partner’s demand is very variable or a competitor from the assembled aircraft parts industry
negotiates a more interesting demand with our metal parts suppliers. Through this AVIA is losing
market share. Another example, but occurs more in food products supply chains, is that these
products result in a weather-related demand uncertainty. For example, the demand of ice-cream is
the highest when it’s a warm weather. The authors, Chen and Yano (2010), suggest a very flexible
contracting scheme to optimize the distribution of risks between the manufacturer and retailer. This
can be achieved for example through weather related rebate contracts to mitigate demand
uncertainty. Next risks can be seen from an operational point of view like the risk on product quality
failures. At last security risks or currency risks can also play a role. Melnyk, Rodrigues, and Ragatz
(2009) added also information/technology risks (C. S. Tang, 2006), financial risks and legal/regulatory
risks (Wagner & Bode, 2008).

8
Disruptions
“Supply chain disruption is the unintended, anomalous event that materializes somewhere in the
supply chain and threatens the normal course of business operations (Wagner & Bode, 2009)”.
In other words disruption is anything that unexpectedly affects your supply chain. According to Sheffi
(2005) these events follow a disruption profile in a predictable way in terms of its effect on company
performance.
From this perspective general problems can be roughly divided between deviation, disruption and
disaster (Gaonkar & Viswanadham, 2004). Whereas the former can be more seen from an
operational view, in essence a variation in lead times or demand within the supply chain from their
expected or mean value, the latter two problems deal more on the environmental problems. With a
disruption is the structure of a supply chain radically changed and with a disaster is the supply chain
shut down temporary or irrecoverable. The authors formulated 2 mathematical optimization models
that deal with only deviation and disruption problems because modeling disasters is simply
impossible.
Random events, land natural disasters like tropical storms and earthquakes can be best estimated
from historical data for their possible occurrence. The likelihood of accidents on the other hand can
also be estimated from industry data, prior events and the enterprise particular safety programs and
implementations. Lastly, the probability of intentional disruptions such as job actions, strikes or
sabotage) is the most difficult to estimate because the likelihood is a function of the specific
company’s decisions and actions.
Then, there is the difference between several kinds of storms according to Altay and Ramirez (2010).
The impact of damage from windstorms and floods seem to be dramatically lower from that of an
earthquake in terms of operational Cash Flow. The authors give the reason for the better
predictability of these former 2 climate events and firm’s ability to prepare their firms in advance for
them. Earthquakes damages a lot and makes recovery very slow and do not allow preparation time.
In addition they show that the impact of natural disruptions is dependent on the firm’s position in
the supply chain. The disasters that can be prepared can be planned for the upstream partners.
There stock is accrued in advance and can be sold to downstream partners where these have
opposite total asset turnovers. A solution to overcome this problem with the downstream partners is
supply-chain wide risk practices because a firm that is not prepared will disrupt the operations of the
rest of the supply chain.
9
Melnyk et al. (2009) proposes a discrete event computer simulation model that is based on the
decomposition of a supply chain disruption in several facets like for example the quantity loss, time
period, periodicity, profile breath & location of a disruption and the output level of its recovery
towards the supply chain performance. They concluded that the use of classical statistical analysis is
rather limited since they do not deal with the time dimension of disruptions. Because of the transient
behavior of the process intervention analysis using time series is more appropriate in their study
(Melnyk et al., 2009). A general rule should be to include a combination of methodologies in order to
make a comparison.
Perry (2007) builds a disaster response model after the 2004 Tsunami in Thailand that is for a part
transferable to a business context. They highlight the logistic aspects (expertise and efficiency) and
the need for quick information by extensive communication and local knowledge to deal with
disasters quickly. This can be the case when some manufacturing activities are outsourced in a
distant country.
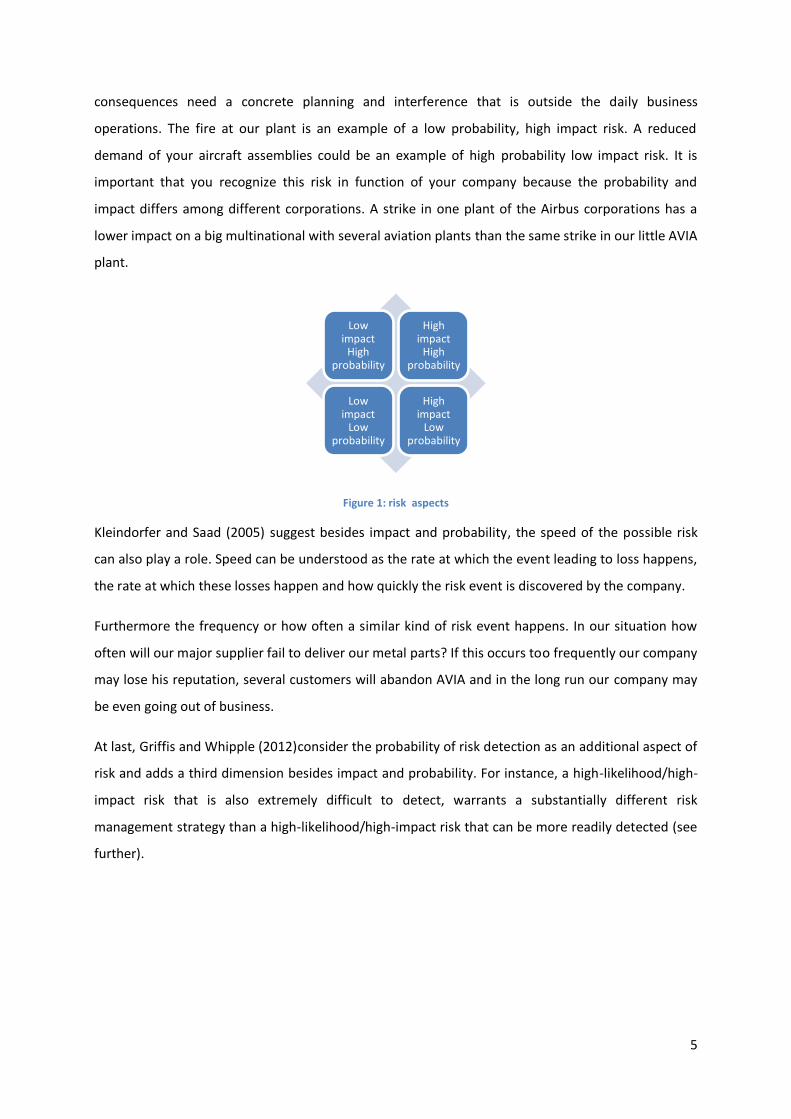
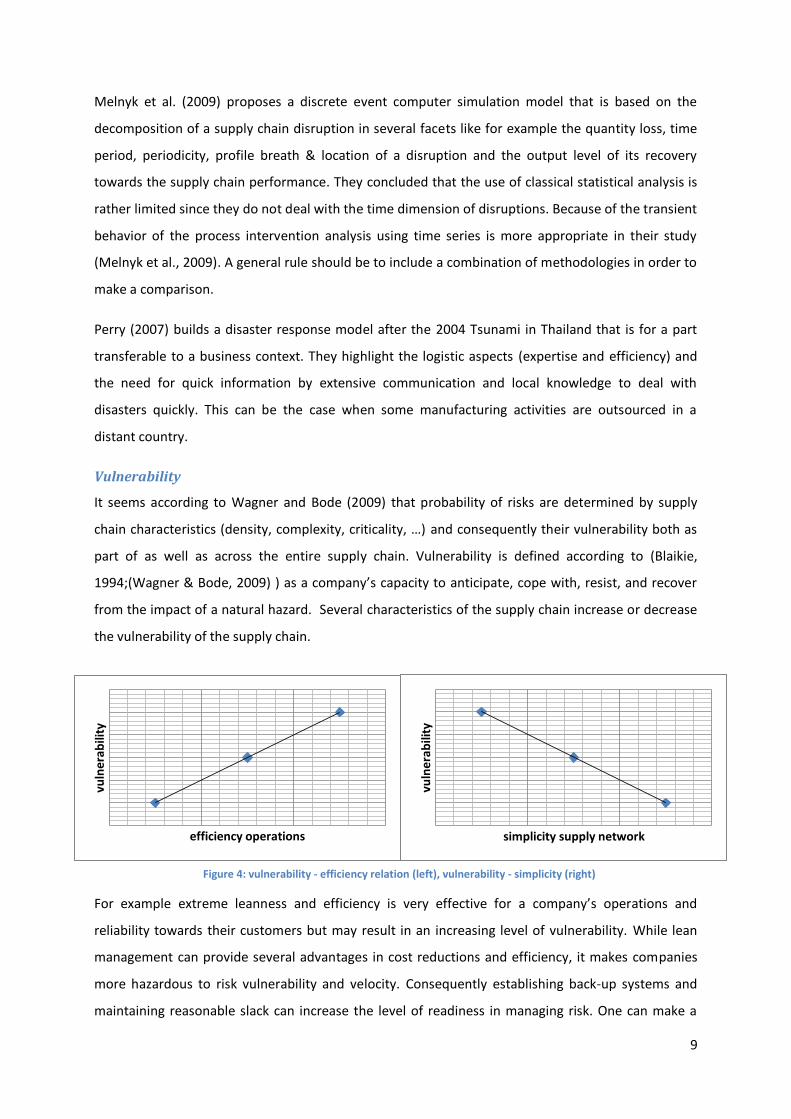
Vulnerability
It seems according to Wagner and Bode (2009) that probability of risks are determined by supply
chain characteristics (density, complexity, criticality, …) and consequently their vulnerability both as
part of as well as across the entire supply chain. Vulnerability is defined according to (Blaikie,
1994;(Wagner & Bode, 2009) ) as a company’s capacity to anticipate, cope with, resist, and recover
from the impact of a natural hazard. Several characteristics of the supply chain increase or decrease
the vulnerability of the supply chain.
For example extreme leanness and efficiency is very effective for a company’s operations and
reliability towards their customers but may result in an increasing level of vulnerability. While lean
management can provide several advantages in cost reductions and efficiency, it makes companies
more hazardous to risk vulnerability and velocity. Consequently establishing back-up systems and
maintaining reasonable slack can increase the level of readiness in managing risk. One can make a
vuln
erab
ility
efficiency operations
vuln
erab
ility
simplicity supply network
Figure 4: vulnerability - efficiency relation (left), vulnerability - simplicity (right)

10
trade-off between robustness and overall efficiency to cope the level of risk. And because of the
supply chain is only as secure as its weakest link minor movements can entail serious disruptions
which makes the supply chain very vulnerable. Second, to reach more leanness or customer made
products provided to worldwide demand, often this is coupled with an increasing complex network.
But this must be paid off towards increasing vulnerability. We shall further see that one can
overcome the vulnerability in complex network by being more resilient.
Sheffi proposed a supply chain vulnerability map (SCVM) with four quadrants namely financial,
strategic, hazard and operational vulnerability. Strategic vulnerability means the vulnerability when a
new product is introduced. Hazard vulnerabilities are the internal as well as external risk drivers
previously described. Operations vulnerability focus on the supply chain as for example distribution
network failures. The framework is constructed in a manner that items of a category placed in the
centre are very important and those on the edge less important. The goal of this framework is that
each of the categories has a property to find, quantify and minimize risk (Blos, Quaddus, Wee, &
Watanabe, 2009).
Wagner and Bode (2006) found evidence of the effect of supply chain vulnerability drivers are
positive towards more supply chain risk. This is the case for supplier dependence, single and multiple
sourcing. So firms must according to Wagner and Bode (2006) avoid dependences and improve the
robustness of a company’s chain. Meanwhile the choice of single or global sourcing must be done
through a risk-benefit analysis (see further).
Vulnerability is not in every industry the same. The aircraft manufacturing industry operates in an
extreme risk environment, characterized by high levels of commercial, technological and political risk
as well as the inherent product safety issues (Haywood & Peck, 2003). Interviewed companies from
the author’s research acknowledged that their supply chain is most vulnerable during times of
change as the risk profiles affecting their supply chains were also changing, but also that change is a
constant state in their supply chain activities. Aircraft companies never experienced a steady-state
resulting in increased supply chain change management (Haywood & Peck, 2003).
To reduce a company’s weakness Asbjørnslett (2009) suggest to take a vulnerability analysis. It’s a
top down analysis and its main focus is towards the system mission and the survivability of the
system (Asbjørnslett, 2009). The essential steps to take this analysis is first to search for possible
threats and their consequences, next the company must bring back their system to new stability by
aligning adequate resource and last determine the disruption or the time the stability is again
established. It gives a complete proactive vulnerability analysis framework that works in two rounds.
11
First the manager tries to understand the threats and risks, analyses and rank the consequent
possible scenarios and is left over with a set of critical vulnerable elements in a first round. These
require additional specific analysis that needs reduced fragility by adding appropriate resource to
mitigate their criticality to them in a second round of investigation.
2.1.2 Risk management
Risk management is defined as identifying and assessing the probabilities and consequences of risks,
and selecting appropriate risk strategies to reduce the probability of, or losses associated with,
adverse events (Manuj & Mentzer, 2008).
The execution of an overall risk management process is useful for companies because managers tend
to focus solely on critical performance targets, which affect the way they manage risk (C. S. Tang,
2006). The need for more supply chain and risk management has certainly become clear after the
PWC investigation (Levi, Vassiladis, & Kyratzoglou, 2013). In their research they categorize
enterprises in 4 levels of achievement of supply chain and risk management. They grouped the two
lower and two higher levels together to reach some conclusions. Appendix ? gives some results from
their study and show the percentage of companies with more than 3 incidents that suffered an
impact of 3% or higher on their performance as a result of supply chain disruptions. First companies
that invested in an advanced risk and supply chain management level are better equipped towards
risks than lower risk management levels.
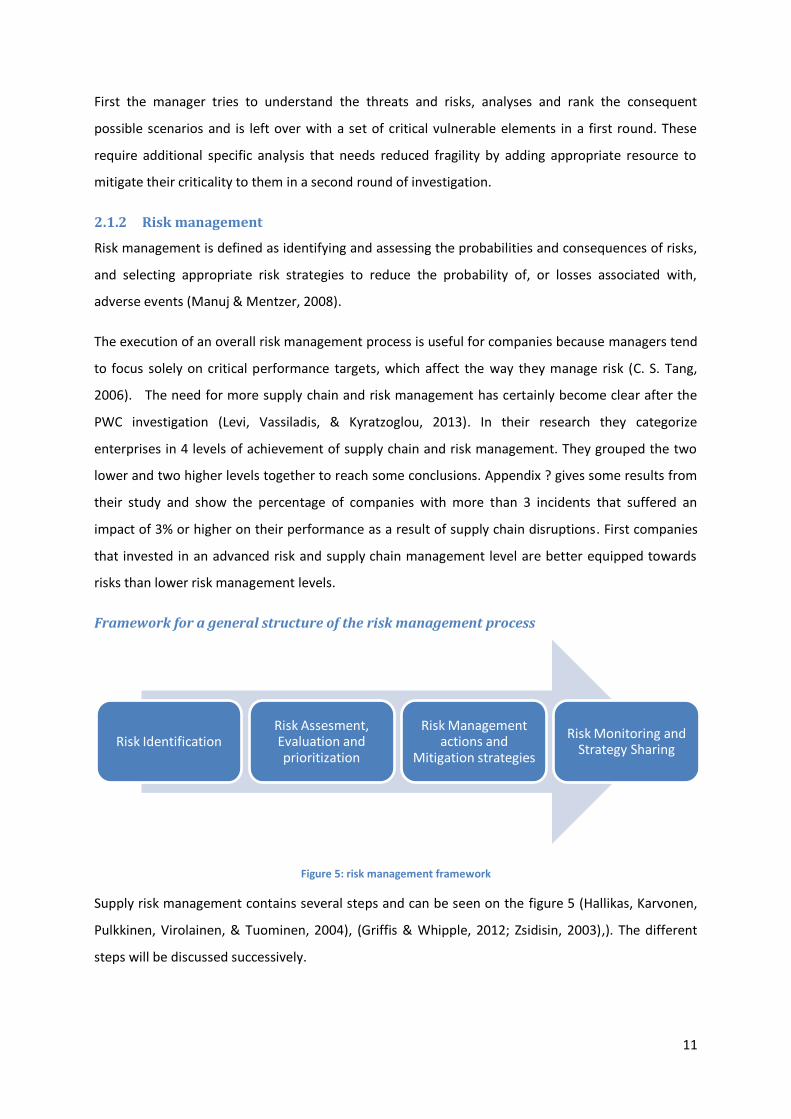
Framework for a general structure of the risk management process
Figure 5: risk management framework
Supply risk management contains several steps and can be seen on the figure 5 (Hallikas, Karvonen,
Pulkkinen, Virolainen, & Tuominen, 2004), (Griffis & Whipple, 2012; Zsidisin, 2003),). The different
steps will be discussed successively.
Risk Identification Risk Assesment, Evaluation and prioritization
Risk Management actions and
Mitigation strategies
Risk Monitoring and Strategy Sharing

12
Risk Identification
Equipment interruptions, quality failures and supply fluctuations. These are common strong signals
of risks in manufacturing systems. The main focus of risk identification is to recognize future
uncertainties to be able to manage these scenarios proactively in a later stage. Chopra and Sodhi
2004 identified nine broad categories of supply chain risks: disruptions, delays, systems, forecasts,
intellectual property, procurement, receivables, inventory and capacity. Furthermore according to
Manuj and Mentzer (2008) it is recommend that, once identified, risks should be segmented by
specific characteristics in order to create a risk profile. You can categorize them in domestic or global
risks.
Once you start to investigate and identify risk, a common approach is to start with a brainstorming
session with the management team with a diversity of people from sales, marketing, quality and
finance if possible of your business. It can be helpful sometimes to get your session accompanied
with your supply chain partners or major customers ((P. G. Smith & Merritt, 2002), (Preston G Smith,
2002)). By brainstorming you can base your business on the past as well as you can ask if everyone
can think of success factors and wonder themselves what can go wrong? Actions that can be
performed to discover risks are for example (Mullai, 2009):
- Identify risk generating activities
- Identify and formulate problems
- Determine the background to determine the context
- Define (technical, analytical) boundaries for the study
- Collect relevant risk-related data and information
Daimler Chrysler had to quit production for several days because of a defective fuel injector that
came from their supplier Bosch, so the former company claimed his supplier for delivering the wrong
part. Bosch claimed that it didn’t make mistakes but instead pointed at his supplier Federal Mogul for
their faulty sockets which in turn found his supplier Dupont guilty for delivering defective granulates
(Henke, 2009). A practical approach in finding the origin of disruptions is the use of the Tree model.
This allows you to find the underlying root causes for today’s disruptions but also by using “what if”
scenarios to get the root cause for future uncertainties (Griffis & Whipple, 2012). Ask yourself “what
could go wrong at this point that would prevent us from achieving success”, especially for projects.
Ultimately in a later stage this can form the basis for a comprehensive scenario planning approach
(Sheffi & Rice Jr, 2005). Also a risk simulation can be done or a sensitivity analysis can be performed
to check if some crucial parameters or outputs change in different scenarios. It is important to find
13
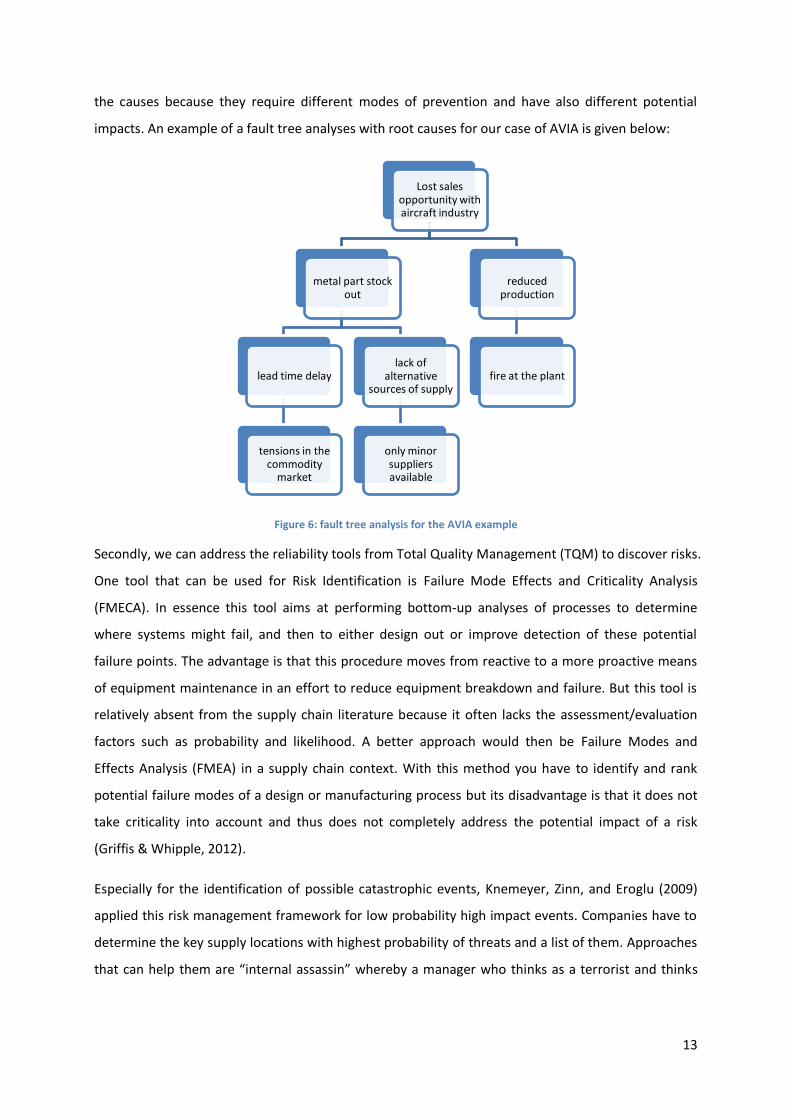
the causes because they require different modes of prevention and have also different potential
impacts. An example of a fault tree analyses with root causes for our case of AVIA is given below:
Figure 6: fault tree analysis for the AVIA example
Secondly, we can address the reliability tools from Total Quality Management (TQM) to discover risks.
One tool that can be used for Risk Identification is Failure Mode Effects and Criticality Analysis
(FMECA). In essence this tool aims at performing bottom-up analyses of processes to determine
where systems might fail, and then to either design out or improve detection of these potential
failure points. The advantage is that this procedure moves from reactive to a more proactive means
of equipment maintenance in an effort to reduce equipment breakdown and failure. But this tool is
relatively absent from the supply chain literature because it often lacks the assessment/evaluation
factors such as probability and likelihood. A better approach would then be Failure Modes and
Effects Analysis (FMEA) in a supply chain context. With this method you have to identify and rank
potential failure modes of a design or manufacturing process but its disadvantage is that it does not
take criticality into account and thus does not completely address the potential impact of a risk
(Griffis & Whipple, 2012).
Especially for the identification of possible catastrophic events, Knemeyer, Zinn, and Eroglu (2009)
applied this risk management framework for low probability high impact events. Companies have to
determine the key supply locations with highest probability of threats and a list of them. Approaches
that can help them are “internal assassin” whereby a manager who thinks as a terrorist and thinks
Lost sales opportunity with aircraft industry
metal part stock out
lead time delay
tensions in the commodity
market
lack of alternative
sources of supply
only minor suppliers available
reduced production
fire at the plant
14
about how to carry out threats against a firm and the “wheel of crises” whereby certain possible
consequences of crises are discussed where the wheel stops.
Risk Assessment, evaluation and prioritization
Risk analysis or the assessment of a risk event is nothing else then weighting or measuring the
subjective probability of a risk event and the potential consequences of it from the viewpoint of the
enterprise. In a later stage companies should tailor the responses and strategies will be taken to
reduce either their probability or their consequences.
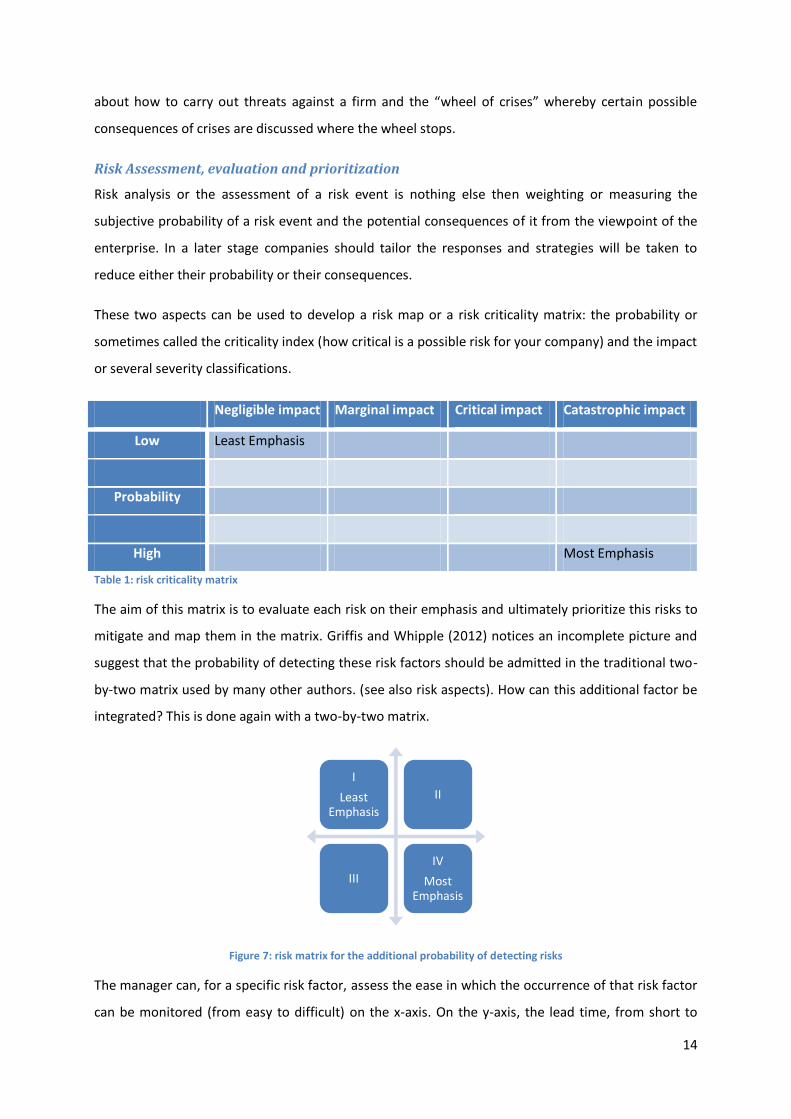
These two aspects can be used to develop a risk map or a risk criticality matrix: the probability or
sometimes called the criticality index (how critical is a possible risk for your company) and the impact
or several severity classifications.
Negligible impact Marginal impact Critical impact Catastrophic impact
Low Least Emphasis
Probability
High Most Emphasis
Table 1: risk criticality matrix
The aim of this matrix is to evaluate each risk on their emphasis and ultimately prioritize this risks to
mitigate and map them in the matrix. Griffis and Whipple (2012) notices an incomplete picture and
suggest that the probability of detecting these risk factors should be admitted in the traditional two-
by-two matrix used by many other authors. (see also risk aspects). How can this additional factor be
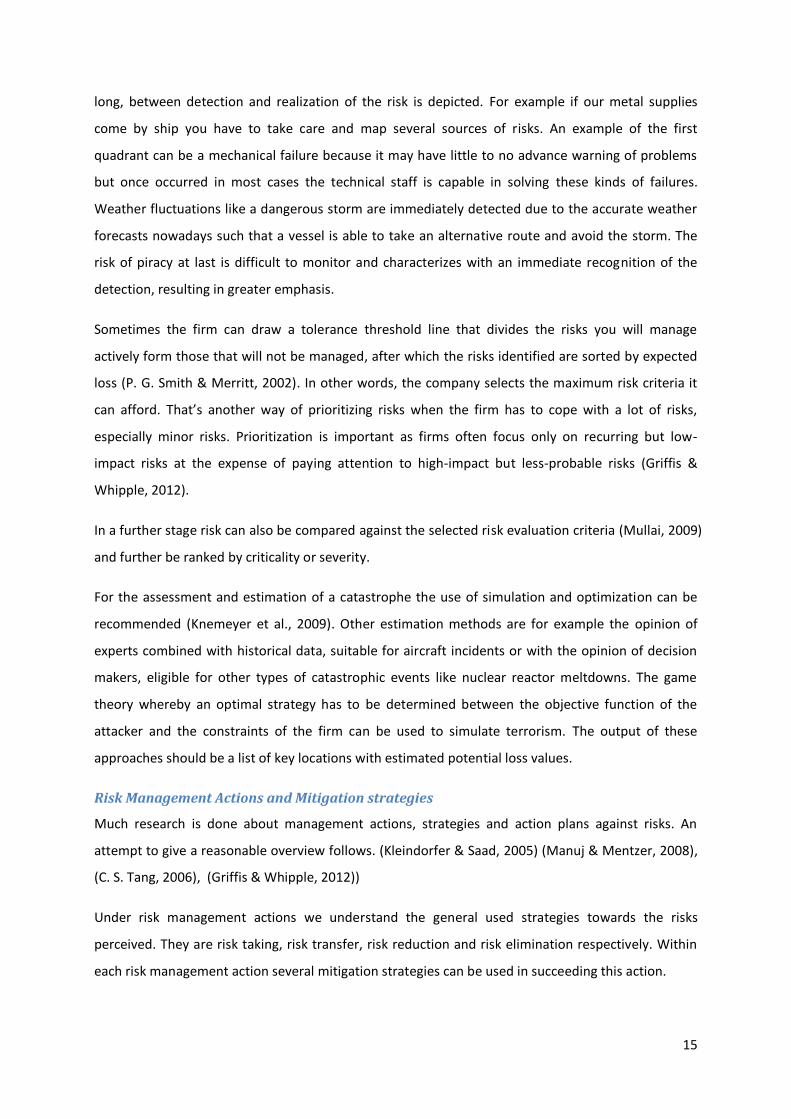
integrated? This is done again with a two-by-two matrix.
Figure 7: risk matrix for the additional probability of detecting risks
The manager can, for a specific risk factor, assess the ease in which the occurrence of that risk factor
can be monitored (from easy to difficult) on the x-axis. On the y-axis, the lead time, from short to
I
Least Emphasis
II
III
IV
Most Emphasis
15
long, between detection and realization of the risk is depicted. For example if our metal supplies
come by ship you have to take care and map several sources of risks. An example of the first
quadrant can be a mechanical failure because it may have little to no advance warning of problems
but once occurred in most cases the technical staff is capable in solving these kinds of failures.
Weather fluctuations like a dangerous storm are immediately detected due to the accurate weather
forecasts nowadays such that a vessel is able to take an alternative route and avoid the storm. The
risk of piracy at last is difficult to monitor and characterizes with an immediate recognition of the
detection, resulting in greater emphasis.
Sometimes the firm can draw a tolerance threshold line that divides the risks you will manage
actively form those that will not be managed, after which the risks identified are sorted by expected
loss (P. G. Smith & Merritt, 2002). In other words, the company selects the maximum risk criteria it
can afford. That’s another way of prioritizing risks when the firm has to cope with a lot of risks,
especially minor risks. Prioritization is important as firms often focus only on recurring but low-
impact risks at the expense of paying attention to high-impact but less-probable risks (Griffis &
Whipple, 2012).
In a further stage risk can also be compared against the selected risk evaluation criteria (Mullai, 2009)
and further be ranked by criticality or severity.
For the assessment and estimation of a catastrophe the use of simulation and optimization can be
recommended (Knemeyer et al., 2009). Other estimation methods are for example the opinion of
experts combined with historical data, suitable for aircraft incidents or with the opinion of decision
makers, eligible for other types of catastrophic events like nuclear reactor meltdowns. The game
theory whereby an optimal strategy has to be determined between the objective function of the
attacker and the constraints of the firm can be used to simulate terrorism. The output of these
approaches should be a list of key locations with estimated potential loss values.
Risk Management Actions and Mitigation strategies
Much research is done about management actions, strategies and action plans against risks. An
attempt to give a reasonable overview follows. (Kleindorfer & Saad, 2005) (Manuj & Mentzer, 2008),
(C. S. Tang, 2006), (Griffis & Whipple, 2012))
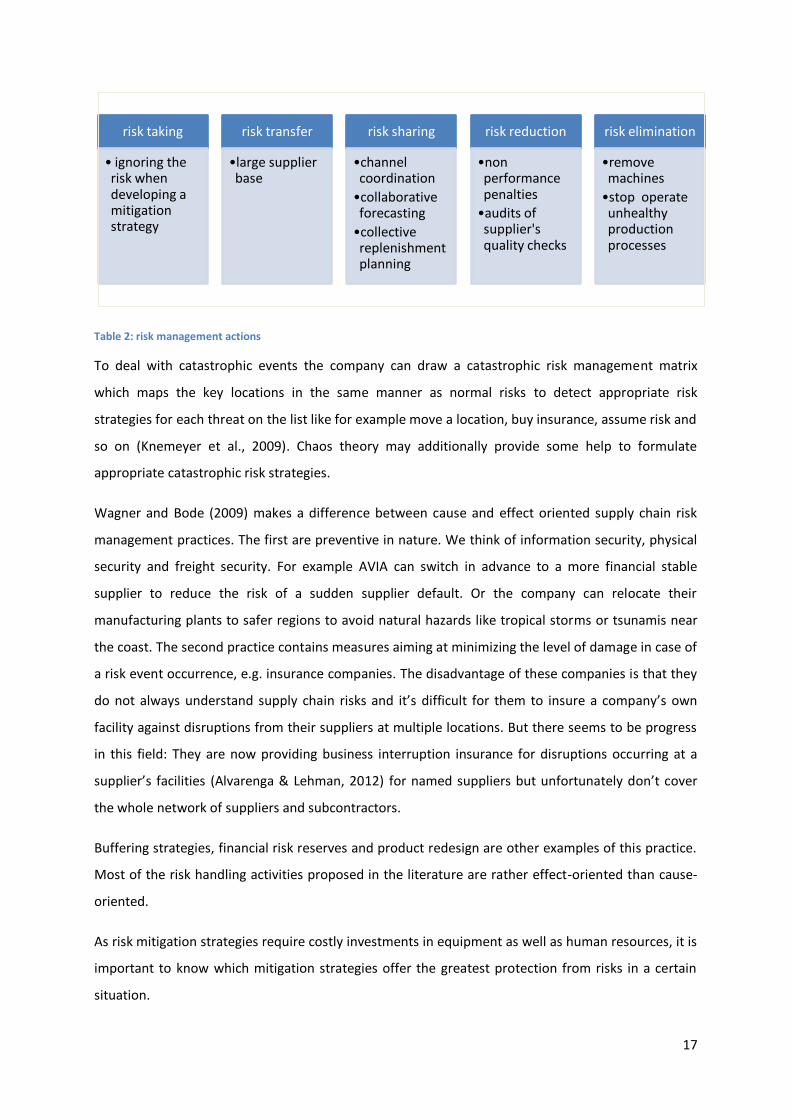
Under risk management actions we understand the general used strategies towards the risks
perceived. They are risk taking, risk transfer, risk reduction and risk elimination respectively. Within
each risk management action several mitigation strategies can be used in succeeding this action.

16
Firstly managers can choose to take the risk. Reasons therefore can be that the risk may be perceived
to be low and the company is willing to accept the risk because of very little consequences for the
firm. According to two German researchers, during the financial crises times, a lot of companies
accepted their risks in this country. This was more the case with manufacturing companies. But after
the crisis these companies shifted towards a more comprehensive approach of risk mitigation. This is
in contrast with service companies who despite the crisis stayed to perform more risk acceptance
strategies (Blome & Schoenherr, 2011).
Alternatively, managers can opt to transfer their risks from one company to another or subdivide
their risks over several companies. This may reduce the total risk in the network if the company takes
the risk can cope with it better than the company transferring it resulting in having a large supplier
network. But the downsides of this risk are the high switching and administrative costs and their
availability when changing from supplier. These are therefore part of transaction-specific
investments. Furthermore it may decrease opportunities to achieve economies of scale.
Furthermore risk can be shared in contracts with the intention of better coordination with channel
partners, collaborative forecasting and collective replenishment planning which increase supply chain
visibility and encourages further analysis of individual risks. They can be managed generally by
developing a common network strategy, sharing best practice modes of action and contract policies.
Moreover, several situations exist that there might be some risk but the company takes the needed
effort to reduce it as much as possible. A common used mitigation approach could be the use of non-
performance penalties built into contracts. If our metal part supplier doesn’t succeed to deliver the
demanded parts, price reductions will be used as stated in the contract.
Examples of other security mechanisms used to reduce risk include monitoring techniques, such as
audits of supplier’s quality checks, inspections of random materials, and tracking of key performance
indicators (KPI’s).
At last, risk elimination may be appropriate when the firm cannot live further with this risk and must
be completely discarded. AVIA decided to quit assembling their aircraft parts with that old machine
that produces much defects.
Sometimes choosing an appropriate risk strategy means changing current operating models or
practices. This means that you systematically review your ‘inventory’ of risk procedures and controls
with the aim to improve risk management practices. An example is the centralized versus localized
approach of manufacturing to mitigate risks and increase benefits.
17
Table 2: risk management actions
To deal with catastrophic events the company can draw a catastrophic risk management matrix
which maps the key locations in the same manner as normal risks to detect appropriate risk
strategies for each threat on the list like for example move a location, buy insurance, assume risk and
so on (Knemeyer et al., 2009). Chaos theory may additionally provide some help to formulate
appropriate catastrophic risk strategies.
Wagner and Bode (2009) makes a difference between cause and effect oriented supply chain risk
management practices. The first are preventive in nature. We think of information security, physical
security and freight security. For example AVIA can switch in advance to a more financial stable
supplier to reduce the risk of a sudden supplier default. Or the company can relocate their
manufacturing plants to safer regions to avoid natural hazards like tropical storms or tsunamis near
the coast. The second practice contains measures aiming at minimizing the level of damage in case of
a risk event occurrence, e.g. insurance companies. The disadvantage of these companies is that they
do not always understand supply chain risks and it’s difficult for them to insure a company’s own
facility against disruptions from their suppliers at multiple locations. But there seems to be progress
in this field: They are now providing business interruption insurance for disruptions occurring at a
supplier’s facilities (Alvarenga & Lehman, 2012) for named suppliers but unfortunately don’t cover
the whole network of suppliers and subcontractors.
Buffering strategies, financial risk reserves and product redesign are other examples of this practice.
Most of the risk handling activities proposed in the literature are rather effect-oriented than cause-
oriented.
As risk mitigation strategies require costly investments in equipment as well as human resources, it is
important to know which mitigation strategies offer the greatest protection from risks in a certain
situation.
risk taking
• ignoring the risk when developing a mitigation strategy
risk transfer
•large supplier base
risk sharing
•channel coordination
•collaborative forecasting
•collective replenishment planning
risk reduction
•non performance penalties
•audits of supplier's quality checks
risk elimination
•remove machines
•stop operate unhealthy production processes
18
A possibility for determining the favorable assessment costs is mapping them against the benefits
from risk mitigation strategies, stated in the framework of Shavell (Kleindorfer & Saad, 2005). This
results in a tradeoff between the cost of acquiring reliable information on risks and the benefits of
mitigation activities. At optimum, a balance must be struck between the marginal costs and benefits
of better risk assessment.
So when do we have to use these mitigation strategies? Risk identification and assessment give a
more specific indication on where to focus the actions. According to Griffis and Whipple (2012),
strategies such as monitoring and risk taking can be used when the likelihood and potential impact
are low and the ability to detect the risk is easy. When selecting a monitoring strategy, either risk
reduction or elimination, you can choose to perform random inspections of products to detect errors
or the risk maybe perceived low so that managers could choose to take the risk. When the opposite
is true, more aggressive risk mitigation strategies like complete risk elimination need to be
considered. Examples here are avoiding dangerous shipping routes or to quit outsourcing and to
manufacture the product in-house to have more product and process control.
If the likelihood of a risk occurring is low and detection may be easy, but the impact of the risk could
be significant, then a postponement strategy may be appropriate if the event causing the risk can be
postponed until more control by the focal firm is established. More control can be established
through vertical integration or imposing contractual obligations on suppliers (Jüttner et al., 2003).
The clearest example of a postponement strategy is producing in modular form. The advantage is
that you can push your semi-finished product from surplus to deficit areas. A company that uses a
postponement strategy is the computer manufacturer Dell. They produce computer hardware in
modular form and let their customers and firms decide which functionalities and properties they
must contain. One can also perform a demand postponement strategy and shift the demand across
products towards their customers (C. S. Tang, 2006) such as a price strategy.
The opposite of postponement is called speculation or also called selective risk taking and is also an
option here. When you perform a speculation strategy, you build up inventory to buffer against the
specific risk.
In cases where impact of a risk may be low, but likelihood of occurrence is high, and the ability to
detect the risk in advance is difficult, a firm may select an imitation strategy and source with the
same supplier because if one firm is exposed to this risk, all firms are.
A flexibility strategy at last could be used when the likelihood of risk occurrence is high and detection
is easy. This could be achieved through multiple sourcing. This strategy requires some adaptation for

19
the company because in a general culture where the focus lies more on core competencies and value
creation more single sourcing relationships have emerged (Blome & Henke, 2009). Strategic
partnerships and alliances are an example of this sourcing strategy. Secondly, companies don’t have
always the choice to choose between single and multiple sourcing. For example, when you have the
choice of only one supplier, because of intellectual protection, then you have a sole sourcing
relationship. This mitigation strategy is sometimes called hedging in a supply chain context because
the company has a globally dispersed portfolio of suppliers.
Another way to provide flexibility is the adoption of standard processes and the use of
interchangeable and generic or modular parts. Finally using simultaneous instead of sequential
processes in key areas as production/distribution speeds up the recovery phase after a disruption.
Figure 8: risk mitigations strategies
Tomlin (2009) determines also the optimal adaptation strategies when probability of supplier and
customer failure is high or low. The used strategies are supplier diversification, contingent sourcing,
which is adding a supplier which is only used in case the main supplier fails to deliver and demand
switching. Diversification should be executed when demand uncertainty increases. Furthermore
when the firm faces an increasing supplier failure probability or faces a high level of risk aversion it
should opt for a contingency strategy. Demand switching is appropriate in case of a low supply risk.
Mitigation strategies can change over time. Suppose company AVIA is plagued with several recalls for
their assemblies because of metal parts affected with corrosion in an earlier stage. Because it isn’t
always easily detectable, current employed postproduction testing is no longer efficient anymore.
Rater than a strategy of control, through frequent testing, a strategy that uses severe penalties with
20
their suppliers for recalled products is more appropriate. Another possibility can be to use an
elimination strategy and look for another supplier.
After the appropriate mitigation strategies are determined, it is recommend developing prevention
and contingency plans to reduce the risk in likelihood of occurrence and impact severity. Wagner and
Bode (2009) suggest that continuity or recovery plans are important tools to ex-ante optimize the
‘firefighting’ after a disruption. These contain for example the radical design of products and the
layout of the manufacturing processes.
As a review to the selected mitigation strategies, some principal criteria can be addressed: efficacy or
the degree to which risks are eliminated, feasibility or the aligning of the right mitigation strategy to
the appropriate risk and efficiency which relates to the cost-effectiveness which was explained above.
Risk Monitoring and Strategy Sharing
Monitoring your risks means identifying the potential increasing trends in their probability or
consequences in the future. After implementing mitigation strategies you will find that some risks
are closed where the risk event has been prevented or other risks remain where the risk event had
happened despite the prevention plans implemented (P. G. Smith & Merritt, 2002). Nowadays
companies can employ real-time risk monitoring capabilities along with techniques to track key
supply chains flows. These tools can speed response in case of numerous unplanned events. A lot of
electronic and high-tech companies, who have very dependent supply chains, have integrated these
tools into their standard supply chain management practices. Improving the traceability of the supply
chain leads to organizations that follow key performance indicators through the entire supply chain
and consequently identify risk not only with their first-tier suppliers but also with their sub-
contractors ((Alvarenga & Lehman, 2012), see also supply chain security).
A company first follows the risk management steps described above and analyzes its network-related
risks internally. In the second phase the partners should identify the areas of risk management that
require joint effort and where risks strategies should be shared.
As enterprises are connected in a network, they are dependent on each other so it can be useful to
share entirely or partially risk management processes and to develop collaborative means to manage
the risk and communicate their views on risks. It is important that the individual risk management
processes are supplemented by a collaborative process. Sheffi (2005) even argues that competitors
should collaborate to control common risks.

21
Moreover in complex network environments mutual risk identification and assessment can be seen
as tools for creating the risk profile of the entire network on the basis of the partners' risk profiles
(Hallikas et al., 2004). The primary tool employed by the Japanese to implement closer supplier co-
ordination and individual supplier development is cross-exchange of staff between buyers and
suppliers.
This requires the benevolence of the enterprise of exchanging inter-organizational information
towards risks & rewards sharing and knowledge transfer. But it gives the firm the possibility to
perform a benchmarking exercise and it generates supply-chain wide visibility of vulnerabilities and it
should give the firm incentives to identify and implement disruption management systems.
Conclusion
Now that we have briefly described the risk management process framework, one can argue of its
need. As risk mitigation strategies require costly investments in equipment as well as human
resources, it is important to know if these strategies pay off towards risks of all kind. As Jüttner et al.
(2003) noted, there is a supply chain trade-off decision between delivering high customer value and
managing possible risks. A trade-off between extra risk mitigation costs and less costs of delivering
high quality and on-time products as a main principle of supply chain management.
Kleindorfer and Saad (2005) investigate if investments in risk management activities yield towards
frequency or severity of accidents. With the use of variables like regulatory programs, facility
characteristics and community demographics, they determined whether observed accidents in the
chemical sector decreases with the use of these risk programs as mediator variables as a
consequence of more severe regulatory programs, more hazardous facility characteristics or the
financial structure of the company. The investigation indeed found evidence of this relationship.
Dani (2009) suggests this risk management framework must be an iterative process and should not
stop with one investigation of risk but instead repeat the exercise to study new issues and risks
identified after the analysis of the event. Furthermore this exercise must be aligned at the strategic
level of the company and according to the strategic objectives to have a clear understanding.
Concluded, it is important to update the possible risk sources and strategic objectives in line with the
risk event or mitigation strategies that may be adapted according to possible new discovered risk
issues (Dani, 2009). We will further see that the adoption of a risk management strategy will foster
the use of a proactive supply chain approach. Mullai (2009) takes it a step further and claims that the
process can start at any point. The major steps of the framework (risk analysis, evaluation and
mitigation) are interactive, change-responding, can be accomplished simultaneously and are aligned
through risk communication (Mullai, 2009).

22
2.2 Supply Chain Management
The first definition of the supply chain management is dated from the early 1980’s and compromises
the following:
“a ‘standard’ supply chain is a system compromising of materials, goods and information (including
money), which pass within and between organizations, linked by a range of tangible and intangible
facilitators, including relationships processes, activities and integrated (information) systems” (Peck,
2006)
While our approach is not to give a full overview of the supply chain with all his aspects, we will
nevertheless give you some information of some practical aspects in this domain that can be linked
or have relationships with the risk management domain.
Bullwhip effect
An important issue for the supply chain is that you have to take into account the major consequences
of the Bullwhip effect. Essentially, the bullwhip effect depicts the phenomenon in which the orders
exhibit an increase in variability up the supply chain, even when the actual customer demands were
fairly stable over time (Sterman 1989; (C. S. Tang, 2006). Cisco systems Inc. wrote off 2.5 billion in
inventory due to a lack of communication among its downstream supply chain partners (Spekman
and Davis, 2004(C. S. Tang, 2006). The increase in variability of the orders up the supply chain can
cause many problems for the upstream partners including higher inventory, lower customer service
level, inefficient use of production and transportation capacities, etc. The more distance between
suppliers and the final consumer in the supply chain, the more these demand changes are
compounded (Fine 1998; Lee, Padmanabhan, and Whang 1997(C. S. Tang, 2006). In order to mitigate
the bullwhip effect, one needs to identify the root causes (C. S. Tang, 2006) which can be done in the
first step, risk identification, of the risk management process.
Secondly, many companies have switched from “local” suppliers to “low cost” and often distant
suppliers on the basis of overhead cost optimization, without considering the cost of risks caused by
this strategic change. Larger companies now buy from smaller suppliers in very remote areas of the
globe. The extended supply chain now has many additional points of potential failure, enlarging the
bullwhip effect and requiring new approaches to risk management. Companies face longer logistics
lead times as well as new and unfamiliar risk profiles encompassing natural disasters, epidemics, and
social, political or monetary instability (Alvarenga & Lehman, 2012).
23
An agency theory perspective
The agency theory perspective justifies the differences in the objectives and risk preferences of the
two parties: the principal (purchasing organization) and agent (suppliers), as well as information
asymmetries. Both parties undergo an agreement with risk sharing (Zsidisin & Ellram, 2003).
The aim to consider the relationship in this perspective is to reduce the purchasing firm’s risk of
moral hazard and adverse selection. The first means the risk of the lack of the supplier, aware of not
by the purchaser, to lever the agreed upon effort to meet customer demand. Adverse selection
means the inaccurate assessment or misrepresentation form the purchaser of the sometimes
unknown supplier abilities to meet customer requirements (Zsidisin & Ellram, 2003). An example of
moral hazard is the unwillingness to further invest in appropriate infrastructure needed to produce
the metal parts for AVIA. An example of the latter is that AVIA, unaware of the major investments in
new metal production equipment, keeps further purchasing the parts from old machinery that are
produced with minor quality.
In essence, suppliers and buyers have to be aware of opportunistic behavior risk. This comes down to
the breaking of their mutual informal agreements & contracts between the partners within the
supply network in the pursuit of competitive advantage and profit (Seiter, 2009). The author
proposes action programs like more communication quality, better partner selection and mutual
sharing of cost accounting information to reduce opportunistic behavior directly or indirectly through
reduced information asymmetry.
Make-or buy decision
Don’t try to force the manufacturing of complementary assets in-house when you can outsource
particular needed competences in a more cost-advantageous way. For many companies, “make or
buy” decisions have been chosen in favor of buying, not making. While this reduces manufacturing
overhead costs, companies lose oversight of key governance and management competences and
strategies. As a consequence this might introduce unknown (new) risks into the supply chain.
Periodic risk rebalancing is therefore essential (Alvarenga & Lehman, 2012).
Outcome-based versus Behavior-based management techniques
In order to align the objectives of both agents and principals several management techniques or
practices are available. These can be split in two categories (Celly & Frazier, 1996; Zsidisin & Ellram,
2003).
Outcome-based management techniques address the importance of coordination of outcomes and
results such as sales growth or sales in relation to targets. According to Zsidisin and Ellram (2003), the

24
use of buffer oriented techniques is an example of that group. Inventories can be held either by the
purchasing firm resulting in internal safety stock or by suppliers which is supplier-managed inventory,
or both. Rather than reducing the likelihood of a harmful event, firms employ buffers to reduce the
disruptive effect of supply risk events. Therefore this approach is short-term oriented.
Behavior based management techniques addresses behaviors such as customer education activities
or selling techniques with distributers from the supplier personnel thereby signaling important
objectives and suggesting specific distributor actions (Celly & Frazier, 1996). It focuses on processes,
emphasizing ‘task and activities” that lead to a reduction in supply risk and is therefore long-term
oriented.
The findings of Celly and Frazier (1996) were that supplier personnel rely too much on outcome-
based efforts when coordinating relationships with distributors. Zsidisin and Ellram (2003) on the
other hand found that there exists a partially positive relationship for behavior techniques with
perceived supply chain risk and this was not supported for buffer oriented techniques. The
implementation of buffers is done regardless of the extent of perceived supply risk.
Although each of the efforts has its downsides, outcome-based may be sometimes inappropriate in
some situations and behavior-bases may be sometimes costly to the firm. An emphasis solely on
maintaining buffers to manage supply risks can harm business profitability due to capital devoted to
inventories and Celly and Frazier (1996) find the risk of demand fluctuation is being positively related
to behavior-based management efforts. On the other hand buffers give you a form of assurance and
behavior based contracts facilitates communication and mutual goal alignment. An inclusion of the
two efforts will be optimal.
Examples of the management techniques are given below:
Outcome Buffer Behavior
- communication about sales
growth, market share, …
- managing inventory
- supplier certification
- quality management
programs implementation
- target costing
- supplier development
The advantage of supplier certification is that they reduce the need for the purchasing organization
to conduct time-consuming inspections. Implementation of quality management programs is also an
25
option but certification improves already the abilities of the supplier to satisfy the quality
expectations of the purchasing firm. Also target costing is interesting where supplier and purchaser
determine ways to drive cost out of its products. At last supplier development can meet the
purchasing organization’s short or long-term supply needs.
Behavior-based efforts may be predominant in franchise channel systems because inter-firm
interaction should be relatively high and relationship termination is more difficult. In conventional
channel systems, outcome-based efforts may be predominant because of the need to keep
coordination costs down. In addition we will find more buffer-oriented approaches within the use of
transactional supplier relationships whereas the use of behavior outcome-base approaches is more
adopted with cooperative supplier relationships (Blome & Henke, 2009).
Making your supply chain redundant versus flexible
According to Sheffi and Rice Jr (2005), the following difference can be made. Redundancy activities
include safety stock, the deliberately use of multiple suppliers or back-up sites. Adding redundancy is
in a way needed for every day’s operability but flexibility strategies on the other hand gives more
competitive advantage in the marketplace. Flexibility can be seen from 3 facets: supply, in-house
conversion and distribution. It aims first of all on correct alignment of the supplier relationship with
the procurement strategy whether you opt for a single supplier or for multiple suppliers or for a
single supplier for each critical part. Secondly using standard processes and having multiple locations
with built-in inter-operability. This allows a firm to operate in another plant once one is disrupted or
the replacement of sick operators. On the customer or distribution side at last, managers face a
choice about which customers to serve first after a disruption. Managers can thereby decide on
several criteria like the vulnerability, the profitability and costs of all customers. Strategies like
postponement or producing semi-finished products, described above, can be used. Managers in
addition are often reluctant to invest in flexibility measures because they don’t see directly or hardly
can estimate the impact on risk mitigation (C. Tang & Tomlin, 2009). So unlike redundancy, flexibility
can also improve the competitive advantage of companies in times without a disruption. Flexibility at
last is indeed important when your company executes a lot of projects because the project manager
must be able to change or redefine several aspects during project execution. Furthermore projects
ensure the coordination between client, contractor and supply chain. Hence, project execution
translates into flexible management. But gaining more on flexibility and consequently efficiency
implies the risk of losing sight and therefore as we have seen before can increase vulnerability.
Companies producing components for the automotive sectors are an example of industries that
focus on project management (Gaudenzi, 2009). It provides a risk management framework that is
also applicable for projects.

26
C. Tang and Tomlin (2009) investigates how much flexibility is needed to mitigate supply chain risk.
On the basis of mathematical models they conclude that only a small amount of flexibility strategies
(e.g. multiple suppliers, flexible supplier contracts, postponement, responsive pricing and flexible
manufacturing processes) is required to mitigate risk.
From their PWC research (Levi et al., 2013), it seems that companies focus on flexibility and customer
service levels on the one hand and other companies on cost reduction and efficiency on the other
hand. It seems according to their study that those former are better coped against risks (appendix).
It’s also worth noting that 80% of the cost-efficient companies face high variable supply chain lead
times given that low variability is mostly one of the key drivers of an efficient operating strategy.
The resilient supply chain
Once gone through all the major risk management steps and approaches the ultimate goal is to build
a resilient supply chain. A supply chain that is both able to absorb disruptions and risks, can
proactively manage its supply chain and sees a possibility to turn the threats of a disruption in a
major advantage can be seen as a resilient enterprise. Resilience is not the same as robustness. The
robustness of a company is the ability to resist from an accidental event, retain to its same stable
situation as it had before and stick to his initial mission (Asbjørnslett, 2009). In contrast resilience
aims at a new stable situation and has the adaptive ability instead of being resistant. Building a
resilient enterprise should be seen from a strategic level and changes the way a company operates
and increases its competitiveness. Two important aspects determine a company’s resilience (Sheffi &
Rice Jr, 2005). First is the market position. Is the industry competitive or has the company a lot of
market power? Else it depends on the responsiveness of the supply chain. When companies are not
so responsive they might risk losing market share. Responsive companies otherwise can increase
market share or once they have a reasonable amount of market power they can lock in their
leadership.
Corporate culture
In the search for the resilient enterprise, it is important not to underestimate the contribution of
culture to an organization (Sheffi & Rice Jr, 2005). Empowering front-line employees to take initiative
and guide actions is a possible step in building a suited corporate culture. Secondly Japanese lean
principles from the Toyota Manufacturing System can be used like Poka Yoke and Hijunka. These
concepts are in essence that one must learn from errors and fixe the root causes. Companies can
minimize the risk of possible disruptions by paying attention to small problems as indications of
major disruptions. At last continuous communication between all layers of a company can foster the
good working of the company.
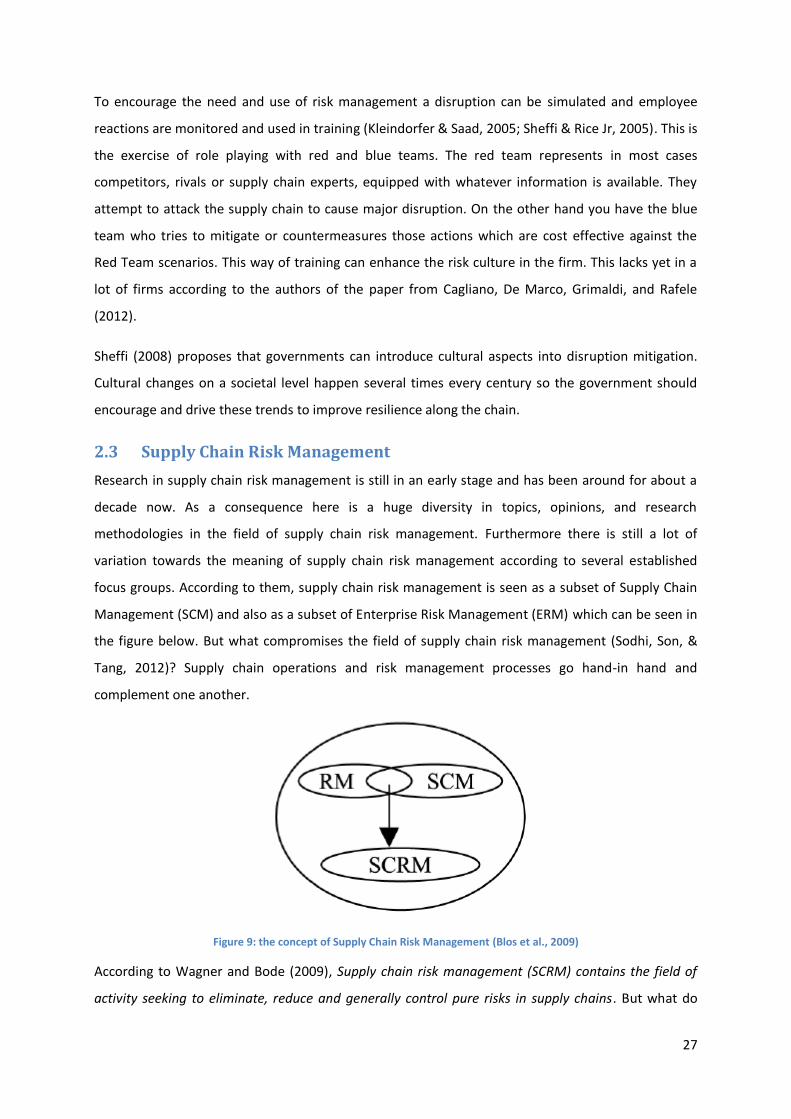
27
To encourage the need and use of risk management a disruption can be simulated and employee
reactions are monitored and used in training (Kleindorfer & Saad, 2005; Sheffi & Rice Jr, 2005). This is
the exercise of role playing with red and blue teams. The red team represents in most cases
competitors, rivals or supply chain experts, equipped with whatever information is available. They
attempt to attack the supply chain to cause major disruption. On the other hand you have the blue
team who tries to mitigate or countermeasures those actions which are cost effective against the
Red Team scenarios. This way of training can enhance the risk culture in the firm. This lacks yet in a
lot of firms according to the authors of the paper from Cagliano, De Marco, Grimaldi, and Rafele
(2012).
Sheffi (2008) proposes that governments can introduce cultural aspects into disruption mitigation.
Cultural changes on a societal level happen several times every century so the government should
encourage and drive these trends to improve resilience along the chain.
2.3 Supply Chain Risk Management
Research in supply chain risk management is still in an early stage and has been around for about a
decade now. As a consequence here is a huge diversity in topics, opinions, and research
methodologies in the field of supply chain risk management. Furthermore there is still a lot of
variation towards the meaning of supply chain risk management according to several established
focus groups. According to them, supply chain risk management is seen as a subset of Supply Chain
Management (SCM) and also as a subset of Enterprise Risk Management (ERM) which can be seen in
the figure below. But what compromises the field of supply chain risk management (Sodhi, Son, &
Tang, 2012)? Supply chain operations and risk management processes go hand-in hand and
complement one another.
Figure 9: the concept of Supply Chain Risk Management (Blos et al., 2009)
According to Wagner and Bode (2009), Supply chain risk management (SCRM) contains the field of
activity seeking to eliminate, reduce and generally control pure risks in supply chains. But what do

28
these risks contain? According to the focus group from the research from Sodhi et al. (2012), risks in
this field should concern majorly with dealing with unknown events or dealing with disruptions or
disasters with low probability and high-impact. This was the opinion of almost the half of the
researchers. Secondly it should concern dealing with risk within supply chain operations, according to
20% of the researchers (Sodhi et al., 2012).
Kajüter, 2003 states: “Supply chain risk management is a collaborative and structured approach to
risk management, embedded in the planning and control processes of the supply chain, to handle
risks that might adversely affect the achievement of supply chain goals.” In this definition the focus is
rather laid on the supply chain. Norrman and Lindroth, 2002 assess the focus of supply chain risk
management more on a practical approach. Supply chain risk management can be defined as, “to
collaboratively apply risk management process tools with partners in a supply chain to deal with risks
and uncertainties caused by, or impacting on, logistics related activities or resources”
Nevertheless this concept is still missing many pieces that have to be found and linked together to
get a comprehensive approach of supply chain risk. SCRM is often not always established as a distinct
function or department in companies. Businesses do not agree on how to integrate these risks into
their decision-making processes, the risk function is typically “headquarters-centered” and there
seems not be a risk regulation that covers the supply chain. However it’s necessary to integrate risk
management into operations, strategic and sales planning.
The work from Jüttner et al. (2003) summarizes well the concept:” “the identification and
management of risks for the supply chain, through a coordinated approach amongst supply chain
members, to reduce supply chain vulnerability as a whole.” And can be summarized using the figure
from them.
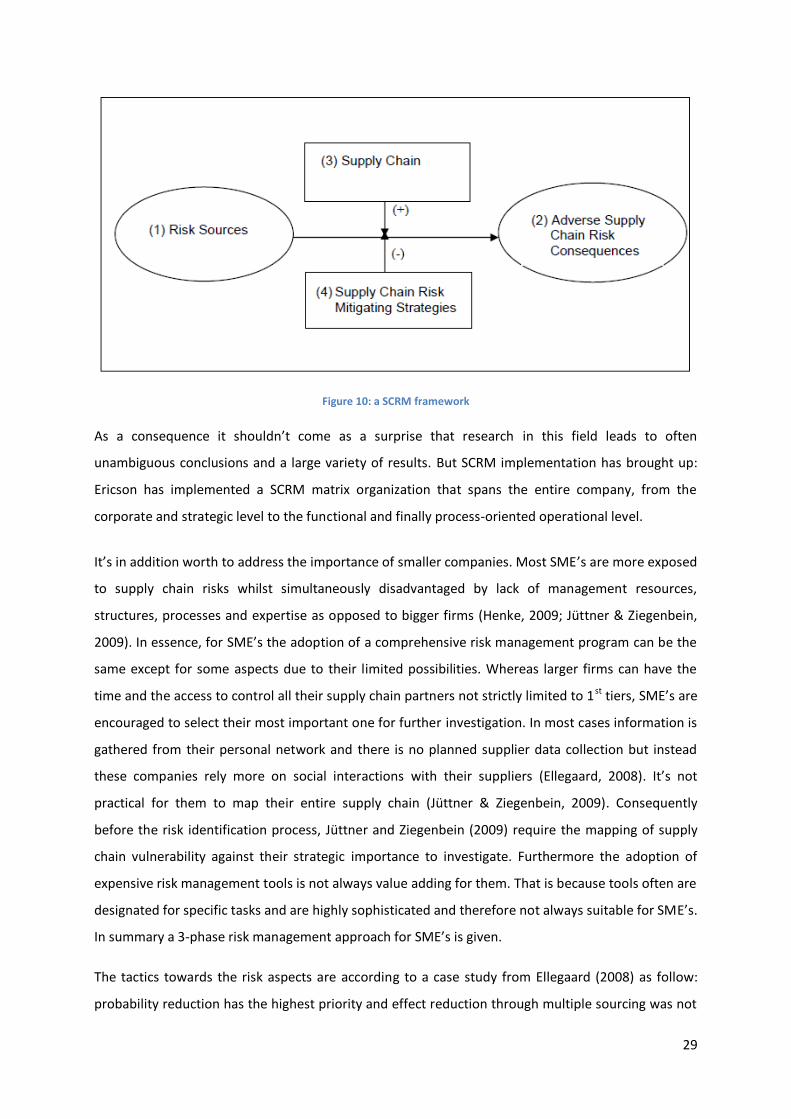
29
Figure 10: a SCRM framework
As a consequence it shouldn’t come as a surprise that research in this field leads to often
unambiguous conclusions and a large variety of results. But SCRM implementation has brought up:
Ericson has implemented a SCRM matrix organization that spans the entire company, from the
corporate and strategic level to the functional and finally process-oriented operational level.
It’s in addition worth to address the importance of smaller companies. Most SME’s are more exposed
to supply chain risks whilst simultaneously disadvantaged by lack of management resources,
structures, processes and expertise as opposed to bigger firms (Henke, 2009; Jüttner & Ziegenbein,
2009). In essence, for SME’s the adoption of a comprehensive risk management program can be the
same except for some aspects due to their limited possibilities. Whereas larger firms can have the
time and the access to control all their supply chain partners not strictly limited to 1st tiers, SME’s are
encouraged to select their most important one for further investigation. In most cases information is
gathered from their personal network and there is no planned supplier data collection but instead
these companies rely more on social interactions with their suppliers (Ellegaard, 2008). It’s not
practical for them to map their entire supply chain (Jüttner & Ziegenbein, 2009). Consequently
before the risk identification process, Jüttner and Ziegenbein (2009) require the mapping of supply
chain vulnerability against their strategic importance to investigate. Furthermore the adoption of
expensive risk management tools is not always value adding for them. That is because tools often are
designated for specific tasks and are highly sophisticated and therefore not always suitable for SME’s.
In summary a 3-phase risk management approach for SME’s is given.
The tactics towards the risk aspects are according to a case study from Ellegaard (2008) as follow:
probability reduction has the highest priority and effect reduction through multiple sourcing was not
30
practiced at all. Also small companies don’t gather much information from their partners that can
help reduce risk.
A company must regularly check their activities in a manner that they fulfill their strategic objectives
dictated by the firm’s vision. A framework that can aid to measure performance is the Balanced
Scorecard of Kaplan and Norton. Their model doesn’t contain only financial objectives but
incorporates also internal, customer and innovative & learning perspectives. When dealing with
supply chain performance, no primary use of financial performance measures is advised (Sheffi &
Rice Jr, 2005).This framework which focuses on performance measurement as a consequence should
be integrated with supply chain risk management. Risk and performance are directly related because
the higher the risk taken the higher the expectation of suitable returns (Sheffi & Rice Jr, 2005). As
more resources and attention is given to supply chain risk management an aligning with performance
management is indispensable.
Besides the electronic multinational Ericsson (Norrman & Jansson, 2004) another company that has
successfully implemented a risk management strategy and accompanying supply chain culture is the
Nisan Motor Company (Schmidt & Simchi- Levi, 2013, (Levi et al., 2013)). After serious harmful
problems due to an earthquake and Tsunami in Japan, they incur a $ 200 billion loss. “Nissan’s
production capacity was perceived to have suffered most from the disaster compared to its
competitors.” But the company managed to increase their production with 9.3 % in comparison with
an overall decrease with its competitors. How was this company able to manage this?
First they implemented an integrative risk management framework with risk identification as early as
possible, assessment and performed countermeasures against them. Second the plant has
formulated a continuous ready plan with their suppliers. Moreover the team was empowered with
local decision management. In addition the company structured its supply chain as flexible as
possible. At last, there was extended enterprise visibility and warnings to between internal and
external business functions (Levi et al., 2013).
2.4 Supply Chain Security Management
Supply Chain Security Management (SCSM) is defined as “the application of policies, procedures and
technology to protect supply chain assets from theft, damage, or terrorism and to prevent the
introduction of unauthorized people or weapons of mass destruction into the supply chain. Security
practices can be control measures implemented in several processes and certainly at several gates
throughout the supply chain where products arrive (Voss & Whipple, 2009).

31
The difference with Supply chain risk management is the fact that Supply chain security management
focuses more on prevention of contamination, damage or destruction of the supply chain assets and
products by policies, procedures and technologies whereas the former investigates more the
likelihood of outcomes being susceptible to disruptions that can damage the supply chain (Autry &
Sanders, 2009). This paper provides a dynamic capability framework that can be used to implement
security practices. These capabilities include processes, technology and human resources. For
example the use of radio frequency identification is a technology capability. With the use of the
Radio Frequency Identification (RFID) technology and their tracking and tracing capabilities, abilities
rise to identify disruptions quickly. Furthermore sensitive control systems often can identify a
disruption before its cause is apparent.
The management of inventory is an example of a process capability and governmental security
initiatives are human resource capabilities.
The problem with risk mitigation activities, in particular those that don’t start at the place of original
production, is that technical control allows hidden action of participants in the process chain (Mau &
Mau, 2009). Therefore a supply chain wide security control system or management is needed. A
comprehensive control platform is required to manage supply chain security effectively. The goal for
supply chains, those that doesn’t consist of a complex network or single supply chains, is to secure
worldwide and realize complete traceability of all involved products and inputs at all the supply chain
levels resulting in continuous transaction data in both directions, upstream and downstream. To
trace all the necessary information, it is useful to make use of an independent database. In this way
effects on the products of your firm can not be overseen thanks to a centralized data management
system.
The basic thought for implementing security initiatives are basically the same as for the use of risk
mitigation strategies. Advanced or high proactive security initiatives pay off and improve security and
firm performance but most firms have not progressed beyond basic physical security measures such
as infrastructure management and therefore have not derived the service benefits from higher level
security measures (Voss & Whipple, 2009). Consequently this creates a dilemma in an optimal
tradeoff between cost of implementation and efficiency of the initiatives but also for firms that face
greater customer or government requirements. More security improvements sometimes can lead to
a decrease of flexibility and firm performance but aim to create a secure supply chain that maintain
advanced security processes and procedures.

32
2.5 Conclusion
Concluded, risk mitigation measures can be seen and implemented from 3 different levels. The
strategic level which focus on for example alternative suppliers, at the tactical level (e.g. improved
demand forecast) as well as the operational level (e.g. business continuity plans).
Although risk management practices and business continuity planning is left too much to security or
insurance professionals in companies, it should be noted as a strategic initiative and must be
implemented in an integrated risk framework approach. As a consequence this risk practice helps to
build a resilient enterprise and supply chain.

33
3 Conceptual framework
The goal of this work is to determine how several environmental aspects (e.g. market size, bargaining
power) may have an impact on the managers or the firm’s risk perception by which we mean the
probability of risk and their impact. Furthermore we investigate if these perceptions might influence
risk mitigation strategies performed by the firm. In particular we will make the distinction between
more proactive versus more reactive performance towards risks. At last we want to examine if
certain mediators and moderators do play a role in selecting that particular strategy. On the one
hand we dive into how varied a firm does perform supply chain management practices and their
choice towards risk management. On the other hand we look at the design and the complexity of the
supply chain and see if any conclusions can be made with this aspect towards risk. While previous
research (Ellis, Henry, & Shockley, 2010) has determined the impact of environment on risk
perception, investigation towards the use of proactive versus reactive management is still a gap in
the literature that hasn’t been explored yet. Instead Ellis et al. (2010) investigated overall supply
disruption risk towards the search of alternative sources of supply.
3.1 Environment
Several papers deal with the environment as an important factor for the determination of risk (Ellis
et al., 2010) (Ritchie & Brindley, 2009). Ellis et al. (2010) chooses also for the integration of some
environmental factors like technological uncertainty and market thinness but also for some company
specific characteristics like item customization and item importance. The environmental construct
here proposed is as follow:
PEST-analysis
An exercise for the company in determining the strength of the environment and the external factors
can be the adoption of a so called PEST analysis. This analysis contains the macro-environmental
aspects of Political forces, Economic forces, Social forces and Technological forces. It’s an
environmental scanning component that can help you to determine trends outside the venture. The
purpose is to detect driving factors and uncertainties.
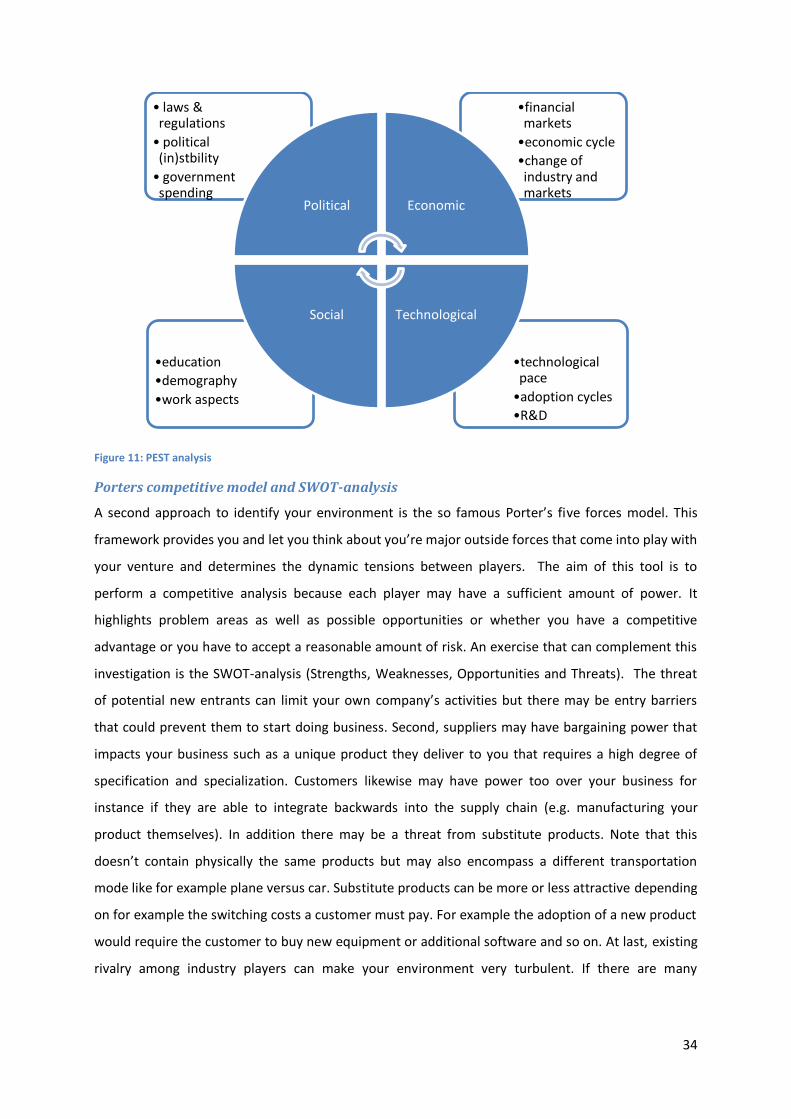
34
Figure 11: PEST analysis
Porters competitive model and SWOT-analysis
A second approach to identify your environment is the so famous Porter’s five forces model. This
framework provides you and let you think about you’re major outside forces that come into play with
your venture and determines the dynamic tensions between players. The aim of this tool is to
perform a competitive analysis because each player may have a sufficient amount of power. It
highlights problem areas as well as possible opportunities or whether you have a competitive
advantage or you have to accept a reasonable amount of risk. An exercise that can complement this
investigation is the SWOT-analysis (Strengths, Weaknesses, Opportunities and Threats). The threat
of potential new entrants can limit your own company’s activities but there may be entry barriers
that could prevent them to start doing business. Second, suppliers may have bargaining power that
impacts your business such as a unique product they deliver to you that requires a high degree of
specification and specialization. Customers likewise may have power too over your business for
instance if they are able to integrate backwards into the supply chain (e.g. manufacturing your
product themselves). In addition there may be a threat from substitute products. Note that this
doesn’t contain physically the same products but may also encompass a different transportation
mode like for example plane versus car. Substitute products can be more or less attractive depending
on for example the switching costs a customer must pay. For example the adoption of a new product
would require the customer to buy new equipment or additional software and so on. At last, existing
rivalry among industry players can make your environment very turbulent. If there are many
•technological pace
•adoption cycles
•R&D
•education
•demography
•work aspects
•financial markets
•economic cycle
•change of industry and markets
• laws & regulations
• political (in)stbility
• government spending
Political Economic
Technological Social
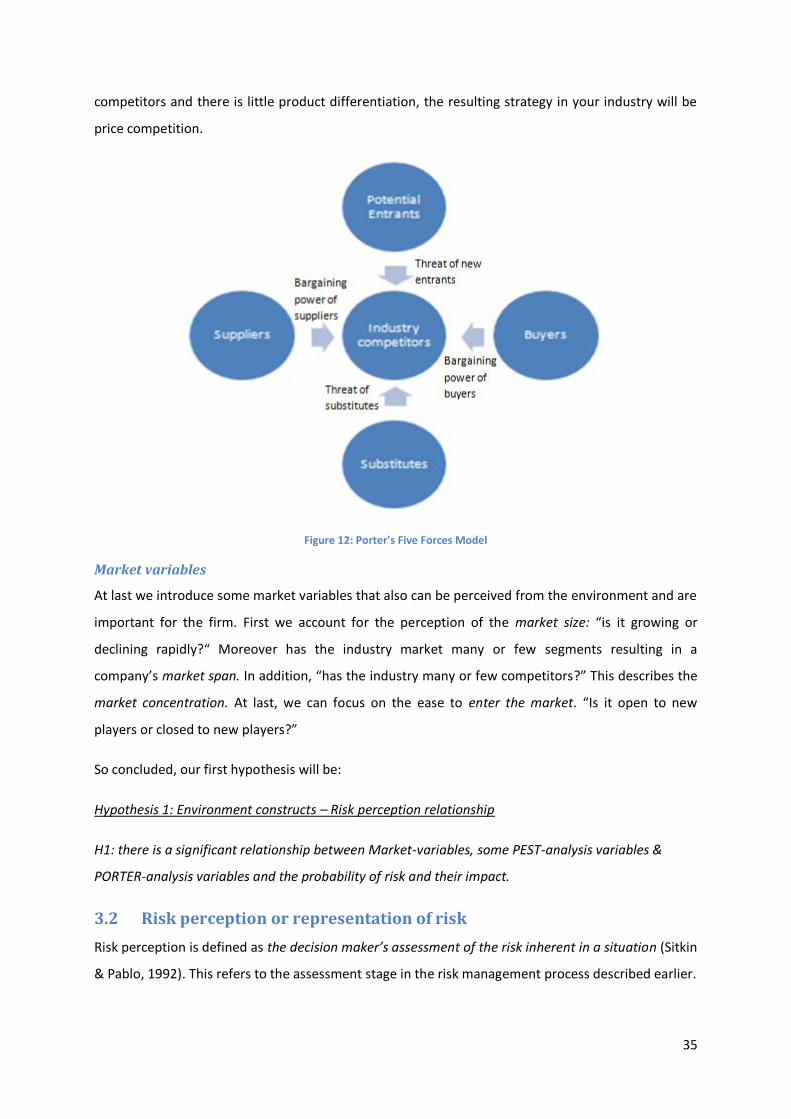
35
competitors and there is little product differentiation, the resulting strategy in your industry will be
price competition.
Figure 12: Porter's Five Forces Model
Market variables
At last we introduce some market variables that also can be perceived from the environment and are
important for the firm. First we account for the perception of the market size: “is it growing or
declining rapidly?“ Moreover has the industry market many or few segments resulting in a
company’s market span. In addition, “has the industry many or few competitors?” This describes the
market concentration. At last, we can focus on the ease to enter the market. “Is it open to new
players or closed to new players?”
So concluded, our first hypothesis will be:
Hypothesis 1: Environment constructs – Risk perception relationship
H1: there is a significant relationship between Market-variables, some PEST-analysis variables &
PORTER-analysis variables and the probability of risk and their impact.
3.2 Risk perception or representation of risk
Risk perception is defined as the decision maker’s assessment of the risk inherent in a situation (Sitkin
& Pablo, 1992). This refers to the assessment stage in the risk management process described earlier.

36
Prior research has already proved the relationship between risk perceptions and risk behavior
although as a mediator between risk propensity and risk behavior (Sitkin & Pablo, 1992).
We will reinvestigate this relationship but consider the perception in both risk probability and risk
impact.
Hypothesis 2: Risk perception – Risk management relationship:
H2a: there is a relationship between the risk perception of risk probability on the choice of pro versus
reactive management.
H b2: there is a positive association between a higher perception of risk impact on proactive as well as
reactive management and the relation on proactive is stronger.
We opt to choose the aspects of risk, impact and probability, from a perception point of view rather
than objective assessments of risk. That is because a manager will take decisions on the basis of his
perceptions of degree of risk and which actions he will do. Risk perception is dependent from several
aspects: as earlier stated risk is dependent on how the problem is framed and the problem domain
familiarity. Furthermore an individual’s propensity towards risk also influences the perception. At last
the homogeneity of the management team and organizational control systems come also into play
(Sitkin & Pablo, 1992).
We represent the risk from 3 perspectives. First from a supplier point of view: “What is the
probability that a key supplier will fail to supply your operations and what will be the impact?”
Secondly, risk perception will be gathered from the own manufacturing operations: ”what is the
probability and the impact that the company’s operations are interrupted and affects your
shipments?” At last probability and effect can be seen from the distribution side: “What is the
probability and impact that a company’s shipment operations are interrupted affecting their
deliveries?”
3.3 Proactive versus Reactive Risk Strategies
The distinction between proactive and reactive risk management can be approached in relation to
their timeframe. Proactive can be seen from an ex-ante and reactive from an ex-post perspective.
But it emphasizes more than solely this.
What is proactive risk strategy actually? Proactive risk management means that you identify risks and
do something about them before they affect your project or your business operations. This is in fact
the use or the implementation of the risk management framework that was introduced and

37
explained in all its facets in the previous chapter. However, this is easier said than done. Many
managers are reluctant to spend time or money on potential problems, since they have plenty of
other problems already. Proactive management of risks is a style that is often foreign to many
Western managers. Companies fail at risk management in general because they fail at one of the two
fundamentals of managing risk well: cross-functionality on the one hand and being proactive on the
other hand. Companies make the mistake to believe that innovation is only in Research &
Development, and that is where most of the risk lies. A lot of companies lack the cross-functionality
capability between departments nowadays. Companies fail at pro-activeness because they wait until
late in the project when risks start occurring and they let risk management lapse and as a
consequence they perform in a reactive manner. So in concrete by proactive we mean for example a
proactive vulnerability analysis or a proactive mitigation strategy or Proactive risk management of
supply risk must be seen as a competitive advantage for the firm.
And what is reactive risk strategy then? Reactive management is the reverse of proactive
management and is the same as firefighting after a disruption. It means that a company waits until
situations are almost hopeless and then saving them miraculously or takes the needed actions to
counter the risks after the damage is observed. Thereafter the company develops prevention and
contingency plans to make the disruptions less severe in the future if those same disruptions or
failures occur (Wagner & Bode, 2009). “Being reactive is the default position when a risk materializes”
(Dani, 2009). So instead of dealing with risks on a day-to-day basis, responding reactive is in fact
being ready when disruptions occur. Activities such as contingency plans that states corrective
actions to resolve undesirable consequences or the accumulation of knowledge and experience that
can be used when the same problems occur in the future are two example of risk management from
a more reactive approach (Ritchie & Brindley, 2009).
An example of a more reactive approach is the concept of Supply Chain Event Management (SCEM)
(Gaonkar & Viswanadham, 2004). Although this offering doesn’t use a suitable risk framework, it
includes supply chain visibility, track and trace and alert messaging which merely address human
operator problems and leave him as the only person to resolve the issue.
One can consider the distinction between Outcome or Buffer oriented strategies and Behavior based
strategies stated earlier already as an indicator in choosing for a more proactive versus reactive risk
strategy. Because when you do for example supplier development or supplier certification you
proactively manage your risks with your suppliers instead of putting buffers in a reactive manner. The
latter is according to Zsidisin and Ellram (2003) not a manner of risk reduction but is a common
approach for every company. Honda focuses on continuous process improvement of suppliers
38
through evaluation in a lot of areas, certification and development (Nelson et al. 1998). Their
emphasis on process improvement has had enormous results on reducing the probability of supply
risk occurrence. The Honda example supports the finding that improving supplier process is a
proactive way to manage supply risk (Zsidisin & Ellram, 2003).
Also the distinction according to Sheffi and Rice Jr (2005), also early stated the difference between
redundancy and flexibility activities that can be projected to the difference between proactive versus
reactive strategies. While some redundancy is part of every resiliency strategy, it represents purely
cost with limited benefit unless it is needed after a disruption. In that regard adding redundancy can
be more seen of a reactive risk approach. Flexibility on the other hand can be justified for a normal
business approach without even taking into account the benefits of risk mitigation strategies and
cost reduction but results from increasing flexibility are difficult to measure from a cost accounting
perspective.
Wieland and Wallenburg (2012) suggest the distinction of Supply chain management practices in the
following manner. Risk management can be done proactively through supporting the robustness of
the supply chain and reactively on the other hand by supporting the agility of the supply chain.
Robustness was explained above. Agility means “the ability of a supply chain to rapidly respond to
change by adapting its initial stable configuration” (Wieland & Wallenburg, 2012). Instead of being
robust, the initial state is adapted which refers to more reactive strategies whereas robustness refers
more to more proactive because of the status-quo policy measures taken in advance. Resilience
previously explained means then the ability of adaption but with the aim to gain a competitive
advantage after the disruption occurs. This can be seen as the cherry on the cake for a firm that is
able to whatever disruption occurs, it can make a positive consequence for the firm with it.
It was found that being agile has a strong positive effect on the supply chain’s customer value but not
directly on business performance while robustness has a strong positive effect on both the business
performance and Supply Chain’s customer value (Wieland & Wallenburg, 2012). Case studies proved
that robustness is important to handle supplier-side risks while agility is necessary to deal with
customer-side risk and therefore the amount of both performances should fit to the firm’s
competitive strategy.
Jüttner et al. (2003) conducted interviews and noticed that “Still, whilst the drivers are recognized as
competitive pressures with risk implications, it appears that the implications are often sorted out on
an ad hoc basis as organizations go along. What seems to be missing is a more proactive approach
where risk implications are anticipated at an earlier stage.’” The aim in this work is to wonder
39
whether companies are more using proactive risk strategies or industries tend to more respond and
recover from disruptions.
We will investigate the relationship between risk perceptions and risk management. Ellis et al. (2010)
draws a similar relationship in their Theoretical Model of Risky Decision Making but instead focus on
the search of alternative sources as management action. Our focus is on the proactive and reactive
risk management strategies.
3.4 Moderators and Mediators
As moderators for our model we selected two major broader categories that deal with supply chain
management namely practices in supply chain management and supply chain complexity and design.
But in order to describe these categories we first draw some general considerations in advance.
First, not every company is equally enthusiastic in sharing their supply chain management practices
or aligning their practices with their major supply chain partners because of confidentially in the
company or risk that the supplier will gain confidential information and the risk of abuse of
knowledge.
Second, in several countries, regulatory or legal authorities can put constraints on both of these
moderators. They can contain supply chain-relevant (trade and transportation) laws and policies.
This can be an important factor of uncertainty to the setup and operation of supply chains. Several
laws and policies include the ability to obtain approvals necessary for supply chain design activities
and supply chain operation practices (Wagner & Bode, 2009).
3.4.1 Supply chain management practices.
Supply chain management practices are for example sharing information with your suppliers or
forming collaborative approaches with the suppliers. Also the practice of system coupling can be
seen as a management practice for the supply chain. The degree of a firm’s system coupling takes
into account both the intensity and extent to which information about demand, capacity, inventory
and scheduling is shared and used by the firm in both directions of the supply chain (Barut, Faisst &
Kanet, 2002).
These are not necessarily the same as risk management practices but can be part of a proactive or
reactive risk management strategy. As explained above, when managers plan to proactive mitigate
risks, choosing different suppliers or sharing risk information with suppliers, can be part of a risk
management strategy. So, we can say that a condition to perform business will be an effective supply

40
chain and their management. But also performing risk management can be added as an extra value
for the firm.
To achieve the company’s business objectives, firms require effective use of integrative supply chain
management practices. These can include information, knowledge and design integration. On the
one hand sharing information between supply chain partners is needed to jointly control risks (as
seen above). But on the other hand it can decrease competitiveness. There can be a leak of
knowledge and a diminishing control about their inflows and outflows (Narasimhan & Talluri, 2009).
Integration with suppliers but also the internal integration and integration with customers prove to
be important drivers for a company’s performance in case of customer satisfaction & competitive
performance (Zhao, Huo, Sun, & Zhao, 2013).
Furthermore Zhao et al. (2013) found out that supply chain risks are negatively related to supply
chain integration. We will investigate a similar relationship namely the effect the firm’s perception of
risk probability and impact has on the choice of conducting several supply chain management
practices.
In fact we examine whether firms who conduct a lot of supply chain management practices will
choose more for risk management strategies and more proactive or more reactive kind of strategies.
Hypothesis 3a: General SCM practices mediator between environment and risk perception
H3a: the relationship of the strength of the environment and the strength of risk perceptions is
increased by the mediator variable general supply chain management practices.
Hypothesis 3b: General SCM practices mediator between risk perception and the risk management
strategies
H3b: the implementation of general supply chain management practices increases the relationship
between the risk perception indicators and the risk management strategies.
Ellegaard (2008) conduct a study in the German automotive industry and found that companies with
high supply chain performance show a higher degree of supply chain risk management but the
relationship can also be interpreted the other way around. Moreover it found a difference between
companies using preventive risk mitigation instruments contrary to those using reactive instruments.
Using the supply chain vulnerability map based on (Sheffi, 2005) as previously explained, Blos et al.
(2009) identified vulnerable impact rates through the four vulnerability quadrants between

41
automotive and electronic companies in Brazil. The automotive industry’s highest problem is the
complex production forecast but they facilitate it through modular production. Electronic companies
on the other hand are more vulnerable because of the high dependence on the Asian market and the
nature of their products.
In the light of the growing trend to act more environmentally friendly and more focus on the
durability of company performances, we will also look at sustainable practices employed through the
supply chain. For example, managers can perform sustainability performance assessments with their
suppliers or they can train their supplier’s personnel in sustainability issues. Thus we will add the
following hypotheses.
Hypothesis 3c: Sustainable SCM practices mediator between environment and risk perception
H3c: Sustainable SCM practices do change the relationship between environmental factors and the
perceptions of risk.
Hypothesis 3d: Sustainable SCM practices mediator between risk perception and risk management
strategies
H3d: there is an effect on the relationship between risk perceptions and management strategies when
taking the sustainable supply chain management practices into account.
3.4.2 Design and complexity of the supply chain
The complexity of a supply chain is a function of their different levels and tiers in the supply chain.
Tightly coupled supply chains are furthermore of uttermost importance because the chain is
characterized by their components wherefore there are few possible substitutions available.
According to Christopher and Lee, 2001 such tighter coupled supply chains are likely more prone to
disruptions. The traditional approach, first introduced by Porter, is the supply chain in its literal
meaning, namely one supplier delivers parts for your own business and you produce your products
that will be distributed towards or directly delivered to your customer(s) that supports a value-
adding creation towards the whole chain.
Figure 13: Supply Chain
Supplier Manufacturer Distributor Customer
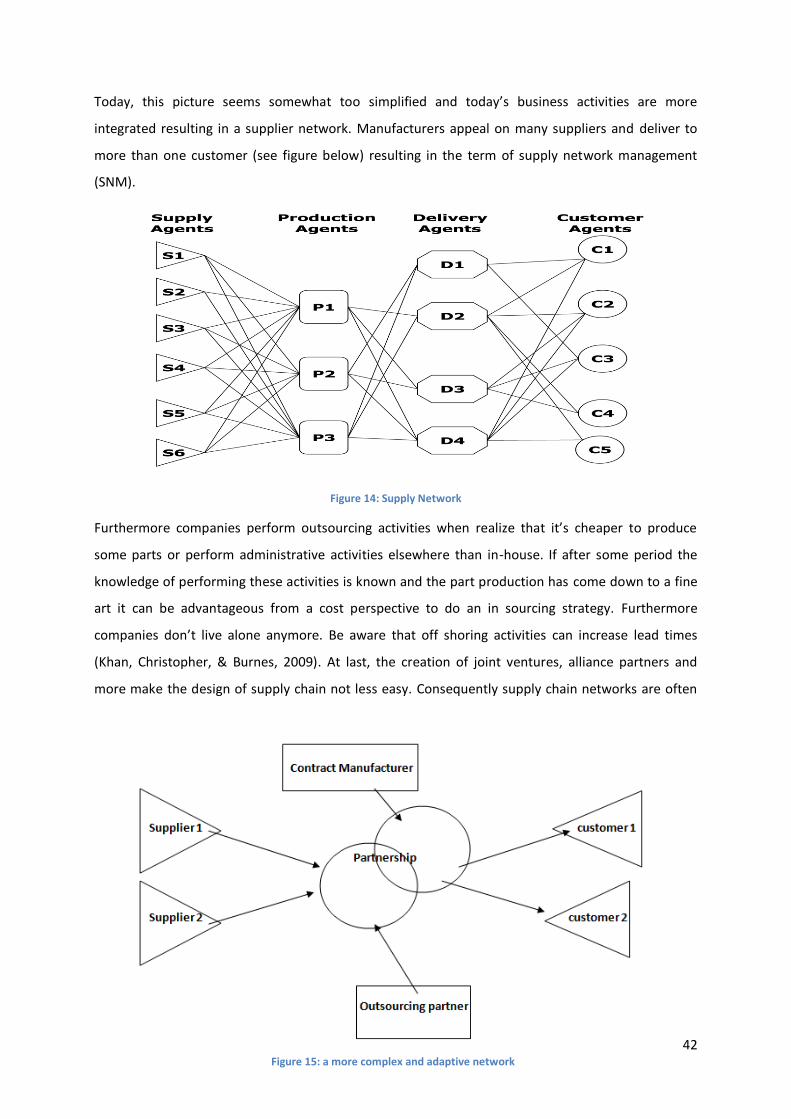
42
Today, this picture seems somewhat too simplified and today’s business activities are more
integrated resulting in a supplier network. Manufacturers appeal on many suppliers and deliver to
more than one customer (see figure below) resulting in the term of supply network management
(SNM).
Figure 14: Supply Network
Furthermore companies perform outsourcing activities when realize that it’s cheaper to produce
some parts or perform administrative activities elsewhere than in-house. If after some period the
knowledge of performing these activities is known and the part production has come down to a fine
art it can be advantageous from a cost perspective to do an in sourcing strategy. Furthermore
companies don’t live alone anymore. Be aware that off shoring activities can increase lead times
(Khan, Christopher, & Burnes, 2009). At last, the creation of joint ventures, alliance partners and
more make the design of supply chain not less easy. Consequently supply chain networks are often
Figure 15: a more complex and adaptive network

43
complex and adaptive but also very dynamic. They are composed of intricate, sometimes
counterintuitive and nonlinear linking elements that include a lot of information and constraints on
each other under which transactions, activities and processes take place (Manuj & Mentzer, 2008).
Although the concept of value network has grown in past years, from a risk perspective managers
should be thinking in terms of networks that create value. Value is transferred from several actors in
a value network. These values which are often not in monetary terms translated can be traded for
other values with other partners. Impact flows constitute the intangible components (information,
knowledge …) shared through partners. Hallikas and Varis (2009) make the comparison with a
business ecosystem theory as a conceptualization, meaning
“The environment beyond the core business & the value network and can be seen as
interdependencies between several business actors and the business environment in which they
operate.”
You should thus determine the dependencies that are most critical to your business and select your
business in your environment that are important enough to make collaborations with in the future.
Several business aspects can be interpreted from a biological view:
Survival from environmental pollution Being head-to-head with technological change
Health of the flora Being able to produce value and share it between members
of the system.
Receive enough air and sunlight A company should position itself in the network where it
can most generate value now and into the future
Ecosystem health regulator Powerful business leaders who create platforms for other
industry players and link other companies
Photosynthesis Business Lifecycle
Dependency from other organisms in
nature
Partnership and complex interplay between competitive
and cooperative business strategy
Table 3: the business from a biological view

44
In figure 16 you find an example of a value network, here for Google. Hallikas and Varis (2009) have
determined the values and impacts with their resulting possible risk through major players in the
Google network. The different players in the network represent nodes where each node represents a
value-adding activity for another node in exchange for some value for the other party. Risk can occur
because partners often transfer unwanted knowledge in close cooperation with each other.
Furthermore the risks in the network are dependent on the behavior of the interconnected systems
of companies. Global supply chains drive up the level of complexity, which drive up the level of risks.
Because of an increasing dynamic complexity and feedback mechanisms these networks have to be
aware of risk and consequently can think of the use of risk management. Giving the importance of
complexity, as you can read a bit further, we also included this facet as a moderator in our network.
It is also important to recognize the indirect relationship because of their increased invisibility these
may pose a higher risk for the head company (Hallikas & Varis, 2009).
The intangible nature of products in the exchanges of the value network increases the complexity of
the supply chain network (Hallikas & Varis, 2009). Less complex supply chains are better able to
manage supply risk and can improve performance. Some complexity reduction measures are
reducing the number of suppliers and serving varied customers through one integrated supply chain
(Hallikas et al., 2004).
Kleindorfer and Saad (2005) addresses the effect of alternative supply chain design options on the
efficiency of the supply chain to various sources of disruption but this research was not yet related to
the use of risk management strategies.
Figure 16: supply information network
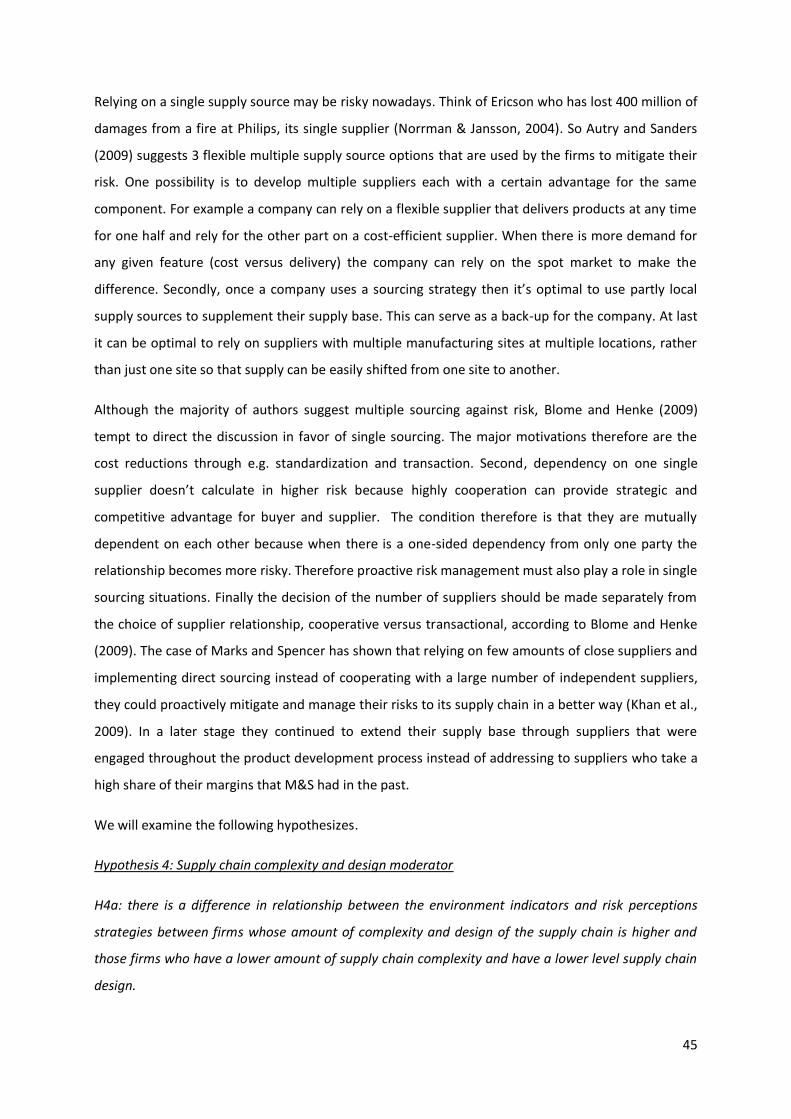
45
Relying on a single supply source may be risky nowadays. Think of Ericson who has lost 400 million of
damages from a fire at Philips, its single supplier (Norrman & Jansson, 2004). So Autry and Sanders
(2009) suggests 3 flexible multiple supply source options that are used by the firms to mitigate their
risk. One possibility is to develop multiple suppliers each with a certain advantage for the same
component. For example a company can rely on a flexible supplier that delivers products at any time
for one half and rely for the other part on a cost-efficient supplier. When there is more demand for
any given feature (cost versus delivery) the company can rely on the spot market to make the
difference. Secondly, once a company uses a sourcing strategy then it’s optimal to use partly local
supply sources to supplement their supply base. This can serve as a back-up for the company. At last
it can be optimal to rely on suppliers with multiple manufacturing sites at multiple locations, rather
than just one site so that supply can be easily shifted from one site to another.
Although the majority of authors suggest multiple sourcing against risk, Blome and Henke (2009)
tempt to direct the discussion in favor of single sourcing. The major motivations therefore are the
cost reductions through e.g. standardization and transaction. Second, dependency on one single
supplier doesn’t calculate in higher risk because highly cooperation can provide strategic and
competitive advantage for buyer and supplier. The condition therefore is that they are mutually
dependent on each other because when there is a one-sided dependency from only one party the
relationship becomes more risky. Therefore proactive risk management must also play a role in single
sourcing situations. Finally the decision of the number of suppliers should be made separately from
the choice of supplier relationship, cooperative versus transactional, according to Blome and Henke
(2009). The case of Marks and Spencer has shown that relying on few amounts of close suppliers and
implementing direct sourcing instead of cooperating with a large number of independent suppliers,
they could proactively mitigate and manage their risks to its supply chain in a better way (Khan et al.,
2009). In a later stage they continued to extend their supply base through suppliers that were
engaged throughout the product development process instead of addressing to suppliers who take a
high share of their margins that M&S had in the past.
We will examine the following hypothesizes.
Hypothesis 4: Supply chain complexity and design moderator
H4a: there is a difference in relationship between the environment indicators and risk perceptions
strategies between firms whose amount of complexity and design of the supply chain is higher and
those firms who have a lower amount of supply chain complexity and have a lower level supply chain
design.
46
H4b: there is a significant difference between high-level designed and more complex supply chain or
networks and low-level designed and less complex supply chains for the relationship between risk
perceptions and risk management strategies.
3.4.3 Continental differences
One can consider if there might be differences between continents. There are certainly differences in
the way Asian countries operate their business as compared to European countries. But reflect these
differences also in terms of risk management and risk perception. In a later section we will
investigate for any differences.
Hypothesis 5: Europe versus Asia moderator
H5a: there is a difference in the relationships for environment and risk perception between the
continents Europe and Asia
H5b: there is a significant difference between Europe and Asia for the relationship between risk
perceptions and risk management.
3.4.4 Comparison with 3 years ago
A lot can change in 3 years, certainly in these sometimes turbulent times. Therefore we will analyze if
there are significant differences in the last 3 year as compared to the current implementation.
Hypothesis 6: Current implementation versus effort in the last 3 years moderator
H6a: there is no significant difference between the policy of 3 years ago and the current
implementation for the risk management programs and supply chain management practices that
were related with risk perceptions for both Europe and Asia.
H6b: there is a difference for the supply chain management practices, general and sustainable, and
risk management strategies, proactive and reactive, that were taken 3 years ago and their current
implementation related to the risk perception of the firm for both complex as simple network designs.

47
3.5 Model diagram
Figure 17: Model diagram
An overview of the variables to investigate and their relationships is given above. The general
framework is composed of only the general “blue” variables. In a later stage we will examine the
intervention of the “green” mediator variables, the SCM practices. In the end we explore the “red”
moderator variables.
48
4 Data Collection
Now that the conceptual model is extensively explained, it is time to gather some data. Data is
needed to test and investigate the relationships between the several constructs in the framework. In
the introduction, I will explain the steps and effort needed that has been done to collect data.
Thereafter some exploratory factor analysis will be done to validate the several items that form the
constructs.
4.1 Introduction
To investigate a conceptual framework, there needs to be data and, more preferable, a lot of data.
So to get this data, I have participated with the International Manufacturing Strategy Survey or IMSS.
It is a research project carried out every 4 years by a global network. This project studies production
and supply chain strategies within the manufacturing and assembly industry through a detailed
questionnaire administered simultaneously in many countries by local research groups. In order to
get worldwide data from this research project I’ve collected industry data for Belgium. This was made
possible in cooperation with the Vlerick Business School.
Through telephone contact with several companies I’ve tried to get the goodwill from manufacturing
managers or plant managers to participate with this research project and their commitment to fill in
the detailed questionnaire. The questionnaire used can be found in the appendix. The purpose was
to address manufacturing companies from the metallic, electronic and automobile sector. More
concrete, the following manufacturing industries have been addressed along with their associated
industry codes:
- 25: fabricated metal products, except machinery and equipment
- 26: computer, electronic and optical products
- 27: electrical equipment
- 28: machinery and equipment not elsewhere classified
- 29: motor vehicles, trailers and semi-trailers
- 30: other transport equipment
To find the Belgian companies from the appropriate industries I made use of the Amadeus Export
Data Belgium Database. I also approached the companies who have participated the previous time
for this research project but some companies didn’t exist anymore and other companies had
changed their manufacturing managers compared to the past. To get the company info and the
managers contact information I consult the Trends Top database. Furthermore I provide an online
possibility to fill in the questionnaire through SurveyMonkey so that the managers don’t have to print

49
out the questionnaire format before filling them manually but instead could fill them online
whenever they will and further continue when they have some time.
4.2 Results For Belgium I could approach 30 companies in total from the 6 sectors stated above. There are 136
operations mangers from these companies contacted. 24 of them weren’t eligible for data
incorporation because the company was going to shut down in less than half a year or the company
didn’t fulfill a manufacturing activity or only performs a distribution function. So 30 out of (136 -24 =)
112 managers participated which results in a response rate of about 26, 79%.
There ain’t no such thing as a free lunch. After sending the Belgium questionnaires I get the
worldwide data from the IMSS. In total 19 different countries have participated through this large-
scale research. Table 4.2 gives you an idea of the Industry Code distribution for Belgium and for the
whole world. Table 4.3 gives the participated country distribution.
Figure 18: proportion of participated industries
Figure 19: proportion of participated countries

50
4.3 Variables and constructs
For the construct of environment we include the following variables:
PORTER PEST Market
Competitive rivalry (A2e)
Threat of substitution (A2g)
Bargaining power of suppliers
(A2h)
Bargaining power of customers
(A2i)
Social pressure (A2k)
Rate of technological change
(A2b)
Environmental pressure (A2j)
Demand fluctuation (SC3a)
Market size (A2a)
Market span (A2c)
Market concentration (A2d)
Market entry (A2f)
Table 4: Environmental constructs
The first five variables can be derived directly from the Porters five forces model that we described
before. As regard the PEST analysis we have items about social force, technological force and
environmental pressure. In addition we included some market variables for the respective industries.
Finally we can pick demand fluctuation as additional variables to complete the construct.
As described before, for probability and impact we have surveyed the following variables:
Probability Impact
Probability of a key supplier failure (R1a1)
Probability of operations failure (R1b1)
Probability of shipment failure (R1c1)
Impact of a key supplier failure (R1a2)
Impact of operations failure (R1b2)
Impact of shipment failure (R1c2)
Table 5: Risk perception variables
For the risk action programs, we have earlier made a distinction between more proactive as well as
more reactive strategies. So we made a distinction between these strategies towards the following
mitigation strategies:
Proactive Risk Management Reactive Risk Management
Preventing operations risk (select a more
reliable supplier, use clear safety procedures,
preventive maintenance) (R2a2)
Detecting operations risk (internal or supplier
monitoring, inspection, tracking) (R2b2)
Responding to operations risk (backup
suppliers, extra capacity, alternative
transportation modes) (R2c2)
Recovering from operations risk (task forces,
contingency plans, clear responsibility) (R2d2)
Table 6: Proactive and Reactive Management
When investigating the questionnaire we could pick several supply chain management practices
surveyed. These can be divided in 2 groups namely practices towards general external action

51
programs as well as practices in relation with sustainability management. The former group analyzes
both these practices for a company’s key suppliers and customers. We will include these variables as
a mediator in our model and see if these variables as a whole strengthen the relationship between
Risk Perceptions and the choice of Proactive versus Reactive management.
General external action programs
Information sharing: (about sales forecast, production plans, order tracking and tracing, delivery
status, stock level) (SC6a2 & SC6f2).
Development of collaborative approaches: (supplier development, risk/revenue sharing, long-term
agreements) (SC6b2 & SC6g2).
Joint decision making: (product design/modifications, process design/modifications, quality
improvement and cost control) (SC6c2 & SC6h2).
System coupling: (vendor managed inventory, just-in-time, Kanban, continuous replenishment)
(SC6d2 & SC6i2).
Developing an international sourcing strategy: (supplier scouting at the international level, open
foreign sales office, develop an international purchasing office or distribution network) (SC6e2 &
SC6j2).
In relation with sustainability management
Suppliers’ sustainability performance assessment: through formal evaluation, monitoring and
auditing using established guidelines and procedures (SMh2).
Training or education for suppliers’ personnel (SMi2).
Joint effort with suppliers to improve their sustainability performance (SMj2).
Table 7: Supply Chain Management Practices
For supply chain complexity and design we will include the following variables in table 12. We will
test if there is a difference between higher complex supply chains or networks and less complex
networks towards the adaptation of more proactive risk management strategies. This construct will
be applied as a moderator in our model. We can roughly divide our variables in 2 broader categories
namely role of the plant and variables in relation to the manufacturing network but we will not use
this distinction in our model.
Role of the plant
Producing in one plant versus producing at multiple plants in the network (G2a).
The role of your plant in the network is stable versus the role of your plant in the network is
revised and changed flexibly if needed (G2d).
To what extent is the plant responsible for the supply chain (procurement, logistics, supplier
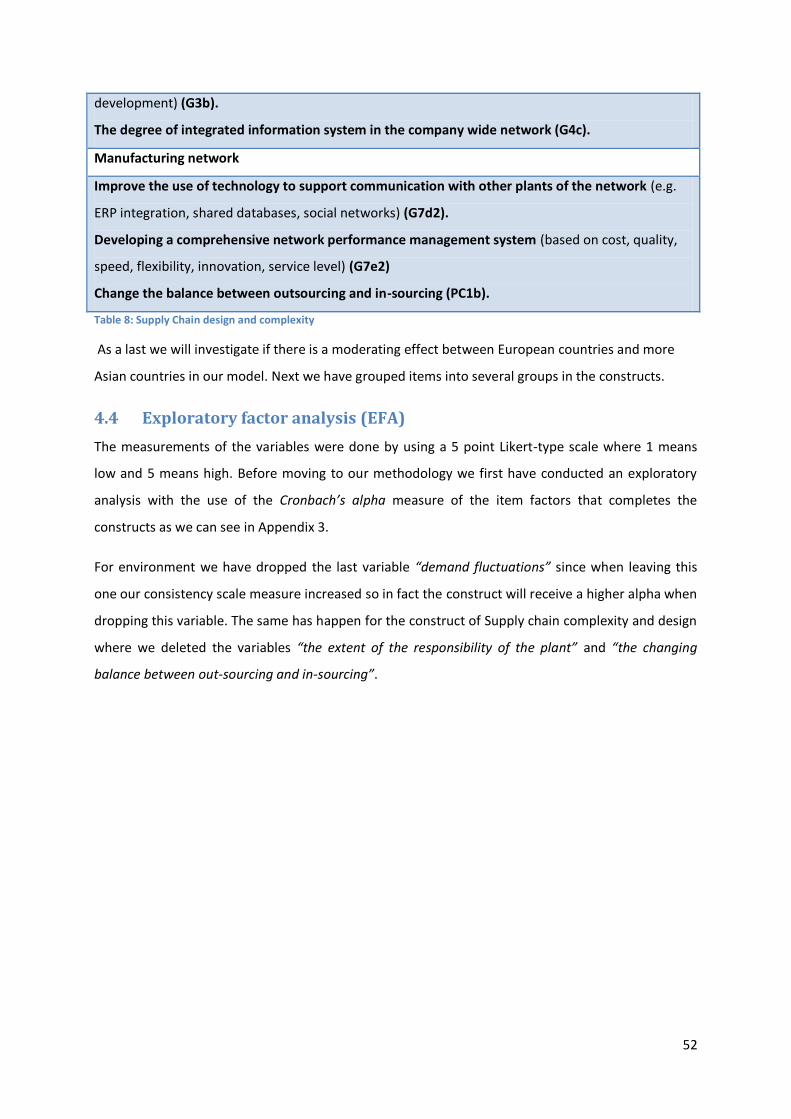
52
development) (G3b).
The degree of integrated information system in the company wide network (G4c).
Manufacturing network
Improve the use of technology to support communication with other plants of the network (e.g.
ERP integration, shared databases, social networks) (G7d2).
Developing a comprehensive network performance management system (based on cost, quality,
speed, flexibility, innovation, service level) (G7e2)
Change the balance between outsourcing and in-sourcing (PC1b).
Table 8: Supply Chain design and complexity
As a last we will investigate if there is a moderating effect between European countries and more
Asian countries in our model. Next we have grouped items into several groups in the constructs.
4.4 Exploratory factor analysis (EFA)
The measurements of the variables were done by using a 5 point Likert-type scale where 1 means
low and 5 means high. Before moving to our methodology we first have conducted an exploratory
analysis with the use of the Cronbach’s alpha measure of the item factors that completes the
constructs as we can see in Appendix 3.
For environment we have dropped the last variable “demand fluctuations” since when leaving this
one our consistency scale measure increased so in fact the construct will receive a higher alpha when
dropping this variable. The same has happen for the construct of Supply chain complexity and design
where we deleted the variables “the extent of the responsibility of the plant” and “the changing
balance between out-sourcing and in-sourcing”.
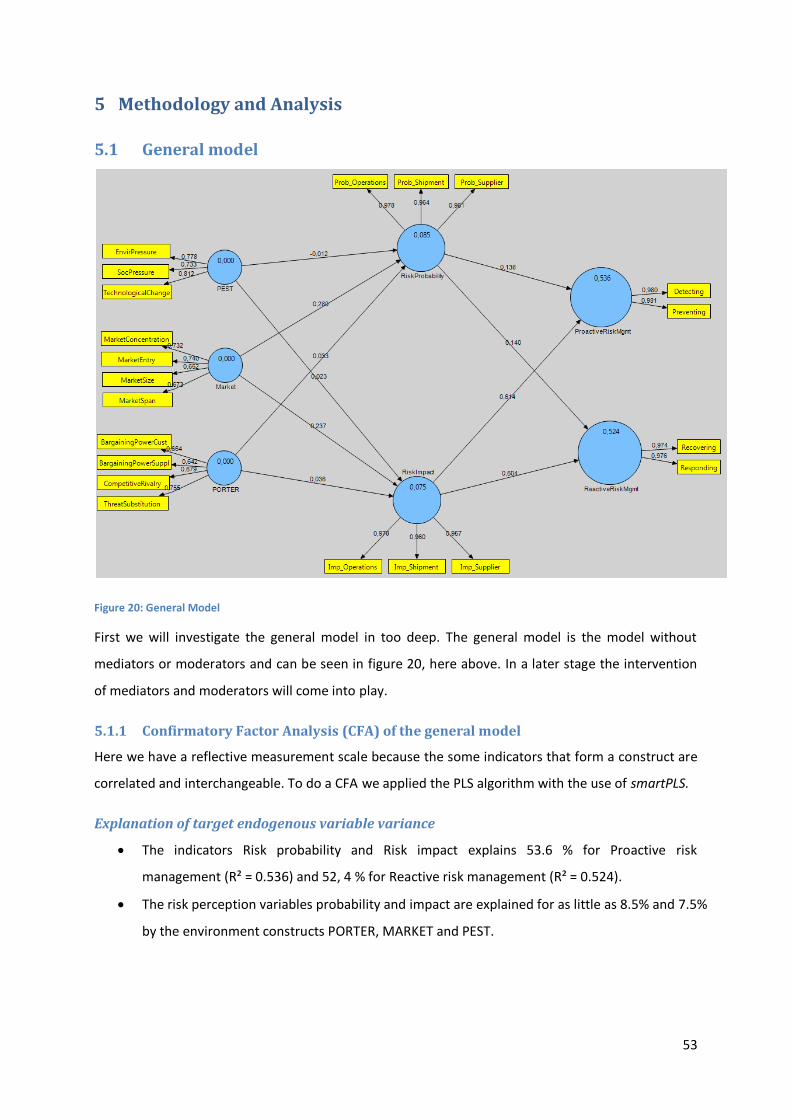
53
5 Methodology and Analysis
5.1 General model
Figure 20: General Model
First we will investigate the general model in too deep. The general model is the model without
mediators or moderators and can be seen in figure 20, here above. In a later stage the intervention
of mediators and moderators will come into play.
5.1.1 Confirmatory Factor Analysis (CFA) of the general model
Here we have a reflective measurement scale because the some indicators that form a construct are
correlated and interchangeable. To do a CFA we applied the PLS algorithm with the use of smartPLS.
Explanation of target endogenous variable variance
The indicators Risk probability and Risk impact explains 53.6 % for Proactive risk
management (R² = 0.536) and 52, 4 % for Reactive risk management (R² = 0.524).
The risk perception variables probability and impact are explained for as little as 8.5% and 7.5%
by the environment constructs PORTER, MARKET and PEST.

54
Inner model path coefficient sizes and significance
When looking at the inner model, we can conclude that the effects of Risk impact (0.614 &
0.604) on the both proactive and reactive strategies will be stronger than the effect of risk
probability (0.138 & 0.140) on them.
All of the indicators of risk perception will be statistically significant on the risk management
strategies.
The market variable will as only environment indicator have a statistically significant
relationship towards both perception and impact. The other environment variables PEST and
PORTER have a factor loading of less than 0.1 and we predict that those variables will not be
significant.
Latent Variable Indicators
Outher model
Loadings
Indicator
Reliability
Cronbach's
alpha AVE
Market MarketConcentration 0,7323 0,53626329 0,6552 0,4903
MarketEntry 0,7395 0,54686025
MarketSize 0,6516 0,42458256
MarketSpan 0,6733 0,45333289
PEST EnvirPressure 0,7782 0,60559524 0,6863 0,6006
SocPressure 0,733 0,537289
TechnologicalChange 0,8118 0,65901924
PORTER BargainingPowerCust 0,6644 0,44142736 0,6433 0,4713
BargainingPowerSuppl 0,6421 0,41229241
CompetitiveRivalry 0,6793 0,46144849
ThreatSubstitution 0,755 0,570025
RiskImpact Imp_Operations 0,9783 0,95707089 0,9632 0,9316
Imp_Shipment 0,9604 0,92236816
Imp_Supplier 0,9567 0,91527489
RiskProbability Prob_Operations 0,9776 0,95570176 0,9659 0,9362
Prob_Shipment 0,964 0,929296
Prob_Supplier 0,961 0,923521
ProactiveRiskMgmt Preventing 0,9796 0,95961616 0,9593 0,9609
Detecting 0,9809 0,96216481
ReactiveRiskMgmt Recovering 0,9743 0,94926049 0,9489 0,9513
Responding 0,9764 0,95335696
Table 9: CFA summary table
Indicator reliability
Indicator reliability shows how reliable the items are that forms the constructs per item. To come to
the reliability indicators, we have to quadrate all the outer model loadings. All the indicators show a
reliability that is higher than 0.4 which is the minimum level required for exploratory research.

55
However, a value that is more than 0.7 is preferred. This is the case for the Risk perception constructs
and risk management constructs which show levels that are higher than 0.9.
Internal consistency reliability
The measurement of the alpha in a Cronbach’s alpha analysis calculates the reliability of the
construct as a whole. This analysis is based on the foundation that every item in a scale must
sufficiently be correlated with any other item from the same scale. For this measurement we use the
Cronbach’s alpha measurement indicator. It is recommended for your scale internal consistency that
Cronbach’s alpha should have a value of 0.6 à 0.7 as a lower limit. We see that this is the case.
However we see that this measure is higher with the risk perception and risk management constructs
than those for the environment.
Convergent validity
Convergent validity means when two or more different methods that measure the same concept
correlate high.
To check for convergent validation we have to look for the AVE measure and we have to assure that
this above 0.5. As we look to our latent variables we see that it’s more or less the case. When we
round up the variables MARKET and PORTER, we see that these have a value of 0.5.
Discriminant validity
MARKET PEST
PORTER
Proactive
RiskMgmt
Reactive
RiskMgmt
Risk
Impact
Risk
Probability
MARKET 0,700214
PEST 0,5927 0,7749839
PORTER 0,561 0,5419 0,68651
ProactiveRiskMgmt 0,2867 0,222 0,1657 0,9802551
ReactiveRiskMgmt 0,2926 0,2286 0,1639 0,9588 0,975346
RiskImpact 0,2707 0,1828 0,1814 0,7277 0,7195 0,9652
RiskProbability 0,2908 0,1713 0,1829 0,6439 0,6376 0,8235 0,9675743
Table 10: Discriminant validiy
Discriminant validation means the opposite of convergent validity and exists when two or more
constructs, measured through one or more methods, correlates low and consequently differ
sufficiently from each other.
To check for discriminant validity we must assure that the square root of the AVE value of each latent
variable, in the table showed in bold, must be higher of the correlation of the latent variable with the
other variables. In practice the figure in bold must be higher than the values in the according row and
column. As we check this for all our variables we see that this is the case for all our construct
56
variables. For example the AVE value of Proactive Risk Management is found to be 0.9609 so its
squared root is 0.9803 which is higher than all the values of its row and its column.
Conclusion
To conclude our confirmatory factor analysis we can say the following. The reliability measures
(indicator reliability and Cronbach’s alpha) are both good. For validity measures we say that the
environment variables Market and PORTER are somewhat weak for the AVE measure but the
discriminant validity of the constructs is ok.
5.1.2 Comparison with alternative frameworks
In general, we could have opted to include market entry also in our PORTER construct and include a
possible economic indicator in the PEST construct (for example MarketSize) but this threatens the
discriminant validity. Indeed, Appendix 5 shows that the discriminant validity is threatened. This is
because the same item is used for more than one construct. Furthermore the AVE variable is bad for
the PORTER construct. At last several indicator reliabilities are also less than 0.4 which is too low.
What reliability and validity should we have if we put all the environmental factors together in one
construct? Appendix 5 provides some figures. A lot of environmental reliability indicators are less
than 0.4 and even less than 0.3 but the Cronbach’s alpha for environment is actually good in
concerning the reliability indicators. For the validity indicator the same conclusion can be made.
Although the AVE is very weak (0.3648) the discriminant validity scores are better, especially for
environment. So according this concept, we’re stuck in between: 1 of 2 indicators of reliability and
validity performs well but the other bad.
The follow figure demonstrates the confirmatory analysis for several constructs. At the bottom we
added 3 other frameworks as well. We can conclude that our general will be the most fitted.

57
indicator
reliability
internal
consistency
reliability
convergent
validity
discriminant
validity
general model Good Good Neutral Good
market entry in PORTER and
market size in PEST and included in
market
Bad Good Bad Bad
all environmental factors Bad Good Bad Good
market entry in PORTER and
market size in PEST but excluded
from MARKET
Bad Bad Bad Good
market entry in PORTER and
market size in MARKET but the
latter excluded from PEST
Bad Good Bad Bad
market size in PEST and market
entry in MARKET but the latter
excluded from PORTER
Good Neutral Neutral Good
Table 11: CFA summary table for comparison with other frameworks
5.1.3 Descriptive statistics
Rivalry among competitors is seen for most firms as relatively high whereas the threat of substitution
is seen as much lower. Furthermore customer bargaining power is much higher than the bargaining
power of suppliers which in fact stress the distributor or customer as an important player.
From the 3 environmental construct, it appears that Market variables are perceived as the most
influenced ones to the firm. The other environmental construct variables are jointly a little less
important but still above a neutral perception of 3. For the entire world, it seems that the threat of a
key supplier failure is the highest possible (2.74) and the risk of shipment operations are the lowest
(2.32). As for probability, the same conclusions can be made for impact. But what is more important
is that the impacts for the three categories are much higher. It means that companies deal with
medium probability risks (+/-2.5) and higher impact (+/-3.5).
It seems that most firms see their risks with a lower probability but with higher impact. It appears
that risk management has increased since 3 years for the four indicators. Preventing has the highest
score and recovering the lowest both for current implementation and 3 years ago.
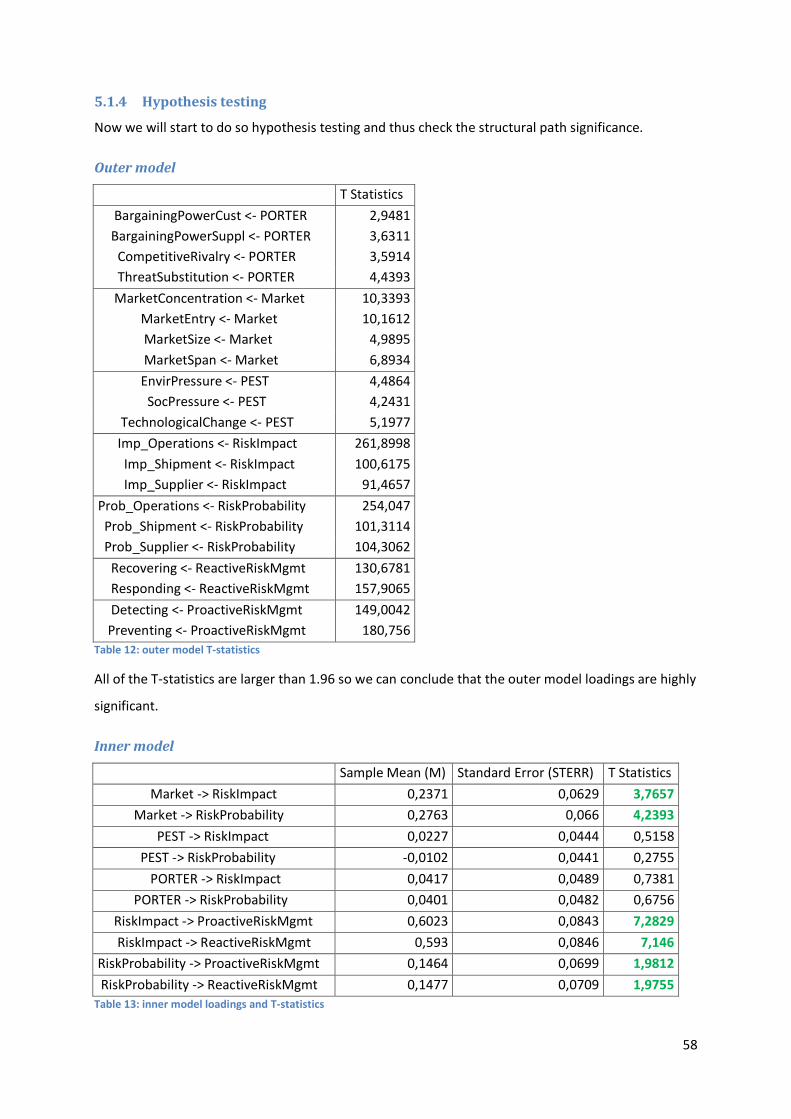
58
5.1.4 Hypothesis testing
Now we will start to do so hypothesis testing and thus check the structural path significance.
Outer model
T Statistics
BargainingPowerCust <- PORTER 2,9481
BargainingPowerSuppl <- PORTER 3,6311
CompetitiveRivalry <- PORTER 3,5914
ThreatSubstitution <- PORTER 4,4393
MarketConcentration <- Market 10,3393
MarketEntry <- Market 10,1612
MarketSize <- Market 4,9895
MarketSpan <- Market 6,8934
EnvirPressure <- PEST 4,4864
SocPressure <- PEST 4,2431
TechnologicalChange <- PEST 5,1977
Imp_Operations <- RiskImpact 261,8998
Imp_Shipment <- RiskImpact 100,6175
Imp_Supplier <- RiskImpact 91,4657
Prob_Operations <- RiskProbability 254,047
Prob_Shipment <- RiskProbability 101,3114
Prob_Supplier <- RiskProbability 104,3062
Recovering <- ReactiveRiskMgmt 130,6781
Responding <- ReactiveRiskMgmt 157,9065
Detecting <- ProactiveRiskMgmt 149,0042
Preventing <- ProactiveRiskMgmt 180,756
Table 12: outer model T-statistics
All of the T-statistics are larger than 1.96 so we can conclude that the outer model loadings are highly
significant.
Inner model
Sample Mean (M) Standard Error (STERR) T Statistics
Market -> RiskImpact 0,2371 0,0629 3,7657
Market -> RiskProbability 0,2763 0,066 4,2393
PEST -> RiskImpact 0,0227 0,0444 0,5158
PEST -> RiskProbability -0,0102 0,0441 0,2755
PORTER -> RiskImpact 0,0417 0,0489 0,7381
PORTER -> RiskProbability 0,0401 0,0482 0,6756
RiskImpact -> ProactiveRiskMgmt 0,6023 0,0843 7,2829
RiskImpact -> ReactiveRiskMgmt 0,593 0,0846 7,146
RiskProbability -> ProactiveRiskMgmt 0,1464 0,0699 1,9812
RiskProbability -> ReactiveRiskMgmt 0,1477 0,0709 1,9755
Table 13: inner model loadings and T-statistics

59
Market variables are significant with a significance level of 5%. The other environmental variables do
not have an effect on the perception of impact as well as probability. This supports Hypothesis 1 for
market variables but not for PORTER and PEST variables. Risk impact perception is strongly significant
on the 5% significance level towards risk management strategies. On the other hand, risk probability
is just not significant on the 5% significance level but certainly on the 10 % significance level. This
supports the hypothesis 2a for risk impact on both risk management strategies but not really
supports the 2b hypothesis.
5.1.5 Multicollinearity
Multicollinearity in fact occurs when two predictor variables are highly correlated. The threat of this
phenomenon is that coefficient estimates can change drastically in response to small changes in the
data. To test the multicollinearity, statisticians often apply the tolerance or Variance Inflation Factor
(VIF) values. The tolerance factor must be higher than 0.2 and the corresponding VIF factor higher
lower than 5. We see that this is the case for all of our constructs.
Coefficientsa
Model
Unstandardized
Coefficients
Standardized
Coefficients
t Sig.
Collinearity Statistics
B
Std.
Error Beta Tolerance VIF
1 (Constant) -7,45E-06 0,023 0 1
Market 0,072 0,041 0,072 1,755 0,08 0,322 3,104
PEST 0,071 0,033 0,071 2,129 0,034 0,487 2,055
PORTER -0,048 0,034 -0,048 -1,389 0,165 0,459 2,181
RiskImpact 0,603 0,041 0,603 14,659 0 0,32 3,122
RiskProbability 0,123 0,041 0,123 2,966 0,003 0,317 3,159
Table 14: Multicollinearity

60
5.2 Input from mediator variables
5.2.1 Framework
Figure 21: framework with general SCM mediator between environment and risk perception (first framework)
In the following section we will analyze the effect of supply chain management practices, both the
general ones and also the efforts towards more sustainability. Because the degree of supply chain
management practices might enforce the relationship between environmental factors and risk
perception but might also strengthen the relationship on this perceptions towards risk management
strategies, we will investigate both mediating effects. The framework where general SCM practices
are mediated between environment and risk perception is given in figure 21. The framework for the
general SCM practices mediated between risk probability/impact and proactive/reactive risk
management is given in figure 22.

61
Figure 22: Framework with general SCM mediator between risk perception and risk management (second framework)
We see that explanation of target endogenous variable variance is increased both for proactive and
risk management when we introduced this mediator to additionally explain the endogenous variable.
Secondly, the inner factor loadings for the relationship between risk probability and both
management strategies have declined below 0.1. We might expect that this relationship will be gone.
In appendix 4 we found both frameworks but instead with the interplay of sustainable SCM practices.
The R² of this framework has slightly augmented to 55.1 % for proactive risk management and 54.2 %
for reactive risk management when considering sustainable practices between risk perceptions and
management.
5.2.2 Confirmatory factor analysis
If we take a look at appendix 6, we found suitable indicators for all of the factors of the mediators.
The determination coefficient R² has increased from 53.6 % and 52.4% to 61.7 % and 60.9% for
proactive and respectively reactive management. We see that for the general SCM there are very
high scores for Cronbach’s alpha and for the AVE measure. Moreover, the indicator discriminates
good with the other constructs. The same can be said for the sustainable SCM.
5.2.3 Descriptive statistics with mediator variables
General supply chain management practices
Also for supply chain management practices we see that all the indicators have increased from 3
years ago. Yet we see a different ranking from all the practices. What is striking is that Supplier

62
collaboration and sharing information with the supplier scores 2 times as the highest. It seems that
firms highlight the importance of sharing information above performing joint actions.
Sustainable supply chain management practices
When we analyzed the descriptive statistics we see that managers performs on average more on
performance assessment with the suppliers and the least on joint efforts with the suppliers with the
aim for more sustainability. What we see is that on average these numbers are somewhat lower than
the general SCM practices. To compare with 3 years ago all these indicators have increased.
5.2.4 Structural path significance
Because we in advance consider SCM practices might mediate both the environment – risk
perception relationship as well as risk perception – risk management relationship, we investigated
both frameworks. Appendix 6 shows the T-statistics for the inner loadings for the first framework.
We consider both the general SCM as well as the sustainable SCM. The outer loadings were all
significant and are not retaken here. No differences occur between general and sustainable SCM.
PORTER variables stay not significant and all market variables stay significant. In addition PEST
variables seem to have now a significant relationship with SCM practices for both mediators and a
significant relationship with probability for the sustainable SCM mediator. What is striking is whereas
risk probability towards risk management was here above yet significant on the 5 % level for the
general model we see that this relationship has been softened.
Also for the second framework we can draw some pretty similar conclusions. The outer loadings are
once again not retaken but they are all significant. We see that the relationship between risk
perceptions and SCM practices as well as their relationship with risk management strategies are all
significant. What is more remarkable here is that the significance of the relationship between risk
impact and SCM practices differ from general and sustainable SCM practices. It seems like the
mediator has some effect on the relationship between these two variables. But can we talk of a
mediating effect between our constructs?
5.2.5 Mediating effect and hypothesis testing
To test for the mediating effect we can make use of the Sobel test. It tests whether a variable
mediates the significant relationship between 2 other variables. To test for this phenomenon we
apply his following formula:
Formula 1: Sobel test statistic
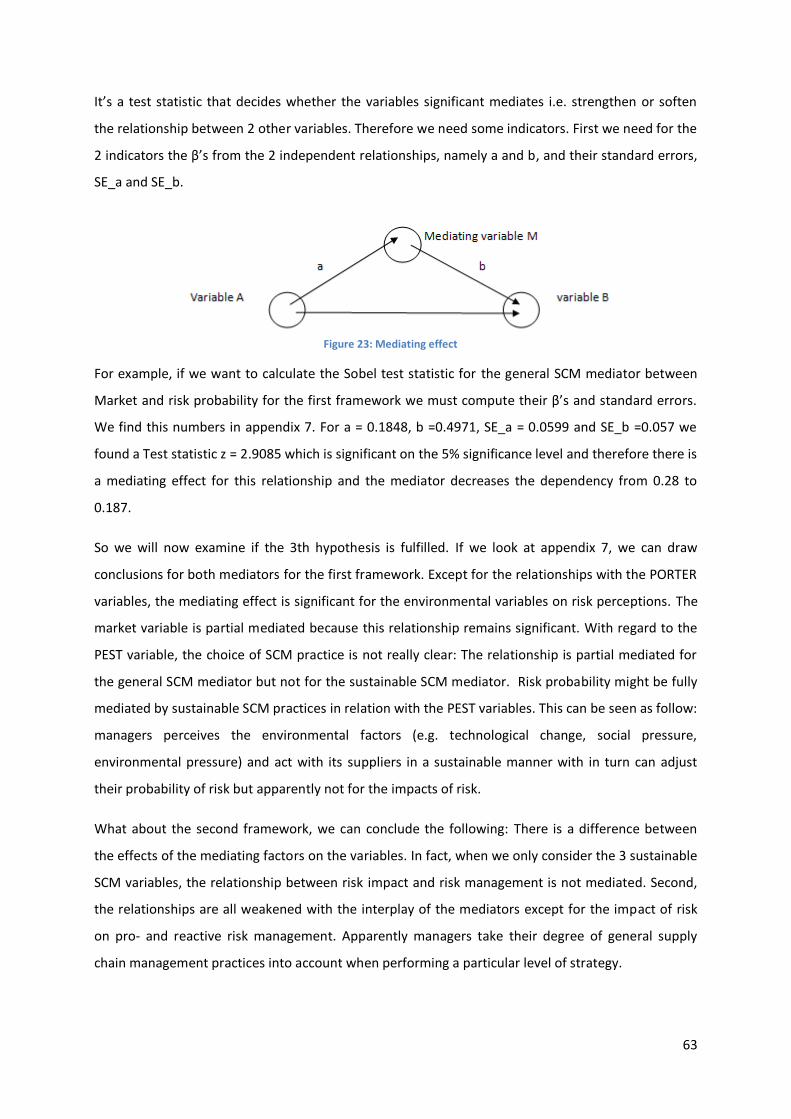
63
It’s a test statistic that decides whether the variables significant mediates i.e. strengthen or soften
the relationship between 2 other variables. Therefore we need some indicators. First we need for the
2 indicators the β’s from the 2 independent relationships, namely a and b, and their standard errors,
SE_a and SE_b.
For example, if we want to calculate the Sobel test statistic for the general SCM mediator between
Market and risk probability for the first framework we must compute their β’s and standard errors.
We find this numbers in appendix 7. For a = 0.1848, b =0.4971, SE_a = 0.0599 and SE_b =0.057 we
found a Test statistic z = 2.9085 which is significant on the 5% significance level and therefore there is
a mediating effect for this relationship and the mediator decreases the dependency from 0.28 to
0.187.
So we will now examine if the 3th hypothesis is fulfilled. If we look at appendix 7, we can draw
conclusions for both mediators for the first framework. Except for the relationships with the PORTER
variables, the mediating effect is significant for the environmental variables on risk perceptions. The
market variable is partial mediated because this relationship remains significant. With regard to the
PEST variable, the choice of SCM practice is not really clear: The relationship is partial mediated for
the general SCM mediator but not for the sustainable SCM mediator. Risk probability might be fully
mediated by sustainable SCM practices in relation with the PEST variables. This can be seen as follow:
managers perceives the environmental factors (e.g. technological change, social pressure,
environmental pressure) and act with its suppliers in a sustainable manner with in turn can adjust
their probability of risk but apparently not for the impacts of risk.
What about the second framework, we can conclude the following: There is a difference between
the effects of the mediating factors on the variables. In fact, when we only consider the 3 sustainable
SCM variables, the relationship between risk impact and risk management is not mediated. Second,
the relationships are all weakened with the interplay of the mediators except for the impact of risk
on pro- and reactive risk management. Apparently managers take their degree of general supply
chain management practices into account when performing a particular level of strategy.
Figure 23: Mediating effect
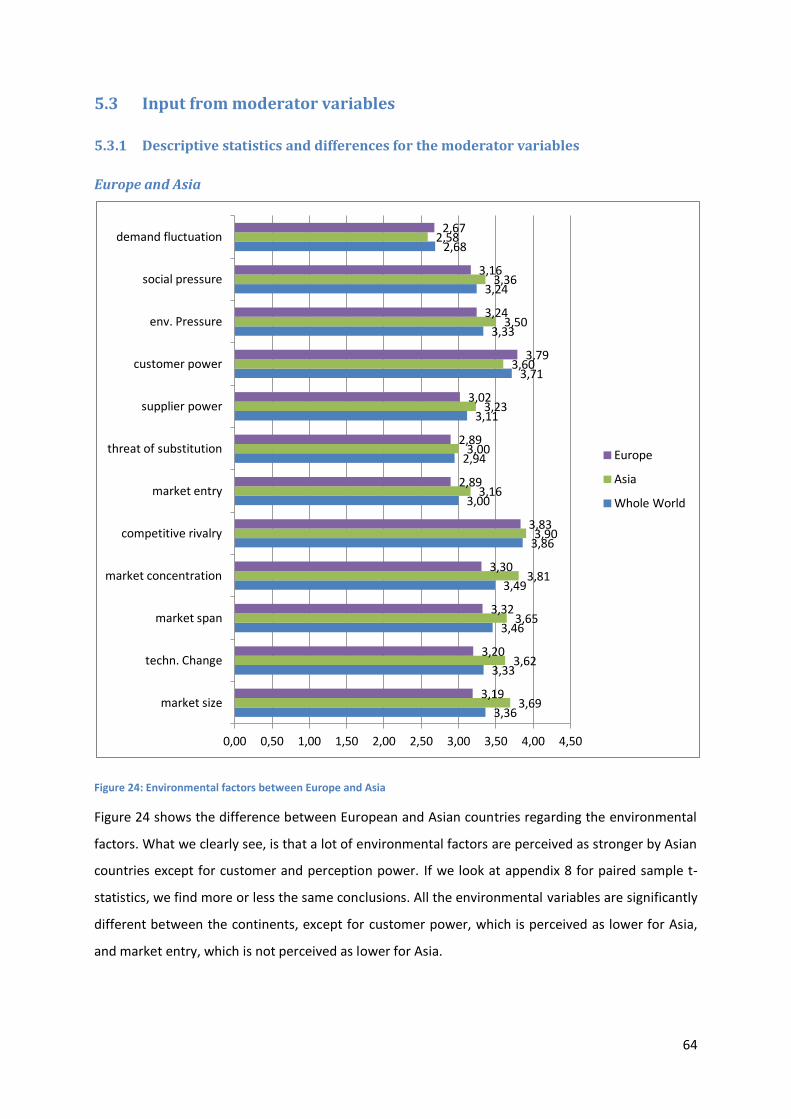
64
5.3 Input from moderator variables
5.3.1 Descriptive statistics and differences for the moderator variables
Europe and Asia
Figure 24: Environmental factors between Europe and Asia
Figure 24 shows the difference between European and Asian countries regarding the environmental
factors. What we clearly see, is that a lot of environmental factors are perceived as stronger by Asian
countries except for customer and perception power. If we look at appendix 8 for paired sample t-
statistics, we find more or less the same conclusions. All the environmental variables are significantly
different between the continents, except for customer power, which is perceived as lower for Asia,
and market entry, which is not perceived as lower for Asia.
3,36
3,33
3,46
3,49
3,86
3,00
2,94
3,11
3,71
3,33
3,24
2,68
3,69
3,62
3,65
3,81
3,90
3,16
3,00
3,23
3,60
3,50
3,36
2,58
3,19
3,20
3,32
3,30
3,83
2,89
2,89
3,02
3,79
3,24
3,16
2,67
market size
techn. Change
market span
market concentration
competitive rivalry
market entry
threat of substitution
supplier power
customer power
env. Pressure
social pressure
demand fluctuation
0,00 0,50 1,00 1,50 2,00 2,50 3,00 3,50 4,00 4,50
Europe
Asia
Whole World

65
Figure 25: Risk Probability and Impact for Europe and Asia
Here we see that Asia perceives more risk probability than the European companies but instead
weight the impact as much stronger than certainly for supplier disruptions. In a later stage we will
investigate if this risk perception difference will also have a different relationship towards risk
management strategies. For risk probability the indicators are significantly different but for risk
impact this counts only for the perception of impact from a supplier default (Appendix 8).
Increase / Decrease Risk action programs in the last 3 years (2010 – 2013)
Preventing
Risk
Detecting
Risk
Responding
Risk
Recovering
Risk
Whole World + 3,02% + 5,84% + 6,09% + 6,66%
Asia + 11,36% + 15,06% + 12,75% + 14,63%
Europe - 2,67% + 0,13% + 1,48% + 1,41%
Table 15: Risk management for Europe and Asia
Table 15 gives you an idea of the risk management development programs in the last 3 years (from
2010 – 2013). As we can see Asian countries have developed or done more effort the past 3 years in
risk action programs despite their already high level in 2010. Europe on the other hand shows a
minor increase for detecting and reactive risk management and even a higher decrease for
preventing risk. Seems like those countries believe that risk management programs are less fruitful
for their operations or they feel themselves in less crisis situations than 3 years ago. Appendix 8
proves that for all the risk management indicators there are significant differences. The highest
difference is for responding to risks.
At last, for the mediator variables general and sustainable SCM practices, we found in appendix 8
that all the indicators are clearly different. These practices seems to be more implemented by Asian
countries. In particular joint decision making with their customers is more performed for Asian
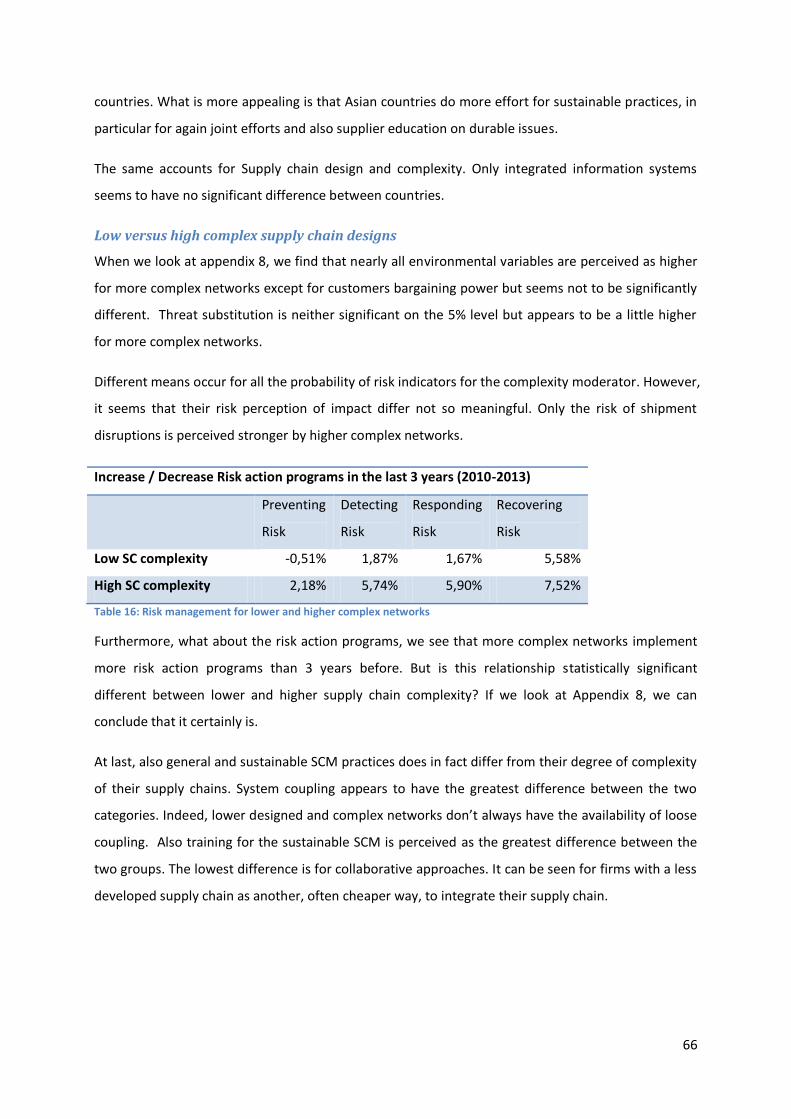
66
countries. What is more appealing is that Asian countries do more effort for sustainable practices, in
particular for again joint efforts and also supplier education on durable issues.
The same accounts for Supply chain design and complexity. Only integrated information systems
seems to have no significant difference between countries.
Low versus high complex supply chain designs
When we look at appendix 8, we find that nearly all environmental variables are perceived as higher
for more complex networks except for customers bargaining power but seems not to be significantly
different. Threat substitution is neither significant on the 5% level but appears to be a little higher
for more complex networks.
Different means occur for all the probability of risk indicators for the complexity moderator. However,
it seems that their risk perception of impact differ not so meaningful. Only the risk of shipment
disruptions is perceived stronger by higher complex networks.
Increase / Decrease Risk action programs in the last 3 years (2010-2013)
Preventing
Risk
Detecting
Risk
Responding
Risk
Recovering
Risk
Low SC complexity -0,51% 1,87% 1,67% 5,58%
High SC complexity 2,18% 5,74% 5,90% 7,52%
Table 16: Risk management for lower and higher complex networks
Furthermore, what about the risk action programs, we see that more complex networks implement
more risk action programs than 3 years before. But is this relationship statistically significant
different between lower and higher supply chain complexity? If we look at Appendix 8, we can
conclude that it certainly is.
At last, also general and sustainable SCM practices does in fact differ from their degree of complexity
of their supply chains. System coupling appears to have the greatest difference between the two
categories. Indeed, lower designed and complex networks don’t always have the availability of loose
coupling. Also training for the sustainable SCM is perceived as the greatest difference between the
two groups. The lowest difference is for collaborative approaches. It can be seen for firms with a less
developed supply chain as another, often cheaper way, to integrate their supply chain.
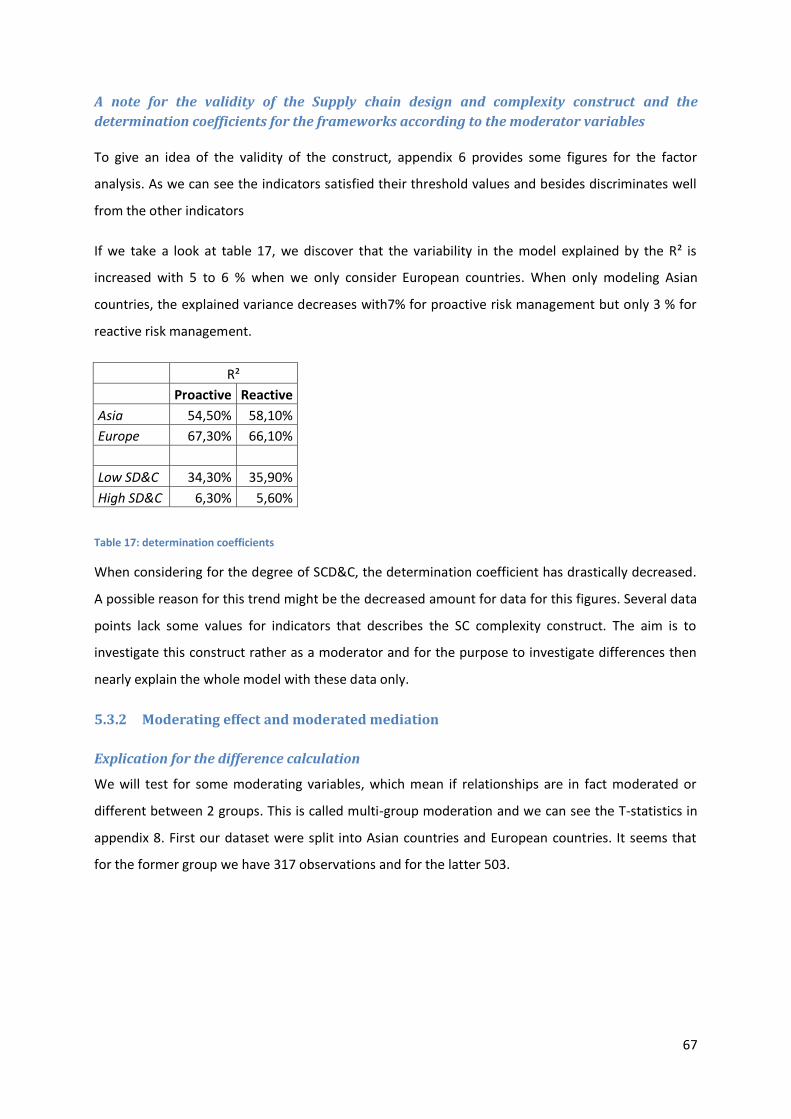
67
A note for the validity of the Supply chain design and complexity construct and the
determination coefficients for the frameworks according to the moderator variables
To give an idea of the validity of the construct, appendix 6 provides some figures for the factor
analysis. As we can see the indicators satisfied their threshold values and besides discriminates well
from the other indicators
If we take a look at table 17, we discover that the variability in the model explained by the R² is
increased with 5 to 6 % when we only consider European countries. When only modeling Asian
countries, the explained variance decreases with7% for proactive risk management but only 3 % for
reactive risk management.
R²
Proactive Reactive
Asia 54,50% 58,10%
Europe 67,30% 66,10%
Low SD&C 34,30% 35,90%
High SD&C 6,30% 5,60%
Table 17: determination coefficients
When considering for the degree of SCD&C, the determination coefficient has drastically decreased.
A possible reason for this trend might be the decreased amount for data for this figures. Several data
points lack some values for indicators that describes the SC complexity construct. The aim is to
investigate this construct rather as a moderator and for the purpose to investigate differences then
nearly explain the whole model with these data only.
5.3.2 Moderating effect and moderated mediation
Explication for the difference calculation
We will test for some moderating variables, which mean if relationships are in fact moderated or
different between 2 groups. This is called multi-group moderation and we can see the T-statistics in
appendix 8. First our dataset were split into Asian countries and European countries. It seems that
for the former group we have 317 observations and for the latter 503.

68
Asia Europe
(m-1)^2 99856
Sample Size 317 503 (m+n-2) 818
Sample Mean -0,0215 0,1802 (n-1)^2 252004
Standard Error (S.E.) 0,0821 0,0787 sqrt(1/m+1/n) 0,071712
t-statistic 1,7020 1st half denominator 0,822824
p-value (2-tailed) 0,0891 2nd half denominator 1,908111
sqrt(1st half + 2nd half) 1,652554
Full denominator 0,118508
numerator 0,2017
Figure 26: calculation for the multi-group moderation t-statistic and p-value
Formula 2: t-test for multi-group moderation and moderated mediation
If we want to calculate for example the significant T-statistic for differences between Europe and Asia
for the relationship between the probability of risk and proactive risk management we must use the
sample means and standard errors. These can be found in SmartPLS after bootstrapping. To calculate
the t-statistic we must fill in the formula given above. Therefore it is easy to split the calculations a
bit like as done above.
For the moderator supply chain design and complexity the dataset is again split in two. The first
group consists of the observations which have an average of the 5 indicators that forms this
construct of less than 3. The second group those that are more or equal than 3. The choice of a
threshold of 3 was decided because the earlier threshold of 2.5 generates less than 100 observations
for the first group. In order to conduct these paired t-tests with some validity, we opt to choose for
groups for at least 100 observations. So these t-statistics are calculated in the same way.
We can also determine the moderating effect through relationships with mediators or otherwise
called the moderated mediation. These can be seen as the total effects between variables. The
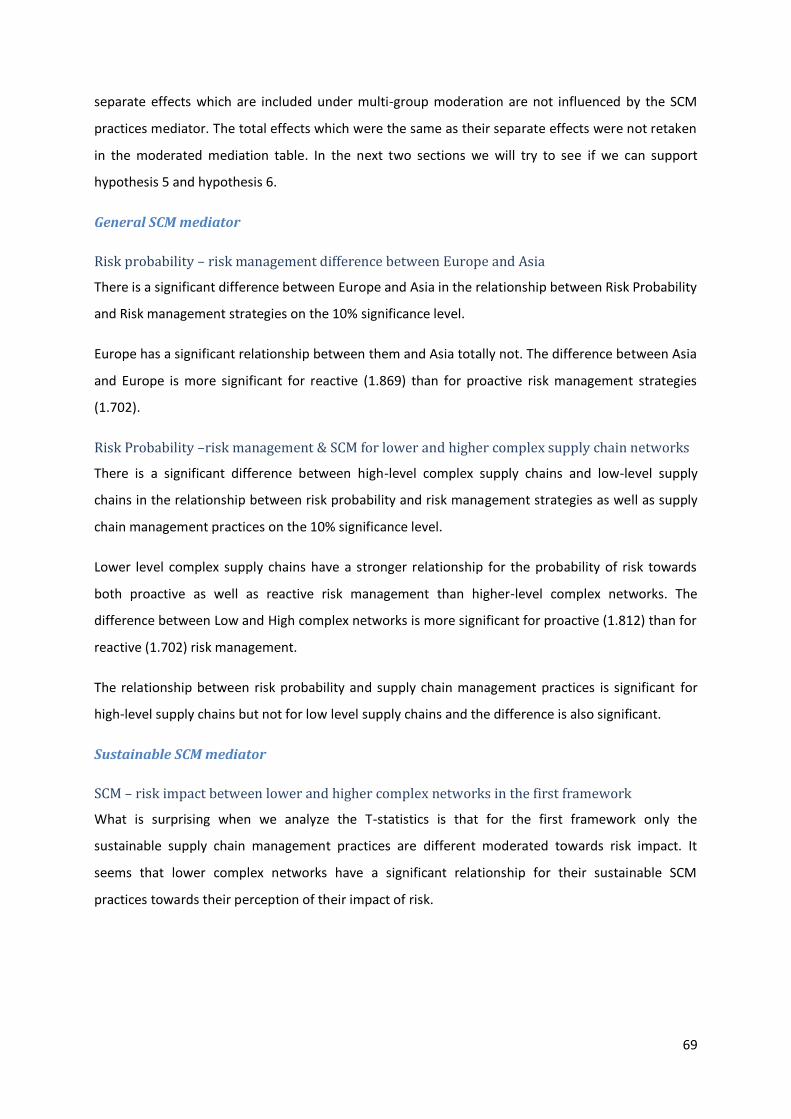
69
separate effects which are included under multi-group moderation are not influenced by the SCM
practices mediator. The total effects which were the same as their separate effects were not retaken
in the moderated mediation table. In the next two sections we will try to see if we can support
hypothesis 5 and hypothesis 6.
General SCM mediator
Risk probability – risk management difference between Europe and Asia
There is a significant difference between Europe and Asia in the relationship between Risk Probability
and Risk management strategies on the 10% significance level.
Europe has a significant relationship between them and Asia totally not. The difference between Asia
and Europe is more significant for reactive (1.869) than for proactive risk management strategies
(1.702).
Risk Probability –risk management & SCM for lower and higher complex supply chain networks
There is a significant difference between high-level complex supply chains and low-level supply
chains in the relationship between risk probability and risk management strategies as well as supply
chain management practices on the 10% significance level.
Lower level complex supply chains have a stronger relationship for the probability of risk towards
both proactive as well as reactive risk management than higher-level complex networks. The
difference between Low and High complex networks is more significant for proactive (1.812) than for
reactive (1.702) risk management.
The relationship between risk probability and supply chain management practices is significant for
high-level supply chains but not for low level supply chains and the difference is also significant.
Sustainable SCM mediator
SCM – risk impact between lower and higher complex networks in the first framework
What is surprising when we analyze the T-statistics is that for the first framework only the
sustainable supply chain management practices are different moderated towards risk impact. It
seems that lower complex networks have a significant relationship for their sustainable SCM
practices towards their perception of their impact of risk.
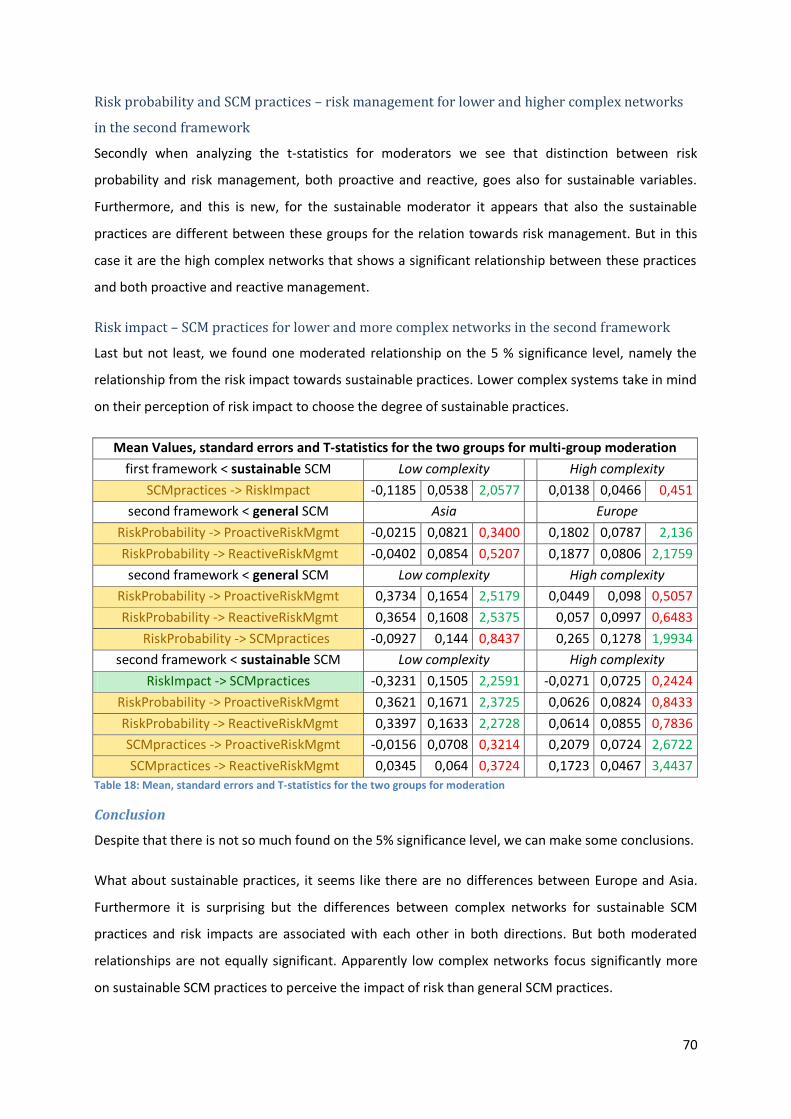
70
Risk probability and SCM practices – risk management for lower and higher complex networks
in the second framework
Secondly when analyzing the t-statistics for moderators we see that distinction between risk
probability and risk management, both proactive and reactive, goes also for sustainable variables.
Furthermore, and this is new, for the sustainable moderator it appears that also the sustainable
practices are different between these groups for the relation towards risk management. But in this
case it are the high complex networks that shows a significant relationship between these practices
and both proactive and reactive management.
Risk impact – SCM practices for lower and more complex networks in the second framework
Last but not least, we found one moderated relationship on the 5 % significance level, namely the
relationship from the risk impact towards sustainable practices. Lower complex systems take in mind
on their perception of risk impact to choose the degree of sustainable practices.
Mean Values, standard errors and T-statistics for the two groups for multi-group moderation
first framework < sustainable SCM Low complexity High complexity
SCMpractices -> RiskImpact -0,1185 0,0538 2,0577 0,0138 0,0466 0,451
second framework < general SCM Asia Europe
RiskProbability -> ProactiveRiskMgmt -0,0215 0,0821 0,3400 0,1802 0,0787 2,136
RiskProbability -> ReactiveRiskMgmt -0,0402 0,0854 0,5207 0,1877 0,0806 2,1759
second framework < general SCM Low complexity High complexity
RiskProbability -> ProactiveRiskMgmt 0,3734 0,1654 2,5179 0,0449 0,098 0,5057
RiskProbability -> ReactiveRiskMgmt 0,3654 0,1608 2,5375 0,057 0,0997 0,6483
RiskProbability -> SCMpractices -0,0927 0,144 0,8437 0,265 0,1278 1,9934
second framework < sustainable SCM Low complexity High complexity
RiskImpact -> SCMpractices -0,3231 0,1505 2,2591 -0,0271 0,0725 0,2424
RiskProbability -> ProactiveRiskMgmt 0,3621 0,1671 2,3725 0,0626 0,0824 0,8433
RiskProbability -> ReactiveRiskMgmt 0,3397 0,1633 2,2728 0,0614 0,0855 0,7836
SCMpractices -> ProactiveRiskMgmt -0,0156 0,0708 0,3214 0,2079 0,0724 2,6722
SCMpractices -> ReactiveRiskMgmt 0,0345 0,064 0,3724 0,1723 0,0467 3,4437
Table 18: Mean, standard errors and T-statistics for the two groups for moderation
Conclusion
Despite that there is not so much found on the 5% significance level, we can make some conclusions.
What about sustainable practices, it seems like there are no differences between Europe and Asia.
Furthermore it is surprising but the differences between complex networks for sustainable SCM
practices and risk impacts are associated with each other in both directions. But both moderated
relationships are not equally significant. Apparently low complex networks focus significantly more
on sustainable SCM practices to perceive the impact of risk than general SCM practices.

71
Furthermore it appears that lower complex networks more account for their perception of risk
possibility to perform their amount of risk management whereas high complex networks not. Also
European countries do this strategy and Asia not.
What is surprising is that the higher complex supply chains act on their general supply chain
management practices in relation to their probability of risk and not at all in the relation towards risk
management. It shows that more complex networks do in fact care about their supply chain. Once
they perceive a higher risk probability they align their supply chain management practices in the
same way. This is not the conclusion for a less complex supply chains.
A last remark that we can make is that for sustainable practices, more high complex supply networks
focus on their SCM practices whereas low complex supply networks focus more on their risk
probability towards both proactive and reactive risk management.
5.4 Some comparison with 3 years ago
A limitation of this study and this gathered data is the absence of data for “effort in last 3 years” for
some variables i.e. for environment, risk probability, risk impact and some supply chain design &
complexity variables. We will now consider to make some conclusions for the last hypothesis (H6).
In earlier section we have showed that there were progressions in risk management compared to 3
years ago. We will now execute some paired sample t-test in order to proof these progressions but
also take a look at evolutions of general and sustainable SCM practices.
As we look through appendix 9 section paired sample t-test for variables, we found evidence for
evolution of most of the variables. What about the dataset for Asia, we see that all the indicators
have increased in value between 3 years ago and now. For European countries the story is somewhat
different. Although these companies have increased on average their reactive risk management
programs, proactive risk management has not significantly changed in the past 3 years. Preventing
has decreased and detecting increased some but not much. Furthermore some SCM practices proved
to be not significant more practice in the past 3 year. This is the case for performance assessment for
the company’s sustainability practices with their suppliers (SusPerfAssS is not significant on the 5 %
significance level). In addition, only sharing information with the suppliers as well as with customers
has increased between the past 3 years for European companies. Other general SCM practices
proved not to be significant on the 5 % significance level. At least, when we conclude for the whole
world, we can say that all indicators have significantly changed except for developing an internal
sourcing strategy with suppliers.
72
There seems to be no significant relationship between current implementation and effort in the last
3 years for all the investigated relationships. To come to this table we applied the same formula as
for calculating moderator t-statistics. The highest t-statistic is for the relationship between SCM
sustainable practices on reactive risk management for the first framework with low complex
networks. Apparently, no significantly different relationships exist between now and 3 years ago. We
will now summarize or findings of the proposed hypothesis.
5.5 Hypothesis summary
Hypothesis summary
H1 Accepted for market, Rejected for PORTER and PEST for both risk perceptions
H2a Accepted for both risk management strategies
H2b Accepted for both risk management strategies
H3a Accepted for market and PEST Rejected for PORTER for both risk perceptions
H3b Accepted for both risk perceptions on both risk management strategies
H3c Accepted for market and PEST Rejected for PORTER for both risk perceptions
H3d Accepted for risk probability on both risk management strategies Rejected for risk impact on both risk management strategies
H4a Accepted for the multi-group moderation relationship between sustainable SCM practices and risk impact * Rejected for all other multi-group relationships Rejected for all moderated mediation relationships
H4b Accepted for the multi-group moderation relationships between risk probability on both risk management strategies where both SCM practices are mediator * Accepted for the multi-group moderation relationship between sustainable SCM practices and both risk management strategies * Accepted for the multi-group moderation relationship between risk impact and sustainable SCM practices Rejected for all other multi-group relationships Rejected for all moderated mediation relationships
H5a Rejected for all multi-group relationships Rejected for all moderated mediation relationships
H5b Accepted for the relationship between risk probability on both risk management strategies where general SCM practices is mediator * Rejected for all other multi-group relationships Rejected for all moderated mediation relationships
H6a Rejected for both frameworks and both SCM practices
H6b Rejected for both frameworks and both SCM practices Table 19: hypothesis summary table
Table 19 summarizes the proposed hypotheses from our conceptual framework and their results.
‘Accepting’ denotes here that the test was significant and consequently supports our conceptual
framework. The Hypothesis’s noted with a * are the those ones who are significant on the 10%
significance level.
73
6 Overall Conclusion
“Many companies perceive if they have to choose their effort between costly risk mitigation strategies
or more flexible supply chain strategies as if they to choose one of both.”
We began this work with declaring several concepts like risks, their aspects and drivers, disruptions,
vulnerability and many more. We proposed the framework to implement a comprehensive risk
management on the basis of many previous literature researches. Thereby we addressed the fact of
risk monitoring and sharing risk information. The concept of SCRM has been linked with SCM, SCSM
and ERM.
The aim of this work was to investigate the difference between the use of more pro-active and more
re-active risk management strategies to manage supply chains against disruptions. A conceptual
framework has been presented which includes environmental factors, SCM factors, risk factors and
SC Design and Complexity variables.
Data was gathered with the aim to test our framework and propose several hypotheses. We have
aimed to compose the most reliable model and with the highest validity. Two frameworks have been
investigated where both mediator variables were between the constructs of environment and risk
perception on the one hand and between risk perception and management on the other hand.
Some environmental variables (i.e. market variables) have impact on the perceptions of risks
(hypothesis 1). Secondly, we saw a stronger influence of risk impact than risk probability on risk
management strategies and most firms perceives a medium risk probability with a higher impact on
average. Although risk management has increased by several countries in 3 years, we do not find so
much difference for more proactive or reactive risk management implementation. Yet, proactive
management is slightly more in favor (hypothesis 2) but not always related with other variables.
General SCM practices ameliorate the model a lot, in terms of declared variance. Sustainable SCM
slightly improves the model. Apparently managers take their degree of general supply chain
management practices into account when performing a particular level of strategy (hypothesis 3).
When we analyzed for Europe & Asia and Low versus High SCD&C (hypothesis 4) we found a lot of
differences in their environmental and risk perceptions but also in their general and sustainable
supply chain and risk management. In fact, Asian countries score a lot higher for nearly all the
indicators. Even worse, the practice of preventing risks more proactively has declined for European
countries. Asian countries perceive their probabilities of risk as much higher and yet their impact as a
lot lower than European countries. Nevertheless these Asian countries implement more risk

74
programs. They are able to compare a highly leveled supply chain with an advanced level of risk
management in comparison with European countries. This is the challenge in today’s business
operations.
When we dig a little deeper, i.e. performed some further analyses in differences between
moderators in the several relationships from our conceptual framework, the outcomes are not
always explicable. Risk impact might be associated with sustainable SCM practices in both directions
and the perception of risk probability differs to their level of risk management implementation.
Lower complex SC focus more on cheaper forms of SCM practices like information sharing and
collaborative approaches whereas more advanced supply chains focus on joint decision making and
system coupling. In addition, lower complex supply chains focus more on risk perception in their
relation to risk management implementations. Complex networks do in fact care about their supply
chain because their risk management practices are more dependent of these. Once they perceive a
higher risk probability they align their supply chain management practices in the same way. This is
not the conclusion for a less complex supply chains (hypothesis 5). At least, a lot of variables have
increase in 3 years but not significant different relationships were found.
Why can it be possible that a lot of risk management efforts don’t really break through or not much
changed in their level of implementation in a lot of companies? Perceive these companies as if the
economic crisis is gone for some time? And what about preventing natural hazards?
First, we must say that a lot of companies see that risk management strategies are not always time
and cost-effective. Certainly European countries think that risk management doesn’t always prove to
have added value. Secondly, some strategies might reduce flexibility of operations or supply chain
management strategies because they could impose business restrictions. Finally, the feeling of many
managers that the crises is yet behind our backs may arouse that we must not stick to constantly
prevent risks or performing business operations in a cautious way.
Besides, a lot of papers in the risk management were written during or after the crisis (i.e. 2008-
2010). One of them is the German research from paper 37. They found that the financial crisis has
not influenced the relationship between enterprise risk management and supply chain (risk)
management. We found overall relationship between supply chain management practices and
proactive risk management for both current implementations as well as for the effort in the last 3
years for the whole world but with no significant differences. This indicates that after the crisis,
companies stick to align supply chain practices and risk strategies but not everyone augment them.
75
7 Limitations and possibilities for future research
In this work we investigated risk management strategies and divided them in more reactive and
more proactive ones. But more risk management practices might upgrade the framework in value.
Because, what we have noticed, is that the constructs for proactive and those for reactive action
programs don’t discriminate too much. This makes generality of findings more difficult. In future
research it might be interesting to further investigate related risk program strategies such the
practice of an integrated risk management or the usage of a supply chain or catastrophic
vulnerability framework.
Second point we like to address is that besides a lot of data that is used for the current
implementation, more data for 3 years ago would be fruitful to make more conclusions for the
evolutions of more indicators (risk probability, risk impact, environment factors and some supply
chain design and complexity variables).
In addition future research can be executed for the relationship of more risk indicators. Besides the
risk perceptions of risk probability and risk impact, other risk indicators like for example speed of risk,
risk frequency, probability of detecting and the perception of overall risk can be further investigated
towards risk management.
Conclusions have been made for the whole world an some differences for the European and Asia
countries. The dataset used contains 14 European countries, good for 503 companies and 4 Asian
countries that represent 337 companies. But this dataset does lack some world figures namely only
Canada from North America has participated for this research. So other world continents were not
represented through this data. Further research can research data for the missing countries here.
At last, no statements have been made for the Belgian firms. Although a modest range of 30
companies have participated through this research, several indicators didn’t contain 30 values. It
was therefore not recommended to execute statistical analysis. Future research could enlarge the
Belgian dataset.

76
8 References
Altay, N., & Ramirez, A. (2010). Impact of disasters on firms in different sectors: implications for
supply chains. Journal of Supply Chain Management, 46(4), 59-80.
Alvarenga, C., & Lehman, E. (2012). Accenture: Managing Risks in the Supply Chain: Reaching New
Standards (pp. 1-12): Accenture.
Asbjørnslett, B. E. (2009). Assessing the vulnerability of supply chains. In R. Ritchie & G. Zsidisin (Eds.),
Supply Chain Risk (pp. 15-33): Springer.
Autry, C., & Sanders, N. (2009). Supply chain security: A dynamic capabilities approach. In R. Ritchie &
G. Zsidisin (Eds.), Supply Chain Risk (pp. 307-329): Springer.
Blome, C., & Henke, M. (2009). Single Versus Multiple Sourcing: A Supply Risk Management
Perspective. In R. Ritchie & G. Zsidisin (Eds.), Supply Chain Risk (pp. 125-135): Springer.
Blome, C., & Schoenherr, T. (2011). Supply chain risk management in financial crises—A multiple
case-study approach. International Journal of Production Economics, 134(1), 43-57.
Blos, M. F., Quaddus, M., Wee, H., & Watanabe, K. (2009). Supply chain risk management (SCRM): a
case study on the automotive and electronic industries in Brazil. Supply Chain Management:
An International Journal, 14(4), 247-252.
Cagliano, A. C., De Marco, A., Grimaldi, S., & Rafele, C. (2012). An integrated approach to supply chain
risk analysis. Journal of Risk Research, 15(7), 817-840.
Celly, K. S., & Frazier, G. L. (1996). Outcome-based and behavior-based coordination efforts in
channel relationships. Journal of marketing research, 33(2), 200-210.
Chen, F. Y., & Yano, C. A. (2010). Improving supply chain performance and managing risk under
weather-related demand uncertainty. Management Science, 56(8), 1380-1397.
Dani, S. (2009). Predicting and managing supply chain risks. In R. Ritchie & G. Zsidisin (Eds.), Supply
Chain Risk (pp. 53-66): Springer.
Ellegaard, C. (2008). Supply risk management in a small company perspective. Supply Chain
Management: An International Journal, 13(6), 425-434.
Ellis, S. C., Henry, R. M., & Shockley, J. (2010). Buyer perceptions of supply disruption risk: a
behavioral view and empirical assessment. Journal of Operations Management, 28(1), 34-46.
Gaonkar, R., & Viswanadham, N. (2004). A conceptual and analytical framework for the management
of risk in supply chains. Paper presented at the Robotics and Automation, 2004. Proceedings.
ICRA'04. 2004 IEEE International Conference on.
Gaudenzi, B. (2009). Assessing risks in projects and processes. In R. Ritchie & G. Zsidisin (Eds.), Supply
Chain Risk (pp. 67-82): Springer.
77
Griffis, S. E., & Whipple, J. M. (2012). A Comprehensive Risk Assessment and Evaluation Model.
Transportation Journal, 51(4), 428-451.
Hallikas, J., Karvonen, I., Pulkkinen, U., Virolainen, V.-M., & Tuominen, M. (2004). Risk management
processes in supplier networks. International Journal of Production Economics, 90(1), 47-58.
Hallikas, J., & Varis, J. (2009). Risk management in value networks. In R. Ritchie & G. Zsidisin (Eds.),
Supply Chain Risk (pp. 35-52): Springer.
Haywood, M., & Peck, H. (2003). Improving the management of supply chain vulnerability in UK
aerospace manufacturing. Paper presented at the Proceedings of the 1st EUROMA/POMs
Conference.
Henke, M. (2009). Enterprise and Supply Risk Management. In R. Ritchie & G. Zsidisin (Eds.), Supply
Chain Risk (pp. 177-185): Springer.
Jüttner, U., Peck, H., & Christopher, M. (2003). Supply chain risk management: outlining an agenda
for future research. International Journal of Logistics: Research and Applications, 6(4), 197-
210.
Jüttner, U., & Ziegenbein, A. (2009). Supply chain risk management for small and medium-sized
businesses. In R. Ritchie & G. Zsidisin (Eds.), Supply Chain Risk (pp. 199-217): Springer.
Khan, O., Christopher, M., & Burnes, B. (2009). The role of product design in global supply chain risk
management. In R. Ritchie & G. Zsidisin (Eds.), Supply Chain Risk (pp. 137-153): Springer.
Kleindorfer, P. R., & Saad, G. H. (2005). Managing disruption risks in supply chains. Production and
Operations Management, 14(1), 53-68.
Knemeyer, A. M., Zinn, W., & Eroglu, C. (2009). Proactive planning for catastrophic events in supply
chains. Journal of Operations Management, 27(2), 141-153.
Levi, D. S., Vassiladis, C., & Kyratzoglou, I. (2013). Supply chain and risk management; making the
right risk decisions to strengthen operations performance: Pwc.
Manuj, I., & Mentzer, J. T. (2008). Global supply chain risk management strategies. International
Journal of Physical Distribution & Logistics Management, 38(3), 192-223.
Mau, N., & Mau, M. (2009). Securing Global Food Distribution Networks. In R. Ritchie & G. Zsidisin
(Eds.), Supply Chain Risk (pp. 331-344): Springer.
Melnyk, S. A., Rodrigues, A., & Ragatz, G. L. (2009). Using simulation to investigate supply chain
disruptions. In R. Ritchie & G. Zsidisin (Eds.), Supply Chain Risk (pp. 103-122): Springer.
Mullai, A. (2009). Risk management system–a conceptual model. In R. Ritchie & G. Zsidisin (Eds.),
Supply Chain Risk (pp. 83-101): Springer.
Narasimhan, R., & Talluri, S. (2009). Perspectives on risk management in supply chains. Journal of
Operations Management, 27(2), 114-118.
78
Norrman, A., & Jansson, U. (2004). Ericsson's proactive supply chain risk management approach after
a serious sub-supplier accident. International Journal of Physical Distribution & Logistics
Management, 34(5), 434-456.
Peck, H. (2006). Reconciling supply chain vulnerability, risk and supply chain management.
International Journal of Logistics: Research and Applications, 9(2), 127-142.
Perry, M. (2007). Natural disaster management planning: a study of logistics managers responding to
the tsunami. International Journal of Physical Distribution & Logistics Management, 37(5),
409-433.
Ritchie, B., & Brindley, C. (2009). SCRM and performance–issues and challenges. In R. Ritchie & G.
Zsidisin (Eds.), Supply Chain Risk (pp. 249-270): Springer.
Seiter, M. (2009). Behavioural Risks in Supply Networks. In R. Ritchie & G. Zsidisin (Eds.), Supply Chain
Risk (pp. 235-247): Springer.
Sheffi, Y. (2005). Building a Resilient Supply Chain. Harvard business Review, 1(8), 1-4.
Sheffi, Y. (2008). Resilience: What it is and how to achieve it: The House Committee on Homeland
Security “The Resilient Homeland–Broadening the Homeland Security Strategy.
Sheffi, Y., & Rice Jr, J. B. (2005). A supply chain view of the resilient enterprise. MIT Sloan
Management Review, 47(1).
Sitkin, S. B., & Pablo, A. L. (1992). Reconceptualizing the determinants of risk behavior. Academy of
management review, 17(1), 9-38.
Smith, P. G. (2002). Managing risk proactively in product development projects. Paper presented at
the IPLNET workshop, Switzerland.
Smith, P. G., & Merritt, G. M. (2002). Proactive Risk Management. Executive Book Summaries, 24(11),
1-8.
Sodhi, M. S., Son, B. G., & Tang, C. S. (2012). Researchers' perspectives on supply chain risk
management. Production and Operations Management, 21(1), 1-13.
Tang, C., & Tomlin, B. (2009). How Much Flexibility Does It Take to Mitigate Supply Chain Risks? In R.
Ritchie & G. Zsidisin (Eds.), Supply Chain Risk (pp. 155-174): Springer.
Tang, C. S. (2006). Perspectives in supply chain risk management. International Journal of Production
Economics, 103(2), 451-488.
Tomlin, B. (2009). Disruption‐management strategies for short life‐cycle products. Naval Research
Logistics (NRL), 56(4), 318-347.
Voss, D., & Whipple, J. (2009). Food Supply Chain Security: Issues and Implications. In R. Ritchie & G.
Zsidisin (Eds.), Supply Chain Risk (pp. 293-305): Springer.
Wagner, S. M., & Bode, C. (2006). An empirical investigation into supply chain vulnerability. Journal of
purchasing and supply management, 12(6), 301-312.

79
Wagner, S. M., & Bode, C. (2008). An empirical examination of supply chain performance along
several dimensions of risk. Journal of business logistics, 29(1), 307-325.
Wagner, S. M., & Bode, C. (2009). Dominant risks and risk management practices in supply chains. In
R. Ritchie & G. Zsidisin (Eds.), Supply Chain Risk (pp. 271-290): Springer.
Wieland, A., & Wallenburg, C. M. (2012). Dealing with supply chain risks: Linking risk management
practices and strategies to performance. International Journal of Physical Distribution &
Logistics Management, 42(10), 887-905.
Zhao, L., Huo, B., Sun, L., & Zhao, X. (2013). The impact of supply chain risk on supply chain
integration and company performance: a global investigation. Supply Chain Management: An
International Journal, 18(2), 115-131.
Zsidisin, G. A. (2003). A grounded definition of supply risk. Journal of purchasing and supply
management, 9(5), 217-224.
Zsidisin, G. A., & Ellram, L. M. (2003). An Agency Theory Investigation of Supply Risk M anagement.
Journal of Supply Chain Management, 39(3), 15-27.
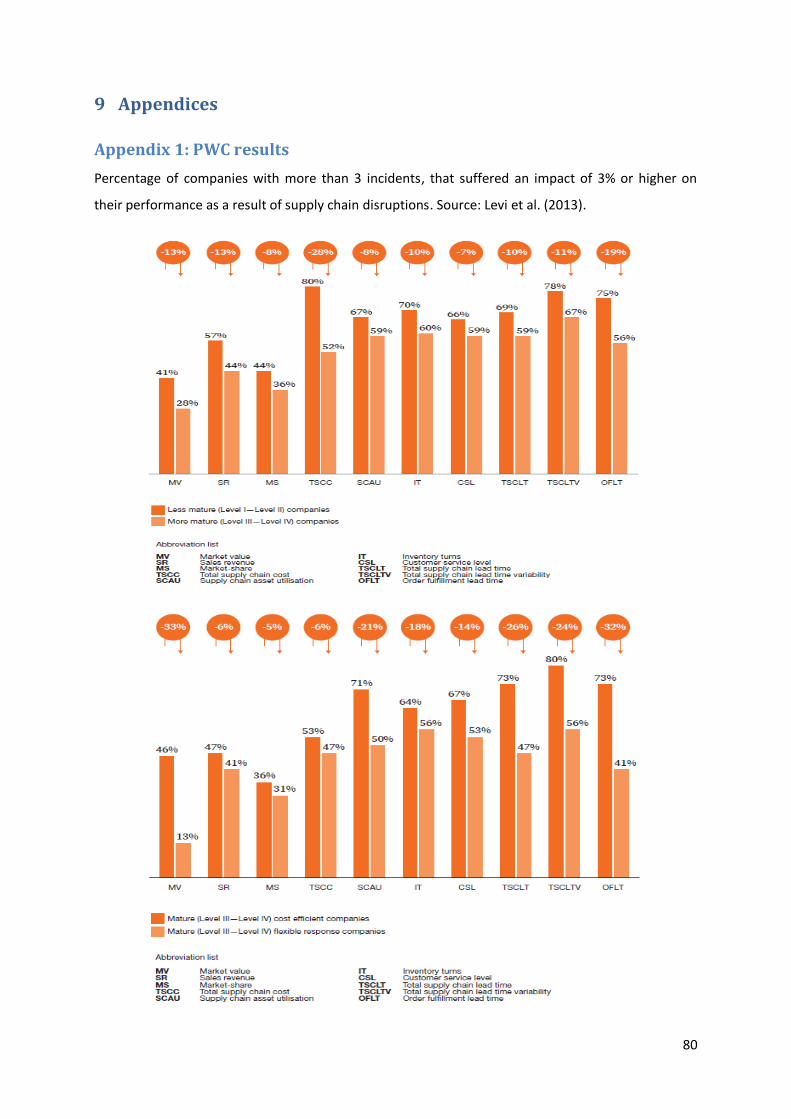
80
9 Appendices
Appendix 1: PWC results
Percentage of companies with more than 3 incidents, that suffered an impact of 3% or higher on
their performance as a result of supply chain disruptions. Source: Levi et al. (2013).
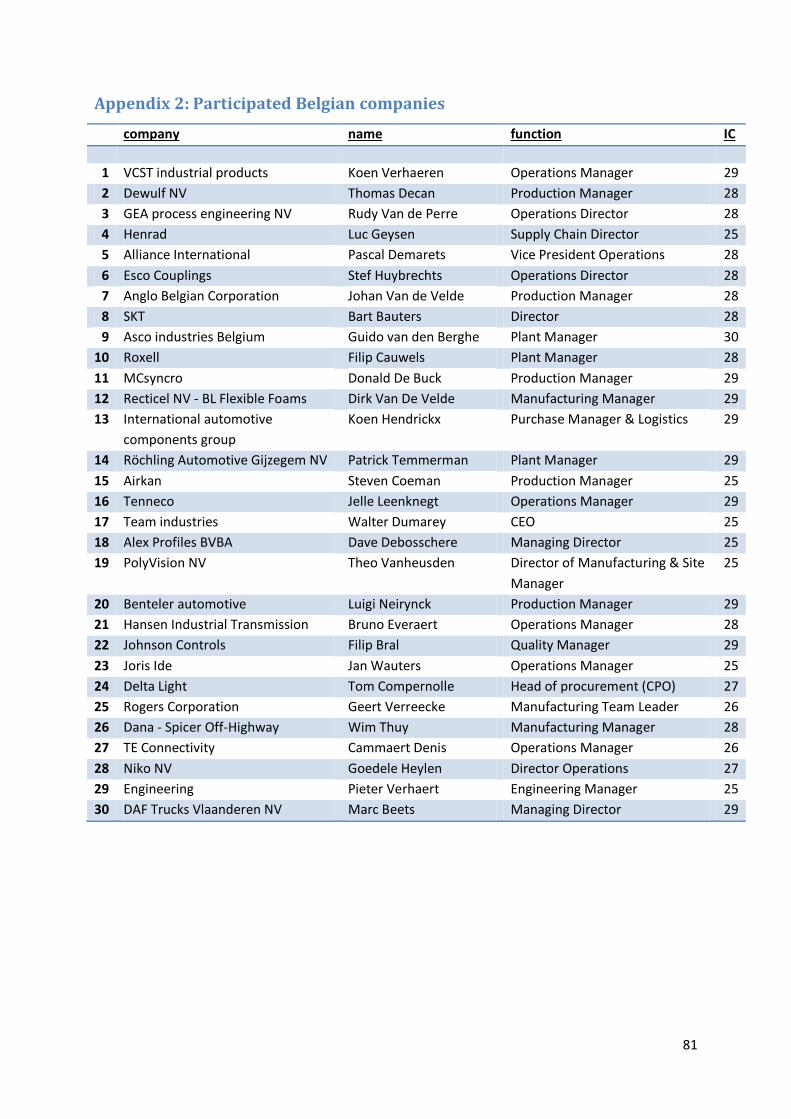
81
Appendix 2: Participated Belgian companies
company name function IC
1 VCST industrial products Koen Verhaeren Operations Manager 29
2 Dewulf NV Thomas Decan Production Manager 28
3 GEA process engineering NV Rudy Van de Perre Operations Director 28
4 Henrad Luc Geysen Supply Chain Director 25
5 Alliance International Pascal Demarets Vice President Operations 28
6 Esco Couplings Stef Huybrechts Operations Director 28
7 Anglo Belgian Corporation Johan Van de Velde Production Manager 28
8 SKT Bart Bauters Director 28
9 Asco industries Belgium Guido van den Berghe Plant Manager 30
10 Roxell Filip Cauwels Plant Manager 28
11 MCsyncro Donald De Buck Production Manager 29
12 Recticel NV - BL Flexible Foams Dirk Van De Velde Manufacturing Manager 29
13 International automotive
components group
Koen Hendrickx Purchase Manager & Logistics 29
14 Röchling Automotive Gijzegem NV Patrick Temmerman Plant Manager 29
15 Airkan Steven Coeman Production Manager 25
16 Tenneco Jelle Leenknegt Operations Manager 29
17 Team industries Walter Dumarey CEO 25
18 Alex Profiles BVBA Dave Debosschere Managing Director 25
19 PolyVision NV Theo Vanheusden Director of Manufacturing & Site
Manager
25
20 Benteler automotive Luigi Neirynck Production Manager 29
21 Hansen Industrial Transmission Bruno Everaert Operations Manager 28
22 Johnson Controls Filip Bral Quality Manager 29
23 Joris Ide Jan Wauters Operations Manager 25
24 Delta Light Tom Compernolle Head of procurement (CPO) 27
25 Rogers Corporation Geert Verreecke Manufacturing Team Leader 26
26 Dana - Spicer Off-Highway Wim Thuy Manufacturing Manager 28
27 TE Connectivity Cammaert Denis Operations Manager 26
28 Niko NV Goedele Heylen Director Operations 27
29 Engineering Pieter Verhaert Engineering Manager 25
30 DAF Trucks Vlaanderen NV Marc Beets Managing Director 29

82
Appendix 3: Internal consistency scale measurement
Environment
Risk probability

83
Risk Impact
Risk Management
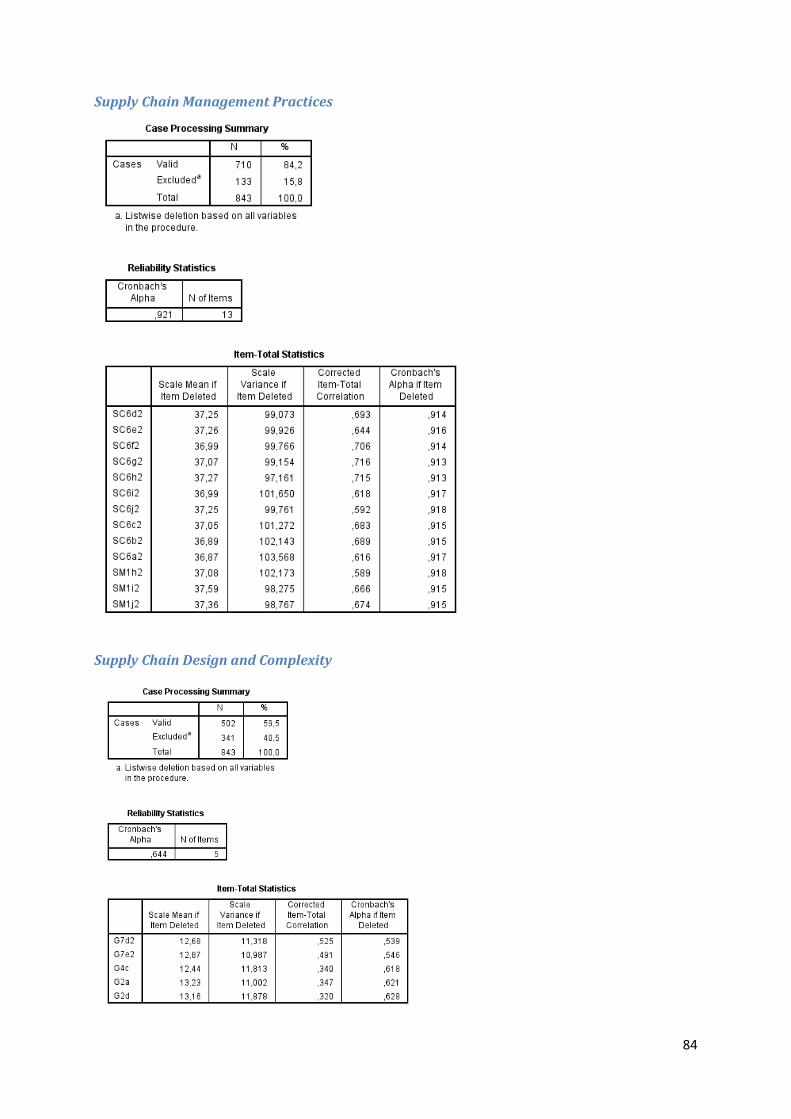
84
Supply Chain Management Practices
Supply Chain Design and Complexity

85
Appendix 4: Descriptive statistics
Environment
Descriptive Statistics
N Mean Std. Deviation Variance
SubstitutionThreat 828 2,94 1,103 1,216
MarketEntry 838 3,00 1,092 1,192
BargainingPowerS 830 3,11 ,903 ,816
SocPressure 832 3,24 1,062 1,129
EnvirPressure 835 3,33 1,070 1,144
TechnologicalChange 838 3,33 1,003 1,007
MarketSize 840 3,36 ,881 ,776
MarketSpan 833 3,46 1,021 1,042
MarketConcentration 836 3,49 1,077 1,160
BargainingPowerC 832 3,71 ,944 ,891
CompetitiveRivalry 835 3,86 ,918 ,843
Valid N (listwise) 794
Environment constructs
Descriptive Statistics
N Mean Std. Deviation
PEST 828 3,3023 ,76588
MARKET 828 3,4352 ,68962
PORTER 811 3,3258 ,55169
Valid N (listwise) 794
Risk probability
Descriptive Statistics
N Mean Std. Deviation Variance
Prob_Shipment 801 2,32 1,212 1,469
Prob_Operations 804 2,52 1,181 1,396
Prob_Supplier 806 2,74 1,168 1,364
Valid N (listwise) 801

86
Risk Impact
Descriptive Statistics
N Mean Std. Deviation Variance
Imp_Shipment 801 3,37 1,320 1,742
Imp_Operations 804 3,52 1,241 1,540
Imp_Supplier 807 3,66 1,183 1,399
Valid N (listwise) 801
Proactive and Reactive Risk Management (last 3 year)
Descriptive Statistics
N Mean Std. Deviation Variance
RecoveringL3Y 794 3,15 1,077 1,159
DetectingL3Y 796 3,27 ,993 ,986
RespondingL3Y 795 3,28 ,971 ,943
PreventingL3Y 798 3,42 ,958 ,919
Valid N (listwise) 791
Proactive and Reactive Risk Management (now)
Descriptive Statistics
N Mean Std. Deviation Variance
Recovering 794 3,35 1,080 1,166
Detecting 795 3,46 ,957 ,916
Responding 797 3,47 ,966 ,933
Preventing 798 3,52 ,935 ,875
Valid N (listwise) 790
Supply chain Management practices (last 3 year)
Descriptive Statistics
N Mean Std. Deviation Variance
SystemCouplingC 768 2,77 1,238 1,533
SystemCouplingS 777 2,80 1,157 1,338
InterDistrC 762 2,83 1,289 1,663
InterSourcingS 776 2,89 1,226 1,503
CollabApprC 772 3,02 1,124 1,263
SharingInfoC 773 3,05 1,111 1,235
DecisionMakingS 778 3,05 1,022 1,045
DecisionMakingC 772 3,07 1,118 1,249
SharingInfoS 782 3,20 ,991 ,981
CollabApprS 780 3,21 1,030 1,062
Valid N (listwise) 747
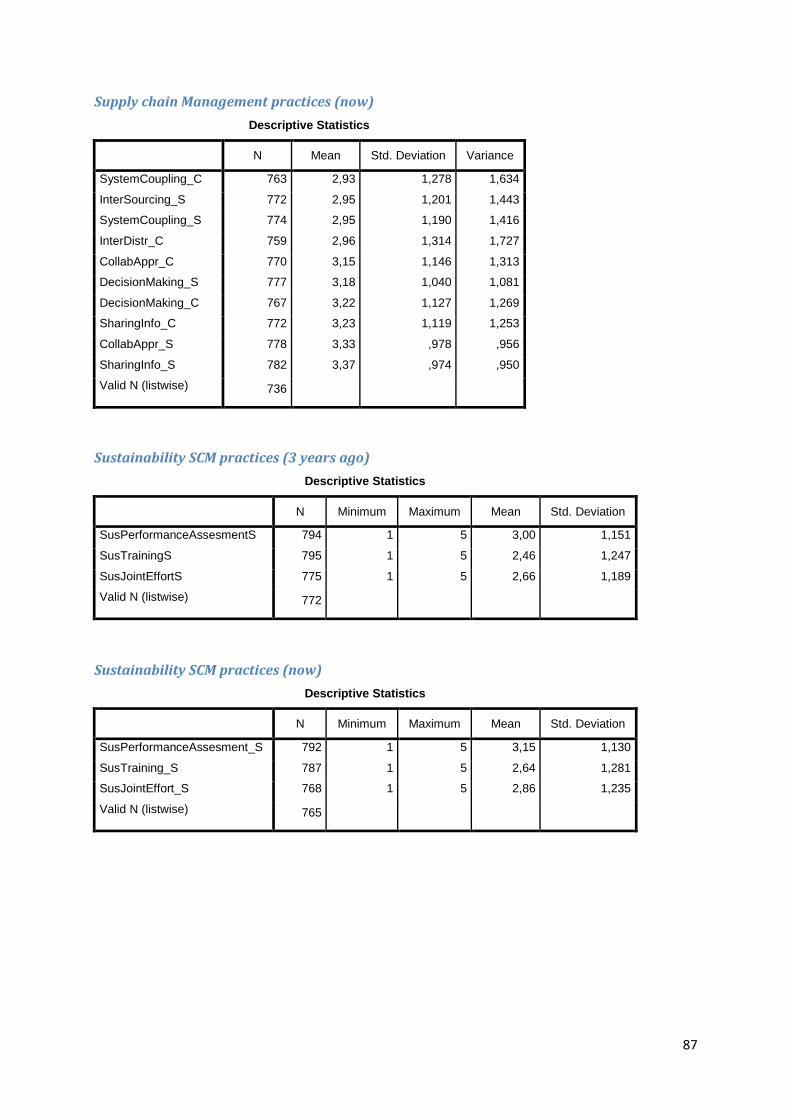
87
Supply chain Management practices (now)
Descriptive Statistics
N Mean Std. Deviation Variance
SystemCoupling_C 763 2,93 1,278 1,634
InterSourcing_S 772 2,95 1,201 1,443
SystemCoupling_S 774 2,95 1,190 1,416
InterDistr_C 759 2,96 1,314 1,727
CollabAppr_C 770 3,15 1,146 1,313
DecisionMaking_S 777 3,18 1,040 1,081
DecisionMaking_C 767 3,22 1,127 1,269
SharingInfo_C 772 3,23 1,119 1,253
CollabAppr_S 778 3,33 ,978 ,956
SharingInfo_S 782 3,37 ,974 ,950
Valid N (listwise) 736
Sustainability SCM practices (3 years ago)
Descriptive Statistics
N Minimum Maximum Mean Std. Deviation
SusPerformanceAssesmentS 794 1 5 3,00 1,151
SusTrainingS 795 1 5 2,46 1,247
SusJointEffortS 775 1 5 2,66 1,189
Valid N (listwise) 772
Sustainability SCM practices (now)
Descriptive Statistics
N Minimum Maximum Mean Std. Deviation
SusPerformanceAssesment_S 792 1 5 3,15 1,130
SusTraining_S 787 1 5 2,64 1,281
SusJointEffort_S 768 1 5 2,86 1,235
Valid N (listwise) 765

88
Supply Chain Design and Complexity (last 3 years)
Descriptive Statistics
N Mean Std. Deviation Variance
OneVSMultiplePlants 545 2,82 1,441 2,076
StableVSchangingFlexibilityPlant 547 2,88 1,300 1,689
NetwPerfMgmtSystemL3Y 523 3,06 1,185 1,404
UseOfTechnologyL3Y 524 3,23 1,163 1,352
IntegrInfoSystems 546 3,64 1,291 1,665
Valid N (listwise) 503
Supply Chain Design and Complexity (now)
Descriptive Statistics
N Mean Std. Deviation Variance
OneVSMultiplePlants 545 2,82 1,441 2,076
StableVSchangingFlexibilityPlant 547 2,88 1,300 1,689
NetwPerfMgmtSystem 525 3,22 1,220 1,488
UseOfTechnology 528 3,39 1,112 1,237
IntegrInfoSystems 546 3,64 1,291 1,665
Valid N (listwise) 502
Appendix 5: Different frameworks
Framework 1:
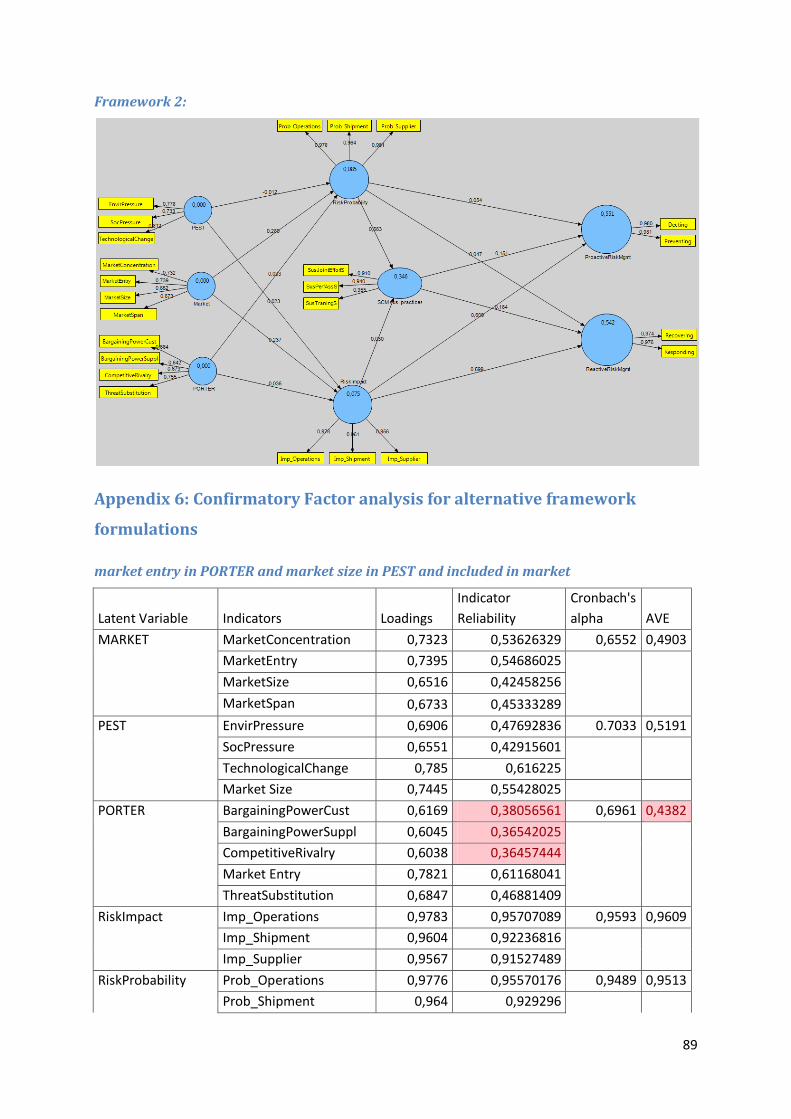
89
Framework 2:
Appendix 6: Confirmatory Factor analysis for alternative framework
formulations
market entry in PORTER and market size in PEST and included in market
Latent Variable Indicators Loadings
Indicator
Reliability
Cronbach's
alpha AVE
MARKET MarketConcentration 0,7323 0,53626329 0,6552 0,4903
MarketEntry 0,7395 0,54686025
MarketSize 0,6516 0,42458256
MarketSpan 0,6733 0,45333289
PEST EnvirPressure 0,6906 0,47692836 0.7033 0,5191
SocPressure 0,6551 0,42915601
TechnologicalChange 0,785 0,616225
Market Size 0,7445 0,55428025
PORTER BargainingPowerCust 0,6169 0,38056561 0,6961 0,4382
BargainingPowerSuppl 0,6045 0,36542025
CompetitiveRivalry 0,6038 0,36457444
Market Entry 0,7821 0,61168041
ThreatSubstitution 0,6847 0,46881409
RiskImpact Imp_Operations 0,9783 0,95707089 0,9593 0,9609
Imp_Shipment 0,9604 0,92236816
Imp_Supplier 0,9567 0,91527489
RiskProbability Prob_Operations 0,9776 0,95570176 0,9489 0,9513
Prob_Shipment 0,964 0,929296

90
Prob_Supplier 0,961 0,923521
ProactiveRiskMgmt Preventing 0,9809 0,96216481 0,9632 0,9316
Detecting 0,9796 0,95961616
ReactiveRiskMgmt Recovering 0,9743 0,94926049 0,9659 0,9362
Responding 0,9764 0,95335696
MARKET PEST PORTER
Proactive
RiskMgmt
Reactive
RiskMgmt
Risk
Impact
Risk
Probability
MARKET 0,7002
PEST 0,7135 0,7205
PORTER 0,7331 0,5641 0,6620
ProactiveRiskMgmt 0,2867 0,2439 0,2072 0,9803
ReactiveRiskMgmt 0,2926 0,2515 0,2033 0,9588 0,9753
RiskImpact 0,2707 0,2044 0,2215 0,7277 0,7195 0,9652
RiskProbability 0,2908 0,2038 0,232 0,6439 0,6376 0,8235 0,9676
All environmental factors together
Latent Variable Indicators Loadings
Indicator
Reliability
Cronbach's
alpha AVE
Environment MarketConcentration 0,671 0,450241 0,8293 0,3648
MarketEntry 0,6829 0,46635241
MarketSize 0,5758 0,33154564
MarketSpan 0,6062 0,36747844
EnvirPressure 0,6607 0,43652449
SocPressure 0,5619 0,31573161
TechnologicalChange 0,6464 0,41783296
BargainingPowerCust 0,5475 0,29975625
BargainingPowerSuppl 0,5101 0,26020201
CompetitiveRivalry 0,5998 0,35976004
ThreatSubstitution 0,5542 0,30713764
RiskImpact Imp_Operations 0,9783 0,95707089 0,9593 0,9609
Imp_Shipment 0,9604 0,92236816
Imp_Supplier 0,9567 0,91527489
RiskProbability Prob_Operations 0,9776 0,95570176 0,9489 0,9513
Prob_Shipment 0,964 0,929296
Prob_Supplier 0,961 0,923521
ProactiveRiskMgmt Preventing 0,9809 0,96216481 0,9632 0,9316
Detecting 0,9796 0,95961616
ReactiveRiskMgmt Recovering 0,9743 0,94926049 0,9659 0,9362
Responding 0,9764 0,95335696
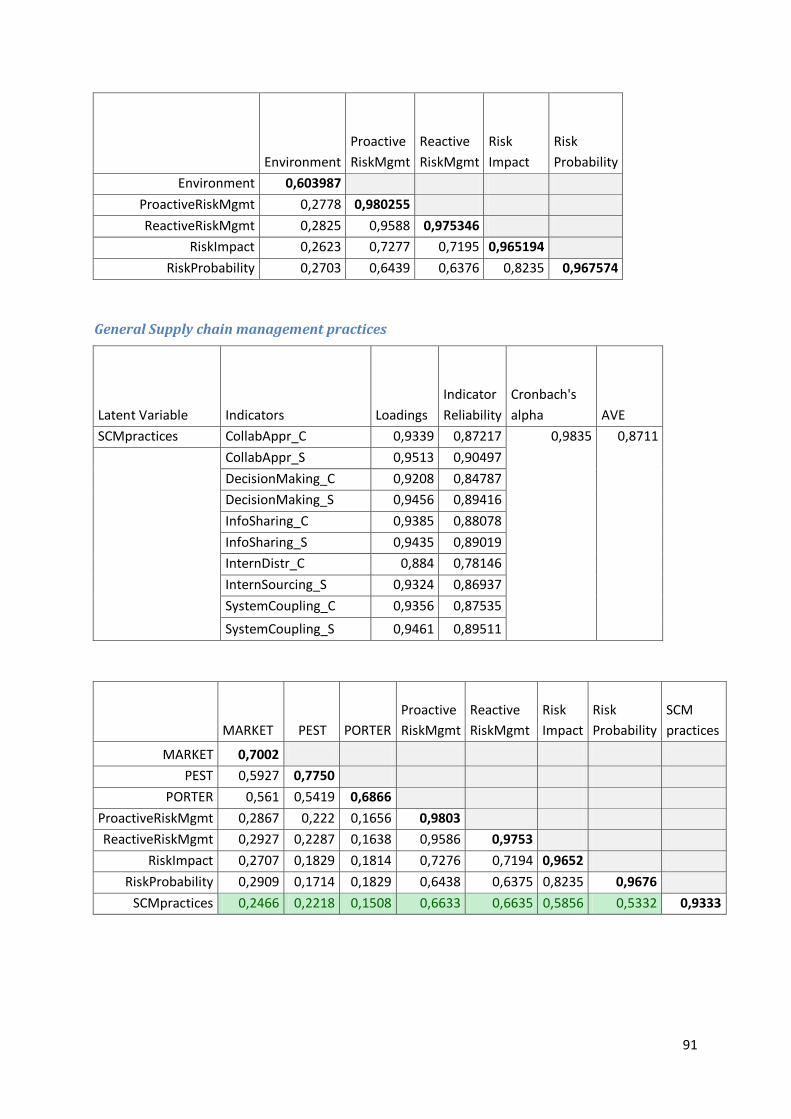
91
Environment
Proactive
RiskMgmt
Reactive
RiskMgmt
Risk
Impact
Risk
Probability
Environment 0,603987
ProactiveRiskMgmt 0,2778 0,980255
ReactiveRiskMgmt 0,2825 0,9588 0,975346
RiskImpact 0,2623 0,7277 0,7195 0,965194
RiskProbability 0,2703 0,6439 0,6376 0,8235 0,967574
General Supply chain management practices
Latent Variable Indicators Loadings
Indicator
Reliability
Cronbach's
alpha AVE
SCMpractices CollabAppr_C 0,9339 0,87217 0,9835 0,8711
CollabAppr_S 0,9513 0,90497
DecisionMaking_C 0,9208 0,84787
DecisionMaking_S 0,9456 0,89416
InfoSharing_C 0,9385 0,88078
InfoSharing_S 0,9435 0,89019
InternDistr_C 0,884 0,78146
InternSourcing_S 0,9324 0,86937
SystemCoupling_C 0,9356 0,87535
SystemCoupling_S 0,9461 0,89511
MARKET PEST
PORTER
Proactive
RiskMgmt
Reactive
RiskMgmt
Risk
Impact
Risk
Probability
SCM
practices
MARKET 0,7002
PEST 0,5927 0,7750
PORTER 0,561 0,5419 0,6866
ProactiveRiskMgmt 0,2867 0,222 0,1656 0,9803
ReactiveRiskMgmt 0,2927 0,2287 0,1638 0,9586 0,9753
RiskImpact 0,2707 0,1829 0,1814 0,7276 0,7194 0,9652
RiskProbability 0,2909 0,1714 0,1829 0,6438 0,6375 0,8235 0,9676
SCMpractices 0,2466 0,2218 0,1508 0,6633 0,6635 0,5856 0,5332 0,9333

92
Sustainable Supply chain management practices
Latent Variable Indicators Loadings
Indicator
Reliability
Cronbach's
alpha AVE
sus. SCM practices SusJointEffort_S 0,9123 0,8322913 0,9247 0,8691
SusPerfAss_S 0,9325 0,8695563
SusTraining_S 0,9514 0,905162
Market PEST
PORTER
Proactive
RiskMgmt
Reactive
RiskMgmt
Risk
Impact
Risk
Probability
SCM sust.
practices
Market 0,70021
PEST 0,5927 0,77505
PORTER 0,561 0,5419 0,68651
ProactiveRiskMgmt 0,2867 0,222 0,1656 0,9802551
ReactiveRiskMgmt 0,2927 0,2287 0,1638 0,9586 0,975346
RiskImpact 0,2707 0,1829 0,1814 0,7276 0,7194 0,9652
RiskProbability 0,2909 0,1714 0,1829 0,6438 0,6375 0,8235 0,96757429
SCM sust. practices 0,293 0,2553 0,175 0,5716 0,5836 0,5319 0,4656 0,9322553
Supply chain design and complexity
Latent Variable Indicators Loadings
Indicator
Reliability
Cronbach's
alpha AVE
Supply chain Design
and complexity
NetwPerfMgmtSystem 0,9683 0,9376049 0,9804 0,926
OneVSMultiplePlants 0,9523 0,9068753
IntegrInfoSystems 0,9598 0,921216
UseOfTechnology 0,9729 0,9465344
StableVSchangingFlexibilityPlant 0,9582 0,9181472
Market PEST
PORTER
Proactive
RiskMgmt
Reactive
RiskMgmt
Risk
Impact
Risk
Probability SCD&C
SCM (sus.)
practices
Market 0,7002 0 0 0 0 0 0 0 0
PEST 0,5927 0,77505 0 0 0 0 0 0 0
PORTER 0,561 0,5419 0,68651 0 0 0 0 0 0
Proactive 0,2867 0,222 0,1657 0,98025507 0 0 0 0 0
Reactive 0,2926 0,2286 0,1639 0,9588 0,9753461 0 0 0 0
Risk Impact 0,2707 0,1829 0,1814 0,7277 0,7195 0,9652 0 0 0
Risk Prob. 0,2909 0,1714 0,1829 0,6438 0,6376 0,8235 0,96757429 0 0
SCD&C 0,0914 0,1373 0,0461 0,1862 0,2135 0,225 0,207 0,962289 0
Sus. SCM 0,2842 0,2309 0,1626 0,483 0,4881 0,4936 0,5876 0,1696 0,9350936
Gen. SCM 0,2465 0,2218 0,1508 0,6632 0,6634 0,5855 0,5332 0,2669 0,933381
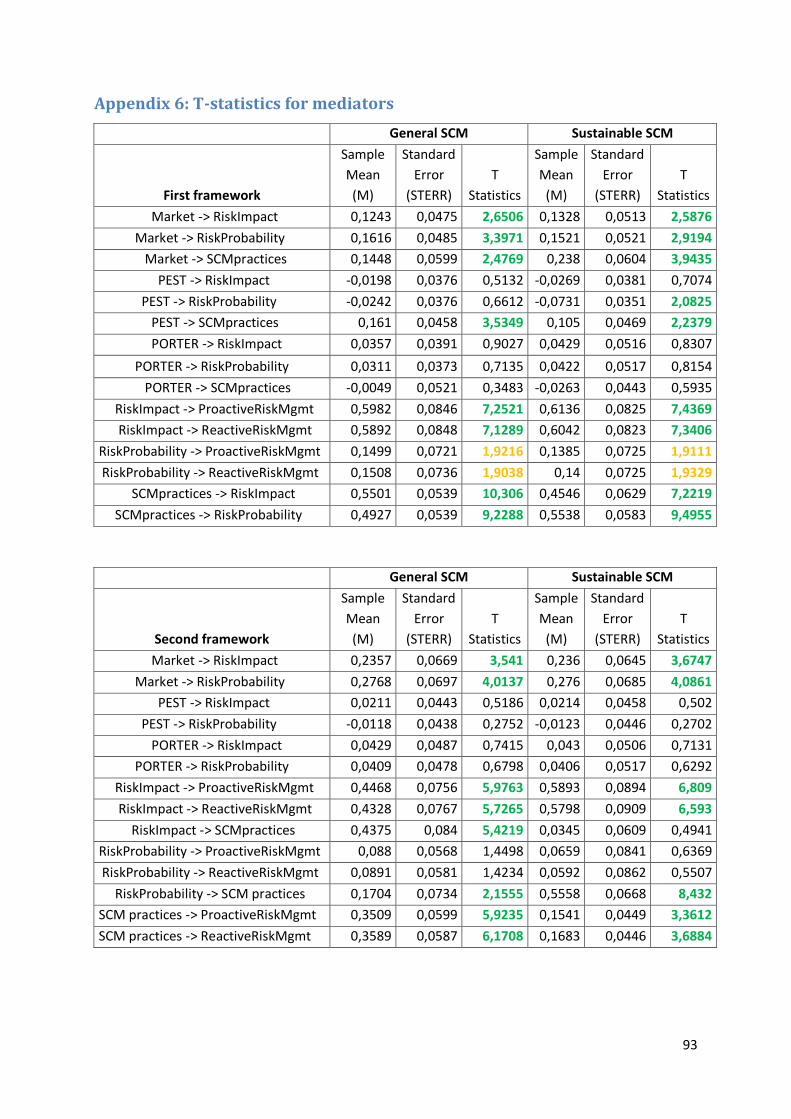
93
Appendix 6: T-statistics for mediators
General SCM Sustainable SCM
First framework
Sample
Mean
(M)
Standard
Error
(STERR)
T
Statistics
Sample
Mean
(M)
Standard
Error
(STERR)
T
Statistics
Market -> RiskImpact 0,1243 0,0475 2,6506 0,1328 0,0513 2,5876
Market -> RiskProbability 0,1616 0,0485 3,3971 0,1521 0,0521 2,9194
Market -> SCMpractices 0,1448 0,0599 2,4769 0,238 0,0604 3,9435
PEST -> RiskImpact -0,0198 0,0376 0,5132 -0,0269 0,0381 0,7074
PEST -> RiskProbability -0,0242 0,0376 0,6612 -0,0731 0,0351 2,0825
PEST -> SCMpractices 0,161 0,0458 3,5349 0,105 0,0469 2,2379
PORTER -> RiskImpact 0,0357 0,0391 0,9027 0,0429 0,0516 0,8307
PORTER -> RiskProbability 0,0311 0,0373 0,7135 0,0422 0,0517 0,8154
PORTER -> SCMpractices -0,0049 0,0521 0,3483 -0,0263 0,0443 0,5935
RiskImpact -> ProactiveRiskMgmt 0,5982 0,0846 7,2521 0,6136 0,0825 7,4369
RiskImpact -> ReactiveRiskMgmt 0,5892 0,0848 7,1289 0,6042 0,0823 7,3406
RiskProbability -> ProactiveRiskMgmt 0,1499 0,0721 1,9216 0,1385 0,0725 1,9111
RiskProbability -> ReactiveRiskMgmt 0,1508 0,0736 1,9038 0,14 0,0725 1,9329
SCMpractices -> RiskImpact 0,5501 0,0539 10,306 0,4546 0,0629 7,2219
SCMpractices -> RiskProbability 0,4927 0,0539 9,2288 0,5538 0,0583 9,4955
General SCM Sustainable SCM
Second framework
Sample
Mean
(M)
Standard
Error
(STERR)
T
Statistics
Sample
Mean
(M)
Standard
Error
(STERR)
T
Statistics
Market -> RiskImpact 0,2357 0,0669 3,541 0,236 0,0645 3,6747
Market -> RiskProbability 0,2768 0,0697 4,0137 0,276 0,0685 4,0861
PEST -> RiskImpact 0,0211 0,0443 0,5186 0,0214 0,0458 0,502
PEST -> RiskProbability -0,0118 0,0438 0,2752 -0,0123 0,0446 0,2702
PORTER -> RiskImpact 0,0429 0,0487 0,7415 0,043 0,0506 0,7131
PORTER -> RiskProbability 0,0409 0,0478 0,6798 0,0406 0,0517 0,6292
RiskImpact -> ProactiveRiskMgmt 0,4468 0,0756 5,9763 0,5893 0,0894 6,809
RiskImpact -> ReactiveRiskMgmt 0,4328 0,0767 5,7265 0,5798 0,0909 6,593
RiskImpact -> SCMpractices 0,4375 0,084 5,4219 0,0345 0,0609 0,4941
RiskProbability -> ProactiveRiskMgmt 0,088 0,0568 1,4498 0,0659 0,0841 0,6369
RiskProbability -> ReactiveRiskMgmt 0,0891 0,0581 1,4234 0,0592 0,0862 0,5507
RiskProbability -> SCM practices 0,1704 0,0734 2,1555 0,5558 0,0668 8,432
SCM practices -> ProactiveRiskMgmt 0,3509 0,0599 5,9235 0,1541 0,0449 3,3612
SCM practices -> ReactiveRiskMgmt 0,3589 0,0587 6,1708 0,1683 0,0446 3,6884

94
Appendix 7: Sobel test
Mediator between environment and risk perception
Mediation Test
generality direct no
med
direct w
med
IV->
Med
beta
Med ->
DV beta
IV ->med
SE
Med ->
DV SE Sobel test
Market ->
RiskImpact 0,237 0,133 0,1848 0,5553 0,0599 0,0559 2,946320656
Market ->
RiskProbability 0,28 0,187 0,1848 0,4971 0,0599 0,057 2,908512633
PEST ->
RiskImpact 0,023 -0,074 0,1228 0,5553 0,0515 0,0559 2,318605859
PEST ->
RiskProbability -0,012 -0,045 0,1228 0,4971 0,0515 0,057 2,300044582
PORTER ->
RiskImpact 0,036 0,048 -0,0189 0,5553 0,0527 0,0559 -0,35840029
PORTER ->
RiskProbability 0,033 0,044 -0,0189 0,4971 0,0527 0,057 -0,35833092
Mediation Test
sustainability
direct no
med
direct w
med
IV->
Med
beta
Med ->
DV beta
IV ->
med SE
Med ->
DV SE Sobel test
Market ->
RiskImpact 0,237 0,133 0,238 0,4546 0,0588 0,0614 3,55154551
Market ->
RiskProbability 0,28 0,152 0,238 0,5538 0,0588 0,0574 3,732464065
PEST ->
RiskImpact 0,023 -0,027 0,105 0,4546 0,0463 0,0614 2,168380126
PEST ->
RiskProbability -0,012 -0,073 0,105 0,5538 0,0463 0,0574 2,207651769
PORTER ->
RiskImpact 0,036 0,043 -0,0263 0,4546 0,0434 0,0614 -0,60397116
PORTER ->
RiskProbability 0,033 0,042 -0,0263 0,5538 0,0434 0,0574 -0,60479898
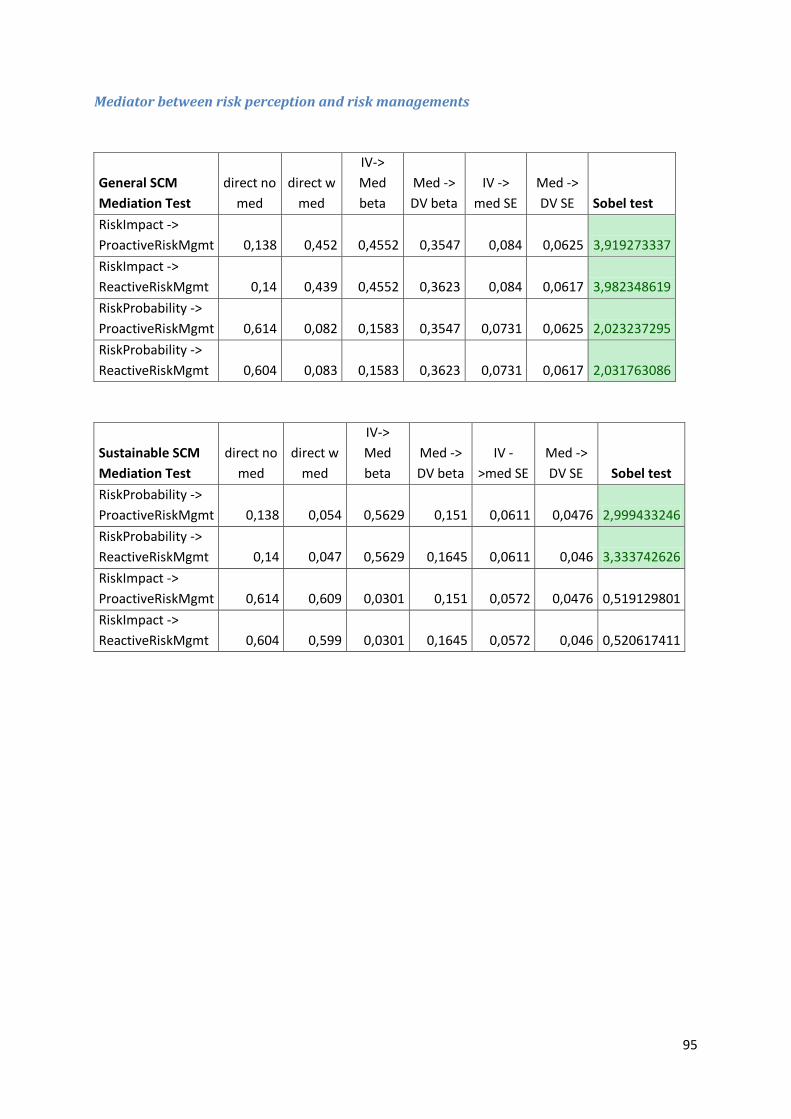
95
Mediator between risk perception and risk managements
General SCM
Mediation Test
direct no
med
direct w
med
IV->
Med
beta
Med ->
DV beta
IV ->
med SE
Med ->
DV SE Sobel test
RiskImpact ->
ProactiveRiskMgmt 0,138 0,452 0,4552 0,3547 0,084 0,0625 3,919273337
RiskImpact ->
ReactiveRiskMgmt 0,14 0,439 0,4552 0,3623 0,084 0,0617 3,982348619
RiskProbability ->
ProactiveRiskMgmt 0,614 0,082 0,1583 0,3547 0,0731 0,0625 2,023237295
RiskProbability ->
ReactiveRiskMgmt 0,604 0,083 0,1583 0,3623 0,0731 0,0617 2,031763086
Sustainable SCM
Mediation Test
direct no
med
direct w
med
IV->
Med
beta
Med ->
DV beta
IV -
>med SE
Med ->
DV SE Sobel test
RiskProbability ->
ProactiveRiskMgmt 0,138 0,054 0,5629 0,151 0,0611 0,0476 2,999433246
RiskProbability ->
ReactiveRiskMgmt 0,14 0,047 0,5629 0,1645 0,0611 0,046 3,333742626
RiskImpact ->
ProactiveRiskMgmt 0,614 0,609 0,0301 0,151 0,0572 0,0476 0,519129801
RiskImpact ->
ReactiveRiskMgmt 0,604 0,599 0,0301 0,1645 0,0572 0,046 0,520617411
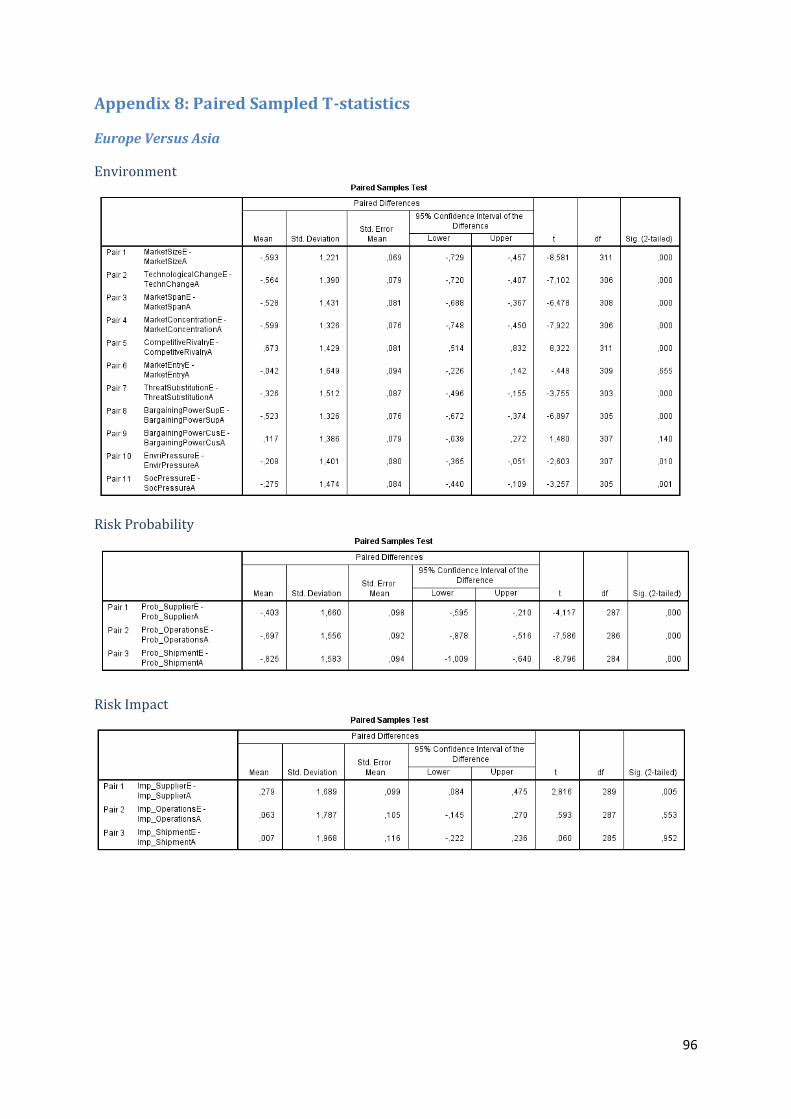
96
Appendix 8: Paired Sampled T-statistics
Europe Versus Asia
Environment
Risk Probability
Risk Impact

97
Risk Management
General SCM practices
Sustainable SCM practices
Supply chain Complexity and Design

98
Low Versus High complex networks
Environment
Risk probability
Risk impact
Risk management

99
General SCM practices
Sustainable SCM practices

100
Appendix 9: Multi-group moderation and moderated mediation
First framework: SCM practices as mediator variables between environment and risk
perception
t-statistics first framework General SCM practices Sustainable SCM practices
MULTIGROUP MODERATION Asia VS EU L VS H compl Asia VS EU L VS H compl
Market -> RiskImpact 0,6359 0,7554 0,1017 0,6449
Market -> RiskProbability 1,1892 0,8877 0,5667 0,8953
Market -> SCMpractices 1,1295 0,2488 1,1138 1,0071
PEST -> RiskImpact 0,8564 0,3586 1,0135 0,0682
PEST -> RiskProbability 0,8752 1,3912 1,0766 1,6242
PEST -> SCMpractices 0,0793 0,9016 0,0823 0,3683
PORTER -> RiskImpact 0,9234 0,6434 0,5830 0,2117
PORTER -> RiskProbability 0,7361 0,7447 0,5702 0,3206
PORTER -> SCMpractices 0,6403 0,2952 1,2589 0,0545
RiskImpact -> ProactiveRiskMgmt 0,6523 0,2320 0,6822 0,1851
RiskImpact -> ReactiveRiskMgmt 0,8333 0,1418 0,8873 0,1318
RiskProbability -> ProactiveRiskMgmt 1,4035 1,5103 1,4342 1,4014
RiskProbability -> ReactiveRiskMgmt 1,4983 1,5621 1,5379 1,4461
SCMpractices -> RiskImpact 1,5009 0,2412 0,1811 1,7324
SCMpractices -> RiskProbability 0,9471 1,2217 0,3756 0,5853
MODERATED MEDIATION
Market -> ProactiveRiskMgmt 0,0921 0,5414 0,1588 0,6779
Market -> ReactiveRiskMgmt 0,1324 0,5600 0,1973 0,6879
Market -> RiskImpact 0,4830 0,7625 0,5295 0,7815
Market -> RiskProbability 0,1686 1,2184 0,1003 0,9775
PEST -> ProactiveRiskMgmt 0,8700 0,6280 0,9759 0,6196
PEST -> ReactiveRiskMgmt 0,8901 0,5499 0,9987 0,5612
PEST -> RiskImpact 0,8096 0,2623 0,8997 0,3300
PEST -> RiskProbability 0,8173 1,3142 0,9025 1,5949
PORTER -> ProactiveRiskMgmt 1,0701 0,4724 1,2789 0,2779
PORTER -> ReactiveRiskMgmt 1,0701 0,4956 1,2794 0,2736
PORTER -> RiskImpact 1,0368 0,7161 1,2493 0,2701
PORTER -> RiskProbability 0,8804 0,8246 1,0696 0,3544
SCMpractices -> ProactiveRiskMgmt 0,6333 0,2016 0,1201 0,9118
SCMpractices -> ReactiveRiskMgmt 0,7378 0,2174 0,0295 0,9469

101
Second framework: SCM practices as mediator variables between risk perception and risk
management
t-statistics second framework General SCM practices Sustainable SCM practices
MULTIGROUP MODERATION Asia VS EU L VS H compl Asia VS EU L VS H compl
Market -> RiskImpact 0,4976 1,1442 0,5062 1,1739
Market -> RiskProbability 0,1458 1,3351 0,1494 1,2834
PEST -> RiskImpact 0,7539 0,1577 0,7588 0,1431
PEST -> RiskProbability 0,7227 1,2396 0,7377 1,2143
PORTER -> RiskImpact 0,9955 0,6033 1,0715 0,5718
PORTER -> RiskProbability 0,8138 0,7038 0,8736 0,6983
RiskImpact -> ProactiveRiskMgmt 0,0613 0,1446 0,0035 0,1807
RiskImpact -> ReactiveRiskMgmt 0,1062 0,0357 0,1017 0,1461
RiskImpact -> SCMpractices 1,2544 0,6952 0,9063 2,0087
RiskProbability -> ProactiveRiskMgmt 1,7020 1,8121 1,3502 1,8093
RiskProbability -> ReactiveRiskMgmt 1,8689 1,7024 1,4679 1,6676
RiskProbability -> SCMpractices 0,3864 1,7177 0,9838 1,3541
SCMpractices -> ProactiveRiskMgmt 0,2912 0,0693 1,2534 1,9513
SCMpractices -> ReactiveRiskMgmt 0,6251 0,6917 1,5046 1,7178
MODERATED MEDIATION
Market -> ProactiveRiskMgmt 0,1111 0,8848 0,1324 0,8779
Market -> ReactiveRiskMgmt 0,1500 0,9020 0,1742 0,8940
Market -> SCMpractices 0,7655 1,1293 0,4025 0,0584
PEST -> ProactiveRiskMgmt 0,8080 0,5949 0,8049 0,6170
PEST -> ReactiveRiskMgmt 0,8298 0,5160 0,8266 0,5377
PEST -> SCMpractices 0,8885 0,5226 0,8417 0,4072
PORTER -> ProactiveRiskMgmt 1,0257 0,4569 1,0915 0,4078
PORTER -> ReactiveRiskMgmt 1,0282 0,4765 1,0931 0,4329
PORTER -> SCMpractices 0,9701 0,5471 1,1142 0,5982
RiskImpact -> ProactiveRiskMgmt 0,6679 0,3094 0,6310 0,1923
RiskImpact -> ReactiveRiskMgmt 0,8715 0,2051 0,8234 0,1000
RiskProbability -> ProactiveRiskMgmt 1,4946 1,5499 1,3899 1,6031
RiskProbability -> ReactiveRiskMgmt 1,6070 1,5853 1,4914 1,5595

102
Appendix 10: Statistics for differences with 3 years ago
Variable paired samples t-test
Proactive and Reactive management
Whole world
Asia
Europe
Proactive versus Reactive
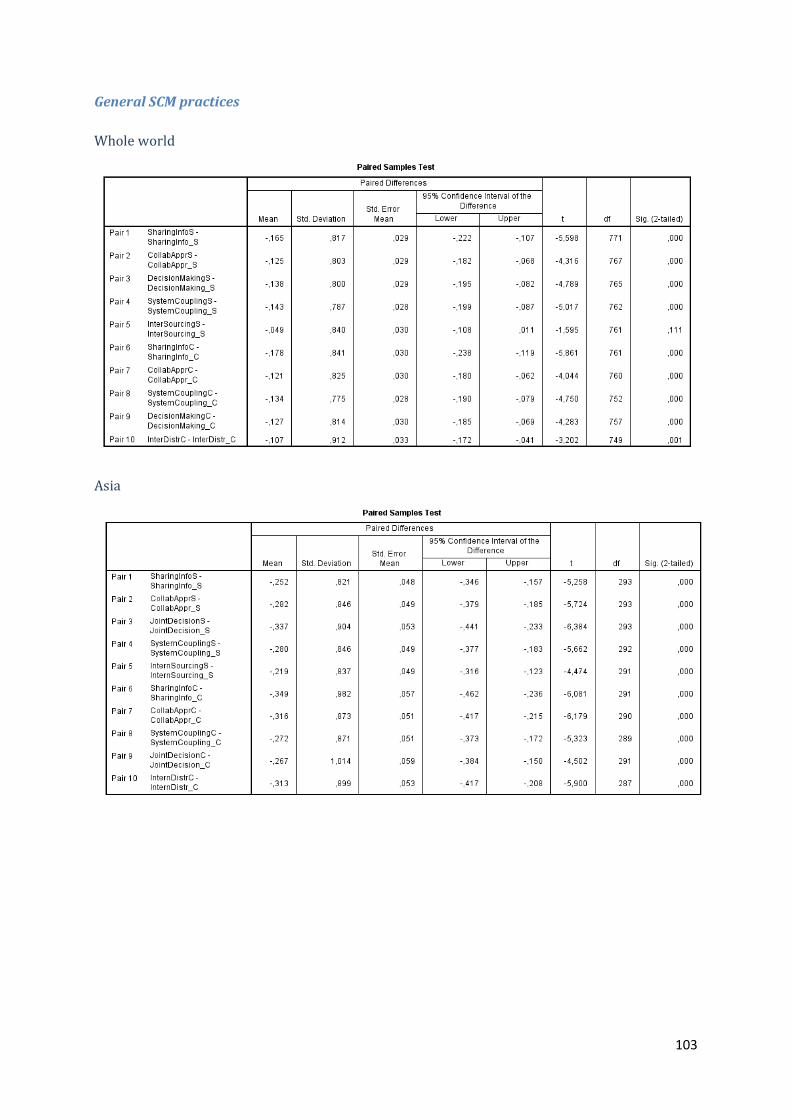
103
General SCM practices
Whole world
Asia

104
Europe
Sustainable SCM practices
Whole world
Asia
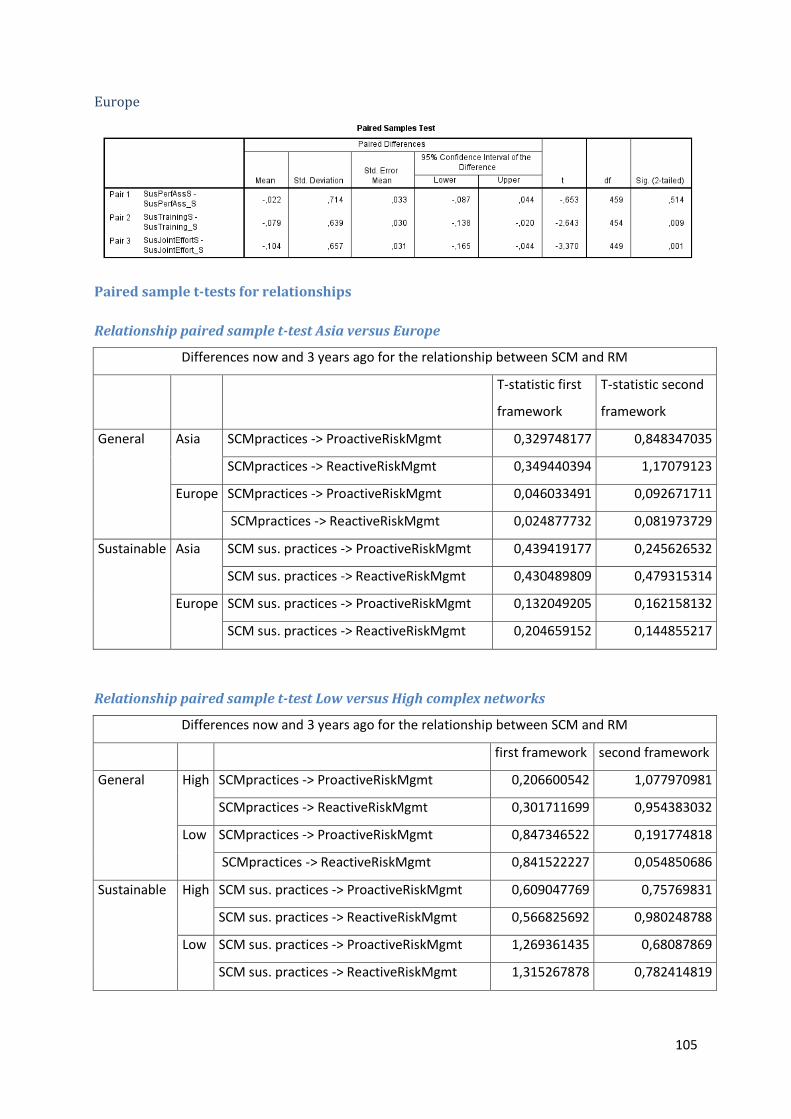
105
Europe
Paired sample t-tests for relationships
Relationship paired sample t-test Asia versus Europe
Differences now and 3 years ago for the relationship between SCM and RM
T-statistic first
framework
T-statistic second
framework
General Asia SCMpractices -> ProactiveRiskMgmt 0,329748177 0,848347035
SCMpractices -> ReactiveRiskMgmt 0,349440394 1,17079123
Europe SCMpractices -> ProactiveRiskMgmt 0,046033491 0,092671711
SCMpractices -> ReactiveRiskMgmt 0,024877732 0,081973729
Sustainable Asia SCM sus. practices -> ProactiveRiskMgmt 0,439419177 0,245626532
SCM sus. practices -> ReactiveRiskMgmt 0,430489809 0,479315314
Europe SCM sus. practices -> ProactiveRiskMgmt 0,132049205 0,162158132
SCM sus. practices -> ReactiveRiskMgmt 0,204659152 0,144855217
Relationship paired sample t-test Low versus High complex networks
Differences now and 3 years ago for the relationship between SCM and RM
first framework second framework
General High SCMpractices -> ProactiveRiskMgmt 0,206600542 1,077970981
SCMpractices -> ReactiveRiskMgmt 0,301711699 0,954383032
Low SCMpractices -> ProactiveRiskMgmt 0,847346522 0,191774818
SCMpractices -> ReactiveRiskMgmt 0,841522227 0,054850686
Sustainable High SCM sus. practices -> ProactiveRiskMgmt 0,609047769 0,75769831
SCM sus. practices -> ReactiveRiskMgmt 0,566825692 0,980248788
Low SCM sus. practices -> ProactiveRiskMgmt 1,269361435 0,68087869
SCM sus. practices -> ReactiveRiskMgmt 1,315267878 0,782414819