the use of x ray in circuit inspection - ulisboa
TRANSCRIPT

1
ABSTRACT
Industrial Radiography is a method for non-destructive inspection, which is based on the differential absorption of penetrating radiation by the part under inspection. Due to density differences, material thickness variations and differences in absorption characteristics caused by variations in the material composition, different regions of a piece absorb different amounts of penetrating radiation. These differences in radiation absorption can be detected via a radiographic film, through an image intensifier tube or electronic radiation detectors. The variation of the absorbed radiation, when detected by any of those means, will permit the detection of existing internal faults or defects in the pieces being inspected. Industrial Radiography fields in electronics industry, include semiconductor encapsulation, SMT circuit boards and also through-hole board assemblies. Concerning circuits encapsulation, taking into consideration the big number of pins and the reduced space among them, the challenges are bigger and impose new requirements, especially in circuits CSPs (Chip Size Packages), also known as "flip chips", where the pin out is close to each other. Currently, there are some limitations in the encapsulation of complex systems, whose lies at the spatial level, being related to three-dimensional connection of active and passive components. This project, started with the reactivation of an unused industrial X-Ray equipment, performing the necessary maintenance operations, in order to ensure, as far as possible, the exploitation of the equipment capabilities. Further, it was developed an image enhancement platform that came to improve the quality of the acquired bi-dimensional images, as well as the simulation of a three-dimensional model. The tools developed are supported by object manipulators, belonging to the X-Ray system, which provides five types of movements. Moreover, the image intensifier was also an important device used in the study and development of that platform, as well as the introduction of a friendly use small remote control, for some maneuvers. In addition, it were studied and developed a tool for simulating a three-dimensional model, based in the acquisition of several bi-dimensional images throw the image intensifier and performing a reconstruction from those projections. The objects from whose we wanted to get the images were placed into X-Ray field, between the X-Ray source and the Image Intensifier and manually submitted to rotation
around their own axis by some degrees at a time, until a complete rotation. MATLAB was the SW tool, used to fulfill the applications under development. Index Terms: X-Ray equipment, industrial nondestructive inspection, radiation, image improvement, three dimension model simulation.
1. INTRODUCTION
n several industrial plants or researching laboratories involved in the field of electronic systems or devices, it is mandatory, along the processes of
manufacturing, assembling or researching, to betake procedures of maintenance, testing, simulation and quality control. Particularly, in some industrial areas, such as automobile, aircraft, informatics, etc., the non-destructive inspection is absolutely necessary to assure the highest quality of the manufactured products, avoiding the risk of their damaging. The current project approaches and describes, either the operations or tools developed to get its goal, by using a X-Ray equipment, brand FEINFOCUS, with X-Ray tube FXT-160.51, especially designed for use in non-destructive testing [5]. Below, on the figure 1, we can see an example of an electronic device that was submitted at non-destructive inspection, by using X-Rays.
Figure 1 - A microprocessor unit subjected to X-Ray inspection
1.1 PRINCIPLES OF X-RAY TESTING
X-Ray inspection is a non-destructive method of analysis and quality control, based in the differentiated absorption of the X-Ray penetrating radiation, according the density
The Use of X-Ray in Circuit Inspection
João Miguel Cardoso Matos, Moisés Simões Piedade e Carlos Beltrán Almeida
Instituto Superior Técnico
Av. Rovisco Pais, 1049-001 Lisboa, Portugal
E-mail: [email protected]
I

2
and thickness of the pieces, devices or any other products under inspection. It is assumed that materials with the same density, thickness and pureness, should absorb the same amount of radiation. In accordance with the radiation amount and materials density, the penetrating radiation shall be detected by an X-Ray detector, where shades with the same level of gray must represent zones of the irradiated area with the same density or thickness. These characteristics and the resulting image, will allow the user to identify flaws or defects in the object submitted to analysis. Furthermore, by using this method it is possible to detect volumetric differences, such as empty spaces, inclusions and interruptions into materials under inspection. In figure 2, it is schematically represented the method of acquisition of an image, by using a non-destructive X-Ray system.
Figure 2 - Principle of non-destructive X-Ray inspection method
1.2 PROPERTIES OF X-RAYS
X-Rays are constituted by electromagnetic radiation (EMR), with similar behavior as light rays. Their reduced wavelength, about 1/10000 of light rays is the main difference between each other. X-Rays was casually discovered in 1895 by the physicist Wilhelm Conrad Röntgen. X-Ray beam contains radiation with different wavelengths, whose can be defined, using (1.1):
Where: λ = Wavelength in nanometers (10
-9 m);
kV = Voltage in kilovolts;
The main properties of X-Rays are listed in table 1.
Table 1 – X-Ray Properties
Invisibility Non perceptible by human
senses
Wave Behavior Beam is propagated in a linear way and at same speed as visible light
Optical Properties Beam can’t be deflected
by prisms of lenses.
Penetration Beam crosses materials being partially absorbed
Ionizing Beam release electrons
into matter.
Health Care X-Rays are dangerous for
living tissues
Radiation intensity and consequent penetration in some matter is determined by the incident radiation, affected by the following effects:
1. Photoelectric Effect; 2. Compton Effect; 3. Pair Production;
1.3 X-RAY EQUIPMENT
Schematic view of an Industrial X-Ray equipment is shown in figure 3, as being the unit used for reaching the results of the present project. It is constituted by:
1. FXT – X-Ray Tube; 2. FHC – High Voltage Generator; 3. FRV – Vacuum Pump; 4. FII – Image Intensifier; 5. FVC – Image Acquisition; 6. FRS – Object Moving Motors; 7. FXC – Cabinet;
Figure 3 - X-Ray Equipment
(1.1)
3
X-Ray Tube (FXT) The X-Ray tube is basically a hot cathode triode, constituted by three main parts: the positive electrode (anode), the negative electrode (cathode) and the focusing grid. These three parts are inserted in a glass or ceramic ampoule, submitted to a high vacuum system reaching 10
-6 bar. For granting the protection of the
ampoule, it is encapsulated into a protection involucre, containing high dielectric oil or inert gas. The vacuum inside the ampoule is absolutely mandatory. The cathode is composed by a filament and a focusing cup. The filament is a small electric conductor, tungsten made, spiral shape, while the focusing cup encapsulates the filament. Its main function, after adequately heated, is to release electrons, which are going to be focused through the focusing grid to get a very well concentrated beam, towards the anode. Filament is fed through a controlled low voltage power supply, 6 to 12 VAC. This voltage heats the filament, being the quantity of released electrons, directly proportional to the fed voltage. The anode is the positive electrode, constituted by a metallic alloying, responsible for producing radiation. There is a target inserted in the anode, where the electronic beam coming from the cathode crashes with the impact due to its high acceleration. The impact causes a phenomenon similar to fission (Division of a heavy atom (uranium, plutonium) into two or more fragments, thanks to the bombardment with neutrons made, phenomenon which results in the release of massive amounts of energy). Such fission result is the production of X-Rays, which energy level is about a 1% to 40 % relating to the released electron beam. The collision point is called focal point. The metal alloying is constituted by special materials, able to effectively dissipate the anode accumulated heating. Taking into consideration the enormous thermal energy accumulated in the anode, it is necessary to protect it against melting. So to ensure the proper cooling of the X-Ray Tube it is used a refrigeration system, which can work through: natural irradiation; convection refrigeration or refrigeration by forced circulation of a fluid. An X-Ray Tube has three main characteristics: Focal Spot, Voltage and Current. The voltage in the tube is the potential difference between the cathode and anode, being very high and expressed in kilovolts (kV). The value of this potential difference determines the electron beam energy. The amount of X-Ray radiation is directly proportional to high voltage. It takes influence, on the kinetic energy of the beam, as well as on the type of resulting radiation, being more or less penetrating, in the same ratio as high voltage increases or decreases. When we refer the current in the X-Ray tube, we are talking about the number of the electrons in the electron beam. Since the value of such current is low (normally between 1mA and 1200 mA), the unit to express its value is normally expressed in milliamps (mA). The electron beam current is proportional to the cathode
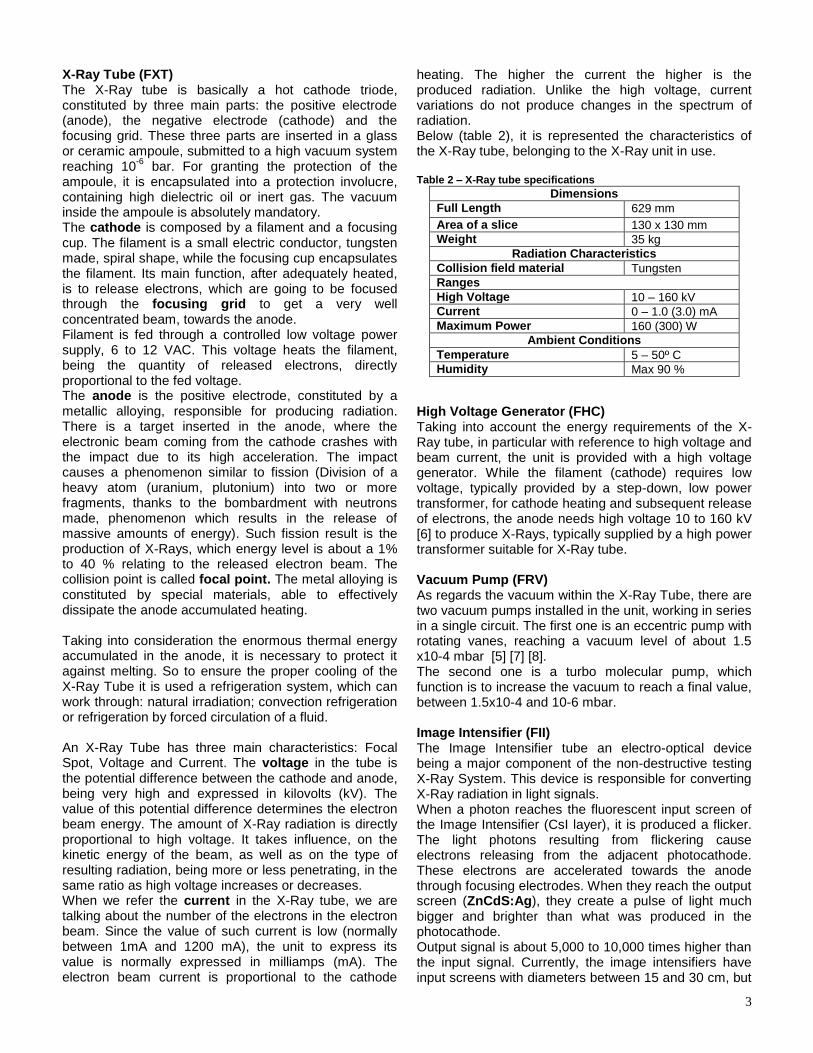
heating. The higher the current the higher is the produced radiation. Unlike the high voltage, current variations do not produce changes in the spectrum of radiation. Below (table 2), it is represented the characteristics of the X-Ray tube, belonging to the X-Ray unit in use. Table 2 – X-Ray tube specifications
Dimensions
Full Length 629 mm
Area of a slice 130 x 130 mm
Weight 35 kg
Radiation Characteristics
Collision field material Tungsten
Ranges
High Voltage 10 – 160 kV
Current 0 – 1.0 (3.0) mA
Maximum Power 160 (300) W
Ambient Conditions
Temperature 5 – 50º C
Humidity Max 90 %
High Voltage Generator (FHC) Taking into account the energy requirements of the X-Ray tube, in particular with reference to high voltage and beam current, the unit is provided with a high voltage generator. While the filament (cathode) requires low voltage, typically provided by a step-down, low power transformer, for cathode heating and subsequent release of electrons, the anode needs high voltage 10 to 160 kV [6] to produce X-Rays, typically supplied by a high power transformer suitable for X-Ray tube. Vacuum Pump (FRV) As regards the vacuum within the X-Ray Tube, there are two vacuum pumps installed in the unit, working in series in a single circuit. The first one is an eccentric pump with rotating vanes, reaching a vacuum level of about 1.5 x10⁻⁴ mbar [5] [7] [8]. The second one is a turbo molecular pump, which function is to increase the vacuum to reach a final value, between 1.5x10⁻⁴ and 10-6 mbar. Image Intensifier (FII) The Image Intensifier tube an electro-optical device being a major component of the non-destructive testing X-Ray System. This device is responsible for converting X-Ray radiation in light signals. When a photon reaches the fluorescent input screen of the Image Intensifier (CsI layer), it is produced a flicker. The light photons resulting from flickering cause electrons releasing from the adjacent photocathode. These electrons are accelerated towards the anode through focusing electrodes. When they reach the output screen (ZnCdS:Ag), they create a pulse of light much bigger and brighter than what was produced in the photocathode. Output signal is about 5,000 to 10,000 times higher than the input signal. Currently, the image intensifiers have input screens with diameters between 15 and 30 cm, but

4
there are also others with 40 cm. The output screen is usually 2.5 to 3.5 cm in diameter. The Image Intensifier Tubes are shielded by a metal encapsulation that avoids either external magnetic fields or radiation leakage. The Image Intensifier installed on the equipment use is a THOMPSON, TH 9428 HP, triple input field (23; 15 and 11 cm, in diameter) Image Acquisition (FVC) To acquire the image produced by the image intensifier, there is a video camera, installed in perpendicular to the image intensifier and using an optical mirror [9], to project the image coming from the image intensifier output screen, to the camera. Object Moving Motors (FRS) The object under inspection is fixed by a clamping box, being possible to move it using the mechanical arms of the X-Ray system, that provide five types of movements, X;Y;Z; Rotation around Y and Z; Image Intensifier far near movement. All movements of the mechanical arms are motorized using steep motors, whose are controlled by joysticks, from an external control console. Every steep motor control is controlled by a generator of electric impulses, activated by a suitable joystick. The above mentioned movements are: Xr, Yr, Zr, Vr(y), Ur(x) and ZII, as can be seen in figure 3. Cabinet (FXC) All parts, devices and systems of the equipment, are installed inside of a metal container, iron made, internally shielded by lead sheet, with 2 mm thickness. In a lateral side of the container there is a window with dimensions 700 x 600 mm, with a sliding crystal glass (composed of silica and lead), with thickness equivalent to 2 mm. of lead (Pb), allowing control visualization of the object under test. Control Console Either preview or object handling, as well as every command of the system, are set through an external console (figure 4).
Safety Issues The cabinet shape respects the “Röntgenverordnung” standards. The average of radiation dose is calculated
using the reference values of 200 kV for high voltage and 1 mA for current. By these values, the quantity of radiation in any point of the cabinet cannot exceed 2.5 μSv per hour [10].
2. PHYSICAL PROJECT
This section describes all operations performed in the image production devices as well as in the image acquisition devices.
2.1 Production of Image in X-Ray
The first approach for fixing the problems on the equipment, were based in the error codes and listed details seen on the control console visualization screen. The main error was: “error 347: Operating vacuum not obtained in time”. This information came to let us know that the vacuum system was not working properly. Vacuum System Operations Facing the failure in the vacuum circuit, two steps were taken into consideration for fixing the problem. The first operation was to repair the connection joints, since the O-rings were very parched to perform their function. All O-rings were replaced from the vacuum pump until the X-Ray tube, so the leakages could be eliminated. Since the mandatory vacuum was not still reached, it was necessary to perform some reparation operations inside the vacuum pump. After the disassemble of the vacuum pump, their O-rings were replaced and the vanes on the eccentric pump rotor that were showing an irregularly worn due to age and use, were rectified, and reinstalled on its place. Finally, we proceed to pump reassembly, being the oil inside the pump body, replaced by a similar one [7] [5]. Refrigeration System Being the refrigeration system’s pump working well, it was only needed to replace the dirty and old fluid by clean distilled water.
2.2 Image Acquisition in X-Ray
The section describes the improvement operations made in the image intensifier and video camera. Image Intensifier First of all, the image intensifier lenses were carefully cleaned. Afterwards, we started the recalibration of the image intensifier, which from our point of view, was one of the most important tasks to be made. Doing this task carefully and accurately, we could ensure we would get the best focused image for all image intensifier’s fields. Recalibration was focused onto the polarization voltages of the four electrodes (electrostatic lens). Our main objective was to get the best image possible, so those
Figure 4 - External Control Console
5
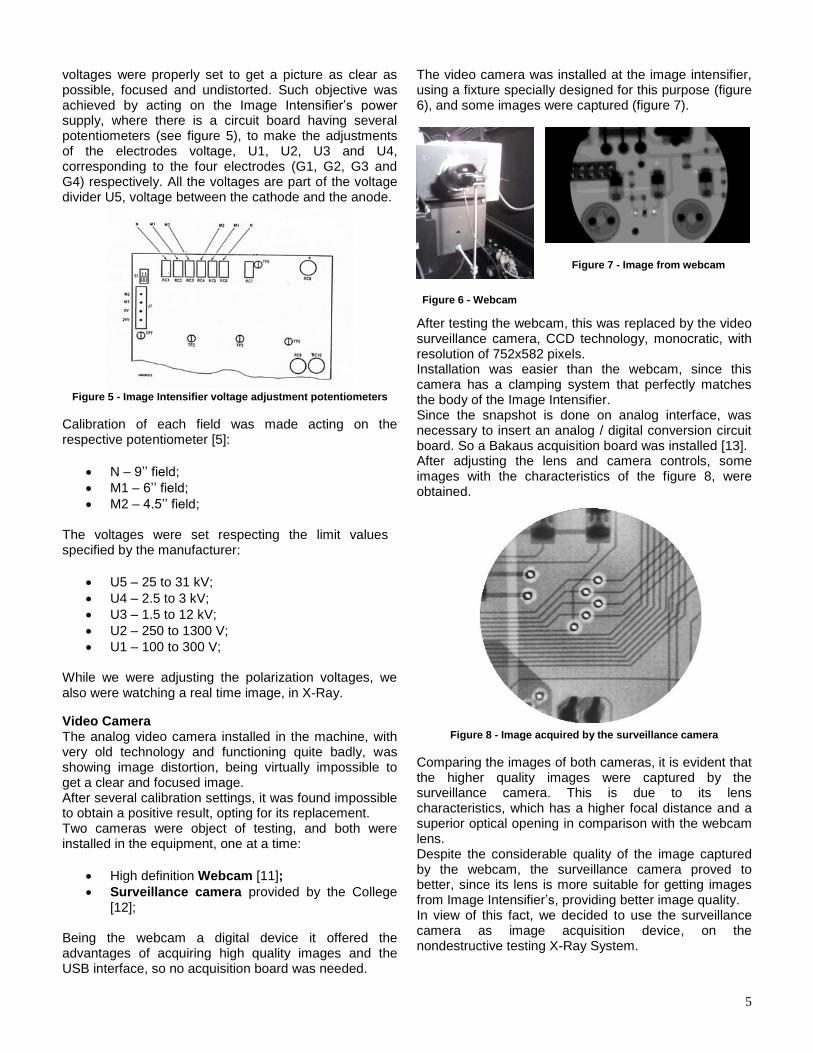
voltages were properly set to get a picture as clear as possible, focused and undistorted. Such objective was achieved by acting on the Image Intensifier’s power supply, where there is a circuit board having several potentiometers (see figure 5), to make the adjustments of the electrodes voltage, U1, U2, U3 and U4, corresponding to the four electrodes (G1, G2, G3 and G4) respectively. All the voltages are part of the voltage divider U5, voltage between the cathode and the anode.
Figure 5 - Image Intensifier voltage adjustment potentiometers
Calibration of each field was made acting on the respective potentiometer [5]:
N – 9’’ field;
M1 – 6’’ field;
M2 – 4.5’’ field; The voltages were set respecting the limit values specified by the manufacturer:
U5 – 25 to 31 kV;
U4 – 2.5 to 3 kV;
U3 – 1.5 to 12 kV;
U2 – 250 to 1300 V;
U1 – 100 to 300 V; While we were adjusting the polarization voltages, we also were watching a real time image, in X-Ray.
Video Camera The analog video camera installed in the machine, with very old technology and functioning quite badly, was showing image distortion, being virtually impossible to get a clear and focused image. After several calibration settings, it was found impossible to obtain a positive result, opting for its replacement. Two cameras were object of testing, and both were installed in the equipment, one at a time:
High definition Webcam [11];
Surveillance camera provided by the College [12];
Being the webcam a digital device it offered the advantages of acquiring high quality images and the USB interface, so no acquisition board was needed.
The video camera was installed at the image intensifier, using a fixture specially designed for this purpose (figure 6), and some images were captured (figure 7).
After testing the webcam, this was replaced by the video surveillance camera, CCD technology, monocratic, with resolution of 752x582 pixels. Installation was easier than the webcam, since this camera has a clamping system that perfectly matches the body of the Image Intensifier. Since the snapshot is done on analog interface, was necessary to insert an analog / digital conversion circuit board. So a Bakaus acquisition board was installed [13]. After adjusting the lens and camera controls, some images with the characteristics of the figure 8, were obtained.
Figure 8 - Image acquired by the surveillance camera
Comparing the images of both cameras, it is evident that the higher quality images were captured by the surveillance camera. This is due to its lens characteristics, which has a higher focal distance and a superior optical opening in comparison with the webcam lens. Despite the considerable quality of the image captured by the webcam, the surveillance camera proved to better, since its lens is more suitable for getting images from Image Intensifier’s, providing better image quality. In view of this fact, we decided to use the surveillance camera as image acquisition device, on the nondestructive testing X-Ray System.
Figure 6 - Webcam
Figure 7 - Image from webcam

6
3. PROCESSING SYSTEM
This section will describe three tools, developed to ensure the project objectives:
1. Remote Control tool, remotely allowing some operations through the PC;
2. Bi-dimensional Image Improvement tool, allowing better detection of defects in the object under analysis;
3. Three-dimensional Simulated Model, regarding to the object submitted to our study;
Selection of tools can be performed by using the menu below. (figure 9).
Figure 9 – Tools Selection Menu
3.1 Remote Control Tool This equipment allows the remote control of some procedures by wiring it to a computer via serial interface V.24 (RS 232C). Connection specifications [14]:
Transmission rate from 110 to 19200 Baud. Each code is transmitted with maximum length of 7 to 8 bit, per character.
1 or 2 stopping bits, with pair or impair parity. Handshaking needed for synchronization.
Computer works as master and equipment as slave.
All codes transmitted require an answer, even in case of erroneous transmission.
All characters registered belong to the 7 bit ASCII table.
All codes terminated with the characters <CR> and <LF>. The command length mustn’t overwrite 80 bytes.
Master waits 10 seconds for the answer. If the answer is not received within that interval, the master resends the command.
For a required operation, the character must be send repeating the character (figure 10).
The following setup operations are allowed by the
remote control:
Current in the X-Ray tube between 50 and 1000
µA;
Voltage in the X-Ray tube between 10 and 150
kV;
Maximum X-Ray operation time between 0 and
9999 s;
Selection of the field of the Image Intensifier -
9’’, 6’’ and 4.5’’;
Focus offset adjustment of the X-Ray beam;
Centering offset adjusting X and Y coordinates;
Opening and closing the equipment door;
Switching on and off the X-Ray system;
Initialization button switching on the vacuum
system;
Remote Control Application is optional. It can be opened and closed by user request. If closed, the equipment is controlled by the Control Console Keyboard. A diagram containing the Remote Control procedures is shown in figure 11.
Figure 11 – Remote Control Tool diagram
3.2 Bi-dimensional improvement
In order to improve the image quality in bi-dimensional fields, it was developed a tool which incorporates a big number of algebraic and visualization operations. First of all, we have the possibility of adjusting the brightness, contrast and saturation, either on image preview or captured image.
Connection PC-Equipment,
via serial interface
Acquisition of Initial
parameters
User enters an X-Ray
parameter. (Ex:
Current).
User presses a control
button
Operation code is send to serial
interface
Equipment receives a command
and sends back the corresponding
code, via serial interface
Serial Interface
PC
Equipment
Equipment
PC
Character corresponding to the wanted command Parameter
Command Repetition “I40I40”
Figure 10 – Command Format
7
Camera descriptor
creation Active
preview
Values inserted
by user
Samples Image Capture
Brightness
Contrast
Saturation
Samples of
different values 20 image average
II Field Menu
Histogram Compensation
Sigmoid function
Calibration parameters
Image Storage
Equipment
PC
After selection of the Image Intensifier field, the tool performs a big quantity of operations, within the capture process. Each image is temporary stored into a matrix of 516 lines and 481 columns Each cellule contains a value between 0 and 255, being 0 the black color and 255 the white color. Values between 0 and 255 represent the grey shades. For improving the image quality, two kinds of techniques were used. The first one was for removing image noise and the second one for improving image quality. For removing the noise in the image we performed the average of twenty consecutive images captured, pixel by pixel (cellule). We also tried the spatial average, but it shown losses of contrast, what is undesirable. After noise removal, several algebraic processes took place, whose include [15] [16]: Sharpen of the image:
Histogram Compensation – distributes the image values, within ranges;
Sharpening mask – creates a blurred image of the original one and subtracts it from the original image;
Mathematical Processes:
Image adding – adds two images, pixel by pixel;
Image subtraction – subtracts two images, pixel by pixel;
Adding, Subtracting, Multiplying and Dividing by a scalar – applies, the same value to all pixels, for a specified operation;
Noise Filtering:
Dead pixel elimination;
Time average; Centering - of the corresponding zone of the object, eliminating the unused areas; Limit detection – application of an algorithm to perform edge detection; Contrast Adjustment [17] – Use of the Sigmoid function. The sigmoid function is a logistic mathematical operation. This function changes the pixel intensity ranges for an interval between 0 and 1. The equation of this function is in 3.1.
( )
( )
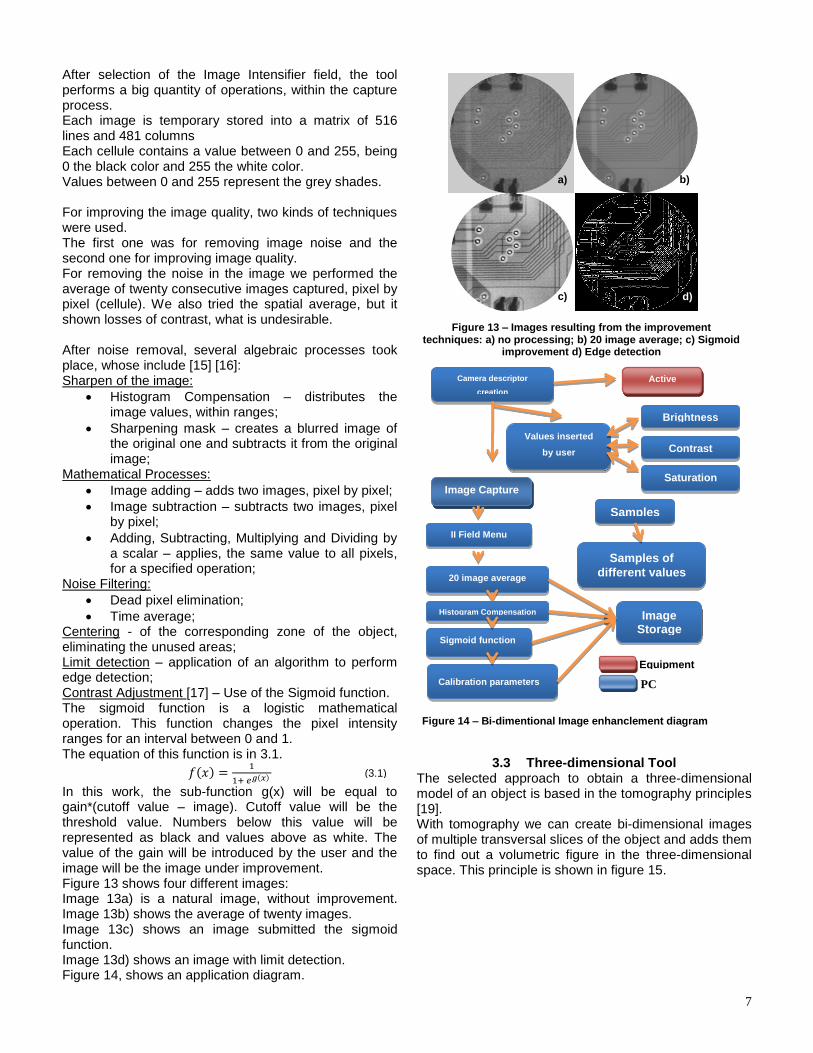
In this work, the sub-function g(x) will be equal to gain*(cutoff value – image). Cutoff value will be the threshold value. Numbers below this value will be represented as black and values above as white. The value of the gain will be introduced by the user and the image will be the image under improvement. Figure 13 shows four different images: Image 13a) is a natural image, without improvement. Image 13b) shows the average of twenty images. Image 13c) shows an image submitted the sigmoid function. Image 13d) shows an image with limit detection. Figure 14, shows an application diagram.
3.3 Three-dimensional Tool
The selected approach to obtain a three-dimensional model of an object is based in the tomography principles [19]. With tomography we can create bi-dimensional images of multiple transversal slices of the object and adds them to find out a volumetric figure in the three-dimensional space. This principle is shown in figure 15.
a)
d) c)
b)
Figure 13 – Images resulting from the improvement techniques: a) no processing; b) 20 image average; c) Sigmoid
improvement d) Edge detection
(3.1)
Figure 14 – Bi-dimentional Image enhanclement diagram

8
To perform a bi-dimensional reconstruction of a slice, we have used a mathematical tool called Radon Transform [20] [21]. Radon Transform is a mathematic operation consisting in an integral transformation in which a function “f” is integrated over straight lines. For better understanding, the Radon Transform converts a bi-dimensional image to several projections, where each projection represents the image being viewed from a specific angle. Therefore, the Radon Inverse Transform will allow the reconstruction of a two-dimensional image from its projections. After getting a certain projection, we are able to create a graphic that stores all the projections from a given straight line. This representation is called a Sinogram. The xx’s axis represents the angles in which the projections were captured and the yy’s axis represents the projection itself. The method used in tomography to reconstruct an image from its projections is called the Filtered Back Projection Algorithm [22] and in this project it will be developed using the iradon algorithm [21] [23]. This algorithm filters the image, using a specific filter: Ram-Lak, Shepp-Logan, Cosine, Hanning, Hann, None. All these filters work in the frequency domain. The filtering is absolutely needed, as we can observe in Figure 16.
Figure 16 – Filter application: a) Original image; b) Reconstruction
with filtering; c) Reconstruction without filtering
There are three methods for interpolating the different acquired data: Nearest-Neighbor, Linear and Spline. Other methods can also be used, but they are very much complex and takes too much time to complete the interpolation. An important matter to take into consideration is the number of projections acquired from some object under analysis. It is recommended to acquire as much images from different angles as possible, has accurate as the reconstruction will be. To test our application we submitted a capacitor to analysis. See the Figure 17.
This object is a 40 μF capacitor. For this object we took projections for the 9’’ and 4.5’’ fields. This will allow the complete reconstruction of the capacitor and its internal components. To reconstruct the bi-dimensional images of all slices we used the iradon function available in the MATLAB library [17]. The filter used was the Hanning filter and the interpolation was the nearest-neighbor. Using the indexes returned by iradon’s function for every slice of the object, we have defined that the pixels corresponding to the object would be set as black color and the rest as transparent. To get only the pixels corresponding to the object after the rearrangement of all slices, it was created a three-dimensional graphic in MATLAB where each slice is set horizontally over its corresponding height. For example, the slice number 200 will be placed perpendicular to the zz’s axis, in the z = 200 position. In the figure 18 it is possible to see the full reconstruction of the capacitor, build from the 9’’ field. From this figure it is possible to see the distortion produced by the 9’’ field. In the figure 19a), is it represented the zone belonging to the object that we want to reconstruct. In figure 19b), it is shown the reconstruction of the internal components of the capacitor. As it can be seen, the object is shown with great detail and the internal components we almost perfectly reconstructed. This proves the goal of this project, That is to say that we proved that it is possible to make a reconstruction of the internal components of a given object and then subject that result to analysis, performing no destruction or alteration to the object in study.
Slice
Figure 15 – Three-dimensional model creation
Figure 17 - Object subjected to analysis
Figure 18 – Complete reconstruction of the capacitor

9
Figure 22 - small metal net, with weld squares
Figure 21 - Chess table with lead squares glued to an acrylic base
A diagram of this tool is represented in figure 20.
Figure 20 – Three-dimensional reconstruction diagram
4. Conclusion
After finishing the maintenance and improvement
operations, described in chapter 2, the result was a clear
image improvement. Procedures taken to repair the
vacuum system (pump and connections) allowed us to
start the equipment operation.
In fact, it is absolutely sure that the pump is working
better than before. Readjustments made in the image
intensifier and camera replacement caused a global
impact in focusing and image quality.
The remote control application, allows the user to control
many operations in the equipment, from any computer.
Furthermore, another important feature would be the
control of all moving arms from any PC, but to get it, is
necessary to make an additional electronic circuit board,
since the positioning control is performed through a
power transistor board, so despite it is possible to do,
this additional feature would require another project.
Concerning the application that performs the bi-
dimensional image improvement, it has enhanced the
image quality, granting a better detection of flaws and
problems.
The application responsible for creating a three-
dimensional model of the object has required a deeper
study onto tomography principles and it is based in the
Radon Inverse Transform.
The quality of the obtained model may not be the best,
but constitutes a means for failure analysis in three-
dimensional space
APPENDIX
Concerning the focus of the acquisition system,
especially regarding the Image Intensifier, 6’’ and 9’’
fields, it was necessary to proceed to some
readjustments. For performing this calibration we used
the GML camera calibration [24] [25]. This application
returns the intrinsic, extrinsic and distortion parameters
whose allow an image correction.
The calibration tool requires a chess table that was used
to identify the square corners in different perspectives.
Three chess tables were developed:
1) A chess table made of lead squares glued to an
acrylic base (figure 21);
2) A small metal net, with the squares made of weld
(figure 22);
3) A chess table printed over a PCB board, with the
squares reinforced with weld, for better detection
(figure 23);
Fixation of object in the rotary clamping box
Platform
Projection Capture Object rotation around zz’s axis (V(r))
The application imports
all the projections
Sinogram creation
for each line
Filtering of the
Sinogram
Line reconstruction from the corresponding sinogram,
applying the Radon Inverse Transform (iradon)
Highlight of the zone corresponding to the
object, setting the rest to transparent
Tri-dimensional
graphic creation Each reconstructed line is placed in the
corresponding height
Equipment
PC
a) b)
Figure 19 – Partial reconstruction of the capacitor: a) Chosen projection from the 4.5’’ field; b) Internal
components reconstruction
10
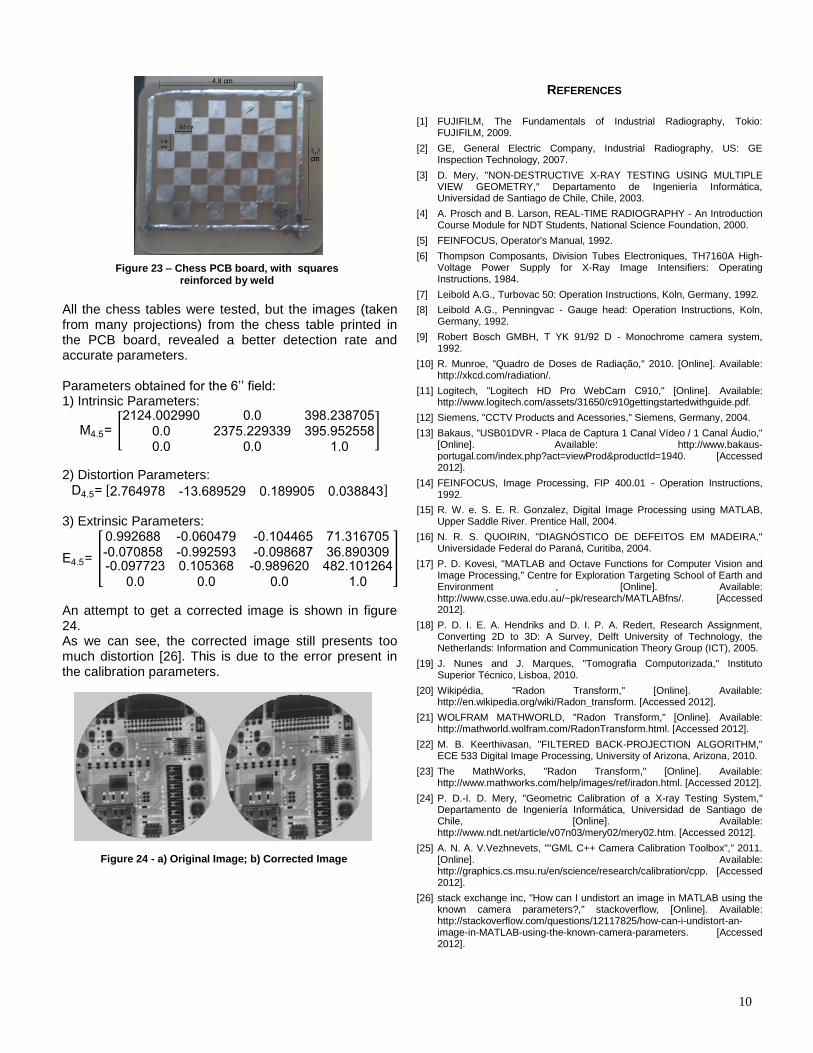
Figure 23 – Chess PCB board, with squares reinforced by weld
All the chess tables were tested, but the images (taken from many projections) from the chess table printed in the PCB board, revealed a better detection rate and accurate parameters. Parameters obtained for the 6’’ field: 1) Intrinsic Parameters:
4.5= [ 4.00 990 0.0 9 . 05
0.0 5. 9 9 95.95 55 0.0 0.0 .0
]
2) Distortion Parameters: 4.5= [ . 649 .6 95 9 0. 9905 0.0 4 ]
3) Extrinsic Parameters:
4.5= [
0.99 6 0.0604 9
0.0 0 5 0.99 59
0. 04465 . 6 05
0.09 6 6. 90 09 0.09 0. 05 6
0.0 0.0
0.9 96 0 4 . 0 64
0.0 .0
]
An attempt to get a corrected image is shown in figure 24. As we can see, the corrected image still presents too much distortion [26]. This is due to the error present in the calibration parameters.
REFERENCES
[1] FUJIFILM, The Fundamentals of Industrial Radiography, Tokio:
FUJIFILM, 2009.
[2] GE, General Electric Company, Industrial Radiography, US: GE Inspection Technology, 2007.
[3] D. Mery, "NON-DESTRUCTIVE X-RAY TESTING USING MULTIPLE VIEW GEOMETRY," Departamento de Ingeniería Informática, Universidad de Santiago de Chile, Chile, 2003.
[4] A. Prosch and B. Larson, REAL-TIME RADIOGRAPHY - An Introduction Course Module for NDT Students, National Science Foundation, 2000.
[5] FEINFOCUS, Operator's Manual, 1992.
[6] Thompson Composants, Division Tubes Electroniques, TH7160A High-Voltage Power Supply for X-Ray Image Intensifiers: Operating Instructions, 1984.
[7] Leibold A.G., Turbovac 50: Operation Instructions, Koln, Germany, 1992.
[8] Leibold A.G., Penningvac - Gauge head: Operation Instructions, Koln, Germany, 1992.
[9] Robert Bosch GMBH, T YK 91/92 D - Monochrome camera system, 1992.
[10] R. Munroe, "Quadro de Doses de Radiação," 2010. [Online]. Available: http://xkcd.com/radiation/.
[11] Logitech, "Logitech HD Pro WebCam C910," [Online]. Available: http://www.logitech.com/assets/31650/c910gettingstartedwithguide.pdf.
[12] Siemens, "CCTV Products and Acessories," Siemens, Germany, 2004.
[13] Bakaus, "USB01DVR - Placa de Captura 1 Canal Vídeo / 1 Canal Áudio," [Online]. Available: http://www.bakaus-portugal.com/index.php?act=viewProd&productId=1940. [Accessed 2012].
[14] FEINFOCUS, Image Processing, FIP 400.01 - Operation Instructions, 1992.
[15] R. W. e. S. E. R. Gonzalez, Digital Image Processing using MATLAB, Upper Saddle River. Prentice Hall, 2004.
[16] N. R. S. QUOIRIN, "DIAGNÓSTICO DE DEFEITOS EM MADEIRA," Universidade Federal do Paraná, Curitiba, 2004.
[17] P. D. Kovesi, "MATLAB and Octave Functions for Computer Vision and Image Processing," Centre for Exploration Targeting School of Earth and Environment , [Online]. Available: http://www.csse.uwa.edu.au/~pk/research/MATLABfns/. [Accessed 2012].
[18] P. D. I. E. A. Hendriks and D. I. P. A. Redert, Research Assignment, Converting 2D to 3D: A Survey, Delft University of Technology, the Netherlands: Information and Communication Theory Group (ICT), 2005.
[19] J. Nunes and J. Marques, "Tomografia Computorizada," Instituto Superior Técnico, Lisboa, 2010.
[20] Wikipédia, "Radon Transform," [Online]. Available: http://en.wikipedia.org/wiki/Radon_transform. [Accessed 2012].
[21] WOLFRAM MATHWORLD, "Radon Transform," [Online]. Available: http://mathworld.wolfram.com/RadonTransform.html. [Accessed 2012].
[22] M. B. Keerthivasan, "FILTERED BACK-PROJECTION ALGORITHM," ECE 533 Digital Image Processing, University of Arizona, Arizona, 2010.
[23] The MathWorks, "Radon Transform," [Online]. Available: http://www.mathworks.com/help/images/ref/iradon.html. [Accessed 2012].
[24] P. D.-I. D. Mery, "Geometric Calibration of a X-ray Testing System," Departamento de Ingeniería Informática, Universidad de Santiago de Chile, [Online]. Available: http://www.ndt.net/article/v07n03/mery02/mery02.htm. [Accessed 2012].
[25] A. N. A. V.Vezhnevets, ""GML C++ Camera Calibration Toolbox"," 2011. [Online]. Available: http://graphics.cs.msu.ru/en/science/research/calibration/cpp. [Accessed 2012].
[26] stack exchange inc, "How can I undistort an image in MATLAB using the known camera parameters?," stackoverflow, [Online]. Available: http://stackoverflow.com/questions/12117825/how-can-i-undistort-an-image-in-MATLAB-using-the-known-camera-parameters. [Accessed 2012].
Figure 24 - a) Original Image; b) Corrected Image