the utilisation of formative and summative
TRANSCRIPT
THE UTILISATION OF FORMATIVE AND SUMMATIVE
ELECTRONIC ASSESSMENTS IN HISTORICALLY DISADVANTAGED
INSTITUTIONS (HDI) IN THE WESTERN CAPE
PALIGA PILLAY
A thesis is submitted in partial fulfilment of the requirements for the degree
of Masters in Information Management in the Department of Economic and
Management Sciences, University of Western Cape.
Supervisor: Prof. A.J. Bytheway
November 2005

II
THE UTILISATION OF FORMATIVE AND SUMMATIVE
ELECTRONIC ASSESSMENTS IN HISTORICALLY DISADVANTAGED
INSTITUTIONS (HDI) IN THE WESTERN CAPE
PALIGA PILLAY (2054173)
KEYWORDS
Educational Technology
Learning Management Systems (LMS)
Formative Assessment
Summative Assessment
On-line Learning
Historically Disadvantaged Institutions (HDI)
Historically Advantaged Institutions (HAI)
Digital Divide
Electronic Assessment
Higher Education
III
ABSTRACT
PALIGA PILLAY (2054173)
MIM thesis, Department of Economic and Management Sciences, University
of Western Cape.
In this thesis, I explore the benefit of electronic formative assessment on learner achievement. Studies had revealed the connection between throughput and assessment. There is great discrepancy between the throughput rate of Historically Disadvantaged Institutions (HDI) and Historically Advantaged Institutions (HAI), according to the National Plan for Higher Education. Previously, assessment was used primarily for summative and certification purposes. Now, with the introduction of Outcomes Based Education (OBE), a number of alternative forms of assessment can be used. In this study I establish the importance and necessity of frequent, electronic, formative assessments which would thereby improve learners’ achievement in the classroom. The white paper on e-education (DOE: 2003) states that e-education must be transformed so that information and communication technology (ICT) can be successfully integrated to “ensure that all learners will be equipped for full participation in the knowledge society”. Recent research has reported significant increases in learner achievement through educational technology with the use of learning management systems (LMS) software (Stephens, 2001, Buchanan, 2000, DeKock, 1994). This study was built upon this body of research on educational technology and how it can be effectively integrated into classrooms. This research would impact on learner achievement through the use of formative assessment to assist under-prepared learners to improve their summative scores. In particular, the effect of formative electronic assessment on learner achievement in the subject Business Information Systems, for first year accounting learners, in the Business Faculty at Peninsula Technikon was investigated. This quantitative study utilized the use of questionnaires and the control group design. The control group design, which consisted of the control and experimental groups was used on a group of learners who had been exposed to the treatment. The treatment for the experimental group comprised of using a formative on-line learning assessment. Independent variables included the treatment condition, race, gender and home language. Analysis of Variance (ANOVA) was used on assessment. Analysis firstly revealed that there was no statistically significant difference between achievement in the practical component between the experimental and the control group. The Kruskal-Wallis tests showed that there were no significant differences between genders. The control group performed better than the experimental group in the theory test. Secondly, analysis revealed statistically significant mean achievement differences between Coloured female with no prior computer usage (M= 78) and Black female with no computer usage (M=44). Based on these findings, implications of the results of this study, future avenues of research and implementation suggestions are offered.

IV
DECLARATION
I declare that the Utilisation of Formative and Summative Electronic
Assessments in Historically Disadvantaged Institutions (HDI) in the Western
Cape, is my own work, that it has not been submitted before for any degree
or Examination in any other university, and that all the sources I have used
or quoted have been indicated and acknowledged as complete references.
Paliga Pillay
November 2005
Signed: ………………………….

V
TABLE OF CONTENTS
KEYWORDS................................................................................................................................II
ABSTRACT................................................................................................................................ III
DECLARATION.........................................................................................................................IV
LIST OF FIGURES ..................................................................................................................VII
LIST OF TABLES .................................................................................................................. VIII
CHAPTER 1 ..................................................................................................................................1
THE PROBLEM AND ITS CONTEXT .....................................................................................1
1.1 INTRODUCTION AND THEORETICAL FRAMEWORK.........................................................1 1.2 DIGITAL DIVIDE............................................................................................................1 1.3 TEACHING PEDAGOGIES................................................................................................2 1.4 ASSESSMENT.................................................................................................................4
1.4.1 Summative assessment.............................................................................................4 1.4.2 Formative assessment..............................................................................................5 1.4.3 Computerisation of assessment ...............................................................................6
1.5 STATEMENT OF THE PROBLEM ......................................................................................7 1.6 RESEARCH OBJECTIVES ................................................................................................7 1.7 LIMITATIONS AND DELIMITATIONS OF THE STUDY .......................................................8 1.8 ORGANISATION OF THE STUDY .....................................................................................8
CHAPTER 2 ..................................................................................................................................9
LITERATURE REVIEW.............................................................................................................9
2.1 INTRODUCTION .......................................................................................................9 2.2 DIGITAL DIVIDE.......................................................................................................9
2.2.1 Basic amenities......................................................................................................10 2.2.2 Race.......................................................................................................................14 2.2.3 Gender...................................................................................................................15 2.2.4 Language...............................................................................................................17
2.3 HIGHER EDUCATION ....................................................................................................18 2.4 ASSESSMENT ..........................................................................................................21
2.4.1 Outcomes-based education....................................................................................23 2.4.2 Computerised assessments ....................................................................................25 2.4.3 Meta-analysis ........................................................................................................26 2.4.4 Summative assessment...........................................................................................27 2.4.5 Formative assessment............................................................................................28
2.5 AGAINST TECHNOLOGY ......................................................................................30 2.5.1 Institutional policies ..............................................................................................30 2.5.2 Teaching pedagogies.............................................................................................31 2.5.3 Educators’ philosophy to teaching and learning...................................................31 2.5.4 Learners ................................................................................................................31
2.6 CONCLUSION..........................................................................................................32
CHAPTER 3 ................................................................................................................................34
METHODOLOGY......................................................................................................................34
3.1 INTRODUCTION .....................................................................................................34 3.2 RESEARCH DESIGN AND METHODOLOGY ......................................................34
3.2.1 Qualitative research ..............................................................................................36 3.2.2 Quantitative research ............................................................................................39
3.3 RESEARCH APPROACH ................................................................................................40 3.4 RESEARCH POPULATION .....................................................................................41 3.5 RESEARCH INSTRUMENTS....................................................................................41
3.5.1 Standardised tests..................................................................................................42
VI
3.5.2 Questionnaires ......................................................................................................42 3.5.3 Experimental research ..........................................................................................43
3.6 VALIDITY AND RELIABILITY .......................................................................................44 3.7 RESEARCH HYPOTHESES.............................................................................................45 3.8 DATA ANALYSIS ....................................................................................................46 3.9 ETHICAL CONSIDERATIONS/ISSUES.................................................................46 3.10 CONCLUSION..........................................................................................................47
CHAPTER 4 RESULTS .............................................................................................................48
4.1 INTRODUCTION .....................................................................................................48 4.2 DEMOGRAPHIC DATA .................................................................................................49 4.3 TECHNOLOGICAL BACKGROUND ................................................................................50 4.4 ONLINE LEARNING......................................................................................................56 4.5 HYPOTHESIS 1 ........................................................................................................60
4.5.1 Test 1 File management ........................................................................................60 4.5.2 Test 2 Theory.........................................................................................................65
4.6 HYPOTHESIS 2 ........................................................................................................70 4.6.1 Test 1 File Management ........................................................................................70 4.6.2 Test 2 Theory.........................................................................................................75
4.7 CONCLUSION..........................................................................................................79
CHAPTER 5 ................................................................................................................................80
DISCUSSION AND CONCLUSION.........................................................................................80
5.1 INTRODUCTION .....................................................................................................80 5.2 SUMMARY OF RESEARCH FINDINGS ................................................................81 5.3 RESEARCH OBJECTIVES...........................................................................................82 5.4 RECOMMENDATIONS FOR FURTHER RESEARCH ..........................................84 5.5 CONCLUSION..........................................................................................................85
BIBLIOGRAPHY .......................................................................................................................86
APPENDIX I ...............................................................................................................................92
APPENDIX II ..............................................................................................................................93
APPENDIX III ............................................................................................................................97
APPENDIX IV.............................................................................................................................98
APPENDIX V ..............................................................................................................................99
APPENDIX VI...........................................................................................................................100
APPENDIX VII .........................................................................................................................101

VII
LIST OF FIGURES Figure 1.1. Theoretical Framework...................................................................3 Figure 1.2. A behavioural model of learning....................................................3 Figure 1.3. Constructivist model of learning....................................................3 Figure 2.1. Household goods Oct 2001 ..........................................................10 Figure 2.2. Micro and macro perspectives .....................................................33 Figure 3.1. Deductive and inductive theorising..............................................36 Figure 3.2. Underlying assumptions...............................................................37 Figure 3.3. Experimental design.....................................................................44 Figure 4.1. Point of access; Community centre; Internet Café.......................51 Figure 4.2. Access to amenities, cell phone ...................................................52 Figure 4.3. Make calls; send SMS; Games.....................................................52 Figure 4.4 Percentage usage of e-mail...........................................................53 Figure 4.5. Perceptions when using an ATM for the first time ......................54 Figure 4.6. Assist learning..............................................................................56 Figure 4.7. Computer expertise .....................................................................57 Figure 4.8. Difficulties with online learning ..................................................58 Figure 4.9. Online assessment ........................................................................59 Figure 4.10 Usefulness of Microsoft Office programs....................................59 Figure 4.11 Box Plot; File Management; Major classification .......................62 Figure 4.12 Standard Deviation Plot; Mean percentage; File Management...63 Figure 4.13 Box Plot; Theory; Major classification ........................................66 Figure 4.14 Standard Deviation Plot; Mean percentage.................................68 Figure 4.15 Box Plot; File Management; Control and Experimental groups..71 Figure 4.16 Means Plot; File Management; Control and Experimental group73 Figure 4.17 Box Plot; Theory; Control and Experimental Groups..................76 Figure 4.18 Means Plot; Theory; Control and Experimental Groups .............77

VIII
LIST OF TABLES Table 2.1. Demographic profile of Cape Town residents .............................13 Table 2.2. Access to/can use computer/Internet............................................14 Table 2.3. Increases in enrolments ................................................................15 Table 2.4. People per age group who cannot read English ...........................17 Table 2.5. First-time entering undergraduates ..............................................20 Table 2.6. Annual success rates 2000-2003 ..................................................20 Table 3.1. Qualitative and quantitative methodologies.................................35 Table 4.1. Demographic data of respondents................................................50 Table 4.2 Descriptive statistics of the eight sub-groups...............................55 Table 4.3. Description of the eight sub-groups .............................................61 Table 4.4. Descriptive statistics of the eight subgroups................................61 Table 4.5. Kruskal-Wallis multiple-comparison Z-value File Management 64 Table 4.6. Descriptive statistics of the eight subgroups................................67 Table 4.7. Kruskal-Wallis multiple-comparison Z-value Theory.................69 Table 4.8. Classification description on prior use of computer ....................70 Table 4.9. Descriptive statistics of the four subgroups. ................................71 Table 4.10 Kruskal-Wallis multiple-comparison Z-value control groups .....74 Table 4.11 Descriptive statistics of the four subgroups .................................75 Table 4.12 Kruskal-Wallis multiple-comparison Z-value test .......................78

1
CHAPTER 1
THE PROBLEM AND ITS
CONTEXT
1.1 INTRODUCTION AND THEORETICAL FRAMEWORK
At the foundation of every higher educational institution is the strategy to
develop learners who are academically, socially and technologically competent.
There is an intrinsic link between the strategy and the throughput rates of an
institution. Many institutions allow these two domains to operate independently.
In reality, strategy is at the heart of the throughput rate and is about choice.
Historically Advantaged Institutions (HAI) had the choice about accepting
learners mostly from an advantaged background, preventing access to many
disadvantaged learners. In 1993 (DOE 1996a), 42% of qualifying learners from
Historically Disadvantaged Institutions (HDI) earned undergraduate diplomas
which signified that many did not meet the admission requirements for degree
studies, while only 2% of qualifying learners from the HAI were in this category.
The proportion of these disadvantaged learners in the higher education
institutions is increasing, whereas throughput rates show no signs of improving
(DOE 2004a). The DoE (1996a) has raised serious concerns over the graduation
rates, which it says is costing the national government a great deal in terms of
resources because of the poor academic performance of learners. Another area of
concern is that the higher education system is not producing the numbers and
types of graduates required by the labour market (Cloete 2001).
… another major aspect of inefficiency in the system is the retention of failing
learners in the system. A number of institutions report poor success rates by course
(averages of 70% and below), low graduation rates (often 15% or below), and yet
record no academic exclusions (Council on Higher Education [CHE] 2000).

2
The challenge is how to devise a system to address this declining quality at
higher education institutions, as well as to assist under-prepared learners in order
to improve academic performance and throughput rates. The purpose of this
research was therefore to explore the integration of electronic formative
assessment into a Business Information System classroom, and the impact it had
on learner achievement.
At the start of this research, a model was developed based upon the author’s
educational experiences, observations and on the initial reading of the literature.
This model (Figure 1.1 below) was used to research the benefits and pitfalls of
electronic formative and summative assessment techniques in historically
disadvantaged institutions.

3
THEORETICAL FRAMEWORK expected
differences in expectation
affect causes
need to change
differences in output
assess
achieve avoid analyse prevent possibility to change
Figure 1.1. Theoretical Framework
Enrolments First-year learners
Environmental Analysis (Macro)
• Technological background (very little computer usage, access to amenities, technology usage)
• Higher education (apartheid legacy – inferior education)
• Digital divide ( home language, gender, race, access to technology,)
Desired output Throughput rate and
graduation output
Actual output Learner pass rate (low);
Low motivation Lecturer demands
Research output low
GAP Between high
enrolments and low throughput rate Digital divide
ASSESSMENT PERFORMANCE ANALYSIS ASSESSMENT CAUSE ANALYSIS
Lack of support Teacher-centred not learner-
centred Traditional assessment methods
Consequences – incentives rewards
Educator marking overload Big student numbers
Educator research outputs (expectations)
Interventions Electronic formative
assessments Bridge digital divide
E-learning OBE learner-centred
Computerised assessments Teaching pedagogies
Electronic assessment Technology savvy
Formative – constant feedback, improved student
morale Summative grading
Use of LMS Improved learner
achievements
Classroom analysis (micro)
• Teaching pedagogies (traditional – teacher-centred, passive learning, content-based)
• Assessment (accreditation, summative)

1
Figure 1.1 above it shows how a gap can arise from the assessment performance
analysis (left) and assessment cause analysis (right) between the outputs desired
(according to the enrolments of an institution) and the actual throughput rate. The
environmental analysis, which looks at the macro environment, stems from the
learners’ background and past practices in education. The classroom analysis,
which looks at the micro environment, encompasses the learning programmes
and all associations that affect the learner and educator in a traditional classroom
setting.
Any discrepancy or gap between the desired and actual output that may have
arisen shows that there is a need to change. The assessment cause analysis looks
at the possible causes and interventions to narrow the gap. If that is the case,
should interventions be put in place so that there is a change in classroom
pedagogy? Should there be a move away from the traditional, behaviouristic
pedagogy to a more learner-paced, constructivist pedagogy? Will this narrow the
gap of the desired and actual output, and at the same time reduce educator mark
loads and provide instant feedback to learners, thereby improving learner
achievement resulting in improved throughput rate and graduate output? The
challenge has been whether the utilisation of electronic formative assessment
assisted to narrow the gap of the actual and desired outputs of the HDI.
1.2 DIGITAL DIVIDE
In examining the macro environment in Figure 1.1, the existence or non-
existence of the digital divide had to be established. The existence or non-
existence of the divide would have a bearing on the learners’ use of educational
technology. The digital divide has many definitions in different contexts.
Warschauer (2003) defines digital divide as a bipolar division between the
“haves” and the “have-nots”, the “connected” and the “disconnected”.
… the digital divide can mean many different things to different sectors of our society.
For some, the installation of a “tickey” box in the village takes residents into a new
realm of communication. For others, a progression from a dial-up modem to broadband

2
enables them to access information at a heightened level (World Summit on the
Information Society [WSIS] 2005).
For the disadvantaged learner at Peninsula Technikon, the digital divide could
mean the difference between a pass and fail. The digital divide describes the
educational divide with the “resource-deprived” learners on one side of the
spectrum, and on the other side the “resource-advantaged” learners (Herselman
& Britton 2002). The South African education and training system has to respond
to these pressures and challenges posed by the information revolution (DOE
2003). Studies have also revealed that the digital divide shows a further
significant divide between gender, race and home language in the use of
computer technology (Singh 2002; Slate, Manuel & Brinson 2002; McCoy &
Heafner 2004). Institutions of higher education face the challenge of integrating
technology into their teaching (Heydenrych, Higgs & Van Niekerk 2003).
This challenge is made even more complex when seen in the context of other trends in
education: the transition from passive classroom lectures to hands-on, learner-centred
and the perception of learners as "customers" with increased control over the learning
process (Radcliffe 2002).
1.3 TEACHING PEDAGOGIES
The inheritance of a didactic and behaviourist learning philosophy from the
legacy of apartheid has been employed in our educational institutions. Figure 1.2
below displays the behavioural model of learning.

3
Figure 1.2. A behavioural model of learning
(Source: Smith, 2001)
Heydenrych et al. (2003) criticise this philosophy, Figure 1.2 above, where
learners are seen as passive recipients “waiting to be led with expert content that
is decided upon by specialists in isolation”. With the onset of technology-
oriented learning, there should be a shift in the pedagogy paradigm from teacher-
centred and passive learning to the constructivist learning philosophy. Figure 1.3
below shows the constructivist model of learning.
Figure 1.3. Constructivist model of learning
(Source: Smith 2001)

4
Heydenrych et al. (2003) explain that the constructivist learning experience,
Figure 1.3 above, is one “in which the learner is building an internal
representation of knowledge, a personal interpretation of experience”, where the
learner takes responsibility for his/her own learning. These authors further
emphasise that institutions may engage “technologies for the sake of technology
but when the pedagogical imperative is given priority, the quality of teaching and
learning stands to be improved”.
1.4 ASSESSMENT
Assessment in higher education institutions is a process of evaluating the
learners’ achievement of the learning outcomes while at the same time preparing
learners for certification. Assessment involves identifying appropriate standards
and criteria and making judgements about quality (Boud 2000). If the sole
purpose of assessment is certification, the research examines the different models
of assessment. The two distinct models of assessment that were investigated were
summative and formative.
1.4.1 Summative assessment
Summative assessment is normally given at the end of a unit of work, which
serves the function of certification, which can be used for graduation purposes.
This gives a quantitative grading and judgement about a learner’s achievement in
a specific area (McKenna & Hesketh 2000). Knight’s (2002) conception of
assessment was that of a “feedout” function when it was used for certification or
achievement as opposed to the feedback function when it was intended to evoke
information to help further learning. The “feedout” and “feedback” functions of
assessment have become confused in practice and, consequently, formative
assessment in higher education has failed in becoming a part of valued learning
(Harlen, Wynne, James, Mary 1997).

5
There has been strong criticism against the use of results in learners studying
only as a means to an end rather than participating in a deeper learning and
knowledge acquisition process (Black & William 1998a). Experience of teaching
over the last few years has revealed that the results (diagnostic analysis) of an
assessment need to be a learning curve for both lecturer and learner and not a
report that needs to be completed as part of an institutional requirement. Recent
research shows there needs to be a paradigm shift in assessment, in order to
narrow the gap between the actual and desired levels of throughput at HDIs, from
the current assessment paradigm (summative functions of assessment) to a
learning, problem-solving paradigm (formative function of assessment) (Harlen,
et al. 1997; Biggs, 1998; Boud 2000; Black & William 1998a).
1.4.2 Formative assessment
Summative assessment serves the purpose of accreditation, promotion or
graduation. Formative assessment serves a function of feedback to the learner in
the learning process, which promotes further learning and improves results in
summative assessments. According to Black and William (1998a), all successful
teaching relies heavily on adapting the teaching in the light of evidence about the
success of previous episodes. Harlen, et al. (1997) indicate the following
characteristics of formative assessment, namely that it is essentially positive in
intent, it is directed towards promoting learning and it is therefore part of
teaching. Black and William (1998b) used approximately 580 articles in 160
journals in their study, which confirms that there is a body of firm evidence that
formative assessment is an essential component of classroom work and that its
development can raise standards of achievement. This study also indicated that
formative assessment helps low achievers more than other learners.
Boud (2000) argues that formative assessment has been neglected, as summative
assessment has dominated thinking in educational institutions and has taken up
too high a proportion of staff time, energy and resources at the expense of
preparing effective learners. This has led to serious implications in higher
education courses that are always moving on to tackle new areas of learning

6
without ascertaining whether those that have gone before have been adequately
understood (Boud 2000).
The White Paper on Higher Education Transformation (DOE 1997) states that
higher education should be restructured so as to meet the “… needs of an
increasingly technologically oriented economy”. Recent research has reported
significant increases in learner achievement through educational technology with
the use of Computer Aided Instruction (CAI) software (Stephens, Bull & Wade
1998). With the rapid increase in learner numbers, practical constraints may
make it difficult for lecturers to provide feedback that is both timely and useful to
the learner (Buchanan 2000). For this reason, the implementation of
computerised formative assessment may be the solution.
1.4.3 Computerisation of assessment
Formative assessment can be beneficial to learner and lecturer, if the time lapse
between assessment and feedback is short. Computerised formative assessment
provides the following benefits: automatic test analysis statistics to be produced
with immediate compilation of learner marks (Stephens 2001); a reduction in
time spent by lecturers on administration (Stephens 2001); freedom of any
gender or cultural prejudices (Stephens 2001); and swift and useful feedback to
learner and lecturer (Buchanan 2000). Learners can revisit the questions or an
assessment as many times as necessary until the learner understands the concept.
With immediate feedback of results and answers, learners can monitor their own
progress and guide the lecturer on the success of the lecture. Problems
experienced by learners can therefore be re-addressed in class. These results
could lead to an improvement in learner pass rates and thereby improve the
graduate output. How many of our academics give learners feedback and
suggestions on their assessments? Experiences of teaching at an HDI have shown
that academics often complain about the poor quality of learners. Access to
electronic formative assessment could provide the means to improve the
throughput rates and could further bridge the digital divide for our disadvantaged
learners.

7
1.5 STATEMENT OF THE PROBLEM
With the strong movement of the Department of Education (DOE 2003) to
integrate technology into the curriculum, a single question remains unanswered.
Does technology, specifically computers, for formative assessment improve
learner achievement?
1.6 RESEARCH OBJECTIVES
This research focused on developing a better understanding of the effects of
electronic formative assessment in a constructivist, technology-rich learning
environment. In particular, this research attempted to –
1. provide insights into the digital divide, the technological and language
background of first-year learners;
2. examine the efficacy of online learning; and
3. determine empirically the effect of constructivist, technology-rich
learning environment, specifically the use of electronic formative
assessments, on learner achievement.
Such information should provide valuable guidance to educators or designers
seeking to determine how computers can best be used to maximise educational
benefits or what the long-term impact of computers will be on educational
productivity.

8
1.7 LIMITATIONS AND DELIMITATIONS OF THE STUDY
The subjects of the study will be limited to Business Information System 1
learners in the Accounting Diploma from the Faculty of Business at Peninsula
Technikon.
1.8 ORGANISATION OF THE STUDY
This report is divided into five chapters. Chapter 1, Introduction and theoretical
framework, includes a description of the problem and its context, the statement of
the problem to be studied, the research objectives of the study, and limitations
and delimitations of the study.
Chapter 2, Literature review, consists of a literature review of studies relative to
the use of computer technology in the classroom and variables associated with
the effective implementation of electronic formative assessment into the
curriculum. This chapter begins with a review of the digital divide with regard to
gender, race and language; concerns of the government on the gap between the
enrolment and low graduate success at higher education institutions; and the use
of computerised assessments and its benefits and pitfalls to learners and
educators.
Chapter 3, Research methodology, discusses the research design and the
methodology utilised in this study. A description of the population, instruments,
hypothesis, ethical considerations and method of analysis used is included.
Chapter 4, Results, presents the results of the study. Descriptive statistics and
results of the quantitative analyses are discussed within the context of each of the
hypotheses and further expanded upon in Chapter 5.
Chapter 5, Discussion and conclusion, is the final chapter of the study. It
includes a summary of the study and a discussion of the conclusions based on the
results of the study.

9
CHAPTER 2
LITERATURE REVIEW
2.1 INTRODUCTION
The purpose of this study was to explore the effect of electronic formative
assessments on learner achievement in historically disadvantaged institutions.
This literature review explored related studies in the macro and micro
environment of the use of electronic formative assessment by –
1. assessing the digital divide with regard to gender, race and
language;
2. discussing the concern of the government on the gap between the
enrolment and low graduate success at higher education institutions,
and
3. using computerised assessments.
2.2 DIGITAL DIVIDE
Digital divide can be defined as “the wide division between those who have
access to information and communication technology (ICT), and are using it
effectively, and those who do not” (Bridge.org 2001). Information and
communications technologies (ICTs) are becoming the foundation of our
societies and economies, and the digital divide implies that the information
"have-nots" do not have the opportunity to participate in the new economy
(Bridge.org 2003). There is also a digital divide between HDIs and HAIs, gender,
race/ethnicity and age with regard to ICTs. How does higher education help to
narrow this divide, and how does it assist the disadvantaged learners to access
ICT? One method of measuring the digital divide is in terms of ownership of
basic amenities, including a computer, the Internet, and the new telephony, the

10
cell phone. Figure 2.1 below show the percentages of ownership of the basic
amenities according to the 1996 census.
2.2.1 Basic amenities
Figure 2.1. Household goods Oct 2001
(SOURCE: StatsSA 2001)
Figure 2.1 above shows evidence of the digital divide in household access to
basic amenities (StatsSA 2001):
… graph masks differences between population groups. For example, the much-
spoken-of 'digital divide' is evident in the fact that less than 2% of African-
headed households had a computer, as opposed to 46% of white-headed
households. Similarly, only 12% of African-headed households had a telephone
in the home, as against the national total of 24%, shown in the graph. This may
in part explain the popularity of cell phones: twice as many African-headed
households had cell phones (25%) as had fixed-line telephones.
According to StatsSA (2001), nearly three-quarters of households in the country
had a radio, well over half had television, and just over half had a refrigerator. At
the other end of the scale, fewer than 10% had a computer. As can be seen in the

11
following extracts, lower-income communities in South Africa have very little or
no access to a computer:
• Herselman and Britton (2002) conducted a case study research on
80 Grade 12 learners from various institutions from resource deprived
or ”have-not” communities in the Port Elizabeth area. Only 11.5% of
all learners tested had regular access to a PC, whilst 21.25% had only
used it a few times, and 60% had never used a computer before under
any circumstances.
• Callaghan and Smit (1999) did their research at the Technikon
Pretoria, by means of questionnaires. The research targeted learners
who did not have previous experience of using computers. None of
the respondents had English as their home language. Research
indicated that respondents were afraid of and unsure about using the
computer for the first time. After six months of usage, learners
showed confidence and had high expectations of what they could do
with the computer.
• The research by Misthry, Mkhize and Harypursat (2001) was
aimed at determining the technological and language background of
the respondents at the University of Durban Westville, as well as the
possible relation between this background and their knowledge of
computers prior to entering university. The research showed that the
majority of respondents came from public schools and many of these
learners had never used a computer before coming to the university.
• Singh’s (2002) research shows that in the year 2000, 33
postgraduate learners at the University of Durban Westville were
taught Information Management, and none of them had used a
computer previously. In 2001, there were 40 learners and in 2002, 45
learners who had never used a computer before.
2.2.1.1 South Africa
12
South Africa has approximately 4.92 million installed telephones and 4.3 million
installed exchange lines. This represents 39% of the total lines installed in Africa
(Telecommunications 30 August 2004). There are about 12 million Internet users
on the continent, of whom 3.1 million are in South Africa (Telecommunications
30 August 2004). In Africa, one in every 200 persons has Internet access,
compared to one in 30 globally, and one in three in advanced economies (Cronin:
2003). The high access prices to the internet are seen as a significant barrier even
among people with access to computers (Bridges.org 2003). According to
Webchek (2002), Internet usage amongst South African Web users is relatively
equal between genders, while the majority of men are advanced users of ICT.
Thirty-one percent of all users are between the ages of 18-24, 63% are English-
speaking, 69% white, 25% have an monthly household income of R30 000+ and
55% have some university or tertiary qualification (Bridges.org 2003).
Recent studies have shown a rapid expansion of cell phone and Internet usage in
South Africa (Bridges.org, 2003; Telecommunications, 2004). There are more
cell phones than landlines in South Africa. In May 2004, South Africa had 18.2
million cell phone users (Telecommunications 30 August 2004). However, the
acquisition of some of these rapidly evolving technologies is beyond the reach of
the lower income communities in South Africa. Under the legacy of apartheid,
these lower income communities were provided with inferior education and poor
or no access to learning opportunities (Singh 2002).
South Africa is the fourth largest GSM (Global Systems for Mobile
Communications) market in the world and is developing at a rate of 50% per
annum (Bridges.org 2003). This market is dominated by Vodacom (which has 10
million users) and MTN (which claims 5.22 million) and in 2001 a third licence
was awarded to Cell C, which had about three million subscribers in May 2004
(Telecommunications 30 August 2004). Cheap cell phones and prepaid phone
cards have made communication accessible to millions of disadvantaged South
Africans, although cell phones are used primarily for receiving calls
(Bridges.org:2003).

13
2.2.1.2 Western Cape
In January 2002, the Cape Town City Council embarked on an assessment of the
digital divide in Cape Town, in terms of ICT and its possible benefits. The
demographic profile from Table 2.1 below compares favourably with the Cape
Town City Council assessment of the digital divide that shows “a large portion of
the Western Cape population is highly literate and financially stable, but the
majority of people are below the bread line, do not have a fixed or mobile
telephone, access to a computer, e-mail, or the Internet” (Bridges.org 2003).
Table 2.1 below shows evidence of the disparity in the annual personal income
per race group.
Table 2.1. Demographic profile of Cape Town residents
(Source: Bridges.org 2003)
In the Western Cape, 82.4% of schools have computers and 56.1% have one for
teaching and learning, whereas nationally the percentages are 39.2% and 26.5%
respectively (DOE 2003). Thirty-two percent of the Internet users in the Western
Cape are between the ages of 18-24, 76% speak English, 58% are male, 61% are
white and 33% are coloured, 23% have a monthly household income of over R30
000 and 59% have a university or tertiary qualification (Bridges.org 2003).

14
Webchek (2000) also found higher use among historically less marginalised
groups ("white" and "coloured" respondents) (Bridges.org 2003).
2.2.2 Race
Within countries, there is a significant division regarding the use of technology
along the line of race. In the United States, many early reports on the digital
divide has been done extensively on race, and it has been revealed that Asian
Americans and Pacific Islanders have the highest level of home Internet access at
56.8%, whereas blacks and Hispanics experience the lowest home Internet access
at 23.5% and 23.6% respectively (Bridges.org :2003).
In South Africa, the racial classification system drawn up by the apartheid
regime was divided among African, white, coloured (of mixed race) and Indian
(of Asian decent) people (Bridges.org 2003). Mangena (2001) commented that
the insidious and difficult spin-off from the apartheid education legacy was the
“… fact that competency in science-related fields was also employed to
perpetuate theories of difference among the races”.
Table 2.2 below describes computer and Internet access by young people up to
the age of 35 according to race in South Africa (Saner 2003).
Table 2.2. Access to/can use computer/Internet
(Source: Saner 2003)
Computer Internet
Race Access Can use Access Can use
Black 19% 16% 8% 5%
Coloured 34% 39% 16% 16%
Indian 53% 73% 27% 38%
White 88% 91% 65% 70%

15
TOTAL 28% 27% 15% 13%
Studies indicate the significance of race on learner achievement (Singh 2002,
Roodt 2003). The integration of computer-assisted learning into the existing
curriculum of heterogeneous classes, should improve learners’ academic
achievement and their motivation (Roodt 2003).
2.2.3 Gender
In the past decade, there has been substantial growth in the higher education
sector. This growth has been reflected for both male and female learners.
However, the DOE (2003) shows that the increase in enrolments at higher
education institutions of African females, at 33%, constitutes the largest share of
head count learner enrolments in 2003. The overall enrolment by race group was
60% African, 6% coloured, 7% Indian and 27% white. Female learners had a
54% share of the total enrolment.
Table 2.3. Increases in enrolments
(Source :DOE 2003)
INCREASES IN ENROLMENTS (2003 compared to 2000)
(thousands)
African female 46 24%
African male 37 24%
Coloured female 8 53%
Coloured male 4 30%
Indian female 7 37%
Indian male 5 27%
White female 17 21%

16
White male 7 9%
Female total 77 25%
Male total 54 19%
OVERALL TOTAL 131 22%
With the increasing demands on the higher education system, cognisance should
be taken of the glaring disparities regarding the use of technology between males
and females learners in the higher education system. Gender differences across
curricula areas have been studied:
… sexual hierarchy, as evidenced within both the education and labour sector, is not the
dictate of biology but is the result of socially constructed norms. These norms have
played a direct role in the creation of a gendered digital divide that is primarily caused
by a lack of women pursuing careers in science and technology. A variety of
sociocultural reasons for the sex related differences are offered (McClean 2001).
McClean (2001) elaborates by indicating that studies revealed that there are very
few powerful, active female role models in computer games or software and
software programs reinforce gender bias and stereotypical gender roles.
When using computers, females have been considered as having a higher level of
computer anxiety than males and they are regarded to experience more negative
feelings toward computers than male users (Brosnan 1994, as cited in Stephens
2001). Stephen (2001) elaborates that this is usually the case because males have
spend more time with computers at home, work and/or school while females are
discouraged to use computers at school. McCoy and Heafner (2004) conducted a
survey on 389 female and 408 male learners at an american university. By the
end of their 4th year, these learners had lived and worked in a computer-intensive
environment for their entire university careers. The survey evaluated attitudes
towards computers and the uses for computers. The results of this study showed
that males were heavier uses in entertainment, but as a tool and for
communication, there were no differences between males and females. Males
and females that make use of email and application programmes, for example
Microsoft office, showed no differences in their use of computers. Stephens

17
(2001) also found that no differences were evident between female and male
learners that had been using computer-assisted assessments, at higher education
institutions.
2.2.4 Language
South Africa has 11 official languages. In the Western Cape, the three official
languages are English, Afrikaans and IsiXhosa. The majority of the learners at
HDI in the Western Cape have English as their second or third language. Most of
the technology and software programs that are used in higher education
institutions are in English. English is recognised as the language of commerce
and science. In 2001, however, it was spoken at home by only 8.2% of South
Africans, an even lower percentage than in 1996 (8.6%) (StatsSA 2001). English
is also the most common language on the Internet across the world. The
following table shows the results of a survey conducted by Bridges.org (2003) in
Cape Town on those who cannot read English.
Table 2.4. People per age group who cannot read English
(Source: Bridges.org 2003)
These people may be marginalised, as ICT becomes part of society
(Bridges.org:2003).
The education departments’ e-education (DOE:2003) document infers that the
“digital divide is not only about connectivity and infrastructure disparities” but it

18
is also about local language content (DOE 2003,2). What does this mean for
people who are not literate in the language that dominates the Internet?
The above literature on the digital divide has shown examples of students’ non-
accessibility to technology. Literature has also shown how home language,
gender and race have further widened the gap between the “haves” and the
“have-nots”. The National Plan for Higher Education (DOE: 1996b) makes
provision for better funding and provision of better access to information
technology for HDIs. Can these institutions be in a better position to make a
positive contribution? Can these higher education institutions play a vital role in
bridging the digital divide, by turning to technology to solve the teaching,
learning and assessment problems brought about by the apartheid era?
2.3 HIGHER EDUCATION
According to the Green Paper on Transformation (DOE:1996a)
Under apartheid, education was divided along racial/ethnic lines, excluding blacks from
quality academic education and technical training. The Extension of University
Education Act of 1959 applied this ideology to higher education. New universities were
created, for African, coloured and Indian students, who were permitted entry to white
universities only to pursue programmes not offered at black universities. Technikons,
created from 1978 onwards, were also developed within the apartheid framework.
In 2000, the South African higher education landscape consisted of 36 higher
education institutions, which consisted of 21 universities and 15 technikons. The
difference between the universities’ role and the technikon is that the former
provides general formative and professional education, basic and applied
research, and the latter a vocational and career education and “product-related”
research and development (DOE 1996b). The technikons have less autonomy
than universities, are subjected to external budget control, and programme
approval procedures (DOE 1996b).

19
The National Plan for Higher Education (DOE: 1996b) proposed the
“establishment of comprehensive institutions through the merger of universities
and technikons”. The new higher education landscape after the merger comprises
11 universities, and the previous technikons now constitute 6 universities of
technology in the new institutional landscape, similar to institutions found in
Australia, Germany and Belgium.
The post-1994 government inherited from the apartheid legacy a higher
education system that was
… segregated by race; unequal in terms of gender and language; divided by the
distinct functions performed between universities and technikon; and set apart
by highly uneven quality between and within different historical institutions
(CHE 2003).
One of the grave concerns facing the government is the gap between the pass rate
expected by institutions and the actual performance of the learners (Business Day
2003). South Africa’s higher-education institutions spend $163 million a year of
the money they receive from the government on the 25% learners who do not
complete their studies (Rossouw 2001). “Between 2000 and 2003, learner
enrolments grew at unexpectedly high rates. The rate of enrolment growth
exceeded the provision of the government subsidy allocations to the higher
education system” (DOE: 2004a). . According to Higher Education Management
Information System (HEMIS), the proportion of disadvantaged learners in the
higher education institutions is increasing, whereas learner output rates shows no
signs of improving (DOE:2004a).
One of the key issues as regards learner enrolment planning for higher education
is the emphasis of the throughput and graduation rates (DOE 2004a). Table 2.5
shows that about 36 000 (or 30%) of the total cohort of 120 000 first-time
entering undergraduates dropped out at the end of their first year of studies.

20
Table 2.5. First-time entering undergraduates
(Source: DOE 2004a)
PROGRESS OF 2000 COHORT OF FIRST-TIME ENTERING
UNDERGRADUATES
Universities Technikons TOTAL
Dropped out at end of 2000 25% 34% 30%
Dropped out at end of 2001 9% 13% 11%
Dropped out at end of 2002 7% 11% 9%
Total dropped out 2000-2002 41% 58% 50%
Graduated in 2002-2003 26% 19% 22%
Studying in 2003 but not
completing
33% 22% 28%
TOTAL IN COHORT 59 000 61 000 120 000
Table 2.6 shows the annual average success rates, which were calculated as ratios
of degree credits to FTE enrolments for the system for the period 2000-2003
(DOE 2004a).
Table 2.6. Annual success rates 2000-2003
(Source: DOE 2004a)
WEIGHTED AVERAGE ANNUAL SUCCESS RATES 2000-2003
2000 2001 2002 2003
Universities 66% 66% 71% 68%
Technikons 62% 63% 66% 66%
AVERAGE FOR THE
SYSTEM
65% 65% 69% 67%

21
Although there seems to be an improvement in the pass rates between 2000 and
2003, there is a strong indication that one third of the learners have either failed
or dropped out of the tertiary institution (DOE 2004a).
The Higher Education Quality Committee (HEQC) frameworks and policies
place emphasis on teaching and learning practice, i.e. the curriculum should be in
line with national policy targets with respect to throughput and graduate output
(DOE 2004b). Emphasis was also placed on the teaching and learning approach
to “promote access and success for learners from disadvantaged educational
backgrounds” and curricula should be designed in such a way that learners from
“poor learning backgrounds” could attain their potential (DOE 2004b).
On the one hand, it could be said that appropriate quality mechanisms will have
to be put in place to reduce repeater, drop-out and failure rates of students so
that institutions can discharge their education and training missions and
responsibilities. On the other hand, it could be argued that the scars or the
legacy of apartheid inherited by HDIs could take a number of years to be
overcome.
2.4 ASSESSMENT
Lin and Gronlund (2000) define assessment as “a general term that encompasses
the full range of instruments used to gain information about learning
(observations, ratings of performances or projects, paper-and-pencil tests)”.
Maree and Fraser (2004) further define assessment as “the organized purpose of
the level to which outcomes are reached by learners”. Siebörger (1998) states,
“… the focal purpose of assessment is to gain information and give feedback
about the progress of learners”. The Department of Education declares that

22
assessment is an important driver in education, which, if not well managed, can
become a barrier to innovation (DOE 2003).
According to the National Plan for Higher Education, the Higher Education
Quality Committee (HEQC) has now become responsible for the appropriateness
of the curriculum and the way standards are set and assessed. Previously, higher
educational institutions could survive only if they managed their enrolments
effectively and if there was no regard for how and what kind of learning took
place (Rucker & Schoenrock 2000). There was no accountability regarding
“whether or how learners were changed as the result of the educational
experience” (Rucker & Schoenrock 2000). There needs to be reconciliation
between assessment for learning and assessment for accountability (Hayward &
Hedge: 2005). Now, with the enrolment caps on government funding, there is a
stronger emphasis on learning and teaching, the throughput rate and graduation
output. It is imperative to “match enrolment plans with available resources to
enable the higher education system to deliver on its teaching and research
mandate” (DOE 2004). Since the first democratic election in 1994, “… the
system of higher education must be reshaped to serve a new social order, to meet
pressing national needs, and to respond to a context of new realities and
opportunities” (DOE 1996b). One of the main areas in which educational reforms
have taken place has been the adoption of the Outcomes-based Education (OBE).
This curriculum design had to be implemented from January 2001 in higher
education institutions.
Before the introduction of OBE, the assessment system was mainly norm-
referenced and primarily summative. According to Maree and Fraser (2004),
norm-referenced assessment refers to the comparison of learners’ achievements
with those of other learners or with pass marks or benchmarks to determine how
well the learner is doing. These authors argue that this approach is more content-
based than learner-centred and does not seem to focus on what the learners have
mastered or understood. In the outcomes-based approach,
… the formulated outcomes will guide how the teaching-learning process must be
constructed so that learners can be empowered with the knowledge, competencies and

23
values to fulfil the real-life roles when exiting the education system, as well as guiding
learning process by means of appropriate assessment (Maree & Fraser:2004).
The OBE assessment is criterion-referenced and formative in that it informs and
shapes learning (Newfield, Andrew, Stein & Maungedzo 2003). Maree and
Fraser (2004) discuss criterion-referenced assessment as “consisting of certain
criteria that learners are expected to achieve in a particular grade”. They
elaborate that the criteria are related to learners’ competencies in particular areas,
skills acquired, and attitudes expressed. Learners need to be made aware of the
outcomes at the outset or as early on in the programme as possible; the
assessment process should be clearly laid out.
2.4.1 Outcomes-based education
Siebörger (1998) defines outcomes-based education as “an approach to teaching
and learning which stresses the need to be clear about what learners are expected
to achieve”. The educator and learner are aware beforehand what performance is
expected of learners. Siebörger (1998) declares this to be an outcome. According
to Maree and Fraser (2004), outcomes have two common features. It could be –
… a verb that describes the action (collect, analyse, measure, etc.) and a noun or
phrase that describes how/where/on what the action will be performed …
The educator and the learner need to have a clear understanding of the
outcomes, so that the educator can assist the learner in achieving these
outcomes. Assessment is the measure of the degree to which the learner has
achieved the outcomes. Learning outcomes are grouped into three domains
by curriculum designers and educators: the cognitive domain (mental
processes); psychomotor domain (body movements and physical action) and
affective domain (attitudes, values and emotions) (Maree & Fraser 2004). The
taxonomy of educational objectives is used in identifying learning outcomes
that should be considered in the cognitive domain, when developing
objectives for classroom instruction (Lin & Gronlund 2000). Assessments

24
need to test the different levels of the cognitive domain. This is based on
progress from the simple to the complex. Maree and Fraser (2004) refer to
Bloom’s taxonomy of cognitive outcomes, namely
• knowledge: involves memorisation and recall of information;
• comprehension: involves making meaning of things, rather than
just remembering them, and is the lowest level of understanding;
• application: the ability to use abstract information and ideas in
concrete situations, such as solving problems;
• analysis: the ability to examine information systematically to
identify the hierarchy of ideas;
• synthesis :the ability to construct something new, to make a
coherent whole; and
• evaluation –the ability to make judgement about the quality of
things.
The reconfigured higher education system should expand on technology-based
capabilities (CHE 2000). The White Paper on Higher Education Transformation
(DOE 1997) states that higher education should be restructured so as to meet the
“... needs of an increasingly technologically-oriented economy”. How can
technology be employed with OBE to bring the disadvantaged institutions on par
with the advantaged?

25
2.4.2 Computerised assessments
The draft white paper on e-education (DOE 2003) defines e-learning as “flexible
learning using ICT resources, tools and applications, focusing on interaction
among teachers, learners, and the online environment”. E-learning uses learning
management systems (LMS), such as WebCT, Blackboard and Kewl as a web-
based platform for facilitating e-learning. WebCT is being used by 3000
institutions worldwide, in South Africa by 80 institutions. Some of the related
terms to e-learning include computer-based training (CBT), computer-related
technology (CRT), computer-assisted instruction (CAI), computer-assisted
education (CAE), computer-assisted assessment (CAA) and online education.
The meanings of these terms are starting to merge. The Education Department
(DOE 2003) believes that developments in ICTs can
…create access to learning opportunities, redress inequalities, improve the quality of
learning and teaching, and deliver lifelong learning. ICTs can accommodate differences
in learning styles and remove barriers to learning by providing expanded opportunities
and individualised learning experiences.
Literature seems to indicate that there could be a possibility to use electronic
assessments across different subjects or disciplines, but the outcome and the
benefits might be different. De Kock and De Kock (1994) used a mathematics
computer-aided learning (CAL) programme for disadvantaged learners entering a
tertiary institution as a special academic support programme, and it was
established that computerised testing can be an efficient way to overcome the
educational crisis in South Africa, provided that learners are motivated and
enthusiastic. Factors that have a positive influence of electronic formative
assessments (Aster 2003):
• can be used as a diagnostic test, e.g. to inform the lecturer of the
level of knowledge of the learners on a particular topic;
• as a remedial exercise – to bring learners up to the required level
to understand what will be discussed in class;
• during a class, as a form of problem-based learning; and

26
• after a class, to check on learning and reinforce concepts.
Peat and Franklin (2002) describe how Bloom’s taxonomy can be used as a guide
to develop different levels of increasing cognitive development in electronic
formative assessment:
Level 1: Test content and knowledge, by using multiple-choice questions
and drag and drop scenarios, with the answer always on the screen.
Level 2: Test application of content, using some multiple choice
questions, but mostly with a format that expects text input from the
learner.
Level 3: Test analysis, using question formats as for Level 2, but with the
addition of two-part questions and formats requiring the building up of
diagrams, flowcharts, etc.
Level 4: Test synthesis of information, the most used format being free-
flow prose, where the learner is expected to synthesise information in
response to a question. This format is not computer-marked but assessed
by the learners comparing their work with sample answers, and with the
option of self-scoring their own performance.
Studies that have been conducted internationally and nationally have revealed
that electronic formative assessment and learner-based learning have a positive
effect on learner outcomes as compared with the traditional, instruction-based,
teacher-centred learning, provided that other interventions to promote technology
assisted learning, are in place (Aster 2003; McCabe and Skinner 2003; Roodt &
Conradie 2003; Ricketts & Wilks 2002; Khan 2001; Buchanan 2000; McKenna
& Hesketh 2000; Bull & Stephens 1999; O’Reilly & Patterson 1999; Stephens et
al 1998).
2.4.3 Meta-analysis
According to Gorard (2001), meta-analysis is a “method that can take all past
studies, allot them their appropriate influence without undue bias, and so compile

27
a clear and convincing account of the current state of knowledge in the field”. In
meta-analysis, the results from an individual study are assigned an effect size
(ES) which is a value assigned to it according to its size, quality and the
effectiveness of the treatment condition (Gorard, 2001). McCabe and Skinner
(2003) conducted a meta-analysis on 20 peer-reviewed studies from 1997 to
2002. These studies comprised groups of learners of not less than one hundred in
each sample. McCabe and Skinner (2003) reported that on their combined
samples of 4314 learners, they discovered that electronic formative assessment
teaching has a small but positive effect on learner outcomes when compared with
traditional instruction. In this study, the effect size (ES = ‘0’) showed no
difference between the experimental and control group, but there was a
difference between the scores obtained between the experimental and control
group. The report showed that the experimental group, which was exposed to
technological instruction, received higher scores in their summative assessment.
2.4.4 Summative assessment
The majority of studies available for review seem to be on the use of
computerised assessments for formative purposes. Stephens et al. (1998) point
out that, as materials become refined following formative use, they are often
incorporated into summative assessments. These authors expand on this by
indicating that summative assessment is used to provide a more varied
assessment and is used with more traditional and other innovative practices when
compared to formative and computerised assessments. Bull and Stephens (1999)
explain that the use of computerised summative assessment involves a greater
need for staff development and time to ensure that effective assessment takes
place. The summative environment needs to be formal, structured and invigilated
(Stephens et al. 1998). In the case of distance learning, summative techniques
can be very successful when utilising internet technologies, and it can be flexible,
self-paced and self-directing when supported by virtual groups of online learners
and experts (O’Reilly 1999).

28
2.4.5 Formative assessment
Successes reported by recent studies with the use of computerised formative
assessments for learners and staff include the following:
Learners
• immediate, individualised, convenient and meaningful feedback to
learners, which is anonymous and non-threatening. Learners can monitor
their educational progress, which can direct them to further study(Khan
2001);
• learners have a closer match between the assessment and learning
environment (Ricketts & Wilks:2002);
• learners can remedy whatever weaknesses the assessment has
exposed, after feedback; tests can be used repeatedly in order to assess
extent of improvement (Buchanan: 2000);
• learners can follow up references and resources, through feedback
(Stephens et al. 1998).
• feedback enables grades to be “relayed and justified”, as well as
providing an opportunity to help learners to improve their
understanding (Brown et al. 1997, cited in Bull & Stephens 1999);
• can be experimental, learner-centred and learner-led, fast,
consistent and effective feedback (Stephens et al. 1998); and
• assist learners in closing the gap between actual and desired levels
of performance(Black & William 1996)
Staff
• allows for greater levels of independence where learners are self-
directed while enabling staff to attend to those learners requiring greater
assistance (O’ Reilly & Patterson 1999);

29
• where large number of “learners or lengthy pieces of work are
involved, practical constraints (such as time or workload pressure)” allow
for fast and useful feedback to learners (Buchanan 2000);
• staff can monitor learner activity and progress (Bull & Stephens
1999);
• diagnose learners’ problems and follow their progress more
easily; also be alerted to issues learners are having difficulty with these in
class and re-address it (O’Reilly & Patterson 1999); and
• reduction of time spent marking, preparing necessary
administrative information, accurate marking across a range of answers,
freedom of any gender or cultural prejudices, improved turn-around time
for results to learners and producing reports (Stephens et al. 1998).
Literature demonstrates that electronic formative assessment process could be
used to motivate students to learn. In addition, the introduction of formative
assessment would need some radical shift in classroom pedagogy. There is strong
evidence to support that the use of computers in a learning environment can be
conducive to learning for both educator and learner.

30
2.5 AGAINST TECHNOLOGY
Recent research has indicated barriers to successful integration of computer-
assisted assessments in higher education: institutional policies, teaching
pedagogies, and teachers’ philosophy to teaching and learning, and learners’
perceptions (Ricketts & Patterson 2002; Scase & Scott 2001; Stephens et al.
1998).
2.5.1 Institutional policies
Scase and Scott (2001) encountered the following problems while implementing
computerised assessments in psychology at their higher education institution:
• infrastructure problems – the networking of hardware and
software and not being able to use certain software on the network;
• creating an awareness and dissemination of information to
academic staff;
• commitment of staff time to training;
• support from the institution’s information system;
• the need for policy and strategic planning within subject areas, in
specific schools and faculties and across the higher education institution;
and
• the need for a central proactive team that can provide
encouragement and support.
Stephens et al. (1998) include the following as well:
• an institutional information strategy required to underpin the
application of technology to the curriculum in an economical and
effective way in order to achieve volume results (Campbell et al. 1996,
cited in Stephens et al. 1998); and
• institutional support and security.

31
Kestner, Hall & Limback (1999) asserts that there is not a high level of
commitment from the faculty involved or support from higher levels of the
university.
2.5.2 Teaching pedagogies
Aster (2003) indicates that the most common type of computerised assessment
are multiple choice questions or questions requiring precise or short answers,
which are more commonly used in the sciences. Stephens (2001) argues that
multiple choice tests lack depth in testing subject knowledge and maintains that
this type of questions encourages learners to guess. Bonk (2002) states that there
is a need for software that provides for online debates, role playing, comparison
and contrast, or brainstorming (other than chat tools).
2.5.3 Educators’ philosophy to teaching and
learning
Beffa-Negrini, Cohen and Miller (2002) argue that academics feel that face-to-
face environments, verbal repetition and feedback to learners can clarify written
directions, whereas enthusiasm and empathy are lost in online learning.
Academics also feel that they are losing control of one of their major teaching
activities by no longer directly grading their learners’ papers (Stephens et al.
1998). Bonk (2002) asserts that the academics need training to teach effectively
on the web. Selwyn (1997) contends that the main disadvantage for educators
using computerised assessments is the increased time involved in administering
the tests.
2.5.4 Learners
Learners may be disadvantaged with the learner-assessment interface and the
scrolling of question papers, which mimic the paper-based test (Ricketts&Wilks:

32
2002). Learners indicated that online testing may or may not match their learning
styles, especially if they are kinaesthetic or hands-on learners (Rucker &
Schoenrock 2000). Rucker and Schoenrock further suggest that English as
second language (ESL) learners and other diverse learners find the reading of
questions from a computer monitor difficult and time-consuming and timed tests
may therefore not be advantageous to these learners.
2.6 CONCLUSION
Based upon the literature review and the needs indicated previously, this study
attempted to explore the effect of electronic formative assessments on learner
achievement in historically disadvantaged institutions.
Literature has shown that there are two perspectives in examining the impact of
educational technology in higher education. The first perspective is a micro
approach (as shown in Figure 2.5) that focuses on classroom assessment,
teaching pedagogy, educational technology, educators and learners. The second
is a macro approach that examines the influence the environment has on the
learner relating to the apartheid legacy, the digital divide and institutional and
government policies.
In the micro approach, literature reveals that with the introduction of outcomes-
based education, there are many advantages and disadvantages to the alternative
forms of assessments that could influence the learning outcomes. There has been
great emphasis on frequent, formative assessments, which has led to an
improvement in summative scores. With the shift to OBE, the teaching pedagogy
changes from behaviouristic to constructivist. There is also strong evidence to
support technology-based learning, which has been of great benefit to both
educators and learners. Literature has also shown that there is resistance amongst
educators to adopt the new teaching pedagogy. This has led to frustration for the
educator and learner with the use of the “old” traditional mode of teaching in the

33
new outcomes-based curriculum, which has been further aggravated by the
introduction of educational technology.
In the macro approach, literature has shown that the apartheid legacy has left its
scars on education. This has given birth to the digital divide in South Africa,
which is also a world phenomenon between the “haves” and the “have-nots” in
the global information society. There are many government policies in place to
redress the inequalities of the past, by focusing on the previously HDIs of higher
education, so that they can produce graduates with the knowledge, competencies
and skills to contribute to the economic and social development of the country.
There is strong evidence from literature that shows that technology-based
learning has failed in many institutions because institutional policies were not in
place to support technology-based learning. There is also a stronger indication in
literature that with training and support from the institution, technology-based
learning has a very positive impact on throughput and graduation rates. The
introduction of technology-based learning in South Africa would involve a
completely new teaching and learning paradigm for the learners and educators.
Figure 2.2. Micro and macro perspectives
Govern- ment
Policies
Apar-theid legacy
Institu- tional
policies
Digital divide
Class- room

34
CHAPTER 3
METHODOLOGY
3.1 INTRODUCTION
The aim of this research is to determine how the utilisation of electronic formative and
summative assessments in higher education can improve learner achievement. This
chapter presents a discussion of the research design and methodology used to explore
the aim of this study. Firstly, a justification for the design chosen and a description of
the research setting is provided. Secondly, a description of the population, instruments,
and data collection procedures, including ethical measures, validity, reliability,
hypothesis, and method of analysis used is included.
3.2 RESEARCH DESIGN AND METHODOLOGY
A research design is a plan or blueprint of an investigation to obtain answers to research
questions or problems (Babbie & Mouton 2001). The design focuses on the end product,
the study that is being planned and the kind of results that are expected. The research
methodology focuses on the research process and the kind of tools and procedures to be
used. According to Zikmund (2003), the terms qualitative and quantitative are used
frequently to identify different modes of inquiry or approaches to the research process.
Quantitative research is all about quantifying relationships between variables, about
individuals’ perceptions and insights into relationships about the world (Bell 1987).
Qualitative research is based on recognition of the importance of the subjective,
experiential “life world” of human beings. Burns (2000) describes qualitative research
as being naturalistic, involving the importance of subjective experience of individuals,
an ideographic approach and as a holistic analysis, as opposed to the criteria of
reliability and statistical compartmentalisation of quantitative research. Table 3.1 below

35
shows some differences between qualitative and quantitative methodologies (Babbie &
Mouton 2001).
Table 3.1. Qualitative and quantitative methodologies
Orientation Quantitative Qualitative
Assumptions of the
world
A single reality can be
measured by an
instrument.
Multiple realities, e.g.
interviews with educators,
learners, parents.
Research purpose Determine the quantity or
extent of some
phenomenon in the form of
numbers
Provides greater
understanding of a concept or
crystallises a problem.
Research methods and
process
Deductive
generalising
Inductive
contextualising
Notion of objectivity Maximum control over
extraneous factors
Gaining trust and rapport in
order to get as close as
possible to subject
Researcher role Detached with use of
instrument
Prepared person becomes
immersed in social situation
Quantitative research uses the deductive process (as shown in Figure 3.1), which starts
with an abstract, logical relationship among concepts and then move toward concrete
empirical evidence, as opposed to the inductive process used in qualitative research
(Neuman 2000). The inductive process (as shown in Figure 3.1) starts with only vague
concepts, which are then refined, to develop empirical generalisations and identify
preliminary relationships (Neuman 2000). The following figure shows deductive and
inductive theorising (Neuman 2000).
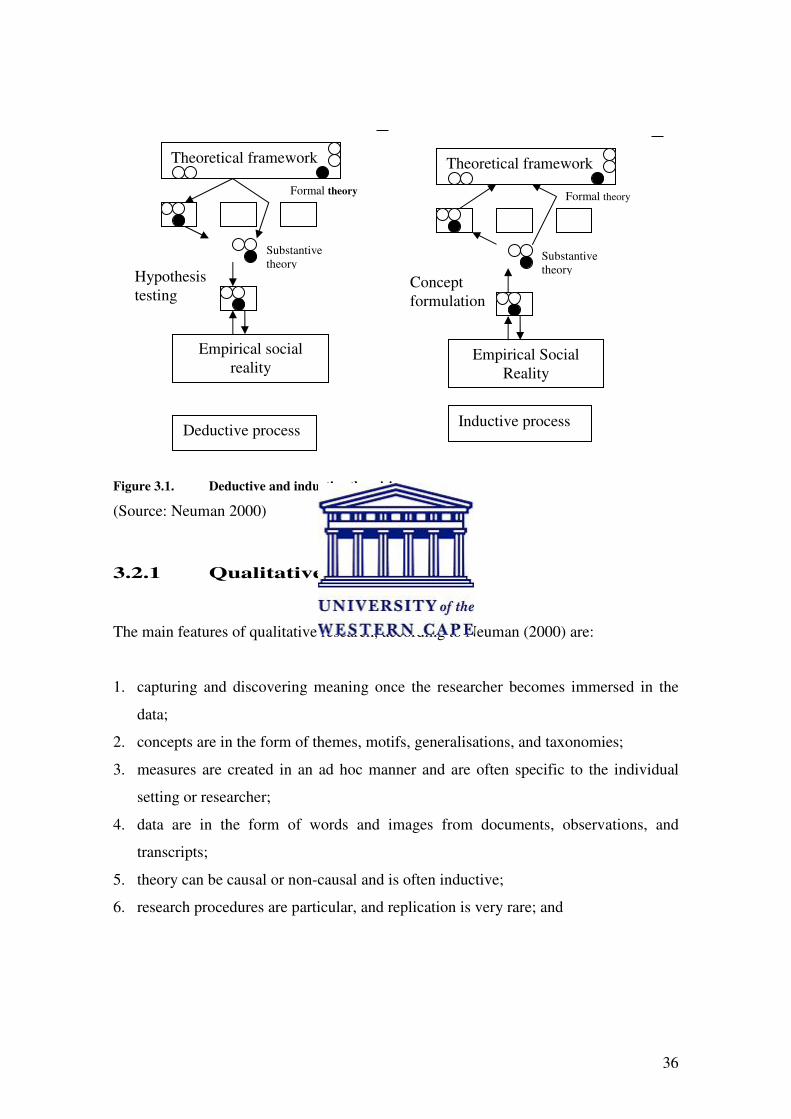
36
Substantive theory
Formal theory
Concept formulation
Theoretical framework
Empirical Social Reality
Inductive process
Figure 3.1. Deductive and inductive theorising
(Source: Neuman 2000)
3.2.1 Qualitative research
The main features of qualitative research, according to Neuman (2000) are:
1. capturing and discovering meaning once the researcher becomes immersed in the
data;
2. concepts are in the form of themes, motifs, generalisations, and taxonomies;
3. measures are created in an ad hoc manner and are often specific to the individual
setting or researcher;
4. data are in the form of words and images from documents, observations, and
transcripts;
5. theory can be causal or non-causal and is often inductive;
6. research procedures are particular, and replication is very rare; and
Substantive theory
Formal theory
Hypothesis testing
Theoretical framework
Empirical social reality
Deductive process

37
7. analysis proceeds by extracting themes or generalisations from evidence and
organising data to present a coherent, consistent picture.
Research is based on assumptions. The most significant assumption that underpins
qualitative research is based on the underlying epistemology, which guides the research.
According to Myers (1997), “epistemology refers to assumptions about knowledge and
how it can be obtained”. The three categories based on the underlying epistemology are
shown in the figure below (Myers 1997).
Figure 3.2. Underlying assumptions
(Source: Myers 1997)
The three categories based on the underlying epistemology are positivist, interpretive
and critical (Chua 1986 in Myers 1997). Each of the categories is associated with
different traditions in social theory and diverse research techniques (Neuman 2000).
Positivist
Myers (1997) describes positivist research as having measurable properties, which are
independent of the researcher and instruments. Burns (2000) elaborates that research is
positivist if there is evidence of quantifiable measures of variables, hypothesis testing
and the drawing of inferences.
Influences/guides
Qualitative research
Positivist Interpretive Critical
Underlying epistemology

38
Interpretive
Interpretive research begins with the assumption that the approach to reality is only
through social constructions such as language, consciousness and shared meanings
(Myers 1997). Interpretive research often uses participant observation and field
research and the research is not just the external or observable behaviour of people, but
meaningful social action (Neuman 2000).
Critical
Critical research is a mix between the nomotheitic and ideographic approaches. Neuman
(2000) defines critical research as a
… critical process of inquiry that goes beyond surface illusions to uncover the real structures in
the material world in order to help people change conditions and build a better world for
themselves.
Strengths of qualitative research
1. Insiders’ view of the field – maintain close association with both participants and
activities within the setting, the researcher has to maintain close association with
both participants and activities within the setting (Burns 2000).
2. Proximity to the field – qualities of social and educational interaction too often
missed by the scientific, more positivistic inquiries (Burns 2000).
Limitations of qualitative research (Burns 2000)
1. Contexts, situations, events, conditions and interactions cannot be replicated to any
extent.
2. Subjective nature of a participant’s perspective and understandings is not suitable to
the scientific criteria.
3. Time required for data analysis collection and interpretation.

39
3.2.2 Quantitative research
The main features of quantitative research (Neuman 2000) are:
1. tests hypothesis with which the researcher begins;
2. concepts are in the form of distinct variables;
3. measures are systematically created before data collection and are standardised;
4. data are in the form of numbers from precise measurement;
5. theory is largely causal and is deductive;
6. procedures are standard, and replication is assumed; and
7. analysis proceeds by using statistics, tables, or chards and discussing how what they
show relates to hypotheses.
Positivism
Neuman defines positivism as the approach of the natural sciences. Positivism assumes
cold, observable facts, quite distinct from ideas, values, or theories (Neuman 2000). The
positivists emphasised the role of discrete and distinct steps on the path to knowledge as
the best way of discovering things (Burns 2000). According to the positivists, science is
based on deduction (Burns 2000).
Strengths of quantitative research
1. Control is achieved through sampling and design and precision through quantitative
and reliable measurement (Burns 2000).
2. Experimentation is an excellent vehicle for the controlled testing of causal processes
(Babbie & Mouton 2001).
3. Hypotheses are tested through a deductive approach, and the use of quantitative data
permits statistical analysis (Neuman 2000).

40
Limitations of quantitative research
1. Control – human beings have varying perceptions, and act differently in the same
situation (Burns 2000).
2. Quantification does not take into account peoples’ experiences (Babbie & Mouton
2001).
3.3 RESEARCH APPROACH
A quantitative research design was selected for the purposes of this study because it
displays the following features:
• hypothesis testing – the author could systematically create a hypothesis and
subject it to an empirical test;
• concepts were in the form of distinct variables (the standardised test – the
independent variable, and treatment, race, gender, home-language – dependent
variables);
• measures were systematically created before data collection and are
standardised;
• data are in the form of numbers from measurement of learners’ achievement;
• theory is largely causal and is deductive from the measurements. The author
moved from general kinds of statements to particular ones.
• replication – the data obtained in the experiment should be reliable and the
same result has to be found if the study is repeated; and
• analysis was done by using statistics, tables, or charts and discussions on how
what they show relates to hypotheses, which enables the author to obtain the
measurements and analysis of the properties of the phenomenon under
investigation.

41
3.4 RESEARCH POPULATION
The target population included all first-year learners registered for Business Information
Systems at Peninsula Technikon. The population for this study was 450 (according to
figures from Peninsula Management Information Systems, April 2004). Participants
were learners who had registered for Business Information Systems 1(Annexure III),
Accounting Department, Business Faculty. This population was chosen based upon the
following criteria:
1) the author lectured on the subject;
2) ease of access; and
3) an expressed need and interest in the type information that this study could
provide. Learners were randomly assigned to available classes through a computer-
scheduling programme. Intact classes were taught within a 90-minute period. The
classes were taught for two periods a week (Annexure IV).
Four of the classes (experimental – as shown in Figure 3.2) were exposed to electronic
formative assessment for an additional two hours per week as well as instructional
teaching. The other four classes (control – as shown in Figure 3.2) had no formative
online assessment, only instructional teaching. The subjects used in the sample
population for this study consisted of all respondents to the questionnaire. Some of the
respondents belonged to the control group, and others belonged to the experimental
group (formative online assessment).
3.5 RESEARCH INSTRUMENTS
In order to obtain data to construct a meaningful representation of the phenomena, the
relationship between electronic formative assessment and learner achievement was
divided into three categories: technological background, online learning and assessment.
The following instruments were utilised:
1. standardised tests for all learners enrolled for Business Information Systems;

42
2. a questionnaire for gathering information to determine the demographic data,
technological background and online experience of the respondents; and
3. experimental design, where the participants were divided into two groups: one
group would be administered with the treatment and the other would be the control
group without the treatment.
3.5.1 Standardised tests
All learners were administered with standardised summative assessments (Annexure V
– Assessment Schedule) in the first two units of Business Information Systems. The
standardised tests were based on the assessment criteria in the curriculum of Business
Information Systems Module 1 (Annexure VI). The first unit is a practical component
on the navigation of the desktop and file management techniques. The second unit is a
theory component, comprising of theory of software and hardware elements of a
computer. The scores for these tests were obtained from the Peninsula Management
Information System
3.5.2 Questionnaires
Definition and nature of questionnaires
According to Burns (2000), a questionnaire is the most commonly used descriptive
method in educational research. Bell (1987) states that
A survey will aim to obtain information from a representative selection of the population and
from that sample will then be able to present the findings as being representative selection of the
population. The survey is used to obtain information, which can be analysed, and patterns
extracted and comparisons made.
Gorard (2001) asserts that technology-based, self-administered questionnaires are
preferable for those respondents, who are literate, well motivated, and who have no
clear need for individual attention. He elaborates by indicating his preference for the
delivery by the researcher to natural groups of respondents, such as school classes (
Gorard 2001).

43
Characteristics of questionnaires (Burns 2000)
• A questionnaire requires a sample of respondents to reply to a number of
standard questions under comparable conditions;
• it can be administered by an interviewee, mail, and Internet or by telephone;
• the respondents represent a defined population;
• the results can be generalised to the defined population; and
• the use of standard questions makes comparisons of individuals possible.
Construction of the questionnaire
The construction of the questionnaire was based on an early review of the literature and
surveys conducted by the Cape Town City Council on the residents of Western Cape.
The instrument was also developed to include areas on previous computer experience of
the respondents, computer training and their online experiences. According to Gorard
(2001), a key decision affects the likely response rate, cost, speed, sample size on how
to deliver it to the sample. The questionnaire was done by technology-based delivery
(Gorard 2001). The questionnaire was placed on the faculty intranet, the learners were
asked to download the questionnaire, to complete it and to e-mail the completed
questionnaire to the author.
3.5.3 Experimental research
Experimental research uses the logic and principles found in natural science research.
Experiments can be conducted in laboratories or in real life (Neuman 2000). Under this
approach, the researcher divides the people being studied into two or more groups
(Gorard 2001). Gorard (2001) states that in the control group or experimental design,
… the researcher creates two (or more) ‘populations’ by using different treatments with two samples
… Each sample becomes the treatment group … The treatment is known as the ‘independent’
variable, and the researcher selects a post-treatment test (or measure) known as the ‘dependent’
variable. Usually one group will receive the treatment and be termed the experimental group and
another will not receive the treatment and be termed the control group.

44
In this study, the respondents were divided into groups according to their prior
computer usage. Figure 3.2 below demonstrates how the treatment was used on the
experimental group.
The experimental research design was used on a group of learners who had registered
for Business Information Systems Module 1 (Appendix III). The treatment for the
experimental group comprised of using a formative online learning assessment. The
control group was not exposed to the treatment. The post-treatment test will be the
standardised summative assessment; and the scores of the test were the dependent
variable. Independent variables included the treatment condition, race, gender and home
language.
Figure 3.3. Experimental design
3.6 VALIDITY AND RELIABILITY
Factors such as learner gender, race/ethnicity and home language are intervening
variables that could have an impact on the external validity of this study. Educator
Experimental group Control group
Learners with prior computer usage
Learners with no prior computer usage
Administer treatment (electronic formative assessment)
Measure dependant variable (Test)
Measure dependent variable (Test)

45
effects on learners in both the control and experimental groups can interact to confound
results. These effects may include:
· the educator’s quality of implementation of the treatment condition;
· quality of instructional delivery, and
· learner rapport.
All or any of these educator effects can interact with the treatment condition to mask or
exaggerate results of the study.
3.7 RESEARCH HYPOTHESES
The word hypothesis is generally used in a rather restricted sense in research to refer to
conjectures that can be used to explain observations (Burns 2000). A hypothesis is a
hunch, an educated guess that is advanced for the purpose of being tested (Neuman
2000). Hypotheses are the working instruments of theory.
The general hypothesis of this research was that, when compared to a traditional,
behaviourist classroom, the enriched constructivist-learning environment by making use
of computerised formative assessments would result in significantly greater
improvements in learner achievement. Based on the general hypothesis and the nature
of the proposed study, the following specific hypotheses were formulated.
Hypothesis 1: The learner achievements of those learners who have used a
computer before attending campus are much higher than those learners who
did not.
Hypothesis 2: The learner achievements of those learners who received
treatment in the experimental group are much higher than the control group
who did not receive treatment.

46
3.8 DATA ANALYSIS
Data was quantitatively analysed by means of tables, percentages, graphs and
explanations. The aim of analysing the data in tables and graphs is to provide a
condensed picture of the data collected and to give adequate coverage in words. The
tables will show how evidence was collected by the author. According to Neuman
(2000), data analysis is a search for patterns in data. Once these patterns are found, they
must be interpreted by means of tables and percentages.
3.9 ETHICAL CONSIDERATIONS/ISSUES
Neuman (2000) explains that the researcher has an obligation to be ethical, even when
the research subjects are unaware of or unconcerned about ethics.
The author is a lecturer at the Cape Peninsula University of Technology and at the time
that the research was planned and conducted, the institution was named Peninsula
Technikon. Permission to conduct the study was granted by the head of Department of
Accounting in the Business Faculty. The author included a letter (Annexure I), which
formed part of the questionnaire (Annexure II), which briefed the learners about the
study and asked for consent. Consent was obtained by the time the learners had
completed and returned the questionnaire.
Neuman (2000) states that informed consent is a “fundamental ethical principle of social
research”. With informed consent, it is likely that the research results would not be
negatively influenced, as participants would be well informed about the study (Neuman
2000). Confidentiality and anonymity were guaranteed in an effort to uphold research
principles and to maintain respondents’ rights and values (Babbie & Mouton 2001).
Information disclosed was treated confidentially. Burns (2000) defines confidentiality as
“the ability of the researcher to keep disclosed information from others”.
47
3.10 CONCLUSION
This chapter focused on a study of the use of electronic formative assessment on learner
achievement. The author explained the research design and methodology, the research
population, the research instruments, the research hypotheses, data analysis and ethical
considerations and the conclusion.
The following chapter presents the research results, and covers aspects such as
demographic information, technological and online learning background, and the
hypotheses.

48
CHAPTER 4
RESULTS
This chapter is organised in the following manner:
(1) The introduction will briefly describe the statistical tests used for analysis;
(2) Demographic, technological background and online learning data will precede
the hypothesis;
(3) Each hypothesis will be presented with results, and discussion; and
(4) Observations will close the chapter.
4.1 INTRODUCTION
There were two data collection components. Firstly, all learners were administered with
summative tests during the first semester as part of the Assessment Schedule (Appendix
V). The scores for Test 1 and Test 2 of the Assessment Schedule were used to determine
the differences between control and experimental groups. The Test 1 scores were also
used to measure the digital divide in respect of technological background, computer
usage, gender, race and home language of learners. Secondly, learners were asked to
complete questionnaires.
A one-way analysis of variance (ANOVA) was used to compare the means of the scores
for Test 1, File Management and Test 2, Theory on the dependent variables, gender and
race, to:
1) determine whether there was a difference between the scores of those who used
a computer prior to coming to the technikon and those who did not; and
2) determine whether there was a difference between the scores of the experimental
and control group.
It was predicted that scores from those who used a computer prior to coming to the
technikon and those who received treatment in the experimental group would have
higher means. A probability level of .05 was used in all statistical tests. Due to the

49
extreme sample size differences present in the subpopulations, the Kruskal-Wallis
multiple-comparison Z-value test was also used. The research hypotheses were tried
against the collected data.
All returned questionnaires were examined for completeness and accuracy. The data
collected was in the form of nominal data. Nominal data is data reported as frequencies
in categories as opposed to ordinal data which lies on a continuum. Upon return, the
questionnaires were entered into the computer using database software (Microsoft
Access) and exported into a spreadsheet (Microsoft Excel). A contingency table
was constructed for each section of data that applied to the hypothesis. Descriptive and
inferential statistics were used to analyse the data by using the statistical software
package SPSS™.
4.2 DEMOGRAPHIC DATA
Learners’ age, gender, race, home language and type of school attended were tabulated
by frequency and percentage. Table 4.1 reports these counts and percentages. Of the 185
who responded, 93.48% were between the ages of 19 and 22, 64.32% were female,
66.49% were black, and 55.14% reported their home language as IsiXhosa. The highest
percentage, 71.04%, had attended government schools (See Table 4.1).

50
Table 4.1. Demographic data of respondents
Item Count Percentage Item Count Percentage
Gender Home language
Female 119 64.32% Afrikaans 39 21.08%
Male 66 35.68% English 22 11.89%
Race Isixhosa 102 55.14%
Black 123 66.49% Isizulu 3 1.62%
Coloured 61 32.97% Sepedi 5 2.70%
Indian 1 0.54% Sesotho 7 3.78%
Type of school Setswana 6 3.24%
Farm school 1 0.55% Siswati 1 0.54%
Govt. school 130 71.04% Age
Model C school 28 15.30% 17-19 105 57.07%
Private school 13 7.10% 20-22 67 36.41%
Village school 11 6.01% 23-25 10 5.43%
26+ 2 1.09%
*Counts may not total 185 due to some respondents not answering the question.
4.3 TECHNOLOGICAL BACKGROUND
Sixty-nine percent of the respondents reported access to computers for personal or
school use prior to attending the technikon. First time access to a computer was at the
following points: college, community centre, family, friend, home, school, Internet café
and library. Fifty-five percent of the respondents had first had access to the computer at
school, 23% at home and 12% at a college. Figure 4.1 shows the percentage of
respondents' first access to computers.

51
College
Com
munity C
entre
Family
Friend
Hom
e
Internet Café
Library
School
Work
Place of Access
0
10
20
30
40
50P
erc
en
t
First start using a computer
Figure 4.1. Point of access; Community centre; Internet Café
Ownership of amenities
In order to examine differences in the adoption of available technologies, the percentage
of learners accessing each technology was analysed.
Sixty-one percent of the respondents indicated that they have a telephone at their place
of residence, 85% possess a radio, 81% a television set, 60% a cell phone, 20% a
computer and 3.8% access to the Internet. Figure 4.2 shows access to amenities:

52
Access of Amenities
0
20
40
60
80
100
Telep
hone
Radio
Television
Computer
Internet
Cell P
hone
Amenities
Perc
enta
ge
Figure 4.2. Access to amenities, cell phone
Cell phone usage
Respondents were asked to indicate how they used their cell phones. Fifty-eight percent
indicated that they played games, 90% send SMSs (short messaging service), 92% make
calls and all learners receive calls on their cell phones. Figure 4.3 shows the major use
of cell phones by respondents.
100%92% 90%
58%
0%
20%
40%
60%
80%
100%
120%
Receive calls make calls Send sms games
Figure 4.3. Make calls; send SMS; Games

53
Thirty-four percent of the respondents reported using e-mail prior to attending the
technikon. Access to a computer was obtained at the following: college, community
centre, family, friend, home, school, Internet café and library. Figure 4.4 shows the
percentage of respondents’ usage of e-mail.
66.5
33.5
No
Yes
% Use of Email prior to attending Technikon
Figure 4.4 Percentage usage of e-mail
ATM usage for the first time
Seventy-seven percent of the respondents reported using an automatic teller machine
(ATM) prior to attending the technikon. Respondents were asked to rate their feelings
the first time they used the ATM. Figure 4.5 shows the percentages of how respondents
felt when using an ATM for the first time.
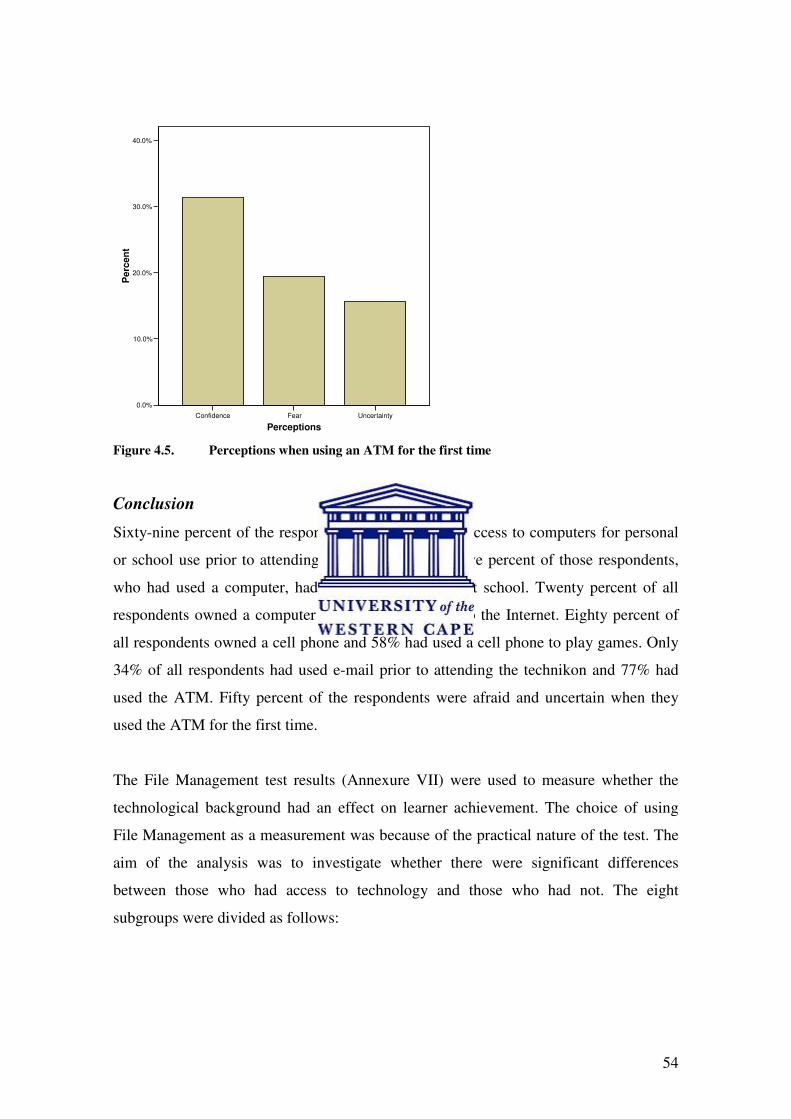
54
Figure 4.5. Perceptions when using an ATM for the first time
Conclusion
Sixty-nine percent of the respondents reported having access to computers for personal
or school use prior to attending the technikon. Fifty-five percent of those respondents,
who had used a computer, had accessed a computer at school. Twenty percent of all
respondents owned a computer and 3.8% had access to the Internet. Eighty percent of
all respondents owned a cell phone and 58% had used a cell phone to play games. Only
34% of all respondents had used e-mail prior to attending the technikon and 77% had
used the ATM. Fifty percent of the respondents were afraid and uncertain when they
used the ATM for the first time.
The File Management test results (Annexure VII) were used to measure whether the
technological background had an effect on learner achievement. The choice of using
File Management as a measurement was because of the practical nature of the test. The
aim of the analysis was to investigate whether there were significant differences
between those who had access to technology and those who had not. The eight
subgroups were divided as follows:
Confidence Fear Uncertainty
Perceptions
0.0%
10.0%
20.0%
30.0%
40.0%
Perc
en
t
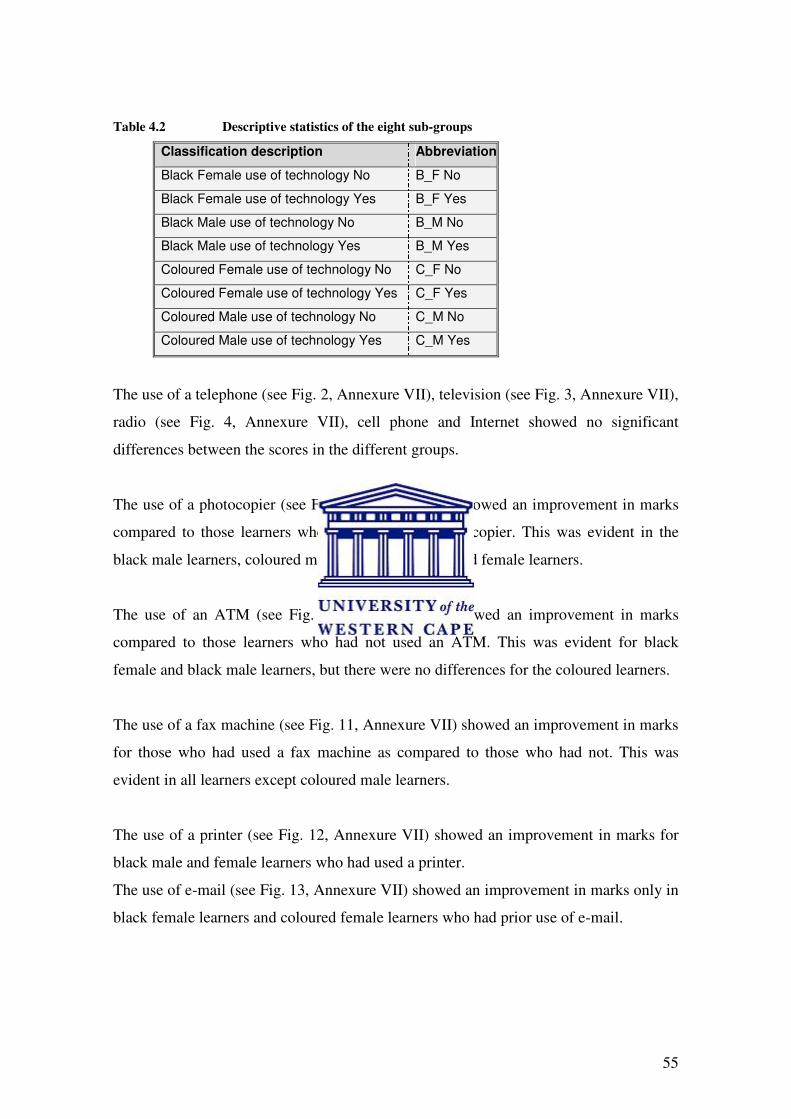
55
Table 4.2 Descriptive statistics of the eight sub-groups
Classification description Abbreviation
Black Female use of technology No B_F No
Black Female use of technology Yes B_F Yes
Black Male use of technology No B_M No
Black Male use of technology Yes B_M Yes
Coloured Female use of technology No C_F No
Coloured Female use of technology Yes C_F Yes
Coloured Male use of technology No C_M No
Coloured Male use of technology Yes C_M Yes
The use of a telephone (see Fig. 2, Annexure VII), television (see Fig. 3, Annexure VII),
radio (see Fig. 4, Annexure VII), cell phone and Internet showed no significant
differences between the scores in the different groups.
The use of a photocopier (see Fig. 9, Annexure VII) showed an improvement in marks
compared to those learners who had not used a photocopier. This was evident in the
black male learners, coloured male learners and coloured female learners.
The use of an ATM (see Fig. 10, Annexure VII) showed an improvement in marks
compared to those learners who had not used an ATM. This was evident for black
female and black male learners, but there were no differences for the coloured learners.
The use of a fax machine (see Fig. 11, Annexure VII) showed an improvement in marks
for those who had used a fax machine as compared to those who had not. This was
evident in all learners except coloured male learners.
The use of a printer (see Fig. 12, Annexure VII) showed an improvement in marks for
black male and female learners who had used a printer.
The use of e-mail (see Fig. 13, Annexure VII) showed an improvement in marks only in
black female learners and coloured female learners who had prior use of e-mail.

56
4.4 ONLINE LEARNING
Respondents were asked if their usage of computers had changed since the increased
emphasis on online learning. Respondents were asked to indicate whether the online
learning assisted their learning. In this case, 94.05% learners indicated that it did assist
them in learning and 5.95% indicated that it did not. Figure 4.6 shows the percentage of
learners assisted in learning.
Figure 4.6. Assist learning.
Learners were asked to rate their overall computer expertise at the technikon. Five
respondents (10%) indicated they were excellent, 32 (60%) said their expertise was
good, 14 (26%) average and 2 (3%) rated themselves as poor. Figure 4.7 shows how
respondents rated their expertise:
5.95%
94.05%
Assist Learning
No
Yes
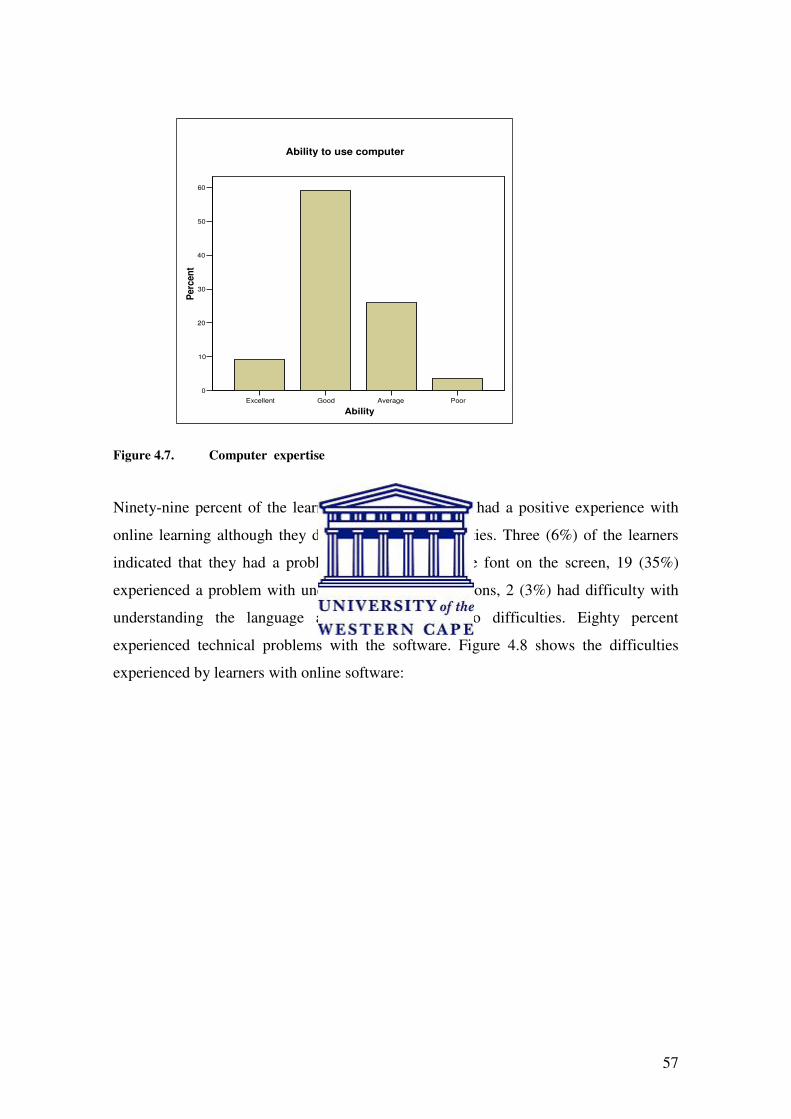
57
Figure 4.7. Computer expertise
Ninety-nine percent of the learners indicated that they had a positive experience with
online learning although they did have certain difficulties. Three (6%) of the learners
indicated that they had a problem with the size of the font on the screen, 19 (35%)
experienced a problem with understanding the instructions, 2 (3%) had difficulty with
understanding the language and 19 (35%) had no difficulties. Eighty percent
experienced technical problems with the software. Figure 4.8 shows the difficulties
experienced by learners with online software:
Excellent Good Average Poor
Ability
0
10
20
30
40
50
60P
erc
en
t
Ability to use computer

58
Figure 4.8. Difficulties with online learning
When asked to rate the level of difficulty of their online assessments, 1 (2%) indicated
the assessments to be very difficult, 17 (32%) very difficult, 32 (60%) easy and 3 (6%)
very easy. 33 (67%) indicated that they would prefer to do electronic assessments in
other subjects in their Accounting Diploma. Figure 4.9 shows learners' perceptions of
online assessment.
Font Size Instructions Language No Difficulties Other
Problems
0
10
20
30
40
Perc
en
t
Difficulties On Line Learning

59
Figure 4.9. Online assessment
When asked to indicate how online learning helped learners to understand the
usefulness of the Microsoft Office program, 57% indicated that their understanding of
Excel had improved, 45% for Internet, 39% for Access and 50% had found an
improvement in Word. Figure 4.10 shows the percentage of learners that found the
different Microsoft office programs useful.
50%
39%
45%
57%
0%
10%
20%
30%
40%
50%
60%
Wordprocessing Access Internet Excel
Figure 4.10 Usefulness of Microsoft Office programs
very easy easy difficult very difficult
Assessment
0
10
20
30
40
50
60
Per
cent
Online Assessment
60
Conclusion
Ninety-four percent of the respondents indicated that online learning assisted their
learning. Sixty percent of the respondents rated their expertise as good. Thirty-five
percent of the respondents had a problem with comprehending the instructions of the
software program. Sixty percent of the respondents found the online assessments to be
easy. Fifty-seven percent of the respondents indicated that their understanding of
Microsoft Excel had improved with the online learning.
4.5 HYPOTHESIS 1
The first hypothesis stated that the learner achievements of those learners who have
used a computer before attending campus would be much higher than those learners
who did not. In this hypothesis, the Test 1 File Management and Test 2 Theory within
the eight subgroups were examined.
4.5.1 Test 1 File management
Analysis of variance (ANOVA) was used on Test 1 Practical scale scores (File
Management). The measurement File Management implies the marks obtained in the
standardised test. The classifier or grouping variable was formed by means of the
combination of race, gender and the prior use of a computer. The aim of the analysis
was to investigate whether any two medians of the eight subgroups were statistically
different. The eight subgroups were divided as follows:
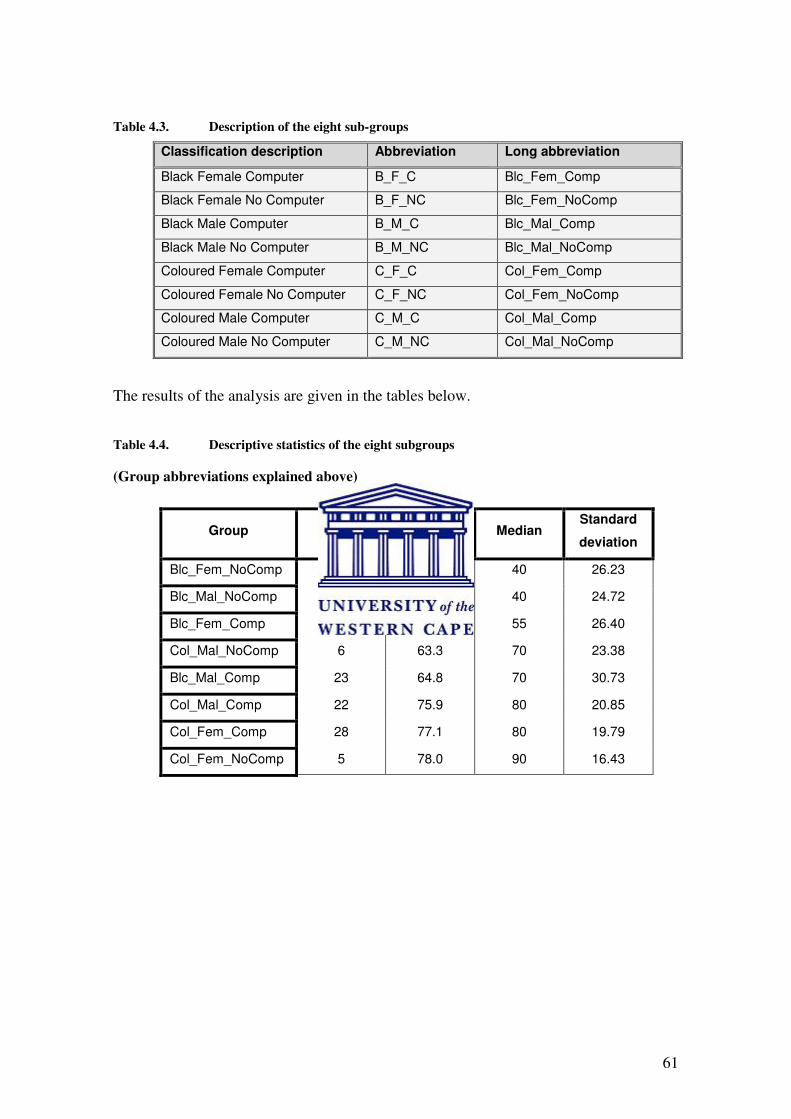
61
Table 4.3. Description of the eight sub-groups
Classification description Abbreviation Long abbreviation
Black Female Computer B_F_C Blc_Fem_Comp
Black Female No Computer B_F_NC Blc_Fem_NoComp
Black Male Computer B_M_C Blc_Mal_Comp
Black Male No Computer B_M_NC Blc_Mal_NoComp
Coloured Female Computer C_F_C Col_Fem_Comp
Coloured Female No Computer C_F_NC Col_Fem_NoComp
Coloured Male Computer C_M_C Col_Mal_Comp
Coloured Male No Computer C_M_NC Col_Mal_NoComp
The results of the analysis are given in the tables below.
Table 4.4. Descriptive statistics of the eight subgroups
(Group abbreviations explained above)
Group Count Mean Median Standard
deviation
Blc_Fem_NoComp 36 44.2 40 26.23
Blc_Mal_NoComp 14 44.3 40 24.72
Blc_Fem_Comp 50 52.6 55 26.40
Col_Mal_NoComp 6 63.3 70 23.38
Blc_Mal_Comp 23 64.8 70 30.73
Col_Mal_Comp 22 75.9 80 20.85
Col_Fem_Comp 28 77.1 80 19.79
Col_Fem_NoComp 5 78.0 90 16.43

62
Tests of assumptions
Test Prob. Decision
Assumption value level (0.05)
Skewness normality of residuals -1.5168 0.129320 Accept
Kurtosis normality of residuals -1.2018 0.229432 Accept
Omnibus normality of residuals 3.7450 0.153737 Accept
Modified-Levene equal-variance test 1.8595 0.078847 Accept
The box plot (Fig. 4.11) shows the range and the interquartile range of the means of the
eight subgroups.
Figure 4.11 Box Plot; File Management; Major classification
From Figure 4.11 above it was clear that there were differences between the medians of
the eight categories. Pairwise comparisons among the groups were conducted using the
Kruskal-Wallis test, the nonparametric version of the analysis of variance (ANOVA). It
was used to compare the means of the eight subgroups. The analysis is calculated from

63
the pairwise comparisons among the groups and the resulting significance is determined
by a comparison of ranked values with the expected values using a chi-square analysis.
Kruskal-Wallis One-Way ANOVA on ranks
Statistical hypotheses
Ho: All medians are equal.
Ha: At least two medians are different.
Test results
Chi-square Prob.
Method DF (H) level Decision(0.05)
Not corrected for ties 7 41.47807 0.000001 Reject Ho
Corrected for ties 7 42.01587 0.000001 Reject Ho
Results from the chi-square analysis rejected the null hypothesis (Ho), which indicates
that at least two medians were significantly different.
Mean vs Standard Deviation Plot
10.00
15.00
20.00
25.00
30.00
35.00
40.0 45.0 50.0 55.0 60.0 65.0 70.0 75.0 80.0
Mean Percentage
Sta
nd
ard
Devia
tio
n o
f G
rou
ps
Figure 4.12 Standard Deviation Plot; Mean percentage; File Management

64
The standard deviations (SD) form an approximate curvilinear (quadratic) relationship
with the mean percentages in that the SD reached a peak between 50 to 65 percent for
the File Management test. There was an expected downward trend of the SDs towards
the higher percentages, due to the censoring of the maximum percentage score (namely
100%) for coloured males with no computers.
The subpopulation sample sizes vary from five for the coloured female no computer
group to fifty for the black female computer group (See Table 4.4). Due to the extreme
sample size differences present in the subpopulations to be compared, it would be
difficult to apply ordinary multiple-comparison methods to rank the different
subpopulations.
For the eight distinct groups (subpopulations) it was possible to perform 28 pairwise
comparisons. The results of these 28 comparisons were summarised in the Kruskal-
Wallis multiple-comparisons. Ten of the 28 pairwise comparisons were significantly
different and supplied some indication of which groups differed with respect to their
medians (see Table 4.5).
Table 4.5. Kruskal-Wallis multiple-comparison Z-value File Management
Blc_Fem
_NoComp
Blc_Mal
_NoComp
Blc_Fem
_Comp
Col_Mal
_NoComp
Blc_Mal
_Comp
Col_Mal
_Comp
Col_Fem
_Comp
Col_Fem
_NoComp
Black
Female
No Computer
0 0.026 1.327 1.501 2.880 4.269 4.777 2.539
Black
Male
No Computer
0.026 0 0.986 1.373 2.291 3.403 3.702 2.341
Black
Female
Computer
1.327 0.986 0 0.861 1.900 3.382 3.871 1.965
Coloured 1.501 1.373 0.861 0 0.233 1.071 1.204 0.908

65
Male
No Computer
Black
Male
Computer
2.880 2.291 1.900 0.233 0 1.296 1.546 0.898
Coloured
Male
Computer
4.269 3.403 3.382 1.071 1.296 0 0.170 0.114
Coloured
Female
Computer
4.777 3.702 3.871 1.204 1.546 0.170 0 0.016
Coloured
Female
No Computer
2.539 2.341 1.965 0.908 0.898 0.114 0.016 0
Regular test: Medians significantly different if z-value > 1.9600
Bonferroni test: Medians significantly different if z-value > 3.1237
The Kruskal-Wallis test showed differences between the eight subgroups. The test
which was corrected for tied ranks, was significant with a chi square = 46.15 and p =
0.001. The most significant differences were found between the coloured female
learners with prior computer usage (Col_Fem _Comp) (M = 77.1, SD = 19.79) and the
black female learners who had no prior computer usage (Blc_Fem _NoComp) (M =
44.2, SD = 26.23) , coloured male learners with computer usage (Col_Mal _Comp) (M
= 75.9, SD = 20.85) and the black female learners who had no prior computer usage
(Blc_Fem _NoComp) (M = 44.2, SD = 26.23), and coloured female learners with prior
computer usage(Col_Fem _Comp) (M = 77.1, SD = 19.79) and black female learners
who had prior computer usage (Blc_Fem _Comp) (M = 52.6, SD = 26.40).
4.5.2 Test 2 Theory
Analysis of variance (ANOVA) was used on Test 2 Theory scale scores (Theory).
The measurement Theory implies the marks obtained in the standardised test. The

66
classifier or grouping variable was formed by means of the combination of race,
gender and the prior use of a computer. The aim of the analysis was to investigate
whether any two medians of the eight subgroups were statistically different. The
results of the analysis were given in the tables below.
Tests of assumptions
Test Prob. Decision
Assumption value level (0.05)
Skewness normality of residuals -0.5185 0.604100 Accept
Kurtosis normality of residuals -1.4048 0.160078 Accept
Omnibus normality of residuals 2.2423 0.325897 Accept
Modified-Levene equal-variance test 1.5095 0.166721 Accept
The box plot (Fig. 4.13) shows the range and the interquartile range of the means of the eight
subgroups.
Figure 4.13 Box Plot; Theory; Major classification

67
From Figure 4.13 above it was clear that there were differences between the medians of
the eight categories. Pairwise comparisons among the groups were conducted using the
Kruskal-Wallis test, the nonparametric version of the analysis of variance (ANOVA). It
was used to compare the means of the eight subgroups. The analysis is calculated from
the pairwise comparisons among the groups and the resulting significance is determined
by a comparison of ranked values with the expected values using a chi-square analysis.
Kruskal-Wallis One-Way ANOVA on ranks
Statistical hypotheses
Ho: All medians are equal.
Ha: At least two medians are different.
Test results
Chi-square Prob.
Method DF (H) level Decision(0.05)
Not corrected for ties 7 15.49889 0.030110 Reject Ho
Corrected for ties 7 15.51015 0.029989 Reject Ho
Results from the chi-square analysis rejected the null hypothesis (Ho), which indicates
that at least two medians are significantly different.
Table 4.6. Descriptive statistics of the eight subgroups
Group Count Means Median Standard
Deviation
Blc_Fem_Comp 50 39.06 40.5 14.21
Blc_Fem_NoComp 36 40.33 40.0 11.85
Blc_Mal_Comp 23 40.61 39.0 15.49
Blc_Mal_NoComp 14 42.64 41.0 8.71
Col_Fem_NoComp 5 43.80 43.0 17.37
Col_Mal_Comp 22 46.23 44.0 13.78
Col_Mal_NoComp 6 48.00 50.5 15.11
Col_Fem_Comp 28 52.93 59.5 16.80

68
Mean vs Standard Deviation Plot - Theory
10.00
11.00
12.00
13.00
14.00
15.00
16.00
17.00
18.00
19.00
20.00
40.00 42.00 44.00 46.00 48.00 50.00 52.00 54.00
Mean Percentage
Sta
nd
ard
De
via
tio
n o
f G
rou
ps
Figure 4.14 Standard Deviation Plot; Mean percentage
The most important deduction that could be made from Figure 4.14 was that the
mean percentages obtained within the eight subgroups had a narrow range with a
minimum of 40% and a maximum of 54%, approximately. With such a narrow
range one does not expect many significant differences between the means or
medians of the eight distinct subgroups.
For the eight distinct groups (subpopulations) it was possible to perform 28
pairwise comparisons. The results of these 28 comparisons were summarised in
the Kruskal-Wallis multiple-comparisons. Three of the 28 pairwise comparisons
were significantly different and supplied some indication of which groups differed
with respect to their medians. The number of differences was much less than for
the File Management scores due to the narrow range of the group medians.

69
Table 4.7. Kruskal-Wallis multiple-comparison Z-value Theory
Blc_Fem
_Comp
Blc_Fem
_NoComp
Blc_Mal
_Comp
Blc_Mal
_NoComp
Col_Fem
_NoComp
Col_Mal
_Comp
Col_Mal
_NoComp
Col_Fem
_Comp
Black
Female
Computer
0 0.305 0.239 0.832 0.588 1.743 1.444 3.416
Black
Female
No Computer
0.305 0 0.024 0.587 0.438 1.401 1.264 2.936
Black
Male
Computer
0.239 0.024 0 0.565 0.436 1.293 1.230 2.651
Black
Male
No Computer
0.832 0.587 0.565 0 0.046 0.568 0.763 1.695
Coloured
Female
No Computer
0.588 0.438 0.436 0.046 0 0.344 0.575 1.093
Coloured
Male
Computer
1.743 1.401 1.293 0.568 0.344 0 0.387 1.265
Coloured
Male
No Computer
1.444 1.264 1.230 0.763 0.575 0.387 0 0.406
Coloured
Female
Computer
3.416 2.936 2.651 1.695 1.093 1.265 0.406 0
Regular test: Medians significantly different if z-value > 1.9600
Bonferroni test: Medians significantly different if z-value > 3.1237
A Kruskal-Wallis test showed some differences between the 8 subgroups. The test,
which was corrected for tied ranks, was significant, with the chi square = 15.51 and p =
0.029. The most significant differences were found between the coloured female
learners with prior computer usage (Col_Fem _Comp) (M = 52.93, SD = 16.80) and the

70
black female learners with prior computer usage (Blc_Fem _Comp) (M = 39.06, SD =
14.21); the coloured female learners with prior computer usage(Col_Fem _Comp) (M =
52.93, SD = 16.80) and black female learners with no prior computer usage (Blc_Fem
_NoComp) (M = 40.33, SD = 11.85).
4.6 HYPOTHESIS 2
The second hypothesis stated that the learner achievements of those learners who
received treatment in the experimental group would be much higher than the control
group who did not receive treatment. In this hypothesis the Test 1 File Management and
Test 2 Theory within the four subgroups were examined.
4.6.1 Test 1 File Management
Analysis of variance (ANOVA) was used on Test 1 Practical scale scores (File
Management) with regard to the control and the experimental groups. The measurement
File Management implies the marks obtained in the standardised test. The classifier or
grouping variable was formed by means of the combination of control, experimental
groups and the usage of a computer. The aim of the analysis was to investigate whether
any two medians of the four subgroups were statistically different. The four subgroups
were divided as follows:
Table 4.8. Classification description on prior use of computer
Classification Description Abbreviation
Experimental group with prior computer usage C_Comp
Experimental group with no prior computer usage C_NoComp
Control group with prior computer usage P_Comp
Control group with no prior computer usage P_NoComp
The results of the analysis are given in the tables below.
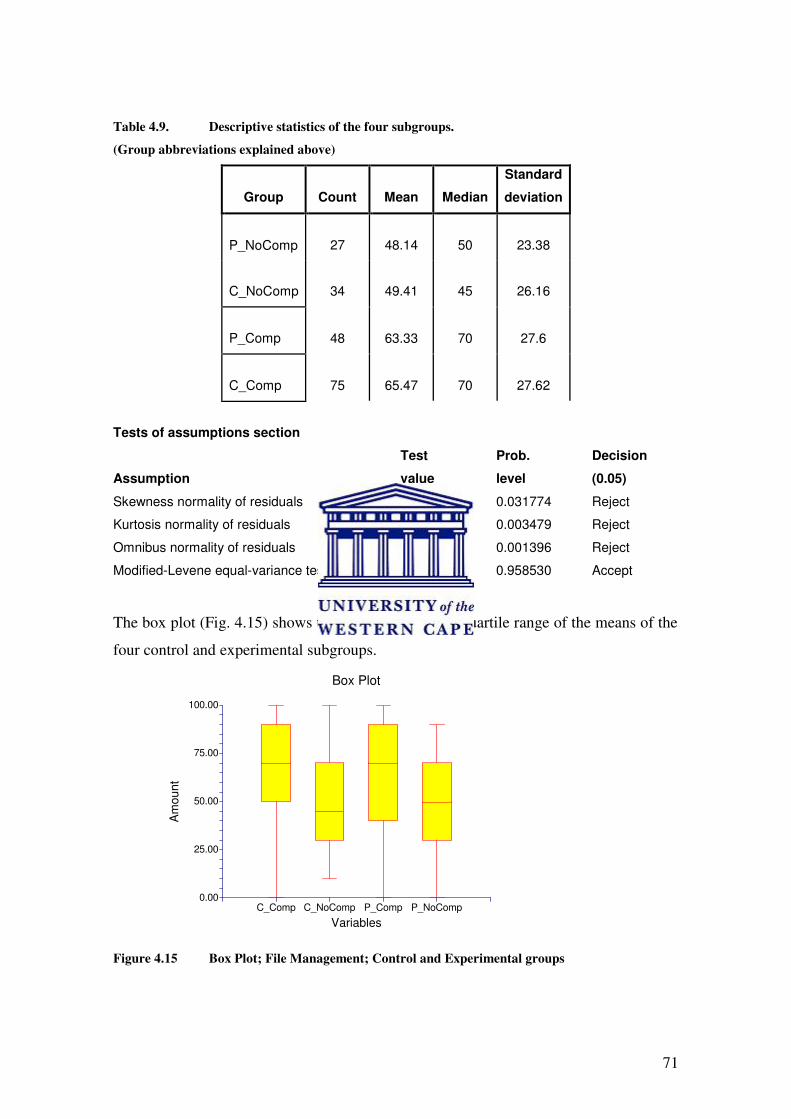
71
Table 4.9. Descriptive statistics of the four subgroups.
(Group abbreviations explained above)
Group Count Mean Median
Standard
deviation
P_NoComp 27 48.14 50 23.38
C_NoComp 34 49.41 45 26.16
P_Comp 48 63.33 70 27.6
C_Comp 75 65.47 70 27.62
Tests of assumptions section
Test Prob. Decision
Assumption value level (0.05)
Skewness normality of residuals -2.1472 0.031774 Reject
Kurtosis normality of residuals -2.9219 0.003479 Reject
Omnibus normality of residuals 13.1480 0.001396 Reject
Modified-Levene equal-variance test 0.1024 0.958530 Accept
The box plot (Fig. 4.15) shows the range and the interquartile range of the means of the
four control and experimental subgroups.
0.00
25.00
50.00
75.00
100.00
C_Comp C_NoComp P_Comp P_NoComp
Box Plot
Variables
Am
ou
nt
Figure 4.15 Box Plot; File Management; Control and Experimental groups

72
From Figure 4.15 above it was clear that there were differences between the medians of
the four categories. Pairwise comparisons among the groups were conducted using the
Kruskal-Wallis test, the nonparametric version of the analysis of variance (ANOVA). It
was used to compare the means of the four subgroups. The analysis is calculated from
the pairwise comparisons among the groups and the resulting significance is determined
by a comparison of ranked values with the expected values using a chi-square analysis.
Kruskal-Wallis One-Way ANOVA on ranks
Statistical hypotheses
Ho: All medians are equal.
Ha: At least two medians are different.

73
Test results
Chi-square Prob.
Method DF (H) level
Decision(0.05)
Not corrected for ties 3 13.77037 0.003235 Reject Ho
Corrected for ties 3 13.94891 0.002976 Reject Ho
Results from the chi-square analysis rejected the null hypothesis (Ho), which indicates
that at least two medians are significantly different (P<0.05).
Figure 4.16 below depicts the way the means vary between the control and
experimental subgroups.
45.00
51.25
57.50
63.75
70.00
C_Comp C_NoComp P_Comp P_NoComp
Means of File_Manage_TEST_1_PRACTICAL
Easy_Classi
File
_M
anage_T
ES
T_1_P
RA
CT
ICA
L
Figure 4.16 Means Plot; File Management; Control and Experimental group
The most important deduction that could be made from Figure 4.16 was that the mean
percentages obtained within the four subgroups had a narrow range with a minimum of
48% and a maximum of 65%, approximately. With such a narrow range one does not
expect many significant differences between the means or medians of the four distinct
subgroups.

74
For the four distinct groups (subpopulations) it was possible to perform six pairwise
comparisons. The results of these six comparisons were summarised in the Kruskal-
Wallis multiple-comparisons. However, four of the six pairwise comparisons were
different and supplied some indication of which groups differed with respect to their
medians.
Table 4.10 Kruskal-Wallis multiple-comparison Z-value control groups
C_Comp
C_NoComp
P_Comp
P_NoComp
C_Comp
0 2.9153 0.4827 2.8046
C_NoComp
2.9153 0 2.2909 0.1037
P_Comp
0.4827 2.2909 0 2.2457
P_NoComp
2.8046 0.1037 2.2457 0
Regular test: Medians significantly different if z-value > 1.9600
Bonferroni test: Medians significantly different if z-value > 2.6383
The Kruskal-Wallis test showed differences between the four subgroups. The test which
was corrected for tied ranks, was significant, with a chi square (N=184) = 13.9489 and p
= 0.002976. However, the most significant difference was found within the
experimental group, between those who had prior computer usage, (C_Comp) (M =
49.41, SD = 26.16) and those who had not, (C_NoComp) (M = 65.47, SD = 27.62).
There was no significant difference between the control and experimental groups.

75
4.6.2 Test 2 Theory
Analysis of variance (ANOVA) was used on Test 2 Theory scale scores (Theory) with
regard to the control and the experimental group. The measurement “Theory” implies
the marks obtained in the standardised test. The classifier or grouping variable was
formed by means of the combination of control, experimental groups and the usage of a
computer. The aim of the analysis was to investigate whether any two medians of the
four subgroups were statistically different. The four subgroups were divided as for the
File Management test. The results of the analysis are given in the table below:
Table 4.11 Descriptive statistics of the four subgroups
Group Count Mean Median
Standard
deviation
C_NoComp 34 36.5 38 26.16
C_Comp 75 39.84 38 27.62
P_NoComp 27 48.70 47 23.38
P_Comp 48 49.95 51 27.6
Tests of assumptions
Test Prob. Decision
Assumption value level (0.05)
Skewness normality of residuals 0.8668 0.386072 Accept
Kurtosis normality of residuals 0.8788 0.379498 Accept
Omnibus normality of residuals 1.5236 0.466824 Accept
Modified-Levene equal-variance test 2.6456 0.050597 Accept
The box plot (Fig. 4.17) shows the range and the interquartile range of the means of the
eight subgroups.

76
0.00
25.00
50.00
75.00
100.00
C_Comp C_NoComp P_Comp P_NoComp
Box Plot
Variables
Am
ou
nt
Figure 4.17 Box Plot; Theory; Control and Experimental Groups
From Figure 4.17 above it was clear that there were differences between the medians of
the four categories. Pairwise comparisons among the groups were conducted using the
Kruskal-Wallis test, the nonparametric version of the analysis of variance (ANOVA). It
was used to compare the means of the four subgroups. The analysis is calculated from
the pairwise comparisons among the groups and the resulting significance is determined
by a comparison of ranked values with the expected values using a chi-square analysis.
Kruskal-Wallis One-Way ANOVA on ranks
Statistical hypotheses
Ho: All medians are equal.
Ha: At least two medians are different.
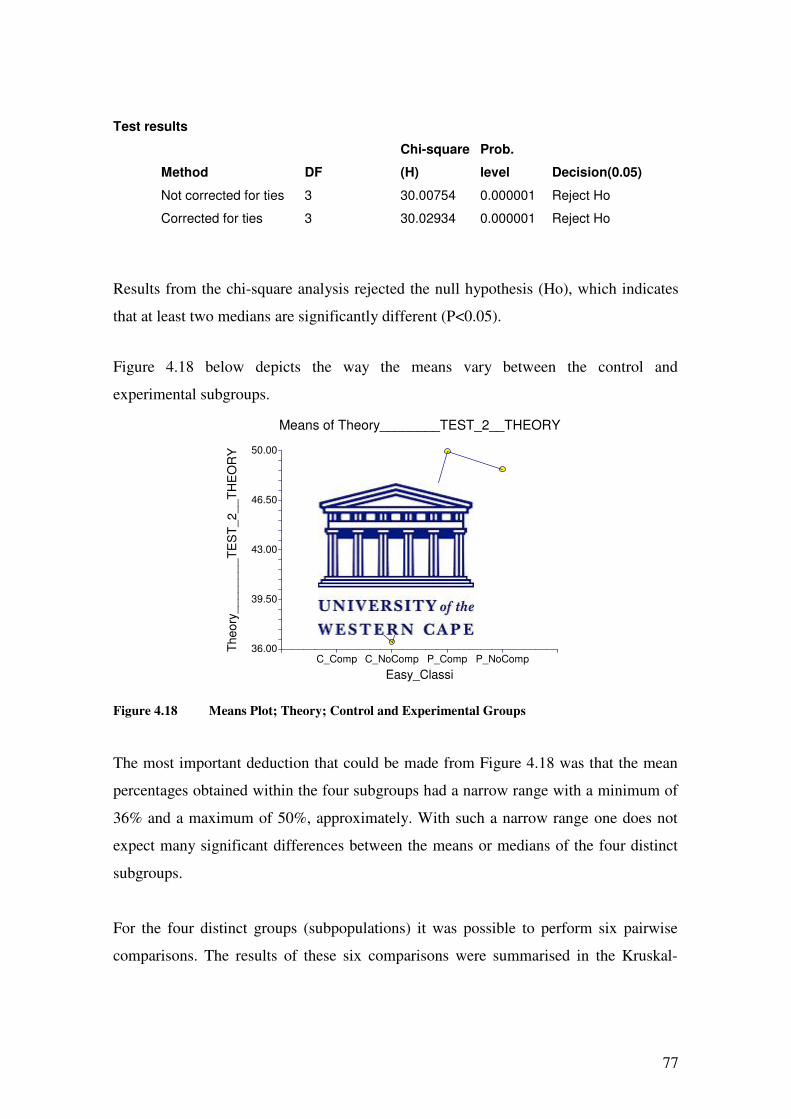
77
Test results
Chi-square Prob.
Method DF (H) level Decision(0.05)
Not corrected for ties 3 30.00754 0.000001 Reject Ho
Corrected for ties 3 30.02934 0.000001 Reject Ho
Results from the chi-square analysis rejected the null hypothesis (Ho), which indicates
that at least two medians are significantly different (P<0.05).
Figure 4.18 below depicts the way the means vary between the control and
experimental subgroups.
36.00
39.50
43.00
46.50
50.00
C_Comp C_NoComp P_Comp P_NoComp
Means of Theory________TEST_2__THEORY
Easy_Classi
Theory
________T
ES
T_2__T
HE
OR
Y
Figure 4.18 Means Plot; Theory; Control and Experimental Groups
The most important deduction that could be made from Figure 4.18 was that the mean
percentages obtained within the four subgroups had a narrow range with a minimum of
36% and a maximum of 50%, approximately. With such a narrow range one does not
expect many significant differences between the means or medians of the four distinct
subgroups.
For the four distinct groups (subpopulations) it was possible to perform six pairwise
comparisons. The results of these six comparisons were summarised in the Kruskal-

78
Wallis multiple-comparisons. However, four of the six pairwise comparisons were
significantly different and supplied some indication of which groups differed with
respect to their medians.
Table 4.12 Kruskal-Wallis multiple-comparison Z-value test
C_Comp
C_NoComp
P_Comp
P_NoComp
C_Comp
0 1.0704 4.0283 3.2255
C_NoComp
1.0704 0 4.3091 3.6669
P_Comp
4.0283 4.3091 0 0.0859
P_NoComp
3.2255 3.6669 0.0859 0
Regular test: Medians significantly different if z-value > 1.9600
Bonferroni test: Medians significantly different if z-value > 2.6383
The Kruskal-Wallis test showed significant differences between the four subgroups.
The test which was corrected for tied ranks, was significant with the chi square (N=184)
= 30.02 and p = 0.000001. However, the most significant difference was found between
the experimental group and the control group, (P_Comp) (M=49.95, SD = 27.6) and the
(C_NoComp) (M=36.5, SD = 26.16). The control group achieved higher means than the
experimental group, which was the opposite for the File Management test. The
significant differences were: control group, (P_Comp) (M=49.95, SD = 27.61) and the
experimental group, (C_Comp) (M = 39.84, SD = 27.62), (P_NoComp) (M=48.70, SD
= 23.38) in the control group and (C_NoComp) (M=36.5, SD = 26.16) in the
experimental group.
79
4.7 CONCLUSION
The first section of this chapter presented data from the questionnaires. The findings
revealed the demographic data, technological background and online learning
experiences of the respondents.
The second section of this chapter presented quantitative findings on the effects of the
independent variables race, gender, and treatment on the dependent variables (Test 1
File Management and Test 2 Theory). ANOVA revealed statistically significant
differences between control and experimental group on the Test 2 Theory assessment.
ANOVA revealed no statistically significant differences in Test 1 File Management.

80
CHAPTER 5
DISCUSSION AND CONCLUSION
5.1 INTRODUCTION
The term gap is often used to describe a number of different but related meanings,
including disparity, difference, divergence, variance, mismatch or inequality. According
to Figure 1.1 (Theoretical Framework), the gap refers to the difference between the
desired and the actual output at HDIs.
The prevailing problem in HDIs is that gaps are emerging with the throughput rate,
graduate output and enrolments. According to a National Plan for Higher Education
(DOE 1996b)for higher education, enrolment at these institutions will rise within 15
years from 15% to 20% of school leavers (DOE 2004b). The gaps need to be addressed;
the government is concerned about South Africa lagging behind other countries in
science and technology. International comparisons have been a driving force behind
both national and provincial initiatives to raise academic standards and improve student
achievement.
The Department of Education identifies the problems experienced by higher education
institutions:
… numbers of disadvantaged students in the higher education system increased over this period
at a higher rate than that of students from advantaged backgrounds. The provision of the
academic staff needed to teach these students grew at less than one third of the rate of increase in
student enrolments (DOE 2004b).
The use of educational technology could help the higher education institutions to meet
the increasing demands of large enrolments of students and high learning volumes. The
response to this crisis is to analyse the results from the previous chapter to ascertain
whether the utilisation of electronic formative assessment in the large, 24/7, high-

81
maintenance and complex IT environments created by the higher education institutions
can be used to improve assessment and learning.
This study tested the following hypotheses:
Hypothesis 1: The learner achievements of those learners who have used a computer
before attending campus are much higher than those learners who have not.
Hypothesis 2: The learner achievements of those learners who received treatment in the
experimental group are much higher than the control group who did not receive
treatment.
5.2 SUMMARY OF RESEARCH FINDINGS
Hypothesis One: The first hypothesis cannot be rejected. Anova of the test scores
further revealed that learners who had access to a computer prior to attending the
technikon had higher results than those who had no prior usage. The only exception
were the coloured female learners who had no prior computer usage, and who showed
equal or better results than learners who have had prior computer usage for the practical
Test 1 File Management. This suggests the existence of a digital divide.
Hypothesis Two: The second hypothesis in this study can be rejected. Anova has
revealed no significant differences between the experimental and control groups in Test
1 File Management. This suggests that the electronic formative assessment used on the
experimental group was not very effective in improving learning achievement. In Test 2
Theory, there was a significant difference between the control and experimental groups.
The control group performed better than the experimental group. The control group had
instructional-based formative assessment, whereas the experimental group had
electronic formative assessment. This could be attributed to 78 % of the learners had
English as a second language (ESL). The experimental group had to read and
comprehend from the computer screen. Figure 1 (Annexure VII) on the means of the
major languages, shows that the results for the theory test for ESL learners were poor.
82
Evidence from the literature has also shown that the predominance of English in online
content may limit widespread interest in and use of the Internet among non-English
speaking populations and the high levels of illiteracy amongst the disadvantaged
communities are probably a greater hindrance (Bridges.org 2003).
Gender
A Kruskal-Wallis test was conducted to evaluate differences between genders in the file
management and theory test. The tests showed that there were no significant differences
between genders. This is in accordance with the evidence from the literature, which
showed that no differences were evident between female and male learners that had
been using a computer as a tool and for communication at higher education institutions
(Stephens 2001; McCoy & Heafner 2004).
Race
A Kruskal-Wallis test was conducted to evaluate differences between races in the file
management and theory test. The test showed that there were significant differences
between black female learners and coloured female learners. The coloured female
learners’ achievements were much higher than those of the black female learners.
Literature has revealed that on the one hand, that coloureds had 34 % access to
computers, and 39% can use computers, and, on the other hand, that blacks had 19%
access to computers and 16% can use computers (Saner 2003).
5.3 RESEARCH OBJECTIVES
The first research objective was to provide insight into the technological and language
background of first-year learners and the digital divide.
Learners’ previous experience and prior learning (or lack of it) all impact directly on
their learning (Czerniewicz 2004). This was clearly evident in the findings when
comparing learners’ use of technology and the scores from the File Management test.
83
The results of the analysis of the connection between the technological background and
scores of Test 1 File Management, revealed that black learners who had used a
photocopier, ATM, fax machine and printer showed higher scores. Results also revealed
that female learners, who had used this technology, showed higher scores in the test.
Coloured male learners showed no difference in their test scores whether they had made
use of technology or not.
Seventy-eight percent of the respondents had English as a second language and this was
clearly revealed in the results of the theory tests in all statistical analyses. The results of
the theory tests, which required reading and comprehension, seemed to be a problem for
ESL learners. In the theory test, the learners whose home languages were Afrikaans and
IsiXhosa, performed poorly. However, in the practical test learners who had Afrikaans
as a home language, were identical to learners whose home language was English.
Initiatives are starting to emerge in South Africa that will foster the development of
local language content in electronic formats, especially in the educational technology
area (Bridges.org 2003).
Thirty-two percent of the respondents in the Western Cape reporting about Internet
usage are between the ages of 18-24, 76% speak English, 58% are male, 61% are white
and 33% are coloured, 23% have a monthly household income of over R30 000 and
59% have a university or tertiary qualification (Bridges.org 2003). Sixty-nine percent of
the respondents reported access to a computer for personal or school use prior to
attending the technikon, 20% owned a computer, 3.8% had access to the Internet and
60% owned a cell phone. Comparison of the statistics for the Western Cape and the
respondents reveals there is a discrepancy in the access and usage of the computer. A
higher percentage of learners have access to a computer in comparison to the percentage
of Western Cape respondents access to a computer. The research objectives of the
study will be discussed below:

84
1. Examine the efficacy of online learning
Online learning gets very positive feedback from the learners. The results of the
questionnaire clearly revealed that online learning had significantly improved their
learning. The online learning issues for concern were technical support, language
difficulty and the comprehension of instructions. Learners found the assessment
relatively easy, and two thirds preferred doing other subjects online.
2. Empirically determine the effect of a constructivist, technology-rich
learning environment, specifically the use of electronic formative assessments,
on learner achievement
It was hypothesised that the learner achievements of those learners who received
treatment in the experimental group would be much higher than the control group who
did not receive treatment. The File Management test results of the Kruskal-Wallis test
did not find a significant difference between the experimental and control groups. The
theory test results of the Kruskal-Wallis test nullified the hypothesis, as the control
group achieved higher achievement than the experimental group.
These findings were in direct contradiction to studies that have found that electronic
formative assessment has improved summative scores (Stephens et al. 1998; Bull &
Stephens 1999; O’Reilly & Patterson 1999; Buchanan 2000; McKenna & Hesketh
2000; Khan 2001; Ricketts & Wilks 2002; Aster 2003; McCabe & Skinner 2003; Roodt
& Conradie 2003).
5.4 RECOMMENDATIONS FOR FURTHER RESEARCH
Given the significant findings concerning achievement gains made by coloured female
learners who had no prior knowledge of computer usage, a detailed study including
qualitative research could be recommended to validate the reported findings further.

85
5.5 CONCLUSION
Higher education exists in a dynamic environment where change is normative. When
considering the higher education environment, we have to consider this from two
angles. The first is the strategy to develop learners who are academically, socially and
technologically competent. Secondly, standards in accordance to the National
Qualifications framework have to be maintained. Institutions need to reassess their
strategy and constantly align and re-align their learning programmes to that strategy.

86
BIBLIOGRAPHY
ASTER. 2003. How can automated assessment be used effectively in small-group teaching? [Online] Available: http://ctiwebct.york.ac.uk/aster/askaster/display-question.asp [2004, October 19] BABBIE, E. & MOUTON, J. 2001.The practice of social research. New York: Oxford University Press. BEFFA-NEGRINI, P., COHEN, N.L. & MILLER, B. 2002. Strategies to motivate students in online learning environments. Journal of Nutrition Education & Behavior. Nov/Dec 2002, 34(6) BELL, J. 1987. Doing your research project: A guide for first-time researchers in education and social science. Milton Keynes, Philadelphia: Open University Press.
BIGGS, J.1998. Assessment and classroom learning: A role for summative assessment? Assessment in Education: Principles, Policy & Practice. Mar 98, 5(1)103-111. BLACK, P. & WILLIAM, D. 1998a. Assessment and classroom learning. Assessment in
Education: Principles, Policy & Practice; Mar 98, 5(1)7-75.
BLACK, P. & WILLIAM, D. 1998b. Inside the black box: Raising standards through classroom assessment. [Online]. Available: http://www.pdkintl.org/kappan/kbla9810.html [2004, August 27] 09:24
BLACK, P. WILLIAM, D. 1996. Meanings and consequences: A basis for distinguishing formative and summative functions of assessment? British Educational Research Journal, 22(5):537. BONK, C.J. 2002. Current myths and future trends in online teaching and learning. [Online] Available: http://www.ascusc.org/jcmc/vol8/issue1/kimandbonk.html [2004, July 30] BONK, C.J., KIM, K.J. 2002. Cross-cultural comparisons of online collaboration. Journal
Higher Education: Conversation Cyberspace Web Commerce. October 2002, 8(1). [Online] Available: http://www.ascusc.org/jcmc/vol8/issue1/kimandbonk.html BONK, C.J., OLSON, T.M., WISHER, R.A. & ORVIS, K.L. 2002. Learning from focus groups: An examination of blended learning. Journal of Distance Education, 17(3)97-118. BOUD, D. 2000. Sustainable assessment: Rethinking assessment for the learning society. Studies in Continuing Education, 22(2)151-167.
BRIDGES.ORG. 2002. Taking stock and looking ahead: Digital divide assessment of the
City of Cape Town, 2002. Bridges.org. Cape Town. [Online] Available:
http://www.bridges.org . [2005, October 10].
BRIDGES.ORG.2001. Spanning the digital divide: Understanding and tackling the issues [Online] Available: http://www.bridges.org [2005, September 12].
BRIDGES.ORG.2003. Cape Town. [Online] Available http://www.bridges.org\capetown\cpt_digital_divide_report_9_june_2003. [2005, October 10]

87
BUCHANAN, T. (2000). The efficacy of a World-Wide Web-mediated formative assessment. Journal of Computer-assisted Learning. 16:193-200. BULL, J. & STEPHENS, D. 1999. The use of Question Mark Software for formative and summative assessment in two universities. Innovations in Education & Training
International. 36(2):128-137.
BURNS, R. 2000. Introduction to research. 4th edn. London: Sage Publications.
BUSINESS DAY. 2003. Tertiary level teachers not up to scratch. Business Day, 9 October. [Online] Available: http://www.bdfm.co.za/cgi-bin/pp-print.[2004, August 19]pl CALLAGHAN, R. & SMIT, K. (1999). Teaching computer literacy in South Africa. Juta.
CHISENGA, A.2001. Facing the digital divide: Ensuring access to digital information in Sub-Saharan Africa. University of Natal.
CLOETE, N. 2001. Is the National Plan for Higher Education for or against globalisation? 27 May 2001. CHET.
COGBURN, D. 2000. Final project: Globalization and the information society. 17 April 2000. [Online] Available: http://www.si.umich.edu/Classes/607/final_papers/gs_3_final_paper.htm [2004, Aug 30]. COUNCIL ON HIGER EDUCATION (CHE). 2000. Towards a new higher education landscape: Meeting the equity, quality and social development imperatives of South Africa in the 21st century. Pretoria: Department of Education. [Online] Available: http://education.pwv.gov.za
COUNCIL ON HIGER EDUCATION (CHE). 2003. The transformation of higher education in South Africa: How much have we achieved? Perceptions of policy developments 1997-2003 and outlook for the next five years. Research report prepared for
the council on higher education 5th CHE Consultative Conference, 12 November 2003. CRONIN, B. 2002. The digital divide. The Dean’s List. Library Journal, 15 February 2002.
CZERNIEWICZ, L. 2004. Cape of Storms or Cape of Good Hope? Educational technology in a changing environment. British Educational Communications and
Technology Agency..
DE KOCK, G.V. & DE KOCK, M.M. 1994. Using Mathematics CAL in a bridging program for tertiary students from disadvantaged communities. Jan 1994. [Online] Available: http://www.upe.ac.za/compsc/math/dekock.html
DEPARTMENT OF EDUCATION (DOE). 1995. White Paper on Education and Training. Pretoria: Department of Education.
DEPARTMENT OF EDUCATION (DOE). 1996a. Green Paper on Transformation. Pretoria: Department of Education.
DEPARTMENT OF EDUCATION (DOE). 1996b. National Commission on Higher Education, an overview of a new policy framework for higher education transformation. Pretoria: Department of Education.

88
DEPARTMENT OF EDUCATION (DOE). 1997. Education White Paper 3: A programme for the transformation of higher education. Pretoria: Department of Education.
DEPARTMENT OF EDUCATION (DOE). 2001. White Paper on Science and Technology. Pretoria: Department of Education.
DEPARTMENT OF EDUCATION (DOE). 2002. Policy. Revised national curriculum statement Grades R-9. (Schools) overview. Pretoria: Department of Education
DEPARTMENT OF EDUCATION (DOE). 2003. White Paper on e-Education: Transforming Learning and Teaching through ICT. Pretoria: Department of Education.
DEPARTMENT OF EDUCATION (DOE). 2004a. Student enrolment planning in public higher education. Pretoria: Department of Education.
DEPARTMENT OF EDUCATION (DOE). 2004b. South African Higher Education 10 years. November 2004.
DMITRY, P. & ABRAMOVA, I. 2003. Africa and ICT: A chance for breakthrough? Information Communication & Society. Mar. 2003, 6(1):42-56.
GORARD, S. 2001. Quantitative methods in educational research. The role of numbers made easy. London and New York: Continuum.
GREER, L. 2001. Does changing the method of assessment of a module improve the performance of a student? Assessment & evaluation in higher education. 26(2):129-137
GURURAJAN, R. (2001). End-user computing: Learning style differences as a predictor of training outcomes. Teaching and Learning Forum 2001. HARLEN, WYNNE, JAMES, MARY. 1997. Assessment and learning: Differences and relationships between formative and summative assessment. Assessment in Education:
Principles, Policy & Practice. Nov 97, 4(3):59-71.
HAYWARD, L. & HEDGE, N.2005. Travelling towards change in assessment: Policy, practice and research in education. Assessment in Education. March 2005, 12(1):55-75.
HERSELMAN, M. & BRITTON K.G. 2002. Analysing the role of ICT in bridging the digital divide amongst learners. South African Journal of Education, 22(4):270-274.
HEYDENRYCH, J.F., HIGGS P. & VAN NIEKERK L.J.2003. Implementing the online learning community in Africa: A Unisa case study. African and Asian Studies, 2(4).
HUGO, J. 2001. South Africa’s first HCI Conference: A rainbow of opportunity. [Online] Available: http://www.chi-sa.org.za/articles/chisareport.htm [2003, July 24] KESTNER, N., HALL, R. & LIMBACK, P. 1999. If you build it, will they come? Campus-Wide Information Systems. 16(5):175-178.
KHAN, K. 2001. Formative self-assessment using multiple true-false questions on the internet: feedback according to confidence about correct knowledge. Mar 2001, Medical
Teacher, 23( 2):158-164. KNIGHT, T. Peter. 2002. Summative assessment in higher education: Practices in disarray. The Open University, UK. Studies in Higher Education,. 27(3):275.
89
LELLIOTT, A. & PENDLEBURY, S. & ENSLIN, P. 2000. Promises of access and inclusion: Online education in Africa. Journal of Philosophy of Education, 34(1):41- 42.
LIM, C.P. 2001. A holistic approach towards the use of an integrated online delivery and management system. Journal of Educational Media, 26(1):19-33.
LIN, R.L. & GRONLUND, N.E.2000. Measurement and assessment in teaching. 8th edn. New Jersey: Prentice Hall. MADZUNYA, N. 2005. Here they are! iWeek ITWeb. Issue 26. 27 October 2005. [Online] Available: www.iweek.co.za MANGENA, M. 2001. Science, Engineering, Technology and our school environment: How can we take it to our schools particularly in rural schools? Paper delivered by the
Deputy Minister of Education, at the Northern Province Council of Churches School
Support Programme Seminar, Pietersburg, 9 August 2001.
MAREE, J.G. & FRASER, W.J.2004. Outcomes-based assessment. Sandown: Heinemann Publishers. McCABE, M., SKINNER, R.A. 2003. Analyzing the tech effect. Researchers examine whether technology has an impact on student achievement. Education Week. Washington.
8 May 2003, 22(35):50. McCOY, L. & HEAFNER, T. 2004. Effect of gender on computer use and attitudes of college seniors. Journal of Women & Minorities in Science & Engineering, 10(1):55-66
McKENNA, C. & HESKETH, I. 2000. Implementing computer-assisted assessment – the legal research skills project. Educational Developments Magazine, April 2000.
MCLEAN, T.J. 2001. Keynote address: Technological demands on women in higher education: Bridging the digital divide. Conference on the technological demands on women in higher education: Bridging the
digital divide, Cape Town, February 2001 MILLER, J. 1999. Entering the information age: Setting priorities in South Africa. Invited
Address: Second International Al Shaam Conference on Information Technology, 26-29 April 1999, Damascus, Syria. MISTHRY, N. & MKHIZE, P. & HARYPURSAT, R. 2001. The role of information technology and its impact on tertiary education. University of Durban Westville.
MYERS, M.D. 1997. Qualitative research in information systems. MISQ Discovery. June 1997. [Online] Available: http://www.qual.auckland.ac.nz/
NEUMAN, W.L. 2000. Social research methods: Qualitative and quantitative approaches. 4th edn. USA: Pearson Education Company. NEWFIELD, D., ANDREW, D., STEIN, P. & MAUNGEDZO, R.2003. ‘No number can describe how good it was’: assessment issues in the multimodal classroom. Assessment in
Education. March 2003, 10(1). O’ REILLY, M. & PATTERSON, K. 1999. Assessing learners through the WWW, Teaching and Learning Unit, Southern Cross University, Australia. [Online] Available: http://www7.scu.edu.au/programme/posters/1908/com1908.htm [2003, August 29].

90
PARKER, K.N. 2003. The quality dilemma in online education. Athabasca University.[Online] Available: http://cde.athabasca.cau.ca/online_bodc/par/tpol_chp16
PEAT, M. & FRANKLIN, S.2002. Supporting student learning: the use of computer-based formative assessment modules. British Journal of Educational Technology, 33(5):515-523. POWERS, D.E., 0' NEILL, K. 1993. Inexperienced and anxious computer users: Coping with a computer-administered test of academic skills. Educational Assessment, 1(2):53-73. PRINSLOO, J & JANKS, H. 2002. Critical literacy in South Africa: Possibilities and constraints in 2002. Nov2002, English Teaching: Practice and Critique, 1(1).
RADCLIFFE, D.F. 2002. Technological and pedagogical convergence between work-based and campus-based learning educational technology & society, 5(2):2002
RICKETTS, C. & WILKS, S.J. 2002. Improving student performance through computer-based assessment: insights from recent research. Assessment & Evaluation in Higher
Education, 27(5):475-479.
ROGERS, L. 2002. Designing instruction for technology-enhanced learning. Idea Group Publishing. Philadelphia.
ROODT, J. & CONRADIE, P. 2003. Creating a learning culture in rural schools via educational satellite TV broadcasts. Presented at the Globalisation, Regionalisation and
the Information Society – A European and South(ern) African Encounter. 9-10 October 2003, Bruges, Belgium. ROSSOUW, H. 2001. South Africa spends $163 million a year on students who drop out. Chronicle of Higher Education. [Online] Available: http://chronicle.com/daily/2001/05/2001051708n.htm
RUCKER, J. & SCHOENROCK, R.J. 2000. Assessment in Business Education. National Business Education Association. Reston.
SANER, R. 2003. The effect of the Internet on South African youth in the next 5 years: 2003-2008. .[Online] Available : http://www.sonlifeafrica.com/article06.htm. [2004, June 20] SCASE, M.O. & SCOTT, B. 2001. Embedding resource-based learning materials in psychology teaching. Information Services & Use, 21(2):43-52.
SELWYN, N. (1997). Assessing students’ ability to use computers: Theoretical considerations for practical research. British Education Research Journal, Feb 97, 23(1).
SIEBORGER, R. 1998. Transforming assessment. A guide for South African teachers. Cape Town: Juta. SILBER, K. 1999. The use of virtual learning environments to support two psychology
modules. Department of Psychology, University of Staffordshire. [Online]. Available: http://ctipsy.york.ac.uklaster/resources/case-studies/reports.htm [2003, August 27].
SINGH, A.M. 2002. Bridging the digital divide. The role of universities in getting South
Africa closer to the global information society. University of Durban Westville.
SLATE, J., MANUEL, M. & BRINSON, K. 2002. The “digital divide”: Hispanic college students’ views of educational uses of the Internet. Assessment & Evaluation in Higher
Education. Jan 2002, 27(1):75-94.

91
SMITH, G.J. 1995. Research guidelines for planning and documentation. Halfway House: Southern Book Publishers.
SMITH, J.E. 2001. The effect of the Carnegie Algebra Tutor on student achievement and attitude in introductory high school algebra. Unpublished PhD in Educational Leadership and Policy Studies. Virginia Polytechnic Institute and State University.
SOLMS, B.V. 2005. Basie von Solms: Winner ICT Leadership Award. iWeek iTWeb. Issue 26, 27 October 2005. [Online] Available: http://www.iweek.co.za STATSA. 2001. Statistics South Africa: Census 2001: Key results. October 2001. [Online] Available: http://www.statsa.co.za
STEPHENS, D. 2001. Use of computer-assisted assessment: Benefits to students and staff. Education for information, 19(1):265-275.
STEPHENS, D., BULL, J. & WADE, W. 1998. Computer-assisted assessment: Suggested guidelines for an institutional strategy. Assessment & Evaluation in Higher Education, 23(3):283. TELECOMMUNICATIONS. GSM Cell phones. [Online] Available: http://www.joburg.org.za/business/telecommunications.stm [2004, August 30].
WALKER, S. 1999-2000. Computer-assisted assessment in Chemistry, Department of Chemistry, University of Liverpool. [Online] Available: http://cti-psy.york.ac.uklaster/resources/case-studies/reports/su. [2003, August27].
WARSCHAUER, M. 2003. Dissecting the “digital divide”: A case study in Egypt. Information Society. Sep/Oct2003, 19(4):297-305.
WEBCHEK. 2000. Knowledge and usage of Government information. [Online] Available: http://www.capegateway.gov.za/other/2004/2/9
WELLINGTON, S.J. & COLLIER, R.E. Experiences of using student workbooks for formative and summative assessment. International Journal of Electrical Engineering
Education, 39(3). WORLD SUMMIT ON THE INFORMATION SOCIETY (WSIS). 2005. South African civil society input, First Draft, June 2005. ZIKMUND, W.G. 2003. Business research methods. 7th edn. USA: Thomson South-Western.

92
APPENDIX I
Dear Student I am inviting your participation in a study, which forms part of my research for my
Masters in Information Management at the University of the Western Cape.
This study will be used to evaluate the technological background and online learning
experiences amongst students and how this affects their progress in Business
Information Systems.
The questionnaire will take you 30 minutes to complete. It consists of 5 pages with a
total of 24 questions. The majority of questions is multiple-choice format and asks you
to select the most appropriate answer.
By completing the questionnaire it will be understood that you have consented to participate in the study. The information that you supply will remain confidential. The results of the study will
be used as part of my thesis, but you may be assured that any information obtained in
connection with this study that may be identified with you, will remain confidential and
will not be disclosed.
I thank you for your participation and help to re-look at teaching and learning
methodology in the future.
Sincerely Paliga Pillay

APPENDIX II
STUDENT NUMBER
INSTRUCTIONS
Answer the questions by (use tab key):
• Choosing the most suitable option from the drop down list.
• Typing in your response in the space (field) provided, or
• Clicking on a checkbox (an X will be inserted e.g. ). DEMOGRAPHICAL DATA
1. Race group If Other (please list)
Black, Coloured, White, Indian, Other
2. Age
17 – 19 yrs; 20 – 22 yrs; 23 – 25 yrs; 26 + yrs
3. Gender
Male; Female
4. Home language If Other (please list)
English; Afrikaans; IsiXhosa; IsiZulu; Is Ndebele; SiSwati, Zitona, Sesotho, Setswana, Sepedi, Tshivenda
5. Type of school attended If Other (please list)
Private, Public School, Model C School, Farm School, Village School
TECHNOLOGICAL BACKGROUND 6. Does your household own TELEPHONE
TELEVISION
RADIO
COMPUTER
7. Do you own a cell phone?
Yes No

94
8. If “Yes” to the use of a Cell Phone, did you use a cell phone to Receive calls
Make calls
Send SMS
Games
9. If “Yes” to own a cell phone, who is your cell phone provider?
Vodacom
MTN
Cell C
10. Have you made use of the following equipment? Telephone Printer Fax
Machine Photocopier Computer ATM Cell
Phone Internet
Yes
No
Yes
No
Yes
No
Yes
No
Yes
No
Yes
No
Yes
No
Yes
No
11. If “Yes” to the use of ATM, what was your feeling when you first used the ATM?
CONFIDENCE
FEAR
UNCERTAINTY
12. Where did you have access to a computer? Work; library; School; College; Internet Café; Friend; Family; Community Centre; Other 13. Have you ever used an Email programme to send or reply to correspondence? Yes No
IF THE ANSWER IS “YES” TO USING A COMPUTER, ANSWER QUESTIONS 12 AND 13 IF THE ANSWER IS “NO” ,GO TO QUESTION 14

ONLINE EXPERIENCE 14. How would you rate your ability with using a computer since coming to Pentech?
POOR
AVERAGE
GOOD
EXCELLENT
15. Which of the following computer applications software do you find useful? WORDPROCESSING
SPREADSHEETS
DATABASE
INTERNET EXPLORER
16. Do you find using the Skills Vantage Manager (SVM) programme VERY DIFFICULT
DIFFICULT
EASY
VERY EASY
17. Has the SVM programme assisted you in learning? 18. What was most difficult about the programme? Other (please list) Language, Font size, instructions, No difficulties 19. Which PART of SVM did you find most useful?
20. How did you find the POST ASSESSMENTS on SVM? VERY DIFFICULT
DIFFICULT
EASY
VERY EASY
21. Would you prefer to use a programme like SVM for other subjects in Higher
Certificate in Accounting (HCA)? 22. If “Yes” to the previous question, do you prefer to do your
ASSESSMENTS for these subjects on the computer?
YES
NO
PART 3 (Word)
PART 4 (Excel)
PART 5 (Access)
PART 7 (Internet)
NONE
YES
NO

96
23. Do you think computer skills are necessary in today’s world? 24. Do you use the library computer system to search for a book? THANK YOU
YES
NO
YES
NO
YES
NO

97
APPENDIX III
BUSINESS INFORMATION SYSTEMS MODULE 1 Business Information Systems Module 1 is a half course that gives a practical introduction to modern computer systems. This course develops familiarity with modern computer systems and encourages their productive use. Module 1 introduces concepts and discusses computer software and hardware systems then considers a range of computer applications, social, legal and ethical issues. The taught course is supplemented by on-line demonstrations and practical exercises. The Course is split into 4 Units that has to be completed in the First Semester.
TYPE OF LEARNING NOTIONAL HOURS
CREDITS WEEKS
70 7 9 Unit 1a Theory 15 1.5 2 Unit 1b File Management 20 2 2 Unit 1c Word Processing 25 2.5 3 Unit 1d Internet & e-mail 10 1 2
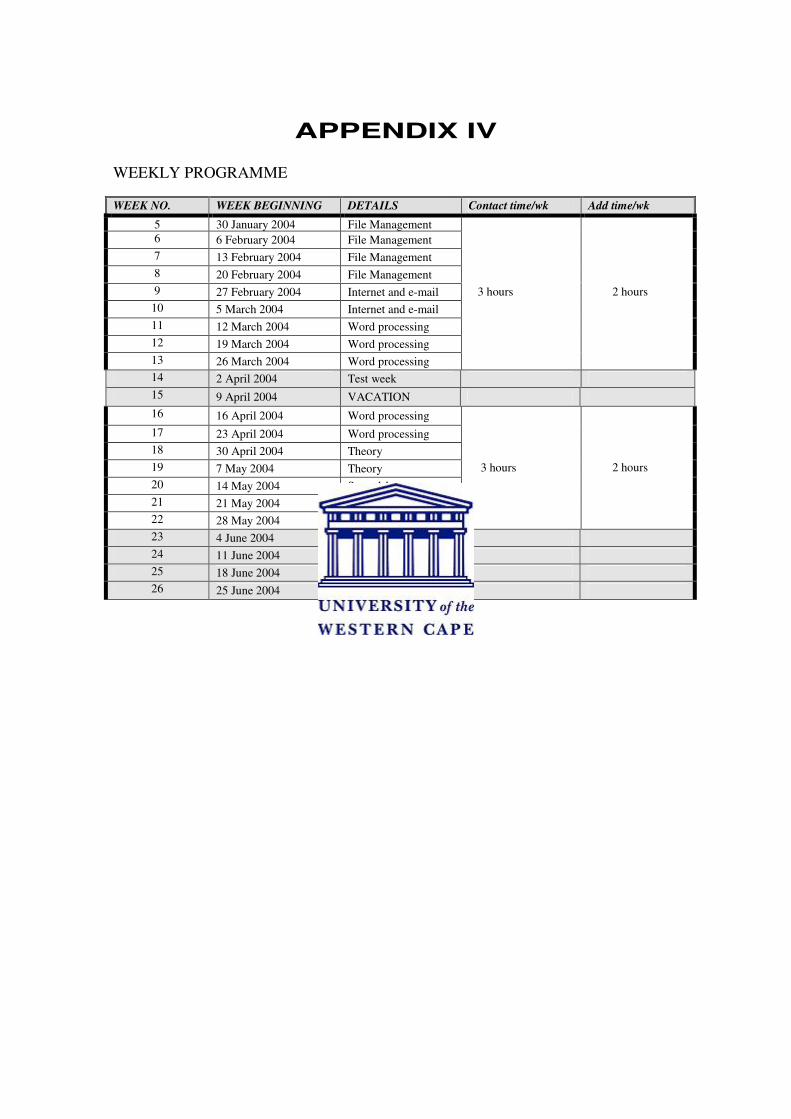
APPENDIX IV
WEEKLY PROGRAMME
WEEK NO. WEEK BEGINNING DETAILS Contact time/wk Add time/wk
5 30 January 2004 File Management 6 6 February 2004 File Management
7 13 February 2004 File Management
8 20 February 2004 File Management
9 27 February 2004 Internet and e-mail
10 5 March 2004 Internet and e-mail
11 12 March 2004 Word processing
12 19 March 2004 Word processing
13 26 March 2004 Word processing
3 hours
2 hours
14 2 April 2004 Test week
15 9 April 2004 VACATION
16 16 April 2004 Word processing
17 23 April 2004 Word processing
18 30 April 2004 Theory
19 7 May 2004 Theory
20 14 May 2004 Spreadsheet
21 21 May 2004 Spreadsheet
22 28 May 2004 Spreadsheet
3 hours
2 hours
23 4 June 2004 Test Week
24 11 June 2004 Test Week
25 18 June 2004 Test Week
26 25 June 2004 TEST WEEK

APPENDIX V
ASSESSMENT SCHEDULE
TYPE ASSESSMENT WEIGHT DATE
File Management Test 1 (M) 10% Test week
Internet & Email Assignment 15% 1 March
Word Processing Project 15% 13 April
Theory Test 2 20% 9 May
Tutorials/Participation 10% 16 May
Portfolio 5% 31 May Practical/Attendance
Attendance 5% 31 May
Integrated Test 3 20% Test week

APPENDIX VI
CURRICULUM
UNIT SPECIFIC OUTCOMES ASSESSMENT CRITERIA 1a Describe the basic hardware elements
and software of a computer. ♦ The motherboard and major components that can latch
on, can be described and identified.
♦ The function of the input and output devices of a computer can be explained.
♦ The operations of the input, possessing, storage and output can be explained.
♦ The memory and storage devices can be explained.
♦ The benefits and topologies of networks can be explained.
♦ The computer as a research and communications device can be explained.
♦ Copyright implications can be explained.
♦ Good housekeeping principles for computers can be explained.
♦ The selection and purchasing of software can be explained.
♦ The selection and purchasing of hardware can be explained.
♦ An e-commerce trade cycle can be described.
1b Use operating systems and utility software to perform computer storage management functions.
♦ The function of operating and utility software can be explained.
♦ The concept of a computer file can be explained.
♦ Computer file storage can be manipulated.

APPENDIX VII
LANGUAGE AND TECHNOLOGICAL BACKGROUND (TABLES AND GRAPHS)
Language
Table 1 Descriptive statistics for the major languages
Group Count Mean Standard Deviation
File Management Test
Afrikaans 39 75.13 21.26
English 21 75.24 18.87
IsiXhosa 102 51.37 27.86
Theory Test
Afrikaans 39 46 14.51
English 21 56 16.14
IsiXhosa 102 39 12.84
0
10
20
30
40
50
60
70
80
File Management Test Theory Test
Tests
Sco
res Afrikaans
English
IsiXhosa
Figure 1 Means to compare languages of File Management and Theory
Proportion Ge to 60% for File Management with respect to
Telephone (Yes, No), Gender & Race Categories
0.0%
10.0%
20.0%
30.0%
40.0%
50.0%
60.0%
70.0%
80.0%
90.0%
B_F No B_F Yes B_M No B_M Yes C_F No* C_F Yes C_M No* C_M Yes
Gender & Race Categories
Perc
enta
ge
Figure 2 Means to compare Telephone ownership and File Management results
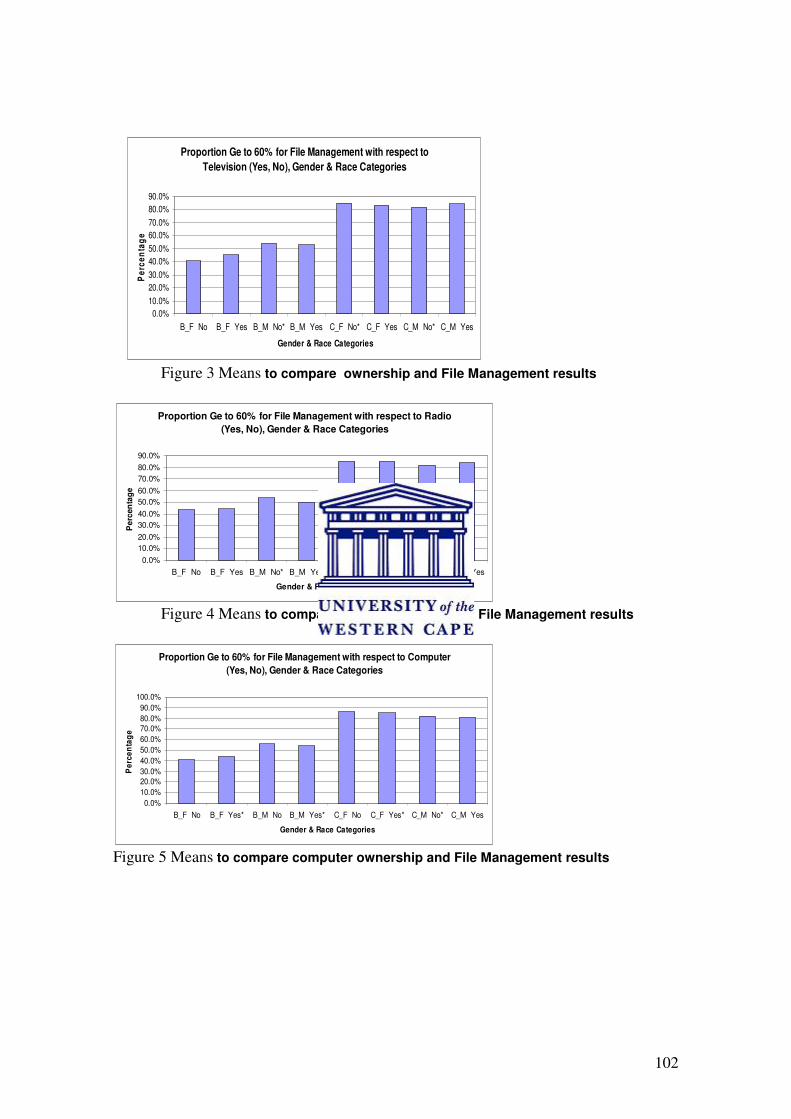
102
Proportion Ge to 60% for File Management with respect to
Television (Yes, No), Gender & Race Categories
0.0%
10.0%
20.0%
30.0%
40.0%
50.0%
60.0%
70.0%
80.0%
90.0%
B_F No B_F Yes B_M No* B_M Yes C_F No* C_F Yes C_M No* C_M Yes
Gender & Race Categories
Pe
rce
nta
ge
Figure 3 Means to compare ownership and File Management results
Proportion Ge to 60% for File Management with respect to Radio
(Yes, No), Gender & Race Categories
0.0%
10.0%
20.0%
30.0%
40.0%
50.0%
60.0%
70.0%
80.0%
90.0%
B_F No B_F Yes B_M No* B_M Yes C_F No* C_F Yes C_M No* C_M Yes
Gender & Race Categories
Pe
rcen
tag
e
Figure 4 Means to compare Radio ownership and File Management results
Proportion Ge to 60% for File Management with respect to Computer
(Yes, No), Gender & Race Categories
0.0%
10.0%
20.0%
30.0%
40.0%
50.0%
60.0%
70.0%
80.0%
90.0%
100.0%
B_F No B_F Yes* B_M No B_M Yes* C_F No C_F Yes* C_M No* C_M Yes
Gender & Race Categories
Pe
rce
nta
ge
Figure 5 Means to compare computer ownership and File Management results

103
Proportion Ge to 60% for File Management with respect to
Internet (Yes, No), Gender & Race Categories
0.0%
10.0%
20.0%
30.0%
40.0%
50.0%
60.0%
70.0%
80.0%
90.0%
B_F No B_F Yes* B_M No B_M Yes* C_F No C_F Yes* C_M No C_M Yes*
Gender & Race Categories
Pe
rce
nta
ge
Figure 6 Means to compare computer ownership and File Management results
Proportion Ge to 60% for File Management with respect to
Cell Phone (Yes, No), Gender & Race Categories
0.0%
10.0%
20.0%
30.0%
40.0%
50.0%
60.0%
70.0%
80.0%
90.0%
B_F No B_F Yes B_M No* B_M Yes C_F No* C_F Yes C_M No* C_M Yes
Gender & Race Categories
Pe
rce
nta
ge
Figure 7 Means to compare computer ownership and File Management results
Proportion Ge to 60% for File Management with respect to the use of a
Cell Phone (Yes, No) before coming to campus, Gender & Race
Categories
0.0%
20.0%
40.0%
60.0%
80.0%
100.0%
B_F No B_F Yes B_M No* B_M Yes C_F No* C_F Yes C_M No* C_M Yes
Gender & Race Categories
Pe
rce
nta
ge
Figure 8 Means to compare cell phone and File Management results

104
Proportion Ge to 60% for File Management with respect to
Photocopier (Yes, No), Gender & Race Categories
0.0%
10.0%
20.0%
30.0%
40.0%
50.0%
60.0%
70.0%
80.0%
90.0%
100.0%
B_F No* B_F Yes B_M No* B_M Yes C_F No* C_F Yes C_M No* C_M Yes
Gender & Race Categories
Pe
rce
nta
ge
Figure 9 Means to compare photocopier and File Management results
Proportion Ge to 60% for File Management with respect to ATM
(Yes, No), Gender & Race Categories
0.0%
10.0%
20.0%
30.0%
40.0%
50.0%
60.0%
70.0%
80.0%
90.0%
B_F No* B_F Yes B_M No* B_M Yes C_F No* C_F Yes C_M No* C_M Yes
Gender & Race Categories
Pe
rce
nta
ge
Figure 10 Means to compare ATM and File Management results
Proportion Ge to 60% for File Management with respect to Fax
Machine (Yes, No), Gender & Race Categories
0.0%10.0%20.0%30.0%40.0%50.0%60.0%70.0%80.0%90.0%
100.0%
B_F No B_F Yes B_M No B_M
Yes*
C_F No C_F Yes C_M No C_M
Yes*
Gender & Race Categories
Perc
en
tag
e
Figure 11 Means to compare fax machine and File Management results

105
Proportion Ge to 60% for File Management with respect to Printer
before coming to Pentech (Yes, No), Gender & Race Categories
0.0%
10.0%
20.0%
30.0%
40.0%
50.0%
60.0%
70.0%
80.0%
90.0%
B_F No B_F Yes B_M No* B_M Yes C_F No* C_F Yes C_M No* C_M Yes
Gender & Race Categories
Pe
rce
nta
ge
Figure 12 Means to compare printer and File Management results
Proportion Ge to 60% for File Management with respect to
Email (Yes, No), Gender & Race Categories
0.0%
10.0%
20.0%
30.0%
40.0%
50.0%
60.0%
70.0%
80.0%
90.0%
B_F No B_F Yes B_M No B_M Yes* C_F No C_F Yes* C_M No* C_M Yes*
Gender & Race Categories
Pe
rce
nta
ge
Figure 13 Means to compare email and File Management results
Proportion Ge to 40% for Theory with respect to
using email (Yes, No), Gender & Race Categories
0.0%
10.0%
20.0%
30.0%
40.0%
50.0%
60.0%
70.0%
80.0%
B_F No B_F Yes B_M No B_M
Yes*
C_F No* C_F
Yes*
C_M No* C_M Yes
Gender & Race Categories
Perc
enta
ge
Figure 14 Means to compare email and Theory results

106
Proportion Ge to 60% for File Management with respect to
On-line learning assistance (Yes, No), Gender & Race
Categories
0.0%
10.0%
20.0%
30.0%
40.0%
50.0%
60.0%
70.0%
80.0%
90.0%
100.0%
B_F No* B_F Yes B_M No B_M Yes C_F No* C_F Yes C_M No* C_M Yes
Gender & Race Categories
Pe
rce
nta
ge
Figure 15 Means to compare On-line assistance and File Management results
Proportion Ge to 60% for File Management with respect to
On line learning for other subjects (Yes, No), Gender & Race Categories
0.0%
20.0%
40.0%
60.0%
80.0%
100.0%
B_F No* B_F Yes B_M No* B_M Yes C_F No C_F Yes C_M No* C_M Yes
Gender & Race Categories
Pe
rce
nta
ge
Figure 16 Means to compare online learning for other subjects and File management
results
Proportion Ge to 40% for Theory with respect to
using online learning for other subjects (Yes, No), Gender &
Race Categories
0.0%
10.0%
20.0%
30.0%
40.0%
50.0%
60.0%
70.0%
80.0%
B_F No B_F Yes B_M No* B_M Yes C_F No* C_F Yes C_M No* C_M Yes
Gender & Race Categories
Perc
enta
ge
Figure 17 Means to compare online learning for other subjects and Theory results

107
Proportion Ge to 60% for File Management with respect to
electronic Library Search (Yes, No), Gender & Race Categories
0.0%
20.0%
40.0%
60.0%
80.0%
100.0%
B_F No B_F Yes B_M No* B_M Yes C_F No C_F Yes C_M No C_M Yes
Gender & Race Categories
Pe
rce
nta
ge
Figure 18 Means to compare electronic library search and File Management results
Proportion Ge to 40% for Theory with respect to
computer library search (Yes, No), Gender & Race Categories
0.0%
10.0%
20.0%
30.0%
40.0%
50.0%
60.0%
70.0%
80.0%
B_F No B_F Yes B_M No* B_M Yes C_F No C_F
Yes*
C_M No* C_M
Yes*
Gender & Race Categories
Pe
rce
nta
ge
Figure 19 Means to compare electronic library search and Theory results