the valuation of technology strategies: examining the ...€¦ · the valuation of technology...
TRANSCRIPT
Paper to be presented at
DRUID15, Rome, June 15-17, 2015
(Coorganized with LUISS)
The Valuation of Technology Strategies: Examining the short and
long-term financial returns of licensingGoretti Cabaleiro
Universidad Alberto HurtadoSchool of Economics
Ana BurcharthFundação Dom Cabral
Innovation and Entrepreneurship [email protected]
AbstractThis paper empirically evaluates the short-term and long-term implications of inward licensing, patenting activity and acombined strategy on firm performance. The short-term effects relate to abnormal stock market returns and long-termeffects relate to continuous changes in market share. Drawing on a dataset of 104 companies that belong to the energy,materials and consumer staples sectors from the Standard & Poors 500 index, we conduct our empirical analysis usingan event study and a fixed effects model for the period 2006-2012. Results show that, in the short-term, companiescapitalize on both developing and acquiring technologies. However, companies capture higher cumulative abnormalreturns when purchasing intellectual property than when developing and protecting technologies per se. Theannouncement of licensing agreements in the consumer staples and energy sector yields the highest returns, while theimpact is not significant in the materials sector. In the long-term, we find that patenting influences negatively the growthof a company?s market share and this effect is stronger when patenting and in-licensing are performed simultaneously.
Jelcodes:O32,L10
Paper Submitted to DRUID15 Conference: “The Relevance of Innovation”
Rome, Italy – June 15-17, 2015
The Valuation of Technology Strategies:
Examining the short and long-term financial returns of licensing!
This paper empirically evaluates the short-term and long-term implications of inward licensing,
patenting activity and a combined strategy on firm performance. The short-term effects relate to
abnormal stock market returns and long-term effects relate to continuous changes in market share.
Drawing on a dataset of 104 companies that belong to the energy, materials and consumer staples
sectors from the Standard & Poors 500 index, we conduct our empirical analysis using an event
study and a fixed effects model for the period 2006-2012. Results show that, in the short-term,
companies capitalize on both developing and acquiring technologies. However, companies capture
higher cumulative abnormal returns when purchasing intellectual property than when developing
and protecting technologies per se. The announcement of licensing agreements in the consumer
staples and energy sector yields the highest returns, while the impact is not significant in the
materials sector. In the long-term, we find that patenting influences negatively the growth of a
company’s market share and this effect is stronger when patenting and in-licensing are performed
simultaneously.
Key words: Inward licensing, Patenting, Markets for Technology, Firm Performance.
JEL Codes: O320 , O310, L1
February 28th, 2015
!!!!!!!!!!!!!!!!!!!!!!!!!!!!!!!!!!!!!!!!!!!!!!!!!!!!!!!!AKNOWLEDGEMENTS
We would like to thank Giovanni Valentini, Roland Suarez, Carlos Kennedy, Gino Cattani, Tommi Laamanen, Andrea Fosfuri, and Marco
Giarratana for their insightful comments and suggestions to improve this paper. We also benefited from comments received at the 3rd KTO Paper Development Workshop at SKEMA Business School, France (2014). We want to express as well our gratitude to Anders Hovgaard for valuable assistance during the collection of data for this paper.
! 1
1. Introduction
The balance between allocation of resources to technologies developed in-house, those
acquired externally and those traded in the market is central to the design of R&D strategies. Albeit
not new, this issue has become more crucial than ever, prompted by the intensification of
competition and of knowledge tradability, as knowledge has become increasingly disembodied
from individuals, organizations and products (Conti, Gambardella, & Novelli, 2013; Natalicchio,
Petruzzelli, & Garavelli, 2014). The proliferation of markets for technology and ideas (Arora,
Fosfuri, & Gambardella, 2001) has indeed opened up an ever-wider variety of opportunities and
technological paths for modern corporations, leading R&D strategies to become more complex and
challenging. As a result, in order to build competitive product portfolios, firms increasingly attempt
to combine the benefits of economizing on transaction costs through vertical integration
(Williamson, 1975) with the benefits of leveraging technological expertise and flexibility through
strategic outsourcing (Powell, Doput, & Smith-Doerr, 1996) and the sales of knowledge assets
(Fosfuri, 2006). The recent examples of Apple and Boeing1 indicate that companies simultaneously
use markets for technology in multiple ways, both as sellers and buyers, depending on the
technology at stake and on the competitive landscape. Alone in the United States, gross royalties
receipts from licenses amounted to $140 billion dollars in 2004, representing an average growth of
11 per cent per year for the period 1994-2004 (Robbins, 2006). Similar patterns have been
estimated for G8 countries too, where technology royalty payments and receipts increased by an
average annual rate of 10.7 per cent from 1980 to 2003 (Arora & Gambardella, 2010).
While the literature provides an advanced understanding of the factors that explain this
growing trend, i.e. why firms become active in markets for technology as either licensors or
licensees (Ceccagnoli, Graham, Higgins, & Lee, 2010; Ceccagnoli & Jiang, 2013; Fosfuri, 2006;
Kani & Motohashi, 2012), the performance implications of R&D allocation decisions remain
inconclusive (Mulotte, Dussauge, & Mitchell, 2013; Wang, Roijakkers, & Vanhavrbeke, 2013).
Even if several studies have investigated this issue, the findings are not consistent. Whereas the
evidence is mostly positive for licensing decisions with respect to return on assets (Zahra, 1996),
!!!!!!!!!!!!!!!!!!!!!!!!!!!!!!!!!!!!!!!!!!!!!!!!!!!!!!!!"!Apple decided not to incorporate Google Maps in the iPhone 5 as it had done in previous versions, but rather to
develop a similar application by itself. At the same time, it licensed its system on chip manufacturing to its main
competitor Samsung. Boeing, on the other hand, realized that its true comparative advantage was not in manufacturing,
but in systems integration. As a result, unlike its chief rival Airbus, it became the designer and systems integrator both
of its planes and of many of the systems that go in them, changing its core business to focus less on manufacturing and more on design and integration services.
!
! 2
diversification (Granstrand, Bohlin, Oskarsson, & Sjöberg, 1992), value-added (Walter, 2012),
product innovativeness (Tsai, Hsieh, & Hultink, 2011) and speed of invention (Leone & Reichstein,
2012), there is also indication of downsides. Negative effects of licensing have been found with
respect to overall performance (in terms of product, market, and financial measures) (Jones, Lanctot
JR., & Teegen, 2001), patenting (Joshi & Nerkar, 2011) and subsequent market entry (Mulotte et
al., 2013). Wang et al. (2013), in fact, found an inverted U relationship of the effects of licensing
among Chinese companies, using patents granted as a proxy for innovative performance.
Interestingly, Tsai and Wang (2008)’s results indicate that external technology acquisition does not
enhance firm performance, but its contribution increases with the internal R&D efforts of firms.
In light of these conflicting results, it remains an open question how shareholders react to
R&D allocation decisions (e.g. the announcement of a license deal or a patent issue). This is
nevertheless a highly relevant question, not only because it determines a company’s financial
market value in the short term, but also because it has enduring effects on innovative behavior. In
fact, the initial stock market reaction of a certain event has been found to be highly correlated to
long-term performance (P. Kale, Dyer, & Singh, 2002), to the compensation schemes of managers
(Dechow & Sloan, 1991; Degeorge, Patel, & Zeckhauser, 1999; Mizik, 2010) and to the company’s
true value (Akhtar & Oliver, 2009). Another key shortcoming is that the existing literature has
mostly concentrated on the exclusive choice between internal and external sourcing of technology
(Hagerdoorn & Wang, 2012; Mulotte et al., 2013). It has thus largely overlooked the combined
approach to R&D strategy that characterizes many modern companies (such as Apple and Boeing)
and that is subject to much controversy. While the economics tradition supports the specialization
argument (i.e. either technology generation and selling or technology buying and
commercialization), management research suggests that the optimal strategy is doing both selling
and buying concurrently, in accordance with the open approach to innovation (Conti et al., 2013).
As a result of these limitations, the performance implications of the different R&D strategies
remains uncertain. Understanding the implications of internal and external technology sourcing is
however crucial in terms of theory and practice. It helps explain when firms should use the market
option and when they should rely on internal capabilities, as well as make better predictions about
what impact different types of R&D strategies have on firm performance (Walter, 2012). We
address this issue by examining the effect of a firm’s inward licensing and patenting activity on
important financial variables. More precisely, we aim at examining the following research question:
What are the short-term and long-term effects of external technology acquisition and internal
! 3
technology development on financial performance? The short-term effects relate to abnormal stock
market returns and long-term effects relate to continuous changes in market share.
We test our hypotheses on a sample of 104 companies that have been selected from the
Standard & Poors 500 index and that belong to the energy, materials and consumer staples sectors.
Our period of analysis comprises seven years (from 2006 to 2012, both included). Results show
that, in the short-term, both internal technology development and external technology acquisition
yield positive market reactions. However, companies capture higher cumulative abnormal returns
when purchasing intellectual property than when developing and protecting technologies per se.
Also, the impact of licensing agreements in the shock market is different depending on the sector.
Specifically, results show that the announcement of licensing agreements in the consumer staples
and energy sector yields the highest returns in the stock market, in comparison to the materials
sector (for which it is not significant). In the long-term, we show that patenting influences
negatively the growth of a company’s market share and this effect is even stronger when patenting
and in-licensing are performed simultaneously.
We advance prior research in two key ways. First, we extend the discussion of implications
of markets for technology by comparing the impact of externalizing vs. internalizing technology
development in the short and in the long term. Second, complementing previous studies that have
focused on internal or external technological acquisition in isolation, we investigate the
performance implications of a combined approach to R&D strategy where a portfolio of in-house
technology development and external technology acquisition is considered. As the recent review of
Conti et al. (2013:754) contends, “a key research question concerns the extent to which, and the
contingencies under which, specialization is less beneficial than an “ambidextrous” open-innovation
approach”.
The paper is organized as follows. Section 2 presents the theoretical arguments
underpinning the hypotheses development. Section 3 describes the data, variables and methodology.
Section 4 reports the results, followed by a discussion of the initial findings. Section 5 concludes
the paper and presents implications for theory and practice.
2. Theory and Hypotheses
To obtain technological know-how, companies can choose between their own internal R&D
and external methods, such as entering into a technology sourcing agreement with an outside party
(Walter, 2012). Recent research in this field can be categorized in three streams. The focus of the
! 4
first stream is to investigate whether companies treat in-house R&D and external sourcing as
substitutes or complements, i.e. if an increase in one strategy raises or decreases the marginal
payoffs of the other. The literature has provided mixed empirical evidence in this regard. While the
works of Pisano (1990), Laursen and Salter (2006) and Vega-Jurado, Gutiérrez-Gracia, and
Fernández-de-Lucio (2009) have supported the substitution viewpoint, the majority of studies, such
as Cohen and Levinthal (1989), Arora and Gambardella (1990), Lowe and Taylor (1998), Cassiman
and Veugelers (2006) and Forman, Goldfarb, and Greenstein (2008) have found evidence for the
complementary view.
The second research stream contemplates the decision to acquire or sell technologies. The
aspect that has received most consideration in the literature is the supply-side determinants of
external knowledge sourcing (Conti et al., 2013), that is, the factors that influence the decision to
license or sell technologies and the implications thereof (e.g. Bianchi, Chiaroni, Chiesa, & Frattini,
2011; Cockburn, MacGarvie, & Müller, 2010; Fosfuri, 2006; Gambardella, Giuri, & Luzzi, 2007;
Kani & Motohashi, 2012; Kim & Vonortas, 2006). By contrast, the demand-side conditions of
licensing behavior have only recently received pronounced attention. These are the factors that
explain the motivations and costs of integrating licensed technology, as well as heterogeneity in the
behavior of licensees (e.g. Ceccagnoli et al., 2010; Ceccagnoli & Jiang, 2013; K. Laursen, Leone, &
Torrisi, 2010). Taken together, these studies indicate that the decision to license-in and -out depend
on a myriad of interrelated factors: the institutional setting (e.g. the strength of intellectual property
rights), industrial structure (e.g. degree of competitive pressure), firm characteristics and resources
endowments (e.g. R&D productivity, co-specialized complementary assets) and individual-level
characteristics (e.g. prior experience of licensing managers).
The third research stream is concerned with investigating the relationship between external
technology acquisition and firm performance. Most studies have evaluated the effects of licensing
on innovation results, as measured by product innovativeness (Tsai et al., 2011), subsequent market
entry (Mulotte et al., 2013), patenting (Joshi & Nerkar, 2011; Wang et al., 2013) and speed of
invention (Leone & Reichstein, 2012). Few have gathered empirical evidence on firm performance
as the outcome variable (Jones et al., 2001; Tsai & Wang, 2008; Zahra, 1996). These three studies
suggest nonetheless opposing results. Zahra (1996) has found that external technology acquisition is
positively associated with firm performance in terms of return on assets (ROA) on the basis of a
multi-industry sample of manufacturing company from a southeastern American state. Drawing on
data from U.S. subsidiaries of both domestic (U.S.) and foreign firms that operate in various
! 5
manufacturing sectors, Jones et al. (2001) have in contrast shown that external technology
acquisition is negatively associated with product, market and financial performance measures (the
latter assessed in terms of profitability and return on investment). Conversely, Tsai and Wang
(2008) did not gather any evidence of the direct relationship between external technology
acquisition and firm performance per se (as of value added), when examining Taiwanese
electronics-manufacturing firms in the period 1998-2002. Moreover, these studies do not consider
the impact of R&D strategies in different terms, nor the combined effect of externalization and
internalization of technology on firm performance. This comprehensive view is important, as R&D
strategies may serve to different purposes over time. While short-time considerations resolve
typically around current market positions (e.g. reaction to competitors), long-time horizons may be
connected to the development of new capabilities and the search for upcoming technological that
will shape future offerings.
Our study contributes to the third research stream by addressing these shortcomings. In the
following, we theorize about the distinct consequences of internal and external technological
sourcing on a firm’s short-term and long-term financial performance.
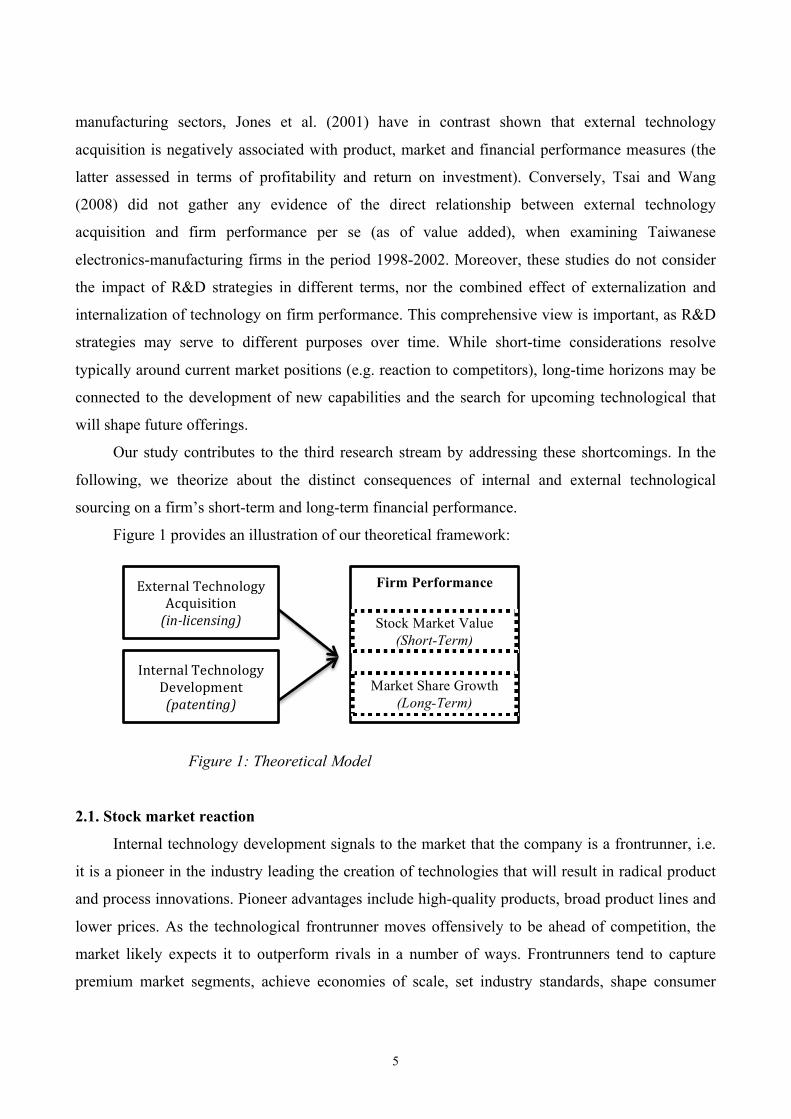
Figure 1 provides an illustration of our theoretical framework:
Figure 1: Theoretical Model
2.1. Stock market reaction
Internal technology development signals to the market that the company is a frontrunner, i.e.
it is a pioneer in the industry leading the creation of technologies that will result in radical product
and process innovations. Pioneer advantages include high-quality products, broad product lines and
lower prices. As the technological frontrunner moves offensively to be ahead of competition, the
market likely expects it to outperform rivals in a number of ways. Frontrunners tend to capture
premium market segments, achieve economies of scale, set industry standards, shape consumer
#$%&'()*!+&,-(.*./0!
1,23454%4.(!!
!"#$%"&'#("#)*!
6(%&'()*!+&,-(.*./0!
7&8&*.9:&(%!!
!+,-'#-"#)*!
Firm Performance
Stock Market Value
(Short-Term)
Market Share Growth
(Long-Term)
! 6
preferences, control distribution channels and thereby gain a strong market position. The favorable
reputation frontrunners often enjoy is thus likely to influence positively their market value (Ali,
1994; Zahra, 1996).
Besides, a company that shows technological prowess via its patenting activities signals to the
market “good management practices”. It demonstrates not only the efficacy of its technological
investments (Zahra, 1996), but also the ability to attract and hire competent R&D professionals and
to foster an innovative environment. In opposition to the situation of inward licensing, the company
has control, autonomy and understanding over proprietary technology. It is thus able to retain full
discretion over strategic decisions that are crucial for its forthcoming technological development
and for a sustained competitive advantage (Walter, 2012). In accordance with the resource-based
view of the firm (Barney, 1991), the possession of competitive resources (patents) and capabilities
(innovation capabilities) generates positive expectations about the firm’s performance.
Lastly, internal R&D generates less uncertainty in the market. The use of internally developed
technologies is less uncertain than the use of externally sourced ones because it is contextualized; it
does not need to be translated to the company’s needs, routines and competences. As prior research
indicates, knowledge is “situated”, in that it is defined in relation to a given social and physical
setting (Tyre & Von Hippel, 1997). It is characterized by a certain degree of interdependence in
specific contexts that limits its reproducibility and expropriation (Natalicchio et al., 2014). Hence,
an internally developed technology is expected to be readily deployed and commercialized. In
contrast, external knowledge transactions imply a variety of costs such as transaction costs, entry
costs, agency costs, appropriability and integration costs (Arora, Fosfuri, & Roende, 2013; Arora &
Gambardella, 2010) that are likely to prolong new product development projects (Knudsen &
Mortensen, 2011). When working with externally developed technologies, licensees need to adapt
and integrate external technologies into their specific product markets (Huston & Sakkab, 2006;
Lin, 2003). Since licensees gain only limited access to licensor’s knowledge (Mulotte et al., 2013),
this is a far from a straightforward endeavor, which depends on the licensor’s ability to transfer
knowledge and the licensee’s ability to absorb external knowledge (Ceccagnoli & Jiang, 2013).
One visible example is Nokia. On February 11, 2011, it announced a plan to develop a new
global mobile ecosystem with Nokia switching its smartphone from its software Symbian to
Windows Phone platform. The licensing deal was expected to catapult Microsoft, whose Windows
Phone operating system lagged behind Apple, Google Android, RIM and Symbian, into second
place worldwide, behind Android. Nokia planned to augment the Windows Phone Operating system
! 7
with proprietary software, enabling brand differentiation. After the announcement, shares in Nokia
fell 14% (Alcacer, Khanna, & Furey, 2011), indicating that shareholders reacted negatively to the
announcement of external technology acquisition.
Taken altogether, our arguments suggest that the global marketplace rewards firms more for
developing and protecting technologies than for purchasing intellectual property per se. Thus, we
propose:
Hypothesis 1: Companies that announce internal technology development (patent issues) will
capture greater cumulative abnormal returns than companies that announce external technology
acquisition (in-licensing deals), all else being equal.
2.2. Future financial returns
Two main streams of research have analyzed the implications of markets for technologies for
a firm’s long-term financial performance: the economics and the management literature. As these
literatures have arrived at opposite conclusions with respect to the optimal R&D strategy, we
develop competing hypotheses accordingly.
The literature on the economics of innovation and technological change emphasizes the long-
term and industry-wide consequences of markets for technology that encourage an improved
division of labor and learning economies. According to this logic, firms should specialize in the
activities in which they enjoy comparative advantage and then trade the outputs of those activities
(Arora & Gambardella, 2010; Conti et al., 2013). Even if recognizing the limited transparency and
strong inefficiencies of markets for technology (Arora et al., 2001), the more economic-oriented
contributions often take technology as easily replicated and transferred, to the extent that it is
embodied in blueprints, machines and materials (Lin, 2003). In this way, it supports the
organizational separation between the production and the use of technology, also known as
“synergetic division of knowledge labor” (Zhao & Chen, 2011). While licensees should carry out
only a subset of tasks necessary to introduce a new product (such as manufacturing, assembly and
sales), licensors should undertake the initial tasks of a new product development project, such as
technical development and product design. By becoming a pure licensing company, for instance, a
firm no longer is directly involved in the product market and is increasingly remote from the
manufacturing, the design of the product and all other activities in which it is relatively less
proficient. From the perspective of economic theories, this is viewed as an efficient and socially
! 8
optimal strategy, because any other solution could potentially increase the total cost of innovation
and thereby affect the well being of society as a whole. By the same token, a decrease in R&D
productivity due to, for instance, low technological opportunities, is expected to reduce the
incentives to invest in R&D and increase the relative payoff of external technological sourcing in
more developed markets for technology (Ceccagnoli et al., 2010).
The specialization argument finds resonance in the strategy literature too, which advocates for
a focus on core competencies. Defined as particular strengths companies have relative to other
organizations in the industry, core competencies are alleged to provide the fundamental basis for the
provision of added value. Deviating too far from core competencies may, nevertheless, generate
lack of clarity and managerial distraction that tend to have harmful consequences for a firm’s
competitive advantage (Prahalad & Hamel, 1990).
The pharmaceutical industry is an example of a setting where companies enjoy distinct
advantage- sourcing and advantage- leveraging advantages along their value chain. Whereas large
pharmaceutical firms have advantages in clinical testing, manufacturing and distribution, small
biotechnology firms have comparative advantages in generating early stage discoveries (Ceccagnoli
et al., 2010; Walter, 2012). Following the economics argument, licensing deals among them is
complementary and desirable because these firms benefit from leveraging their distinct
competences while accessing those of the other (Zhao & Chen, 2011).
Overall, the main tenet of this literature is that, via vertical specialization, “the overall pie
companies produce jointly is larger that it would be if they all internalized both research and
commercialization activities” (Conti et al., 2013: 753). Thus, we propose:
Hypothesis 2a: A combined R&D strategy has inferior impact on long-term financial performance
than internal technology development or external technology acquisition carried out independently.
In opposition to the economics rationale, the management literature advocates for a combined
or ambidextrous approach to R&D strategy. Following the logic of openness (Chesbrough, 2003),
companies can and should use external ideas and external paths to the market to supplement in-
house R&D efforts. Inbound and outbound practices ought to be implemented simultaneously, as a
means of accelerating internal innovation processes and of increasing the value of innovative efforts
(Chesbrough & Bogers, 2014; Dahlander & Gann, 2010; Fosfuri & Tribó, 2008). In spite of the
significant costs related to knowledge absorption, time and managerial attention (Knudsen &
! 9
Mortensen, 2011; Keld Laursen & Salter, 2006), open innovation is expected to facilitate access to
resources, knowledge and competencies otherwise unavailable to the firm, as well as enable
companies to better realize the monetary and strategic potential of the active commercialization of
knowledge (Faems, de Visser, Andries, & van Looy, 2010; Gassman, Enkel, & Chesbrough, 2010;
Huizingh, 2011). The underlying assumption is that in-house R&D and external sourcing are
complementary (Cassiman & Veugelers, 2006).
According to this line of reasoning, decisions related to the governance mode (open vs.
closed) should be taken at the problem level, where trade-offs can be best evaluated. Instead of
pursuing a specialized R&D strategy, companies should define the optimal governance of
innovation depended on the nature of the innovation problem to be solved (Pisano & Verganti,
2008). As each governance form offers access to different types of communication channels,
incentives and property rights, it supplements each other (Felin & Zenger, 2014). The use of varied
types of solution, i.e. a combined R&D strategy, is thus supported.
Moreover, the open literature defends a balanced view of attitudes to knowledge, according to
which companies should search for useful knowledge regardless of its source of origin. Protective
attitudes against knowledge sourcing and knowledge sharing in the form of the not-invented-here
(NIH) and the not-shared-here (NSH) syndromes are alleged to have detrimental consequences for
the innovation performance of firms (Burcharth, Knudsen, & Søndergaard, 2014; Katz & Allen,
1982).
Anecdotal evidence showing substantial increase (nearly 60%) in the R&D productivity of
companies that implemented of an open innovation approach (Huston & Sakkab, 2006) further
supports the management idea for a combined R&D strategy.
Overall, the main argument of this literature is that, “firms should use external knowledge
internally, on the one hand, but also exploit their internal knowledge by selling or sharing it on the
other” (Conti et al., 2013:753). Thus, we propose:
Hypothesis 2b: A combined R&D strategy has greater impact on long-term financial performance
than internal technology development or external technology acquisition carried out independently.
3. Data, Variables & Methods
3.1. Sampling
! 10
Our empirical analysis is based on a dataset of 104 companies that have been selected from
the Standard & Poors 500 index (as of 31 December 2006). Widely regarded as the best single
instrument of the U.S. equities market, this index includes 500 leading companies listed on the
NYSE or the NASDAQ stock market. It selects constituent companies based on their asset and
revenue location (U.S. company), level of market capitalization (minimum US$ 4 billion), public
float (at least 50%), financial viability (four quarters of positive reported earnings) and sector
representation. The companies were selected for our study according to their sector classification,
i.e. if they belonged to the energy, materials or consumer staples sectors in the terminology of the
Global Industry Classification Index (GICS). These sectors were chosen because they encompass
only manufacturing firms and are characterized by medium-levels of technology intensity. For the
purpose of our study, it would be a problem to deal with companies that obtain, for instance, 3,000
patents in a year (as it happens in the electronics, pharmaceuticals and chemical sectors, for
instance). In this case, patent announcements would be so common that would hinder us from
isolating their effect. The period chosen for analysis is 2006-2012.
The dataset extracted from Standard & Poors 500 index is integrated with information
gathered from multiple additional sources, including Compustat, Factiva and United States Patent
and Trademark Office (USPTO), using firm level identifiers (gvkey), as explained below.
3.2. Variables
3.2.1. Dependent variables
The two dependent variables of interest are Cumulative Abnormal Returns, CARs (first
hypothesis), and Continuous Change in the Company’s Market Share (second hypothesis).
Cumulative Abnormal Returns measures how much a stock price deviates from its expected
value during an event window (Gulati, Lavie, & Singh, 2009; P. Kale, Dyer, & Singh, 2003).
CARs were calculated in the following way: First, for each firm i, we computed the abnormal
returns using the market model (Fama, Fisher, Jensen, & Roll, 1969), which assumes a stable linear
relationship between market returns and returns on the financial instrument, as well as accounts for
market trends and firm risk. In this way, the market model improves the chances of isolating the
effect of specific events (Campbell, Lo, & MacKindley, 1997). To estimate the coefficients
(average return of the firm compared with the market average) and (sensitivity of its return to
the market return or risk of the stock), we used ordinary least squares (OLS) with the 200 trading
!i
!i
! 11
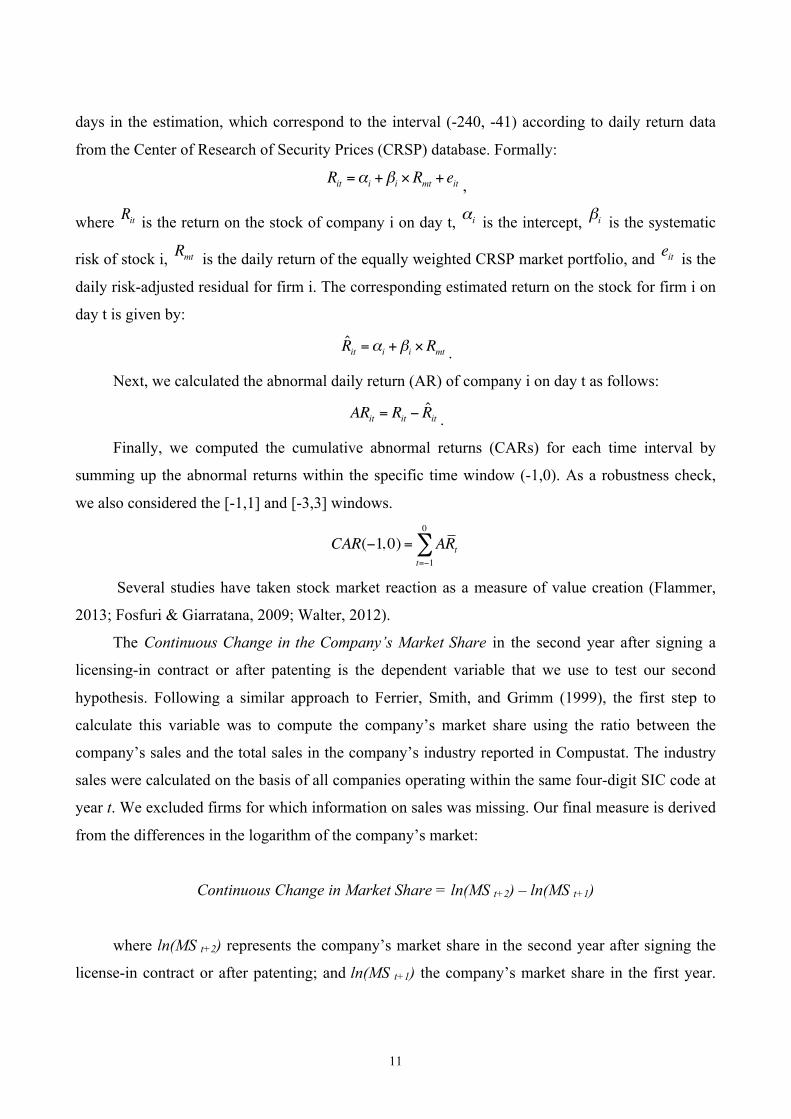
days in the estimation, which correspond to the interval (-240, -41) according to daily return data
from the Center of Research of Security Prices (CRSP) database. Formally:
,
where is the return on the stock of company i on day t, is the intercept, is the systematic
risk of stock i, is the daily return of the equally weighted CRSP market portfolio, and is the
daily risk-adjusted residual for firm i. The corresponding estimated return on the stock for firm i on
day t is given by:
.
Next, we calculated the abnormal daily return (AR) of company i on day t as follows:
.
Finally, we computed the cumulative abnormal returns (CARs) for each time interval by
summing up the abnormal returns within the specific time window (-1,0). As a robustness check,
we also considered the [-1,1] and [-3,3] windows.
Several studies have taken stock market reaction as a measure of value creation (Flammer,
2013; Fosfuri & Giarratana, 2009; Walter, 2012).
The Continuous Change in the Company’s Market Share in the second year after signing a
licensing-in contract or after patenting is the dependent variable that we use to test our second
hypothesis. Following a similar approach to Ferrier, Smith, and Grimm (1999), the first step to
calculate this variable was to compute the company’s market share using the ratio between the
company’s sales and the total sales in the company’s industry reported in Compustat. The industry
sales were calculated on the basis of all companies operating within the same four-digit SIC code at
year t. We excluded firms for which information on sales was missing. Our final measure is derived
from the differences in the logarithm of the company’s market:
Continuous Change in Market Share = ln(MS t+2) – ln(MS t+1)
where ln(MS t+2) represents the company’s market share in the second year after signing the
license-in contract or after patenting; and ln(MS t+1) the company’s market share in the first year.
Rit=!
i+"
i!R
mt+ e
it
Rit
!i
!i
Rmt
eit
R̂it=!
i+"
i!R
mt
ARit= R
it! R̂
it
CAR(!1,0) = ARt
t=!1
0
"
! 12
Due to skewness in the market share data, a logarithmic transformation was applied. This measure
can be interpreted as yielding positive values when there is an increase in a firm’s relative market
share, and as yielding negative values when there is a decrease in a firm’s relative market share
after two years. One potential issue in estimating the relative changes in the company market share
after an inward licensing or a patent announcement regards the fact that a firm already experiencing
performance problems may also be more likely to engage in licensing deals or patents which would
produce biased estimates due to simultaneity (Verbeek, 2000). In order to try to deal with this
problem, we added the change on the company market share in the previous year as one of the
predictors that should capture the effect of the past performance on the subsequent changes in the
licensor market share. As a robustness check, we also applied the Wooldridge (2002) test for
autocorrelation in panel data and the estimators indicated no evidence of first-order autocorrelation.
3.2.2. Independent variables
Our main independent variables are external technology acquisition and internal technology
development.
External technology acquisition is measured by the number of inward licensing agreements
available in the press. The data originates from the Factiva database, a comprehensive database of
global news and business information that includes local newspapers, same-day newswires,
company reports and media programs. Factiva contains business news from more than 14.000 news
sources, 12.000 websites and 4.000 blogs, covering sources from more than 159 countries in 22
languages. In a recent study, Flammer (2013) has attained the high accuracy and reliability of the
data contained in this database.
Using the Factiva database, we extracted related news articles in the period of interest (2006 –
2010) using the following search term: "company name" near30 "licensing agreement". The
resulting hits were all individually examined by a specially trained graduate research assistant and
scrutinized for information regarding licensing agreements. The codification captured the names of
the licensor and licensee and the date of announcement. Further, two dummy variables captured
whether the license is a cross-licensing agreement and whether the agreement is an amendment.
Finally, to the degree possible, the economic conditions and the content of the licensing agreements
were obtained. There were 96 licensing agreements identified from our searches, where 57 covered
inward deals and 39 covered outward deals. However, after matching our database with the one of
! 13
CRSP, we lost 3 observations2, resulting in a final dataset with 54 inward licensing deals. One
concern with this analysis is that we only capture the tip of the iceberg with regards to the actual
number of licensing agreements, as we may suspect that not all licensing agreements are reported in
the media and therefore not included in our dataset (it is not compulsory for companies to report
licensing revenues as a separate item in the income statement). However, as Schilling (2009: 258)
claimed, “even though each database only captures a sample of alliance activity, it may yield
reliable results for many – if not all – purposes”. In this study, the fact that we could not measure all
licensing agreements goes against our research in that we have a conservative measure.
Specifically, if we are not identifying all the licensing agreements, we are not considering all these
“increases” in the stock market. In consequence, the “normal” returns used to make the prediction
should be greater than in the case of identifying the whole population and, therefore, obtaining
significant “abnormal returns” should be more difficult for us.
Internal technology development is proxied by patents granted by the USPTO in the period of
interest (2006-2010). Patents are preferred over R&D investments because they constitute an output
measure related to a firm’s innovation efforts (and not an input measure). Even if a limited amount
of a firm’s internally developed technologies is granted exclusive property rights, patents provide a
suitable approximation for in-house inventive activity. As our dataset contains exclusively
American companies, we deemed appropriate to only include patents granted by the American
patent office (in line with previous studies such as Fosfuri and Giarratana (2009)). In the electronic
USPTO patent database (http://patft.uspto.gov/netahtml/PTO/search-bool.html), we used two terms
in our query, accordingly: 1) "company name" in "assignee name" and 2) " 1/1/2006-
>12/31/2010” in "issue date". Using a web crawler, we searched the USPTO database using the
terms described above for each of our sample companies. These searches resulted in more than
24.000 patents. Using the web crawler, we extracted the relevant information for each patent, e.g.
date granted, US patent number, US class, assignee name. Due to the nature of the search term, a
number of patents from companies with names similar to those of our sample companies were
collected, as were patents registered to subsidiaries and joint ventures of our sample companies. To
clean these patents from our sample, we manually examined the extracted data. Patents registered to
subsidiaries or companies with similar names were removed from the sample. In the cleaning
process, we considered that 'name of the company'= 'name of the company+ co'='name of the
company+ company'. After cleaning the data, we had 13.398 patents. However, after the matching
!!!!!!!!!!!!!!!!!!!!!!!!!!!!!!!!!!!!!!!!!!!!!!!!!!!!!!!!;!<&!*.5%!%-'&&!.=5&'8)%4.(5!=&,)35&!%-'&&!*4,&(54(/!)/'&&:&(%5!>&'&!)((.3(,&?!?3'4(/!>&&@&(?5A!15!5%.,@!:)'@&%!45!,*.5&?!>&!?&,4?&?!(.%!
%.!35&!%-&!(&$%!*)=.'!?)0!%.!)8.4?!,)9%3'4(/!3('&*)%&?!&8&(%5A!
! 14
with CRSP, our final sample is equal to 12.270 patents. For the event study conducted for
Hypothesis 1, we considered only one observation per day for a more conservative measure (for the
cases in which a company had several patents issued in the same day), what further reduced our
sample to 4.547 patents.
3.2.3. Control variables
Data on control variables was gathered primarily from the Compustat database. A number of
control variables related to firm characteristics and investments have been included in the second
part of the analysis focused on future returns, namely firm size, firm age, firm sector, investments
and year. We have controlled for firm size by using the natural logarithm of number of employees
available in Compustat, as larger firms are expected to deter a bigger portion of the market due to
potential benefits of economies of scale. Firm age was defined as the natural logarithm of years
since its foundation, computed by the following difference: 2006 (first year of analysis) minus the
foundation year of each company. Data on the foundation year was gathered via Internet searches in
the companies’ websites and Wikipedia. Older companies who have been operating for longer time
are likely to possess larger market shares (e.g. acquired via brand differentiation or learning
economies). To account for our cross-industry approach, firm sector was computed by using two
dummies related to the sector classification in the Standard & Poors 500 index (energy, materials or
consumer staples); where 1= if the company belonged to a given sector; 0= if it did not belong.
Investments were measured as capital expenditures and acquisitions, as provided by Compustat. As
they refer to the purchase of assets other than technology to provide future income, they represent
other growth strategies that may affect a firm’s potential market share. Specifically, capital
expenditures represent the funds used for additions to property, plant, and equipment, excluding
amounts arising from acquisitions and including property and equipment expenditures.
Acquisitions, in turn, refer to the fixed assets of purchased companies. Finally, year dummies were
included to account for our longitudinal approach.
3.3. Methods
Regarding the first hypothesis, whose objective is to capture the stock price reactions to
licensing announcements and patent issues, we ran an event study using the Eventus Software. This
package performs event studies using data read directly from CRSP stock databases. In order to run
the event study, we examined the stock price reaction by analyzing the average CARs during the
! 15
event window. These CARs captured how much the stock price deviated from its expected value on
the day of the licensing or patenting announcement. This methodology relies on the assumption that
stock markets are efficient and that prices perfectly reflect all public information related to the
prospects of the company. Thus, the effect of a specific event should be reflected almost
immediately in the stock market. That is, when an event occurs, the market updates its forecast,
causing a shift in market value.
To avoid including unrelated events that might influence stock returns, the event window
needs to be sufficiently narrow (Gulati et al., 2009). A common approach is to set the event day
(day 0) as the day of the announcement and to consider the possibility that the event might have
happened on the previous day, before the stock market closed (day -1) (MacKinlay, 1997). Previous
research has indicated that a two-day window is more effective for capturing stock market reactions
than longer windows, since longer windows are more likely to capture confounding effects that
make difficult to obtain reliable statistical inference (Crutchley, Guo, & Hansen, 1991). We
therefore use the two-day event window (-1,0) as our main specification. Yet, as our study relies on
the announcement date of corporate news (in the case of the licensing deals), which may not
necessarily be the date of the actual event, we may run into the problem of “event uncertainty”. To
deal with this potential drawback, we followed previous literature on event studies (e.g. Flammer,
2013) and expanded the event window. Thus, as a robustness check, we also considered the three-
day (-1,1) and six-day (-3,3) windows.
To determine if the resulting mean CARs differed significantly from zero, we performed two
different tests. One of them is parametric: Patell Z test (Patell, 1976), while the other one is non-
parametric: Generalized Sign Z (Cowan, 1992). After analyzing the significance of the cumulative
abnormal returns, a necessary next step is to discern if the differences between the mean CAR of
the compared groups are significant. We used the t-statistic to compare the means between two
groups.
In order to test our second hypotheses, we used a fixed effects model as a way to account for
the substantial unobserved firm heterogeneity that commonly affects studies dealing with corporate
performance measures (Coles, Lemmon, & Felix Meschke, 2012). Indeed, to test whether the use of
fixed effects is appropriate, we applied a!Hausman (1978) test. The results indicated significant
differences between the random and fixed effects estimators (chi = 11.69, p < 0.005), confirming
the suitability of fixed effects. Finally, robust standard errors were used to rule out
heteroskedasticity concerns (Wooldridge, 2002).
! 16
4. Results and Discussion
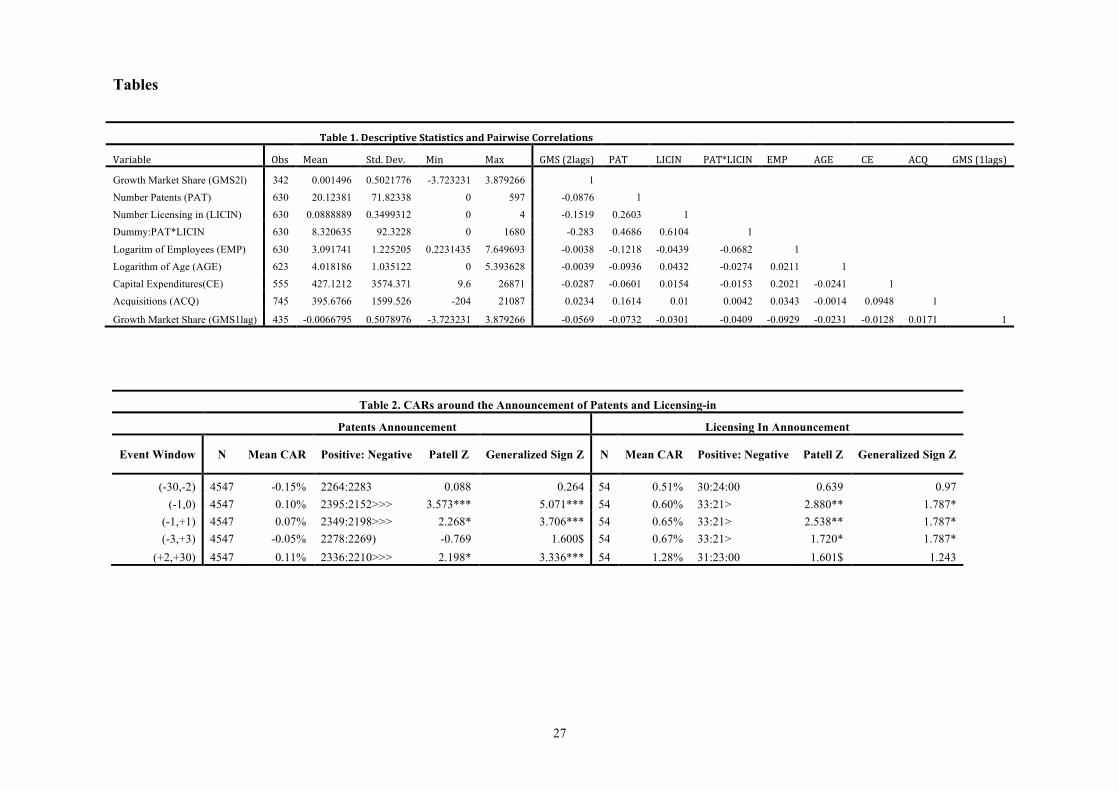
Table 1 provides the means, standard deviations, and Pearson correlation coefficients of the
variables used in the fixed effects model. The correlation does not warrant further examination with
respect to multicollinearity. Additionally, the maximum variance inflation factor (VIF) associated
with any of the independent variables was 1.46 (mean VIF = 1.18), which is well below the rule-of-
thumb value of ten (Wooldridge, 2012).
--------------------- Insert Table 1
--------------------
4.1. Short-term effects
Our analysis starts with the event study to test Hypothesis 1, concerning whether companies
capture higher cumulative abnormal returns with the announcement of patent issues than with the
announcement of licensing agreements.
--------------------- Insert Table 2
--------------------
The results are presented in Table 2. For each event window, we report the mean CAR as
percentage, counts of positive and negative individual CARs, their corresponding Patell z-statistics
and Generalized Sign Z. For patent issues, the average CAR in the main event window is 0.10
percent and significant at the 0.001 level (Patell z = 3.573). It is also significant under the
Generalized Sign Z test (5.071) at the 0.001 level. For licensing agreements, the average CAR is
also positive (0.60 per cent) and significant under all tests (Patell z = 2.880 at 0.01 level and
Generalized Sign Z test =1.787 at 0.05 level). Our results thus indicate that, in the short-term,
companies capitalize on both developing and acquiring technologies. They resonate the findings of
Walter (2012), who analyzed the effects of inward and outward licensing transactions on abnormal
stock market returns in the US computer and pharmaceutical industries for the period 1990-2000.
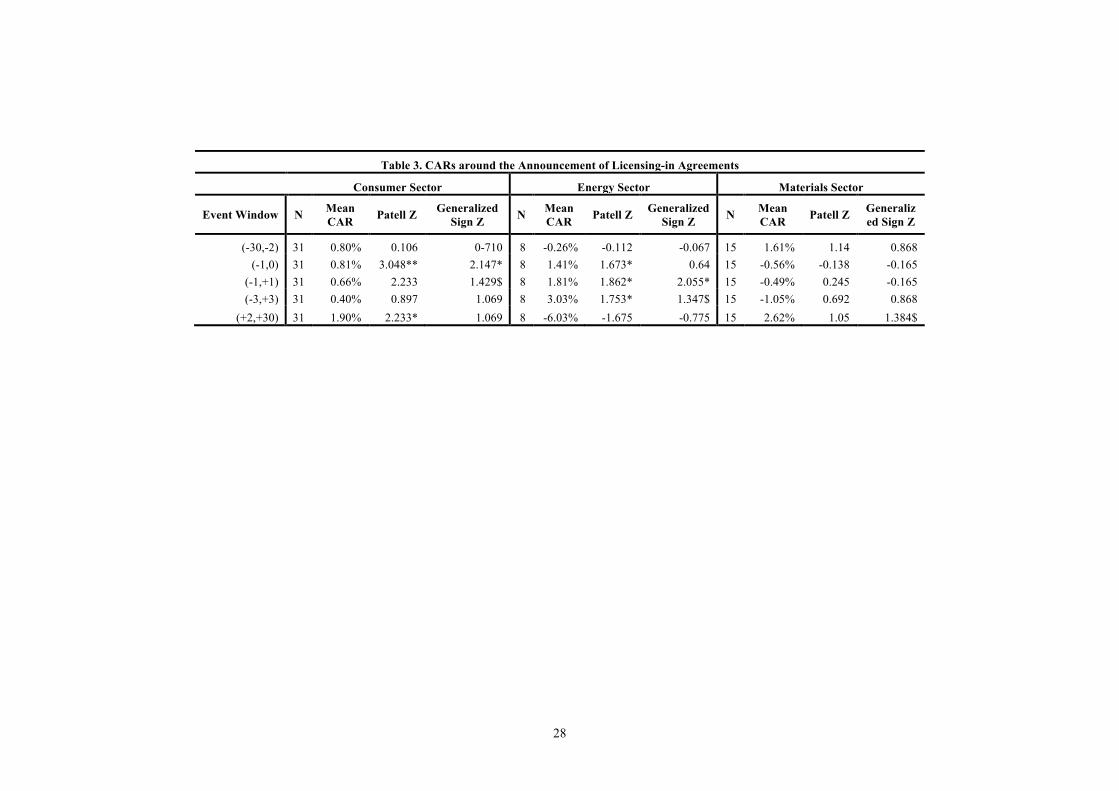
Table 3 breaks down these results by sector. It reveals that the announcement of licensing
agreements in the consumer staples and energy sector yields the highest returns in the stock market,
in comparison to the materials sector (for which it is not significant).
--------------------- Insert Table 3
--------------------
! 17
In order to test the difference of CARs between the announcement of patents and licenses, we
ran a t-test that compares the mean CARs resulting from licensing-in with the mean CARs resulting
from patenting. The null hypothesis is that the mean CARs of both groups are not different. The t-
test is equal to 5.3524 and we reject the null hypothesis at the 1% level, suggesting that the CARs
from both groups are statistically different and that the effect of announcing licensing-in in the
stock market is stronger than the effect of announcing patents.
Hence, these findings lead to the rejection of Hypothesis 1. Contrary to our expectations,
shareholders react less positively to the announcement of internal technology development than to
the announcement of external technological acquisition. This may reflect the preference of the
market of legitimized technologies. While licensed technologies are proven to work (sanctioned
technologies that have been accepted by others), this is not necessarily the case of new inventions
that have just been patented. Widely applied as instruments of market protection, many patented
inventions are never put into practice. This surprising result may also be seen as a consequence of
the “institutionalization” of open innovation (Chesbrough & Bogers, 2014). There has recently been
a lot of media attention towards openness (e.g. Pisano & Verganti, 2008), where firms are facing
increasing external pressure to comply with an open approach to R&D strategy. This high external
pressure may amplify shareholders’ positive reaction to the announcement of open practices such as
inward licensing. Another possible explanation is that, by purchasing the newest technologies in the
market, companies signal to shareholders their effort to be up-to-date with technical developments
and thus commitment to be at the technological frontier. Moreover, as they are willing to use
outside knowledge, they show that they do not suffer from NIH tendencies.
4.2. Long-term effects
Hypotheses 2 tests the two opposite implications of markets for technologies for a firm’s
long-term financial performance that were previously pointed in the literature: economics vs.
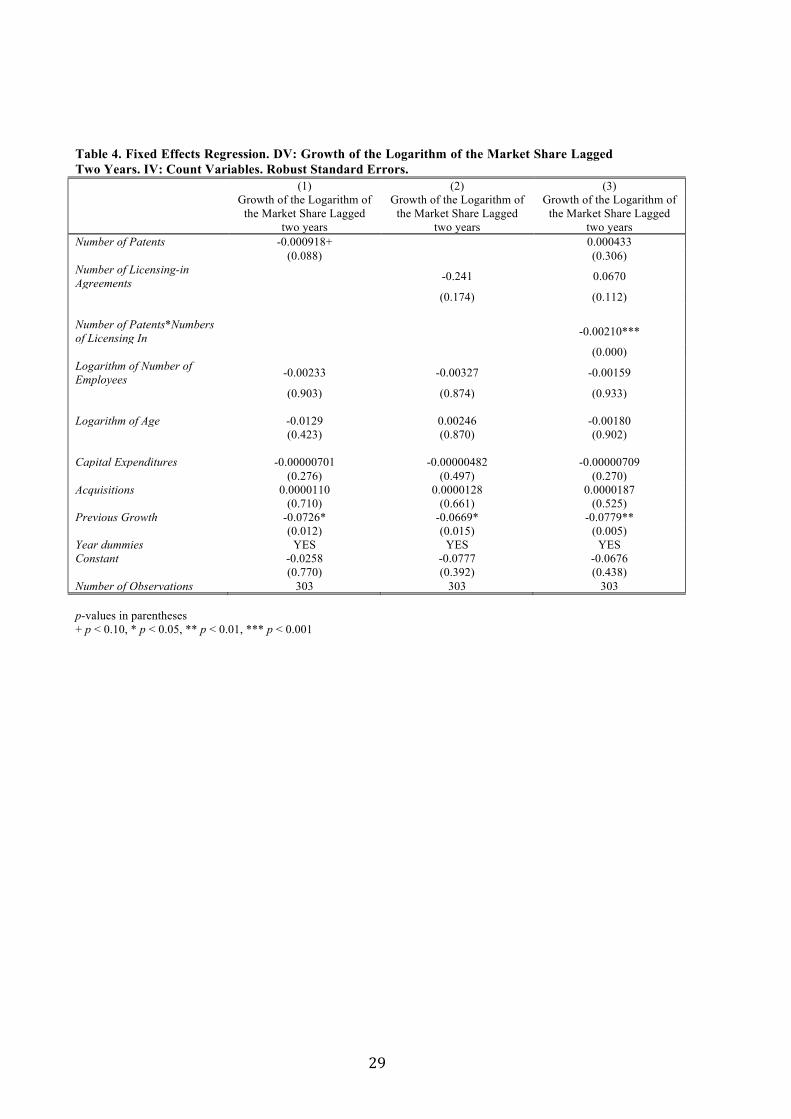
management literature. The panel data analysis based on the fixed effects model is presented in
Table 4, where models 1 and 2 include the control variables and the direct effects of the
independent variables and model 3 incorporates the interaction effect. A hierarchical approach is
thus followed, as this is a relatively conservative approach that evaluates the statistical significance
of interaction terms after controlling for lower-order effects (Frazier, Tix, & Barron, 2004; Hayes,
2013)
--------------------- Insert Table 4
! 18
--------------------
The results of Table 4 reveal that neither the coefficient of number of patents, nor the
coefficient of number of inward licensing agreements were significant in Models 1 and 2 (at the 5%
significance level), indicating that separate R&D strategies do not influence the growth of a
company’s market share in isolation. These findings are in line with Tsai and Wang (2008), who
discovered a non-significant effect of external technology acquisition on firm value added for a
sample of 341 Taiwanese electronics-manufacturing firms in the period 1998-2002. The lack of
evidence of a direct association between the independent variables and the dependent variable is not
a concern for our analysis. We follow Hayes (2013), who strongly encourages the test of
moderation even in the absence of significant direct effects, which are “not required for moderation
analysis” (p. 223). In fact, the results of Model 3 show that the coefficient of the interaction term
between the number of licensing-in and the number of patents is negative (!̂ = -0.00210) !and
significant at the 1% level, suggesting contrary to our expectations, that the combination of R&D
strategies has a negative impact on the growth of a company’s market share in a two-year time lag.
Thus, they lead to the confirmation of Hypothesis 2a (the economics argument) and to the rejection
of Hypothesis 2b (the management argument).
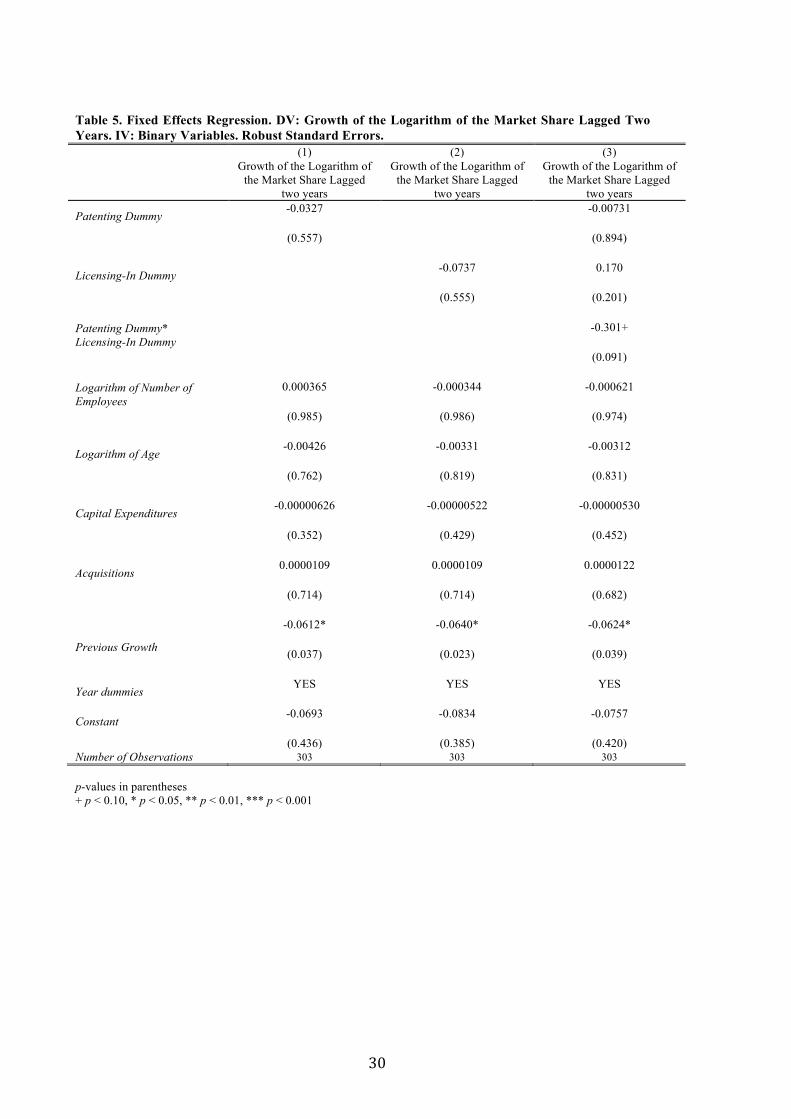
4.3. Sensitivity analysis
As a robustness check, we have also checked the results using binary variables. Given the
nature of our independent variables, we found it appropriate to recalculate our model, treating them
as dummy variables (where 1= if a firm had a patent/license; 0 =if a firm had no patent/ license). As
Table 5 shows, results are robust across the two model specifications and thus validate our findings.
The direct effects of inward licensing and patenting are not significant, while the interaction term
between them is negative (!̂ = -0.301) !and significant at 10%, what confirms Hypothesis 2a.
--------------------- Insert Table 5
--------------------
5. Conclusions (preliminary)
A lively scholarly debate exists around the role played by inputs used for firms to expand
technological knowledge for innovation, where internal R&D investments and external technology
acquisitions are seen as important strategies for developing new products and processes. The
! 19
objective of this paper is to empirically evaluate the short-term and long-term impacts of a firm’s
inward licensing and patenting activity on performance. As most extant research has investigated
the trade-offs between internalizing and externalizing knowledge sourcing in isolation, an
additional objective is to assess the results of a combined R&D strategy.
Both internal technology development and external technology acquisition were found to
yield positive market reactions in the short-run. Companies capture nevertheless higher cumulative
abnormal stock market returns when purchasing intellectual property than when developing and
protecting technologies per se. However, in the long run patenting and in-licensing lead to a relative
decrease in the companies’ market share when performed simultaneously. These findings have
implications for theory and practice.
From a theoretical perspective, our study contributes to the literature on technology markets
and innovation management in two important ways. First, it expands the analysis of outcomes of
technology markets by relating theoretical arguments explaining the benefits and costs of internal
and external knowledge sourcing to abnormal stock market returns and changes in relative market
share. In this way, it provides a comparative analysis of the differing outcomes in the short and in
the long term. Second, our study provides an empirical test of opposing arguments related to the
performance implications of a combined approach to R&D strategy, where a portfolio of in-house
technology development and external technology acquisition is considered simultaneously. We
found support for the economics argument, according to which a combined R&D strategy yields
inferior returns to long-term performance. Put differently, firms are better off if they specialize in
the activities in which they enjoy comparative advantages. In this way, it questions the highly
popular open innovation approach (Chesbrough, 2003), which argues for an ambidextrous R&D
strategy.
From a practical perspective, our study prompts managers to be cautions in delineating their
R&D strategies. Even though internalization and externalization may generate immediate positive
returns, they may not pay off in the future. They are encouraged to reflect upon a specialized R&D
strategies based on the companies’ core competencies – either developing and selling technologies
or purchasing and commercializing them.
Our study has nevertheless a number of noteworthy limitations. Our sample is restricted to
large American firms and should be replicated in other contexts in order to validate our findings.
Besides, long-term financial performance may be assessed in a number of ways. While we consider
relative changes in a company’s market share a valid measure, as it assesses performance relative to

! 20
prior performance and to other competitors in the industry, additional performance variables such as
value added should be tested as to confirm our findings. Besides, our measure of external
technology acquisition unlikely captures all inward licensing agreements of the sampled companies.
More complete license databases are not available and constitute a noteworthy effort for future
scholarly work. Additionally, the use of patents as an indication of internal technology development
remains a first approximation. Not all internally developed technologies are patented and inter-firm
differences are also subject to differing IP strategies.
!
! 21
6. References
Akhtar, F., & Oliver, B. (2009). Capital Market Efficiency: McGraw-Hill Australia Pty Ltd. /PPTs t/a Business Finance 10e by Person, Chapter 16.
Alcacer, J., Khanna, T., & Furey, M. (2011). Nokia: The Burning Platform. Harvard Business
School Case, 9-711-514.
Ali, A. (1994). Pioneering versus incremental innovation: Review and research propositions. Journal of Product Innovation Management, 11(1), 46-61.
Arora, A., Fosfuri, A., & Gambardella, A. (2001). Markets for Technology: The Economics of
Innovation and Corporate Strategy: MIT Press.
Arora, A., Fosfuri, A., & Roende, T. (2013). Managing Licensing in a Market for Technology. Management Science, 59(5), 1092-1106.
Arora, A., & Gambardella, A. (1990). Complementarity And External Linkages: The Strategies Of The Large Firms In Biotechnology. Journal of Industrial Economics, 38(4), 361-379.
Arora, A., & Gambardella, A. (2010). Ideas for rent: an overview of markets for technology. Industrial & Corporate Change, 19(3), 775-803.
Barney, J. (1991). Special Theory Forum: The Resource-Based Model of the Firm: Origins, Implications, and Prospects. Journal of Management, 17(1), 97-99.
Bianchi, M., Chiaroni, D., Chiesa, V., & Frattini, F. (2011). Exploring the role of human resources in technology out-licensing: an empirical analysis of biotech new technology-based firms. Technology Analysis & Strategic Management, 23(8), 825-849.
Burcharth, A. L. A., Knudsen, M. P., & Søndergaard, H. A. (2014). Neither Invented Nor Shared Here: The Impact and Management of Attitudes for the Adoption of Open Innovation Practices. Technovation, 34(3), 149-161.
Campbell, J. Y., Lo, A. W., & MacKindley, A. C. (1997). The Econometrics of Financial Markets: Princeton University Press.
Cassiman, B., & Veugelers, R. (2006). In Search of Complementarity in Innovation Strategy: Internal R&D and External Knowledge Acquisition. Management Science, 52, 68-82.
Ceccagnoli, M., Graham, S. J. H., Higgins, M. J., & Lee, J. (2010). Productivity and the role of complementary assets in firms' demand for technology innovations. Industrial & Corporate
Change, 19(3), 839-869.
Ceccagnoli, M., & Jiang, L. (2013). The cost of integrating external technologies: supply and demand drivers of value creation in the markets for technology. Strategic Management Journal,
34, 404-425.
Chesbrough, H. (2003). Open Innovation: The New Imperative for Creating and Profiting from
Technology. Boston, Massachusetts: Harvard Business School Press.
! 22
Chesbrough, H., & Bogers, M. (2014). Explicating open innovation: Clarifying an emerging paradigm for understanding innovation. In H. Chesbrough, W. Vanhaverbeke & J. West (Eds.), New Frontiers in Open Innovation (pp. 3-28). Oxford: Oxford University Press.
Cockburn, I., MacGarvie, M. J., & Müller, E. (2010). Patent thickets, licensing and innovative performance. Industrial & Corporate Change, 19(3), 899-925.
Cohen, W. M., & Levinthal, D. A. (1989). Innovation and Learning: The Two Faces of R & D. Economic Journal, 99(397), 569-596.
Coles, J. L., Lemmon, M. L., & Felix Meschke, J. (2012). Structural models and endogeneity in corporate finance: The link between managerial ownership and corporate performance. Journal
of Financial Economics, 103(1), 149-168. doi: 10.1016/j.jfineco.2011.04.002
Conti, R., Gambardella, A., & Novelli, E. (2013). Research on Markets for Inventions and Implications for R&D Allocation Strategies. Academy of Management Annals, 7(1), 717-774.
Cowan, A. R. (1992). Nonparametric Event Study Tests. Review of Quantitative Finance and
Accounting, 2, 343-358.
Crutchley, C. E., Guo, E., & Hansen, R. S. (1991). Stockholder Benefits from Japanese-U.S. Joint Ventures. Financial Management, 20(4), 22-30.
Dahlander, L., & Gann, D. M. (2010). How Open is Innovation? Research Policy, 39(6), 699-709.
Dechow, P., & Sloan, R. (1991). Executive Incentives & the Horizon Problem: An Empirical Investigation. Journal of Accounting & Economics, 14(1), 51-89.
Degeorge, F., Patel, J., & Zeckhauser, R. (1999). Earning Management to Exceed Thresholds. Journal of Business, 72(1), 1-33.
Faems, D., de Visser, M., Andries, P., & van Looy, B. (2010). Technology Alliance Portfolios and Financial Performance: Value-Enhancing and Cost-Increasing Effects of Open Innovation. Journal of Product Innovation Management, 27(6), 785-796. doi: 10.1111/j.1540-5885.2010.00752.x
Fama, E. F., Fisher, L., Jensen, M. C., & Roll, R. (1969). The Adjustment of Stock Prices to New Information. International Economic Review, 10(1), 1-21.
Felin, T., & Zenger, T. R. (2014). Closed or open innovation? Problem solving and the governance choice. Research Policy, 43(5), 914-925.
Ferrier, W. J., Smith, K. G., & Grimm, C. M. (1999). The Role of Competitive Action in Market Share Erosion and Industry Dethronement: A Study of Industry Leaders and Challengers. The
Academy of Management Journal, 42(4), 372-388. doi: 10.2307/257009
Flammer, C. (2013). Corporate Social Responsibility and Shareholder Reaction: The Environmental Awarennes of Investors. Academy of Management Journal, 56(3), 758-781.
! 23
Forman, C., Goldfarb, A., & Greenstein, S. (2008). Understanding the inputs into innovation: Do cities substitute for internal firm resources? Journal of Economics & Management Strategy,
17(2), 295-316.
Fosfuri, A. (2006). The Licensing Dilemma: Understanding the Determinants of the Rate of Technology Licensing. Strategic Management Journal, 27(12), 1141-1158.
Fosfuri, A., & Giarratana, M. S. (2009). Master of War: Rival's Product Innovation and new Advertising in Mature Product Markets. Management Science, 55(2), 181-191.
Fosfuri, A., & Tribó, J. A. (2008). Exploring the antecedents of potential absorptive capacity and its impact on innovative performance. Omega, 36(2), 173-187.
Frazier, P. A., Tix, A. P., & Barron, K. E. (2004). Testing Moderator and Mediator Effects in Counseling Psychology Research. Journal of Counseling Psychology, 51(1), 115-134. doi: 10.1037/0022-0167.51.1.115
Gambardella, A., Giuri, P., & Luzzi, A. (2007). The market for patents in Europe. Research Policy,
36, 1163-1183.
Gassman, O., Enkel, E., & Chesbrough, H. (2010). The Future of Open Innovation. R & D
Management, 40, 213-221.
Granstrand, O., Bohlin, E., Oskarsson, C., & Sjöberg, N. (1992). External technology acquisition in large multi-technology corporations. R&D Management, 22, 111–134.
Gulati, R., Lavie, D., & Singh, H. (2009). The Nature of Partnering Experience and the Gains from Alliances. Strategic Management Journal, 30(1213-1233).
Hagerdoorn, J., & Wang, N. (2012). Is There Complementarity or Substitutability Between Internal and External R&D Strategies? Research Policy, 41, 1072-1083.
Hausman, J. A. (1978). Specification Test in Econometrics. Econometrica, 46(6), 1251-1271.
Hayes, A. F. (2013). Introduction to Mediation, Moderation and Conditional Process Analysis. New York: The Guilford Press.
Huizingh, E. K. R. E. (2011). Open Innovation: State of The Art and Future Perspectives. Technovation, 31(1), 2-9.
Huston, L., & Sakkab, N. (2006). Connect and Develop: Inside Procter & Gamble's New Model for Innovation. Harvard Business Review, 84(3), 58-66.
Jones, G. K., Lanctot JR., A., & Teegen, H. J. (2001). Determinants and performance impacts of external technology acquisition. Journal of Business Venturing, 16(3), 255 - 283.
Joshi, A. M., & Nerkar, A. (2011). When do strategic alliances inhibit innovation by firms? Evidence from patent pools in the global optical disc industry. Strategic Management Journal,
32, 1139-1160.
! 24
Kale, P., Dyer, J., & Singh, H. (2002). Alliance capability, Stock Market Response and Long-Term Alliance Success: The role of the alliance function. Strategic Management Journal, 23(8), 747–767.
Kale, P., Dyer, J., & Singh, H. (2003). Value Creation and Success in Strategic Alliances. European
Management Journal, 19(5), 463-471.
Kani, M., & Motohashi, K. (2012). Understanding the technology market for patents: New insights from a licensing survey of Japanese firms. Research Policy, 41, 226-235.
Katz, R., & Allen, T. J. (1982). Investigating the Not Invented Here (NIH) Syndrome: A Look at the Performance, Tenure, and Communication Patterns of 50 R&D Project Groups. R & D
Management, 12(1), 7-20.
Kim, Y., & Vonortas, N. S. (2006). Technology licensing partners. Journal of Economics and
Business, 58, 273-289.
Knudsen, M. P., & Mortensen, T. B. (2011). Some Immediate - but Negative - Effects of Openness on Product Development Performance. Technovation, 31, 54-64.
Laursen, K., Leone, M., & Torrisi, S. (2010). Technological exploration through licensing: new insights from the licensee’s point of view. Industrial & Corporate Change, 19(3), 871-897.
Laursen, K., & Salter, A. (2006). Open for Innovation: The Role of Openness in Explaining Innovation Performance Among U.K. Manufacturing Firms. Strategic Management Journal,
27(2), 131-150.
Leone, M. I., & Reichstein, T. (2012). Licensing-in fosters rapid invention! the effect of the grant-back clause and technological unfamiliarity. Strategic Management Journal, 33(8), 965-985.
Lin, B.-W. (2003). Technology transfer as technological learning: a source of competitive advantage for firms with limited R&D resources. R & D Management, 33(3), 327-341.
Lowe, J., & Taylor, P. (1998). R&D and technology purchase trhough licensing agreements: complementary strategies and complementary assets. R & D Management, 28(4), 263-278.
MacKinlay, A. C. (1997). Event Studies in Economics and Finance. Journal of Economics
Literature, 35(1), 13-39.
Mizik, N. (2010). The Theory and Practice of Myopic Management. Journal of Marketing
Research, 47(4), 594-611.
Mulotte, L., Dussauge, P., & Mitchell, W. (2013). Does Pre-entry Licensing Undermine the Performance of Subsequent Independent Activities? Evidence from the global aerospace industry, 1944-2000. Strategic Management Journal, 34, 358-372.
Natalicchio, A., Petruzzelli, A. M., & Garavelli, A. C. (2014). A literature review on markets for ideas: Emerging chracteristics and unasnwered questions. Technovation, 34, 65-76.
! 25
Pisano, G. P. (1990). The R&D Boundaries of the Firm: An Empirical Analysis. Administrative
Science Quarterly, 35(1), 153-176.
Pisano, G. P., & Verganti, R. (2008). What Kind of Collaboration Is Right for You? Harvard
Business Review, 86(12), 78-87.
Powell, W. W., Doput, K. W., & Smith-Doerr, L. (1996). Interorganisational collaboration and the locus of innovation: networks of learning in biotechnology. Administrative Science Quarterly,
41(1), 116-145.
Prahalad, C. K., & Hamel, G. (1990). The Core Competence of the Corporation. Harvard Business
Review, 68(3), 79-91.
Robbins, C. (2006). Measuring payments for the supply and use of intellectual property. In M. Reinsdorf & M. J. Slaughter (Eds.), International Trade in Services and Intangibles in the Era of
Globalization. Washington DC: University of Chicago Press.
Schilling, M. A. (2009). Understanding the Alliance Data. Strategic Management Journal, 30(3), 233-260.
Tsai, K.-H., Hsieh, M.-H., & Hultink, E. J. (2011). External technology acquisition and product innovativeness: The moderating roles of R&D investment and configurational context. Journal of Engineering and Technology Management, 28(3), 184-200.
Tsai, K.-H., & Wang, J.-C. (2008). External technology acquisition and firm performance: A longitudinal study. Journal of Business Venturing, 23, 91-112.
Tyre, M. J., & Von Hippel, E. (1997). The Situated Nature of Adaptive Learning in Organizations. Organization Science, 8(1), 71-83.
Vega-Jurado, J., Gutiérrez-Gracia, A., & Fernández-de-Lucio, I. (2009). Does external knowledge sourcing matter for innovation? : evidence from the Spanish manufacturing industry. Industrial
and Corporate Change, 18(4), 637-670.
Verbeek, M. (2000). A guide to modern econometrics. Chichester; New York: Wiley.
Walter, J. (2012). The influence of firm and industry characteristics on returns from technology licensing deals: evidence from the US computer and pharmaceutical sectors. R & D
Management, 42(5), 435-454.
Wang, Y., Roijakkers, N., & Vanhavrbeke, W. (2013). Learning-by-Licensing: How Chinese Firms Benefit from Licensing-In Technologies. IEEE Transactions on Engineering Management,
60(1), 46-58.
Williamson, O. E. (1975). Markets and hierarchies: Analysis and antitrust implications. New York: Free Press.
Wooldridge, J. M. (2002). Econometric analysis of cross section and panel data. Cambridge, Mass.: MIT Press.

! 26
Wooldridge, J. M. (2012). Introductory econometrics : a modern approach. Mason, Ohio: South-Western Cengage Learning.
Zahra, S. A. (1996). Technology strategy and financial performance: Examining the moderating role of the firm's competitive environment. Journal of Business Venturing, 11(3), 189-219.
Zhao, G., & Chen, W. (2011). Ensuring Quality Science from "R" to "D": An optimal Adoption Strategy for In-licensing of Pharmaceutical Innovation. IEEE Transactions on Engineering
Management, 58(4), 643-661.
! 27
Tables
!
!"#$%&'(&)%*+,-./-0%&1/"/-*/-+*&"23&4"-,5-*%&67,,%$"/-72*& !! !! !! !!
"#$%#&'(! )&*! +(#,! -./0!1(20! +%,! +#3! 4+-!56'#7*8! 9:;! <=>=?! 9:;@<=>=?! A+9! :4A! >A! :>B! 4+-!5C'#7*8!
Growth Market Share (GMS2l) 342 0.001496 0.5021776 -3.723231 3.879266 1
Number Patents (PAT) 630 20.12381 71.82338 0 597 -0.0876 1
Number Licensing in (LICIN) 630 0.0888889 0.3499312 0 4 -0.1519 0.2603 1
Dummy:PAT*LICIN 630 8.320635 92.3228 0 1680 -0.283 0.4686 0.6104 1
Logaritm of Employees (EMP) 630 3.091741 1.225205 0.2231435 7.649693 -0.0038 -0.1218 -0.0439 -0.0682 1
Logarithm of Age (AGE) 623 4.018186 1.035122 0 5.393628 -0.0039 -0.0936 0.0432 -0.0274 0.0211 1
Capital Expenditures(CE) 555 427.1212 3574.371 9.6 26871 -0.0287 -0.0601 0.0154 -0.0153 0.2021 -0.0241 1
Acquisitions (ACQ) 745 395.6766 1599.526 -204 21087 0.0234 0.1614 0.01 0.0042 0.0343 -0.0014 0.0948 1
Growth Market Share (GMS1lag) 435 -0.0066795 0.5078976 -3.723231 3.879266 -0.0569 -0.0732 -0.0301 -0.0409 -0.0929 -0.0231 -0.0128 0.0171 1
!
!
!
Table 2. CARs around the Announcement of Patents and Licensing-in
Patents Announcement Licensing In Announcement
Event Window N Mean CAR Positive: Negative Patell Z Generalized Sign Z N Mean CAR Positive: Negative Patell Z Generalized Sign Z
(-30,-2) 4547 -0.15% 2264:2283 0.088 0.264 54 0.51% 30:24:00 0.639 0.97
(-1,0) 4547 0.10% 2395:2152>>> 3.573*** 5.071*** 54 0.60% 33:21> 2.880** 1.787*
(-1,+1) 4547 0.07% 2349:2198>>> 2.268* 3.706*** 54 0.65% 33:21> 2.538** 1.787*
(-3,+3) 4547 -0.05% 2278:2269) -0.769 1.600$ 54 0.67% 33:21> 1.720* 1.787*
(+2,+30) 4547 0.11% 2336:2210>>> 2.198* 3.336*** 54 1.28% 31:23:00 1.601$ 1.243
!
!
!
!
!
!
!
!
! 28
!
!
!
!
Table 3. CARs around the Announcement of Licensing-in Agreements
Consumer Sector Energy Sector Materials Sector
Event Window N Mean
CAR Patell Z
Generalized
Sign Z N
Mean
CAR Patell Z
Generalized
Sign Z N
Mean
CAR Patell Z
Generaliz
ed Sign Z
(-30,-2) 31 0.80% 0.106 0-710 8 -0.26% -0.112 -0.067 15 1.61% 1.14 0.868
(-1,0) 31 0.81% 3.048** 2.147* 8 1.41% 1.673* 0.64 15 -0.56% -0.138 -0.165
(-1,+1) 31 0.66% 2.233 1.429$ 8 1.81% 1.862* 2.055* 15 -0.49% 0.245 -0.165
(-3,+3) 31 0.40% 0.897 1.069 8 3.03% 1.753* 1.347$ 15 -1.05% 0.692 0.868
(+2,+30) 31 1.90% 2.233* 1.069 8 -6.03% -1.675 -0.775 15 2.62% 1.05 1.384$
!
! "#!
Table 4. Fixed Effects Regression. DV: Growth of the Logarithm of the Market Share Lagged
Two Years. IV: Count Variables. Robust Standard Errors.
(1) (2) (3)
Growth of the Logarithm of
the Market Share Lagged
two years
Growth of the Logarithm of
the Market Share Lagged
two years
Growth of the Logarithm of
the Market Share Lagged
two years
Number of Patents -0.000918+ 0.000433
(0.088) (0.306)
Number of Licensing-in
Agreements -0.241 0.0670
(0.174) (0.112)
Number of Patents*Numbers
of Licensing In -0.00210***
(0.000)
Logarithm of Number of
Employees -0.00233 -0.00327 -0.00159
(0.903) (0.874) (0.933)
Logarithm of Age -0.0129 0.00246 -0.00180
(0.423) (0.870) (0.902)
Capital Expenditures -0.00000701 -0.00000482 -0.00000709
(0.276) (0.497) (0.270)
Acquisitions 0.0000110 0.0000128 0.0000187
(0.710) (0.661) (0.525)
Previous Growth -0.0726* -0.0669* -0.0779**
(0.012) (0.015) (0.005)
Year dummies YES YES YES
Constant -0.0258 -0.0777 -0.0676
(0.770) (0.392) (0.438)
Number of Observations 303 303 303
p-values in parentheses
+ p < 0.10, * p < 0.05, ** p < 0.01, *** p < 0.001
!
! "#!
Table 5. Fixed Effects Regression. DV: Growth of the Logarithm of the Market Share Lagged Two
Years. IV: Binary Variables. Robust Standard Errors.
(1) (2) (3)
Growth of the Logarithm of
the Market Share Lagged
two years
Growth of the Logarithm of
the Market Share Lagged
two years
Growth of the Logarithm of
the Market Share Lagged
two years
Patenting Dummy -0.0327 -0.00731
(0.557) (0.894)
Licensing-In Dummy -0.0737 0.170
(0.555) (0.201)
Patenting Dummy*
Licensing-In Dummy
-0.301+
(0.091)
Logarithm of Number of
Employees
0.000365 -0.000344 -0.000621
(0.985) (0.986) (0.974)
Logarithm of Age -0.00426 -0.00331 -0.00312
(0.762) (0.819) (0.831)
Capital Expenditures -0.00000626 -0.00000522 -0.00000530
(0.352) (0.429) (0.452)
Acquisitions 0.0000109 0.0000109 0.0000122
(0.714) (0.714) (0.682)
Previous Growth
-0.0612*
(0.037)
-0.0640*
(0.023)
-0.0624*
(0.039)
Year dummies YES YES YES
Constant -0.0693 -0.0834 -0.0757
(0.436) (0.385) (0.420)
Number of Observations 303 303 303
p-values in parentheses
+ p < 0.10, * p < 0.05, ** p < 0.01, *** p < 0.001