the “value at risk” concept for insurance · pdf filethe “value at...
TRANSCRIPT

171
The “Value at Risk” Concept for Insurance Companies
Willi Ufer
The VAR concept is becoming the industry standard for risk management in banks active in trading. This presentation tries to show possible applications and conditions for the VAR-methods in insurance companies.
La conception VAR (la valeur au risque) est le nouveau standard pour le management du risque dans le monde financier. Au tours de cette pr&entation on va ellaborer quelques applications des methodes du type VAR. En outre on va etudier les conditions sous lesquelles ces modeles peuvent &re utiles pour des compagnies d’assurances.
DG Bank Frankfurt, Am Platz der Republik, D-60265 Frankfurt am Main (Germany); Tel: + 49-69- 74414394, Fax: + 49-69-1441-6206

172
A. The ImDortance of Value-at-Risk for Insurance ComDanieg
In times, of real time information worldwide it becomes easy for investors
to compare the performance of financial institutions like banks, insurance
companies and funds. Even less informed investors and clients are able to
judge the performance of financial institutions by using the service of rating
agencies, who give ratings not only on banks, but also on insurance
companies and funds. Especially for insurance companies and investment
funds efficient capital investments are the differentiating battle field on which
competitors try to gain new clients. It becomes evident that the results of the
capital investments influences the competitiveness and growth of financial
institutions in the future.
In 1990 Harry M. Markowitz, one of the founders of modern portfolio
theory, received the Nobel Price for Economics for his work. The basis of his
work was to introduce risk into portfolio theory. Not only the expected return
but also the risk of an investment becomes a decision criterion.
But what exactly is risk, how is it measured? As a measurement different
variables are considered. So one can choose the probability that over a
certain period of time a loss appears. In modern portfolio theory the standard
deviation of the annual return has established itself as a measure of risk. This
statistical term expresses the average deviation of an expected value.
In today’s insurance companies risk is often measured by the amount of
possible depreciation at the end of the year. This is somehow quantified by
doing a rough scenario-analysis on the securities which have to be accounted
by the lower of cost or market. Sometimes this method is accompanied by a
so-called Gap Analysis which compares volumes between assets and
liabilities, within different time buckets. All these methods have the
disadvantage that they are not standardized and therefore, not usable to

173
compare competing companies. They normally do not give a good
understanding of the real economic risks involved and by no means are they
able to quantify the risk of complex portfolios which include options and
correlation risks.
Methods which give a clear picture of market risks have been developed
by large trading houses. In the last few years, the reason why they so quickly
have become prominent in Europe, is the fact that the Bank for International
Settlement in Base1 (BIS) has proposed to cover market risks in banks with
equity. The allowed methods to quantify market risks according to Base1 are
either some very standardized tables and scenario analysis’ or some bank
internal methods. A working group organised by the BIS has shown that
mainly three different internal methods are presently used by trading houses.
These are the Historical Simulation Method, the Variance-Covariance
Method, and the Monte-Carlo-Method.
Internal Methods will become even more important when the European
Capital Adequacy Directive will be revised in 1998. This already leads to the
fact that Internal Models will be introduced into national laws by the national
authorities in Europe who made it to their objective to get a tighter control on
market risks of financial institutions.
Internal Methods measure market risk under normal market conditions by
using historical market data to predict future market events. The so-called
Variance-Covariance-Method measures the volatilities and correlations of
market variables from historical price data and produces a statistical model
based on these estimates. The Historical Simulation Method uses historical
price observations directly to simulate future price changes. Using historical
data to predict the future, makes the assumption that the future shows a
174
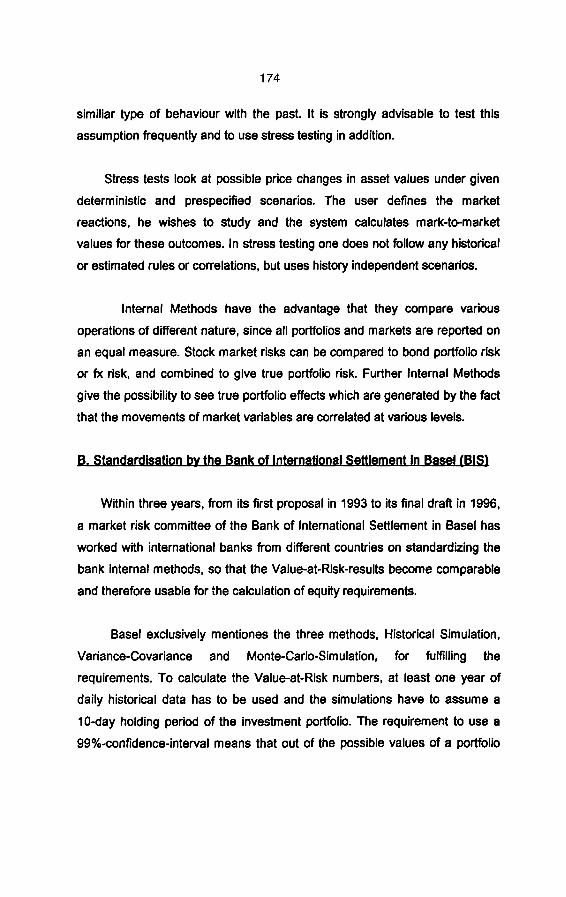
similiar type of behaviour with the past. It is strongly advisable to test this
assumption frequently and to use stress testing in addition.
Stress tests look at possible price changes in asset values under given
deterministic and prespecified scenarios. The user defines the market
reactions, he wishes to study and the system calculates mark-to-market
values for these outcomes. In stress testing one does not follow any historical
or estimated rules or correlations, but uses history independent scenarios.
Internal Methods have the advantage that they compare various
operations of different nature, since all portfolios and markets are reported on
an equal measure. Stock market risks can be compared to bond portfolio risk
or fx risk, and combined to give true portfolio risk. Further Internal Methods
give the possibility to see true portfolio effects which are generated by the fact
that the movements of market variables are correlated at various levels.
5 Stmdardisatkm bv the Bank of Intm&hoal Settlementinl
Within three years, from its first proposal in 1993 to its final draft in 1996,
a market risk committee of the Bank of International Settlement in Base1 has
worked with international banks from different countries on standardizing the
bank internal methods, so that the Value-at-Risk-results become comparable
and therefore usable for the calculation of equity requirements.
Base1 exclusively mentiones the three methods, Historical Simulation,
Variance-Covariance and Monte-Carlo-Simulation, for fulfilling the
requirements. To calculate the Value-at-Risk numbers, at least one year of
daily historical data has to be used and the simulations have to assume a
lo-day holding period of the investment portfolio. The requirement to use a
99%-confidence-interval means that out of the possible values of a portfolio

175
the point is marked where 99 % of all possible values have a better outcome
and 1 % have a worse outcome. This point is compared with the actual value
of the portfolio and the amount of loss defined with this procedure is the
so-called 1 % Value-at-Risk level or the 99 % confidence interval. In other
words there is a 1 %-probability that the value of the portfolio will decrease
more than the loss obtained by the Value-at-Risk-level.
1. The Variance-Covariance-Approach
The Variance-Covariance Method measures the standard deviations
(volatility) and correlations of market variables (so-called risk factors) from
historical price data. Each single position in a portfolio is attributed to a risk
factor and the amount of stock in each risk factor is multiplied by its volatility.
This resulting vector is then multiplied by the Covariance Matrix to give the
value at risk of the entire portfolio. Multiplying the result by 2,33 scales the
VAR from one standard deviation to a 99 % confidence interval (see
appendix 1).
The Variance-Covariance-Matrix is the basis of these methods outlined. It
summarizes the stochastic relationship between the various risk factors.
Changes in volatilities of risk factors and their correlation coefficients give
information about the effect one risk factor has on another risk factor.
The Variance-Covariance-Approach is an extension of Markowitz’ portfolio
theory. Markowitz developed portfolio theory only for linear pricing functions.
Directly applying Markowitz’ portfolio theory to option bearing positions
requires a linear approximation of these pricing functions and thus neglects
gamma effects. Regulators require that Internal Models from market risk

176
measurement include convexity risks. Different alternatives exist to
accomplish this task. The easiest one is to calculate separately the convexity
risk (gamma) and to add it to the calculated linear risk, known as Delta Plus
Approach.
2. Historical Simulation
The Historical Simulation produces a list of profits and losses that a
portfolio would have experienced if the current portfolio would have been held
over predefined historical time periods. From the list of profit and losses the 1
% Value-at-Risk is determined by choosing the 1 % worst loss. Although this
method is easy to understand it has certain draw-backs. Firstly it is focused
on the historical paths of market movements. Secondly it is time consuming to
recalculate the market value of each single position. This disadvantage can
be solved by doing delta/gamma approximations for the recalculation of
market values (appendix 2).
3. Monte-Carlo-Simulation
The Monte-Carlo-Simulation generates random numbers that are modified
to have the distributions defined by historical data and the estimated
volatilities and correlations. The model takes a set of possible values for each
of the market variables during each simulation run and uses those values to
calculate the corresponding prices for all positions. These simulations are
repeated normally for 10.000 to 20.000 times, each simulation gives a
representation of market-value.
Although the Monte-Carlo-Simulation takes a lot of computer time it is the
most advanced method for quantifying risk since it does not depend on one
historical time path (see appendix 3).
177
P. IrnDlementation
1. Requirements
After the decision for VAR the institution must decide on which positions
VAR is planned to calculate. The choices are either on single portfolios or
company wide. This question is closely connected with the most difficult task
for large houses to get the transaction data in a consistent manner. In
addition, historical market data, evaluation formulae for all products traded
and the implementation of at least one of the above mentioned Internal
Methods is needed. Finally one must decide on what kind of reports are
wanted and needed.
2. Transaction Data Base
In order to run a Value-at-Risk calculation on a portfolio, all transaction
data of this portfolio have to be available in a consistent manner. The choices
are either to use an existing inhouse data base or to buy from an external
vendor a data base which includes already the description of the products
traded or to use the shell of an open data base vendor. The decision criteria
are complex and include points like the quality of the already existing
transaction data base and its flexibility for a Value-at-Risk-calculation. Further
one has to judge realistically the capacities of the inhouse EDP resources
which are necessary to do inhouse developments. If one decides to buy a
ready-to-use data base from an external vendor it is most advisable to took to
software houses who offer derivative trading systems since their products
normally offer the broadest choice of products within their data bases.

178
3. Market data
As mentioned above at least one year of daily market data is needed for
each single risk factor an institution is trading in. Such a data base can be
collected by oneself but one has to consider that it is not a trivial task to do.
Especially when the number of risk factors is going into hundreds. It is more
advisable to get this data from either professional data base vendors like
DATA STREAM or REUTERS or from banks like DG BANK (via its GIS
information systems) or JP Morgan who offeres these data on different
computer networks.
4. Evaluation formulae
It is highly advisable that each institution knows exactly about the
evaluation methods of all products traded. Therefore it should be a minor task
to put these formulae together into the necessary software environment.
Alternatively, like the above mentioned question of transaction data bases,
derivative trading systems offer the widest choice of evaluation formulae for
all possible products traded.
5. Models
At least one of the so-called Base1 lnhouse Methods should be chosen
and implemented in order to calculate Value-at-Risk. The first method to
consider is clearly the Historical Simulation Method since it is easy to
understand and to communicate to relevant groups in one’s institution. No
statistical assumptions are made and therefore explaining lt needs no
statistical background. Especially investment houses, like insurance
companies who do not frequently trade and turnover their stock, can afford to
179
use the time consuming recalculation of each single position which is
necessary in the Historical Simulation.
The Variance-Covariance-Method becomes very complex to implement,
especially when option risks are included in the portfolio. Therefore this
method is only advisable when option risks do not dominate and when quick
and intra-day calculations are necessary.
The Monte-Carlo-Method clearly dominates the two other methods by the
quality of information. But depending on the finess of the implementation it
can become very time consuming and therefore not usable for intraday
calculations.
6. Reports
Especially for Value at-Risk reports it is essential to have not only one
single number showing the Value-at-Risk with a 99 % confidence interval for
the entire portfolio but to have at least an additional picture of the real
distribution of the outcomes of all run scenarios. Also interesting are reports
on other statistical values like largest portfolio loss or highest portfolio proffl
and predefined parameter or statistical stress test results.
Introducing the Value-at-Risk concept into an insurance company,
implementing the necessary software environment and starting to use
consequently risk numbers to go with the reported return numbers might be a
difficult but worthwile task to do. The concepts of modern portfolio theory
which do not work without risk numbers and the tendency to use Value-at-
Risk as an industry standard worldwide will force financial institutions to use

180
these numbers for their client reporting as well as their regulatory reporting.
Any insurance company who is implementing Internal Models now will have a
head start in this highly competitive business.

aw. 1
181
Y according to Variance-Covariaoce-Matr~ AR
time series of historical market data
1Oybonds 1Oybonds 7ybcnlds 7ybcnlds 5Y- 5Y- . . . .
29.12.95 29.12.95 632 632 6,07 6,07 5.33 5.33
26.12.95 26.12.95 6,29 6,29 6,05 6,05 5.30 5.30
27.12.95 27.12.95 6.25 6.25 6.01 6.01 5%25 5%25
I I vector of lOday matrix of sensitivities correlations
233 x
positions in portfolio
DM 20 MLN 7 % Pfandbrief WKN333666
DM 10 MLN Capped Floater
WKN444888
HFL 30 MLN Bond
I position per risk factor
sl cl,l; c1.2... s2 x . . . . . . . . . I][ 1
x p2JmJ
83 . . . . . . . . .
sn . . . . ..cn.n
- VAR B
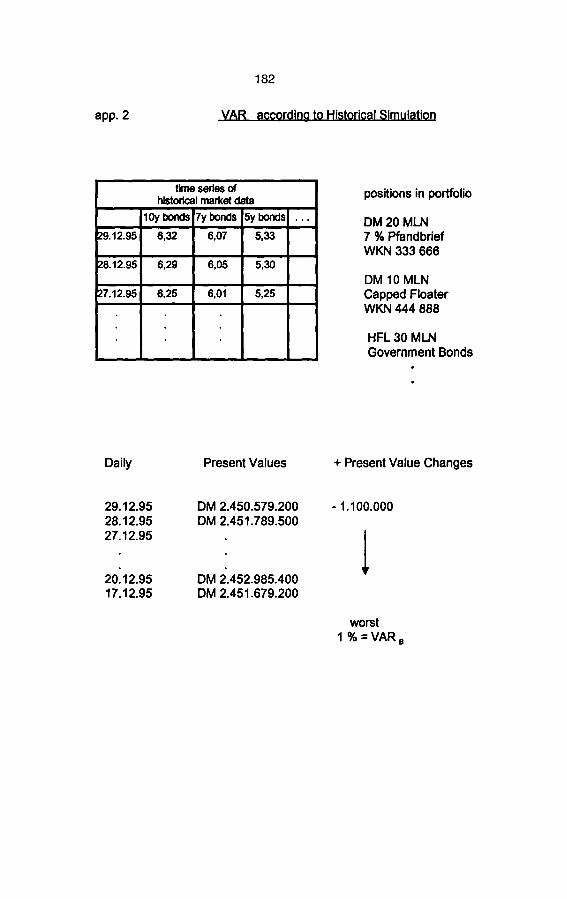
am. 2 VAR accordina to His&&al SimulatiQa
182
I time series af
historical market data I positions in portfolio
DM 20 MLN 7 % Pfandbrief WKN 333 666
DM IO MLN Capped Floater WKN 444 888
HFL 30 MLN Government Bonds
.
.
Daily Present Values + Present Value Changes
29.12.95 DM 2.450.579.200 - 1.100.000 28.12.95 DM 2.451.789.500 27.12.95
20:12.95 DM i.452.985.400 I
17.12.95 DM 2.451.679.200
worst 1% =VAR,

183
w. 3 VAR accrlo-SimW
time series of historical market data positions in portfolio
29.1235 632 6,07 533
28.12.95 6.29 6.05 5930
27.1235 6.25 6.01 525 127.12.Q5l 6.25 1 6.01 1 525 1 1
vector of 1 Oday r&ix of sensitivities correlations
233 n
b b
m-simulations
PV 1 PV2 ,-.
PV3 -
PVm
DM 20 MLN 7 % Pfandbrief WKN 333 666
DM 10 MLN Capped Floater WKN 444 888
HFL 30 MLN Bond
I position per risk factor
worst 1 %=VARB

184
References
l Basle Committee on Banking Supervision: “Proposal to issue a Supplement
to the Basle Capital Accord to Cover Market Risks”, Basle, April 1995
- CD Financial Technology Ltd: “VAR + User’s Guide”, Helsinki, March 1996
- DG BANK: “KAR General Design”, Frankfurt, March 1995
- DG BANK: “Financial Technology”, Frankfurt 1995