the value of barbados’ fisheries: a preliminary assessment
TRANSCRIPT

Barbados Fisheries Management Plan, Public Information Document No. 2 FMP-PID-2
THE VALUE
OF BARBADOS’ FISHERIES:
A preliminary assessment
Environmental Special Projects Unit
Ministry of Energy and theEnvironment
Fisheries Division
Ministry of Agriculture and RuralDevelopment
Centre for Resource Managementand Environmental Studies
University of the West Indies
August 2007


THE VALUE
OF BARBADOS’ FISHERIES:
A preliminary assessment
By
Robin Mahon1
Christopher Parker2
Travis Sinckler3
Stephen Willoughby2
Julieann Johnson2
1 Centre for Resource Management and Environmental Studies, University of the WestIndies, Cave Hill Campus, Barbados2 Fisheries Division, Ministry of Agriculture and Rural Development, Hincks Street,Bridgetown, Barbados3 Environmental Special Projects Unit, Ministry of Energy and the Environment, #1 Sturges,St. Thomas, Barbados (recently established as the Natural Heritage Department at the sameaddress)
This booklet was prepared by the Centre for Resource Management and EnvironmentalStudies (CERMES), University of the West Indies, Cave Hill Campus, Barbados in
collaboration with the Fisheries Division, Ministry of Agriculture and Rural Developmentand the Environmental Special Projects Unit, Ministry of Energy and the Environment.
The funds were provided by the Environmental Special Projects Unit
It should be cited as:
Mahon R., C. Parker, T. Sinckler and S. Willoughby and J. Johnson. 2007. The value ofBarbados’ fisheries: a preliminary assessment. Fisheries Division, Ministry of Agricultureand Rural Development, Barbados, Fisheries Management Plan Public InformationDocument No. 2: 24 pp.
Photographs: Cover clockwise from top left - Cast netting on the west coast (© Corrie Scott), Flyingfishbagged for sale (Tanya Staskiewicz), Grilled fish at Maria’s in Oistins (Robin Mahon), Longliner (TanyaStaskiewicz), Pulling a seine on the west coast © Corrie Scott), Bajan fish filleted and vacuum packed in thesupermarket (Robin Mahon); cover centre - cleaning fish in Oistins Market (Tanya Staskiewicz); page 4 – theBridgetown Fisheries Complex (BFC) harbour (Robin Mahon); page 5 – Skeete’s Bay fishing site (RobinMahon); page 7 – retrieving a gill net and deboning flyingfish (Fisheries Division); page 8 – Bajan fish productsin a St. Vincent supermarket (Robin Mahon) and seafood processing business (Tanya Staskiewicz); page 9 –iceboats and longliners in the BFC harbour (Robin Mahon); page 11 – offloading tuna at the BFC (ChristopherParker); page 13 – blue marlin (Greg Franklin) and seafood restaurant (Robin Mahon); page 15 – steaking fishat Weston (Lara Schuhmann); page 17 – wahoo, back when fish were big (Dudley Wiles); page 21 – pot fishingon the west coast (© Corrie Scott) and potfishes (Fisheries Division).

ii
SUMMARYThe value assigned to fisheries in the national economy is often based on the ex-vessel valueof the fish landed. As the fish moves through various market pathways to the consumer, itincreases in value with each transaction, and contributes to livelihoods. This additional valueshould be accounted for in assigning an economic value to fisheries and in determining theappropriate investment in management. A preliminary assessment of this additional valuewas carried out for the major fisheries of Barbados by: determining the pathways along whichfish move from fisher to consumer, amounts moving on each path, and price increase at eachstep. Overall, additional value was about US$19 M, and was about 2.6 times the landed valueof the fishery. This ranged from about 7.4 times the landed value for flyingfish to zero for seaurchins. The distribution of this additional value among reseller groups varied from being68% for restaurants, 20% for processors/exporters, 8% for fish frys, 3% for vendors and <1%for supermarkets. These results underscore the need to value fishery products broadly,especially in a tourism economy where seafood is important mainstay of restaurants and fishfry operations.
CONTENTS
INTRODUCTION .....................................................................................................................1
HOW THE VALUATION WAS DONE...................................................................................2
THE TOTAL VALUE OF BARBADOS’ FISHERIES ............................................................3
VALUATIONS FOR SPECIES AND SPECIES GROUP........................................................5
Flyingfish ...............................................................................................................................6
Dolphinfish ............................................................................................................................8
Tuna .....................................................................................................................................10
Billfishes (including blue marlin) ........................................................................................12
Swordfish .............................................................................................................................14
Kingfish................................................................................................................................16
Snapper ................................................................................................................................18
Shark and barracuda.............................................................................................................19
Lobster .................................................................................................................................20
Reef fishes (potfish).............................................................................................................21
Jacks (seine fish) ..................................................................................................................22
Bonito...................................................................................................................................23
All others..............................................................................................................................23
NEXT STEPS ..........................................................................................................................24
FURTHER READING ............................................................................................................24

INTRODUCTIONFishing and fish have been an importantpart of Barbadian commerce and culturefrom the earliest recorded times (Welch2005). The fishing industry has gonethrough many changes, particularly theoffshore fleet. In the late 1950s, the fleetconverted from sail to motor. The ‘ice-boat’ emerged in the 1980s and increasedthe fishing range of the fleet. The 1990ssaw the appearance of longliners, whichnow number 30 or more. This offshorefleet, targeting flyingfish and largepelagics such as dolphinfish, tuna,billfishes, and kingfish (mainly wahoo),has been the mainstay of the industry. Fishcomplexes at Oistins, Bridgetown, ConsetBay and Skeetes Bay have been builtprimarily to serve its needs. A processingindustry has emerged to clean, cut andpackage these products for local andexport markets.
Though small, the inshore fisheries are noless a part of Barbados’ fishing culture.Sea eggs, reef fishes (pot fish), snappersand brims, jacks and sprats are keyexamples of the resources harvested fromthe island shelf and the deeper waters of itsslope. Less important, but nonethelesscontributing to the overall fishery picturefor Barbados are lobster, conch andseamoss. These inshore resources aretaken by a variety of fishing methods --diving, spearfishing, handlines, traps, castnets and seines nets among them. Theinshore fleet comprises a large number ofsmall open vessels (moses). For a fullerdescription of the Barbados fishingindustry see Willoughby and Leslie(2000).
Fishing adds much to Barbadian life. Itprovides an important and readilyavailable source of food of the highestquality. It also provides a means oflivelihood for many people. Those whocatch fish, sell fish, and process anddistribute fish are estimated to numbermore than 6,000. Those who cook and
serve fish, whether in exclusiverestaurants, at fish frys or the numerousrum shops across the island have not beencounted. They all owe their living, eitherin whole or in part to these resources.Numerous others make a living bysupporting the industry. Some build, selland maintain the boats, their engines andall the fishing and electronic equipmentthat they carry. Others sell and service thevehicles and equipment involved intransporting, processing and exportingfish.
The fishing industry is important in otherways as well. It provides an importantinput to the tourism industry. Flyingfish,dolphinfish, kingfish and tuna areperennial favourites with visitors.Recently, fish frys have emerged as amajor feature and attract large numbers oflocals and visitors. Fish exports are on theincrease, providing foreign revenue. Lastbut not least, when we consider the valueof the Barbadian fishing industry we musttake account of the colour and interest thatthe fishing industry adds to Barbadian lifeand culture. It fascinates locals and visitorsalike and inspires our artists. And there isthe Oistins Fish Festival.
Unfortunately, the true value of theBarbados fishing industry to the economyof Barbados has never been properlyassessed. Only the ex-vessel value of thefish landings is reflected under fisheries inthe GDP estimates of Barbados. Clearly,as fish passes from hand to hand alongvarious pathways and finally to consumerthere is considerable value added along theway. To obtain a true picture of themarket value of the fishing industry, thisadded value must be included.
In this report we make a preliminaryattempt to assess the added value by:
Identifying the pathways along whichfish and fish products flow.

2
Estimating the value and value addedof fish and fish products at each stagein each path.
Our findings are illuminating. The ex-vessel value turns out to be only 20% ofthe total value, when value added iscounted.
We re-emphasise that fisheries may alsohave considerable value in several otherways that this study has not explored.These include:
The value of the support services to thefishing industry;
The value of fishing and fish productsin attracting visitors to the island;
The value of fish as food inmaintaining the health of Barbadians,and thus educing health costs; or
The value of fisheries in the cultureand identity of Barbadians.
Each of these can be assessed usingappropriate methods. The value of theseshould be estimated as soon as possible.
HOW THE VALUATION WAS DONEThe steps were: (1) to construct for eachfishery type a diagram showing thepathways that fish follow from the fisherto the consumer; then (2) starting with thetotal estimated landings in each fisherytype, estimate the percentage that movesalong each pathway. This was doneseparately for each type of fishery becausein different types of fisheries, productsmay follow different pathways, or thesame pathways in different proportions.The average annual landings for the five-year period 1999 to 2003 were used in thisstudy.
Finally, the price that the fishery productwas sold for at each step along the pathwas estimated. The sale of fish from thefisherman to the first buyer provides thelanded or ex-vessel value of the fish. Ateach step after that, the difference betweenthe purchase price of the fish and itsselling price gives the price increase orvalue added. By multiplying the totalamount of fish by the value-added perkilogram, the total value added wasestimated. When fish was actuallyprocessed or changed form by cleaning,deboning or preparation for cooking a 20%loss figure was applied to account forunused parts.
The accuracy of the estimates of value is amatter of concern. Much of the
information required was available fromrecords at the Fisheries Division, or wasobtained from interviews with FisheriesDivision staff. The Fisheries Divisionroutinely collects information on totalamounts of fish landed and on sellingprices at major landing sites. Theirestimates of total landings by category arethe starting point for this valuation. Thisinformation was supplemented byconducting surveys of a variety of sourcesincluding: fish boners, scalers, vendors andhawkers, processors, restaurants andhotels, supermarkets and fish-fry vendors.Surveys were carried out on the south andwest coasts of the island, with three hotelsand five restaurants surveyed on eachcoast. The sample population was derivedfrom the hotels and restaurants catering toa broad base of clientele, i.e. local andforeign. Prices used are annual averages.These are known to vary seasonally, but itwas beyond the scope of this project toattempt a seasonal breakdown.
The estimate for sea urchins was derivedfrom data provided by McConney et al.(2003). It was based on estimated numbersof full-time and part-time fishers and theiraverage respective earnings per season asreported in a survey. Owing to problemswith willingness of fishers to provideinformation on earnings and uncertainty

3
regarding numbers, and designation ofpart-time and full-time status, this estimateis considered to be one of the least reliable.
Two types of fishery are missing from thisvaluation study, because the products areseldom sold in the regular market places.These are conch and small inshorepelagics called ‘sprats’. There are nosubstantial conch resources in Barbados,although conch can be found scattered
throughout the island shelf whereverappropriate habitats occur. When diversencounter these they are taken and soldlocally to known buyers or to restaurants.Sprats, likewise are sold locally toconsumers on the beach or as bait. Thereare no data for these fisheries from whichto develop estimates. Since most is solddirectly from fisher to consumer, thevalue-added is likely to be minimal.
THE TOTAL VALUE OF BARBADOS’ FISHERIESThis study shows that the total value of thefish landed in Barbados is considerablygreater than its ex-vessel value (Table 1).The value added component ranges from0% in the case of the ‘all others’ categoryto 88% of the total value in the case of
flyingfish. It is higher for offshorefisheries, the catch of which is processed,exported and is the main attraction at fishfrys and restaurants, than it is for inshorefisheries, the catch of which is most oftensold directly to consumers.
Table 1. The value added for different fisheries (BDS$)
Fish Type Ex-vessel value Value added
(% of total)
Overall value
Flyingfish 3,588,498 26,648,676 (88) 30,237,174
Dolphinfish 5,005,384 6,002,346 (55) 11,007,731
Tuna 1,402,850 2,435,389 (63) 3,838,239
Billfishes 615,609 654,605 (52) 1,270,214
Swordfish 193,043 123,037 (390 316,080
Kingfish 266,918 184,283 (410 451,201
Subtotal - offshore 11,072,302 36,048,336 (77) 47,120,638
Snappers 164,301 245,929 (60) 410,229
Shark and barracuda 89,441 84,633 (49) 174,074
Lobster 7,867 7,775 (50) 15,642
Jacks 59,252 33,796 (36) 93,048
Bonito 9,771 9,369 (49) 19,139
Reef fishes 89,314 56,056 (39) 145,370
Sea eggs 2,775,000 0 (0) 2,775,000
All others 402,095 57,780 (13) 459,875
Subtotal - coastal 3,597,041 495,338 (12) 4,092,379
Total 14,669,343 36,543,674 (71) 51,213,017
When the value-added is broken outaccording to who sells the fish and towhom, it shows that the majority of theadditional value is derived from sale ofcooked fish to consumers in restaurants
and at fish frys (Table 2). Vendors andprocessors (however) generate appreciableamounts of additional values as theytransport, clean and market fish.

3
Table 2. The value added by different sellers according tocategory of buyer (BDS$).
Seller Buyer Value added($BDS)
(%)
Vendor Consumer 464,399 1.3
Fish fry 189,494 0.5
Restaurant 525,350 1.4
Subtotal 1,179,243 3.2
Processor Consumer 383,866 1.1
Export 1,583,735 4.3
Fish fry 182,915 0.5
Restaurant 4,638,553 12.7
Supermarket 490,337 1.3
Subtotal 7,279,406 19.9
Restaurant Consumer 24,819,781 67.9
Fish fry Consumer 3,118,813 8.5
Subtotal 27,938,595 76.5
Supermarket Consumer 146,430 0.4

5
VALUATIONS FOR SPECIES AND SPECIES GROUPThe results of the survey are displayed inthe form of path diagrams and value addedtables for each species or fishery group.
In the path diagrams, the percentages offish moving from each seller to the variousbuyers are shown. A dashed line is used toindicate path transactions in which the20% loss factor due to cleaning orprocessing was applied. The pathway fromexport to consumer is included forcompleteness, but no value added isestimated for this path.
The value added table for each species orgroup shows the actual quantities andprices of fish as it passes from one form toanother and one path component toanother.
Flyingfish and large pelagics had the mostcomplex pathways, often involving export.Coastal resources that were most oftensold directly to consumers had the simplestpathways.

6
Flyingfish
Flyingfish is the mainstay of the fishingindustry, comprising about 63% of thelandings. Note the large proportion of fishgoing to processors that then goes on to
high valued-added markets, i.e. hotels,restaurants and export.
FISHER
VENDORS/HAWKERS
PROCESSORS
CONSUMERS
RESTAURANTS
FISH FRY
1%
9%
25%
21%
45%
54%1%
4%
100%
100%
100%
SUPERMARKETSEXPORT MARKET
86% 8%
100%
46%

7
Table 3. Estimation of the value added and overall value for flyingfish (BDS$)
Fis
hfo
rm
Seller BuyerProportion
(%)
Amount
(kg)Price
(BDS $)
Pricedifference(BDS $)
Value/
valueadded
(BDS $)
Vendors/hawkers 25 378,669 2.53 958,032
Processors 45 670,870 2.02 1,355,157
Fish fry 9 134,174 2.89 387,763Fisher
Consumer 21 307,109 2.89 887,546Wh
ole
Total Landings (kg) 1,490,822 Landedvalue
3,588,498
Restaurants 46 174,188 6.30 3.77 656,687Vendors/Hawkers Consumer 54 204,481 3.54 1.01 206,526
Consumer 1 6,709 10.59 8.57 57,494
Restaurants 86 576,948 9.70 7.68 4,430,962
Supermarkets 8 53,670 9.10 7.08 379,981
Fish fry 1 6,709 9.30 7.28 48,839
Processors
Export Market 4 25,158 9.56 7.54 189,688
Deb
on
ed
Supermarket Consumer 100 29,518 10.59 1.49 43,982
Restaurants Consumer 100 751,136 $43.85 $34.15 25,651,286
Fish fry Consumer 100 159,332 $22.36 $12.80 2,039,444
Co
ok
ed
Supermarket Consumer 100 24,151 $18.97 $9.87 238,373
Value added by deboned and cooked flyingfish 33,943,263
Overall value of flyingfish fishery outputs 37,531,761

8
Dolphinfish
Dolphinfish is next most important singlespecies after flyingfish at about 21% of thetotal landings. It is an important food fishspecies throughout the Caribbean region aswell as an important component of
recreational fisheries. This resource isshared with our neighbors and itssustainability may be at risk as there is noarrangement for collaboration inmanagement of the fishery.

9
Table 4. Estimation of the value added and overall value for dolphinfish (BDS$)
Fis
hfo
rm Seller BuyerProportion
(%)
Amount
(kg)Price
(BDS $)
Pricedifference(BDS $)
Value/
valueadded
(BDS $)
Vendors/hawkers 29 146,967 10.17 1,494,652
Processors 56 283,798 9.15 2,596,751
Fish fry 8 40,543 11.65 472,321
Fisher
Consumer 7 35,475 12.45 441,661Wh
ole
fish
Total Landings(kg) 506,782 Landed Value 5,005,384
Fish frys 43 63,196 11.67 1.50 94,794Vendors/Hawkers Consumer 57 83,771 12.45 2.28 190,998
Consumer 16 45,408 16.47 7.32 332,384
Restaurants 48 136,223 15.46 6.31 859,567
Supermarkets 10 28,380 14.96 5.81 164,887
Fish fry 6 17,028 14.56 5.41 92,121
Processors
Export market 20 56,760 25.35 16.20 919,505
Deb
on
ed
Supermarkets Consumer 65 18,447 16.65 5.00 92,234
Restaurants Consumer 100 136,223 49.50 34.04 4,637,031
Fish fry Consumer 100 79,689 22.87 11.20 892,516
Co
ok
ed
Supermarket Consumer 100 9,933 14.17 1.72 17,085
Value added by deboned and cooked dolphin fish 8,293,122
Overall value of dolphinfish fishery outputs 13,298,506

10
Tuna
This is primarily yellowfin tuna which isdistributed throughout the Atlantic Oceanand fished by vessels from many countries.This species is targeted mainly by the
longline fleet. It is a valuable exportcommodity especially when carefulhandling at sea and ashore is practiced toensure a high grade fresh product.
FISHER
VENDORS/HAWKERS
PROCESSORS&
EXPORTERS
CONSUMERS
RESTAURANTS
FISH FRY
4%
6%
17%
7%
70%
48%52%5%
28%
100%
100%
SUPERMARKETSEXPORT MARKET
49%9%
100%

11
Table 5. Estimation of the value added and overall value for tuna (BDS$)
Fis
hfo
rm
Seller BuyerProportion
(%)
Amount(kg)
Price(BDS $)
Pricedifference(BDS $)
Value/
valueadded
(BDS $)
Vendors/hawkers 17 26,125 9.10 237,740
Processors 70 107,575 8.90 957,414
Fish fry 6 9,221 10.31 95,065
Fisher
Consumer 7 10,757 10.47 112,631
Total Landings (kg) 153,678 Landed Value 1,402,850Wh
ole
fish
Processors Export market 28 30,121 30.76 21.86 658,443
Fish fry 48 12,540 10.65 1.55 19,437Vendors/hawkers Consumer 52 13,585 11.47 2.37 32,197
Consumer 5 5,379 10.59 1.69 9,090
Restaurants 49 52,712 14.87 5.97 314,688
Supermarkets 9 9,144 12.10 3.20 29,260
Processors
Fish fry 9 9,682 12.30 3.40 32,918
Deb
on
ed
Supermarkets Consumer 100 5,486 17.15 5.05 27,706
Restaurants Consumer 100 52,712 3.35 38.48 2,028,341
Fish fry Consumer 100 9,682 $23.50 11.20 108,435
Co
ok
ed
Supermarkets Consumer 100 3,658 19.65 7.55 27,614
Value added by deboned and cooked tuna 3,288,129
Overall value of tuna fishery outputs 4,690,978

12
Billfishes (including blue marlin)
Billfishes are among the most depletedlarge pelagic species in the Atlantic Ocean.Consequently, they cannot be exported tothe USA and are consumed locally. They
are also targeted by sportfishers especiallythe charter boats that serve the tourismindustry.
FISHER
VENDORS/HAWKERS
PROCESSORS
CONSUMERS
RESTAURANTS
FISH FRY
16%
21%
21%
20%
38%
74%26%26%
48%
100%
100%
100%
SUPERMARKETS
10%

13
Table 6. Estimation of the value added and overall value for billfishes (including bluemarlin) (BDS$)
Fis
hfo
rm
Seller BuyerProportion
(%)
Amount(kg)
Price(BDS $)
Pricedifference(BDS $)
Value/valueadded
(BDS $)
Vendors/hawkers 21 13,944 8.92 124,377
Processors 38 25,231 8.35 210,681
Fish fry 21 13,944 9.93 138,460
Fishermen
Consumer 20 13,280 10.70 142,092Wh
ole
Total Landings (kg) 66,398 Landed Value 615,609
Fish fry 74 10,318 13.67 4.75 49,012Vendors/Hawkers Consumer 26 3,625 14.45 5.53 20,048
Consumer 26 6,560 16.96 8.61 56,483
Restaurants 48 12,111 16.53 8.18 99,068
Supermarkets 10 2,523 16.57 8.22 20,740
Processors
Fish fry 16 4,037 16.54 8.19 33,063
Deb
on
ed
Supermarkets Consumer 100 2,271 23.85 7.28 16,532
Restaurants Consumer 100 12,111 60.20 43.67 528,887
Fish fry Consumer 100 13,944 22.87 6.33 88,263
Co
ok
ed
Supermarket Consumer 100 1,328 25.56 8.99 11,938
Value added by deboned and cooked billfish 924,033
Overall value of billfsh fishery outputs 1,539,642

14
Swordfish
Swordfish are a highly prized food fish butthe Atlantic stocks have been severelydepleted. Consequently, there is stringent
management by the InternationalCommission for Conservation of AtlanticTunas aimed at rebuilding stocks.
FISHER
VENDORS/HAWKERS
PROCESSORS
CONSUMERS
RESTAURANTS
FISH FRY
16%
11%
16%
15%
58%
74%26%26%
48%
100%
100%
100%
SUPERMARKETS
10%

15
Table 7. Estimation of the value added and overall value for swordfish (BDS$)
Fis
hfo
rm
Seller BuyerProportion
(%)
Amount(kg)
Price(BDS $)
Pricedifference(BDS $)
Value/
valueadded
(BDS $)
Vendors/hawkers 16 1,831 17.65 32,315
Processors 58 6,637 16.10 106,855
Fish frys 11 1,259 17.90 22,531
Fishermen
Consumer 15 1,716 18.26 31,342
Wh
ole
fish
Total Landings (kg) 11,443 Landed Value 193,043
Fish frys 74 1,355 18.67 1.02 1,382Vendors/
Hawkers Consumer 26 476 19.25 1.60 762
Consumer 26 1,726 21.00 4.90 8,455
Restaurants 48 3,186 21.67 5.57 17,745
Supermarkets 10 664 21.96 5.86 3,889
Deb
on
ed
Processors
Fish fry 16 1,062 21.00 4.90 5,203
Restaurants Consumer 100 3,186 58.92 37.25 118,668
Fish fry Consumer 100 3,675 27.50 6.50 23,891
Co
ok
ed
Supermarket Consumer 100 601 24.87 2.91 1,748
Value added by deboned and cooked swordfish 181,744
Overall value of swordfish fishery outputs 556,531

16
Kingfish
This group comprises mainly wahoo, butalso includes some true kingfish and ceromackerel. These species are an important
component of the small-scale fisheries inthe eastern Caribbean
FISHER
VENDORS/HAWKERS
PROCESSORS
CONSUMERS
RESTAURANTSSUPERMARKETS
FISH FRY
16%
22%
21%
9%
48%
64%36%26%
48%
10%
100%
100%
100%

17
Table 8. Estimation of the value added and overall value for kingfish (BDS$)
Fis
hfo
rm
Seller BuyerProportion
(%)
Amount(kg)
Price(BDS $)
Pricedifference(BDS $)
Value/valueadded
(BDS $)
Vendors/hawkers 21 5,874 9.49 55,741
Processors 48 13,426 9.15 122,844
Fish fry 22 6,153 9.90 60,919
Fishermen
Consumer 9 2,517 10.89 27,413Wh
ole
Total Landings (kg) 27,970 Landed Value 266,918
Fish frys 64 3,759 11.90 $2.41 9,060Vendors/Hawkers Consumer 36 2,115 12.89 $3.40 7,189
Consumer 26 3,491 13.67 $4.52 15,778
Restaurants 48 6,444 15.67 $6.52 42,017
Supermarkets 10 1,343 13.96 $4.81 6,458
Deb
on
ed
Processors
Fish fry 16 2,148 13.00 $3.85 8,270
Supermarket Consumer 100 940 18.38 $4.42 4,154
Restaurants Consumer 100 6,444 38.20 $22.53 145,190
Fish fry Consumer 100 6,153 15.66 $2.66 16,368
Co
ok
ed
Supermarket Consumer 100 403 19.56 $5.60 2,256
Value added by deboned and cooked kingfish 256,739
Overall value of kingfish fishery outputs 523,656

18
Snapper
Table 9. Estimation of the value added and overall value for snapper (BDS$)
Fis
hfo
rm
Seller BuyerProportion
(%)
Amount
(kg)Price
(BDS $)
Pricedifference(BDS $)
Value/valueadded
(BDS $)
Vendors/hawkers 35 5,426 9.62 52,199
Processors 45 6,976 10.65 74,298
Consumer 19 2,946 12.10 35,641
Fisher
Restaurants 1 155 13.95 2,163
Total Landings (kg) 15,503 Landed Value 164,301Wh
ole
fish
Processors Restaurants 1 70 14.96 4.31 64
Vendors/Hawkers
Consumer 100 5,426 12.10 2.48 13,457
Consumer 3 209 11.36 0.71 149
Restaurants 88 6,139 15.76 5.11 31,371Processors
Supermarkets 9 628 18.96 8.31 5,218Deb
on
ed
Supermarket Consumer 100 628 20 1.04 653
Co
ok
-ed Restaurants Consumer 100 6139 67.60 51.84 318,256
Value added by deboned and cooked snapper 368,514
Overall value of snapper fishery outputs 901,329

19
Shark and barracuda
Table 10. Estimation of the value added and overall value for shark and barracuda(BDS$)
Fis
hF
orm
Seller BuyerProportion
(%)Amount
(kg)Price
(BDS $)
Pricedifference(BDS $)
Value/valueadded
(BDS $)
Vendors/hawkers 50 4,888 6.75 32,991
Fish fry 15 1,466 10.65 15,616
Restaurants 10 978 10.65 10,410
Fisher
Public consumer 25 2,444 12.45 30,425Wh
ole
fish
Total Landings (kg) 9,775 Landed Value 89,441
Fish frys 17 249 11.67 4.92 1,226
Deb
on
ed
Vendors/Hawkers Public consumer 83 1,217 12.45 5.70 6,937
Fish fry Consumer 100 249 31.50 20.85 5,197
Co
ok
-ed
Restaurants 100 978 56.70 46.05 45,014
Value added by deboned and cooked shark and barracuda 58,374
Overall value of shark and barracuda fishery outputs 147,815

20
Lobster
Table 11. Estimation of the value added and overall value for lobster (BDS$)
Fis
hF
orm
Seller BuyerProportion
(%)Amount
(kg)Price
(BDS $)
Pricedifference(BDS $)
Value/valueadded
(BDS $)
Vendors/Hawkers 45 182 19.00 3,463
Consumer 20 81 22.00 1,782
Fisher
Processors 35 142 18.50 2,622
Total Landings (kg) 405 Landed Value 7,867
Restaurants 76 108 43.50 25.00 2,693Processors
Supermarkets 24 34 44.20 25.70 874
Vendors/
Hawkers
Consumer 100 182 24.00 5.00 911
Wh
ole
Supermarkets Consumer 100 34 56.00 11.80 401
Co
ok
-ed Restaurants Consumer 100 108 97.00 53.50 5,764
Value added by re-sale of whole and cooked lobster 10,644
Overall value of lobster fishery outputs 29,276

21
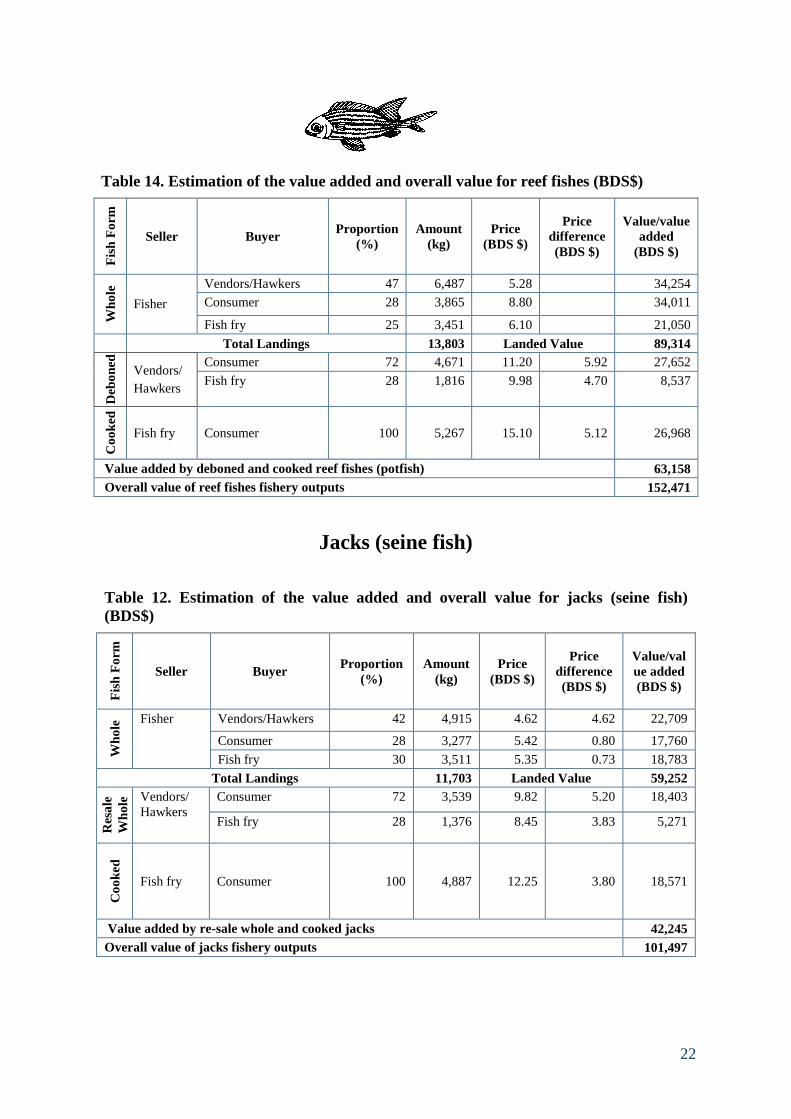
Reef fishes (potfish)
It is generally accepted that the reef fishstocks on the south and west coast of theisland are depleted. Estimates from othersimilar areas indicate that we should beable to get somewhere in the range of 390-530 metric tons of reef fishes a years forthe entire island. Even towards the lowerend of this range (about 400 mt/yr),current catches are far short of that. If the
state of depletion is due to overfishing,then fishers and consumers stand to gainconsiderably if the stocks are rebuilt.
As an added benefit there would be agreater abundance and variety of fishes onthe reefs, in particular the species whichare attractive for snorkelers and divers.Therefore, the tourism industry would alsobenefit from rebuilding.
22
Table 14. Estimation of the value added and overall value for reef fishes (BDS$)
Fis
hF
orm
Seller BuyerProportion
(%)Amount
(kg)Price
(BDS $)
Pricedifference(BDS $)
Value/valueadded
(BDS $)
Vendors/Hawkers 47 6,487 5.28 34,254
Consumer 28 3,865 8.80 34,011
Wh
ole
Fisher
Fish fry 25 3,451 6.10 21,050
Total Landings 13,803 Landed Value 89,314
Consumer 72 4,671 11.20 5.92 27,652
Deb
on
ed
Vendors/
HawkersFish fry 28 1,816 9.98 4.70 8,537
Co
ok
ed
Fish fry Consumer 100 5,267 15.10 5.12 26,968
Value added by deboned and cooked reef fishes (potfish) 63,158
Overall value of reef fishes fishery outputs 152,471
Jacks (seine fish)
Table 12. Estimation of the value added and overall value for jacks (seine fish)(BDS$)
Fis
hF
orm
Seller BuyerProportion
(%)Amount
(kg)Price
(BDS $)
Pricedifference(BDS $)
Value/value added(BDS $)
Vendors/Hawkers 42 4,915 4.62 4.62 22,709
Consumer 28 3,277 5.42 0.80 17,760
Wh
ole
Fisher
Fish fry 30 3,511 5.35 0.73 18,783
Total Landings 11,703 Landed Value 59,252
Consumer 72 3,539 9.82 5.20 18,403
Res
ale
Wh
ole Vendors/
HawkersFish fry 28 1,376 8.45 3.83 5,271
Co
ok
ed
Fish fry Consumer 100 4,887 12.25 3.80 18,571
Value added by re-sale whole and cooked jacks 42,245
Overall value of jacks fishery outputs 101,497

23
Bonito
Table 13. Estimation of the value added and overall value for bonito (BDS$)
Fis
hF
orm
Seller BuyerProportion
(%)Amount
(kg)Price
(BDS $)
Pricedifference(BDS $)
Value/valueadded
(BDS $)
Vendors/Hawkers 37 630 5.08 5.08 3,199
Public Consumer 30 511 6.16 1.08 3,145
Fisher
Fish fry 33 562 6.10 1.02 3,426Wh
ole
Total Landings 1,702 Landed Value 9,771
Public consumer 65 409 11.58 6.50 2,661
Deb
on
ed
Vendors/Hawkers Fish fry 35 220 11.58 6.50 1,433
Co
ok
ed
Fish fry Consumer 100 782 15.84 9.74 7,617
Value added by deboned and cooked bonito 11,711
Overall value of bonito fishery outputs 21,481
All others
Table 15. Estimation of the value added and overall value for all others (BDS$)
Fis
hF
orm
Seller BuyerProportion
(%)Amount
(kg)Price
(BDS $)
Pricedifference(BDS $)
Value/valueadded
(BDS $)
Vendors/Hawkers 40 23,959 6.08 145,672
Public Consumer 35 20,964 7.16 150,104Fisher
Fish fry 25 14,975 7.10 106,319Wh
ole
Total Landings 59,898 Landed Value 402,095
Public consumer 80 19,167 8.46 2.38 45,618
Deb
on
ed Vendors/Hawkers
Fish fry 20 4,792 8.58 2.50 11,980
Co
ok
ed
Fish fry Consumer 100 19,766 7.84 0.74 14,627
Value added by deboned and cooked fish 72,225
Overall value of all other fishery outputs 474,320

24
NEXT STEPSThis was a preliminary study with limitedtime and funds. Hence, several data gapswere identified. These will need furtherresearch.
Fish-fry vendors did not provide accessto records of their purchasing and re-sale practices therefore the estimatesare based on verbal information.
There are no records of landings forlobster, sea urchins and conch. Theseresources are considered high valuedby various players in the “value-addedchain”.
There is no information on otherestablishments such as rum shops andsmall restaurants that are known tofrequently sell fish. These warrantfurther investigation, as due to theirlarge numbers, they probably addsignificant overall value.
No information was obtained on thecontribution from food processorsmaking fish products.
Prices were averaged since there werea range of prices available for eachcategory of seller.
The locations of the survey should beextended, to receive a more
representative contribution from thefishery resources.
Consumers are varied and there is theneed for a better understanding of theircharacteristics.
This preliminary study has providedinsight into the apparent value of fisheriesto the national economy. It indicates thatthere is the need to fully investigate thisvalue in all its ramifications in order thatthe industry can receive support that isconsistent with its value.
In addition to refinement of thepreliminary estimates provided here andfilling of the gaps identified above, there isthe need to examine the value ofassociated supporting activities such as:
Fishing industry gear and equipmentsupply;
Vessel construction, repair andmaintenance;
Support for distribution and processingsystems.
We recommend that these be pursuedsystematically until the value of this vitalindustry is fully understood.
FURTHER READINGFisheries Division. 2001. BarbadosFisheries Management Plan. Ministry ofAgriculture and Rural Development,Barbados, 67 pp.
Mahon, R. and P. McConney. 2004 [ed].Management of large pelagic fisheries inCARICOM. FAO Fisheries TechnicalPaper No 464, 149 p.
McConney, P., R. Mahon and C. Parker.2003. Barbados case study: the sea eggfishery. Caribbean Coastal Co-management Guidelines Project.
Caribbean Conservation Association,Barbados. 75 pp.
Welch, P. L.V. 2005. Exploring the marineplantation: An historical investigation ofthe Barbados fishing industry. The Journalof Caribbean History 39: 19-37
Willoughby, S. and D. Leslie. 2000.Fishing gear of Barbados. Ministry ofAgriculture and Rural Development,Barbados, Fisheries Division Report FDR-002-2000, 41 p.