the value of food aid monetization: benefits, risks and best practices
DESCRIPTION
Informa Economics has released its study “The Value of Food Aid Monetization: Benefits, Risks and Best Practices (November 2012), showing multiple benefits to recipients.TRANSCRIPT

The Value of Food Aid Monetization: Benefits, Risks and Best Practices
Prepared for the:
Alliance for Global Food Security
Informa Economics 775 Ridge Lake Blvd. Suite 400 Memphis, TN 38120 Phone: 901.766.4669 www.informaecon.com
November 2012

i
TABLE OF CONTENTS
I. EXECUTIVE SUMMARY ................................................................................................. 1
II. INTRODUCTION........................................................................................................... 18
III. PROJECT SCOPE & METHODOLOGY ..................................................................... 19
A. SCOPE ........................................................................................................................ 19
B. METHODOLOGY ............................................................................................................ 19
1. Overview ................................................................................................................. 19
2. Key “Risks and Benefits” Study Questions & Methodology .................................... 20
3. Determination of Fair Market Value ........................................................................ 22
IV. FOOD AID & MONETIZATION OVERVIEW ............................................................... 28
A. OVERVIEW OF FOOD AID PROGRAMS AND MONETIZATION ................................................ 28
B. U.S. INTERNATIONAL FOOD AID PROGRAMS ................................................................... 29
C. POTENTIAL BENEFITS AND RISKS OF FOOD AID MONETIZATION ........................................ 35
V. THE GAMBIA – SOYBEAN OIL – INTERNATIONAL RELIEF AND DEVELOPMENT 37
A. FOOD AID OVERVIEW .................................................................................................... 37
1. The Gambia Food Aid Overview ............................................................................. 37
2. Program Overview: IRD – The Gambia – Soybean Oil Monetization ...................... 38
B. THE GAMBIA SOYBEAN OIL MONETIZATION RATIONALE ................................................... 39
1. Vegetable Oil Supply and Demand – Significant Demand & Insufficient Domestic Production .................................................................................................................. 39
2. Commercial Import Limitations and/or Additional Monetization Rationale .............. 40
C. IMPACT ON DOMESTIC MARKET ...................................................................................... 41
1. Price Impact ............................................................................................................ 41
2. Production .............................................................................................................. 43
3. Internal Market Development .................................................................................. 45
4. Consumers/Food Availability .................................................................................. 46
D. IMPACT ON COMMERCIAL TRADE ................................................................................... 47
E. DIRECT MONETIZATION COSTS AND REVENUES .............................................................. 49
F. THE GAMBIA CONCLUSIONS ........................................................................................... 50
VI. GUATEMALA – SOYBEAN MEAL – PROJECT CONERN INTERNATIONAL .......... 53
A. FOOD AID OVERVIEW .................................................................................................... 53
1. Guatemala Food Aid Overview ............................................................................... 53
2. Program Overview: PCI – Guatemala - Soybean Meal Monetization ..................... 54
B. GUATEMALA SOYBEAN MEAL MONETIZATION RATIONALE ................................................. 55
1. Soybean Meal Supply and Demand – Significant Demand & Insufficient Domestic Production .................................................................................................................. 55
2. Commercial Import Limitations and/or Additional Monetization Rationale .............. 56
C. IMPACT ON THE DOMESTIC MARKET ............................................................................... 57
1. Price Impact ............................................................................................................ 57
2. Production .............................................................................................................. 59

ii
3. Internal Market Development .................................................................................. 61
4. Consumers/Food Availability .................................................................................. 62
D. IMPACT ON COMMERCIAL TRADE ................................................................................... 64
E. DIRECT MONETIZATION COSTS AND REVENUES .............................................................. 66
F. GUATEMALA CONCLUSIONS ........................................................................................... 67
VII. LIBERIA – RICE – LAND O’ LAKES ......................................................................... 70
A. FOOD AID OVERVIEW .................................................................................................... 70
1. Liberia Food Aid Overview ...................................................................................... 70
2. Program Overview: Land O’ Lakes – Liberia – Rice ............................................... 71
B. LIBERIA RICE MONETIZATION RATIONALE ....................................................................... 72
1. Rice Supply and Demand – Sufficient Domestic Demand, Yet Insufficient Domestic Production .................................................................................................................. 72
2. Commercial Import Limitations and/or Additional Monetization Rationale .............. 74
C. IMPACT ON THE DOMESTIC MARKET ............................................................................... 75
1. Price Impact ............................................................................................................ 75
2. Production .............................................................................................................. 77
3. Internal Market Development .................................................................................. 80
4. Consumers/Food Availability .................................................................................. 80
D. IMPACT ON COMMERCIAL TRADE ................................................................................... 81
E. DIRECT MONETIZATION COSTS AND REVENUES – COST RECOVERY ................................. 84
F. LIBERIA CONCLUSIONS .................................................................................................. 85
VIII. MOZAMBIQUE – WHEAT – WORLD VISION .......................................................... 88
A. FOOD AID OVERVIEW .................................................................................................... 88
1. Mozambique Food Aid Overview ............................................................................ 88
2. Program Overview: World Vision – Mozambique - Wheat Monetization ................. 89
B. MOZAMBIQUE WHEAT MONETIZATION RATIONALE ........................................................... 90
1. Wheat Supply and Demand – Insufficient Domestic Production, Yet Sufficient Domestic Demand ...................................................................................................... 90
2. Commercial Import Limitations and/or Additional Monetization Rationale .............. 93
C. IMPACT ON DOMESTIC MARKET ...................................................................................... 94
1. Price Impact ............................................................................................................ 94
2. Production .............................................................................................................. 97
3. Internal Market Development .................................................................................. 99
4. Consumers/Food Availability ................................................................................ 100
D. IMPACT ON COMMERCIAL TRADE ................................................................................. 102
E. DIRECT MONETIZATION COSTS AND REVENUES ............................................................ 105
F. MOZAMBIQUE CONCLUSIONS ....................................................................................... 105
IX. UGANDA – WHEAT – ACDI/VOCA .......................................................................... 108
A. FOOD AID OVERVIEW .................................................................................................. 108
1. Uganda Food Aid Overview .................................................................................. 108
2. Program Overview: ACDI/VOCA – Uganda - Wheat Monetization ....................... 109
B. WHEAT MONETIZATION RATIONALE .............................................................................. 111
1. Wheat Supply and Demand – Insufficient Domestic Production ........................... 111

iii
2. Commercial Import Limitations and/or Additional Monetization Rationale ............ 113
C. IMPACT ON THE DOMESTIC MARKET ............................................................................. 113
1. Price Impact .......................................................................................................... 113
2. Production ............................................................................................................ 116
3. Internal Market Development ................................................................................ 118
4. Consumers/Food Availability ................................................................................ 119
D. IMPACT ON COMMERCIAL TRADE ................................................................................. 121
E. DIRECT MONETIZATION COSTS AND REVENUES ............................................................ 125
F. UGANDA CONCLUSIONS .............................................................................................. 125
X. CONCLUSIONS .......................................................................................................... 128
APPENDIX ...................................................................................................................... 130
A. COUNTRY PROFILES – SELECT MONETIZATION CASES .................................................. 130
B. LITERATURE REVIEW REFERENCES .............................................................................. 141

iv
List of Figures Figure 1: World Wheat Prices ............................................................................................ 23 Figure 2: World Rice Prices ............................................................................................... 24 Figure 3: Daily Average Freight Rates by Vessel Size ...................................................... 25
Figure 4: U.S. International Food Assistance Tonnages, FY 2006 - 2010 ........................ 34 Figure 5: U.S. International Food Assistance Funding, FY 2006 - 2010 ........................... 34 Figure 6: Vegetable Oil Production and Consumption in The Gambia .............................. 40 Figure 7: The Gambia – Soybean Oil - IRD: Price Received vs. Estimated Import Parity
Price ....................................................................................................................... 43
Figure 8: The Gambia Oil Crop Production & Monetized Soybean Oil Trends*................. 45 Figure 9: The Gambia Commercial Vegetable Oil & Monetized Soybean Oil Imports, Fiscal
Year ........................................................................................................................ 48 Figure 10: Guatemala – SBM – PCI: Price Received vs. Alternative Market Price Estimates
................................................................................................................................ 59 Figure 11: Guatemala Feed Grains/Meals: Production & Monetized Soybean Meal Trends*
................................................................................................................................ 61
Figure 12: Guatemala Per Capita Soybean Meal and Poultry Meat Consumption, 1961 - 2009 ........................................................................................................................ 63
Figure 13: Guatemala Commercial & Monetized Soybean Meal Imports, Fiscal Year ...... 65 Figure 14: 2007 Liberia Food Supply (kg/capita/yr) ........................................................... 74 Figure 15: Liberia – Rice - LOL: Price Received vs. Estimated Import Parity Price ........... 77
Figure 16: Liberia Rice and Related Product Crop Production & Monetization Trends* .... 79 Figure 17: Liberia – Monetized and Commercial Rice Imports .......................................... 82
Figure 18: Liberia’s Top Twenty Food Imports, in 2009. ................................................... 83 Figure 19: Top Crops Produced in Mozambique, by Volume ........................................... 91 Figure 20: 2007 Mozambique Food Supply (kg/capita/yr) ................................................ 92
Figure 21: Mozambique – Wheat – WV: Price Received vs. Estimated Import Parity Price................................................................................................................................ 97
Figure 22: Mozambique Wheat and Related Product Production & Monetization Trends *99 Figure 23: Mozambique Commercial & Monetized Wheat Imports by Fiscal Year .......... 103
Figure 24: Mozambique Cereal Imports. ......................................................................... 104 Figure 25: 2007 Uganda Food Supply (kg/capita/yr) ....................................................... 112 Figure 26: Uganda – Wheat – ACDI/VOCA: Price Received vs. Estimated Import Parity
Price ..................................................................................................................... 115 Figure 27: Uganda Wheat and Related Product Production & Monetization Trends* ...... 117 Figure 28: Uganda Commercial & Monetized Wheat Imports .......................................... 122 Figure 29: Uganda Cereal Imports, 2001-2010 ............................................................... 124 Figure 30: Uganda Food Imports, 2009 ........................................................................... 124

v
List of Tables Table 1: U.S. International Food Assistance Tonnage, FY 2006 – 2010, Metric Tons ..... 28 Table 2: U.S. International Food Assistance Funding, FY 2006 – 2010, Million U.S. Dollars
................................................................................................................................ 28
Table 3: PL480 Title II Appropriations, FY 2003 – 2013, Million U.S. Dollars ................... 31 Table 4: PL 480 Title II Funds, FY 2006 – 2010, Million U.S. Dollars ............................... 31 Table 5: Volume and Value of U.S. Soybean Oil Programmed for Monetization* for The
Gambia, Fiscal Years 2006-2010 ........................................................................... 38 Table 6: The Gambia Vegetable Oil Imports, Fiscal Years 2001 to 2010 .......................... 48
Table 7: Volume of The Gambia Vegetable Oil Imports .................................................... 49 Table 8: Value of The Gambia Vegetable Oil Imports ....................................................... 49 Table 9: Direct IRD Soybean Oil Monetization Costs & Revenues – The Gambia ............ 50 Table 10: Volume and Value of U.S. Soybean Meal Programmed for Monetization* for
Guatemala, Fiscal Years 2001-2011 ...................................................................... 54 Table 11: Guatemala’s Monetized Soybean Meal, Commercial Imports, and Monetized
Imports as Share of Total Imports, 2001 – 2011 ..................................................... 56
Table 12: Guatemala Soybean Meal Imports, Fiscal Years 2001 to 2011 ......................... 65 Table 13: Volume of Guatemala Soybean Meal Imports by Country of Origin .................. 65
Table 14: Value of Guatemala Soybean Meal Imports by Country of Origin ..................... 66 Table 15: Per Unit Price of Guatemala Soybean Meal Imports ......................................... 66 Table 16: Direct PCI Soybean Meal Monetization Costs & Revenues - Guatemala .......... 67
Table 17: Volume and Value of Rice Programmed for Monetization* in Liberia Fiscal Years 2006-2010 .............................................................................................................. 71
Table 18: Awardees for Rice Programmed for Monetization for Liberia ............................ 71 Table 19: Liberia Rice Supply and Demand (MT) ............................................................. 73 Table 20: Liberia Anticipated Import Requirements for 2011 Marketing Year ................... 83
Table 21: World Rice Exports to Liberia ............................................................................ 84 Table 22: World Rice Exports to Liberia ............................................................................ 84
Table 23: World Rice Exports to Liberia ............................................................................ 84 Table 24: Direct LOL Rice Monetization Costs & Revenues - Liberia ............................... 85
Table 25: Volume and Value of U.S. Wheat Programmed for Monetization* for Mozambique, Fiscal Years 2001-2010 ................................................................... 89
Table 26: Mozambique Wheat Supply and Demand (MT) ................................................ 91
Table 27: World Vision Mozambique Wheat Monetization – Number of Bidders, Buyers, Demand, and Quantity Sold .................................................................................... 95
Table 28: Mozambique Wheat Imports, Fiscal Years 2001 to 2010 ................................ 103 Table 29: Volume of Mozambique Wheat Imports by Country of Origin .......................... 103 Table 30: Value of Mozambique Wheat Imports by Country of Origin ............................. 104
Table 31: Direct WV Wheat Monetization Costs & Revenues - Mozambique.................. 105
Table 32: Volume and Value of US Wheat Programmed for Monetization for Uganda, Fiscal Years 2001-2011 ........................................................................................ 109
Table 33: Awardees for US Wheat Programmed for Monetization in Uganda Fiscal Years 2006-2011 ............................................................................................................ 109
Table 34: Uganda Wheat Supply and Demand (MT) ....................................................... 111 Table 35: Uganda’s Largest Wheat Millers (by Capacity) ............................................... 118

vi
Table 36: Uganda Wheat Imports, 2001 to 2011 ............................................................. 122 Table 37: Volume of Uganda Wheat Imports by Country of Origin .................................. 123
Table 38: Value of Uganda Wheat Imports by Country of Origin ..................................... 123 Table 39: Direct ACDI/VOCA Wheat Monetization Costs & Revenues - Uganda ............ 125

vii
DISCLAIMER This report was produced by Informa Economics, Inc. (“Informa”) for the Alliance for Global Food Security (“AGFS”). Informa has used the best and most accurate information available to complete this study. Informa is not in the business of soliciting or recommending specific investments. The reader of this report should consider the market risks inherent in any financial investment opportunity. While Informa has extended its best professional efforts in completing this analysis, the liability of Informa to the extent permitted by law, is limited to the professional fees received in connection with this project.

viii
Abbreviations and Terms Abbreviations ACDI/VOCA – a private voluntary organization registered with USAID AGFS – Alliance for Global Food Security CCC – Commodity Credit Corporation CBO – Community Based Organization CIF – Cost, insurance and freight CS – Cooperating Sponsor CDSO – Crude degummed soybean oil DAP – Development Assistance Program EMG – Emerging Markets Group ERS – Economic Research Service FAO – Food and Agriculture Organization of the United Nations FAS – Foreign Agricultural Service, U.S. Department of Agriculture FFE – Food for Education FFP – Food for Progress FFW – Food for Work FOB – Free on board GAO – U.S. Government Accountability Office GTIS – Global Trade Information System (same as Global Trade Atlas) IPP – Import parity price IRD – International Relief and Development ITSH – Internal transportation, storage and handling IDP – Internally displaced person LOL – Land O’ Lakes LRA – Lord’s Resistance Army MONCON – Monetization consortium MYAP – Multi-Year Assistance Program NAADS – National Agricultural Advisory Services NGO – Non-Governmental Organization PCI – a private voluntary organization registered with USAID, previously called “Project Concern International” PVO – Private Voluntary Organization SFP – School Feeding Program USDA – United States Department of Agriculture USAID – United States Agency for International Development WFP – United Nations World Food Program WV – World Vision Terms Throughout this report, all “tons” refer to metric tons (MT) and all “dollars ($)” refer to U.S. $, unless otherwise noted. The terms “agricultural commodity” and “commodity” are used interchangeably and they mean any agricultural commodity or the products thereof.

ix
The terms “cooperative,” “developing country,” “food security,” “nongovernmental organization,” and “private voluntary organization” have the same meanings given those terms in section 402 of the Food for Peace Act (7 U.S.C. 1732), as follows:
“COOPERATIVE.—The term ‘cooperative’ means a private sector organization whose members own and control the organization. and share in its services and its profits and that provides business services and outreach in cooperative development for its membership. DEVELOPING COUNTRY.—The term ‘developing country’ means a country that has a shortage of foreign exchange earnings and has difficulty meeting all of its food needs through commercial channels. (6) FOOD SECURITY.—The term ‘food security’ means access by all people at all times to sufficient food and nutrition for a healthy and productive life. (7) NONGOVERNMENTAL ORGANIZATION.—The term ‘nongovernmental organization’ means an organization that works at the local level to solve development problems in a foreign country in which the organization is located, except that the term does not include an organization that is primarily an agency or instrumentality of the government of the foreign country. (8) PRIVATE VOLUNTARY ORGANIZATION.—The term ‘private voluntary organization’ means a not-for-profit, nongovernmental organization (in the case of a United States organization, an organization that is exempt from Federal income taxes under section 501(c)(3) of the Internal Revenue Code of 1986) that receives funds from private sources, voluntary contributions of money, staff time, or in-kind support from the public, and that is engaged in or is planning to engage in voluntary, charitable, or development assistance activities (other than religious activities).”
The term “Bellmon analysis” is used to describe the analysis undertaken to make the determination required under section 403(a) of the Food for Peace Act:
“403(a) PROHIBITION.—No agricultural commodity shall be made available under this Act unless it is determined that—
(1) adequate storage facilities will be available in the recipient country at the time of the arrival of the commodity to prevent the spoilage or waste of the commodity; and (2) the distribution of the commodity in the recipient country will not result in a substantial disincentive to or interference with domestic production or marketing in that country.”
The term “cost recovery” is a measurement of total monetization revenues (cost per metric ton times total tonnage) divided by monetization costs (commodity procurement cost, foreign- flag freight cost, and, where applicable, inland transportation, storage and handling costs).

1
I. EXECUTIVE SUMMARY
The United States provides food aid overseas to promote development and food security and to address emergency needs. Most of the food commodities are distributed to recipients (86% in fiscal year 20101). In some cases, commodities may be ”monetized” – sold on the market or to the government of the recipient country and the proceeds used for development activities to improve agriculture, nutrition, livelihoods, access to education and food security, and to reduce vulnerability in crisis-prone regions. Net food-importing developing countries are the primary recipients. This study summarizes the potential risks and benefits of monetization and evaluates data from specific monetization cases against those potential risks and benefits. Best practices to minimize chances of adverse impacts on local production or markets and to avoid disruption of commercial trade also are identified. Two common criticisms of monetization found in the literature are summarized in the title of a June 2011 U.S. General Accountability Office (GAO) report: International Food Assistance: Funding Development Projects through the Purchase, Shipment, and Sale of U.S. Commodities is Inefficient and Can Cause Adverse Market Impacts. The basis for the GAO finding that food aid is “inefficient” is that the “cost recovery” of food aid monetization is generally less than 100% – e.g., the funds generated for development projects via the proceeds from monetization of the commodities are less than the costs incurred to procure and ship the commodities to recipient countries. However, this basic cost recovery formula only tells part of the story; it is not sufficient for determining the value of monetization to a recipient country. Cost recovery only places a value on the proceeds generated from the sale and does not take into account additional benefits that accrue from the provision of the commodity itself. GAO’s rationale for concluding that monetization “can result in adverse market impacts” is that there is insufficient and inconsistent collection of data by USAID and USDA to prove otherwise; a problem that can be addressed by better coordination between the agencies, a clearer description of what constitutes the “reasonable market price” for a commodity, and improved USAID and USDA data collection.2 In this study five food aid monetization cases were evaluated in detail to determine whether and how monetization adds value and creates benefits besides generating funds for conducting development activities.3 One of the primary research questions
1 GAO, June 2011. “International Food Assistance: Funding Development Projects through the Purchase,
Shipment, and Sale of U.S. Commodities is Inefficient and Can Cause Adverse Market Impact”. 2 Obtaining a “reasonable market price in the economy where the agricultural commodity is to be sold” is
a requirement for PL 480 Title II and Food for Progress programs in order to avoid disrupting world prices or normal patterns of commercial trade. See section 403(e) of the Food for Peace Act. 3 This study reviewed 19 monetization cases conducted by private voluntary organizations and
cooperatives. Five of the cases were chosen for in-depth analysis: two PL 480 Title II development programs, two Food for Progress programs and one McGovern-Dole International Food for Education and Child Nutrition program. Data and background information for the in-depth studies were collected from applications and reports submitted by implementing organizations to administrative agencies (USDA and

2
was: “Does monetization create benefits that would not have occurred with direct program funding?” In short, the answer was found to be “yes.” Monetization can lead to benefits beyond those that would be created via direct program funding by addressing credit, hard currency, small volume, and other constraints to buying on the international market, thereby creating business opportunities and increasing the availability of the commodity in the recipient country. The study also found that, due to the practices used when designing and implementing the five reviewed programs, (1) the sale of the commodities did not compete with or create disincentives to local production, (2) the sale of the commodities did not disrupt commercial trade, and (3) the sale was for a fair market value (e.g., the sales price received for the commodity was comparable to prevailing market prices for similar commodities in the country of sale), which helps mitigate the potential for market disruption. Best practices for determining the fair market value and collecting consistent data on monetization are described in this report. Study Questions The purpose of in-depth analysis of each of the five case studies was to answer the following questions about the potential risks and benefits of monetization: Was there sufficient domestic demand and insufficient domestic production to
warrant the monetization and importation of the chosen commodity?
Methodology Overview: This was evaluated by comparing historical production and consumption levels of the monetized commodity and related commodities in each of the evaluated countries.
Does food aid monetization provide benefits that would not be achieved with
alternative policy options (e.g., direct program funding)?
Does the monetization add to food availability and/or quality? And/or has monetization aided market development?
Is there another reason for monetization over alternative policy options (e.g., direct program funding)?
Methodology Overview: This evaluation was based primarily on interviews with program representatives from each of the reviewed countries, and, to a lesser extent, information from reports submitted by implementing agencies to USAID and USDA, as well as published evaluations and reports. The purpose was to identify potential credit, currency, volume and/or other market barriers that may prevent
USAID); additional sales and market information collected by those organizations during the course of program implementation; interviews with program representatives; data published or provided by USDA and USAID; independent, published evaluations of the programs; market analysis conducted by USAID contractors in the recipient countries (called the “Bellmon Estimation Studies for Title II” or “BEST,” http://www.usaidbest.org); and market and shipping information from widely used commercial sources.
3
buyers from purchasing the commodity or a similar quality product off of the open market. For example, in several of the evaluated cases small- or medium-sized buyers were disadvantaged in sourcing commodities because they could not purchase commercial-scale quantities on the open market. Volume constraints were analyzed by comparing freight costs for commercial-scale shipments with the costs that would have likely been incurred to ship the smaller volumes that would have been transacted by the in-country buyers.
Has the monetization had an adverse impact on domestic production of the monetized commodity and/or related products?
Methodology Overview: This was evaluated by comparing both the volumes and trends of monetization of the commodity against the in-country production of that commodity and/or related products. Two key statistics were evaluated: (1) the transaction volume of the monetized commodity relative to total domestic production of that commodity (both with and without related products included); and (2) whether there was any historical correlation that might indicate that the level of monetization had a negative impact on production.
Has the monetization disrupted commercial trade of the monetized commodity and/or related products?
Methodology Overview: This was evaluated by comparing both the volumes and trends of the monetized commodity against the total imports of that commodity and/or related products. Two key statistics were evaluated: (1) the transaction volume of the monetized commodity relative to total imports of that commodity and related products; and (2) whether there was any historical correlation that might indicate that the level of monetization had a negative impact on imports.4
What is the average direct cost recovery rate?
Methodology Overview: The “cost recovery rate” equals revenues from sales divided by the costs of procuring and shipping the commodity, plus other costs incurred in carrying out the monetization. Revenue and cost data were provided by implementing organizations, which had collected the information during the course of program implementation in each of the reviewed countries. “Revenues” equal the transaction price multiplied by the volume. “Costs” are the sum of the commodity procurement price (price of the commodity at the U.S. loading port), ocean freight cost (prevailing foreign-flag rate at the time of sale for shipping the cargo from the U.S. port to the destination port), and, when applicable, internal transportation, storage, and handling costs (any additional costs incurred by the program after the cargo reaches the destination port to deliver the product to the in-country buyer[s]). A three-year average cost recovery rate (revenues divided by costs) was utilized
4 The Global Trade Atlas, FAO and USDA databases were the primary sources of information to conduct
this review.

4
whenever three years of data were available. If the commodity was monetized for less than three years, then the average cost recovery rate for the entire program was used.
Key Conclusions/Findings In all evaluated cases monetization did not disrupt domestic production or the marketing of locally-produced commodities. Domestic production of the commodity chosen for monetization was insufficient to meet demand, which helps mitigate any potential disincentive to or interference with domestic production.5 In all of the cases analyzed within this study, the commodity chosen for monetization was consumed in significant amounts in the target country and national production was insufficient to meet the demand. As a result, the sales did not compete with local production or the marketing of locally-produced commodities. For example: in Gambia, where soybean oil was monetized, the country produces only 10% to 16% of its total vegetable oil demand. In Mozambique, where wheat was monetized, domestic wheat production accounts for roughly 1% of domestic demand. In some cases, an appropriate way to mitigate any potential disruption to local production and marketing is by timing the monetization to occur when domestic availability is particularly low (e.g., during the growing season) or demand is particularly high (e.g., before certain holidays). In all evaluated cases monetization did not disrupt commercial imports. Achieving a fair market value for the monetized commodity helps ensure that monetization does not interfere with commercial sales. Monetizing at levels that are low relative to total import volumes can also help avoid interfering with commercial sales, but in years when a low-income net food-importing country is unable to maintain typical commercial import levels due to economic stress or high world prices, keeping a low ratio of monetization to total imports is not necessarily beneficial. In the evaluated cases monetization transaction volumes were relatively small compared with total import volumes (10% or less). There was one case where total monetization volumes (from all programs) reached 10% of total import volumes (Mozambique), but it was found upon further evaluation, and supported by other studies, that monetization did not have an adverse impact on commercial imports.
5 Section 403(a)(2) of the Food for Peace Act states that no commodity can be provided under this Act,
unless “the distribution of the commodity in the recipient country will not result in a substantial disincentive to or interference with domestic production or marketing in that country." This provision applies to any commodity provided, whether for distribution or monetization, under PL 480 and Food for Progress, except for an emergency.

5
Informa found that overall, the level of commercial imports increased over time and monetization’s share of imports decreases. Moreover, because the Mozambican milling industry relies on imported wheat, when commercial imports declined by 153,512 MT from 2007 to 2008 due to high world prices, it would have been helpful to the domestic industry and consumers to increase the volume of monetization relative to commercial imports. Total monetization did increase that year, but only by 2,190 MT. Thus, while monetization of 10% or less of average import levels for the preceding three years is a useful guideline for avoiding interference with commercial trade, depending on the specific situation in the recipient country, levels above 10% may be warranted. All cases evaluated in this study achieved a “fair market value,” that is, the price was comparable to prices for similar quality products available on the market in the country where the sales took place, or, if limited volume is traded on the local market, the price that local buyers would have to pay to obtain similar quality products off of the world market. [See subheading that follows, entitled, Best Practices: Determination of the “Fair Market Value”.] Obtaining the fair market value minimizes the potential for any adverse impacts on the market or disruption of normal patterns of commercial trade, as required by section 403(e) of the Food for Peace Act.6 Monetization can address a variety of market constraints and thereby create business opportunities and increase food availability and/or improve access to more nutritious foods within the recipient country. The five cases demonstrated a number of ways that monetization can add value, compared to direct project funding, by addressing market constraints. Market constraints include the following: Credit Constraints – Limited access to financing prevents potential buyers from
purchasing commodities on the world market. Monetization provides those buyers with financing options. For example, monetization programs can offer more flexible payment terms than what is commercially available by not requiring an international letter of credit or allowing payment in installments, rather than full payment upon delivery. This benefit is highlighted in the Uganda, Mozambique and Liberia case studies. In Uganda ACDI/VOCA allowed buyers to buy the wheat in installments, which encouraged a wide variety of millers to participate and was particularly helpful to those with cash-flow limitations. The World Vision wheat monetization in
6 Section 403(e) of the Food for Peace Act, “World Prices,” stipulates:
“(1) IN GENERAL.—In carrying out this Act, reasonable precautions shall be taken to assure that sales or donations of agricultural commodities will not unduly disrupt world prices for agricultural commodities or normal patterns of commercial trade with foreign countries. (2) SALE PRICE.—Sales of agricultural commodities described in paragraph (1) shall be made at a reasonable market price in the economy where the agricultural commodity is to be sold, as determined by the Secretary or the Administrator, as appropriate.”
These provisions apply to any commodity provided, whether for distribution or monetization, under PL 480 and Food for Progress, except for an emergency.

6
Mozambique had credit terms that encouraged participation of smaller millers, giving them experience with commercial trade practices, while making the sales process more competitive to facilitate achievement of a fair market value. Payments for rice under the LOL program in Liberia were spread over a 120-day period from arrival in port, with a 15% advance payment.
Volume Constraints – For medium- and small-scale buyers, higher freight rates and
other costs associated with low-volume sales impede their ability to source commodities on the world market. Freight rates can increase by multiples of 2 or more when less than full-sized commercial volumes are procured. Monetization provides small- and medium-sized buyers access to the commodities at a landed price (e.g., cost, insurance and freight (CIF) price) that is comparable to prices a larger buyer would have paid for full-sized shipments of similar products. This benefit was highlighted in The Gambia (IRD), Uganda (ACDI/VOCA), Liberia (LOL), and Guatemala (PCI) case studies. In Uganda ACDI/VOCA stored imported wheat and buyers took delivery by truck, as needed. This enabled larger volumes per shipment to be brought in, thereby reducing freight rates.
Currency Risk Constraints – The risk of volatile exchange rates can prevent buyers
from purchasing on the global market. Monetization programs that allow buyers to purchase in local currency mitigate this risk. This benefit is highlighted in the evaluated Uganda and Mozambique case studies where monetization is conducted in local currency. A Uganda market analysis conducted by independent USAID contractors reported that “Title II wheat monetizations have played a pivotal role in developing a competitive domestic milling industry, by providing high-quality wheat under favorable sales contracts that are generally not available through regular commercial sales (including payment in Ugandan shillings).”7
Hard Currency Constraints – When sales are made in local currency, a country that
has limited hard currency reserves is able to import more food commodities without making a difficult tradeoff between food, fuel, and other necessary imported goods. Of the cases evaluated, payment was made in local currency for Uganda and Mozambique.
Price Constraints – The worldwide run up in commodity prices during late 2007 and
early 2008 made commercial commodity imports cost prohibitive for many net food-importing, developing countries. Monetization levels slightly increased in some countries to help fill the gap, although the amounts provided through monetization were too small to offset the declining imports. For example, due to the high price environment, total commercial wheat imports in Mozambique fell by 153,512 MT from 2007 to 2008, and total wheat imports for monetization only increased by 2,190 MT. In Uganda, from 2007 to 2008, commercial wheat imports fell 94,639 MT and total monetized wheat increased by 9,900 MT.
7 Fintrac. “USAID Office of Food for Peace Uganda Bellmon Estimation”. USAID. July 2011.

7
As described above, monetization helps overcome market constraints and thereby creates business opportunities and/or adds volume to the food available within the country. In some cases, overcoming these constraints improves the quality and/or nutritional value of the food available. For example, through IRD’s program in The Gambia, consumers had access that they would not otherwise have had to soybean oil, which has better nutritional value than the vegetable oils that are typically imported (which is higher in saturated fat). In Mozambique millers had the opportunity to produce higher quality flour by blending high-protein hard red winter and northern spring wheat varieties with the soft wheat varieties typically available in Mozambique. Well timed monetization deliveries can also even out food availability throughout the year, alleviating local market price volatility. In the Uganda program, shipments are planned to arrive when market supplies are low, helping to stabilize local prices. However, this important advantage can be disrupted if administrative agencies (USDA and USAID) are not able to order commodities to meet the schedules requested by implementing agencies For the McGovern-Dole International Food for Education and Child Nutrition program, cash support is not always made available for ITSH (internal transportation, storage and handling) and related costs. Therefore, monetization serves as a flexible funding tool when direct funding is not an option. For example, in the Guatemala Food for Education program implemented by PCI, soybean meal, a product that is growing in demand due to the expansion of poultry production, was monetized and the sales proceeds were used to support the ITSH costs of the school feeding program. The amount monetized was small compared to total import requirements: from 2009 through 2011, monetized soybean meal under this program averaged less than 3% of total soybean meal imports. Best Practices: Determination of the “Fair Market Value” As previously noted, all cases evaluated in this study achieved a “fair market value,” that is, the sales price was comparable to prices for similar quality products available on the market in the country where the sales took place, or, if limited volume is traded on the local market, the price that local buyers would have to pay to obtain similar quality products off of the world market. This was determined by an evaluation of the fair market value for the monetized commodity at the time the sales contract was signed. Obtaining the fair market value minimizes the potential for any adverse impacts on the market or disruption of commercial trade. Both USAID and USDA already require detailed reports from private voluntary organizations and cooperatives during the course of program implementation, including information about the monetization of commodities. Thus, the fair market value analysis can be included in those regular program reports.

8
There are two appropriate ways to determine the fair market value for a commodity that will be sold in a foreign country: (1) direct in-country market analysis and (2) determination of the “import parity price.” Both methods reflect best practices. Since circumstances vary by country and commodity, it is important that implementing organizations have the opportunity to use either method when determining the fair market value for a monetized commodity. Method 1 - Direct In-Country Market Analysis: Before a sales agreement is signed, implementing agencies conduct a market analysis to determine prevailing prices and market trends for the commodity and similar or substitute commodities in the country where it will be sold. This is completed by collecting information from a variety of sources, such as the port of entry, customs offices, wholesale markets and market participants. If reliable local price information is available, such data can be used to establish the fair market value, after adjusting for quality variations, as necessary. Quality adjustment can be made by looking at average price premiums and discounts on the world market between the evaluated qualities, focusing on prices in key exporting countries. Method 2 - Calculate the Import Parity Price: When, local price data is unavailable or unreliable, evaluating the import parity price (IPP) is a good way to determine the fair market value. The IPP represents the price that local buyers would have to pay to obtain similar quality products off the world market. Since transactions between major buyers and sellers at primary export points are relatively transparent, they can give guidance as to what represents a fair market value for a particular commodity. The following steps are taken to calculate the IPP and used to determine the fair market value in relation to the local market where the commodity will be monetized: Determine the best quality match for the commodity.
Identify appropriate export point(s) with transparent prices.
Determine the “commodity, insurance and freight” or “CIF” price for the commodity by adding by adding: (1) the FOB price (“free on board,” the price of a commodity at the loading port); (2) the prevailing ocean freight rate from that market to the port where the commodity will be off-loaded; and (3) the prevailing insurance costs for shipping the commodity to the port where it will be off-loaded.
Determine off-load and handling charges at receiving points.
Where applicable, quantify internal transportation, storage and handling costs.

9
Key Benefits/Risks by Case Study The following lists key risks and benefits specific to each of the evaluated case studies.
Key Benefits Key Risks
The Gambia – Vegetable Oil – IRD
There is sufficient domestic demand and insufficient domestic production.
Domestic production comprised between 10% and 16% of domestic annual vegetable oil supply from 2000 to 2007.
Gambian consumers gained access that they would not otherwise have had to soybean oil, which has better nutritional value relative to the palm oil that they generally purchase (which is higher in saturated fat).
Small lots of soybean oil were made available for sale and such small quantities would have been difficult and cost-prohibitive for the buyers to obtain on the world market.
There was no adverse impact on local production of vegetable oil.
The quantity of monetized soybean oil is small relative to domestic oil crop production. Between 2008 and 2010, monetized soybean oil accounted for 1% of the total vegetable oil crop production in The Gambia.
There has been no disruption to commercial trade.
The monetized soybean oil share of total vegetable oil imports was small, averaging less than 5%.
IRD received a fair market value for the soybean oil after a competitive and transparent tender process, indicating that the monetization did
The cost recovery rate* was low relative to other monetization cases highlighted in this report for reasons outside of IRD’s control.
The procurement price paid by USDA for the soybean oil was high when compared to FOB Gulf soybean oil prices during the period when the commodity was shipped and monetized.
The length of time between the issuance of the sales tender by IRD in the Gambia and the delivery of the soybean oil created a risk factor that discouraged some buyers from offering bids, making the sales process less competitive.
U.S. soybean oil receives a premium on The Gambian market over the lower-priced refined palm oil that dominates imports, but it faces significantly higher transportation costs. Transit time is also longer (150 days versus 60 days), which imposes a price risk to buyers and can impact the sales price.
10
Key Benefits Key Risks
The Gambia – Vegetable Oil – IRD
not disrupt market prices or interfere with commercial trade.
Monetization proceeds are being used to improve production and processing revenues within the cashew value chain across three countries: Senegal, The Gambia, and Guinea Bissau. There are barriers to monetizing in Senegal and Guinea Bissau, so the proceeds from The Gambia monetization are providing regional benefits.
The Food for Progress monetization program is the major U.S. assistance program in The Gambia and plays an important role in advancing foreign policy. Food for Progress is a good match for expanding private sector agricultural development in The Gambia and providing an entry point for U.S. Embassy to engage the Gambian Government in discussions.
Key Benefits Key Risks
Guatemala – Soybean Meal – Project Concern International
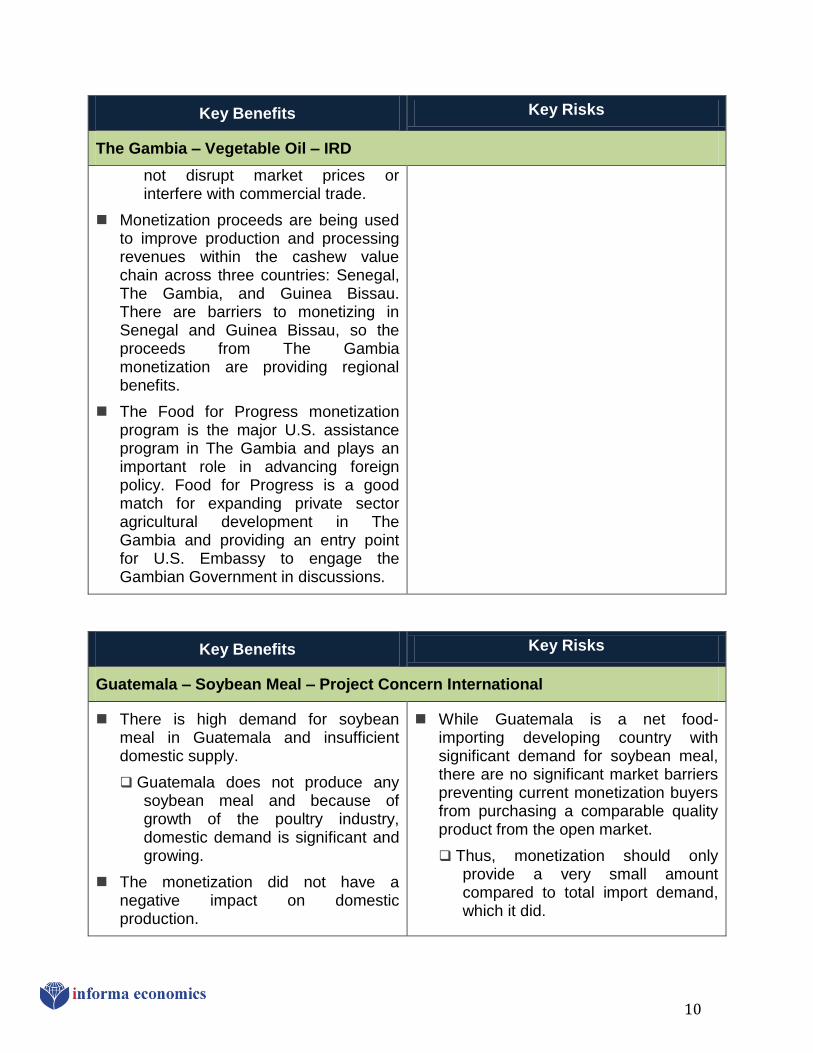
There is high demand for soybean meal in Guatemala and insufficient domestic supply.
Guatemala does not produce any soybean meal and because of growth of the poultry industry, domestic demand is significant and growing.
The monetization did not have a negative impact on domestic production.
While Guatemala is a net food-importing developing country with significant demand for soybean meal, there are no significant market barriers preventing current monetization buyers from purchasing a comparable quality product from the open market.
Thus, monetization should only provide a very small amount compared to total import demand, which it did.

11
Soybean meal is not produced in Guatemala. Comparing the levels monetized to production of similar commodities in the country, soybean meal monetization accounted for 0.7% of overall grain and meal production.
The monetization of soybean meal did not disrupt commercial trade.
Monetization of soybean meal for all programs from 2009 through 2011 averaged less than 3% of total soybean meal imports.
PCI received a fair market value for the soybean meal, indicating the monetization did not disrupt market prices or interfere with commercial patterns of trade.
Engaging a local broker helped PCI achieve the fair market value.
The cost recovery* rate was 83%.
The buyer took possession of the cargo upon loading at the U.S. port. Therefore, the risk of port delays, which can occur when shipping food aid to Guatemala and can add to program costs, were the buyer’s responsibility.
Under the McGovern-Dole International Food for Education and Child Nutrition program, cash support is not always made available for ITSH (internal transportation, storage and handling) and related costs, which is the case with Guatemala. Thus, monetization served as a flexible funding tool that allowed the program to obtain the ITSH funds necessary to implement the school feeding program.
According to the Ministry of Education in Guatemala, primary school students in the Department of Huehuetenango complete only 1.5 years of schooling
It is also important that market demand is growing, since this decreases the chance of disrupting normal patterns of commercial trade.
A fair market value was achieved, even though there was only one official bid.
PCI took steps to attract more bidders by employing a local broker, but this did not change the number of bids received. This is likely attributable to the fact that a minimum sales price was set in the request for bids which was not attractive to all buyers.

12
on average, demonstrating the worst educational achievement in the entire country. Children in the program target area who attend school typically arrive at school hungry after walking an average of three kilometers to get there. Thus, the chief objective of this three-year school feeding program targeting 30,000 children is to use school feeding as a platform to: (a) improve school enrollment and attendance; (b) improve student health status; and (c) enhance the learning environment by improving school infrastructure. Besides providing school meals as an incentive for attendance, a key component of the program is to increase parent, community and local government participation and support for school feeding activities.
Key Benefits Key Risks
Liberia – Rice – Land O’Lakes
Liberia does not produce enough rice to cover its domestic consumption demands.
Since 2005, production has accounted for between 30% and 55% of Liberia’s domestic demand.
Buyers seeking less-than commercial volumes of rice are prevented from buying on the world market because the cost of shipping such small quantities is cost prohibitive. The monetization program helped overcome the barriers by providing an opportunity to buy smaller lots and allowing incremental payments.
The availability of parboiled rice was increased, thereby providing higher
The Liberian government’s import license restrictions and a lack of small buyer access to credit limit the ability of smaller players to import rice. Even though a line of credit was provided as part of the rice monetization, because the monetized rice was sold for U.S. dollars, smaller market players were not likely to participate.

13
Key Benefits Key Risks
quality rice to the population at large.
The monetization does not interfere with local production.
Over the past 3 years, rice consumption has averaged 340,000 MT, while local production only provided an average of 180,000 MT. With the end of Liberian Civil Wars, demand is growing. Thus, the monetization of 11,000 MT in 2012 did not interfere with local production.
Monetization of rice did not disrupt commercial trade.
The total amount of rice monetized in 2012 was small relative to total rice imports – equivalent to 6.8% of the average amount of rice imported over the preceding three marketing years, 2009-2011. (Final import data are not yet available for 2012, but total imports are likely to be higher than the past three-year average.)
Historically, there is no indication that monetization of rice has interfered with trade, since commercial imports have continued to rise.
LOL received a fair market value when it sold the rice, indicating that the monetization did not disrupt market prices or interfere with commercial trade.
The cost recovery* rate was high, 95%.
The program just started in 2012 and the objective is to improve meat value chains that were devastated by the civil war, focusing specifically on improved goat rearing. The program is promoting

14
Key Benefits Key Risks
commercial goat production, meat processing and marketing by re-stocking 21,000 goats and providing training in animal husbandry, fodder production and business management to 10,000 producers. Two slaughter-houses in Monrovia will be being renovated and 12 easy-to-use slaughter slabs will be added to improve meat safety. In addition to increasing incomes and expanding businesses, the program will benefit over 550,000 consumers in the targeted areas by improving the nutritional quality of the diet.
Key Benefits Key Risks
Mozambique – Wheat – World Vision
Mozambique is not a commercial wheat producer and locally available wheat varieties are mainly soft wheat.
Since FY2005, Mozambique’s wheat production-to-consumption ratio has ranged between 0.53% and 1.23%.
Monetizing hard wheat created the opportunity for millers to blend this higher-protein wheat with soft wheat to produce better quality flour.
The sales process was structured to encourage a variety of millers to participate in the tenders, by allowing payment in local currency and in installments (versus full payment upon receipt of the commodities).
This stimulated participation of small- and medium-sized enterprises that may not be able to buy on the world market because of
In some years the total volume of wheat monetized in Mozambique exceeded, 10% of total import volumes.
Even though BEST reports generally suggest that the 10% level should not be exceeded, there is no evidence that this was disruptive to local production or commercial markets in Mozambique.
In some years the country was not able to maintain commercial import levels due to high world market prices or the unexpected cancelation of sales contracts. In such years, it would be reasonable for monetization levels to increase as a percentage of total import volume. In fact, it may be desirable to increase monetization in such cases even if monetized amounts will exceed 10% of imports.

15
Key Benefits Key Risks
credit, hard currency and minimum volume constraints.
The importance of wheat monetization to fill supply gaps was very apparent when worldwide wheat prices spiked in 2008: Mozambique’s total commercial wheat imports plummeted by 153,512 MT from 2007 to 2008.
Monetization in Mozambique is for local currencies, thereby avoiding draw-down on the country’s limited hard currency reserves and eliminating the buyer’s foreign exchange risk.
The local currency proceeds also provide the added benefit of funding agriculture, nutrition and natural resource management programs in poor, crisis-prone areas of the country, in coordination with the Government of Mozambique’s nutrition and agriculture development strategies.
Monetization has not disrupted commercial trade.
As also noted by Donovan et al. (2010), Mozambique’s commercial wheat import volumes have been increasing, monetized volumes have been decreasing, and the monetized import share of total imports has been declining.
The monetization of the wheat was for the fair market value, indicating that monetization did not disrupt market prices or interfere with commercial trade.
Between 2009 and 2011, cost recovery* rates have averaged 80%. The cost recovery rate reached 101% for the first transaction in 2012.
Mozambique is a poor developing country that requires wheat imports to supply its milling industry and to meet consumer demand. A drop in supply can set back development of the industry and increase consumer prices.

16
Key Benefits Key Risks
Uganda - Wheat – ACDI/VOCA
There is sufficient domestic demand and insufficient domestic production.
Uganda only produced 6% of its domestic wheat needs in 2010.
Food availability has increased and quality has improved, relative to what would have been achieved without monetization, by:
Addressing credit constraints; Reducing buyer risk by allowing
purchases in domestic currency; Reducing cost-prohibitive prices
faced by small- and medium-sized buyers who need to buy less-than- commercial-sized volumes; and
Increasing the consumption of better quality flour by blending high-protein Hard Red Winter Wheat with soft wheat varieties.
Monetization has helped expand the capacity of the Uganda wheat milling industry.
The supply gap during the Russia export embargo was partially offset by monetization of wheat and the potential for market volatility was reduced.
There was no adverse impact on local production.
There was no disruption of commercial trade.
Total monetized wheat averaged 7.6% of total wheat imports from 2006-2010, and was 5.4% of imports in FY 2011.
Over the last four years, U.S. monetized wheat shipments to Uganda have been relatively flat,
One of the food aid shipments, or the announcement of that shipment, could have been better aligned with the market needs in Uganda. A case was noted where the price received was lower than desired because the shipment was announced after buyers had already filled their warehouses with wheat and, therefore, market demand was low.
Inland transportation costs to Uganda are high and infrastructure improvements would greatly improve the cost efficiency of supplying wheat and other imported products to the country.

17
Key Benefits Key Risks
while commercial imports reached a record high in 2009 and have remained high since then.
ACDI/VOCA received a fair market value for the wheat, indicating that the monetization did not disrupt market prices or interfere with commercial trade.
During the course of the FY 2007-2011 MYAP, the average cost recovery* rate was 82%. For the first monetization in FY 2012, the cost recovery rate was 91%.
From FY 2007-2012, ACDI/VOCA, along with sub-recipients Africare, the Lutheran World Federation and The AIDS Support Organization, as well as local NGOs and CBOs, implemented a $74.3 million food security program in northern Uganda, targeting poor, vulnerable populations. It improved agricultural productivity, household savings, nutrition, and hygiene, and thereby strengthened the ability of communities to withstand climatic and other shocks. Under the ACDI/VOCA program, 97,006 rural households (580,000 household members) received training and technical assistance and 309,400 people were assisted by rehabilitation of 249 km of rural feeder roads. ACDI/VOCA also provided 12 months of supplementary food rations and complementary services to 127,016 people living with HIV/AIDs and their family members.
* Cost recovery (for all evaluated cases) measures total monetization revenues (cost per metric ton times total tonnage) divided by monetization costs (commodity procurement cost, foreign- flag freight cost, and, where applicable, inland transportation, storage and handling costs).

18
II. INTRODUCTION
The United States provides agricultural commodities overseas to promote development and food security and to meet emergency needs. Most of the commodities are directly distributed to recipients (86% in fiscal year 20108). However, in some cases, commodities may be "monetized” -- sold on the market or to the government of the recipient country and the proceeds used for developmental activities. Two common criticisms of monetization found in the literature are summarized in the title of a June 2011 U.S. General Accountability Office (GAO) report: International Food Assistance: Funding Development Projects through the Purchase, Shipment, and Sale of U.S. Commodities is Inefficient and Can Cause Adverse Market Impacts. The basis for the GAO finding that food aid is “inefficient” is that the “cost recovery” of food aid monetization is generally less than 100% – e.g., the funds generated for development projects via the proceeds from the monetization of the commodities are less than the cost incurred to procure and ship the commodities to recipient countries. However, this basic cost recovery formula only tells part of the story; it is not sufficient for determining the value of monetization to a recipient country. “Cost recovery” only places a value on the sales’ proceeds and does not take into account additional benefits that accrue from the provision of the commodity itself. Additionally, GAO’s rationale for concluding that monetization “can result in adverse market impacts” is that there is insufficient and inconsistent collection of data by USAID and USDA to prove otherwise; a problem that can be addressed by better coordination between the agencies, a clearer description of what constitutes the “reasonable market price” for a commodity, and improved USAID and USDA data collection. This study summarizes the potential risks and benefits of monetization, as reviewed in the literature, and evaluates data from five specific monetization cases against those potential risks and benefits, and describes, in detail, several cases that demonstrate the value and need for food aid monetization beyond the generation of funds to conduct development activities. Best practices to minimize chances of any adverse local market impacts also are identified. The study found that, due to the practices used when designing and implementing the five reviewed programs, in each case (1) the sale of the commodities did not compete with local production, (2) the sale of the commodities did not disrupt commercial trade, and (3) the sale was for a fair market value (e.g., the sales price received for the commodity was comparable to prevailing market prices for similar commodities in the country of sale), which helps to mitigate market disruption. The best practice for determining the fair market value is described in the report.
8 GAO. 2001. “International Food Assistance: Funding Development Projects through the Purchase,
Shipment, and Sale of U.S. Commodities is Inefficient and Can Cause Adverse Market Impact”.
19
III. PROJECT SCOPE & METHODOLOGY
A. Scope
Based on a review of the legislative requirements for monetization and a literature review of studies relevant to food aid monetization, Informa identified various benefits and costs that were often noted, sometimes with and sometimes without evidence or concrete examples. Based on this research, a set of critical questions was developed to use as Informa reviewed particular monetization cases. A set of 19 cases, representing a range of countries, commodities, organizations and program types, was provided by non-governmental organizations that agreed to provide data for use in this review. After reviewing those 19 cases, Informa refined its set of questions and identified a subset of five studies that represented a range of commodities, programs, countries and organizations that would provide sufficient data for an in-depth review. The non-governmental organizations representing these five cases provided applications and reports that had been submitted to the administrative agencies (USAID and USDA) and other information collected during the course of implementing the programs (such as tender and sales documents and ongoing market analysis). Informa also interviewed program representatives and collected relevant third-party reports and evaluations. For those five food aid monetization cases, Informa applied its study questions and evaluated a range of potential risks and benefits of monetization. The purpose was to determine value that may be gained from monetization beyond the generation of funds to conduct food security and developmental programs. In addition, while evaluating the programs and analyzing country-specific data, Informa sought to identify beneficial practices used in developing and implementing monetization programs that reduce the likelihood of interfering with local production or disrupting commercial trade patterns.
B. Methodology
1. Overview
Informa conducted a literature review of studies and policy reports that identified potential risks and benefits of food aid monetization and/or highlighted the successes/failures of specific cases. Some of the literature was based on opinion or assumption of what may happen if certain analyses and precautions were not taken, while others provided data analysis from actual cases. The objective of this literature review was not to critique or analyze existing studies, but rather to compile a list of commonly cited potential risks and benefits. This list was utilized when developing the key questions for evaluating each of the five case studies examined within this study – the “risks and benefits” questions. In addition, Informa reviewed the relevant laws and regulations for food aid programs to identify key requirements for monetization and incorporated analysis of whether those requirements were met into the “risks and benefits” questions.

20
Informa began with a group of 19 monetization cases provided by non-governmental organizations that are members of the Alliance for Global Food Security. A brief summary of each of these cases is presented in Appendix A. This group was narrowed down to five cases for more in-depth analysis. These cases were selected to represent a variety of countries, commodities and implementing organizations. Ongoing or recently-completed programs and programs for which independent analyses and evaluations had been conducted were preferred because of greater data availability. Each of the five cases was evaluated against the set of key “risks and benefits” questions... Within the scope of this study, Informa analyzed public data (including BEST reports and program evaluations, as well as data made available by USAID, USDA, FAO, and the Global Trade Atlas). Informa also evaluated data provided by Private Voluntary Organization (PVOs) about their programs, including reports provided to USAID and USDA, sales records, market assessments, and other information collected and reported in the course of implementing food aid programs. The scope of this study does not include field visits, but representatives of PVOs in the United States and in countries where the monetization took place were interviewed.
2. Key “Risks and Benefits” Study Questions & Methodology
Each case study was analyzed to answer the following questions: Was there sufficient domestic demand and insufficient domestic production to
warrant the monetization and importation of the chosen commodity?
Methodology Overview: This was evaluated by comparing historical production and consumption levels of the monetized commodity and related commodities in each of the evaluated countries.
Does food aid monetization provide benefits that would not be achieved with
alternative policy options (e.g., direct program funding)?
Does the monetization add to the food availability and/or quality? And/or has monetization aided market development?
Is there another reason for monetization over alternative policy options (e.g., direct program funding)?
Methodology Overview: This evaluation was based primarily on reports submitted by implementing agencies to USAID and USDA, other data provided by and interviews with program representatives from each of the reviewed countries, and information from published evaluations and reports. The purpose was to identify potential credit, currency, volume and/or other market barriers that may prevent buyers from purchasing the commodity or a similar quality product off of the open market. For example, in several of the evaluated cases small- or medium-sized

21
buyers were disadvantaged in sourcing commodities because they could not purchase commercial-scale quantities on the open market. Volume constraints were analyzed by comparing freight costs for commercial-scale shipments with the costs that would have likely been incurred to ship the smaller volumes that would have been transacted by the in-country buyers.
Has the monetization had an adverse impact on domestic production of the monetized commodity and/or related products?
Methodology Overview: This was evaluated by comparing both the volumes and trends of monetization of the commodity against the in-country production of that commodity and/or related products. Two key statistics were evaluated: (1) the transaction volume of the monetized commodity relative to total domestic production of that commodity (both with and without related products included); and (2) whether there was any historical correlation that might indicate that the level of monetization had a negative impact on production.
Has the monetization disrupted commercial trade of the monetized commodity and/or related products?
Methodology Overview: This was evaluated by comparing both the volumes and trends of the monetized commodity against the total imports of that commodity and/or related products. Two key statistics were evaluated: (1) the transaction volume of the monetized commodity relative to total imports of that commodity and related products; and (2) whether there was any historical correlation that might indicate that the level of monetization had a negative impact on imports. The Global Trade Atlas, FAO and USDA were the primary sources of information for this analysis.9
What is the average direct cost recovery rate?
Methodology Overview: The “cost recovery rate” equals revenues from sales divided by the costs of procuring and shipping the commodity, plus other costs incurred in carrying out the monetization. Revenue and cost data were provided by implementing organizations, which had collected the information during the course of program implementation in each of the reviewed countries. “Revenues” equal the transaction price multiplied by the volume. “Costs” are the sum of the commodity procurement price (price of the commodity at the U.S. loading port), ocean freight cost (prevailing foreign-flag rate at the time of sale for shipping the cargo from the U.S. port to the destination port), and, when applicable, internal transportation, storage, and handling costs (any additional costs incurred by the program after the
9 Implementing organizations observed that for some target countries, standard sources of
information on import levels, such as customs reports or exporting country records of exports to the recipient country, may under-report actual import levels because they do not capture illegal or informal trade.

22
cargo reaches the destination port to deliver the product to the in-country buyer[s]).10 A three-year average cost recovery rate (revenues divided by costs) was utilized whenever three years of data were available. If the commodity was monetized for less than three years, then the average cost recovery rate for the entire program was used. A three-year average cost recovery rate (revenues divided by costs) was utilized whenever three years of data was available (not all programs had monetized the evaluated commodity for three years).
3. Determination of Fair Market Value
For food monetization to be successful, it must not have an adverse impact on the domestic market or international trade. In fact, as noted under the section on “Potential Benefits and Risks of Food Aid Monetization” in chapter IV, these two areas are often cited as potential negatives of food monetization programs. Another common criticism is that the cost recovery rate is often less than 100%. In considering these issues, understanding what the “fair market value” in the global market is for the commodity to be monetized and how this fair market value relates to the local market is critical. Obtaining a fair market value can help improve the cost recovery rate as well as help to mitigate any potential negative market affects. With this in mind, this section describes the concept of fair market value as it relates to the monetization process and potential measures and procedures for determining the fair market value. The concept of a global fair market value is usually defined by market participants in terms of transparent prices observed at major export and import locations. Typical export movements from major suppliers to major buyers are usually in large, ship-lot sizes of 45 thousand MT to 60 thousand MT. Transactions between major buyers and sellers at primary export points are relatively transparent and can give guidance as to what represents a fair market value in global terms. Using wheat as an example, the chart below shows wheat prices at major wheat exporting points in different parts of the world.
10
USDA procures the commodities for food aid programs through an open tender, which includes the cost for delivering them to the export port. The implementing organization tenders for ocean freight to ship the commodity to the port of entry to the recipient country, according to USDA and USAID regulations, which require a certain percentage to be carried on U.S.-flag vessels. Some ocean freight costs are reimbursed by the Maritime Administration to USDA and USAID. The prevailing foreign-flag rate for the time of sale is used as the ocean freight rate for the cost recovery formula.

23
Figure 1: World Wheat Prices
Source: Informa Economics.
Obviously, global wheat prices in different parts of the world move in concert with each other; however, as the chart shows, there can be significant variation between markets. This variation can be due to a variety of factors including quality, transportation differences, local supply and demand dynamics, and government action. For example, wheat from suppliers such as Ukraine that are far removed from import destinations and which typically supply lower quality wheat, tend to trade at a lower price than markets such as Canada that have higher quality wheat and/or are closer to end-user markets. It is also instructive to look at the case of Russia where a drop in local supply in 2010/11 led to a government-imposed embargo on wheat shipments (and, thus, the discontinuity in the wheat prices for Russia [as shown in the chart]). Similar to wheat, rice prices show significant variation from different major export points. As the following chart shows, while world rice prices generally move together, the same factors noted for wheat can cause localized export rice prices to show significant variation among markets.

24
Figure 2: World Rice Prices
Source: Informa Economics.
As noted earlier, transportation plays a significant role in defining price differences between markets and for the vast majority of global grain trade, movement of these commodities takes place in relatively large (45 thousand MT to 60 thousand MT) ship-lot sizes. Of course, the size of the ship used to transport the commodities varies depending on the needs of both the exporter and the importer. As a general rule, the smaller the ship, the higher the cost per MT, per nautical mile of carrying the goods, as economies of scale are captured in the larger ship size movements. The following chart illustrates this point by showing the per MT cost of moving bulk commodities by vessel size.

25
Figure 3: Daily Average Freight Rates by Vessel Size
Source: Informa Economics.
An evaluation of the “fair” market value was conducted for each of the case studies included in this study to determine if the program received a reasonable price for the monetized commodity, that is, was the price comparable to prices a buyer would have had to pay for similar quality products available on the local market, or, if limited volume is traded on the local market, the price that local buyers would have to pay to obtain similar quality products off of the world market. This was determined by an evaluation of the fair market value for that commodity at the time the sales contract was signed. There are two appropriate ways to determine the fair market value for a commodity that will be sold in a foreign country: (1) direct in-country market analysis and (2) determination of the “import parity price.” Both methods reflect best practices. Since circumstances vary by country and commodity, it is important that implementing organizations have the opportunity to use either method when determining the fair market value for a monetized commodity. Method 1 - Direct In-Country Market Analysis: Before a sales agreement is signed, implementing agencies conduct a market analysis to determine prevailing prices and market trends for the commodity and similar or substitute commodities in the country where it will be sold. This is completed by collecting information from a variety of sources, such as the port of entry, customs offices, wholesale markets and market participants. If reliable local price information is available, such data can be used to establish the fair market value, after adjusting for quality variations, as necessary. Quality adjustment can be made by looking at average price premiums and discounts

26
on the world market between the evaluated qualities, focusing on prices in key exporting countries. Method 2 - Calculate the Import Parity Price: Often times, local price data is unavailable or unreliable. In such cases, evaluating the import parity price (IPP) can be a good way to determine the fair market value. This price represents the price that local buyers would have to pay to obtain similar quality products off of the world market. In general terms, the IPP is the FOB price of a similar quality commodity at the nearest or most competitive export market plus freight and insurance costs. This equals the landed price (e.g., the CIF price) of the monetized commodity. If the delivery point for the monetized commodity is off-ship or inland, the necessary unloading and inland transportation, storage and handling cost must be added to the landed price to accurately establish the fair market value at the point of delivery. It is important to note that this IPP was calculated using freight rates reflective of commercial-scale volumes; thus, evaluating what a large commercial-scale buyer would have to pay for the commodity off of the open market. The following is a “best practices” approach with respect to relating the global fair market value to the local market and IPP. Determine the best quality match for the commodity: There are often significant quality differences and differences in commodity characteristics that need to be considered as a first step in the monetization process. For example, in the case of wheat, there are five classes of wheat commonly traded in global markets (Hard Red Spring Wheat, Hard Red Winter Wheat, Soft Red Winter Wheat, White Wheat and Durum Wheat) and, within each class, there can be significant variation in quality with respect to factors such as protein levels, moisture content, foreign material, etc. In Figure 1 above, for example, the wheat prices from Canada reflect a Hard Red Spring Wheat with a protein content of 13.5% while the prices from Ukraine reflect soft wheat with a lower protein level. Finding the best match in the global market with respect to quality and commodity characteristics is the first step in linking the IPP to the global fair market value. Identify appropriate export point(s) with transparent prices: In this step, it is usually necessary to choose two or more origin points in the global market as a starting point of determining a fair market value. For example, if the commodity to be monetized is wheat and the market is Central America, a logical starting point is to look at export prices from Argentina, the US and Canada. As noted in the paragraph above, commodity characteristics and quality need to be considered, but at this stage, proximity to markets needs to be considered as a major factor. Determine ocean freight from export points(s): With several origins identified, freight rates from the origin to the market where monetization will take place needs to be determined. Sometimes provisional rates can be obtained from market participants. If not, rates can be determined by looking at prevailing time charter rates (the daily rate for vessel utilization) and then looking at steaming times from origin to destination. With ocean freight rates determined, the origin prices for the commodity are added to the

27
freight rates to determine a delivered price to the port closest to the market to be monetized. These delivered prices are then compared with each other and the lowest cost origin and freight combination are selected as the fair market value for that particular destination. Identify other handling or related charges: Typically, the transport of a commodity into a market where monetization takes place has characteristics that are different from more generic moves of that commodity that are characteristic of global trade. For example, the vessel size or configuration might be different from the typical Supramax or Panamax vessels that are typical of the global grain trade. The commodity might not be shipped in bulk but rather move in bags, containers or some other type of conveyance. There might be special port or handling charges, insurance rates or other fees that need to be added to the cost of the move. These cost adjustments can be added to or subtracted from the delivered cost of the commodity, determined in the prior paragraph. Determine Off-load and handling charges at receiving points: All ports of entry have handling and off-load charges and these charges can vary from port to port. These fees need to be added to the total cost of the delivered value of the commodity. Quantify inland transportation costs: After the commodity to be monetized is off-loaded at port, it usually has to be delivered to an inland location (the exception, of course, is if the monetization takes place at the port after unloading). These costs need to be determined. Once the inland costs (including any fees or costs incurred at the final destination inland are included) are added to the value of the commodity unloaded at the port, the IPP can be compared with the monetization value actually received. The above steps will result in a local IPP that can be used in the monetization process to determine if local prices received in the monetization process relate closely to the globally determined fair market value. For each of the examples used in this report, the locally monetized price did, in fact, relate well to the IPP and can be viewed as practical, best practice examples.

28
IV. FOOD AID & MONETIZATION OVERVIEW
A. Overview of Food Aid Programs and Monetization
The United States has regularly provided food assistance to countries and people in need since the end of World War II. The level of aid peaked at about 16 MMT/year in the 1960s. From FY 2006 through 2010, total U.S. food aid volume averaged 2.8 million metric tons (Table 1) and $2.4 billion per fiscal year (Table 2).11
Table 1: U.S. International Food Assistance Tonnage, FY 2006 – 2010, Metric Tons
Source: USAID U.S. International Food Assistance Reports, 2006 - 2010
Table 2: U.S. International Food Assistance Funding, FY 2006 – 2010, Million U.S.
Dollars
Source: USAID U.S. International Food Assistance Reports, 2006 - 2010
Since the 1980s, food aid programs have changed considerably. Commodity sales through concessional loans to governments (PL 480 Title I) and grants of food aid to governments for sale in their countries (PL 480 Title III), which accounted for half of the food aid commodities in the late 1980’s and early 1990’s, have been phased out. Now, the largest share of food aid is used for emergencies (such as protracted relief and
11
Data for 2006-2010 reported in this chapter are from the USDA/USAID International Food Aid Reports found at: http://www.fas.usda.gov/food-aid.asp. No IFAR report was posted for 2011. Total tonnage includes PL480 Title I, PL480 Title II, Food for Progress (Title I and CCC-funded), McGovern-Dole International Food for Education and Child Nutrition and Bill Emerson Humanitarian Trust. It does not include cash-funded local-regional purchase by USAID or USDA.
Title I
FY
PL 480 -
Title II
Subtotal Emergency
Non-
Emergency
PL 480 -
Title II
Subtotal
Title I-
funded
CCC-
funded Subtotal
2006 178,000 1,669,780 664,025 2,333,805 212,350 275,000 487,350 - 82,000 - 3,081,155
2007 - 1,532,964 594,840 2,127,804 23,210 240,630 263,840 5,000 103,230 - 2,499,874
2008 - 1,964,860 341,280 2,306,140 10,400 210,490 220,890 - 86,860 323,820 2,937,710
2009 - 1,919,760 474,350 2,394,110 14,300 274,230 288,530 - 126,523 21,000 2,830,163
2010 - 1,652,790 500,150 2,152,940 40,680 199,730 240,410 - 125,030 - 2,518,380
McGovern-
Dole Food
for
Education
Bill Emerson
Humanitarian
Trust
Grand TotalSection
416(b)*
Title II
Food for Peace (P.L.480) Food for Progress
Title I
FY
PL 480 -
Title II
Subtotal Emergency
Non-
Emergency
PL 480 -
Title II
Subtotal
Title I-
funded
CCC-
funded Subtotal
2006 50 1,222 370 1,592 72 147 219 - 86 - 1,947
2007 - 1,437 349 1,786 17 113 130 20 99 - 2,035
2008 - 1,981 354 2,335 13 153 166 - 99 266 2,866
2009 - 2,166 378 2,544 22 216 238 - 168 6 2,956
2010 - 1,523 401 1,924 20 146 166 - 174 8 2,272
Food for Peace (P.L.480) Food for Progress
Grand Total
Title IISection
416(b)*
McGovern-
Dole Food
for
Education
Bill Emerson
Humanitarian
Trust

29
refugees, natural disasters, manmade disasters), comprising 73.3% of all food aid funding from FY 2006-2010.12 Another change is that for nonemergency food aid programs, greater emphasis is placed on achieving measurable results, such as decreased child malnutrition and improved agricultural productivity and livelihoods in targeted populations, and improving the ability of vulnerable populations to withstand droughts and other shocks. Distribution of commodities can be an important factor in achieving results, but funds are also needed to support training, technical transfer, and other developmental components. For programs conducted in developing countries that produce insufficient commodities to meet their needs, food aid commodities may be sold and the proceeds used to support program-related costs and developmental activities. The sale and use of proceeds for these purposes is called “monetization.” The use of monetization is approved on a case-by-case basis by the administrative agency, either USAID or USDA, as part of the program application and approval process. In 2010, 86% of food aid commodities were distributed; 14% were monetized.13 Monetization is permitted under several different food aid programs and is currently used for Food for Peace Title II (15.3% of total Title II commodities from 2006-2010 were monetized), Food for Progress (nearly all of the commodities provided are monetized) and, occasionally, for McGovern-Dole International Food for Education and Child Nutrition programs.
B. U.S. International Food Aid Programs
This chapter reviews U.S. international food aid programs that are authorized by law and that permit the sale of food aid commodities in developing countries. Refer to Table 1 and Table 2 for the tonnage levels and expenditures for these programs from fiscal year 2006 to 2010.14 Section 416(b) of the Agricultural Act of 1949 authorizes the Secretary of
Agriculture to provide commodities held by the Commodity Credit Corporation for international food assistance. It is only used when the Secretary declares that surpluses are available and in practice, apportionments for section 416 must be
12
Total emergency food aid includes funds provided through Title II for emergency programs and from the Bill Emerson Humanitarian Trust. 13
Government Accountability Office, 2001. “International Food Assistance: Funding Development Projects through the Purchase, Shipment, and Sale of U.S. Commodities is Inefficient and Can Cause Adverse Market Impact”. 14
For programs subject to appropriations, expenditures for a fiscal year may not be the same as appropriations because of Maritime Administration reimbursements for some of the previous year’s ocean freight costs and funds carried in from the previous year.

30
approved by the White House Office of Management and Budget. When available, section 416 has primarily been used to provide commodities for emergency needs. It has also been used during economic crises in developing countries and for supporting developmental programs in developing countries. CCC no longer holds substantial inventories of commodities that are useful for food aid and section 416 has not been used in several years. Both monetization and distribution programs are permitted under section 416.
The Food for Peace Act or “PL480,” (prior to 2008 known as the “Agricultural
Trade Development and Assistance Act of 1954”) provides food aid and funds accrued from commodity sales to improve food security in developing countries. It is funded through congressional appropriations. Three food assistance programs are authorized under PL 480: Title I (concessional loans to foreign governments for the procurement of U.S. commodities); Title II (donations of commodities primarily through NGOs or the UN WFP to meet emergency needs and address the underlying causes of hunger); and Title III (donations of commodities to foreign governments to promote development).
PL 480 Titles I and III accounted for the largest portion of PL 480 from the 1980s
to 1993. With few exceptions, the commodities were sold in recipient countries. Depending on the terms of the agreement, the proceeds were used for general budget support for the recipient country government or for specific projects. Title III grants were phased out in 1994. Title I loans ended in 2007, partially because developing countries did not want to incur long-term debt. However, the use of Title I funds for grants to foreign governments through the Food for Progress program continued, albeit in small amounts (e.g. $20,000,000 in FY 2010).
PL 480 Title II has been the largest part of the U.S. food aid portfolio for over a
decade. USAID determines which agricultural commodities—including processed, blended, and fortified foods—are available for Title II, and issues a commodity list with estimated procurement costs per metric ton for each product. When developing Title II proposals, applicants choose commodities from that list. After a program is approved, the USDA-Kansas City Commodity Office procures the commodities through open tenders and the implementing organization takes responsibility for the commodities when they cross ship’s tackle at U.S. ports. Table 3 presents the U.S. government appropriations for PL480 Title II programs from FY 2003 to 2013.

31
Table 3: PL480 Title II Appropriations, FY 2003 – 2013, Million U.S. Dollars
*Level requested in the President’s FY 2013 Budget Sources: Appropriations Acts, FY 2003-2012, and Office of Management and Budget, Fiscal Year Budget of the U.S. Government, FY 2013
For emergencies, food aid may be provided to governments, intergovernmental organizations, private agencies, and public agencies under terms and conditions determined by the Administrator of USAID. Most agreements are for one year, but half of emergency operations are in countries that receive emergency food aid for two years or longer. From 2006-2010, 81.8% of Title II funds were used for emergencies (Table 4).
Table 4: PL 480 Title II Funds, FY 2006 – 2010, Million U.S. Dollars
Source: USAID U.S. International Food Assistance Reports, 2006 - 2010
“Nonemergency” programs are typically implemented by PVOs and cooperatives over several years to reduce food insecurity of vulnerable populations. The USAID website describes those programs as tackling chronic undernutrition and helping the most vulnerable break the cycle of poverty and hunger through agriculture and livelihoods support. USAID determines eligible countries for nonemergency programs and issues a Request for Applications, soliciting Development Assistance Program (DAP) proposals.15 DAPs typically have both monetization and distribution components. For example, supplemental foods may be distributed to lactating and pregnant women, young children, or people affected by HIV/AIDS, while the sales proceeds support training and materials for maternal-child nutrition, health, and sanitation, and for improving agricultural production and marketing. The needs
15
A DAP was previously called a “Multiyear Assistance Program” or “MYAP” and both designations will be seen in this report. Link to the USAID FY 2012 PL 480 Title II DAP RFA: http://transition.usaid.gov/our_work/humanitarian_assistance/ffp/fy12.developmentprogramrfa.pdf
2003 2004 2005 2006 2007 2008 2009 2010 2011 2012 2013*
Regular Appropriations 1,440 1,185 1,175 1,282 1,215 1,211 1,226 1,690 1,497 1,466 1,400
Supplemental Appropriations 369 0 240 350 450 850 1,095 150 0 0 -
Total Appropriations 1,809 1,185 1,415 1,632 1,665 2,061 2,321 1,840 1,497 1,466 -
FY Emergency
Non-
Emergency
Total
Title II
2006 $1,222 $370 $1,592
2007 $1,437 $349 $1,786
2008 $1,981 $354 $2,335
2009 $2,166 $378 $2,544
2010 $1,523 $401 $1,924
2006-10
Average $1,666 $370 $2,036

32
assessment, objectives, activities, and beneficiaries of each activity, as well as a plan for measuring and reporting on results (such as decreased levels of child malnutrition, increased household food supplies, greater diet diversity, increased agricultural productivity, greater access to and management of water, and increased incomes), are part of the program proposal. The proposal also identifies the types and levels of each commodity that will be used and provides a market analysis explaining why those commodities were chosen and explains how they will be distributed or monetized. If a proposal is approved, a baseline study is conducted to set the starting point for measuring progress. If monetization is part of the program plan, an organization provides information in its proposal demonstrating that the monetization of the chosen commodity in the amounts requested and through the method proposed is unlikely to interfere with local production or marketing or commercial imports of the same or substitute commodities. USAID issues monetization guidelines for applicants to follow when analyzing the market to develop the monetization plan. The Agency also decides whether the information provided in an application is correct, including by contracting with an independent firm to conduct a Bellmon Estimation Study (BEST) that identifies which commodities and how much of each commodity may be monetized without resulting in “substantial disincentive or interference with domestic production or marketing.” USDA provides the calculation of “Usual Marketing Requirements (UMRs),” which is used to determine the amount of a particular commodity that can be monetized with minimal potential to interfere with commercial agricultural trade.16 Once a DAP is approved, the awardee conducts market analyses to estimate prevailing prices and market conditions closer to the time when the commodity will be sold. For all programs, the awardee provides progress reports to USAID, including on the use of commodities for distribution and monetization, the use of funds to date, and progress toward achievement of results.
Food for Progress, established in 1985 and restructured in 1990, following the dissolution of the Soviet Union, provides commodities to developing countries and emerging democracies committed to introducing and expanding free enterprise in their agricultural sectors. Food for Progress programs target particular industry segments or barriers to private sector agriculture growth within a country. Outcomes include improved agricultural incomes, growth of agricultural businesses and financial services, and higher levels of production. Most programs are implemented by NGOs, such as PVOs, cooperatives, nonprofit associations, and universities, and in some cases, by governments or intergovernmental organizations. Funding for
16
The UMRs are reported by the U.S. Government to the FAO Consultative Subcommittee on Surplus Disposal, which allows other governments to comment on the levels that will be provided and whether they may or may not interfere with commercial trade.

33
Food for Progress through CCC funds averaged $155 million a year from 2006 to 2010, providing an average of 240,016 MT of commodities per year.17 The guidelines, regulations, results framework, and other information for submitting a Food for Progress proposal are provided on the USDA/FAS website. In each fiscal year USDA may use a total of $40 million for ocean transportation costs to ship the commodities to overseas destinations, which limits the amount of commodities that can be provided. In each fiscal year USDA may also provide a total of $15 million to implementing agencies to support program implementation. Monetization is commonly used in the first year of the program to fund activities over a three-year period. Applications include information explaining how the commodities were selected and demonstrating that the amount requested can be imported and monetized without disrupting local production and marketing patterns of the same or similar products. USDA determines whether that information is correct and also determines the UMRs for commodities requested. The sales process, estimated proceeds, and detailed budget for using the funds are included in the application. Once a program is approved, the awardee submits reports on monetization, expenditures, and activities every six months.
The McGovern-Dole International Food for Education and Child Nutrition
Program provides school meals or take home food rations, improves the educational environment, and results in increased attendance, improved learning and greater local support for school feeding programs in developing countries. Programs are conducted in countries that have made a demonstrable commitment to education. Funding averaged $125 million from FY 2006 to 2010 (average of 104,729 MT) and, except for $84 million provided by CCC, was provided through the congressional appropriations process. Programs are implemented by NGOs, WFP and, occasionally, by governments.
Following guidelines posted on USDA’s website, proposals are submitted for a program in eligible countries (typically three years in duration). If approved, commodities are provided, as well as funds to cover management, operational and activity costs. Therefore, monetization is used infrequently. However, the flexibility to monetize has provided opportunity to add value to the commodities in recipient countries and to support school feeding programs when USDA funding cannot be provided for internal transportation, storage and handling. Guidelines for choosing commodities and for describing the monetization process are similar to those for Food for Progress.
Figure 4 and Figure 5 provide an illustration of U.S. international food assistance program tonnages and funding, respectively.
17
PL 480 Title I funds can also be used for Food for Progress programs and levels provided from FY 2006-2010 were: $73,000,000 (212,350 MT) in FY 2006; $17,000,000 (23,210 MT) in FY 2007; none in FY 2008; $22,000,000 (14,300 MT) in 2009; and $20,000,000 (40,680 MT) in FY 2010.

34
Figure 4: U.S. International Food Assistance Tonnages, FY 2006 - 2010
* 5,000 MT was reported in FY 07 under Section 416(b) Source: USAID U.S. International Food Assistance Reports, 2006 - 2010
Figure 5: U.S. International Food Assistance Funding, FY 2006 - 2010
Source: USAID U.S. International Food Assistance Reports, 2006 - 2010

35
C. Potential Benefits and Risks of Food Aid Monetization
The literature on food aid monetization repeatedly highlights benefits, while also consistently arguing the common risks and costs. There is a good-sized body of literature focusing specifically on monetization, but a greater number of studies have attempted to evaluate the risks and benefits of food aid in general. For the purposes of this report, the focus is primarily on the benefits and risks of food aid monetization, specifically, but notes when certain characteristics may also apply to food aid in general. The following are cited as potential beneficial outcomes of food aid monetization: Monetization itself can help promote market and processing sector development.
The proceeds from food aid monetization can help fund development activities and ultimately help ensure food security.
Monetization can help provide business opportunities for U.S. companies involved in producing, processing, and transporting commodities.
Monetization can help promote consumer demand for U.S. agricultural products.
PVOs may be able to fund certain projects with monetization revenues that they otherwise would not be able to.
Food aid monetization provides recipient countries opportunities to purchase commodities off the world market, when they otherwise may not have been able to procure sufficient amounts due to poor credit or other market barriers.
When monetization transactions occur in local currency, monetization can help recipient countries retain foreign (hard) currency.
Food aid in general—including monetized food aid—may increase food availability in the recipient country and provide nutritional benefits.
By providing a commodity that is in short supply in the recipient country and also generating funds for development activities from the sale of that commodity, a monetization program has greater benefits than direct cash funding for programs, even if the cost recovery is less than 100%.
The following are cited as potential disadvantages or risks of food aid monetization: Routine food aid monetization can lead to local dependency and/or changed
consumer preference for a foreign commodity and create disincentives to local production and marketing (also a concern regarding distribution of food aid).
The process is costly and inefficient with regard to the revenue generated from monetization sales versus the money donated by the U.S. government for the food aid monetization.

36
Food aid monetization can act as an impediment to U.S. commercial agriculture exports, displacing U.S. commercial sales. Food aid monetization can hurt economic development goals in the long term by creating disincentives to local production and marketing.
Due to open market sales, monetized commodities may not reach food insecure or poor populations. This suggests that poorer market segments may not be able to buy the commodes or will not be the ultimate recipients of the monetized commodity. For example, the argument is made that when the buyers are large market players (versus small players), they may inflate retail prices of the commodity or value-added production.
Since 75% of U.S. food aid must be shipped using U.S.-flagged vessels, and foreign vessels must wait three years after acquiring U.S. flag registry before being eligible to carry U.S. food aid, shipping costs are higher than necessary and can reduce the recovery rate of food aid.18
The following are cited as potential risks or disadvantages of food aid in general—whether monetized or distributed:
Cause commercial exporters to lose market share in the food aid recipient country (displacement of commercial imports).
Depress local commodity prices by increasing the local food supply, creating disincentives for local production or local market development, or contributing to local price volatility if large quantities are abruptly dumped on local markets.
18
The U.S.-flag shipping requirement (called “cargo preference”) recently changed from 75% to 50% of food aid cargoes.

37
V. THE GAMBIA – SOYBEAN OIL – INTERNATIONAL
RELIEF AND DEVELOPMENT
This chapter analyzes the potential impacts and value of monetized soybean oil in The Gambia under a Food for Progress program conducted by International Relief Development (IRD). First, a brief overview of food aid in The Gambia is provided, which puts monetization, soybean oil monetization and IRD soybean oil monetization in perspective relative to total food aid. Additionally, a program overview of IRD soybean oil monetization in The Gambia is provided. Then, the key rationale for monetizing soybean oil in The Gambia is described, followed by an analysis of its potential market impacts. The analysis presented within this case study aims to answer the following questions: Is there sufficient domestic demand and insufficient domestic production to warrant
the monetization or importation of soybean oil?
Does food aid monetization provide benefits that would not be achieved with alternative policy options (e.g., direct program funding)?
Does the monetization of soybean oil add to the food availability and/or quality in The Gambia? And/or has monetization aided market development?
If no to the above, is there another reason for monetization over alternative policy options (e.g., direct program funding)?
Did IRD receive a reasonable fair market value?
Has soybean oil monetization had a notable adverse impact on local soybean oil or related product production?
Has soybean oil monetization disrupted commercial trade of soybean oil or related products?
What is the average direct cost recovery rate?
A. Food Aid Overview
1. The Gambia Food Aid Overview
Total food aid in The Gambia totaled 4,500 MT per year between 2009 and 2010, of which 87% was monetized vegetable oil, all of which was monetized by IRD. The only non-vegetable monetization occurred in 2006 when USAID monetized 1,500 MT of rice. The below table is based on programed food aid data supplied by USDA and USAID and does not necessarily reflect the fiscal year when actual shipments occurred.

38
According to IRD, 2,000 MT of soybean oil was monetized in 2009 and 2,500 MT was monetized in 2010, while USDA reports the quantities somewhat differently, 3,000 MT in FY 2009 and 1,500 MT in FY 2010 (see Table 5). The total amount reported by both IRD and USDA for 2009 and 2010 combined is 4,500 MT. Table 5: Volume and Value of U.S. Soybean Oil Programmed for Monetization* for
The Gambia, Fiscal Years 2006-2010
Fiscal
Year
(Oct-
Sep)
PL480 Title II (USAID) Food for Progress - CCC
Purchased (FAS/USDA)
Monetized* U.S. Soybean
Oil
Quantity
(MT)
Value
($1,000)
Price
per
Ton
Quantity
(MT)
Value
($1,000)
Price
per
Ton
Quantity
(MT)
Value
($1,000)
Price
per
Ton
2006 1,700 1,505.7 886 0 0 0 1,700 1,505.7 886
2007 0 0 0 0 0 0 0 0 0
2008 0 0 0 0 0 0 0 0 0
2009 0 0 0 3,000* 5,940.0 1,980 3,000* 5,940.0 1,980
2010 0 0 0 1,500* 2,970.0 1,980 1,500* 2,970.0 1,980
* Monetized food aid is programmed food aid. Actual food aid shipments may have occurred in the following fiscal year or, in some cases, the preceding fiscal year from when it was programmed. According to IRD, 2,000 MT of soybean oil was monetized in 2009 and 2,500 was monetized in 2010. Sources: FAS/USDA for monetized food aid under Food for Progress CCC Purchase and USAID for monetized food aid under Title II
2. Program Overview: IRD – The Gambia – Soybean Oil Monetization
This program is designed with the goal of increasing incomes of 10,000 cashew farmers and processors by increasing the revenues throughout the cashew value chain (production, processing and marketing of cashew products) in three countries: Senegal, The Gambia, and Guinea Bissau. Funding for the development activities is generated through the sale of vegetable oil in The Gambia. To help facilitate the program, the government of Gambia waived duties on the monetized products. As described by IRD, the program has three main components:
1) Capacity building of cashew farmers associations to strengthen their entrepreneurial and advocacy skills to better manage and provide leadership in the cashew value chain;
2) Identification of high-yielding varieties, and promotion and introduction of innovative agronomic and post-harvest technologies; and
3) Increased local consumption of cashews through nutrition education and provisions of appropriate small-scale processing units to transform cashew apples and nuts into processed products.

39
The program (i) provides intensive participatory training on business management, marketing, post harvesting and handling, and agricultural best practices to improve the quality of the cashew nuts, (ii) supports 60 small-scale local processors (7 nut processors and 52 apple processors) in The Gambia and Senegal through the provision of equipment and proper training, and (iii) facilitates linkages among key participants along the value chain (farmers, processors, traders and nut exporters). The program is not yet complete, but thus far, IRD reported the following key outcomes:
1) A noticeable increase in farmers registering in farmers associations; 2) Farmers reporting an increased awareness of cashew nut quality requirements; 3) A better understanding of cashew marketing and better price negotiation skills;
and 4) The high quality of nuts, particularly in The Gambia, led to a premium price being
paid to the farmers.
B. The Gambia Soybean Oil Monetization Rationale
According to USAID Bellmon analyses: “To warrant importation and sale of monetized food aid, both local dietary preferences and available market information must strongly suggest that a commodity is consumed in significant amounts (e.g., there is significant demand), and that national production is insufficient to meet the demand (e.g., there is insufficient national supply to meet demand).”19 This section analyzes whether or not soybean oil meets both of the above criteria necessary to warrant the importation and sale of monetized soybean oil in The Gambia. Then, additional rationale is described specific to IRD soybean oil monetization in The Gambia.
1. Vegetable Oil Supply and Demand – Significant Demand & Insufficient Domestic Production
A general criteria used by USAID within a Bellmon analysis to make a positive monetization recommendation specifies that a country must have sufficient consumer demand for a particular commodity, and that local production must be insufficient in meeting this domestic demand. These criteria are met for soybean oil in The Gambia. While The Gambia produces both groundnut oil and limited palm oil, the country’s groundnut oil is generally inedible due to its high aflatoxin content. Instead, Gambian groundnut oil is exported as a crude oil for further processing. General vegetable oil demand, shown in Figure 6, far exceeds domestic production, which averaged 19% of domestic consumption between 2007 and 2009.
19
This quote comes from the 2011 USAID Bellmon Estimation for Uganda, however it applies across any monetization case.

40
Figure 6: Vegetable Oil Production and Consumption in The Gambia
* Vegetable oil consumption includes cottonseed oil, groundnut oil, maize germ oil, olive oil, palm oil, palm kernel oil, rape and mustard oil, soybean oil, and sunflower oil. ** Vegetable oil production includes palm oil and groundnut oil. Source: FAOSTAT
The Gambia produces no soybean oil, yet Gambian consumers have demonstrated a strong preference for this oil over the most commonly available palm oil, and are willing to pay a premium for soybean oil versus palm oil.
2. Commercial Import Limitations and/or Additional Monetization Rationale
In addition to the sufficient demand and insufficient domestic production argument for monetization, the monetization of U.S. soybean oil in The Gambia can be justified through other perspectives.
The vegetable oil market in The Gambia is competitive, with numerous buyers
Small lots of soybean oil were made available for sale and such small quantities would have been difficult and cost-prohibitive for the buyers to obtain on the world market. For example, the lot size allowed four importers to place bids for the soybean oil in 2010. A variety of other distributers were able to purchase smaller lots of oil from the bidders who won the tender.
Gambian consumers gained access that they would not otherwise have had to soybean oil, which has better nutritional value relative to the palm oil that they generally purchase (which is higher in saturated fat).

41
Monetization proceeds are being used to improve production and processing revenues within the cashew value chain across three neighboring countries: Senegal, The Gambia, and Guinea Bissau. There are barriers to monetizing in Senegal and Guinea Bissau, so the proceeds from The Gambia monetization are providing regional benefits.
The Food for Progress monetization program is the major U.S. assistance program in The Gambia and plays an important role in advancing foreign policy. Food for Progress is a good match for expanding private sector agricultural development in The Gambia and providing an entry point for the U.S. government to engage the Gambian Government in discussions.
The above analysis of The Gambia’s vegetable oil supply and demand, the nutritional advantage of soybean oil versus bleached palm oil, and the development activities facilitated through monetization proceeds indicate the value of soybean oil monetized in The Gambia. Vegetable oil production provides less than 20% of consumption needs in the country. While vegetable oils are commercially imported, there has been more than adequate demand to sustain both the typical commercial imports and the small amount of U.S. soybean oil that was monetized. In addition, competition in The Gambia’s vegetable oil market appears strong.
C. Impact on Domestic Market
1. Price Impact
Did IRD receive a reasonable fair market value?
Yes – Based on Informa’s analysis, the prices received by IRD have been within a reasonable margin of error relative to the estimated import parity prices (IPP). The IPP is a measure of “fair market value” and is a reflection of what it would cost a large commercial importer to purchase off of the world market and transport the product to the same delivery point as IRD. However, according to IRD, at this point it is unlikely that buyers would purchase soybean oil if it were not monetized. This is because purchasing in small quantities off the world market would be cost prohibitive; the freight and logistic costs per ton are much higher than for larger volumes. Economies of scale allow larger buyers to have access to better rates for shipping, storage and distribution.
Price Establishment Process According to an IRD representative, to establish a fair price for the oil, the first check is with the international market to determine whether there is a need to fix a base or minimum price. For the March 2009 bid, the “fair market value” was first tracked starting December 2008, and then checked again just before the monetization. Based on this information, they then set the minimum bid price, which was indicated in the bidding guide. The minimum bid price was not put in the first sales tender notice, but was later

42
added to minimize the number of extremely low bids. The process they followed was to announce the tender in the newspaper, to review the bids received to determine whether they met the tender requirements, and to post all of the bids, allowing all bidders to know what others had offered. IRD will accept the highest offer from the bidder who meets the financial requirements. IRD found that there are a few “less-than-serious” bidders who will bid high to get a “call back” and then try to negotiate something different, claiming that they did not understand the conditions. They then enter the negotiation phase, ultimately arriving at the top buyer who can meet the financing requirements. When negotiating the price, IRD takes into account the opportunity cost since buyers must commit the funds for a commodity that will not be delivered until three months after an agreement is signed. Buyers also incur price risk – e.g. the risk that the price may decrease on the international market by the time the commodity is delivered. The contract stipulates that in the event that duties must be paid, it is the responsibility of the buyer. While IRD has been successful in getting the commodity in the country duty free, this is a risk that the buyer must assume. There were five credible bids in the first monetization round and 11 in the second. The buyer in the first round was an import company and the buyer in the second round was a bank that sold to the buyer of the first round. All purchases were in US$. When the project agreement for the program was first signed, the commodities were valued at $1,350 per MT, as global commodity prices were extremely high, for a total budget of $6,105,375. When the sale took place, the average price for the commodity was $777 per MT, or 42% less than anticipated (the total proceeds were about $3.5 million). IRD observed that the Food for Progress agreement was signed when soybean oil prices were at their peak, during the fuel and food price crisis in the summer of 2008, when soybean oil was in demand as both a food product and a biofuel. Food for Progress proposals and estimated sales prices are submitted up to one year prior to the time when monetization will take place. Since prices can move up or down considerably during this period, the actual sales price can be very different than the estimated price in the agreement, either increasing or decreasing the funds available to implement the program plan. Price Received vs. Alternative Market Price Estimates Figure 7 illustrates the soybean oil prices IRD received relative to the estimated import parity price (IPP). The prices received by IRD reflect the month and year the bid was made. The IPP is intended to provide parameters by which to examine whether or not the price received by IRD was reasonable relative to the price buyers could have received by importing a similar product of commercial-scale quantities from either the U.S. or Argentina (key exporters of soybean oil). This is a measure to assess “fair market value”. Based on this analysis, the prices received by IRD have been within reasonable margin of error relative to the estimated IPP.
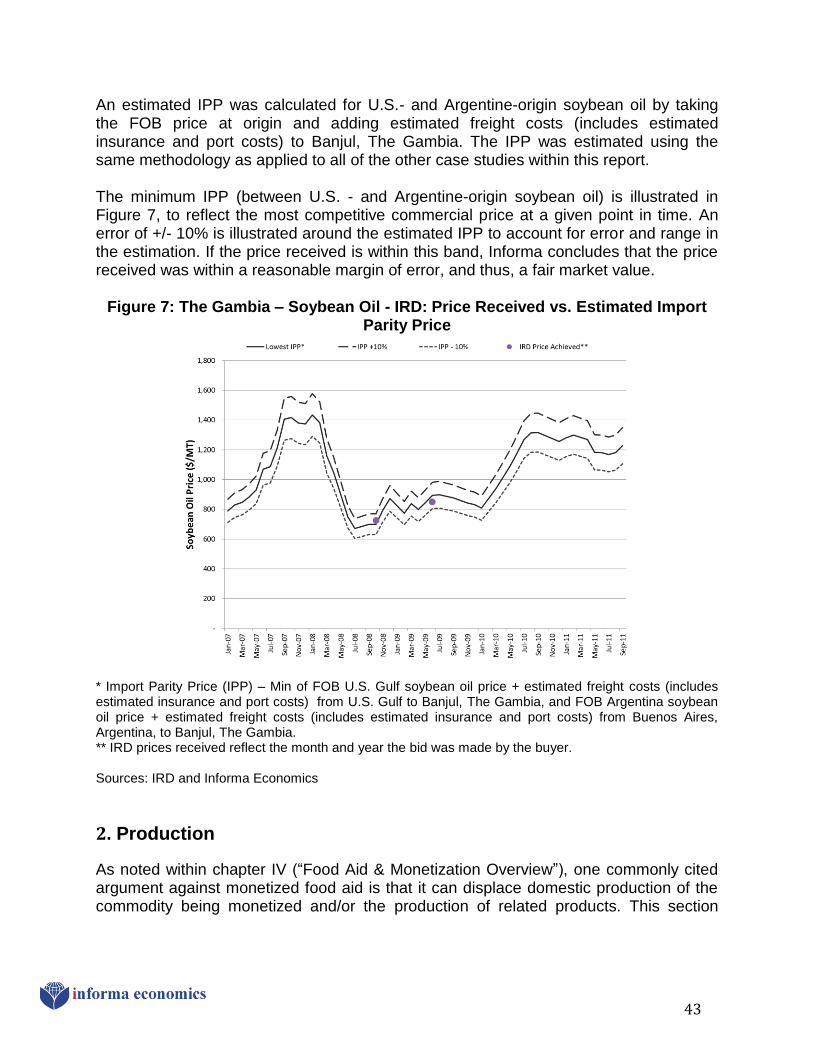
43
An estimated IPP was calculated for U.S.- and Argentine-origin soybean oil by taking the FOB price at origin and adding estimated freight costs (includes estimated insurance and port costs) to Banjul, The Gambia. The IPP was estimated using the same methodology as applied to all of the other case studies within this report. The minimum IPP (between U.S. - and Argentine-origin soybean oil) is illustrated in Figure 7, to reflect the most competitive commercial price at a given point in time. An error of +/- 10% is illustrated around the estimated IPP to account for error and range in the estimation. If the price received is within this band, Informa concludes that the price received was within a reasonable margin of error, and thus, a fair market value.
Figure 7: The Gambia – Soybean Oil - IRD: Price Received vs. Estimated Import Parity Price
* Import Parity Price (IPP) – Min of FOB U.S. Gulf soybean oil price + estimated freight costs (includes estimated insurance and port costs) from U.S. Gulf to Banjul, The Gambia, and FOB Argentina soybean oil price + estimated freight costs (includes estimated insurance and port costs) from Buenos Aires, Argentina, to Banjul, The Gambia. ** IRD prices received reflect the month and year the bid was made by the buyer. Sources: IRD and Informa Economics
2. Production
As noted within chapter IV (“Food Aid & Monetization Overview”), one commonly cited argument against monetized food aid is that it can displace domestic production of the commodity being monetized and/or the production of related products. This section

44
aims to analyze whether or not the monetization of soybean oil in The Gambia has had any notable, negative impact on the domestic production of oil or oilseed crops. Overview Has monetization of soybean oil in The Gambia had an adverse impact on
local soybean oil production and/or the production of related products?
No – Given the relatively small volumes of monetized oil relative to domestic production, it is not surprising that there is no apparent or statistically significant correlation between food aid (total food aid, monetized food aid, or monetized soybean oil) and any of the examined oil crops. Between 2008 and 2010, monetized soybean oil accounted for just 1% of total oil crop production in The Gambia (groundnuts + oil palm fruit + sesame seed + cottonseed).
Impact of Monetized Soybean Oil on Production While, the monetization of soybean oil does not have any direct impact on The Gambia soybean oil production, as The Gambia does not produce any soybeans, its potential impact on the production of other oil crops was examined. Groundnuts are the primary oilseed crop produced in The Gambia, with an average annual production of 101,380 MT between 2008 and 2010. Palm fruit is the next largest oil crop produced in The Gambia, with a three-year average production level of 35,330 MT. Sesame seed and cottonseed are also produced in The Gambia; however, volumes are far less significant with 2,490 MT and 152 MT of production, respectively. Only a portion of the oilseed crops is used to produce vegetable oil and from 2007 through 2009, on average, domestic oil production only met 19% of consumption demand. Given the relatively small volumes of monetized oil relative to domestic production, it is not surprising that there is no apparent or statistically significant correlation between monetized soybean oil and any of the examined oil crops. The size of monetized soybean oil relative to oil crop production and trends are illustrated in Figure 8.

45
Figure 8: The Gambia Oil Crop Production & Monetized Soybean Oil Trends*
* Please note: (i) that monetized food aid is on the second axis, as values are considerably lower than production and (ii) the illustrated historical production data goes back to 1990 while the monetized food aid data goes back to 2001; however, this does not necessarily imply that there was no monetized food before 2001.
** The 2009 and 2010 soybean oil monetization volumes are based on actual quantities sold. Other monetized food aid volumes are based on programmed food aid data from the USDA, FAS (FFP-CCC and FFE- Govt/PVO) + monetized data from USAID. It is also important to note that this is programmed food aid, and actual food aid shipments may have occurred in the following fiscal year or in some cases the preceding fiscal year.
Sources: IRD, USDA, FAS; USAID; FAO; and Informa Economics
3. Internal Market Development
In the case of The Gambia monetization of soybean oil in small lots increases the cost of the total monetization, and thereby decreases the revenue received by PVOs, compared with monetizing in larger lots. Therefore, the most recent monetization of U.S. soybean oil—by International Relief and Development (IRD)—was sold in two medium-sized lots under two tenders. While reducing program costs, the lot-size limited participation of smaller buyers who could not obtain international loans for the larger volumes. However, some of the smaller buyers are purchasing smaller volumes of soybean oil from the buyers who won the tenders. Because smaller buyers are not able to meet the financial requirements to bid successfully on the soybean oil tenders, the program is unlikely to have contributed to any expansion in the number of market participants. Similarly, we cannot conclude that the monetization has or has not increased competition in the market. However, the

46
vegetable oil market in The Gambia already has a number of market players. For example, during IRD’s second monetization of 2,500 MT of U.S. soybean oil during the spring of 2010, 11 different companies placed bids. Virtually all of The Gambia’s edible oil supply is imported, and, of this, roughly 90% of imports are refined, bleached palm oil from Indonesia. The availability of U.S. soybean oil on The Gambian market through monetization has introduced a high quality oil t that may otherwise be cost-prohibitive to import through commercial channels. Consumers in The Gambia tend to read origin labels when buying vegetable oil and will choose the soybean oil when it is available, even though it is sold at a premium over palm oil. The Gambian consumer preference for soybean oil has been exemplified through the sharply rising price of soybean oil when the product is in short supply. For example, during IRD’s last monetization, the price of soybean oil when it arrived in the spring of 2010 was $27 per 20-liter drum, but rose to $44 per 20-liter drum when the soybean oil supply began to wane.
4. Consumers/Food Availability
The impacts of the monetization of soybean oil in The Gambian are twofold: first, positive nutritional implications of making oil that is lower in saturated fat available to consumers; and second, increased business activity and incomes through the use of sales proceeds to develop the cashew nut value chain. According to Mayo Clinic, saturated fats and trans fats intake can increase a person’s blood cholesterol and contribute to cardiovascular disease. Mayo Clinic recommends that a person avoid consumption of the two fats, and notes that “good fats” such as monosaturated fatty acids and polyunsaturated fatty acids help lower cholesterol and decrease the risk of heart disease. When comparing the fatty acid composition of palm oil versus soybean oil, soybean oil is more “heart-healthy” than palm oil.20 Consumers similarly perceive soybean oil to be a healthier oil compared with the bleached palm oil that is most widely consumed in The Gambia. However, when the monetized soybean oil is finished in the market, buyers do not source the U.S. oil on their own. This leads IRD to believe that at this point, soybean oil is cost-prohibitive unless made available through a monetization program. Because the oil is part of a development program, the Gambian government grants duty waivers and provides port clearance. Additionally, if buyers were to import the same small quantity of soybean oil commercially that has been purchased through monetization, freight costs would be higher than for a buyer importing commercial scale volumes. As a result, consumers are getting a higher quality oil due to monetization. Using the proceeds from monetization, IRD helps 10,000 cashew producers and processors in The Gambia, Guinea Bissau, and Senegal by adding value along the
20
Found at http://www.livestrong.com/article/456642-palm-oil-vs-soybean-oil/

47
cashew nut supply chain. Specifically, the project includes “providing training to cashew farmers, seeds for higher-yielding varieties, new cultivation techniques, nutrition education, land management practices, and small-scale units to process and use all parts of the cashew fruit and nut.”21 To carry out these activities, IRD is working in conjunction with the Ministries of Agriculture, Forestry, Environment, and Natural Resources of all three countries, as well as with certain organizations with farming expertise.
D. Impact on Commercial Trade
Overview Soybean oil monetization does not disrupt commercial vegetable oil imports. The monetized soybean oil share of total vegetable oil imports is small, recently averaging less than 5%. The BEST analysis assumes that, as long as monetized imports are 10% or less of total imports, monetized imports will not have an adverse impact on commercial imports. Impact of Monetized Soybean Oil Imports on Commercial Imports Monetized soybean oil has not disrupted commercial vegetable oil imports. The BEST analysis assumes that, as long as monetized imports are 10% or less of total imports, monetized imports will not have an adverse impact on commercial imports. The share of monetized soybean oil imports recently has been below 10% (Figure 9 and Table 6). Soybean oil imports increased notably in 2007 before declining in 2008. However, this decline was not the result of monetization, as no soybean oil was monetized in 2008. Rather, international commodity prices are a major determinant of commercial import levels.
21
According to IRD’s website, http://www.ird.org/en/our-work/programs/improving-cashew-production-in-the-senegambia

48
Figure 9: The Gambia Commercial Vegetable Oil & Monetized Soybean Oil Imports, Fiscal Year
Sources: USDA/FAS and USAID for monetized soybean oil prior to 2009. IRD for 2009 and 2010 monetization volumes. FAO for total imports 2001 to 2009 and Global Trade Atlas world exports to The Gambia to derive 2010 imports.
Table 6: The Gambia Vegetable Oil Imports, Fiscal Years 2001 to 2010
In Metric Tons
Sources: USDA/FAS and USAID for Monetized Aid prior to FY 2009. IRD for FY 2009 and FY 2010 monetization volumes. FAO for total imports 2001 to 2009 (calendar year) and Global Trade Atlas world exports to The Gambia for 2010 (calendar year) used to derive imports.
Impact of Monetized Soybean Oil Imports on Competing Imported Vegetable Oils The Gambia imports relatively large quantities of vegetable oil, with palm oil and linseed oil accounting for most of the imports (Table 7 and Table 8). Monetized soybean oil has not disrupted commercial vegetable oil imports. In the case of The Gambia, monetized soybean oil imports are small and account for less than 10% of total vegetable oil imports.
Type of Import 2001 2002 2003 2004 2005 2006 2007 2008 2009 2010
Monetized Soybean Oil 0 0 0 0 0 1,700 0 0 2,000 2,500
Commercial Vegetable oil Imports 27,918 36,824 47,715 30,211 22,401 31,207 73,417 58,306 74,823 28,267
Total Vegetable Oil Imports 27,918 36,824 47,715 30,211 22,401 32,907 73,417 58,306 76,823 30,767
Monetized/Total 0% 0% 0% 0% 0% 5% 0% 0% 3% 8%

49
Table 7: Volume of The Gambia Vegetable Oil Imports Calendar Year, Metric Tons
Type of Oil 2001 2002 2003 2004 2005 2006 2007 2008 2009
Palm oil 2,200 4,300 14,200 25,200 21,600 32,200 34,000 28,500 40,200
Linseed oil 8,609 17,397 23,067 0 0 0 36,716 27,942 36,135
Soybean oil 14,400 14,600 10,100 4,900 500 400 2,200 1,502 19
Other oils 2,709 527 348 111 301 307 501 362 469
Total Oils 27,918 36,824 47,715 30,211 22,401 32,907 73,417 58,306 76,823 Source: FAOSTAT
*Note that FAO import data is provided in calendar year, whereas monetization data is programmed fiscal year data.
Table 8: Value of The Gambia Vegetable Oil Imports Calendar Year, $1,000 (CIF)
Type of Oil 2001 2002 2003 2004 2005 2006 2007 2008 2009
Palm oil 880 1,900 6,500 11,500 10,500 16,000 10,900 10,500 16,600
Linseed oil 2,589 4,018 3,876 0 0 0 18,063 12,923 21,437
Soybean oil 7,200 8,500 6,000 3,000 350 290 1,800 1,091 7
Other oils 953 211 131 70 174 211 274 253 302
Total Oils 11,622 14,629 16,507 14,570 11,024 16,501 31,037 24,767 38,346 Source: FAOSTAT *Note that FAO import data is provided in calendar year, whereas monetization data is programmed fiscal year data.
E. Direct Monetization Costs and Revenues
IRD monetized 2,000 MT of soybean oil in 2009 and 2,500 MT in 2010. Total monetization proceeds equaled $3,575,000 for the two years, while total costs equaled $7,296,659, for an average cost recovery rate of 49%. This is a low cost recovery rate relative to other cases highlighted in this report, but this is due to factors outside of IRD’s control. One of the primary factors for the relatively low cost recovery rate is the high ocean freight rate to The Gambia, which is notably higher than for other monetization transactions examined in this report. Additionally, the price USDA paid for soybean oil was significantly higher than the FOB Gulf soybean oil price. However, it should be noted that IRD does not have any control over either freight costs or procurement costs and this could also be attributed to the barrels in which it was delivered. The relatively small monetization volumes are another potential factor for the higher freight costs. (Section C.1 of this chapter, “Price Impact,” describes the sales process and efforts taken by IRD to maximize revenues.)

50
Table 9: Direct IRD Soybean Oil Monetization Costs & Revenues – The Gambia
* Non-US flag rate. * * ITSH = Inland Transportation, Storage & Handling Source: IRD
F. The Gambia Conclusions
Key research questions presented in the introduction to this case study are answered below.
1) Is there sufficient domestic demand and insufficient domestic production to warrant the monetization and importation of soybean oil?
The Gambia produces no soybean oil, yet Gambian consumers have demonstrated a strong preference for this oil over the most commonly available palm oil, and are willing to pay a premium for soybean oil versus palm oil. Vegetable oil demand, in general, far exceeds domestic production, which averaged between 10% and 16% of domestic annual vegetable oil supply between 2000 and 2007.
Yes
2) Does food aid monetization provide benefits that would not be achieved with alternative policy options (e.g., direct program funding)?
Yes
2009 2010
Revenues
Volume (MT) 2,000 2,500
Sales Price (US$/MT) 725 850
Total Revenues (US$) 1,450,000 2,125,000
Costs
Commodity (US$/MT) 1,222 1,334
Ocean Freight* (US$/MT) 349 327
ITSH** (US$/MT) - -
Taxes/ Duties/ Port Fees (US$/MT) - -
Other (US$/MT) - -
Total C&F (US$) 3,143,591 4,153,068
Cost Recovery 46% 51%

51
a. Does the monetization of soybean oil add to food availability and/or quality? And/or has monetization aided market development?
The quality/nutritional value of the monetized soybean oil is greater than the traditionally imported palm oil, which is higher in saturated fat and considered by buyers to be of lower quality. Monetization has increased access to soybean oil, which is recognized for its nutritional benefits, but is difficult for Gambians to buy on the world market because it would be cost prohibitive. Thus, monetization provides The Gambia a better quality oil and has allowed a range of local distributors to sell the product in country.
Yes
b. Is there another reason for monetization over alternative policy options (e.g., direct program funding)?
U.S. development assistance in The Gambia is extremely limited. Food for Progress is one of the few foreign aid programs that is well matched for the country since it promotes private sector agricultural growth and market-based systems and provides an entry point for U.S. Government discussions with the Government of The Gambia on trade, economic and other policies.
Yes
3) Did IRD receive a reasonable fair market value?
Based on Informa’s analysis, the prices received by IRD have been within a reasonable margin of error relative to the estimated import parity prices, which are a reflection of what it would cost a large commercial importer to purchase off of the world market and transport the product to the same delivery point as IRD.
Yes
4) Has soybean oil monetization had a notable adverse impact on local soybean oil or related product production in The Gambia?
Given the small volumes of monetized oil relative to domestic production, it is not surprising that there is no apparent or statistically significant correlation between monetized soybean oil and any of the examined oil crops. Between 2008 and 2010, monetized soybean oil accounted for just 1% of total oil crop production in The Gambia (groundnuts + oil palm fruit + sesame seed + cottonseed). Moreover, less than 19% of vegetable oil demand is met through local production. Imports are necessary.
No

52
5) Has soybean oil monetization disrupted commercial trade of soybean oil or related products?
The monetized soybean oil share of total vegetable oil imports is small, recently averaging less than 5%. The BEST analysis assumes that as long as monetized imports are 10% or less of total imports, monetized imports will not have an adverse impact on commercial imports. In addition, the commodity was sold at a fair market value when the sales price was compared to prevailing rates for imports of similar products. Therefore, it did not interfere with import prices of similar commodities.
No
6) What is the average direct cost recovery rate?
IRD monetized 2,000 MT of soybean oil in 2009 and 2,500 MT in 2010 with an average cost recovery rate of 49%. The procurement price was unusually high since took place during the fuel and commodity price crisis, while the sale took place months later. There are high ocean freight and handling costs associated with monetizing soybean oil in The Gambia. These variables were outside the control of IRD, but they were able to employ several methods to try to attract more bidders and thereby increase competition in the sales process. The product sold at a premium to other imported oils because its quality was recognized.
49%

53
VI. GUATEMALA – SOYBEAN MEAL – PROJECT
CONERN INTERNATIONAL
This chapter analyzes the potential impacts and value of monetized soybean meal in Guatemala and looks specifically at the soybean meal monetization conducted by Project Concern International (PCI) under a McGovern-Dole International Food for Education and Child Nutrition Program. First, a brief overview of food aid in Guatemala is provided, followed by a program overview of PCI soybean meal monetization in Guatemala. Then, the key rationale for monetizing soybean meal in Guatemala is described, followed by an analysis of its potential market impacts. The analysis presented within this case study aims to answer the following questions: Is there sufficient domestic demand and insufficient domestic production to warrant
the monetization or importation of soybean meal?
Does food aid monetization provide benefits that would not be achieved with alternative policy options (e.g., direct program funding)?
Does the monetization of soybean meal add to the feed/grain availability and/or quality in Guatemala? And/or has monetization aided market development?
Is there another reason for monetization over alternative policy options (e.g., direct program funding)?
Did PCI receive a reasonable fair market value?
Has the monetization had an adverse impact on domestic production of soybean meal and/or related products?
Has the monetization disrupted commercial trade of soybean meal and/or related products?
What is the average direct cost recovery rate?
A. Food Aid Overview
1. Guatemala Food Aid Overview
Total programmed Guatemala food aid was 124,540 MT between 2008 and 2010. Of the total food aid, monetized soybean meal accounted for 25%. Table 10 below illustrates programmed soybean monetization by fiscal year under each of the programs. PCI monetized 1,000 MT of soybean meal in FY 2011. This represents 12% of the total 8,000 MT of soybean meal that was programmed for monetization in 2011, as reported by USDA, FAS. USAID has not monetized soybean meal since 2002, when

54
it established the policy of only monetizing commodities that are for human consumption, not animal feed22. As a result, USDA is the only agency monetizing soybean meal in recent years, under Food for Education (PCI and SHARE) and Food for Progress (Texas A&M University and Finca) programs (see Table 10). Table 10: Volume and Value of U.S. Soybean Meal Programmed for Monetization*
for Guatemala, Fiscal Years 2001-2011
* Monetized food aid is programmed food aid. Actual food aid shipments may have occurred in the following fiscal year or in some cases the preceding fiscal year from when it was programmed Sources: FAS/USDA for monetized food aid under Food for Progress – CCC Purchased and Food for Education – Govt PVO and USAID for monetized food aid under Title II
2. Program Overview: PCI – Guatemala - Soybean Meal Monetization
PCI began a three-year school-feeding program in FY 2010 in Guatemala, reaching 164 schools and 32,000 beneficiaries. Students receive a warm breakfast every school day for three years. The program also includes educational health and nutritional programs, school gardens, and the construction of school infrastructure such as latrines and kitchens. The proceeds from a one-time monetization of 1,000 MT of soybean meal were used to cover internal transportation, storage, and handling (ITSH) costs incurred in delivering the food for the school feeding program. Monetization was not the sole source of program funds. The overall goal of the program is to distribute breakfast within schools and thereby:
1) Improve school enrollment and classroom attendance; 2) Improve student health status; and 3) Enhance the learning environment by improving school infrastructure, specifically
kitchens, water, and sanitation systems. 22
From USAID 2011 Guatemala Bellmon Analysis, by Fintrac, Inc. However, this policy has been changed, as of 2012.
2001 20,300 3,979 196 20,300 3,979 196
2002 21,570 4,292 199 21,570 4,292 199
2003 0 0 0
2004 0 0 0
2005 15,000 3,270 218 1,100 229 208 16,100 3,499 217
2006 23,000 5,008 218 2,000 435 217 25,000 5,443 218
2007 2,000 309 155 2,000 309 155
2008 15,000 7,350 490 4,800 1,152 240 19,800 8,502 429
2009 5,340 2,617 490 5,340 2,617 490
2010 5,990 1,947 325 5,990 1,947 325
2011 8,020 2,767 345 8,020 2,767 345
Quantity
(MT)
Value
($1,000)
Price
per Ton
Quantity
(MT)
Value
($1,000)
Price
per Ton
Quantity
(MT)
Value
($1,000)
Price
per Ton
Quantity
(MT)
Value
($1,000)
Fiscal
Year
(Oct-Sep)
PL480 Title II (USAID)Food for Progress - CCC
Purchased (FAS/USDA)
Food for Education - Govt
PVO
Monetized* US Soybean
Meal
Price
per Ton
55
B. Guatemala Soybean Meal Monetization Rationale
According to USAID Bellmon analyses, “to warrant importation and sale of monetized food aid, both local dietary preferences and available market information must strongly suggest that a commodity is consumed in significant amounts (e.g., there is significant demand), and that national production is insufficient to meet the demand (e.g., there is insufficient national supply to meet demand).”23 This section analyzes whether or not soybean meal meets both of the above criteria necessary to warrant the importation and sale of monetized soybean meal. Then, additional rationale will be described specific to PCI soybean meal monetization in Guatemala.
1. Soybean Meal Supply and Demand – Significant Demand & Insufficient Domestic Production
Outside of the basic criteria for commodity eligibility for monetization, including that the commodity must be eligible for both 1) export from the U.S. and 2) import into Guatemala (e.g., no trade barriers preventing a commodity’s import), the most recent Bellmon analysis for Guatemala conducted by Fintrac Inc. in October 201124 evaluated the eligibility for U.S. soybean meal monetized imports under the following criteria:
1) The commodity must have sufficient local demand, and
2) The commodity must have insufficient local production requiring commercial import activity.
As discussed further in this chapter under the heading “Consumers/Food Availability”, the per capita use of soybean meal (as animal feed) in Guatemala is large and growing. The growth in domestic soybean meal consumption can be attributed to growth in per capita poultry meat consumption (and overall poultry meat production). Guatemala does not produce any soybean meal and must, therefore, rely on imports to meet its growing domestic demand. To analyze commercial import activity with respect to monetized soybean meal imports, for the USAID “BEST” analysis, Fintrac Inc. uses the guideline that the amount monetized must account for no more than 10% of average annual total import volumes of the commodity and similar commodities. Between FY2001 and FY2011, Guatemala imported between 18,750 MT and 289,020 MT of soybean meal. From 2001 to 2011, the share of monetized soybean meal only exceeded 10% in 2001 (at 10.9%) and 2006 (10.1%), but, during other years, it was below 10%. Since 2009, monetized soybean meal has been less than 3% (Table 11).
23
This quote comes from the 2011 USAID Bellmon Estimation for Uganda, however it applies across any monetization case. 24
Found at http://pdf.usaid.gov/pdf_docs/PNADY391.pdf

56
Table 11: Guatemala’s Monetized Soybean Meal, Commercial Imports, and
Monetized Imports as Share of Total Imports, 2001 – 2011
Source: Global Trade Atlas and UN Comtrade for total imports and FAS/USDA and USAID for Monetized food aid.
The supply and demand evaluation concludes that soybean meal meets the requirements necessary to warrant importation and sale of monetized food aid in Guatemala. There is significant demand and insufficient domestic production.
2. Commercial Import Limitations and/or Additional Monetization Rationale
The USAID-commissioned Bellmon analysis for Guatemala (hereafter called the “USAID Guatemala Bellmon analysis) notes two overarching challenges to monetizing food aid in that country: (i) potential buyers generally have access to credit and high quality U.S. commodities through the open market and typical advantages of participating in monetization are “largely moot”, (ii) Guatemalan food imports and processing companies are “controlled, to a great extent, by an oligarchy” which reduces the likelihood of PVOs receiving competitive prices. However, there is a counter to both of these points in this particular soybean meal monetization case. To the first point, while there is not necessarily a barrier preventing buyers from purchasing soybean meal from the open market, monetization is such a small portion of overall trade that it is unlikely to cause any harm (which is confirmed by analysis in section VI.D of this report). To the second point, soybean meal is utilized as an animal feed and involves a different set of buyers and businesses than those involved in importing and processing commodities for human food use. Additionally, the process by which PCI issues its sales tender via a broker helps ensure a competitive market price (PCI’s identity is not revealed and the buyer is unaware that it is a monetized commodity that they are buying).
The USAID Guatemala Bellmon analysis recommends bulk U.S. soybean meal (48 percent protein) for monetization in FY12 for the following reasons:
There is a substantial commercial market for U.S. soybean meal, with growing commercial imports already sourced almost exclusively from the U.S.
Trade policies favor the import of U.S. soybean meal, as there are no quotas or tariffs for soybean meal from the U.S.
2001 2002 2003 2004 2005 2006 2007 2008 2009 2010 2011
Monetized Soybean Meal 20,300 21,570 0 0 16,050 25,000 2,000 19,800 5,340 5,990 8,020
Commercial Imports 166,450 213,724 216,956 227,584 221,470 223,741 287,999 238,823 262,282 276,990 281,000
Total Soy Meal Imports 186,750 235,294 216,956 227,584 237,520 248,741 289,999 258,623 267,622 282,980 289,020
10.1% 0.7% 7.7% 2.0% 2.1% 2.8%
Monetized Volume as Share of
Total Imports 10.9% 9.2% 0.0% 0.0% 6.8%

57
Monetization of a small volume of soybean meal would have no discernible impact on normal trade relations between Guatemala and its usual trading partner in the soybean meal market (the U.S.), but would simply substitute for a very small volume of normal U.S. commercial sales in support of food security activities in Guatemala.
The 2011 USAID Guatemala Bellmon analysis concluded: “Provided the monetization is conducted through an open and competitive process, the team finds that monetization of up to 25,315 MT per year would have no discernible negative impact on the Guatemalan soybean meal market…” This limit is notably higher than the total 8,000 MT of soybean meal which was monetized in FY2011, of which PCI monetized 1,000 MT.
C. Impact on the Domestic Market
1. Price Impact
Overview Did PCI receive a reasonable fair market value?
Yes – PCI used a local broker and potential buyers were unaware that the product was sold under a food aid program, thereby encouraging bids that reflect prevailing market prices. Based on the Informa analysis, the price received by PCI was within reasonable margin of error relative to the estimated import parity prices and the import implied prices – both measures used to assess fair market value.
Price Establishment Process A local broker was used to represent PCI, which allowed PCI’s identity to remain anonymous throughout the negotiations and the buyer was not aware that they were purchasing monetized soybean meal. Although the commodity was offered to all known soybean meal buyers in Guatemala, only one official sales offer was received (there was another received by phone but it was never made official). This bid was received on October 29, 2010, and the final contract was signed by a producer of animal feed in November 2010, with final product delivery in December 2010. Payment terms were in U.S. dollars and paid via letter of credit. A PCI representative commented that additional offers would have been desired; however, a minimum bid price was established and this likely was the reason for the low number of bids. On the other hand, setting a price floor also helped PCI obtain a good sales price. USDA covered the cost for the commodity and ocean freight, as in all McGovern-Dole Food for Education programs. However, in this case, the buyer took possession of the cargo once the commodity was loaded onto the ship at the U.S. port, rather than at the destination port. This arrangement minimized the risk for PCI during transit or at the port of entry; an important safeguard since customs delays at Guatemalan ports were

58
commonplace, increasing the likelihood of program implementation delays, infestation, and other additional fees for waiting time at the port. Because another organization was monetizing soybean meal in Guatemala, PCI coordinated with that organization and gave it information about the bid that PCI received for the soybean meal. PCI only received one offer, which was higher than the sales price received by the other organization. This was likely attributable to the utilization of the local broker, the fact that PCI set a minimum sales price, and that PCI was selling a much smaller quantity of soybean meal than the other organization. The timing of the monetization sale did not have any positive or negative seasonality impacts, as soybean meal imports are relatively consistent, year round. However, PCI did note that efforts were made to ensure that the product did not arrive over the holidays, as this would have negatively impacted commodity importation for the buyers. Price Received vs. Alternative Market Price Estimates Figure 10 illustrates the soybean meal price PCI received relative to the estimated import parity price and the import implied price. The price received by PCI was compared to prevailing commercial prices for U.S. soybean meal (the primary exporter of this commodity to Guatemala) delivered to Guatemala during the month and year the bid was made. This information was used to determine whether PCI received a fair market value. Based on this analysis, the price received by PCI was within reasonable margin of error relative to the alternative market price estimates. Two methods were used to estimate alternative market prices for Guatemala: (i) the import implied price based on GTIS trade data (total trade value / total trade volume) and (ii) the estimated import parity price (IPP). The import implied price is a good series for Guatemala because there are significant trade volumes and the trade value is reflective of the actual price paid for the soybean meal, even if it was contracted at a price set months prior. This import implied price is not a valid series for the other case studies evaluated within this report. The other series, the import parity price, uses the U.S. Gulf FOB soybean meal price plus estimated freight, which is consistent with the methodology applied in all of the other case studies evaluated in this study to analyze fair market values. The FOB price used in the IPP calculation reflects the value of the product at the time the contract price was set and does not necessarily reflect the value of the product which could have potentially been contracted at a previously established price. The IPP is calculated by taking the soybean meal FOB price at the U.S. Gulf and adding freight costs (includes estimated insurance and port costs) to Guatemala. An error of +/- 10% is illustrated around the estimated IPP to account for error and range in the estimation. If the price received is within this band (or above), Informa concludes that the price received was within a reasonable margin of error and a fair market value was achieved.

59
Figure 10: Guatemala – SBM – PCI: Price Received vs. Alternative Market Price Estimates
* Import Parity Price – U.S. Gulf Soybean Meal (48%) + estimated freight costs (includes estimated insurance and port costs) from U.S. Gulf to Guatemala. ** Implied Import Price = Value of Guatemala soybean meal imports divided by volume of imports. ***The PCI price received reflects the month and year the bid was made by the buyer. Sources: PCI; GTIS; and Informa Economics
2. Production
In reviewing the literature on food aid, one commonly cited argument against monetization, as well as food aid distribution, is that it can displace domestic production of the monetized or distributed commodity, and/or related products. This section analyzes whether the monetization of soybean meal in Guatemala had any notable negative impact on the domestic production of soybean meal in Guatemala or of other related products. Overview Has monetization of soybean meal in Guatemala had a notable negative
impact on local soybean meal production and/or the production of related products?
No – Given that Guatemala has not produced any soybean meal since 1991, the monetization of soybean meal has not had any direct impact on Guatemala soybean meal production. Furthermore, upon analyzing data for other grains and protein meals, there is insufficient evidence to conclude that soybean meal monetization has had any notable negative impact on domestic grain or meal

60
production, as soybean meal monetization accounts for 0.7% of overall grain and meal production, and production for each of the key grains/meals has been steady or increasing since the early 2000s.
Impact of Monetized Soybean Meal on Production Soybean meal is primarily used as an animal feed, generally blended at a 2:1 ratio with corn (2 units of corn per 1 unit of soybean meal). However, there is no domestic production of soybean meal in Guatemala. Thus, Guatemala relies solely on commercial imports and food aid monetization for its soybean meal needs. Corn is the primary grain produced in Guatemala, with an average annual production of 1,183,000 MT between 2008 and 2010. Sorghum and palm kernel meal are the next two largest feed grains/meals produced in Guatemala, with the three-year average production levels of 53,000 and 26,000 MT, respectively. While, the monetization of soybean meal does not have any direct impact on Guatemala soybean meal production, as Guatemala has not produced any soybean meal since 1991, its potential impact on the production of these other feed grains/meals was examined. Figure 11 illustrates the historical production of key Guatemalan feed grains and meals and compares these trends with trends in total monetized food aid and monetized soybean meal.
As illustrated in Figure 11, monetized food aid has been highly variable over the past decade and there is no apparent or statistically significant correlation monetized soybean meal and any of the examined feed grains and meals. Total monetized soybean meal has exhibited a slight downward trend since early 2000s; meanwhile domestic production of total feed grains/meals has exhibited a slight upward trend. This lack of relationship is not surprising considering that total food aid represents 3% of all Guatemalan grain and meal production, and monetized soybean meal represents less than 1% of domestic feed grain and meal production. Thus, any potential market impact of monetized soybean meal, if any, would be on commercial trade and not on domestic feed grain or meal production. Potential commercial soybean meal trade impacts are evaluated in section VI.D of this chapter (“Impact on Commercial Trade”).

61
Figure 11: Guatemala Feed Grains/Meals: Production & Monetized Soybean Meal Trends*
* Note: (i) corn production is on the second axis and (ii) the illustrated historical production data goes back to 1990 while the monetized food aid data goes back to 2001; however, this does not necessarily imply that food aid monetization began in 2001.
** Monetized soybean meal volumes are based on programmed food aid data from the USDA, FAS (FFP-CCC and FFE- Government/PVO) + monetization data from USAID. It is also important to note that this is programmed food aid, and actual food aid shipments may have occurred in the following fiscal year or in some cases the preceding fiscal year.
Source: USDA, FAS; USAID and Informa Economics
3. Internal Market Development
As previously mentioned, Guatemala has no soybean or soybean meal production, and, therefore, has relied on imports for all of its soybean meal needs. However, the likely candidates for purchasing monetized soybean meal already have well established soybean meal supply chains. They often purchase from the United States in U.S. dollars, and have lines of credit directly with U.S. suppliers. Thus, the typical advantages of importing monetized commodities (e.g., overcoming hard currency and credit limitations) did not apply in the case of Guatemala. The companies that import soybean meal also generally import yellow corn and are feed manufacturers. According to the USAID Guatemala Bellmon analysis in October 2011, Guatemala’s top soybean meal importers and their respective market shares of the feed industry were the following:

62
Soybean Meal Importer Market Share
Aliansa (part of Grupo Gutiérrez – Muti-Inversiones holdings) 35% Frisa (Grupo PAF) 30% Avisa (Avícola Rosanda) 10% COMAYMA (Cooperativa Integral de Producción Madre y Maestra) 8% Agribrands Purina 5% Molino Santa Ana 3% CIXSA, Concentrados de Guatemala, Alimentos del Prado y Agroimportaciones
1%
Total 92%
Roughly 12 smaller companies account for the remaining import market share. The winning bidder for the sale of 1,000 MT of soybean meal in November 2010 (FY2011) was a medium-sized animal feed producer. Due to the small volume of the sale, the monetization transaction likely would not have stimulated market development, but similarly would not have interfered with patterns of commercial trade or hurt market development in any way. Despite the competitive market for soybean meal, only one company placed a written bid in PCI’s sale of monetized product in 2010. PCI set a minimum bid and used a broker to obtain a fair market value for the meal and it is likely that the higher price floor may have deterred some buyers from placing bids.
4. Consumers/Food Availability
Guatemala has long been plagued with food insecurity due to a history of conflict (civil war from 1960 to 1996), natural disasters (volcanoes, hurricanes, and tropical storms), high poverty rates, and high rates of malnourishment (43% of the population). Food insecurity in Guatemala is particularly severe among indigenous populations. From 1960 to 2009, Guatemala’s per capita soybean meal use for livestock feed increased, reflective of similar growth in the country’s broiler production and per capita poultry consumption (Figure 12).

63
Figure 12: Guatemala Per Capita Soybean Meal and Poultry Meat Consumption, 1961 - 2009
Sources: Soybean Meal Consumption (FAS PSD); Poultry Meat Consumption (FAOSTAT); Population (World Bank)
The instances of soybean meal monetization have been in relatively small volumes in comparison with commercial imports, and monetization did not resolve a market barrier that would have otherwise prevented commercial imports. As a result, the monetized soybean meal imports are unlikely to have had a substantial positive impact on food availability, nutrition, or consumer prices; although, the transactions similarly have not adversely affected any of these three categories, either. While monetization does not generally have a notable impact on domestic feed grain availability, monetization helped develop the commercial feed and poultry industries after the civil war ended. It also played a role in helping to fill a market gap during the 2008 worldwide run up in soybean meal prices. In 2008, commercial imports fell by 49,000 and 19,800 MT of soybean meal was monetized, a 17,800 MT increase relative to 2007. Additionally, the proceeds from the monetization transactions serve as a funding tool to carry out programs that positively impacted child food availability and nutrition. Monetization was the only tool available at the time to fund the internal transportation, storage, and handling (ITSH) for PCI’s three-year McGovern Dole Food for Education program. With the proceeds from the sale of 1,000 MT of soybean meal, PCI was able to fund ITSH costs such as transportation and warehousing (including rent, security, and utilities), serving 164 schools and reaching 32,000 beneficiaries in the department of Huehuetenango. The monetization, therefore, has helped in achieving three program objectives:

64
1. “Improve school enrollment and attendance in the classroom,
2. Improve student health status, and
3. Enhance the learning environment by improving school infrastructure, specifically kitchens, water, and sanitation systems.”25
D. Impact on Commercial Trade
Overview There is no domestic production of soybean meal, so soybean meal imports account for all of Guatemala’s soybean meal supply. Guatemala uses soybean meal for the manufacture of animal feed and, to a much lesser extent, as a source of vegetable protein for production of nutritional supplements for human consumption. Food monetization does not disrupt commercial trade or trade with competing commodities for the following reasons:
The monetized soybean meal share of total soybean meal imports is small, averaging less than 3% in three of the last four years and under 10% in nine of the last 11 years. The BEST analysis assumes that, as long as monetized imports are 10% or less of total imports, monetized imports will not have an adverse impact on commercial imports.
The United States has a substantial commercial market in Guatemala and accounts for nearly all soybean meal imports. Thus, monetized soybean meal imports would be a substitute for only a very small amount of U.S. commercial sales.
Monetized soybean meal imports do not disrupt imports of other protein meals since soybean meal is the only meal imported by Guatemala.
Impact of Monetized Soybean Meal Imports on Commercial Imports Monetized soybean meal has not disrupted commercial imports. The BEST analysis assumes that as long as monetized imports are 10% or less of total imports, monetized imports will not have an adverse impact on commercial imports. The share of monetized soybean meal imports has been below 3% in three of the last four years (Figure 13 and Table 12). Additionally, commercial imports have been steadily increasing since the early 2000s.
25
From personal communication with PCI in their “Description of Monetization of SBM for McGovern Dole FFE Program Guatemala 2010”

65
Figure 13: Guatemala Commercial & Monetized Soybean Meal Imports, Fiscal Year
* Percentages indicate monetized soybean meal share of total soybean meal imports. Sources: FAS/USDA and USAID for monetized aid and UN Comtrade for imports in 2001 and 2002 and Global Trade Atlas for imports 2003-2010
Table 12: Guatemala Soybean Meal Imports, Fiscal Years 2001 to 2011
In Metric Tons
Source: USDA/FAS and USAID for monetized food aid. UN Comtrade for imports in 2001 and 2002 and Global Trade Atlas for 2003-2011
Guatemala is a relatively large soybean meal importer and the United States accounts for nearly all of Guatemala’s soybean meal imports (Table 13 and Table 14). Because monetized imports are small and currently account for less than 3% of total imports, they are not likely to have an adverse impact on U.S. commercial shipments to Guatemala.
Table 13: Volume of Guatemala Soybean Meal Imports by Country of Origin October-September Year, Metric Tons
Source: UN Comtrade for 2001 and 2002 and Global Trade Atlas for 2003 to 2011
2001 2002 2003 2004 2005 2006 2007 2008 2009 2010 2011
Monetized Soybean Meal 20,300 21,570 0 0 16,100 25,000 2,000 19,800 5,340 5,990 8,020
Commercial Imports 166,450 213,724 216,956 227,584 221,420 223,741 287,999 238,823 262,282 276,990 281,000
Total Soy Meal Imports 186,750 235,294 216,956 227,584 237,520 248,741 289,999 258,623 267,622 282,980 289,020
10.1% 0.7% 7.7% 2.0% 2.1% 2.8%
Monetized Volume as Share
of Total Imports 10.9% 9.2% 0.0% 0.0% 6.8%
Origin 2001 2002 2003 2004 2005 2006 2007 2008 2009 2010 2011
USA 153,492 234,694 203,371 187,384 235,218 248,704 289,226 258,612 252,570 280,378 289,020
Other 33,258 600 13,585 40,200 2,302 37 773 11 15,052 2,602 0
World 186,750 235,294 216,956 227,584 237,520 248,741 289,999 258,623 267,622 282,980 289,020

66
Table 14: Value of Guatemala Soybean Meal Imports by Country of Origin
October-September, $1,000 (CIF)
Source: UN Comtrade for 2001 and 2002 and Global Trade Atlas for 2003 to 2011
Because of Guatemala’s high dependency on imports, international commodity prices play a major role in impacting commercial imports. Soybean meal imports rose steadily from 216,960 MT in 2003 to 290,000 MT in 2007. But high international soybean meal prices reduced imports in 2008 (Table 15). Import prices have remained high and imports in 2011 are still below the 2007 record.
Table 15: Per Unit Price of Guatemala Soybean Meal Imports October-September Year, Dollars per Metric Ton (CIF)
Origin 2001 2002 2003 2004 2005 2006 2007 2008 2009 2010 2011
USA 225 206 212 299 253 256 276 429 441 407 442
World 219 206 214 305 254 256 276 430 441 408 442
Source: UN Comtrade for 2001 and 2002 and Global Trade Atlas for 2003-2011 Impact of Monetized Soybean Meal Imports on Competing Imported Commodities Soybean meal is the only meal that is imported by Guatemala, so monetized soybean meal imports will not impact other competing meal imports.
E. Direct Monetization Costs and Revenues
PCI monetized roughly 1,000 MT of soybean meal in 2010. A bid offer of $406.50/MT was received October 29, 2010, and a contract was signed in November 2010, with product delivery in December 2010. Total monetization proceeds equaled $406,398. Total costs were $489,209, for a cost recovery rate of 83%.
Origin 2001 2002 2003 2004 2005 2006 2007 2008 2009 2010 2011
USA 34,463 48,438 43,215 55,974 59,465 63,741 79,768 111,072 111,258 114,152 127,658
Other 6,483 128 3,153 13,390 799 12 214 11 6,829 1,198 1
World 40,946 48,566 46,369 69,364 60,264 63,753 79,982 111,082 118,087 115,350 127,659

67
Table 16: Direct PCI Soybean Meal Monetization Costs & Revenues - Guatemala
* Non-US flag rate. ** ITSH = Inland Transportation, Storage & Handling Source: PCI
The previous section of this chapter (C.1 “Price Impact”) discussed the process by which PCI established the price and efforts taken to maximize revenues. Freight costs were reduced by coordinating the delivery of the commodity with another organization monetizing soybean meal around the same time.
F. Guatemala Conclusions
Key research questions presented in the introduction to this case study are answered below.
1) Is there sufficient domestic demand and insufficient domestic production to warrant the monetization and importation of soybean meal?
Based on the Informa analysis, soybean meal is of sufficient demand in Guatemala and there is insufficient domestic production. Guatemala does not produce any soybean meal and domestic demand is growing due to growth in per capita poultry meat consumption (and overall poultry meat production). These findings are supported by the USAID 2011 Guatemala Bellmon analysis conducted by Fintrac, which recommended the monetization of soybean meal, finding that soybean meal was eligible for export from the U.S. and for import to Guatemala, was in significant domestic demand, and that Guatemala was a soybean meal-deficit country requiring imports.
Yes
Nov. 2010
Revenues
Volume (MT) 999.75
Sales Price (US$/MT) 406.50
Total Revenues (US$) 406,398
Costs
Commodity (US$/MT) 408.45
Freight* (US$/MT) 79.50
ITSH** (US$/MT) -
Taxes/ Duties/ Port Fees (US$/MT) -
Other (US$/MT) 1.38
Total C&F (US$) 489,209
Cost Recovery 83%

68
2) Does food aid monetization provide benefits that would not be achieved with alternative policy options (e.g., direct program funding)?
Yes
a. Does the monetization of soybean meal add to the feed grain/meal availability and/or quality? And/or has monetization aided market development?
There are no barriers preventing current buyers of monetized soybean meal from being able to purchase a comparable quality product from the open market. While in the past monetization of soybean meal helped provide access to improved feed ingredients, and thereby supported development of the commercial feed and poultry industries, the FY 2011 example did not necessarily add incremental volume to or improve the quality of soybean meal available.
No
b. Is there another reason for monetization over alternative policy options (e.g., direct program funding)?
While there is not necessarily a barrier preventing buyers from purchasing soybean meal from the open market, monetization was a flexible tool available to PCI to fund the ITSH costs for their school feeding program when direct funding was not an available option.
Yes
3) Did PCI receive a reasonable fair market value?
PCI used a local broker, set a floor price and had the buyer take delivery at U.S. port rather than the destination port in Guatemala, practices that contributed to getting a good price for the commodity and minimized PCI’s risk. . Based on the Informa analysis, the price received by PCI is within reasonable margin of error relative to the estimated import parity price and the import implied price.
Yes
4) Has soybean meal monetization had a notable negative impact on local feed grain or meal production in Guatemala?
Guatemala does not produce soybean meal and relies entirely on imports to meet demand. Upon analyzing data for other grains and protein meals, there is insufficient evidence to conclude that soybean meal monetization has had any notable, negative impact on domestic grain or meal production, as soybean meal monetization accounts for 0.7% of overall grain and meal production, and production for each of the key grains/meals has been steady or increasing since the early 2000s. These findings are supported by conclusions from the 2011 USAID Bellmon Estimation for Guatemala, which concluded: “Provided the
No
69
monetization is conducted through an open and competitive process, the team finds that monetization of up to 25,315 MT per year would have no discernible negative impact on the Guatemalan soybean meal market…” Over the past three years, soybean meal monetization has averaged 6,500 MT per program year.
5) Has soybean meal monetization had a notable negative impact on local feed grain or meal imports in Guatemala?
The BEST analysis assumes that as long as monetized imports are 10% or less of total imports, monetized imports will not have an adverse impact on commercial imports. The monetized soybean meal share of total soybean meal imports is small, averaging less than 3% in three of the last four years and under 10% in nine of the last 11 years. These findings are supported by conclusions from the 2011 USAID Bellmon Estimation for Guatemala, which concluded that monetization of a small volume of soybean meal would have no discernible impact on normal trade relations between Guatemala and its usual trading partner in the soybean meal market (the U.S.), but simply would substitute for a small volume of normal U.S. commercial sales in support of food security activities in Guatemala.
No
6) What is the average direct cost recovery rate?
PCI monetized roughly 1,000MT of soybean meal in December 2010 (contract signed November 2010) with a cost recovery rate of 83%.
83%

70
VII. LIBERIA – RICE – LAND O’ LAKES
This chapter analyzes the potential impacts and value of monetized rice in Liberia and specifically examines the rice monetization in FY 2012 conducted by Land O’ Lakes (LOL) under a Food for Progress program. First, a brief overview of food aid in Liberia is provided, which puts monetization, rice monetization and LOL rice monetization in perspective relative to total food aid. Additionally, a program overview of LOL rice monetization in Liberia is provided. Then, the key rationale for monetizing rice in LOL is described, followed by an analysis of its potential market impacts. Finally, overall program costs and benefits are summarized. The analysis presented within this case study aims to answer the following questions: Is there sufficient domestic demand and insufficient domestic production to warrant
the monetization and importation of rice?
Does food aid monetization provide benefits that would not be achieved with alternative policy options (e.g., direct program funding)?
Does the monetization of rice add to the food availability and/or quality in Liberia? And/or has monetization aided market development?
Is there another reason for monetization over alternative policy options (e.g., direct program funding)?
Did LOL receive a reasonable fair market value?
Has the monetization had an adverse impact on domestic production of rice and/or related products?
Has the monetization disrupted commercial trade of rice and/or related products?
What is the average direct cost recovery rate?
A. Food Aid Overview
1. Liberia Food Aid Overview
Total Liberia food aid was 45,040 MT between 2008 and 2010. Of the total food aid, 54% was monetized rice. Under the Food for Progress program, LOL monetized 11,000 MT of rice in FY 2012, the highest level since FY 2006, but only 10% above the PL 480 Title II monetization of 10,110 MT in FY 2010. Regarding future monetization, LOL plans to monetize 6,660 MT in the second year of the program (January 2013). LOL is in communication with ACDI/VOCA and OICI to coordinate these sales since they are conducting P.L. 480 Title II developmental food aid programs in the country.

71
Under the P.L. 480 Title II Liberia development programs, rice was monetized: 3,000 MT in FY 2007, 4,860 MT in 2009 and 10,110 MT in FY 2010 (Table 17). In FY 2006 and FY 2008, rice was monetized under the Food for Progress program, 1,000 MT and 9,000 MT, respectively.
Table 17: Volume and Value of Rice Programmed for Monetization* in Liberia Fiscal Years 2006-2010
Program FY 2006 FY 2007 FY 2008 FY 2009 FY 2010
Title II - Food for Peace
Volume (MT) 0 3,000 0 4,860 10,110
Value ($1,000) 0 1,185.0 0 2,551.5 4,246.2
Per Unit ($/MT) 0 395 0 525 420
Food for Progress
Volume (MT) 1,000 0 9,000 0 0
Value ($1,000) 379 0 3,870.0 0 0
Per Unit ($/MT) 379 0 430 0 0
Total
Volume (MT) 1,000 3,000 9,000 4,860 10,110
Value ($1,000) 379 1,185 3,870 2,551.5 4,246.2
Per Unit ($/MT) 379 395 430 525 420 * Monetized food aid is programmed food aid. Actual food aid shipments may have occurred in the following fiscal year or in some cases the preceding fiscal year from when it was programmed.
Source: USAID for Title II and FAS/USDA for Food For Progress - CCC Purchased.
Table 18: Awardees for Rice Programmed for Monetization for Liberia
Fiscal Years 2006-2010
Fiscal Year Awardee
2006 Visions in Action (VA)
2007 Catholic Relief Services
2008 NA
2009 Catholic Relief Services
2010 ACDI/VOCA and Opportunities Industrialization Centers International
Source: U.S. International Food Assistance Report 2006-2010.
2. Program Overview: Land O’ Lakes – Liberia – Rice
Years after the 1999-2003 civil war in Liberia ended, the country is still on the road to recovery. Threats to Liberia’s food security include: residual effects of war; population displacement, limited infrastructure, poor sanitation, and poor water quality. Thirty percent of the country’s children are stunted and 19% underweight. The conflict severely reduced the country’s agricultural capacity. Although the goal of the government is to transition from food aid to food self-sufficiency, the country still is far off from that goal.

72
The three-year (2011-2014) Food for Progress program in Liberia awarded to LOL receives the majority of its proceeds through monetization. Since November of 2011, the monetization of U.S. parboiled rice by LOL in Liberia has brought in just under $8.5 million. Monetization revenues from the program will help LOL to increase Liberia’s goat production industry, which suffered during the Liberian Civil Wars. Goat meat is a mainstay in Liberian diets, and the funds will serve to develop commercial goat production by distributing 9,330 goats to farmers, constructing a slaughter facility in Monrovia that will include on-site cold storage, training veterinary technicians (as there are currently only two veterinarians in Liberia), renovating meat shops in three counties, and providing training in animal husbandry, fodder production and business management to 10,000 producers, among other activities. Land O’ Lakes also plans to lead a campaign focusing on the hygienic handling of foods and nutrition, which is estimated to reach more than 110,000 rural households.26
B. Liberia Rice Monetization Rationale
According to USAID Bellmon analyses, “To warrant importation and sale of monetized food aid, both local dietary preferences and available market information must strongly suggest that a commodity is consumed in significant amounts (e.g., there is significant demand), and that national production is insufficient to meet the demand (e.g., there is insufficient national supply to meet demand).”27 This section analyzes whether or not rice meets both of the above criteria necessary to warrant the importation and sale of monetized rice in Liberia. Then, additional rationale will be described specific to LOL rice monetization in Liberia.
1. Rice Supply and Demand – Sufficient Domestic Demand, Yet Insufficient Domestic Production
Similar to other Bellmon analyses conducted by Fintrac Inc. for USAID, the Bellmon analysis for Liberia in August 2009 (hereafter called “USAID Liberia Bellmon analysis”) made a determination to monetize rice using the criteria that (i) rice must be both eligible for export from the U.S. and eligible for import to the recipient country, and (ii) there must be significant domestic demand, but insufficient domestic production. Using the general criteria used in the USAID Liberia Bellmon analysis, the analysis presented in this section confirms that the basic criteria for rice monetization in Liberia are met: rice is both eligible for export from the U.S. and import into Liberia, and Liberia’s domestic production does not meet domestic demand, thereby requiring rice imports.
26
As described in http://www.idd.landolakes.com/PROJECTS/Africa/ECMP2-0164835.aspx. 27
This quote comes from the 2011 USAID Bellmon Estimation for Uganda, however it applies across any monetization case.

73
Prior to the civil wars28, Liberia did not produce enough rice to cover its domestic consumption demands, and the rice Liberia does produce is generally of poor quality. Rice production did not really begin to recover until the mid-2000s. Since then, rice production has recovered to the point where 2011 milled rice production is 151% of pre-war levels (1998). However, the rice produced in Liberia is consumed locally and of poor quality, often with small stones due to poor harvesting techniques. In its 2010 Strategic Review for a Feed the Future initiative in Liberia, USAID stated that “local [Liberian] rice is not processed well and, thus, not preferred by urban consumers.” In addition to domestically produced rice quality issues, despite Liberia’s rice production recovery following the wars, the volume produced still does not meet domestic consumption. Since 2005, production only has accounted for between 30% and 55% of Liberia’s domestic demand, accounting for 48% in 2010 (see Table 19).
Table 19: Liberia Rice Supply and Demand (MT)
Source: USDA Foreign Agricultural Service PSD (production, imports, consumption); USAID Food Aid Data
Rice is a staple in Liberian diets and this point is evident when looking at the share of rice (based on kg/capita/yr) in the Liberian diet. According to 2007 data from FAO (the most recent data made publically available), cereals account for 23.0% of the Liberian diet, and rice accounts for 73.1% of cereals consumed. Rice accounts for roughly 50% of the average adult’s caloric intake in terms of its energy role.29
28
The First Liberian Civil War lasted from 1989 to 1996, while the Second Liberian Civil War was from 1999 to 2003. 29
http://microlinks.kdid.org/sites/microlinks/files/resource/files/GFSR_Liberia_Rice_VC_Analysis.pdf.
2005 2006 2007 2008 2009 2010
Production 96,000 66,000 101,000 113,000 181,000 185,000
Imports 225,000 165,000 210,000 140,000 150,000 200,000
Of Which, Monetized Food Imports 0 1,000 3,000 9,200 4,900 10,100
Consumption 321,000 231,000 311,000 253,000 331,000 385,000
Production/Consumption 30% 29% 32% 45% 55% 48%

74
Figure 14: 2007 Liberia Food Supply (kg/capita/yr)
Food Supply Food Supply - Cereals
Source: FAO.
The Government of Liberia has a policy to strive toward self-sufficiency in rice production, and rice production in Liberia is expected to continue increasing as a result. However, both total and per capita consumption also are likely to continue increasing due to population growth, Liberia’s growing economy, and an upward trend in consumption (both total and per capita) that resumed after a significant drop during the years of the First Liberian Civil War.30 As a result, Liberia is expected to remain dependent on rice imports to meet domestic needs. The above analysis concludes that rice meets the basic supply and demand requirements to warrant the import and sale of monetized rice in Liberia. There is significant demand and national production is insufficient to meet demand. This is supported by the USAID Liberia Bellmon analysis, which recommended parboiled rice for monetization “given Liberia’s high demand for rice, insufficient domestic production (low yield and productivity, among other reasons), and growing year-on-year demand.”
2. Commercial Import Limitations and/or Additional Monetization Rationale
In addition to the above criteria of sufficient demand and insufficient supply, the USAID Liberia Bellmon analysis also evaluated the competitive environment for rice in Liberia and the possibility that a fair market value could be obtained and concluded favorably to the monetization of rice in Liberia.
30
According to data from FAOSTAT.
Starchy Roots 38.8%
Cereals -Excl. Beer
23.0%
Fruits - Excl. Wine 10.7%
Vegetables 5.6%
Sugarcrops, Sugars, & Sweetners
3.9%
Vegetable Oils 3.8%
Meat & Offals 2.3%
Other 8.0%
Wheat 26.73%
Rice (Milled Equiv.) 73.07%
Oats 0.20%

75
As discussed in greater detail in subsequent chapters, monetization: Helps stabilize rice supplies and, thus, food availability and consumer prices.
Without monetization, commercial rice imports would be largely cost-prohibitive.
C. Impact on the Domestic Market
1. Price Impact
Overview Did LOL receive a reasonable fair market value?
Yes – Based on the Informa analysis, the price received by LOL was well within a reasonable margin of error relative to the estimated import parity prices; a measure used to assess fair market value.
Price Establishment Process A tender was announced in two Liberian papers and tender documents were hand delivered to all rice importers. The tender invitation specified:
The seller - USDA, Food for Progress food aid via LOL;
The delivery point - delivered to buyers conveyances alongside vessel;
The commodity specifications and volume – 11,000 MT of milled rice (long, medium, or short grain milled rice grading U.S. No.2 or better);
Form – 50 kg woven polypropylene bags;
Credit requirements - 10% prepayment required upon signing and an irrevocable signed letter of credit by bank of seller’s choice for remaining 90%;
Minimum bid price - $660/MT;
Currency – all bids submitted in US$; and
Minimum volume - bid can be for full 11,000 MT or in lots of 5.5 thousand MT.
LOL received six bids in response to the tender announcement from private Liberian rice importers approved by the Ministry of Commerce and Industry. The six bidders were the only importers licensed to import rice. These importers are well-established with good credit ratings and suitable warehouses. Of the six bids, one bid was eliminated because it was under the minimum bid price that LOL established based on an assessment of prevailing market prices for similar commodities. LOL also eliminated the highest bidder because its submission was incomplete. Then, of the remaining four bidders, LOL selected the two highest. However, USDA asked LOL to re-negotiate with those two plus the highest bidder that had originally been eliminated due to an incomplete offer. None of the three had submitted bids for the full 11,000 MT and USDA asked LOL to negotiate to see if one of

76
the buyers would take all of the tonnage. Two immediately dropped their offer price by 25%, but the highest bidder stayed at, or close to, its original offer. LOL sold the full 11,000 gross MT of rice (gross as the buyer paid for 11,024 MT of which the additional 24 MT covered the bags) to the highest bidder for $770/MT, a large market player in Liberia. The final sale price was reduced because the original quantity bid upon was a smaller lot. This case was unique in that USDA agreed to a bank guarantee by the only U.S. Treasury-compliant bank in Liberia, whereby payments for the rice were spread over a 60-day period from arrival in port, with a 15% advance payment. Price Received vs. Alternative Market Price Estimates The most recent rice monetization transaction resulted in six bids (all private importers), with the winning bid being from a large importer. While this transaction yielded six bids, the government of Liberia controls the companies that can import rice, and these six were the only importers holding a government-issued import license at the time. Due to the government control over import licenses, past rice monetizations have included fewer bidders, therefore reducing potential competition. However, despite the government control over import licenses, LOL compared the final price received with what it would have cost to import parboiled rice from Brazil, and found that the price received from the monetization was in line with the commercial Brazil rice import price at the time. This conclusion is supported by the Informa analysis presented in this section. Figure 15 illustrates the rice price LOL received relative to the estimated import parity price (IPP). The price received by LOL reflects the month and year the bid was made. The IPP is intended to provide parameters to examine whether or not the price received by LOL was reasonable relative to the price buyers could have received by importing commercially at commercial-scale volumes from the U.S. (a key exporter of parboiled rice). This U.S. series was utilized in this analysis to compare the quality and type of rice with that received via monetization. Based on this analysis, the price received by LOL was well within the reasonable margin of error for the estimated IPP. The IPP was estimated using the same methodology as applied to all the other case studies within this report. An estimated IPP was calculated by taking the U.S. Gulf FOB price of parboiled rice (sacked) and adding estimated freight costs (includes estimated insurance and port costs) to Monrovia, Liberia. This resulting IPP and LOL price received are illustrated in Figure 15. An error of +/- 10% is illustrated around the estimated IPP to account for error and range in the estimation. If the price received is within this band, Informa concludes that the price received was within a reasonable margin of error and, thus, a fair market value. In this case, the price received was above the estimated IPP reasonable margin of error.

77
Figure 15: Liberia – Rice - LOL: Price Received vs. Estimated Import Parity Price
* Import Parity Price (IPP) – FOB U.S. Gulf parboiled rice price + estimated freight costs (includes estimated insurance and port costs) from the U.S. Gulf to Monrovia, Liberia. **The LOL price received reflects the month and year the bid was made by the buyer. Sources: LOL; USAID Liberia Bellmon Estimation; and Informa Economics The USAID 2009 Liberia Bellmon analysis concluded that commercial prices were higher than historical monetization prices received by Catholic Relieve Services (CRS). Based on the Informa analysis, the 2007 CRS monetization price was below the estimated Import Parity Price (IPP) while the 2009 price is right at the low end of the IPP margin of error band. However, the 2012 LOL monetization price was well above the IPP margin of error band.
2. Production
As noted within the literature review, one commonly cited argument against monetized food aid is that it can displace domestic production of the commodity being monetized and/or the production of related products. This section aims to analyze whether or not the monetization of rice in Liberia has had any notable negative impact on the domestic production of rice and/or related products. For purposes of this analysis, related product crops, referenced throughout this section, include all cereals and roots & tubers (e.g., cassava, sweet potatoes, taro, and yams). Overview Has monetization of rice in Liberia had an adverse impact on local rice
production and/or the production of related products?

78
No – Over the past 3 years, monetized rice has accounted for only 1.2% of total related product crop production and 3.5% of rice production. Upon analyzing correlations and trends between food aid (total food aid, monetized food aid and monetized rice) and Liberia’s domestic crop production (total related product crop production and rice), no significant negative correlations where found. In fact, the period of highest monetization volumes have coincided with the highest historical period of domestic rice production.
Impact of Monetized Rice on Production Rice accounts for nearly all of the cereal production in Liberia, but it is a smaller portion of total related product crop production (cereals and roots & tubers). Rice (milled equivalent) accounts for 21% of the key cereal and roots and tuber crops (e.g., cassava, sweet potatoes, taro, and yams). Despite increases in monetized rice over the past several years, those increases have been small in comparison to local production and rice production has increased notably since the mid-2000s. Rice production declined between 2000 and 2003 during the time of Liberia’s second civil war. According to the USAID 2009 Liberia Bellmon analysis, the agricultural sector historically has been divided into commercial and subsistence farmers, whereby the commercial farms provided job opportunities to the subsistence farmers, but the war devastated the commercial sector and displaced a large number of subsistence farmers. Rice production did not really begin to recover until the mid-2000s when gradual annual increases began to take hold. However, since then, rice production has recovered. According to recent FAS data, 2011 milled rice production is 151% of pre-war levels (1998). The production of other related product crops fared better throughout the period of the war, increasing steadily from 1995 to about 2001, and, as rice began to recover, production of these other crops became relatively stagnant, remaining at levels around 580,000 MT over the past five years. Food aid, particularly non-monetized food aid, was most prevalent during the years following the war. Then, as rice production began to recover, total food aid declined. Between 2008 and 2010, total food aid accounted for 7% of rice production and 2% of total related product crop production. Monetized food aid percentages are significantly smaller. Over the past three years, monetized rice has accounted for only 1.2% of total related product crop production and 3.5% of rice production. Figure 16 serves two purposes: (i) it provides perspective regarding the small volumes of monetized rice relative to total rice and related product crop production and (ii) it illustrates the lack of any significant correlation/relationship between monetization and production of these crops. In fact, the period of highest monetization volumes have coincided with the highest historical period of domestic rice production. Total monetized food aid in Liberia has exhibited a strong upward trend since the early 2000s. Meanwhile, domestic production of examined crops has also exhibited an upward trend.

79
Please note that in order to illustrate the comparison of these trends, monetization volumes are shown on a separate axis because the monetization volumes are so small relative to crop production.
Figure 16: Liberia Rice and Related Product Crop Production & Monetization Trends*
* Please note: (i) that monetized food aid is on the second axis, as values are considerably lower than production and (ii) the illustrated historical production data goes back to 1990 while the monetized food aid data goes back to 2001; however, this does not necessarily imply that food aid monetization began in 2001.
** Monetized food aid volumes are based on programmed food aid data from the USDA, FAS (FFP-CCC and FFE- Govt/PVO) + monetized data from USAID. This is programmed food aid, actual food aid shipments may have occurred in the following fiscal year or in some cases the preceding fiscal year.
Source: USDA, FAS; USAID; FAO, and Informa Economics.
Given monetized rice, accounts for such a small portion of overall domestic production, any significant negative impact on domestic food production would not be expected. As illustrated in Figure 16, there is no apparent or statistically significant correlation between monetized rice and rice (or related product) production in Liberia. Upon analyzing correlations and trends, no significant negative correlations where found and most correlations were positive (e.g., the higher the monetization level, the more production). It is important to note that causality or lack of causality should not be definitively concluded from this positive correlation, as there are many other factors influencing crop production levels. However, this simple correlation analysis does support the conclusion that rice monetization has not had any notable, negative impact on Liberia crop production.

80
3. Internal Market Development
As LOL just started its program in Liberia and the first shipment under this program arrived in Liberia in July 2012, it is too early to judge any market development as a result of the monetization.
4. Consumers/Food Availability
While monetized rice shipments account for a small portion of domestic production, they have, at times, served to increase rice—especially parboiled rice—availability. The 2012 rice monetization, for example, came at a time when Liberian stocks of parboiled rice were running low. Furthermore, parboiled rice is a higher quality rice that is in particularly high demand ahead of Liberian holidays. As a result, monetized parboiled rice imports serve to meet this seasonal demand, and, moreover, increase the availability of this higher quality rice on the Liberian market. Additionally, monetization proceeds have helped to fund development activities that have positively impacted farmer incomes and nutrition. FAO reports that an estimated two-thirds of Liberia’s cereal consumption requirements, estimated at about 530,000 MT, are covered by imports. Rice is Liberia’s most consumed staple, accounting for 86% of cereal consumption and nearly 80% of total cereal imports. Import prices have been on an upward trend because of higher international rice prices and also because the Liberian currency gradually has depreciated, making imports more expensive. Since about two-thirds of Liberian households depend on market access for food supplies, higher food prices would aggravate the food security conditions for vulnerable households. Liberia is highly reliant on rice imports. Liberia only produces about 40% to 50% of the rice it needs to feed its population, relying on imports to cover the remaining portion. Domestic rice production (milled basis) averaged around 185,000 MT the last three years while commercial imports have averaged around 200,000 MT, according to FAS/USDA. Most of the local rice production is consumed by farm families and does not enter the commercial market due to poor quality. Total rice demand is growing in Liberia because the population is growing and there is also increased demand from an influx of refugees from Cote d’Ivoire. FAS forecasts Liberia’s rice imports at 220,000 MT in 2011/12. FAO GIEWS forecasts even higher 2011 rice imports with commercial imports estimated at 260,000 MT and food aid imports at 10,000 MT. Monetization helps stabilize food availability in a market with rising import prices and a depreciating currency, and both factors have a significant impact on buyers’ ability to pay, particularly since Liberia is a least developed country. During 2008 and 2009, commercial rice imports declined by 67,900 and 53,600 MT, respectively, relative to the previous three-year average. Rice monetization did not completely compensate for this decline, but monetized rice volumes did increase relative to levels monetized in

81
previous years. The 2008 and 2009 monetized rice was 7,200 MT and 3,500 MT, respectively, above the previous three-year average. Liberia imports three main types of rice, long grain parboiled rice, medium and short grain “butter” rice, and long grain white rice. Compared to “butter rice,” which is imported from China and is the most frequently consumed rice in Liberia, parboiled rice is of higher quality and is, therefore, preferred by those who can afford its price premium to “butter rice.” Furthermore, according to the local LOL representative in Liberia, who is familiar with Liberian consumers and rice monetization, U.S. parboiled rice has a good reputation. Parboiled rice is in high demand for special holidays, just ahead of Independence Day (July 26) and before Christmas Day. Land O’ Lakes, under a Food for Progress program awarded in November/December of 2011, receive the majority of their program funding through monetization proceeds. The sales revenues are used to increase Liberia’s goat production, which suffered during the Liberian Civil Wars. Land O’ Lakes also plans to run a campaign focusing on the hygienic handling of foods and nutrition, which they estimate should reach more than 110,000 rural households.31
D. Impact on Commercial Trade
Overview Food monetization does not disrupt commercial trade or trade with competing commodities for the following reasons:
The monetized rice share of total rice imports is small, averaging only about 3% for the last five years. The USAID Liberia Bellmon analysis assumes that, as long as monetized imports are 10% or less of total imports, monetized imports will not disrupt commercial imports.
Monetized rice imports do not disrupt imports of other commodities since rice dominates imports accounting for about three-fourths of total cereal imports.
Impact of Food Aid Monetization on Commercial Imports and Imports of Other Commodities U.S. No. 2 parboiled rice has been monetized in Liberia a number of times. In FY 2010, 10,100 MT of rice was monetized under a P.L. 480 Title II program. In FY 2012, monetized rice accounts for only about 5% of Liberia’s total rice imports, and, thus, is unlikely to have any significant impact on commercial imports. Plus, commercial imports continue to grow. 2012 import projections are around 11,000. However, Liberia’s total rice import needs could be higher than expected in 2012 due to the poor rice harvest in
31
As described in http://www.idd.landolakes.com/PROJECTS/Africa/ECMP2-0164835.aspx

82
February (especially in the southeastern region) as a result of the change in rainfall patterns. Monetized rice imports represent only a small share of total imports (0.6% in FY 2006 and 5% in FY 2010), plus commercial imports have continued to rise. While monetized rice food aid to Liberia increased from 1,000 MT in FY 2006 to 10,110 MT in FY 2010 and could total 11,000 MT in FY 2012, all rice imports also have increased steadily, rising from 140,000 MT in 2007/08 to an expected 220,000 MT in 2011/12. While monetized rice volumes did increase as commercial imports dropped in 2008 and 2009, due to high international rice prices and currency devaluation that increased the price of imported rice, since 2009, both commercial imports and monetized rice imports have both increased (see Figure 17). Rice monetization does not have a notable impact on commercial trade, as it accounts for such a small share of total volume and as total imports have trended upward over the past several years. It is unlikely that monetized parboiled rice displaces imports of lower quality rice since the buyer is one of the larger importers and the monetized rice is a small portion of its total rice imports and parboiled rice is not directly competitive with lower quality rice. However, without monetization, parboiled buyers would be unlikely to purchase similar quantities of the high quality and more costly parboiled rice.
Figure 17: Liberia – Monetized and Commercial Rice Imports
Source: FAS/USDA and USAID for monetized food aid and Global Trade Atlas for total imports derived from world exports to Liberia
Impact of Monetized Rice Imports on Competing Imported Commodities Rice monetization has little impact on other food imports because rice is, by far, the top food staple and largest food import item in Liberia (Table 20). According to GIEWS
0
50,000
100,000
150,000
200,000
250,000
2001 2002 2003 2004 2005 2006 2007 2008 2009 2010
Metr
ic T
on
s
Monetized Rice Imports Commercial Imports
0.6% 1.4% 6.6% 3.3% 5.1%

83
Cereal Supply/Demand Balances for Sub-Saharan Africa, anticipated rice imports are estimated to account for 78% of total cereal imports in marketing year 2011.
Table 20: Liberia Anticipated Import Requirements for 2011 Marketing Year
Wheat Rice Coarse Grains
Total
Commercial Imports 50 260 20 330
Food Aid Needs 5 10 1 16
Total Imports 55 270 21 346 Source: GIEWS.
Figure 18: Liberia’s Top Twenty Food Imports, in 2009.
Source: FAO.
Liberia imports three main types of rice:
Long grain (15-25 percent broken) parboiled rice from either China or the U.S.;
Medium and short grain “butter” rice from China; and
Long grain (15-25 percent broken) white rice, mainly from India, but also from elsewhere in Asia.
Liberian government trade data on rice imports by country of origin is not available. This study used Global Trade Atlas (GTIS) export data (where Liberia was the destination) to derive Liberia import data. Although GTIS data slightly underestimates total rice exports to Liberia because it does not include all countries of the world, the data show major rice trade partners of Liberia. Based on GTIS trade data, Liberia imported 192.96 thousand MT of rice in FY 2011. Thailand is currently the largest supplier of rice to Liberia, accounting for 38% of the market. The United States became the second largest supplier in FY 2011 and gained market share, accounting for 30% of the market
14,836
11,711
8,0006,731
5,276 5,133 4,8594,000 3,860 3,300 3,200 2,600 2,164 2,081 2,000 1,766 1,753
37,799
11,930
5,250
0
5,000
10,000
15,000
20,000
25,000
30,000
35,000
40,000
Mill
ed R
ice
Bre
akfa
st C
erea
ls
Palm
Oil
Food Pre
ps Nes
Whea
t Flo
ur
Cig
aret
tes
Bev
erag
es N
on-Alc
oholic
Whea
t
Chic
ken
Pastry
Sugar R
aw
Eggs in
Shel
l
Veget
able
Oil
Nes
Sugar R
efin
ed
Pulses
Nes
Bee
r of B
arle
y
Molk
Whole
Drie
d
Onio
ns
Sugar C
onfect
ionar
y
Mar
garin
e
$1,0
00

84
compared with only 9% in FY 2010 and 7% in FY 2009. China had been the largest rice supplier to Liberia until FY 2009 and currently ranks third with 18.5% of the market.
Table 21: World Rice Exports to Liberia October-September Year, Metric Tons
Origin 2005/06 2006/07 2007/08 2008/09 2009/10 2010/11
Thailand 5,996 338 2,615 31,027 75,239 73,391
United States 12,453 15,260 16,786 10,813 12,844 58,603
China 109,827 192,212 121,562 102,595 42,500 35,781
Brazil 0 0 0 568 5,300 17,099
Cote d’Ivoire 2,911 0 0 0 11 5,125
Other 15,260 1,545 890 3,357 1,720 2,960
Total 146,447 209,355 141,853 148,360 137,614 192,959 Source: Global Trade Atlas.
Table 22: World Rice Exports to Liberia October-September Year, $1,000 (FOB)
Origin 2005/06 2006/07 2007/08 2008/09 2009/10 2010/11
Thailand 1,687 142 1,195 9,224 23,991 31,474
United States 4,682 6,002 8,015 6,845 7,253 26.061
China 22,846 42,110 37,500 41,038 15,754 14,135
Brazil 0 0 0 173 1,670 7,214
Cote d’Ivoire 1,220 0 0 0 21 3,425
Other 5,717 312 487 912 1,019 1,348
Total 36,152 48,566 47,197 58,392 49,708 83,657 Source: Global Trade Atlas.
Table 23: World Rice Exports to Liberia
October-September Year, Dollars per Metric Ton (FOB)
Origin 2005/06 2006/07 2007/08 2008/09 2009/10 2010/11
Thailand 281 421 457 297 319 420
United States 376 393 478 633 565 445
China 208 219 308 400 371 395
Brazil 0 0 0 304 315 422
Total 247 232 333 394 361 434 Source: Global Trade Atlas.
E. Direct Monetization Costs and Revenues – Cost Recovery
LOL monetized 11,000 MT of rice in 2012; another transaction is currently in process for delivery in FY 2013. Total 2012 monetization proceeds equaled $8,488,480 and total costs incurred were $8,900,755 for a cost recovery rate of 95% (see Table 24). All inland transportation, storage and handling are covered by the buyer, as the product

85
was delivered to buyers’ conveyances alongside vessel. This is a high cost recovery rate relative to many of the other programs and monetization cases evaluated. The previous section of this chapter (section C, “Price Impact”) discussed the process by which LOL established the price and efforts taken to maximize revenues.
Table 24: Direct LOL Rice Monetization Costs & Revenues - Liberia
* Non-US flag rate. ** ITSH = Inland Transportation, Storage & Handling. Source: Land O’ Lakes.
F. Liberia Conclusions
Key research questions alluded to in the introduction to this case study are answered below.
1) Is there sufficient domestic demand and insufficient domestic production to warrant the monetization or importation of rice?
Based on the Informa analysis, rice is of sufficient demand in Liberia and there is insufficient domestic production. These findings are supported by Fintrac (2009 Liberia Bellmon analysis), which recommended the monetization of rice, finding that rice was eligible for export from the U.S. and for import to Liberia, and that it was in significant domestic demand, and that Liberia was a rice-deficit country requiring imports.
Yes
2) Does food aid monetization provide benefits that would not be achieved with alternative policy options (e.g., direct program funding)?
Yes
2012
Revenues
Volume (MT) 11,000
Sales Price (US$/MT) 770.00
Total Revenues (US$) 8,470,000
Costs
Commodity (US$/MT) 635.78
Freight* (US$/MT) 173.00
ITSH (US$/MT) -
Taxes/ Duties/ Port Fees (US$/MT) -
Other (US$/MT) -
Total C&F (US$) 8,896,603
Cost Recovery 95%
86
a. Does the monetization of rice add to food availability and/or quality? And/or has monetization aided market development?
The volume of rice recently monetized in Liberia is small in comparison with Liberia’s total annual rice imports. Consumers demand more higher-quality parboiled rice, particularly ahead of large holidays—namely, Independence Day (July 26) and Christmas Day. As a result, the monetized rice, does contribute somewhat to the availability of higher quality, parboiled rice. In addition, monetized rice imports have added parboiled rice to the Liberian market at times when local parboiled rice supplies were running low (e.g. January 2012 during LOL’s recent sale of U.S. rice). The monetization of rice provides an opportunity for the six licensed Liberian rice importers to buy high-quality parboiled rice, a commodity that is in high demand among Liberian consumers who can afford it given its slight premium over the more widely consumed “butter rice.” The six importers would not import as much parboiled rice commercially because it would be cost-prohibitive, which is overcome by selling in small lots and allowing incremental payments.
Yes
b. Is there another reason for monetization over alternative policy options (e.g., direct program funding)?
No
3) Did LOL receive a reasonable fair market value?
Based on Informa analysis, the price received by LOL was well within a reasonable margin of error relative to the estimated import parity prices.
Yes
4) Has rice monetization had an adverse impact on local rice or related product production in Liberia?
Over the past three years, monetized rice has accounted for 1.2% of total related product crop production and 3.5% of rice production. Upon analyzing correlations and trends between monetized rice and Liberia’s domestic crop production (total related product crop production and rice), no significant negative correlations were found. In fact, the period of highest monetization volumes has coincided with the highest historical period of domestic rice production.
No

87
5) Has rice monetization disrupted rice or related product imports into Liberia?
The USAID Liberia Bellmon analysis assumes that as long as monetized imports are 10% or less of total imports, monetized imports will not have an adverse impact on commercial imports. Monetized rice imports represent only a small share of total imports (0.6% in FY 2006 and 5% in FY 2010), and commercial imports have continued to rise. Therefore, the monetized imports have had no notable impact on commercial rice imports in Liberia.
No
6) What is the average direct cost recovery rate by LOL?
LOL monetized 11,000 MT of rice in FY 2012. The cost recovery rate for this transaction was 95%.
95%

88
VIII. MOZAMBIQUE – WHEAT – WORLD VISION
This chapter analyzes the potential impacts and value of monetized wheat in Mozambique and looks specifically at wheat monetization conducted by World Vision (WV) under a P.L. 480 Title II development program. First, a brief overview of food aid in Mozambique is provided, which puts monetization, wheat monetization, and WV wheat monetization in perspective relative to total food aid. Additionally, a program overview of WV wheat monetization in Mozambique is provided. Then, the key rationale for monetizing wheat in Mozambique is described, followed by an analysis of its potential market impacts. The analysis presented within this case study aims to answer the following questions: Is there sufficient domestic demand and insufficient domestic production to warrant
the monetization or importation of wheat?
Does food aid monetization provide benefits that would not be achieved with alternative policy options (e.g., direct program funding)?
Does the monetization of wheat add to the food availability and/or food quality in Mozambique? And/or has monetization aided market development?
Is there another reason for monetization over other alternative policy options (e.g., direct program funding)?
Did WV receive a reasonable fair market value?
Has the monetization had an adverse impact on domestic production of wheat and/or related products?
Has the monetization disrupted commercial trade of wheat and/or related products?
What is the average direct cost recovery rate?
A. Food Aid Overview
1. Mozambique Food Aid Overview
Total Mozambique food aid was 249,130 MT between 2008 and 2010. Of the total food aid, 89% was monetized wheat. World Vision monetized 49,000 MT of wheat in 2010 under a P.L. 480 Title II DAP; representing 100% of the wheat monetized under Title II that year and 70% of total monetized wheat, as reported by USDA, FAS and USAID (the other 30% was monetized under Food for Progress programs). World Vision monetizes on behalf of a group of PVOs that are conducting Title II development programs in Mozambique. Therefore, the proceeds are used for development activities conducted by WV as well as the other PVOs, in accordance with their individual agreements with USAID (called “Multi-year Assistance Programs,” or “MYAPs”).

89
Wheat is monetized in Mozambique under Title II and Food for Progress (FFP). Title II usually accounts for more than 50% of monetized wheat food aid (Table 25). Since FY 2010, Title II monetized food aid has been decreasing.
Table 25: Volume and Value of U.S. Wheat Programmed for Monetization* for Mozambique, Fiscal Years 2001-2010
* Monetized food aid is programmed food aid while actual food aid shipments may have occurred in the following fiscal year or in some cases the preceding fiscal year. Sources: FAS/USDA for monetized food aid under “Food for Progress CCC Purchased” and USAID for monetized food aid under “PL480 Title II”.
2. Program Overview: World Vision – Mozambique - Wheat Monetization
WV is currently monetizing hard red winter wheat in Mozambique under P.L. 480 Title II. While WV has monetized wheat in Mozambique since 1997, and vegetable oil under Title II during certain years, WV is currently leading a Monetization Consortium (MONCON) of PVOs that are implementing five-year (August 2008 to July 2013) Multi-Year Assistance Programs (MYAPs). The MYAPs include $100 million in funding through the monetization of 142,000 MT of U.S. wheat over five years. Monetization sales revenues are used by PVOs in the consortium (including World Vision, Food for the Hungry, Save the Children, Adventist Development and Relief Agency, and four sub-PVOs) to fund agricultural development and other food security activities. Specific activity goals include improving crop quality and productivity, promoting better nutrition and health, increasing communities’ resilience to shocks, increasing food availability/access for poor households, increasing rural incomes, increasing literacy, and preventing disease. Focusing on the very poor, PVOs carry out a variety of activities, such as:
2001 98,400 14,700.7 149 0 0.0 0 98,400 14,700.7 149
2002 60,400 8,249.5 137 0 0.0 0 60,400 8,249.5 137
2003 61,700 10,877.9 176 17,000 2,278.0 134 78,700 13,155.9 167
2004 64,070 11,403.9 178 0 0.0 0 64,070 11,403.9 178
2005 30,000 5,850.0 195 0 0.0 0 30,000 5,850.0 195
2006 47,999 8,831.8 184 11,100 2,259.4 204 59,099 11,091.2 188
2007 49,850 11,013.3 221 20,000 4,300.0 215 69,850 15,313.3 219
2008 30,940 12,994.8 420 41,100 8,827.9 215 72,040 21,822.7 303
2009 45,560 11,845.6 260 35,600 11,164.0 314 81,160 23,009.6 284
2010 49,040 14,025.4 286 20,000 5,200.0 260 69,040 19,225.4 278
Price
per Ton
Quantity
(MT)
Value
($1,000)
Price
per Ton
Quantity
(1,000
PL480 Title II (USAID)
Food for Progress - CCC
Purchased (FAS/USDA) Monetized* US Wheat AidQuantity
(MT)
Value
($1,000)
Price
per Ton
Value
($1,000)
Fiscal
Year
(Oct-
Sep)

90
Develop farmer associations so farmers can learn from one another, can share in product marketing, and can negotiate better prices;
Promote improved agricultural methods, such as improved inputs and techniques to maximize yields and prevent post-harvest losses, and improved marketing methods and storage capacity;
Provide training in farming as a business, rather than just for subsistence, and broadening livelihood options;
Target the same communities where agricultural development activities are taking place for nutrition and health intervention, including improving sanitation, access to health services, the diets of pregnant and lactating women and children under the age of five, and the nutritional practices of child caretakers.
The activities enabled through the monetization of wheat in Mozambique undercurrent Title II MYAPs reach 200,000 farmer households and 375,000 young children and caretakers, and 100,000 households are increasing their ability to mitigate shocks.
B. Mozambique Wheat Monetization Rationale
According to USAID Bellmon analyses, “to warrant importation and sale of monetized food aid, both local dietary preferences and available market information must strongly suggest that a commodity is consumed in significant amounts (e.g., there is significant demand), and that national production is insufficient to meet the demand (e.g., there is insufficient national supply to meet demand).”32 This section analyzes whether or not wheat meets both of the above criteria necessary to warrant the importation and sale of monetized wheat in Mozambique. Then, additional rationale will be described specific to WV wheat monetization in Mozambique.
1. Wheat Supply and Demand – Insufficient Domestic Production, Yet Sufficient Domestic Demand
In January 2008, the Emerging Markets Group (EMG) concluded an extensive Bellmon analysis33 that made a positive determination that hard wheat was fit for monetization in Mozambique, after numerous monetizations of hard wheat for roughly 15 years. Using the criteria applied in more the 2009 Mozambique Bellmon analysis by Fintrac Inc., we have similarly found that wheat supply and demand conforms to these criteria. That is, hard wheat is eligible for import into Mozambique and export from the U.S., and Mozambique has significant wheat demand that is not met by domestic production, thereby requiring wheat imports.
32
This quote comes from the 2011 USAID Bellmon Estimation for Uganda, however it applies across any monetization case. 33
Emerging Markets Group (EMG). 2008. Mozambique: FY08-12 Bellmon Monetization and Distribution Analysis. Final Report. Maputo: EMG.

91
Mozambique is not a commercial wheat producer. Instead, cassava is the crop that accounts for the largest production in Mozambique (based on tonnage), followed by sugarcane and maize (Figure 19). As a result, Mozambique has insufficient domestic wheat production to meet its domestic demand. This finding is shown in Table 26, where Mozambique produced 3,000 MT of wheat in FY2010, yet consumption for that year totaled 526,000 MT. Production, therefore, accounted for roughly half of a percent of the country’s domestic consumption. Since FY2005, the production-to-consumption ratio has been similar to that of FY2010, ranging from 0.53% to 1.23% of Mozambique’s domestic wheat demand (Table 26).
Figure 19: Top Crops Produced in Mozambique, by Volume
Source: FAOSTAT
Table 26: Mozambique Wheat Supply and Demand (MT)
Source: USDA Foreign Agricultural Service PSD (production, consumption); Global Trade Atlas (imports); USAID Food Aid Data
0
5,000,000
10,000,000
15,000,000
20,000,000
25,000,000
30,000,000
MT
2005 2006 2007 2008 2009 2010
Production 3,000 3,000 3,000 3,000 3,000 3,000
Imports 463,434 478,268 394,406 243,084 460,367 465,395
Of Which, Monetized Food Imports 30,000 59,099 69,850 72,040 81,160 69,040
Consumption 497,000 511,000 568,000 244,000 397,000 526,000
Production/Consumption 0.60% 0.59% 0.53% 1.23% 0.76% 0.57%

92
Most of the wheat consumed in Mozambique is in the form of flour34, but some wheat is also consumed as pasta. The authors of a 2010 study (Donovan et al.) that evaluated the impacts of wheat and vegetable oil monetizations in Mozambique from 1997 to 2007 wrote that certain officials in Mozambique believed that the consumption of wheat—particularly in bread and noodles—is increasing as a result of demand for the two foods from urban consumers, who appreciate the convenience (low preparation time) of bread and pasta. Based on 2007 FAO data (the most recent publically available data at FAOSTAT), Figure 20 provides perspectives regarding the relative importance of wheat in the Mozambican diet. Cereals account for 24.1% of the average diet in Mozambique (based on kg/capita/yr), with wheat accounting for the second-largest share of the Mozambique cereal supply (at 16.0%), after maize (32.1%). Sources at WV have noted an increasing trend during their wheat monetizations, where bidders often have requested a larger volume of wheat than what the tender offer originally stated, thereby implying strong demand.
Figure 20: 2007 Mozambique Food Supply (kg/capita/yr)
Food Supply Food Supply - Cereals
Source: FAO
The above supply and demand analysis concludes that wheat meets the requirements necessary to warrant importation and sale of monetized food aid in Mozambique. There is significant demand and national production is insufficient to meet demand.
34
According to 2008 Bellmon Analysis conducted by the Emerging Markets Group.
Starchy Roots 59.6%
Cereals -Excl. Beer
24.1%
Fruits - Excl. Wine 3.6%
Sugar & Sweeteners
2.0%
Meat 1.9%
Vegetable Oils 1.8%
Other 6.9%
Maize 32.1%
Wheat 16.0%
Rice (Milled Equivalent)
12.9%
Sorghum, Millet, &
Other Cereals
5.2%

93
2. Commercial Import Limitations and/or Additional Monetization Rationale
Mozambique is considered a low-income, food deficit country by FAO and ranks 184 out of 187 countries on the UN 2011 Human Development Index. Thus, the country’s food needs are high. For example, Mozambique is highly dependent on wheat imports to meet domestic requirements since the country produces less than 1% of its domestic needs, and wheat demand has been growing. Because of Mozambique’s high dependency on imports, international commodity prices, as well as exchange rates, play a major role in impacting commercial imports. In years when international prices are high and/or exchange rates particularly unfavorable, a demand gap may result, a gap which monetization can help fill. The worldwide run up in commodity prices during late 2007 and early 2008 made commercial wheat imports cost prohibitive for many net food-importing, developing countries such as Mozambique. Due to the high price environment, total commercial wheat imports in Mozambique fell by 153,512 MT from 2007 to 2008, but wheat imports for monetization only increased by 2,190 MT. The monetized wheat is primarily hard red winter wheat, which is more expensive than Mozambique’s domestically produced or commercially imported wheat, but is generally of higher quality. While there are no significant commercial barriers to importing wheat, a Michigan State University study concluded that if monetized wheat imports were reduced, commercial imports likely would shift to cheaper soft wheat. The implication would be that, with less hard wheat used, the quality of flour would likely be reduced. As was seen during 2007-2008, imports will fall significantly when world market prices are high, which can jeopardize the wheat milling industry in the country. The Michigan State University study on wheat monetization35 found that:
The value of the monetized food deliveries would reduce demand for foreign exchange, which would be otherwise required for commercial imports (up to US$200 million over the time period covered by the study);
Monetization did not cause price shocks on local wheat flour prices;
Monetization did not change food consumption habits or depress prices of locally produced substitutes since it did not affect wheat flour prices;
Monetization provided a platform for discussion between public and private sectors concerning wheat quality and demand;
Monetization may have facilitated a shift to using higher quality wheat in bread and flours by increasing demand for hard wheat varieties; and
Monetization attained cost recovery rates of over 90% in several years for wheat.36
35
The Evaluation of the Impacts of Title II Monetization Programs for Wheat and Crude Edible Oils in Mozambique, 1997-2007,2010.

94
C. Impact on Domestic Market
1. Price Impact
Overview Did World Vision receive a reasonable fair market value?
Yes - Based on Informa analysis, the prices received by WV and implementing partners generally have been within a reasonable margin of error relative to the estimated import parity prices (used to represent “fair market value”).
The following details the price establishment process undergone by WV and the “fair market value analysis” conducted within this study. Price Establishment Process World Vision Mozambique used tender sales to establish the price, but with an option for negotiations to reach consensus on payment terms or clear small remaining quantities of wheat after selling the amounts requested to the highest bidders. The process overview as described by WV is as follows: Tendering Process
The tender is written for the total amount of wheat that will be shipped during a particular delivery period, but bidders are allowed to submit offers for less than the full quantity.
Invitations for bids are sent to all eligible buyers in Mozambique (all wheat millers are known as per registration information available within the Ministry of Commerce).
Buyers submit their sealed bids according to the prescribed tender submission requirements.
All bids must be received at the Monetization Consortium (MONCON) office prior to the deadline.
All bids are date stamped and registered when received by the MONCON office.
Bids Analysis
Bids are opened on the first working day after the close of the tender submission date (or same day after closure of submission date).
36
Cost recovery measures total monetization revenues (cost per metric ton times total tonnage) divided by monetization costs (commodity procurement cost, foreign-flag freight cost, and, where applicable, inland transportation, storage and handling costs).

95
Bids are opened in the presence of the Tender Committee and invited stakeholders (donor, Ministry of Commerce, buyer representatives - regardless of bid submission).
All bids above the floor prices are considered in conjunction with the commodity quantity, proposed payment terms, shipment consolidation, and the market context of the planned call forward. Recently, a risk-based decision has been considered to avoid the entire commodity going to one miller.
Insufficient Bids for the Entire Quantity
Should there be insufficient bids offering above the minimum floor price to take up the entire quantity, MONCON is permitted to enter into negotiations with bidders whose offers were below the floor price and/or to renegotiate submitted bids.
Announcement of results
Bidders are informed of the outcome of the tender in writing within three working days of the tender closing date.
According to World Vision, the number of bids and quantities requested by buyers has been increasing. Buyers have stated that favorable payment terms, consistent quality, and timeliness of shipments are all factors that have contributed toward this increasing demand. Table 27 lists the number of bids, number of buyers, total volume requested, quantity available for monetization, and the quantity actually sold between 2008 and 2012 monetization transactions.
Table 27: World Vision Mozambique Wheat Monetization – Number of Bidders, Buyers, Demand, and Quantity Sold
YEAR NUMBER OF BIDDERS
NUMBER OF SUCCESSFUL BIDDERS
General demand (MT)
Available tonnage for Sale (MT)
ACTUAL SOLD (MT)
2012 11 4 67,000 39,120 39,120 2011 10 5 57,000 36,900 36,900
2010 CFII 12 3 27,000 11,000 11,000 2010 CFI 12 5 55,040 38,040 38,040
2009 CFII 11 7 16,560 16,560 16,560 2009 CF1 11 7 30,000 29,000 29,000
2008 11 2 30,000 30,940 30,940
Totals 282,600 201,560 201,560 Source: World Vision

96
Price Received vs. Alternative Market Price Estimates Figure 21 illustrates the wheat prices WV and implementing partners received relative to the estimated import parity prices (IPP). The prices received by WV and implementing partners reflect the month and year of the bid opening date and are compared against the estimated IPP. The IPP is used to represent “fair market value” and is intended to provide parameters by which to examine whether or not the prices received were reasonable relative to the price that buyers could have received by importing commercial-scale volumes commercially from either the U.S., Argentina or Germany (key exporters of hard wheat) and have it delivered to the same destination point as delivered to in the monetization transaction. Based on this analysis, the prices received by WV and implementing partners were within reasonable margin of error relative to the estimated IPP. Figure 21 illustrates the minimum IPP price between U.S., German, and Argentine origin points (key export markets). The minimum price is used to reflect the most competitive commercial price for hard wheat at a given point in time. The “lowest IPP” illustrated in Figure 21 is generally Argentina; however, during much of 2009 and early 2010, Germany became the lowest cost competitor of the three origins examined. The U.S. is rarely the lowest cost. The IPP was estimated using the same methodology as applied to all of the other case studies within this report. An estimated IPP was calculated by taking the FOB hard wheat prices at the origin points (e.g., U.S. Gulf, Germany, and Argentina) and adding estimated freight (including estimated insurance and port costs) to Maputo, Mozambique. An error of +/- 10% is illustrated around the estimated IPP price to account for error and range in the estimated IPP. If the price received is within this band, Informa concludes that the price received was within a reasonable margin of error, and thus, a fair market value.

97
Figure 21: Mozambique – Wheat – WV: Price Received vs. Estimated Import Parity Price
* Lowest Import Parity Price (IPP) = Minimum of a-c, whereby a = FOB U.S. Gulf hard wheat price + estimated costs (includes estimated insurance and port costs) from U.S. Gulf to Maputo, Mozambique; b = FOB Argentina hard wheat price + estimated freight (includes estimated insurance and port costs) from Buenos Aires, Argentina, to Maputo, Mozambique; and c = Germany hard wheat price + estimated freight (including estimated insurance and port costs) from Breman, Germany, to Maputo, Mozambique. **”WV Price Achieved” reflects the month and year of the opening bid. Sources: WV and Informa Economics
2. Production
As noted within the Food Aid & Monetization Overview, Chapter (IV), one commonly cited argument against monetized food aid is that it can displace domestic production of the commodity being monetized and/or the production of related products. This section aims to analyze whether or not the monetization of wheat in Mozambique has had any notable impact on the domestic production of wheat and/or related products. For purposes of this analysis, related product crops that are referenced throughout this section include all cereals and roots and tubers (e.g., cassava, sweet potatoes, taro, and yams). Overview Has monetization of wheat in Mozambique had an adverse impact on local
wheat production and/or the production of related products?
No – While variable, total monetized food aid has not exhibited any upward or downward trend since the early 2000s; meanwhile, domestic production of

98
cereals has exhibited an upward trend. Upon analyzing the data, there is insufficient evidence to conclude wheat monetization has had any notable negative impact on domestic wheat or related crop production. Domestic wheat production is low -- since FY2005, Mozambique’s wheat production-to-consumption ratio has ranged between 0.53% and 1.23%, meeting less than 1% of demand, which is why the country relies on imports to meet its needs. Other cereals plus roots and tubers are produced and consumed in large quantities in the country and upon analyzing correlations between monetized wheat and Mozambique domestic cereal and roots and tuber crop production, no significant correlations where found and most all correlations were positive (e.g., the higher the monetization level the more production)..
Impact of Monetized Wheat Food Aid on Production Mozambique produces minute quantities of wheat and relies heavily on imports to meet domestic demand. As a result, imports are much greater than local production. Wheat is not a major crop in Mozambique, as evidenced by its consistently low level of production compared to other cereals, roots and tubers for over two decades (see Figure 23). Primary cereal crops produced in Mozambique include: corn (77%), sorghum (13%), milled rice (8%), and millet (2%). Primary roots and tuber crops include: cassava (85%), sweet potatoes (13%), and potatoes (2%). As illustrated in Figure 22, monetized wheat has been variable over the past decade and there is no apparent or statistically significant correlation between monetized wheat) and the domestic production any of the examined crops (wheat, cereals, or roots & tubers). While variable, monetized wheat has not exhibited any upward or downward trend since the early 2000s; meanwhile, domestic production of cereals (including wheat) has exhibited an upward trend. Roots and tubers have exhibited a slight downward trend. Please note that in order to illustrate the comparison of these trends, monetization volumes are shown on a separate axis because the monetization volumes are so small relative to crop production. Upon analyzing correlations between monetized wheat and Mozambique domestic cereal and roots and tuber crop production, no significant correlations where found (all less than 0.55), and most all correlations were positive (e.g., the higher the monetization level the more production). It is important to note that causality or lack of causality should not be definitively concluded from this analysis, as there are many other factors influencing crop production levels. However, this simple correlation analysis does support the conclusion that wheat monetization has not had any notable negative impact on Mozambique cereal or root and tuber crop production.

99
Figure 22: Mozambique Wheat and Related Product Production & Monetization Trends *
* Please note: (i) that monetized wheat is on the second axis, as values are considerably lower than production of related products and (ii) the illustrated historical production data goes back to 1990 while the monetized food aid data goes back to 2001; however, this does not necessarily imply that food aid monetization began in 2001. ** Monetized food aid volumes are based on programmed food aid data from the USDA, FAS (FFP-CCC and FFE- Government/PVO) and monetized data from USAID. It is also important to note that this is programmed food aid, and actual food aid shipments may have occurred in the following fiscal year or in some cases the preceding fiscal year. Sources: USDA, FAS; USAID; FAO, and Informa Economics
3. Internal Market Development
While it is difficult to empirically attribute any development outcomes in Mozambique’s milling industry directly to the monetization of wheat in the country, anecdotal evidence suggests that the consistent monetization of wheat in Mozambique over the years has contributed to increased market development in Mozambique through increased competition in the milling industry (with new market participants) and by prompting further commercial imports of wheat by Mozambican millers. The buyers of monetized U.S. wheat in Mozambique generally have been industrial wheat millers operating in Mozambique who have either milled and sold the wheat products (e.g., bread, biscuits, chapatti) or acted as a wholesaler and re-sold the wheat in smaller lots. The buyers tend to be private companies that are either family-owned or part of a regional or multi-national group of companies, and most millers would be classified as small- to medium-sized, relative to other millers in the sub-region. Of the

100
eight primary millers, the region has two large millers—SOCIMOL and BAKHRESA—but neither company has purchased Title II wheat in recent years. The wheat monetization process in Mozambique allows for the entrance of small-scale millers and the program has evolved to encourage competition in the market place for both the development of smaller millers and for the purpose of achieving a fair market value. The risk for collusive behavior among buyers to achieve a lower price generally decreases when the number of market participants increases. Competition is encouraged through monetization, as the monetization sales process in Mozambique (and in some other countries) often offers more favorable payment terms compared with commercial commodity purchases, addressing credit and hard currency constraints and thereby increasing the number of market participants that can import wheat. For example, when purchasing monetized wheat, a buyer is able to pay with a down payment and in multiple installments; however, if purchasing commercially, the buyer would have to pay in full upon shipment receipt. The 2010 Donovan et al. study included a brief analysis of competition in Mozambique’s wheat milling industry and found that, through 2000, there were consistently four buyers (bidders) of monetized wheat. However, between 2001 and 2007, more market participants bought monetized wheat, with five different buyers in four out of seven years and six different buyers in two out of the seven years. The authors also noted that during these years there were cases of buyers jointly placing bids, which means that there may have been even more wheat buyers participating in monetized wheat sales.37 Donovan et al. found that the spread between international and local retail wheat prices decreased during the early part of the monetization period and remained stable during the second portion of the time frame. They speculated that the finding “may be partially due to increased competitiveness in the milling sector,” but are unable to conclude that the increasing number of millers in Mozambique directly caused the narrowing spread, due to their limited empirical analysis. The authors of the 2010 study also noted anecdotal evidence suggesting that the monetization of U.S. wheat may have played a role in increasing the demand for hard wheat varieties and may have “facilitated a shift to using higher quality wheat in bread and other flours.”
4. Consumers/Food Availability
Reviews of monetization transactions in Mozambique, including the 2008 Bellmon by EMG, the 2010 Donovan et al. study, and correspondence with World Vision (the monetization lead for Title II and some Food for Progress programs), have all discussed ways in which monetization contributed to positive impacts for the Mozambican
37
However, the authors are unsure of how market share may have fluctuated among different buyers over time.

101
consumer. Areas particularly noted in the literature or through conversation with World Vision include:
Improved flour quality. Monetization provides millers in Mozambique the opportunity to produce a higher quality flour by incorporating U.S. hard red winter and northern spring wheat varieties into their blend. These varieties are not produced in substantial volume in Mozambique, but are in high demand by millers, who combine the higher-protein hard wheat with the domestically produced and imported soft wheat varieties.38
No impact on retail wheat flour prices. Donovan et al. found that the monetization of wheat did not have an impact on consumer retail flour prices, neither “[depressing] the price of locally produced substitutes”, nor changing consumption habits.
Increased food availability through small buyer access. The monetization of wheat in Mozambique often allows “more favorable payment terms” compared with purchasing wheat commercially, including paying in installments versus in full, as noted in the Market Development section. This allows certain millers to import wheat through monetization that otherwise would not have been able.
Monetization enabled numerous development activities. The sales of monetized commodities in Mozambique have enabled numerous development activities across implementing partners, including (but not limited to) activities to reduce food insecurity, improve nutrition, increase rural incomes, increase literacy, prevent disease, improve agricultural productivity, and improve infant feeding practices.
It also can be noted that U.S. wheat monetization in Mozambique helped fill a supply gap during the 2010-2011 Russian wheat export embargo and during the high worldwide wheat price spike in late 2007 and early 2008, which also helped reduce potential market volatility.
In a 2011 speech given by Ambassador of Mozambique Amelia Matos Sumbana to the United States at the International Food Aid and Development Conference39, the Ambassador stressed the critical contribution of U.S. food aid programs to Mozambique’s development, particularly following the 16 years of armed conflict in the country. The Ambassador noted that Title II and the Title III food aid programs aided the country to transition to “a more stable and inclusive democracy,” while helping fulfill both short-term food needs and a longer-term development goals. Ambassador Sumbana highlighted the positive impact of monetized Title II commodities, coupled with programs that served to improve maternal-child health and nutrition, agricultural production and marketing, and increase household incomes. Due
38
According to the 2008 Bellmon on Mozambique, by Emerging Markets Group. 39
http://foodaid.org/news/wp-content/uploads/2011/07/Ambassador-Sumbana-Mozambique-Speech-at-the-International-Food-Aid-and-Development-Conference-June-29-2011.pdf

102
to the success of such programs—which the Ambassador sites as having allowed households to meet year-round food needs and increased the number of healthy children in areas where half of the children were malnourished—the “successful Title II program model is being replicated in other areas of the country where remoteness, cyclical natural disasters, and under-developed infrastructures place communities at risk.”
D. Impact on Commercial Trade
Overview The USAID Bellmon analysis assumes that, as long as monetized imports are 10% or less of total imports, the potential for adverse impact on commercial imports is minimal. In the case of Mozambique, programmed monetized wheat imports accounted for more than 10% of total imports in nine of the 10 fiscal years from 2001-FY 2010 (see Figure 24). However, it is important to note that total Mozambique wheat imports increased sharply from fiscal year 2001 through 2010, while the quantity of monetized wheat imports has been fairly flat and the share of monetized wheat has declined. It also should be noted that in Figure 24, programmed food aid data from USAID and USDA is used to estimate the share of monetized imports each fiscal year. However, if actual shipment data from the FSA/USDA Kansas City Commodity Office is used instead, the Mozambique monetized wheat import share would have been considerably lower, e.g. 10.5% rather than 14.8% in FY 2010. Nevertheless, these levels are higher than many other monetization programs and therefore, the potential for import displacement was further evaluated. Based on analysis presented in this chapter, Informa does not find any empirical evidence to suggest that monetization has had a notable adverse impact on commercial wheat imports in Mozambique. If anything, it likely contributed to the growth and improvement of the milling industry in that country. Impact of Monetized Wheat Food Aid Imports on Commercial Imports Monetized commodities often complement imports, but also can compete with commercial imports. Although estimated monetized imports have averaged above 10% of total imports, that percentage has been declining. The share of monetized wheat has declined from 55.5% in FY 2001 to 14.8% in FY 2010 (Table 28 and Figure 23). Monetized wheat imports have fallen from 98,400 MT in FY 2001 to 69,000 MT in FY 2010. If the FY 2001 high is dropped, monetized imports averaged only 66,000 MT from FY 2002 to FY 2010 and have been relatively flat over the last five years (Figure 23). Total wheat imports, on the other hand, have been increasing sharply during this same time period, rising from 177,000 MT in FY 2001 to a record 597,190 MT in FY 2011. Australia, the U.S. and Argentina currently are the largest suppliers of wheat to Mozambique, with those three countries accounting for 78% of total wheat shipments (Table 29 and Table 30). Imports from the United States were a record high in FY 2011.

103
Table 28: Mozambique Wheat Imports, Fiscal Years 2001 to 2010 In Metric Tons
Source: USDA/FAS and USAID for monetized aid and Global Trade Atlas data world exports to Mozambique used to derive imports
Figure 23: Mozambique Commercial & Monetized Wheat Imports by Fiscal Year
* Percentages indicate monetized wheat share of total wheat imports Sources: FAS/USDA and USAID for monetized aid and Global Trade Atlas data using world exports to derive Mozambique imports
Table 29: Volume of Mozambique Wheat Imports by Country of Origin
October-September Year, Metric Tons
Source: Global Trade Atlas data – imports derived using world exports to Mozambique
Type of Import 2001 2002 2003 2004 2005 2006 2007 2008 2009 2010
Monetized Wheat 98,400 60,400 78,700 64,070 30,000 59,099 69,850 72,040 81,160 69,040
Commercial Imports 78,767 117,923 216,520 421,751 433,434 419,169 324,556 171,044 379,207 396,355
Total Imports 177,167 178,323 295,220 485,821 463,434 478,268 394,406 243,084 460,367 465,395
% Share 55.5 33.9 26.7 13.2 6.5 12.4 17.7 29.6 17.6 14.8
Origin 2001 2002 2003 2004 2005 2006 2007 2008 2009 2010 2011
Australia 20,865 22,890 35,525 0 23,161 0 0 0 28,763 25,500 188,130
USA 89,706 60,055 113,448 204,229 80,997 73,677 104,514 47,331 142,480 152,572 164,841
Argentina 64,994 35,602 25,397 210,095 282,470 67,558 183,846 126,995 65,301 0 111,568
EU27 0 8,000 85,549 0 25,000 199,421 32,778 22,682 201,907 198,387 47,004
Brazil 0 0 0 0 3,500 0 0 0 0 14,000 41,780
Uruguay 0 0 0 0 0 0 0 0 0 27,502
Russia 0 0 0 0 0 0 17,579 35,475 20,082 57,950 16,358
Other 1,602 51,776 35,301 71,497 48,306 137,612 55,689 10,601 1,834 16,986 2
Total 177,167 178,323 295,220 485,821 463,434 478,268 394,406 243,084 460,367 465,395 597,185

104
Table 30: Value of Mozambique Wheat Imports by Country of Origin October-September, $1,000 (CIF)
Source: Global Trade Atlas data – imports derived using world exports to Mozambique
Impact of Monetized Wheat Imports on Competing Imported Commodities Wheat is the major cereal imported (Figure 24), followed by rice. Wheat imports are larger than other cereal imports because Mozambique produces little wheat while it does produce more than half of its domestic rice needs and most of its coarse grain needs. Monetized wheat imports have little impact on other cereal imports since they are small, accounting for less than 9% of total cereal imports based on GIEWS outlook for 2011/12.
Figure 24: Mozambique Cereal Imports.
Source: FAS/USDA
Origin 2001 2002 2003 2004 2005 2006 2007 2008 2009 2010 2011
Australia NA NA NA 0 NA 0 0 0 4,508 5,365 58,063
USA 13,102 8,326 17,556 38,792 12,025 7,681 27,305 17,829 37,587 35,066 55,580
Argentina 7,657 3,889 3,351 30,670 33,739 9,497 32,075 38,451 13,799 0 32,007
EU27 0 1,010 11,789 0 3,367 28,891 5,609 9,503 45,787 38,123 15,795
Brazil 0 0 0 0 458 0 0 0 0 2,436 12,146
Uruguay 0 0 0 0 0 0 0 0 0 0 7,646
Russia 0 0 0 0 0 0 2,877 10,288 3,362 10,070 3,655
Other 3,126 7,372 5,691 12,478 7,200 20,938 12,105 3,812 625 4,106 1
Total NA NA NA 81,940 NA 67,007 79,972 79,882 105,667 95,166 184,891

105
E. Direct Monetization Costs and Revenues
Direct costs and revenues from 2005 to 2012 are illustrated in Table 31 Over the past three years (2009-2011); World Vision has monetized an average of 50,390 MT of wheat per year in Mozambique. Cost recovery rates have varied greatly between 2005 and 2012; ranging from 65% to 101%. Between 2009 and 2011, this rate averaged 80%.
Table 31: Direct WV Wheat Monetization Costs & Revenues - Mozambique
1/ Monetization volumes include WV and implementing partners. WV is the lead agency 2/ Weighted average based on volume. 3/ Non-US flag rate 4/ ITSH = Inland Transportation, Storage & Handling Source: World Vision
F. Mozambique Conclusions
Key research questions presented in the introduction to this case study are answered below.
1) Is there sufficient domestic demand and insufficient domestic production to warrant the monetization or importation of wheat?
Based on Informa analysis, wheat is of sufficient demand in Mozambique and there is insufficient domestic production. Since FY2005, the production-to-consumption ratio has ranged between 0.53% and 1.23% of Mozambique’s domestic wheat demand. The Emerging Markets Group (2008 Mozambique Bellmon Estimation), which recommended the monetization of wheat, also noted Mozambique’s lack of commercial production, significant demand, and that Mozambique is a wheat-deficit country requiring imports. Based on Informa’s analysis, these factors still held true for wheat monetization conducted since 2008.
Yes
2) Does food aid monetization provide benefits that would not be
2005 2006 2007 2008 2009 2010 2011 2012
Revenues
Volume (MT) /1 17,499 48,000 49,848 - 76,500 49,040 36,900 39,120
Sales Price (US$/MT) /2 217.20 218.82 244.32 - 240.91 323.70 371.08 364.78
Total Revenues (US$) 3,800,783 10,503,500 12,178,906 - 18,429,802 15,874,473 13,692,852 14,270,194
Costs /2
Commodity (US$/MT) 143.47 191.21 222.22 - 273.68 192.96 380.00 291.85
Ocean Freight (US$/MT) /3 164.45 78.59 69.22 - 97.45 135.72 99.50 70.89
ITSH (US$/MT) /4 - - - - - - - -
Taxes/ Duties/ Port Fees - - - - - - - -
Other (US$/MT) - - - - - - - -
Total C&F (US$) 5,388,293 12,950,297 14,527,814 - 28,392,157 16,118,228 17,693,550 14,190,389
Cost Recovery /2 71% 81% 84% n/a 65% 98% 77% 101%

106
achieved with alternative policy options (e.g., direct program funding)?
a. Does the monetization of wheat add to food availability and/or quality? And/or has monetization aided market development?
The monetization of higher-protein varieties of wheat in Mozambique has raised quality standards, and may have encouraged greater demand and use of higher quality wheat and contributed to growth of the milling industry. Overall, monetization has addressed credit, currency risk, and hard currency constraints and thereby made more food available in the country, which would not be possible through other policy options, such as direct funding of program activities. Monetization in Mozambique has made higher-protein wheat varieties more accessible to local millers. Several methods were used to achieve this, including allowing payment in local currencies and installments and permitting buyers to bid on a portion of the shipment. This may have encouraged increased use of wheat, particularly higher protein varieties, in Mozambique (based on anecdotal evidence, though not empirically proven). The monetization of wheat in Mozambique has reduced the demand for foreign exchange in Mozambique (as would be necessary to commercially obtain wheat) by allowing payment in local currency. In addition, the monetization has helped smaller millers enter the wheat market.
The potential for wheat monetization to fill supply gaps was apparent when worldwide wheat prices spiked in 2008: Mozambique’s total commercial wheat imports plummeted by 153,512 MT from 2007 to 2008. Monetization increased only slightly during that period, by 2,190 MT, which was not enough to fill the gap, but it indicates how susceptible the country is to changes in world prices and why monetization is important to food security. A drop in supply can set back development of the milling industry and increase consumer prices.
Yes
b. Is there another reason for monetization over alternative policy options (e.g., direct program funding)?
n/a

107
3) Has wheat monetization had an adverse impact on local wheat or related product production in Mozambique?
Total monetized food aid has been relatively stable since the early 2000s; meanwhile, domestic production of cereals has exhibited an upward trend. Upon analyzing the data, there is insufficient evidence to conclude that wheat monetization has had any notable negative impact on domestic wheat or related crop production. Upon analyzing correlations between monetized wheat and Mozambique domestic cereal and roots and tuber crop production, no significant correlations where found (all less than 0.55), and most all correlations were positive (e.g., the higher the monetization level the more production).
No
4) Has wheat monetization disrupted commercial trade of wheat or related products?
There are no indications that commercial trade was disrupted. As also noted by Donovan et al. (2010), Mozambique’s commercial wheat import volumes have been increasing since 2001, monetized volumes have been fairly flat, and the monetized import share of total imports has been declining. Further, the monetization of the wheat was for the fair market value, indicating that monetization did not disrupt market prices. In some years the country was not able to maintain commercial import levels due to high world market prices (particularly noticeable in 2008 and 2009). In such years, it would be reasonable for monetization levels to increase as a percentage of total import volume. In fact, it may be desirable to increase monetization in such cases. Thus, using the often-cited threshold level of 10% of imports could have negative consequences for development and food security objectives. In the case of Mozambique, a drop in supply can set back development of the industry and increase consumer prices. Nevertheless, because the monetization levels were relatively higher than other programs, the potential for import displacement was further evaluated. Based on analysis presented in this chapter, Informa does not find any empirical evidence to suggest that monetization has had a notable adverse impact on commercial wheat imports in Mozambique.
No
5) What is the average direct cost recovery rate by WV and implementing partners?
Cost recovery rates have varied greatly between 2005 and 2012; ranging from 65% to 101%. Between 2009 and 2011, this rate averaged 80%.
80%

108
IX. UGANDA – WHEAT – ACDI/VOCA
This chapter analyzes the potential impacts and value of monetized wheat in Uganda and looks specifically at wheat monetization conducted by ACDI/VOCA under a P.L. 480 Title II development program. First, an overview of food aid in Uganda is provided, which puts monetization, wheat monetization and ACDI/VOCA wheat monetization in perspective relative to total food aid. Additionally, a program overview of ACDI/VOCA wheat monetization in Uganda is provided. Then, the key rationale for monetizing wheat in Uganda is described, followed by an analysis of its potential market impacts. The analysis presented within this case study aims to answer the following questions: Is there sufficient domestic demand and insufficient domestic production to warrant
the monetization or importation of wheat?
Does food aid monetization provide benefits that would not be achieved with alternative policy options (e.g., direct program funding)?
Does the monetization of wheat add to the food availability and/or quality in Uganda? And/or has monetization aided market development?
Is there another reason for monetization over alternative policy options (e.g., direct program funding)?
Did ACDI/VOCA receive a reasonable fair market value?
Has the monetization had an adverse impact on domestic production of wheat and/or related products?
Has the monetization disrupted commercial trade of wheat and/or related products?
What is the average direct cost recovery rate?
A. Food Aid Overview
1. Uganda Food Aid Overview
Total Uganda food aid was 200,610 MT between 2008 and 2010. Of the total food aid, 44% was monetized. Wheat is the primary commodity monetized in Uganda, accounting for 100% of monetized commodities between 2008 and 2010. Historically, small amounts of vegetable oil have been monetized. ACDI/VOCA monetized an average of 21,000 MT of wheat per year in Uganda between 2009 and 2011. This represents 83% of the 2009-2011 annual average 26,000 MT in monetized wheat reported by USDA, FAS and USAID.

109
Wheat has been monetized in Uganda each fiscal year since 2001, with levels ranging from a low of 14,600 MT in 2004 to a high of 52,100 MT in 2005 (Table 32).
Table 32: Volume and Value of US Wheat Programmed for Monetization for Uganda, Fiscal Years 2001-2011
Monetized food aid is programmed food aid while actual food aid shipments may have occurred in the following fiscal year or in some cases in the preceding fiscal year. Sources: FAS/USDA for monetized food aid under Food for Progress CCC Purchased and USAID for monetized food aid under Title II.
Most wheat was monetized under the Title II program -- totaling 131,600 MT from FY 2006 through FY 2011. USDA Food for Progress awardees also occasionally monetize hard red winter wheat (HRWW). During the period FY 2006 through FY 2011, 15,000 MT of HRWW was monetized under FFP. Table 33: Awardees for US Wheat Programmed for Monetization in Uganda Fiscal
Years 2006-2011
Fiscal Year Title II USAID Food for Progress, FAS
2006 ACDI/VOCA, AFRICARE, CRS,WVUS & SCF 2007 ACDI/VOCA, WVUS & SCF 2008 ACDI/VOCA, WVUS & SCF 2009 ACDI/VOCA & MCI FINCA
2010 ACDI/VOCA & MCI FINCA
2011 ACDI/VOCA & MCI
Source: U.S. International Food Assistance Report 2006-2010; ACDI/VOCA (2011); FAS
2. Program Overview: ACDI/VOCA – Uganda - Wheat Monetization
ACDI/VOCA’s involvement in wheat monetization in Uganda is long standing, going back to 1998. Over the years, both food aid distribution and monetization proceeds have been utilized to support many different development projects. The most recent
2001 18.3 2,814 154 0.0 0 0 18.3 2,814 154
2002 18.5 2,800 151 0.0 0 0 18.5 2,800 151
2003 20.7 4,467 216 0.0 0 0 20.7 4,467 216
2004 14.6 2,657 182 0.0 0 0 14.6 2,657 182
2005 19.3 3,185 165 32.8 6,068 185 52.1 9,253 178
2006 16.7 2,926 175 0.0 0 0 16.7 2,926 175
2007 20.3 4,570 225 0.0 0 0 20.3 4,570 225
2008 30.2 12,965 429 0.0 0 0 30.2 12,965 429
2009 21.6 5,819 269 7.5 2,400 320 29.1 8,219 282
2010 21.7 6,643 306 7.5 2,400 320 29.2 9,043 310
2011 21.1 8,448 400 0.0 0 0 21.1 8,448 400
Fiscal
Year
PL480 Title II (USAID) Food for Progress (FAS) Total Monetized US Wheat AidQuantity
(1,000 MT)
Value
($1,000)
Price per
Ton
Quantity
(1,000 MT)
Value
($1,000)
Price per
Ton
Quantity
(1,000 MT)
Value
($1,000)
Price per
Ton

110
was a multiyear Title II development program that ended in FY 2012. A new multi-year program was launched during the summer of 2012. The purpose of the Ugandan last Title II development program was to reduce food insecurity and increase nutrition awareness and best practices for vulnerable populations in northern and eastern Uganda. The two strategic project objectives are:
1) Reduce food insecurity and increase nutrition status through the better production and use of food by smallholder farmers, and
2) Reduce food insecurity and improve nutrition for particularly vulnerable people through the distribution of supplementary food rations.
From FY 2007-2012, ACDI/VOCA, along with sub-recipients Africare, the Lutheran World Federation and The AIDS Support Organization, as well as local NGOs and CBOs, implemented a $74.3 million food security program in northern Uganda, targeting poor, vulnerable populations. It improved agricultural productivity, household savings, nutrition, and hygiene, and thereby strengthened the ability of communities to withstand climatic and other shocks. Under the ACDI/VOCA program, 97,006 rural households (580,000 household members) received training and technical assistance and 309,400 people were assisted by rehabilitation of 249 km of rural feeder roads. ACDI/VOCA also provided 12 months of supplementary food rations and complementary services to 127,016 people living with HIV/AIDs and their family members. The project has involved:
Food security grants to both local NGOs and community-based organizations (CBOs) and provides technical assistance and training of trainers (TOT) to local sub-grantees in areas such as nutrition and hygiene, agronomic methods, post-harvest handling, group savings mobilization and management, ACDI/VOCA’s signature Farming as a Business curriculum, collective marketing, and natural resource management.
Working with Africare, ACDI/VOCA improved transportation infrastructure through the rehabilitation of feeder roads to increase access to local and regional markets.
As a result of program efforts, 20 cooperative community-based groups formed to expand marketing capabilities and meet storage needs in Uganda, and a large number of participants are women farmers. It also was observed that the program’s training of the trainers is trickling down to the farmers, helping to ensure that the benefits of the program survive long after the program has ended.

111
More examples of program benefits are provided in sectionC.4 of this chapter, “Consumers/Food Availability.”
B. Wheat Monetization Rationale
According to USAID 2011 Uganda Bellmon analyses, “To warrant importation and sale of monetized food aid, both local dietary preferences and available market information must strongly suggest that a commodity is consumed in significant amounts (e.g., there is significant demand), and that national production is insufficient to meet the demand (e.g., there is insufficient national supply to meet demand).”40 This section analyzes whether or not wheat meets both of the above criteria necessary to warrant the importation and sale of monetized wheat in Uganda. Then, additional rationale will be described specific to ACDI/VOCA wheat monetization in Uganda.
1. Wheat Supply and Demand – Insufficient Domestic Production
The analysis presented in this section indicates wheat meets the requirements necessary to warrant importation and sale of monetized food aid in Uganda. There is significant demand and national production is insufficient to meet this demand. Uganda produced only about 6% of its domestic needs in 2010, based on domestic production of 21,500 MT and net imports of 360,400 MT (FAO) 41; implying an estimated consumption of roughly 381,900 MT. Production has been relatively flat in recent years and significant increases are not expected in the future.
Table 34: Uganda Wheat Supply and Demand (MT)
Sources: FAO; USAID Bellmon Estimation (food aid data).
40
This quote comes from the 2011 USAID Bellmon Estimation for Uganda, however it applies across any monetization case. 41
According the 2011 USAID Office of Food For Peace Uganda Bellmon Estimation, GoU statistics report Uganda soft wheat production of 19,000 MT (while no date was given for this estimate, this is similar to 2008 and 2009 FAO data).
2005 2006 2007 2008 2009 2010
Production 15,000 18,000 19,000 19,000 20,000 21,500
Imports 314,115 351,574 332,911 248,172 397,905 371,262
Of which, Food Aid 23,670 24,631 31,410 25,015 42,415 21,710
Exports 29 2,420 1,393 1,454 237 10,857
Net Trade 314,087 349,155 331,518 246,718 397,668 360,404
Consumption 329,087 367,155 350,518 265,718 417,668 381,904
Production/Consumption 5% 5% 5% 7% 5% 6%

112
Hard Red Winter wheat is not grown in Uganda as soils are unfavorable. While soft wheat can be grown in Uganda’s soil, relatively few farmers produce wheat. According to the Ministry of Agriculture of Uganda, wheat is grown on a small scale in Kapchorwa (Uganda-Kenya border) and Kabale (Uganda-Rwanda border). Wheat demand, on the other hand, has been growing in Uganda because of increased demand for wheat flour, which is a result of growing urbanization. Consumers are increasingly incorporating wheat products into their diets, particularly pan-style breads and chapatis. Consumers are turning to wheat-based products because they are better suited to urban living than other cereals such as sorghum and millet or roots and tubers due to the shorter time required for their preparation and the greater availability of wheat in more convenient processed forms. Wheat demand is forecast to grow 5% to 10% per year over the next five years, assuming there are no economic shocks to bar this growth42. With a relatively flat production forecast and growing demand, Uganda will continue to rely on imports to meet its domestic needs, particularly for hard wheat. While based on 2007 FAO data (most recent publicly available data), Figure 25 provides perspective regarding the relative importance of wheat in the Uganda diet. Though it is only 2% of the diet (based on kg/capita/yr), wheat is a key cereal (17% of total cereal supply).
Figure 25: 2007 Uganda Food Supply (kg/capita/yr)
Food Supply Food Supply – Cereals
Source: FAO
42
USAID Office of Food For Peace Uganda Bellmon Estimation, July 2011.

113
The above supply and demand analysis concludes that wheat meets the requirements necessary to warrant importation and sale of monetized food aid in Uganda. There is significant demand and national production is insufficient to meet demand.
2. Commercial Import Limitations and/or Additional Monetization Rationale
For many smaller buyers in Uganda, credit, currency and volume constraints limit their ability to purchase off of the global market. Through monetization, smaller millers are able to purchase U.S. wheat, whereas otherwise this would not be possible. Yet, due to the design of the monetization program, the costs/risks to ACDI/VOCA are minimized, as would be in the case of selling the wheat to larger millers. A Bellmon analysis conducted by Fintrac Inc. in July 2011 highlighted that “Title II wheat monetizations have played a pivotal role in developing a competitive domestic milling industry by providing high-quality wheat under favorable sales contracts that are generally not available through regular commercial sales (including payment in Ugandan shillings).”
C. Impact on the Domestic Market
1. Price Impact
Overview Did ACDI/VOCA receive a reasonable fair market value?
Yes – Based on Informa analysis, the prices received by ACDI/VOCA and cooperating organizations have been within reasonable margin of error relative to the estimated import parity prices.
Price Establishment Process The following material was provided directly by ACDI/VOCA and describes their price establishment process. Sales Process
The wheat tender is advertised in the newspaper before the vessel leaves the U.S. loading port. The millers also are informed about the tender by phone.
The wheat is sold using a closed bid system. This enables ACDI/VOCA to be aware of the market prices.
ACDI/VOCA summarizes the bid prices and then compares them with their survey of local prices, as well as Mombasa and U.S. Wheat Associates indicative prices. It is generally realized that HRW wheat is more expensive than soft wheat and hard spring or hard blended wheat from the Former Soviet Union states.

114
When the bids have been evaluated, the next stage is to negotiate with the bidders for a fair market value, although most of the bids are usually below the market price. Most times, ACDI/VOCA is able to negotiate a price that will assure a fair market value. ACDI/VOCA continues to negotiate with the bidders whose prices match up with their estimates.
When the successful bidders accept the terms of the contract, the sales agreements are prepared for signing at the negotiated and agreed price.
Negotiation Considerations
The price bid by the miller.
The quantity the miller usually buys.
The capacity of the mill.
The quantity which was bid.
Financial status - Can the miller raise the required Bank Guarantee?
The past performance on a previous contract.
ACDI/VOCA also considers apportionment of the quantity of the wheat to all buyers that bid.
Delivery of wheat to millers
The inland freight contractor will deliver the wheat to each miller -- 50% by road and 50% by rail. The terms of payment are usually pegged to the metric tons delivered at the miller’s destination.
According to ACDI/VOCA, they are working to better coordinate monetization shipments with the market. Well- timed monetization deliveries can help alleviate local market price volatility. Price Received vs. Alternative Market Price Estimates Figure 26 illustrates the wheat prices ACDI/VOCA and cooperating agencies received relative to the estimated import parity prices (IPP). The prices received by ACDI/VOCA and other agencies reflect the month/year the bid was made. The IPP is intended to provide parameters by which to examine whether or not the prices received were reasonable relative to the price buyers could have received by importing commercial-scale volumes commercially from the U.S., Argentina or Germany (key exporters of hard wheat). In other words, did the agency receive a “fair market value”? Based on this analysis, the prices received were within reasonable margin of error relative to the estimated IPP. Figure 26 illustrates the minimum IPP price between U.S.-, German-, and Argentinian- origin points to reflect the most competitive commercial price for hard wheat at a given point in time. The estimated IPP price from the 2011 Uganda Bellmon analysis also is

115
illustrated. This IPP price was from Argentina. When Informa estimates for the Argentina IPP are compared with the estimated IPP from the Uganda Bellmon, prices are similar after March 2009; they are lower prior to this point. However, the “lowest IPP” illustrated in Figure 26 is below the Uganda Bellmon Argentina-Uganda IPP during much of 2009 and early 2010 because during this time Germany became the lowest cost competitor of the three origins examined. The U.S. is rarely the lowest cost. The IPP was estimated using the same methodology as applied to all of the other case studies within this report. An estimated IPP was calculated by taking the FOB hard wheat prices at the U.S. Gulf, Germany, and Argentina and adding estimated freight (includes estimated insurance and port costs) to Mombasa, Kenya, plus inland freight. An error of +/- 10% is illustrated around the estimated IPP price to account for the error and range in the estimation. If the price received is within this band, Informa concludes that the price received was within a reasonable margin of error, and thus, a fair market value.
Figure 26: Uganda – Wheat – ACDI/VOCA: Price Received vs. Estimated Import Parity Price
* Import Parity Price (IPP) – Minimum of (a) FOB U.S. Gulf hard wheat price + estimated freight costs (includes estimated insurance and port costs) from U.S. Gulf to Mombasa, Kenya, + inland freight; (b) FOB Argentina hard wheat price + estimated freight costs (includes estimated insurance and port costs) from Buenos Aires, Argentina, to Mombasa, Kenya, + inland freight; or (c) Germany hard wheat price + estimated freight costs (includes estimated insurance and port costs) from Breman, Germany, to Mombasa, Kenya + inland freight. ** This is the CIF Monrovia + unloading and inland freight estimated within the 2011 Uganda Bellmon Estimation. ***Prices received reflect the month and year the bid was made by the buyer. Sources: ACDI/VOCA; USAID Uganda Bellmon Estimation; and Informa Economics.

116
2. Production
As noted within the literature review, one commonly cited argument against monetized food aid is that it can displace domestic production of the commodity being monetized and/or the production of related products. This section analyzes whether or not the monetization of wheat in Uganda has had any notable impact on the domestic production of wheat and/or related products. For purposes of this analysis, related product crops, referenced throughout this section, include all cereals and roots and tubers (e.g., cassava, sweet potatoes, and potatoes). Overview Has monetization of wheat in Uganda had a notable negative impact on local
wheat production and/or the production of related products?
No – Since 2000, total monetized food aid has exhibited a slight upward trend. Meanwhile, domestic production of related product crops has also exhibited an upward trend. Upon analyzing the data, there is insufficient evidence to conclude wheat monetization has had any notable, negative impact on domestic wheat or related crop production. Moreover, wheat is not a major crop and domestic production meets very little of consumption needs – only 6% in 2010. This conclusion is also supported by findings within the 2011 BEST Analysis for Uganda. According to that analysis, “Current MYAP programming being undertaken appears to minimize any negative impacts on production incentives and markets, especially as agricultural rehabilitation is still in its infancy in northern Uganda.”
Impact of Monetized Wheat Food Aid on Production Wheat accounts for a small share (1%) of overall cereal production in Uganda. Other cereals produced in Uganda include corn (48%), millet (29%), sorghum (18%), and milled rice (4%). For each of these key cereals, Ugandan production has been increasing since the early 2000s, and, for all of these crops, annual production growth over the past 10 years has met or exceeded the previous 10 years. Uganda also produces a relatively large amount of roots & tuber crops, which include cassava, sweet potatoes, and potatoes. If monetized wheat is examined in relation to the total related product crop production, monetized wheat accounts for a mere 0.2%.

117
Figure 27: Uganda Wheat and Related Product Production & Monetization Trends*
* Please note: (i) that monetized wheat is on the second axis, as values are considerably lower than production of related products and (ii) the illustrated historical production data goes back to 1990 while the monetized food aid data goes back to 2001; however, this does not necessarily imply that food aid monetization began in 2001. ** Monetized food aid volumes are based on programmed food aid data from the USDA, FAS (FFP-CCC and FFE- Government/PVO) + monetized data from USAID. It is also important to note that this is programmed food aid, and actual food aid shipments may have occurred in the following fiscal year or in some cases the preceding fiscal year. Sources: USDA, FAS; FAO, and Informa Economics.
As illustrated in Figure 27, monetized food aid has been highly variable over the past decade and there is no apparent or statistically significant correlation between monetized wheat and any of the examined crops (cereals or roots & tubers). Since 2000, total monetized food aid has exhibited a slight upward trend (although the peak in 2005 is outside trend). Meanwhile, domestic production of related product crops also has exhibited an upward trend. Upon analyzing correlations between monetized wheat and Uganda domestic cereal and roots and tuber crop production, no significant correlations where found (all less than 0.56), and most all correlations were positive correlation (e.g., the higher the monetization level, the more production). It is important to note that causality or lack of causality should not be definitively concluded from this analysis, as there are many other factors influencing crop production levels. However, this simple correlation analysis does support the conclusion that wheat monetization has not had any notable impact on Uganda cereal or root and tuber crop production.

118
3. Internal Market Development
Due to the small share of monetized wheat imports among total Ugandan wheat imports, any instances of market development such as increases in milling efficiency, job creation in the milling sector, or new millers entering the industry, cannot be directly attributed to the monetization of wheat in Uganda. However, there still are certain positive outcomes to highlight regarding monetization, in the context of both the composition of Uganda’s milling industry and milling capacity expansion. First, Uganda’s milling industry consists of seven large players that likely account for between 95% and 99% of total wheat milling in Uganda.43 The largest millers include the following companies, with the following capacities:
Table 35: Uganda’s Largest Wheat Millers (by Capacity)
Source: ACDI/VOCA
Due to the strong demand for high quality hard red winter wheat, ACDI/VOCA found that every time they monetize wheat in Uganda, some of these seven main millers generally place bids. In addition to these seven bidders, eight additional bidders have participated in monetized wheat sales from 1997 to 2012. While bids are generally close to what the mills would pay for commercial soft wheat varieties (lower than what a fair market value would be for hard red winter wheat), the strong demand for the hard red winter wheat generally helps ACDI/VOCA negotiate with the companies to achieve a higher and more fair market value for U.S. monetized hard red winter wheat. This implies that, despite the large market share held by these companies, they are not demonstrating collusive behavior to achieve a lower price for monetized hard red winter wheat. In past wheat sales in Uganda, ACDI/VOCA has noted that smaller millers—who otherwise would not be able to obtain the credit necessary to purchase U.S. wheat commercially—have been able to purchase monetized wheat. They generally will place a down payment on the total quantity of wheat, after which ACDI/VOCA will store the wheat and millers will come and collect the wheat, paying for each load before collection. This process has worked well for both the smaller mills and for ACDI/VOCA,
43
Rough estimate from ACDI/VOCA.
Miller Location
Milling
Capacity
(MT/day)
% of Capacity
of Largest
Millers
Bajaber Millers Kampala 270 30.0%
Ntake Bakery Co. Kampala 250 27.8%
Elgon Millers Mbale 160 17.8%
Kengrow Industries Jinja 120 13.3%
Nile Agro Industries Jinja 120 13.3%
Unga Millers Kampala 100 11.1%
Samco Millers Kabale 30 3.3%

119
as the smaller millers are able to purchase U.S. wheat that they otherwise would not have access to, yet the costs/risks to ACDI/VOCA remain minimized, as it would be in the case of selling the wheat to larger millers. A Bellmon analysis conducted by Fintrac Inc. in July 2011 highlighted that “Title II wheat monetizations have played a pivotal role in developing a competitive domestic milling industry, by providing high-quality wheat under favorable sales contracts that are generally not available through regular commercial sales (including payment in Ugandan Shillings).” In the years that ACDI/VOCA and other PVOs have been monetizing wheat in Uganda—from at least 1998—Uganda’s milling industry has grown. The growth has continued recently, with the capacity of the seven primary millers in Table 35 increasing from 900 MT per day in 2011 to 1,050MT per day in 2012. While the monetization of U.S. hard red winter wheat cannot be directly credited with industry growth, it has contributed to providing a higher quality flour, recognized as such by both millers and bakers44. A Murphy, 2007 study45 examined the specific impacts of Title II wheat monetization on the development of the domestic milling industry, finding that "Millers overwhelmingly credited PL-480 Title II wheat sales as a contributing factor to their growth. Specifically, they attributed U.S. HRW wheat grain’s continued market presence for the past 10 years and dependable quality as key aspects...Title II monetization sales began when the industry was in its infancy. The steady supply of US-origin hard wheat during this period allowed new mills to build a market for quality flour required by bakers...Critically, most millers concurred that Title II sales were instrumental in their growth in terms of sales, assets and employees…” Infrastructure can also be a constraint for some buyers that can be overcome via food aid monetization. For example, some buyers may not have the storage to allow them to purchase sufficient quantity off of the open market to get a price comparable to what buyers receive via the monetization program or what larger players with storage could achieve off of the open market. There are cases where ACDI/VOCA has stored the grain and buyers will pick up truck loads as needed; thus, helping to facilitate the involvement of smaller market players.
4. Consumers/Food Availability
The monetization of wheat in Uganda has likely contributed—at least marginally—to food availability as, in some instances, it provides smaller millers who may not have sufficient access to credit, storage, or foreign currency, the opportunity to purchase U.S.
44
Anecdotal information from ACDI/VOCA, e.g. Ugandan bakers, when purchasing flour from a mill, do not necessarily know that they are purchasing flour containing U.S. HRWW, but they have noted a quality difference among different flours. 45
Murphy, E. (2007). Monetization and Development: A Case Study of Title II Sales in Uganda (1989-2006). Washington, D.C.:

120
wheat, while larger millers meet their import demand through commercial means. In addition, wheat monetization may have increased wheat availability on particular occasions when Uganda saw import shortages from traditional wheat suppliers (e.g. Russia’s 2010-2011 wheat export embargo). In addition to food availability, the impact of monetization on nutrition, access to food and food availability can be exemplified in two ways: First, directly, through the availability and consumption of higher quality flour—the
result of replacing an “improver” (an additive that improves the milling qualities of soft flour and gets bread to rise) with HRW wheat during the milling process, and
Second, indirectly, through the positive outcomes of the development activities implemented by ACDI/VOCA and its partners using monetized proceeds improved, among other things, incomes, agricultural productivity and marketing, and nutrition of targeted low-income and vulnerable populations.
For two decades war was waged by the Lord’s Resistance Army (LRA) in the northeastern part of Uganda. As a consequence, one and a half million people were displaced from their homes and the economy suffered – not only in the north, but throughout the country. Starting in the 1990’s, besides emergency assistance to those directly affected by war, food aid has been used to bolster food supplies in the market place through monetization, provide nutritional support to people living with and affected by HIV/AIDs, and support development in poor, rural areas. Those programs proved beneficial. Since the LRA was pushed out of the country in 2009, developmental food aid is mainly focused in the northeastern parts of the country where the LRA had been active and food insecurity is most prevalent. For example, Karamoja region in northeastern Uganda was not only adversely impacted by the LRA, but also has long suffered from chronic drought and high levels of poverty, making its population the most food insecure compared with other regions. As a result, this region has been receiving food aid handouts for four decades, and now the goal is to link food aid to development in order to overcome food insecurity and build resiliency. The work of PVOs, through Title II development programs, has helped farmers who returned from internally displaced persons (IDP) camps after being displaced by the LRA. The five-year Title II Multi-Year Assistance Program (MYAP) awarded $74 million to ACDI/VOCA for the period of 2007-2011 (and then extended 9 months into 2012) focused on this region. During the course of that program, one of the important achievements was changing subsistence farms into cooperative enterprises. For example, training was provided under the ACDI/VOCA program to 307 farmer groups (9,000 farmers) in eastern Uganda and 23 Community Based Organizations (CBOs) were formed, which function as a cooperative enterprises, so that the groups may more efficiently produce and market their crops. The success is reflected through the groups’ continued growth and initiative – they constructed and paid for new storage and marketing facilities and procurement of additional farm inputs. Moreover, the CBOs

121
formed mother-child care groups that play a significant role in helping ensure the health and hygiene of group members. Through a no-cost, nine-month extension of the 2007-2011 MYAP, which ended the summer of 2012, ACDI/VOCA trained extension agents from Uganda’s National Agricultural Advisory Services (NAADS). They identified gaps in training and outreach and then trained selected NAADS staff in nutrition and hygiene, post-harvest handling, farmer group formation and management, and Farming as a Business practices.46
D. Impact on Commercial Trade
Overview Wheat monetization has not had any notable impact on Uganda commercial imports of wheat or substitute commodities for the following reasons: The monetized wheat share of total imports is small and that share has declined in
recent years, falling from an average annual share of 15.1% from 2001 to 2005 to 7.6% from 2006 to 2010. In 2011, monetized wheat comprised 5.4% of total wheat imports.
Commercial imports continue to grow, averaging 315,000MT per year from 2006 to 2010 compared with only 161,000 MT per year from 2001 to 2005.
Monetized wheat imports also are unlikely to disrupt imports of competing commodities since wheat is, by far, the number one cereal import in terms of volume (nearly 80% of cereal imports) and food import value, sharply exceeding e other direct competing products.
Impact of Monetized Wheat Food Aid Imports on Commercial Imports Monetized wheat has not disrupted commercial wheat imports. The share of monetized wheat imports has been trending downward, falling from an average of 15.6% per year for 2001 to 2005 to an average of 7.3% per year from 2006 to 2011 (Table 36 and Figure 28). In 2011, it was 5.4% of total wheat imports. Over the last four years, U.S. monetized wheat shipments to Uganda have been relatively flat, while commercial imports were a record high in 2009 and have since remained high (Table 36 and Figure 28). Moreover, ACDI/VOCA’s received a fair market value for the wheat it sold in Uganda, which indicates that it did not depress import prices for competitive products, a strong indicator that commercial trade was not displaced.
46
From ACDI/VOCA trains NAADS staff under Uganda Title II Food Security Program, a draft success story provided to Informa Economics by ACDI/VOCA.

122
Table 36: Uganda Wheat Imports, 2001 to 2011 In 1,000 Metric Tons
Source: USDA/FAS and USAID for monetized wheat aid and UN Comtrade for total imports.
Figure 28: Uganda Commercial & Monetized Wheat Imports
* Percentages represent monetized wheat as a percent of total wheat imports. Sources: FAS/USDA and USAID for monetized wheat aid and UN Comtrade for total imports.
Monetized wheat has not impacted Uganda’s major commercial wheat suppliers – the Ukraine and the Russian Federation. Both of these countries, especially Ukraine, have been increasing their wheat shipments to Uganda. These two countries accounted for 65% of total Uganda wheat imports in 2010 compared with 43% in 2009 and 35% in 2008. The United States has maintained its ranking as the third largest wheat supplier to Uganda (Table 37 and Table 38).
2001 2002 2003 2004 2005 2006 2007 2008 2009 2010 2011
Monetized Wheat 18,270 18,500 20,700 14,600 52,100 16,700 20,300 30,200 29,100 29,200 21,120
Commercial Imports 67,137 104,780 157,105 222,235 262,015 334,874 312,611 217,972 368,805 342,062 366,949
Total Imports 85,407 123,280 177,805 236,835 314,115 351,574 332,911 248,172 397,905 371,262 388,069
5.4%
Monetized Volume
as Share of Total 21.4% 15.0% 11.6% 6.2% 16.6% 4.8% 6.1% 12.2% 7.3% 7.9%
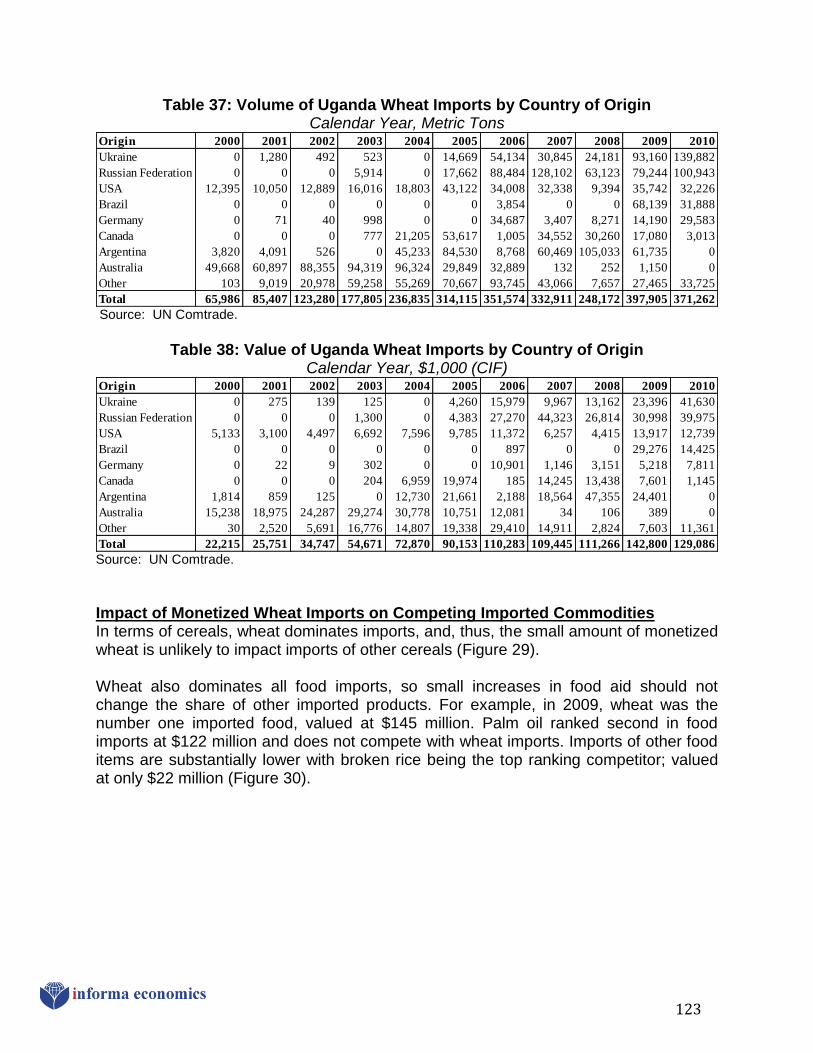
123
Table 37: Volume of Uganda Wheat Imports by Country of Origin Calendar Year, Metric Tons
Source: UN Comtrade.
Table 38: Value of Uganda Wheat Imports by Country of Origin
Calendar Year, $1,000 (CIF)
Source: UN Comtrade.
Impact of Monetized Wheat Imports on Competing Imported Commodities In terms of cereals, wheat dominates imports, and, thus, the small amount of monetized wheat is unlikely to impact imports of other cereals (Figure 29). Wheat also dominates all food imports, so small increases in food aid should not change the share of other imported products. For example, in 2009, wheat was the number one imported food, valued at $145 million. Palm oil ranked second in food imports at $122 million and does not compete with wheat imports. Imports of other food items are substantially lower with broken rice being the top ranking competitor; valued at only $22 million (Figure 30).
Origin 2000 2001 2002 2003 2004 2005 2006 2007 2008 2009 2010
Ukraine 0 1,280 492 523 0 14,669 54,134 30,845 24,181 93,160 139,882
Russian Federation 0 0 0 5,914 0 17,662 88,484 128,102 63,123 79,244 100,943
USA 12,395 10,050 12,889 16,016 18,803 43,122 34,008 32,338 9,394 35,742 32,226
Brazil 0 0 0 0 0 0 3,854 0 0 68,139 31,888
Germany 0 71 40 998 0 0 34,687 3,407 8,271 14,190 29,583
Canada 0 0 0 777 21,205 53,617 1,005 34,552 30,260 17,080 3,013
Argentina 3,820 4,091 526 0 45,233 84,530 8,768 60,469 105,033 61,735 0
Australia 49,668 60,897 88,355 94,319 96,324 29,849 32,889 132 252 1,150 0
Other 103 9,019 20,978 59,258 55,269 70,667 93,745 43,066 7,657 27,465 33,725
Total 65,986 85,407 123,280 177,805 236,835 314,115 351,574 332,911 248,172 397,905 371,262
Origin 2000 2001 2002 2003 2004 2005 2006 2007 2008 2009 2010
Ukraine 0 275 139 125 0 4,260 15,979 9,967 13,162 23,396 41,630
Russian Federation 0 0 0 1,300 0 4,383 27,270 44,323 26,814 30,998 39,975
USA 5,133 3,100 4,497 6,692 7,596 9,785 11,372 6,257 4,415 13,917 12,739
Brazil 0 0 0 0 0 0 897 0 0 29,276 14,425
Germany 0 22 9 302 0 0 10,901 1,146 3,151 5,218 7,811
Canada 0 0 0 204 6,959 19,974 185 14,245 13,438 7,601 1,145
Argentina 1,814 859 125 0 12,730 21,661 2,188 18,564 47,355 24,401 0
Australia 15,238 18,975 24,287 29,274 30,778 10,751 12,081 34 106 389 0
Other 30 2,520 5,691 16,776 14,807 19,338 29,410 14,911 2,824 7,603 11,361
Total 22,215 25,751 34,747 54,671 72,870 90,153 110,283 109,445 111,266 142,800 129,086

124
Figure 29: Uganda Cereal Imports, 2001-2010
Source: UN Comtrade.
Figure 30: Uganda Food Imports, 2009
Source: FAOSTAT.

125
E. Direct Monetization Costs and Revenues
From FY 2007 through FY 2011, ACDI/VOCA monetized an average of 22,420 MT of wheat per year in Uganda. On average, total monetization proceeds per fiscal year equaled $9,827,996, while total costs have averaged $12,139,310, for an average cost recovery rate of 82%. In FY 2012, for the first monetization, cost recovery was 91%. These are good cost recovery rates, particularly as inland transportation rates are relevant to this monetization case and they are not in many other examined cases. Section C.1 of this chapter (“Price Impact”) reviews the process by which ACDI/VOA established the price and efforts taken to maximize revenues
Table 39: Direct ACDI/VOCA Wheat Monetization Costs & Revenues - Uganda
1/ Monetization volumes include ACDI/VOCA and implementing partners. ACDI/VOCA is the lead agency. 2/ Weighted averages based on volume. 3/ Non-US flag rate. 4/ ITSH = Inland Transportation, Storage & Handling.
*FY 2012 is to-date reported values. Source: ACDI/VOCA
F. Uganda Conclusions
Key research questions presented in the introduction to this case study are answered below.
1) Is there sufficient domestic demand and insufficient domestic production to warrant the monetization or importation of wheat?
Informa analysis indicates wheat meets the requirements necessary to warrant importation and sale of monetized food aid in Uganda. There is significant demand and national production is insufficient to meet this demand. Uganda produced only about 6% of its domestic needs in 2010. With a relatively flat production forecast and growing demand, Uganda will continue to rely on imports to meet its domestic needs, particularly for
Yes
FY 07 FY 08 FY 09 FY 10 FY 11 FY 12
Revenues
Volume (MT) /1 20,310 27,400 21,550 21,710 21,120 5,120
Sales Price (US$/MT) /2 355.52 547.41 393.96 359.16 503.97 516.00
Total Revenues (US$) 7,220,698 14,998,966 8,489,880 7,797,323 10,643,800 2,641,920
Costs*
Commodity (US$/MT) 204.76 398.76 245.07 202.82 377.87 267.44
Ocean Freight (US$/MT) /3 91.77 182.22 124.99 124.82 109.65 157.50
ITSH (US$/MT) /4 110.38 121.79 139.86 113.80 122.43 141.39
Taxes/ Duties/ Port Fees (US$/MT) - - - - - -
Other (US$/MT) - - - - - -
Total C&F (US$) 8,264,403 19,255,781 10,988,639 9,583,652 12,882,281 2,899,610
Cost Recovery /2 87% 78% 77% 81% 83% 91%

126
hard wheat as the soils are unfavorable to grow hard wheat.
2) Does food aid monetization provide benefits that would not be achieved with alternative policy options (e.g., direct program funding)?
Yes
a. Does the monetization of wheat add to food availability and/or quality? And/or has monetization aided market development?
Monetization has increased food availability on the Ugandan market that would not otherwise be met through commercial trade by addressing market barriers such as credit, volume and currency risk constraints. Monetization has provided sales contracts with terms that are generally not available through commercial exporters because the market is small and less familiar compared to other destinations. Helpful contract terms included payment in Ugandan shillings, providing access to smaller lots, and allowing buyers to pick up the commodities in installments from the warehouse. While monetized volumes are small, it provides access to a product that can improve flour quality, but would be very difficult for millers in this landlocked country to obtain commercially. Monetization has contributed to increased food availability by reducing buyer risk. For some buyers, the risk of volatile exchange rates can be restrictive to purchasing off of the global market. This ACDI/VOCA monetization program allows buyers to purchase in local currency which alleviates some of the buyer risk. It also helps keeps currency in the country – a benefit to the overall economy. Infrastructure also can be a constraint for some buyers, which can be overcome via food aid monetization. For example, some buyers may not have the storage to allow them to purchase sufficient quantity off of the open market to get a price comparable to what buyers receive via the monetization program or what larger players with storage could achieve off of the open market. There are cases where ACDI/VOCA has stored the grain and buyers will pick up truck loads as needed.
Yes
b. Is there another reason for monetization over alternative policy options (e.g., direct program funding)?
Monetization of wheat allows consumption of higher quality flour—the result of replacing an “improver” (an additive that improves the milling qualities of soft flour and gets bread to rise) with HRW wheat during the milling process.
Yes

127
3) Did ACDI/VOCA receive a reasonable fair market value?
Based on Informa analysis, the prices received by ACDI/VOCA and cooperating organizations have been within reasonable margin of error relative to the estimated import parity prices and the evaluation of market prices conducted by ACDI/VOCA before finalizing the sales contract.
Yes
4) Has wheat monetization had an adverse impact on domestic wheat and/or related product production in Uganda?
Wheat is not a major food crop in Uganda and is produced in small amounts. Thus, this review also analyzed other cereal or substitute products, to see if there was an adverse impact on production of those products. Since 2000, total monetized food aid has exhibited a slight upward trend. Meanwhile, domestic production of related product crops also has exhibited an upward trend. Upon analyzing the data, there is insufficient evidence to conclude wheat monetization has had any notable negative impact on domestic wheat or related crop production. This conclusion is consistent with the conclusion found in the 2011 BEST Analysis for Uganda: “Current MYAP programming being undertaken appears to minimize any negative impacts on production incentives and markets, especially as agricultural rehabilitation is still in its infancy in northern Uganda.”
No
5) Has wheat monetization disrupted commercial trade of wheat and/or related products?
The monetized wheat share of total imports is small and that share has declined in recent years, falling from an average annual share of 15.1% in 2001-2005 to 7.3% in 2006-2011. Commercial imports continue to grow, averaging 323,900 MT per year from 2006 to 2011 compared with only 162,700 MT per year from 2001 to 2005. Since the fair market value was achieved when the wheat was sold, this indicates that sales did not interfere with commercial prices. Additionally, monetized wheat imports are unlikely to have disrupted imports of competing commodities since wheat is, by far, the number one cereal import (nearly 80% of cereal imports) and also the top food import on a value basis. On average, monetization only accounted for 7.4% of wheat imports from FY 2006-2010, and only 5.4% in FY 2011.
No
6) What is the average direct cost recovery rate by ACDI/VOCA and implementing partners?
During the course of the FY 2007-2011 MYAP, the average cost recovery rate was 82%. For the first monetization in FY 2012, the cost recovery was 91%.
82%
128
X. CONCLUSIONS
The study found that, due to the practices used when designing and implementing the five reviewed programs, in each case (1) the sale of the commodities did not compete with local production, (2) the sale of the commodities did not disrupt commercial trade, and (3) the sale was for a fair market value (e.g., the sales price received for the commodity was comparable to prevailing market prices for similar commodities in the country of sale), which helps to mitigate market disruption. The monetized commodity must be of sufficient domestic demand and there must be
insufficient domestic production to warrant the importation and monetization of the commodity. In all cases evaluated within this study, this criterion was met.
When monetization is done in a responsible manner47 and volumes are small relative to overall production or trade, monetization does not adversely impact production and it does not disrupt trade. In all cases evaluated within this study, monetization did not have an adverse impact on local production or commercial trade.
While the cost recovery rate may be less than 100%, as it is in all evaluated cases within this study (except the 2012 cost recovery for Mozambique was 101%), there are a number of other reasons why monetization is of value compared to direct project funding and therefore, monetization has benefits beyond the generation of sales proceeds. Examples include:
Cases where the monetization results in added food availability on the domestic market and/or generates business opportunities that would not be there in the absence of monetization. In these cases, domestic production is insufficient to meet demand and there are market barriers preventing some or all buyers from purchasing the commodity off of the world market, such as
Credit Constraints – Limited access to financing prevents potential buyers from purchasing commodities on the world market. Monetization provides those buyers with financing options. For example, monetization programs can offer more flexible payment terms than what is commercially available by not requiring an international letter of credit and allowing incremental payments instead of payment in full upon delivery.
Volume Constraints – For medium- and small-scale buyers, higher freight rates and other costs associated with low-volume sales impede their ability to source commodities on the world market. Freight rates can increase by multiples of 2 or more when less than full-sized commercial volumes are
47
There is a wide number of “Best Practices” highlighted within the literature which minimize the potential negative impacts and maximize potential benefits of food aid monetization.

129
procured. Monetization provides small- and medium-sized buyers access to the commodities at a landed price (e.g., cost, insurance and freight (CIF) price) that is comparable to prices a larger buyer would have paid for full-sized shipments of similar products.
Currency Risk Constraints – The risk of volatile exchange rates can prevent
buyers from purchasing on the global market. Monetization programs that allow buyers to purchase in local currency, thereby reducing this risk.
Hard Currency Constraints – When sales are made in local currency, a country
that has limited hard currency reserves is able to import more food commodities without making a difficult tradeoff between food, fuel, and other necessary imported goods.
Price Constraints – The worldwide run up in commodity prices during late 2007 and early 2008 made commercial commodity imports cost prohibitive for many net food-importing, developing countries and least developed countries. Monetization levels slightly increased in some countries to help fill the gap, although the amounts provided through monetization were too small to offset the declining imports.
Cases where monetization results in added food quality and/or enhanced consumer nutrition. There are cases where the cost of procuring a similar quality product off of the open market would be cost restrictive and buyers would revert to lower quality product. In these cases, monetization is filling a nutritional gap that buyers cannot afford to fill themselves.
Cases where there are monetization is the only funding tool available to carry-out a development project and is an appropriate for the country because it requires imports of certain commodities to meet its needs and monetization would represent only a small portion of those imports.
In some cases, well-timed monetization deliveries can help alleviate local market price volatility.

130
APPENDIX
A. Country Profiles – Select Monetization Cases
Informa reviewed 19 different /monetization cases provided by AGFS member organizations and chose five from that list for the in-depth studies provided in this report. This section provides brief country profiles for this initial list of potential case studies. High level public data was collected to get a snapshot of the monetization case. A number of elements were evaluated, including Key Development Indicators
Monetization and development programs are generally conducted in countries/regions where there is a development need and these countries are generally among some of the poorest countries in the world. Often the goal of these programs is to improve in-country nutrition, poverty, and/or agricultural and general economics. For this reason general trends were observed for indicators such as: GDP, Agricultural value added, Crop and food production, Employment, Life expectancy, Malnutrition, and Poverty
Additionally, one commonly cited benefit of monetization is that it helps increase in-country food availability by reducing potential credit barriers to commercial trade. For this reason, credit indicators were observed and compared.
Production, Consumption, and Net Trade - For the commodity relevant to the
proposed case study, local production and consumption trends were analyzed to determine if there is significant demand and insufficient domestic production to warrant the importation and sale of the monetized commodity.
Food Aid Data - Trends in total food aid by commodity were analyzed and compared to production, consumption and commercial trade trends.
The above analyses served as indicators that the case may be a “good” example of monetization and warrant more in-depth analysis. The other criteria utilized to identify the 5 case studies were a desire to have a variety of countries, organizations, types of programs and commodities, and that the monetizations took place fairly recently and there is generally good data availability (public and private). Below are a series of tables and charts for these 19 cases. Data sources for these charts include The World Bank; USDA, FAS; and FAO.

131
BANGLADESH – SOYBEAN OIL
Soybean Oil Supply and Demand, 1995-2010
*Production data unvailable prior to 2003.
BURKINA FASO – RICE
Rice Supply and Demand, 1995-2010

132
CONGO - WHEAT
Wheat Supply and Demand, 1995-2010
The GAMBIA – VEGETABLE OIL
Vegetable Oil Supply and Demand 1995-2009
Indicator 2000 2006 20092009 LDC
1
Average
Population (millions) 49.63 59.09 64.20 17
GDP (current million USD) 4,306 8,543 11,204 10,756
GDP growth (annual %) -7 5 3 4
Agriculture, value added (current million USD) 2,126 3,702 4,636 3,095
Agriculture growth (annual %) -12 3 3 4
Crop production index (2004-2006 = 100) 103 99 98 112
Food production index (2004-2006 = 100) 102 100 99 112
Employment in agriculture (% of total
employment) a a a 64
Life expectancy at birth (total years) 46 47 48 57
Malnutrition prevalence, weight for age (% of
children under 5) a a a 19
Poverty headcount ratio at national poverty line
(% of population) a 71 a 46
Domestic credit provided by banking sector (% of
GDP) 8 5 7 a
Domestic credit to private sector (% of GDP) 3 3 7 a
1 Least Developed Countries
a Data unavailable for given year.
Development Indicators

133
GEORGIA - WHEAT
Wheat Supply and Demand, 1995-2010
*Net trade data unavailable prior to 1996.
GUATEMALA- SOYBEAN MEAL
Soybean Meal Supply and Demand, 1995-2010

134
KENYA - WHEAT
Wheat Supply and Demand, 1995-2010
LIBERIA - RICE
Rice Supply and Demand, 1995-2010

135
LIBERIA - VEGETABLE OIL
Vegetable Oil Supply and Demand, 1995-2009
LIBERIA - WHEAT
Wheat Supply and Demand, 1995-2009
*Production data unavailable for time series.

136
MADAGASCAR - WHEAT
Wheat Supply and Demand, 1995-2009
MALAWI – SOYBEAN OIL
Soybean Oil Supply and Demand, 1995-2009
*Production data unavailable for time series.

137
MAURITANIA – WHEAT
Wheat Supply and Demand, 1995-2009
MOZAMBIQUE - WHEAT
Wheat Supply and Demand, 1995-2010

138
NICARAGUA - WHEAT
Wheat Supply and Demand, 1995-2010
*Production data is unavailable
NIGER - RICE
Rice Supply and Demand, 1995-2010

139
RWANDA - VEGETABLE OIL
Development indicator data is unavailable.
Vegetable Oil Supply and Demand, 1995-2009
SENEGAL – VEGETABLE OIL
Vegetable Oil Supply and Demand, 1995-2009

140
UGANDA - WHEAT
Wheat Supply and Demand, 1995-2009

The Value of Food Aid Monetization: Benefits, Risks, and Best Practices
141
B. Literature Review References
1. Abdulai, Awudu, Christopher B. Barrett, and Peter Hazell. Food Aid For Market Development in Sub-Saharan Africa. 2004.
2. Barrett Et Al. U.S. MONETIZATION POLICY: RECOMMENDATIONS FOR IMPROVEMENT. Study Prepared under the Auspices of the Global Agricultural Development Initiative. 2009.
3. Deloitte & Touche. USAID Ethiopia: FY 2003 Bellmon Distribution Study: Final Report. 2002.
4. Donovan, Cynthia, Helder Zavale, and David Tschirley. The Evaluation of the Impacts of Title II Monetization. Working paper no. 103. East Lansing, MI: Dept of Ag., Food, and Rural Economics and Dept. of Economics (MSU). 2010.
5. Donovan, Cynthia, Megan McGlinchy, John Staatz, and David Tschirley. Emergency Needs Assessments and the Impact. Working paper no. 87. East Lansing, MI: Department of Agricultural Economics and the Department of Economics, Michigan State University (MSU). 2006.
6. Emerging Markets Group, Ltd. FY 2007 Title II Bellmon Monetization and Distribution Study: Rwanda. 2006.
7. Emerging Markets Group, Ltd. Mozambique F08-12 Bellmon Monetization and Distribution Analysis: Final Draft. 2008.
8. Fintrac Inc. for USAID Office of Food for Peace. Liberia Bellmon Estimation. 2009.
9. Fintrac Inc. for USAID Office for Food for Peace. Uganda Bellmon Estimation. 2011.
10. Fintrac Inc. for USAID Office of Food for Peace. Guatemala Bellmon Estimation. 2011.
11. GAO. INTERNATIONAL FOOD ASSISTANCE: Funding Development Projects through the Purchase, Shipment, and Sale of U.S. Commodities Is Inefficient and Can Cause Adverse Market Impacts. no. GAO-11-636. United States Government Accountability Office (GAO). 2011.
12. Hanrahan, Charles E., and Carol Canada. International Food Aid: U.S. and Other Donor Contributions. no. RS21279. Congressional Research Service. 2011.
13. Ho, Melissa D., and Charles E. Hanrahan. International Food Aid Programs: Background and Issues. no. R41072. Congressional Research Service. 2010.
14. Maunder, Nick. The Impact of Food Aid on Grain Markets in Southern Africa: Implications for Tackling Chronic Vulnerability, a Review of the Evidence. 2006.

The Value of Food Aid Monetization: Benefits, Risks, and Best Practices
142
15. Shaw, Ron, and Craig MacKay. An Analysis of PL-480 Title II Monetization Data (2001-2005): Impacts on Domestic Production, Local Marketing and Global Trade. 2006.
16. Simmons, Emmy, and David Shiferaw. GETTING DOWN TO BUSINESS: FEED THE FUTURE IN AFRICA U.S. ASSISTANCE TO SUB-SAHARAN AFRICA 2010. 2011.
17. Simmons, Emmy. MONETIZATION OF FOOD AID: Reconsidering U.S. Policy and Practice. 2009.
18. Tschirley, David, and Julie Howard. Title II Food Aid and Agricultural Development in Sub-Saharan Africa: Towards a Principled Argument for When, and When Not, to Monetize. Working paper no. 81. East Lansing, MI: Dept. of Agricultural Economics and the Dept. of Economics (MSU). 2003.
19. USAID. Monetization Field Manual. 2012.