the value of indigenous sight - pwc
TRANSCRIPT
www.pwc.com.au
The value of Indigenous sight An economic analysis Final report
University of
Melbourne
The value of Indigenous
sight: An economic
analysis
September 2015
University of Melbourne PwC i
Disclaimer
This report has been prepared by PricewaterhouseCoopers Australia (PwC) at the request of the University of Melbourne Indigenous Eye Health Unit (IEHU) in our capacity as advisors in accordance with the Agreement dated 26 February 2015 between PwC and the IEHU.
This report is not intended to be utilised or relied upon by any other persons other than the IEHU, nor to be used for any purpose other than that articulated above. Accordingly, PwC accepts no responsibility in any way whatsoever for the use of this report by any other persons or for any other purpose.
The information, statements, statistics and commentary (together the “Information”) contained in this report have been prepared by PwC from publicly available material, consultations with the IEHU and an advisory group convened by the IEHU, and from material provided by the IEHU. PwC has not sought any independent confirmation of the reliability, accuracy or completeness of this information. It should not be construed that PwC has carried out any form of audit of the information that has been relied upon.
Accordingly, whilst the statements made in this report are given in good faith, PwC accepts no responsibility for any errors in the information provided by the IEHU or other parties nor the effect of any such error on our analysis, suggestions or report.
The Information must not be relied on by third parties, copied, reproduced, distributed, or used, in whole or in part, for any purpose other than detailed in our Agreement without the written permission of the IEHU and PwC.
Liability is limited by a scheme approved under Professional Standards Legislation.

University of Melbourne PwC ii
Executive summary
PwC and PwC’s Indigenous Consulting (PIC) collaborated with the University of Melbourne Indigenous Eye Health Unit (IEHU) to estimate the economic impacts of eliminating unnecessary vision loss for Indigenous Australians.
We compared the economic impacts of continuing provision of current eye care services and programs to the additional economic impacts that would be generated by implementing the recommendations outlined in the Roadmap to Close the Gap for Vision (the Roadmap).
The purpose of this analysis is to help to understand and quantify the case for government investment in the Roadmap.
The Roadmap The Roadmap is a call to action to eliminate the known differences in the standard of eye health in Indigenous Australians compared to mainstream Australians.1
It showed that 94 percent of the vision loss experienced by Indigenous Australians is preventable or treatable – but that there are challenges and barriers along the patient pathway that are preventing effective care. 2
The Roadmap focuses on four conditions:
Refractive error – this includes myopia (short-sightedness), hyperopia (long-sightedness), with or without astigmatism (when the eye can sharply image a straight line lying only in one meridian) and presbyopia (the need for reading glasses as one gets older).3
Cataract – this is clouding of the lens of the eye which prevents clear vision. Although most cases of cataract are related to the ageing process, occasionally children can be born with the condition, or a cataract may develop after eye injuries, inflammation, and some other eye diseases.4
Diabetic retinopathy – which is the damage to blood vessels inside the retina causing vision loss and blindness. People with diabetes are at risk of developing diabetic retinopathy. Symptoms only emerge in the later stage and include blurred vision, eye strain and headaches.5
Trachoma – this is a bacterial infection of the eye that can cause complications including blindness. This preventable disease is linked to poor hygiene and is
1 Note: In this report we use the terms ‘Indigenous’ and ‘Indigenous Australians’ to refer to all Aboriginal and
Torres Strait Islander peoples.
2 Taylor et al., April 2013.
3 World Health Organization, 2015c.
4 ibid
5 Better Health Channel, 22 June 2015.

Executive summary
University of Melbourne PwC iii
often associated with poverty. Lack of facial cleanliness is the key factor that causes the spread of the infection that causes trachoma.6
In the next ten years PwC estimates that over 34,000 Indigenous Australians will be affected by low vision or blindness as a result of these four conditions.7
Challenges related to current eye care
The Roadmap sets out the evidence for why current eye care services and programs will not be able to address this estimated vision loss. This includes:
the referral pathway is currently a ‘leaky pipe’ – meaning that it can be inefficient and that individuals may ‘drop out’ of services
coordination and links between Aboriginal Health Services, clinics and hospitals could be better
referral for those found to have diabetic eye disease is not prompt enough.8
In the Roadmap the IEHU recommends a series of strategies and actions to resolve these challenges that it believes will eliminate unnecessary vision loss for Indigenous Australians.
The IEHU put forward in 2013 that the implementation of the recommendations set out in the Roadmap will require a doubling of existing funding. However with this additional investment cataract surgery will increase seven times, diabetic examinations five times and use of glasses 2.5 times, leading to substantially improved eye health for Indigenous Australians.9
Since then there have been several Commonwealth funded programs (such as the Rural Health Outreach Fund and Visiting Optometrists Scheme) that have been reframed to better meet patient needs and which have received significantly increased funding.
Approach to analysis We have followed a cost-benefit analysis approach to understand the benefits of closing the gap for Indigenous eye health. The analysis has been applied over a ten-year period from 2015 to 2024. This approach considers and compares two scenarios:
1 the costs of funding current eye care services and programs, and the benefits these generate for Indigenous Australians, the Australian economy and Australian, state and territory governments
2 the costs incurred and benefits generated by the implementation of the Roadmap, which sets out the additional strategies and activities required to eliminate avoidable vision loss.
Together, current eye care services and programs and the implementation of the recommendations in the Roadmap are expected to eliminate avoidable vision loss
6 ibid
7 PwC Analysis. See Table 6
8 Taylor et al., April 2013.
9 Taylor et al., April 2013.

Executive summary
University of Melbourne PwC iv
for Indigenous Australians. Their cumulative costs and benefits have therefore also been considered.
A cost-benefit approach excludes benefits that cannot be reliably quantified in dollar terms. This means a number of important benefits were not accounted for in the analysis, including impacts on the education system, some aspects of health care, impacts on life expectancy and whole of community health impacts.
This analysis can therefore be considered as a conservative view of the impact of Indigenous eye health in Australia.
The benefits that have been quantified in this analysis are:
productivity benefit to the individual – productivity benefit for Indigenous Australians affected by unnecessary blindness or low vision, a portion of whom were not previously working due to their condition and would enter the workforce upon treatment, or who are already working and who would be more productive with full vision
productivity benefit to carers – productivity benefit for carers of individuals affected by unnecessary blindness or low vision who would no longer be forgoing education, productive time or leisure time to care for that individual upon treatment
avoided tax burden – the avoided tax burden generated by a reduced need to raise tax revenue to fund healthcare and welfare costs. When Indigenous Australians affected by unnecessary blindness or low vision are treated and return to full vision they will also no longer be affected by other co-morbidities caused by blindness and low vision. This means that the government no longer has to fund the direct health costs for care related to their co-morbidities, which reduces the tax burden on the Australian population. If Indigenous Australians affected by unnecessary blindness or low vision are able to return to the workforce, they will no longer be eligible for welfare support, reducing the tax revenue required to fund it.
direct health system savings (health benefit) –the averted health costs associated with the most common co-morbidities which are a direct result of unnecessary blindness and low vision: falls and depression. When Indigenous Australians affected by unnecessary vision loss are treated and return to full vision they will also no longer be affected by other co-morbidities caused by their vision loss. This means that healthcare for these co-morbidities will no longer require funding.
A number of other benefits were considered but not included. These are listed in Appendix A.
These benefits are generated by different cohorts of the Indigenous Australian population affected by blindness or low vision. This factor has been taken into account when quantifying the benefits.
Costs In 2015-16 the Australian, state and territory governments will spend approximately $40 million on Indigenous eye care. This is made up of:
Executive summary
University of Melbourne PwC v
capped and uncapped costs to provide services to address cataract, refractive error and diabetic retinopathy10
some coordination, governance and evaluation costs
funding for trachoma elimination and health promotion programs.
The additional strategies and activities set out in the Roadmap require another $24 million in funding to enhance eye care through:
further regional and national collaboration and coordination
improving care pathways and patient support
enhancing data collection and monitoring, accountability and oversight.
After 2016-2017, the funding for trachoma programs is not yet committed, however the IEHU believes these programs are still needed. This funding therefore becomes an additional component of the additional costs required to eliminate unnecessary vision loss. Figure 1 breaks down the funding that will be required over the next ten years to close the gap in Indigenous eye health. Rural Health Outreach Fund (RHOF), Visiting Optometrists Scheme (VOS) and Medical Outreach – Indigenous Chronic Disease Programme (MOICDP) funding is assumed to continue.
Figure 1: Total annual funding required to close the gap in Indigenous eye health ^
Source: PwC analysis, Anjou, 2015; Hsueh et al., 2013; Macklin et al., 2013; University of Melbourne, 2015; Vision 2020 Australia, 2015.
^Note: these costs are extrapolations of 2011 and 2015 data provided by and developed in collaboration with the Indigenous Eye Health Unit at the University of Melbourne. The funding profile changes from 2017-18 onwards as current government funding for trachoma lapses in 2015-16 and is therefore considered as additional funding required after this point.
10 Capped costs: these are government funds that have been allocated for specific purposes and have set limits such as
Medical Specialist Outreach Assistance Program (MSOAP), Visiting Optometrist Scheme (VOS) and Patient Assistance Travel Scheme (PATS); Uncapped costs: this is government expenditure that has no set limit (or ‘cap’), namely the Medicare Benefits Schedule or Medicare.
$40$36
$24$28
0
10
20
30
40
50
60
70
2015-16 and 2016-17 2017-18 onwards
$m
illi
on
s
(und
isco
unte
d, $
2015
)
Current funding Additional funding
44%
63%56%
37%
Executive summary
University of Melbourne PwC vi
Results Total benefits
PwC analysed two scenarios:
the impact of current eye care services and programs
the full impact of the activities set out under the Roadmap.
As well as the cumulative impact of current eye care and the Roadmap, which is anticipated to close the gap for Indigenous eye health.
Table 1 describes the benefits generated under each scenario.
Table 1: Total benefits generated over ten years
Scenario Current eye care services & programs
Implementation of the Roadmap
Total
Explanation of scenario
Current eye care services and programs are anticipated to address approximately one third of unnecessary vision loss for Indigenous Australians. They therefore generate one third of estimated benefits.
Implementation of the Roadmap is anticipated to address the remaining two thirds of unnecessary vision loss for Indigenous Australians. It therefore generates two third of estimated benefits.
Together, current eye care services and the implementation of the Roadmap are anticipated to eliminate unnecessary vision loss for Indigenous Australians.
Total benefits ($m discounted, 2015)
$278 million $578 million $856 million
Source: PwC, based on advice from the IEHU
Total costs
Table 2 compares the total cost of funding to the total benefit generated under each scenario.
Table 2: Total cost and benefit over ten years for the elimination of unnecessary vision loss for Indigenous Australians
Current eye care
services & programs ($m discounted, 2015)
Implementation of the Roadmap
($m discounted, 2015)
Total value ($m discounted, 2015)
Total cost -$308 -$227 -$534
Total benefit $278 $578 $856
Net benefit -$30 $351 $321
Benefit cost ratio 0.9 2.5 1.6 Source: PwC. Please note that totals may not sum due to rounding. Costs and benefits are quantified over a 10 year period and discounted using a real discount rate of 5 percent. For this reason the undiscounted costs in Figure 1 are not directly comparable to the discounted costs in this table.
Does this demonstrate a case for investment in the Roadmap?
Over the next ten years, current eye care services and programs will generate an estimated total of $278 million in economic benefits, but they will cost the Australian, state and territory governments $308 million to provide.
Investment in the Roadmap’s recommendations in addition to current eye care will cost an additional $227 million over ten years but will generate further economic benefits of $578 million.
This means that investment in the Roadmap’s recommendations will:
Executive summary
University of Melbourne PwC vii
increase the overall economic benefit from investment in eye care for Indigenous Australians
increase the efficiency of provision of eye care services and programs (generate more benefit for less cost).
Currently, for every $1 spent on eye care the return to the Australian economy is $0.90. The implementation of the recommendations set out in the Roadmap is intended to address the challenges and barriers to effective and efficient eye care service provision and so is anticipated to provide a return on government investment of $2.50 for every additional $1 spent.
Overall, the elimination of unnecessary vision loss for Indigenous Australians will generate an estimated return of $1.60 for every $1 of funding for eye care.
Benefit drivers
The two major drivers of the benefit from improved Indigenous eye health are:
productivity benefit to the individual: which will generate $529 million of benefit over ten years
productivity benefit to carers: which will generate $255 million of benefit over ten years.
Fiscal lens
It is also possible to take a fiscal lens, which considers the costs and benefits to the funders – in this case the Australian and state and territory governments. This produces a benefit value that is a subset of the economic benefit total.
The fiscal benefits to governments that will be generated through closing the gap for Indigenous eye health are:
increased tax income - $120 million of benefit over ten years
increased indirect tax - $42 million of benefit over ten years
reduction in welfare payments - $179 million of benefit over ten years
reduction in direct health expenditure - $27 million of benefit over ten years.
This means that over a ten year period, the estimated total fiscal benefit to the Australian and state and territory governments will be $367 million. When compared to a total cost of funding over ten years of $534 million this represents a net impact to government expenditure of -$167 million.
Other fiscal benefits not included in this study, such as the indirect flow-on effects of greater productivity, may further offset the costs and reduce the net negative fiscal impact.
Wellbeing and quality of life
A ‘Years lost due to disability’ (YLDs) approach can be used to quantify the impact on individual’s wellbeing of improved eye health.11
11 This is a method developed by the World Health Organization to measure the impact of disability and disease.

Executive summary
University of Melbourne PwC viii
One YLD represents the equivalent of one year of full health and productive life lost due to disability, therefore the number of YLDs averted through the implementation of the Roadmap provides an indication of ‘how much’ wellbeing has been restored through the elimination of unnecessary blindness and low vision for Indigenous Australians.
The total number of YLDs averted by closing the gap for Indigenous eye health and eliminating unnecessary vision loss is estimated to be between 1,700 and 7,300 years of life free of disability for the Indigenous community (depending on the calculation method used).12
Conclusion If Australia implements the Roadmap in addition to the provision of current eye care services and programs, it will be able to restore sight or avoid future vision loss for 34,000 Indigenous Australians, closing the gap for Indigenous eye health.13
The implementation of the Roadmap presents an opportunity to close the gap for Indigenous eye health and realise positive change for Indigenous Australians which will support a stronger and more productive Australian economy. This can be achieved for a net fiscal cost to governments of $167 million over ten years.
Figure 2: The value of Indigenous sight
Source: PwC. Note: ^ refers to all Australian, state and territory governments. * depending on the calculation method used
12 There are two approaches to measuring the impact of blindness and low vision on health and productivity which
attribute either a greater or a lesser importance to this impact. Due to differences of expert opinion over which is most reliable (Taylor et al, 2013) we have estimated YLD using both approaches: 1) the 2010 Global Burden of Disease disability weightings (which attribute a lesser importance to the impact of blindness and low vision); 2) the 2004 Global Burden of Disease disability weightings (which attribute a greater importance to the impact of blindness and low vision).
13 PwC analysis, see Table 6
Economy
$321 million net benefit to the Australian economy
Community
Substantial social and wellbeing benefitsincluding 1,700 -7,300 YLDs averted*
$167 million net cost to
government^
Government

Executive summary
University of Melbourne PwC ix
The elimination of unnecessary vision loss for Indigenous Australians has the potential to generate close to $900 million in economic benefits for Australia over a ten year period from 2015 t0 2024, and a net benefit of $321 million. This benefit is dependent on the implementation of the recommendations set out in the Roadmap, which are intended to address the current challenges and barriers to effective and efficient eye care service provision.
Investment in the Roadmap’s recommendations will:
substantially increase the overall economic benefit from investment in eye care for Indigenous Australians
substantially increase the efficiency of provision of eye care services and programs, generating a return of $2.50 for every additional $1 spent.

University of Melbourne PwC x
Contents
Disclaimer i
Executive summary ii
1 Background 1
2 Determining benefits 9
3 Results of the analysis 15
Appendix A Approach 23
Appendix B Sensitivity analysis 44
Appendix C Advisory group for the economic analysis of Indigenous eye health 46
Appendix D Bibliography 47

University of Melbourne PwC 1
1 Background
1.1 The project PwC and PwC’s Indigenous Consulting (PIC) collaborated with the University of Melbourne Indigenous Eye Health Unit (IEHU) to estimate the economic impacts of implementing the recommendations outlined in the Roadmap to Close the Gap for Vision (the Roadmap).
The program of recommendations is intended to eliminate unnecessary vision loss for Indigenous Australians and in doing so close the gap in the standard of eye health between Indigenous and non-Indigenous Australians. These recommendations require additional investment above what the Australian, state and territory governments have currently committed to Indigenous eye health.
PwC has been commissioned to test the hypothesis that the potential economic benefits that could be realised from implementing the Roadmap’s program of recommendations will be substantially greater than the additional funding required. We have developed a cost-benefit analysis to test this hypothesis.
This analysis will help strengthen the case for the benefits that will be realised from the implementation of the Roadmap.
1.2 The Roadmap The Roadmap to Close the Gap for Vision was launched in February 2012 as a call to action to eliminate the known differences in the standard of eye health in Indigenous Australians compared to mainstream Australians.
It sets out a program of recommendations for policy change and investment to improve the quality and sustainability of eye care services for Indigenous Australians in order to ‘close the gap’.
The Roadmap addresses primary eye care, refractive services, cataract, diabetic eye disease and trachoma.
Figure 3: Summary of the Roadmap to Close the Gap for Vision

Background
University of Melbourne PwC 2
Drivers for the Roadmap Indigenous children start life with much better vision than the average Australian, yet Indigenous people over the age of 40 have six times more blindness than other Australians.14
The IEHU set out in 2010 to understand why current services and programs for Australians with eye problems were not effective for Indigenous Australians.
They undertook a research project to find out:
why Indigenous Australians have trouble using eye services that already exist
what needs to be fixed in the government support programs for visiting eye specialists
what else needs to happen so Indigenous Australians with eye problems get proper care and referrals for further treatment.15
This research showed that 94 percent of the vision loss experienced by Indigenous Australians is preventable or treatable – but that 35 percent of Indigenous adults have never had an eye exam.16 This vision loss is caused by four conditions:
Refractive error – this includes myopia (short-sightedness), hyperopia (long-sightedness), with or without astigmatism (when the eye can sharply image a straight line lying only in one meridian) and presbyopia (the need for reading glasses as one gets older).17
Cataract – this is clouding of the lens of the eye which prevents clear vision. Although most cases of cataract are related to the ageing process, occasionally children can be born with the condition, or a cataract may develop after eye injuries, inflammation, and some other eye diseases.18
Diabetic retinopathy – which is the damage to blood vessels inside the retina causing vision loss and blindness. People with diabetes are at risk of developing diabetic retinopathy. Symptoms only emerge in the later stage and include blurred vision, eye strain and headaches.19
Trachoma – this is a bacterial infection of the eye that can cause complications including blindness. This preventable disease is linked to poor hygiene and is often associated with poverty. Lack of facial cleanliness is the key factor that causes the spread of the infection that causes trachoma.20
Table 3 sets out the IEHU’s key findings in relation to each of these conditions, which informed the recommendations included in the Roadmap.
14 Taylor et al., 2014.
15 ibid
16 ibid
17 World Health Organization, 2015c.
18 ibid
19 Better Health Channel, 2015.
20 ibid

Background
University of Melbourne PwC 3
Table 3: Key findings from the Roadmap to Close the Gap for Vision research project
Key finding Implications
Refractive error
Only 20% of Indigenous adults wear glasses for distance compared to 56% in mainstream
Lack of reading glasses meant that 39% could not see normal print
An optometrist working in Aboriginal Health Service led to much better outcomes
Readily accessible eye services are needed for all Australians
More and better co-ordinated visits by optometrists or ophthalmologists are required in more remote areas
Better co-ordination and links between Aboriginal Health Services, clinics and hospitals are needed in urban areas
Cataract
Blinding cataract is 12 times more common in Indigenous adults
But rates of cataract surgery are 7 times lower
Waiting time for cataract surgery is 56% longer than mainstream
Indigenous Australians are 4 times more likely to have to wait for more than 1 year for cataract surgery
Cataract surgery needs to be made readily available for all Australians
Adequate and sustainable funding is required for visiting specialist services
Proper funding for patient travel to regional hospitals for surgery is required
Adequate surgical facilities, time and staff must be committed for cataract surgery
Excellent co-ordination is required between the patient, community, clinic, hospital and the surgical team
Diabetic retinopathy
37% of Indigenous adults have diabetes and 13% have already lost vision
98% of blindness from diabetes is preventable with early detection and timely treatment
Only 20% have had an eye exam in the last year
Only 37% needing laser surgery have received it
All Indigenous people with diabetes need an eye exam every year and better access to diabetes education
Good co-ordination and recall mechanisms are needed
Sustainable funding (Medicare) is required for retinal photography
Prompt referral is required for those found to have diabetic eye disease
Laser surgery should be available locally but good quality slit lamps and portable lasers are needed
Trachoma
Two thirds of remote communities have endemic trachoma
Adults with trachoma scarring and in-turned lashes (trichiasis) are
The extent of trachoma needs to be mapped clearly
All children at risk need to be checked regularly

Background
University of Melbourne PwC 4
Key finding Implications
found across the country
Trachoma can be eliminated with the SAFE Strategy21
Elderly people across the country need to be checked for in-turned lashes (trichiasis) and operated on if necessary
Trachoma elimination programs need to be fully implemented in endemic areas
Source: Adapted from – Taylor et al., April 2013; Taylor et al., 2014.
Progress to date The IEHU has presented progress to date in the implementation of the Roadmap in its series ‘Annual Update on the Implementation of The Roadmap to Close the Gap for Vision.’
1.3 Costs The Australian and state and territory governments fund a number of different support services for eye health generally and Indigenous eye health in particular, including primary health care, outreach services and trachoma elimination programs. About $40 million of funding is currently provided by Australian and state and territory governments (see Table 4).
The Roadmap indicates that government funding for current services and programs to address Indigenous eye health cannot achieve the outcomes necessary to close the gap in the standard of eye health between Indigenous and non-Indigenous Australians.22
Table 4 sets out the estimated total funding required to eliminate unnecessary vision loss for Indigenous Australians and breaks down this funding to show how much will come from current funding and how much additional government investment is needed. Table 4 includes:
capped and uncapped costs to provide services to address cataract, refractive error and diabetic retinopathy23
coordination, governance and evaluation costs
funding for trachoma elimination and health promotion programs
21 Trachoma can be prevented with the World Health Organization's (WHO) SAFE Strategy:
surgery for trichiasis
antibiotic (Azithromycin) treatment
facial cleanliness and
environmental improvements.
WHO and all Governments including Australia have committed to the Global Elimination of Trachoma by 2020 (GET 2020)
22 Taylor et al., April 2013; Hsueh et al., 2013.
23 Capped costs: these are government funds that have been allocated for specific purposes and have set limits such as
Medical Specialist Outreach Assistance Program (MSOAP), Visiting Optometrist Scheme (VOS) and Patient Assistance Travel Scheme (PATS); Uncapped costs: this is government expenditure that has no set limit (or ‘cap’), namely the Medicare Benefits Schedule or Medicare

Background
University of Melbourne PwC 5
– the current funding for trachoma elimination lapses in 2016-17. It therefore becomes part of the additional funding required to ‘close the gap’ from 2017-18 onwards.
This estimate of funded and unfunded costs is an extrapolation developed in collaboration with the IEHU based on the following sources:
the estimated annual funded and unfunded costs of closing the gap for Indigenous eye health in 2011 for refractive error, cataract and diabetic retinopathy24
a 2015 update of the additional capped costs required from the Australian Government25
a 2015 recommendation by Vision 2020 Australia in relation to further investment required to close the gap for Indigenous eye health, assumed to be in addition to the additional cost estimate from 201126
the current Australian Government funding provided to close the gap on trachoma.27
24 Hsueh et al., 2013.
25 University of Melbourne, 2015.
26 Vision 2020 Australia, 2015.
27 Nash, 2014 and Macklin et al., 2013.

Background
University of Melbourne PwC 6
Table 4: Estimated annual cost of closing the gap for Indigenous eye health, 2015-2024 (undiscounted, $2015)
2015-16 to 2016-17
$m p.a %
2017-18 onwards
$m p.a %
Total over 10 years
$m
Total over 10 years
$m, population
growth^
Current funding:*
Diabetic retinopathy, cataract, refractive error 12 19% 12 19% 118 129
Trachoma 4 7% 0 0% 8 8
Coordination and other costs + 24 38% 24 38% 240 262
Subtotal current funding 40 63% 36 57% 366 400
Additional funding required:*
Diabetic retinopathy, cataract, refractive error 14 22% 14 22% 138 151
Trachoma 1 1% 5 8% 41 46
Coordination and other costs +
9 14% 9 14% 92 101
Subtotal additional funding required
24 37% 28 44% 272 298
Total funding required 64 100% 64 100% 638 697
Source: PwC analysis; Anjou, 2015; Hsueh et al., 2013; Macklin et al., 2013; University of Melbourne, 2015; Vision 2020 Australia, 2015. Please note that totals may not sum due to rounding.
* Includes Australian Government capped and uncapped costs and State and territory government capped and uncapped costs.
The capped State/Territory costs are assumed to be 49% funded as per 2011. The uncapped Commonwealth and State/Territory costs are assumed to be 40% funded as per 2011. The uncapped Commonwealth and State/Territory costs are distributed 61% Commonwealth/39% State/Territory as per 2011.
+ Coordination and other costs include Commonwealth and State/Territory coordination; State/Territory Low Cost Spectacles, Patient Assisted Transport; governance
^ Costs are grown in line with the average Indigenous Australian population growth rate over the 2015 to 2024 period (2.0%) as projected by the Australian Bureau of Statistics, 30 April 2014.
These costs will be used as the cost inputs for the CBA.
1.4 Project approach PwC has undertaken a CBA of the costs and anticipated impact of the recommendations set out in the Roadmap to estimate the economic savings that it could generate.
Our approach considered:
the cost of implementing the Roadmap
the quantifiable benefits that would be achieved by closing the gap for vision through the Roadmap
the different stakeholders that would benefit from the Roadmap.
This approach is set out in Figure 4.

Background
University of Melbourne PwC 7
Figure 4: Cost-benefit approach
Source: PwC
The CBA framework monetises (quantifies in dollar terms) the benefits to be derived from the implementation of the Roadmap. Impacts are quantified over a ten year period using a real discount rate of 5 percent.28 This allows the costs and benefits to be directly compared to determine the net impact of the Roadmap.
The benefits are determined by estimating the change in a number of identified metrics related to Indigenous eye health between two scenarios: the status quo (if current services and programs continue for the next ten years) and the future state (if the recommendations set out in the Roadmap are implemented to enhance current services and programs, over the next ten years).
This is illustrated in Figure 5.
Figure 5: Calculating the net impact
Source: PwC
28 The 5 percent discount rate is the preferred rate for discounting future values related to health sector investments.
See: Department of Health and Ageing, 2008, page 127; Department of Health and Ageing and Health Council, 2003, page 2.
Cost- benefit framework
CostsWhat costs will
be incurred?
StakeholdersWho are we doing this for and who
will be affected?
BenefitsWhat will be
achieved by the change?
Benefits Costs Net impact
Scenario 1Status quo, 2015-2024Current services &
programs
Scenario 2Future state, 2015-2024Implementation of
the Roadmap
Background
University of Melbourne PwC 8
The CBA framework is a useful tool because:
it enables valuation of impacts in terms of a single, familiar measurement scale (that is, money) – although sometimes benefits can be difficult to value in dollar terms
it is a preferred method for decision making on government spending as it allows all impacts to be assessed on a consistent basis across many projects and against the costs of investment.
Overview of methodology Our methodology involved:
reviewing key publicly-available literature related to Indigenous and non-Indigenous eye health, including:
– costs associated with poor eye health
– potential benefits of improving eye health
deriving from the evidence base a set of key inputs that could be modelled in relation to the Indigenous population in Australia
undertaking initial modelling to estimate the impact of implementing the Roadmap on the costs and benefit inputs
testing our initial inputs and modelling approach with an advisory group of experts in Indigenous eye health
– the advisory group workshop took place on 7 May 2015 (a list of workshop participants is included at Appendix C).
revising the model inputs to generate an estimate of the benefits of closing the gap for Indigenous eye health.
We did not conduct any primary data collection for this analysis.

University of Melbourne PwC 9
2 Determining benefits
There is a broad range of positive impacts that occur as a result of improving eye health. These include benefits such as:
improved physical health
improved wellbeing
greater participation in employment or education.
For Indigenous Australians, health also has a greater meaning than the physical or mental health and wellbeing of the individual. For Indigenous Australians, ‘health’:
“refers to the social, emotional and cultural well-being of the whole Community in which each individual is able to achieve their full potential as a human being thereby bringing about the total well-being of their Community.”29
Therefore, the positive impact of improved Indigenous eye health is felt not just by the individual, it is also felt by their community more broadly.
2.1 Benefits explored for the cost-benefit analysis
As a CBA requires benefits to be quantified in dollar terms, only benefits for which reliable evidence could be collated and quantification pathways identified have been explored for this project.
Through the literature review and advisory group a number of potential benefit metrics were identified for inclusion in the analysis. Appendix A presents the full list of benefits that were considered for the CBA, and explains the rationale for their inclusion or exclusion.
2.2 Final benefits list The final list of benefits that have been valued in monetary terms is:
1 productivity benefit to the individual – productivity benefit for Indigenous Australians affected by unnecessary blindness or low vision, a portion of whom were not previously working due to their condition and would enter the workforce upon treatment, or who are already working and who would be more productive with full vision
2 productivity benefit to carers – productivity benefit for carers of individuals affected by unnecessary blindness or low vision who would no longer be forgoing education, productive time or leisure time to care for that individual upon treatment
3 direct health system savings (health benefit) – the averted health costs associated with the most common co-morbidities which are a direct
29 National Aboriginal Community Controlled Health Organisation, 2014.

Determining benefits
University of Melbourne PwC 10
result of unnecessary blindness and low vision: falls and depression. When Indigenous Australians affected by unnecessary vision loss are treated and return to full vision they will also no longer be affected by other co-morbidities caused by their vision loss. This means that healthcare for these co-morbidities will no longer require funding.
4 avoided tax burden – the avoided tax burden generated by a reduced need to raise tax revenue to fund healthcare and welfare costs. When Indigenous Australians affected by unnecessary blindness or low vision are treated and return to full vision they will also no longer be affected by other co-morbidities caused by blindness and low vision. This means that the government no longer has to fund the direct health costs for care related to their co-morbidities, which reduces the tax burden on the Australian population. If Indigenous Australians affected by unnecessary blindness or low vision are able to return to the workforce, they will no longer be eligible for welfare support, reducing the tax revenue required to fund it.
A number of other benefits were considered but not included. These are listed in Appendix A.
These benefits are generated by different cohorts of the Indigenous Australian population affected by blindness or low vision. Table 5 sets out which benefits are generated by which age groups or levels of vision loss amongst the Indigenous population.
Table 5: Generation of benefits by age group
Benefit Explanation Children
5-15
Young adults
16-39
Senior adults
40-64
Retire-ment age
65+
LV B* LV B LV B LV B
Productivity – individual
This benefit is only generated by the working age population as it is an estimation of the additional income that individuals who are blind or vision impaired would earn from employment if their sight was restored.
Productivity – carer
This benefit is generated by all individuals with blindness or low vision as it is possible that all these individuals could have carers for some proportion of time.
Avoided costs – falls
The costs avoided from healthcare associated with falls are generated by senior adults and retirement age adults, as these cohorts are more likely to suffer falls than the younger population.
Avoided costs – depression
The costs avoided from healthcare associated with depression are generated by individuals of any age who are blind. Individuals can be affected by depression at any age and whether blind or of low vision. However we have chosen to only consider the blind population as there is likely to be a stronger causal link between blindness and depression than between low vision and depression.

Determining benefits
University of Melbourne PwC 11
Benefit Explanation Children
5-15
Young adults
16-39
Senior adults
40-64
Retire-ment age
65+
Avoided tax burden – falls
The reduction in tax revenue required to fund healthcare related to falls is generated by senior adults and retirement age adults. As noted above this is because these cohorts are more likely to suffer falls than the younger population.
Avoided tax burden – depression
The reduction in tax revenue required to fund healthcare related to depression is generated by individuals who are blind. As noted above, this is because individuals can be affected by depression at any age and there is a strong causal link between blindness and depression.
Avoided tax burden – welfare
When an individual enters employment, they are no longer eligible for welfare support. Therefore this benefit is generated by the working age population.
Source: PwC.
Note: * LV: Low vision; B: Blind
2.3 Determining the timeframes for benefits realisation
We assume that the backlog of Indigenous Australians with untreated vision loss in 2015 will be reduced over a five year period. This assumption also includes the goal of eliminating trachoma by 2020.30 It is noted that this is a more aggressive rate than that assumed in the global Value of Sight study undertaken in 2013 where the backlog was assumed to be reduced over the 10 year period of analysis. 31 In addition to the backlog, we assume new instances of vision impairment over the analysis period – which result from applying the current prevalence rates to the growing Indigenous population – are treated as they occur.
2.4 Benefits profile The benefits have been quantified for two scenarios: the status quo (if current services and programs continue for the next ten years) and the future state (if the recommendations set out in the Roadmap are implemented to enhance current services and programs, over the next ten years). These are measured relative to a hypothetical base case where no eye care services are provided.
The total benefit of closing the gap for Indigenous eye health is apportioned between the two scenarios. On the advice of the IEHU, the share of benefits between two components is assumed to be one third for current services and two thirds for the implementation of the Roadmap. Figure 6 illustrates this assumption. As is described further in Appendix A, the assumed share of benefits for the current funding system is based on the inefficiencies noted in the Roadmap.
30 Taylor et al. April 2013, page 6.
31 PwC, 2013, page 7.

Determining benefits
University of Melbourne PwC 12
Figure 6: Benefits profile used for this analysis
Source: PwC
2.5 Total population affected To estimate the benefits of eliminating unnecessary vision loss for Indigenous Australians over ten years, we have to understand the size of the population that would be affected by blindness or low vision caused by refractive error, cataract, diabetic retinopathy or trachoma over the ten-year period.
Figure 7 sets out how we determined this population.
One of the key inputs to this calculation is the prevalence rates of eye conditions amongst the Indigenous Australian population provided in the 2009 National Indigenous Eye Health Survey (NIEHS). The NIEHS 2009 remains the most recent and comprehensive data source to date. At the time of writing the NIEHS is being updated however the updated data are not available to incorporate into this analysis.
Although there has been an increased level of activity to address Indigenous eye health undertaken since 2009, the IEHU advises that the prevalence rates from the NIEHS 2009 are still applicable to today’s population as the rates of cataract surgery, diabetes exams and the provision of glasses have not changed significantly since 2009. Whilst rates of trachoma have fallen in children, the impact of this change will not be observed for some years to come.32
32 Taylor, 2015.
2015 2020 2025
Hypothetical base case –no eye care services
Number of Indigenous Australians
with unnecessary vision loss Current eye care services
and programs
Implementation of the Roadmap
0
The number of Indigenous Australians with unnecessary
vision loss increases over time if no care is provided
The number of Indigenous Australians with unnecessary
vision loss reduces by 1/3rd
but current services and programs cannot meet the
100% of the need
The remaining 2/3rd of Indigenous Australians who
have not received appropriate eye care from
current funding are treated by implementing the
Roadmap which Closes the Gap in Indigenous eye health
2/3
1/3
Determining benefits
University of Melbourne PwC 13
Figure 7: Estimating the total Indigenous population affected by unnecessary blindness and low vision
Source: PwC
The population numbers used for the CBA are presented in Table 6.
Table 6: Number of Indigenous Australians expected to be affected by low vision and blindness as a result of trachoma, diabetic retinopathy, cataract or refractive error between 2015 and 2024
Age group Estimated population affected between 2015 and 2024
Low vision
Children (5-15) 2,600
Young adults (16-39) 9,700
Senior adults (40-64) 11,600
Retirement age adults (65+) 7,000
Sub-total 30,800
Blindness
Children (5-15) 200
Young adults (16-39) 600
Senior adults (40-64) 1,800
Retirement age adults (65+) 800
Sub-total 3,400
Total 34,200
Source: PwC. Please note that totals may not sum due to rounding.
2.6 Other benefit lenses The benefits of improved Indigenous eye health can be viewed through different lenses. This CBA will take an economic lens, comparing the costs and benefits of implementing the Roadmap to society and the economy as a whole.
FINAL POPULATION
What is the total population of Indigenous Australians and how will this change over ten years?
ABS population estimates and
population projections
What proportion of the Indigenous Australian population are affected by low vision or blindness?
National Indigenous Eye Health Survey
2009
How much unnecessary low vision or blindness is caused by the four eye conditions: Refractive Error,
Cataract, Diabetic Retinopathy, Trachoma?
National Indigenous Eye Health Survey
2009

Determining benefits
University of Melbourne PwC 14
Fiscal
It is also possible to take a fiscal lens, which considers the financial costs and benefits to the funders – in this case the Australian and state and territory governments. This produces a benefit value that is a subset of the economic benefit total. When submitting a request for government investment it can be valuable to show the estimated net impact on government revenue and expenditure, at the same time as recognising that a social investment should not necessarily be expected to generate positive fiscal returns.
The major fiscal benefits to governments that will be considered as part of this analysis are set out in Table 7.
Table 7: Fiscal benefits included in the analysis
Benefit Rationale
Increased tax income Individuals who are able to enter the workforce are earning, and those who are already in the workforce may increase their earning potential. These individuals are therefore paying a higher amount of tax on their income than they were before treatment.
Welfare saving More individuals are in employment so they are no longer receiving government support through Newstart or the Disability Support Pension.
Health cost saving The reduced occurrence of common co-morbidities to blindness and low vision results in reduced health expenditure.
Increased indirect tax Individuals are earning more so they are able to spend more on goods and services that attract the Goods and Services Tax (GST) and other indirect taxes.
Source: PwC; Access Economics, 2004.
Wellbeing and quality of life
It is difficult to quantify and monetise the social and wellbeing benefits associated with improved eye health. One approach that has been used in previous studies is the Disability Adjusted Life Years (DALYs) approach.33
The DALYs approach measures the gap between current health status resulting from a disease or condition (in this case, eye conditions) and an ideal health situation where a given population lives to an advanced age, free of disease and disability.34 It quantifies both years of potential life lost due to premature mortality and the years of productive life lost due to disability.
The years of productive life lost due to disability associated with the current status of eye conditions amongst Indigenous Australians, and the change in DALYs that would result from implementing the Roadmap, can be used as a measure of the increased wellbeing and quality of life generated by improved Indigenous eye health.
In this report we quantify the years of productive life lost due to disability (YLD) but not the years of potential life lost due to premature mortality (YLL) due to the availability of information. However, evidence presented elsewhere shows the YLD is much larger than YLL for eye diseases and hence YLD comprises the larger share of DALYs.35
33 PwC, 2013; Access Economics, 2004.
34 World Health Organization, 2015b.
35 Deloitte Access Economics, 2015, page 36-37.

University of Melbourne PwC 15
3 Results of the analysis
If Australia implements the Roadmap in addition to the provision of current eye care services and programs, it will be able to:
restore sight or avoid future vision loss for 34,000 Indigenous Australians, closing the gap for Indigenous eye health36
generate net economic benefits of $321 million.37
This can be achieved at a net fiscal cost to the Australian and State and territory Governments of $167 million over ten years.
Economic lens
Over the next ten years, current eye care services and programs will generate an estimated total of $278 million in economic benefits, but they will cost the Australian, state and territory governments $308 million to provide. This represents a return of $0.90 for every $1 of funding.
Investment in the Roadmap’s recommendations in addition to current eye care will cost an additional $227 million over ten years but will generate further economic benefits of $578 million.
This means that investment in the Roadmap’s recommendations will:
substantially increase the overall economic benefit from investment in eye care for Indigenous Australians
substantially increase the efficiency of provision of eye care services and programs (generate more benefit for less cost), generating a return of $2.50 for every additional $1 spent.
Overall, the elimination of unnecessary vision loss for Indigenous Australians will generate an estimated return of $1.60 for every $1 of funding for eye care.
Major drivers of benefit
The two major drivers of the total benefit are:
productivity benefit to the individual: which generates $529 million of benefit over ten years
productivity benefit to carers: which generates $255 million of benefit over ten years.
Fiscal lens
The elimination of unnecessary vision loss for Indigenous Australians through the delivery of current services and programs and the implementation of the Roadmap will represent a net impact to government expenditure of -$167 million.
Wellbeing and quality of life
The total number of YLDs averted by closing the gap for Indigenous eye health and eliminating unnecessary vision loss is between 1,700 and 7,300 depending on the calculation method used.38
36 PwC analysis, see Table 6
37 PwC analysis, see Section 3.2
Results of the analysis
University of Melbourne PwC 16
3.1 Total cost The total cost to close the gap for Indigenous eye health is made up of:
the funding currently allocated to health services and programs that address Indigenous eye health
the additional funding estimated in the Roadmap to be required to eliminate unnecessary vision loss.
Over ten years, this represents a total of $534 million of funding required from government. Table 8 presents the current and additional costs.
Table 8: Total cost over 10 years for the elimination of unnecessary vision loss for Indigenous Australians
Costs Current services &
programs ($m discounted, 2015)
Implementation of the Roadmap
($m discounted, 2015)
Total value ($m discounted, 2015)
Total cost -$308 -$227 -$534
Source: PwC
Currently there is a funding gap of approximately 37 percent to be able to fully implement the recommendations set out in the Roadmap and eliminate unnecessary vision loss for Indigenous Australians. Figure 8 illustrates this gap.
38 This is a method developed by the World Health Organization to measure the impact of disability and disease.
There are two approaches to measuring the impact of blindness and low vision on health and productivity which attribute either a greater or a lesser importance to this impact. Due to differences of expert opinion over which is most reliable (Taylor et al, 2013) we have estimated YLD using both approaches: 1) the 2010 Global Burden of Disease disability weightings (which attribute a lesser importance to the impact of blindness and low vision); 2) the 2004 Global Burden of Disease disability weightings (which attribute a greater importance to the impact of blindness and low vision).

Results of the analysis
University of Melbourne PwC 17
Figure 8: Total annual funding required to eliminate unnecessary vision loss for Indigenous Australians
Source: PwC analysis, Anjou, 2015; Hsueh et al., 2013; Macklin et al., 2013; University of Melbourne, 2015; Vision 2020 Australia, 2015. ^Note: these costs are extrapolations of 2011 and 2015 data provided by and developed in collaboration with the Indigenous Eye Health Unit at the University of Melbourne (see Appendix A Table 18 for details)
3.2 Total benefit The total value of the combined economic and health benefits that have been quantified in monetary terms is $856 million accrued over a ten year period, from 2015 to 2024.
This total benefit result, compared to the total cost estimated to close the gap for Indigenous eye health, shows a benefit cost ratio of 1.6; that is, for every $1 of investment in the Roadmap, there is an estimated return of $1.60.
Approximately one third of this benefit will be generated by current services and programs and two thirds of the benefit will be generated by the implementation of the Roadmap. The breakdown of this benefit is outlined in Table 9. The fiscal impact upon governments has also been estimated as has the wellbeing benefit in terms of YLDs averted. These results are detailed later in this chapter.
Table 9: Estimated benefit generated by current eye care services and programs and the implementation of the Roadmap
Benefit
Current services & programs
($m discounted, 2015)
Implementation of the Roadmap
($m discounted, 2015)
Total value ($m discounted, 2015)
Productivity to the individual $172 $357 $529
Productivity to carers $83 $172 $255
Avoided health costs $10 $21 $30
Avoided tax burden $13 $28 $41
Total $278 $578 $856
Source: PwC. Please note that totals may not sum due to rounding.
Productivity to the individual If unnecessary vision loss for Indigenous Australians was to be eliminated, the benefit from these persons entering the workforce or taking on a higher-skilled job is estimated at $529 million. This is a conservative estimate that takes into
$40$36
$24$28
0
10
20
30
40
50
60
70
2015-16 and 2016-17 2017-18 onwards
$m
illi
on
s
(und
isco
unte
d, $
2015
)
Current funding Additional funding
44%
63%56%
37%
Results of the analysis
University of Melbourne PwC 18
account that not all individuals who have received successful treatment will enter the workforce or take on higher-skilled jobs because:
the capability of individuals may be limited if their low vision or blindness has hindered participation in education, skills development or work experience
there may be limited employment opportunities available for the individual, depending on location and other factors.
Productivity to carers When an individual’s sight is restored, they will no longer require a carer to support them with their low vision or blindness. The estimated productivity benefit to carers of eliminating unnecessary vision loss is $255 million. This represents the time that carers would be able to spend in productive activity (such as employment), education or leisure.
Avoided health costs The total avoided health co-morbidities benefit estimated to be realised from the elimination of unnecessary vision loss is $30 million. This is primarily generated by the avoided cost of healthcare related to falls ($28 million), which is the principal co-morbidity associated with blindness and low vision.
Avoided tax burden The total avoided tax burden benefit is estimated to be $41 million, arising from tax revenue savings related to direct healthcare and welfare spending that is no longer required when unnecessary vision loss is reduced.
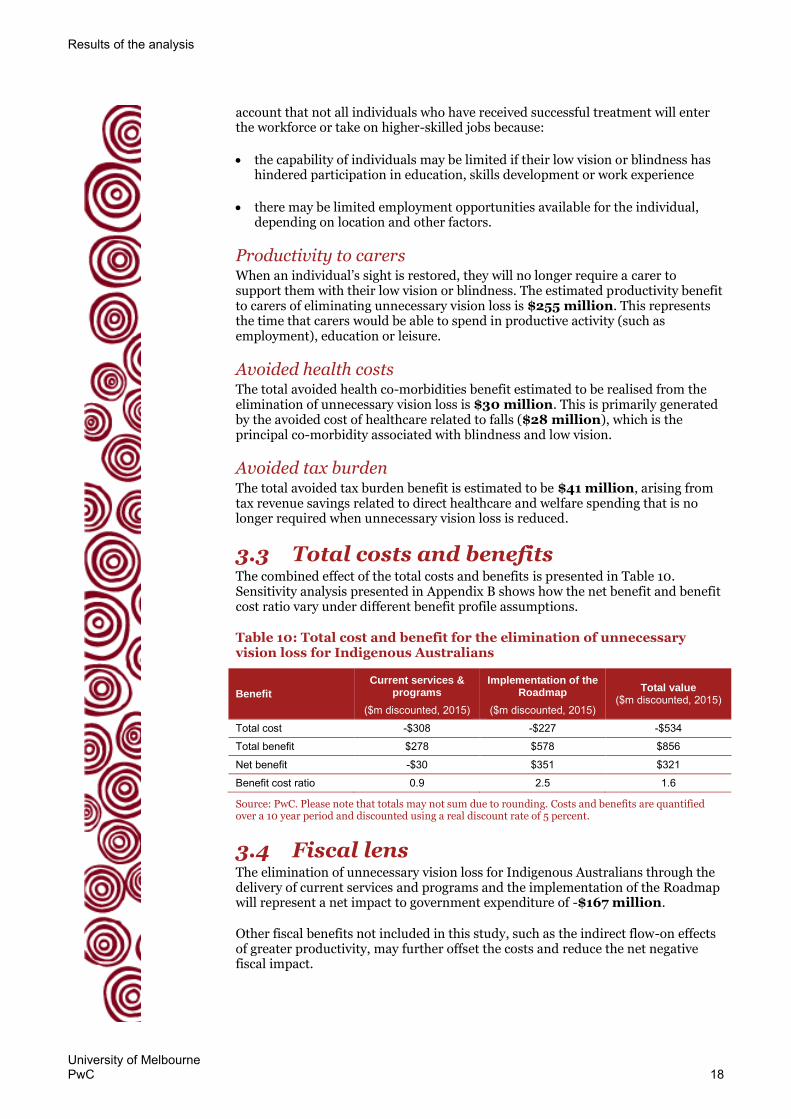
3.3 Total costs and benefits The combined effect of the total costs and benefits is presented in Table 10. Sensitivity analysis presented in Appendix B shows how the net benefit and benefit cost ratio vary under different benefit profile assumptions.
Table 10: Total cost and benefit for the elimination of unnecessary vision loss for Indigenous Australians
Benefit
Current services & programs
($m discounted, 2015)
Implementation of the Roadmap
($m discounted, 2015)
Total value ($m discounted, 2015)
Total cost -$308 -$227 -$534
Total benefit $278 $578 $856
Net benefit -$30 $351 $321
Benefit cost ratio 0.9 2.5 1.6
Source: PwC. Please note that totals may not sum due to rounding. Costs and benefits are quantified over a 10 year period and discounted using a real discount rate of 5 percent.
3.4 Fiscal lens The elimination of unnecessary vision loss for Indigenous Australians through the delivery of current services and programs and the implementation of the Roadmap will represent a net impact to government expenditure of -$167 million.
Other fiscal benefits not included in this study, such as the indirect flow-on effects of greater productivity, may further offset the costs and reduce the net negative fiscal impact.

Results of the analysis
University of Melbourne PwC 19
Table 11: Fiscal impact on government
Impact on government
Current services & programs
($m discounted, 2015)
Implementation of the Roadmap
($m discounted, 2015)
Total value ($m discounted,
2015)
Total fiscal cost -$308 -$227 -$534 Benefits Increased income tax $39 $81 $120
Increased indirect tax $14 $28 $42
Reduced welfare spending $58 $121 $179
Reduced health spending $9 $18 $27
Total fiscal benefit $119 $248 $367
Net fiscal impact -$188 $22 -$167
Source: PwC. Please note that totals may not sum due to rounding.
3.5 Wellbeing and quality of life The wellbeing and quality of life benefit is expressed in terms of ‘Years lost due to disability’ (YLDs) averted, where one YLD represents the loss of the equivalent of one year of full health and productive life due to disability.
The total number of YLDs averted by closing the gap for Indigenous eye health and eliminating unnecessary blindness over the next 10 years is estimated to be 7,300 years under the WHO Global Burden of Disease 2004 disability weightings, or 1,700 years under the WHO Global Burden of Disease 2010 disability weightings.39
The total number of DALYs averted by closing the gap would be higher than this were the number of years of life lost due to premature death (YLL) able to be taken into account. Due to the availability of information, the associated YLL has not been included.
3.6 Conclusion The implementation of the Roadmap presents an opportunity to close the gap for Indigenous eye health and realise positive change for Indigenous Australians which will support a stronger and more productive Australian economy. This can be achieved for a net fiscal cost to governments of $167 million over ten years.
39 Two methods of calculating YLDs are presented here due to the differences of opinions between experts in the field.
These differences are set out in Taylor et al, 2013. The 2004 disability weightings are 0.170 for distance vision: moderate impairment and 0.600 for distance vision blindness. The 2010 disability weightings are 0.033 for distance vision: moderate impairment and 0.195 for distance vision blindness. See World Health Organization, 2013, page 84.
Results of the analysis
University of Melbourne PwC 20
Figure 9: The value of Indigenous sight
Source: PwC. Note: ^ refers to all Australian, state and territory governments. * depending on the calculation method used
The elimination of unnecessary vision loss for Indigenous Australians has the potential to generate close to $900 million in economic benefits for Australia over a ten year period from 2015 t0 2024, and a net benefit of $321 million. This benefit is dependent on the implementation of the recommendations set out in the Roadmap, which are intended to address the current challenges and barriers to effective and efficient eye care service provision.
Investment in the Roadmap’s recommendations will:
substantially increase the overall economic benefit from investment in eye care for Indigenous Australians
substantially increase the efficiency of provision of eye care services and programs, generating a return of $2.50 for every additional $1 spent.
Economy
$321 million net benefit to the Australian economy
Community
Substantial social and wellbeing benefitsincluding 1,700 -7,300 YLDs averted*
$167 million net cost to
government^
Government


University of Melbourne PwC 22
Appendices
Appendix A Approach 23
Appendix B Sensitivity analysis 44
Appendix C Advisory group for the economic analysis of Indigenous eye health 46
Appendix D Bibliography 47
University of Melbourne PwC 23
Appendix A Approach
This appendix provides an overview of the approach taken in the cost benefit analysis as well as the estimation of fiscal impacts and the calculation of Disability Adjusted Life Years (DALYs). The following tables summarise the different benefits that were considered in the analysis together with a description of their impact and why they were included or excluded from the cost-benefit analysis (CBA).
Table 12: Benefits included in the cost-benefit analysis
Benefit Benefit
type Rationale
Evidence for quantification
Decision
Improved participation in employment
Productivity People who are blind or visually impaired have reduced employment possibilities. Across the Australian population as a whole, the employment rate for the avoidably blind is 34% compared to an employment rate of 62% for the general population.40 This means that eliminating avoidable blindness and low vision will enable some individuals to return to or enter the workforce.
The path to quantify improved participation in employment and the impact that this would generate in terms of increased earning potential is well defined and frequently used in studies on improving eye health.
Include
Improved participation in society
Productivity Those who care for an individual affected by avoidable blindness or low vision devote time that they could be spending on other activities than caring for that individual. This is time that they could be spending in education, employment or leisure. Successfully treating an individual who is blind or has low vision would release a certain amount of caring time for other purposes.
There is some understanding of the extent to which blind persons in Australia use carers,41 and it is common practice to ascribe a value to productive time for cost-benefit analyses. Therefore the path to quantification is relatively straight-forward.
Include
Reduced occurrence of common co-morbidities – falls, depression
Health cost An analysis of the burden of blindness and vision loss in the UK by Access Economics (2008) notes that the only two co-morbidities of statistical significance likely to be causally related to low vision are falls and depression.
A number of studies internationally have estimated the incidence of falls and the health system costs in relation to falls caused by low vision, supporting quantification for this report.42 Several studies have examined the link between depression and low vision, concluding that visually
Include
40 Vision Australia, 2012, page 7; Gordon et al., 2011; Australian Bureau of Statistics, 16 April 2015.
41 Australian Bureau of Statistics, 16 December 2010.
42 PwC’s 2013 Value of Sight report undertook a literature review of a number of such studies. Cruess et al., 2008;
Tseng et al., 2012; and Lotery et al., 2005 and Cruess et al., 2007 cited in PwC, 2013.

Approach
University of Melbourne PwC 24
Benefit Benefit
type Rationale
Evidence for quantification
Decision
impaired adults are more likely to experience depressive symptoms compared to the general population.43 The health costs related to depression can be estimated using Australian Government expenditure data.
Reduced tax burden due to reduced health expenditure
Economic The government must raise a certain amount of tax revenue to fund direct health costs. When these health costs are reduced as there is less demand for healthcare (as those who were blind or had low vision have been treated successfully and are no longer falling or affected by depression caused by their visual impairment), the tax revenue required is also, in theory, reduced.
Based on the quantification of the health costs of falls and depression which will be avoided by eliminating unnecessary vision loss, it is possible to calculate the reduction in tax revenue required.
Include
Source: PwC
Table 13: Benefits excluded from the cost-benefit analysis
Benefit Benefit type Rationale Evidence for quantification
Decision
Improved participation in education
Productivity Avoidable blindness and low vision may contribute to preventing children from receiving an education, in two ways – those who cannot participate in education because of their avoidable blindness or low vision condition and those who cannot participate in education because they are carer for another individual (family member or friend) who suffers from avoidable blindness or low vision.
The impact of improved participation in education is generally quantified in terms of the future productivity of an individual. This is because as a result of achieving a higher level of education an individual is expected to have greater earning potential in the future. The timeframe of our cost-benefit analysis (ten years to 2024) and the lack of data available about the specific age bracket of children and young people who experience low vision or blindness means that we cannot estimate whether this benefit will be realised by 2024.
Exclude
Improved independence, self-esteem and social networks
Social Loss of sight severely hinders an individual’s ability to attend to their day to day activities, leading to a dependence on carers and feelings of incompetency on behalf of the blind individual. Several studies have documented the
Whilst this benefit is highly important, the path to its quantification is undefined and not adequately framed in monetary values.
Exclude
43 Nyman et al., 2010; Horowitz, 2003.

Approach
University of Melbourne PwC 25
Benefit Benefit type Rationale Evidence for quantification
Decision
association between loss of sight and feelings of loneliness and isolation, which contribute to sentiments of low self-esteem. 44
Reduced incorrect use of medication
Health cost Individuals who are blind or visually impaired may misread or be unable to read the instructions provided on prescription or over-the-counter medication labels. This can result in taking the wrong medication or the improper dosage of medication.45
There is limited evidence of the incidence of incorrect use of medication as a result of blindness.
Exclude
Reduced use of home dialysis
Health cost Individuals who are blind or visually impaired as a result of diabetic retinopathy may also be affected by renal failure, which commonly results from diabetes. The blind or visually impaired are more likely to receive in-hospital treatment as they would be unable to operate home dialysis equipment. This results in additional health costs, which could be avoided by eliminating avoidable blindness and low vision.
There is limited evidence to link the incidence of diabetic retinopathy and renal failure in individuals affected by diabetes.
Exclude
Increased life expectancy and associated increased income
Health cost Studies have demonstrated a link between visual impairment and premature mortality. Associated with this premature mortality may be a loss of income if an individual is still of working age.
This is not included in the CBA because it includes both direct and indirect health and well-being impacts. Some of the direct health impacts are included via the reduced occurrence of common co-morbidities – falls, depression.
Exclude
Whole of community health and wellbeing
Health/social For Indigenous Australians, health has a greater meaning than the physical or mental health and wellbeing of the individual. For Indigenous Australians, ‘health’ relates to the social, emotional and cultural wellbeing of the whole of the community to which individuals belong. The Advisory group suggested in particular that, for Indigenous communities, vision loss
Whilst this benefit is highly important, the path to its quantification is undefined and not adequately framed in monetary values
Exclude
44 Long et al., 1996; Keeffe et al., 2009; Nyman et al., 2010.
45 American Foundation for the Blind, 2009.

Approach
University of Melbourne PwC 26
Benefit Benefit type Rationale Evidence for quantification
Decision
in a community elder could affect community cohesion and wellbeing.
Aids, equipment and home modifications
Health cost To make living with their vision impairment easier, people with low vision and blindness may purchase aids and other equipment and modify their home. Some of this expenditure would be avoided where vision is improved.
While able to be quantified, it is likely that these benefits are small relative to the other benefits considered.
Exclude
Source: PwC
Overview of costs and benefits The CBA framework monetises (quantifies in dollar terms) the benefits to be derived from the implementation of the Roadmap. Impacts are quantified over a 10 year period and are discounted using a real discount rate. The reason for discounting is to be able to equally compare costs and benefits which occur at different time periods.46 The value of the real discount rate is 5 percent as this is the preferred rate for discounting future values related to health sector investments.47
In summary, the below impacts were quantified in the CBA:
Costs
Costs to government – this includes the costs to the Commonwealth, State and territory governments to treat trachoma, diabetic retinopathy, cataract and refractive error amongst Aboriginal and Torres Strait Islanders.
Benefits
Productivity to individuals – this benefit is the result of individuals being able to see and therefore being able to work.
Productivity to carers – this benefit results from carers of low vision and blind people who, as a result of the person they care for being able to see better, can now use more of their time for other activities.
Health costs avoided – this benefit derives from the avoided comorbidities where low vision and blind people do not fall over or become depressed because they can see.
Tax burden avoided – this benefit refers to reduction in taxpayers funds spent on health and welfare needs of vision impaired people as they are now able to see and therefore can work (reducing the need for welfare) and/or avoid
46 According to the Productivity Commission, 2010 "The discount rate is a critical parameter in cost-benefit analysis
whenever costs and benefits differ in their distribution over time, especially when they occur over a long time period."
47 See: Department of Health and Ageing, 2008, page 127; Department of Health and Ageing and Health Council,
2003, page 2.

Approach
University of Melbourne PwC 27
comorbidities like falls and depression (avoiding the need for hospital or doctor visits for example).
These impacts are now described in greater detail, including their sources and method of computation. This includes how the fiscal impacts were estimated.
Firstly though, the prevalence of vision impairment amongst Indigenous Australians is described because these impacts depend upon the prevalence of low vision and blindness caused by four eye diseases that are responsible for most of the Indigenous population’s vision impairment (trachoma, cataract, diabetic retinopathy and refractive error).
Approach to cost benefit analysis
Prevalence of Indigenous Australian vision impairment The estimated prevalence of vision impairment amongst Indigenous Australians is based upon two key data sources – the 2009 National Indigenous Eye Health Survey (NIEHS) and population statistics from the Australian Bureau of Statistics (ABS).
The 2009 NIEHS surveyed vision loss amongst children (5 to 15 year olds) and adults (aged 40 and over) in a sample of Indigenous communities throughout Australia. The survey provides estimated rates of prevalence of low vision and blindness48 for these age groups and also rates of causes of low vision and blindness. These data are summarised as follows:
Table 14: Prevalence rates of vision loss in Indigenous Australians
Children Adults
Low Vision Blindness Low Vision Blindness
Major City 4.5% 0.6% 7.7% 2.6%
Inner Regional 2.6% 0.0% 7.8% 2.4%
Outer Regional 1.5% 0.0% 6.6% 0.6%
Remote 0.9% 0.0% 10.2% 0.8%
Very Remote Coastal 1.1% 0.3% 9.5% 1.1%
Very Remote Inland 0.3% 0.3% 12.7% 3.9%
Total 1.5% 0.2% 9.4% 1.9%
Source: National Indigenous Eye Health Survey (2009) cited in Taylor et al., 2011, page 2.
Table 15: Cause of low vision and blindness in Indigenous Australians
Children(a)
Adults(b)
Cause of vision: Low Vision Blindness Low Vision Blindness
Cataract 1% 9% 27% 32%
Diabetic Retinopathy 0% 0% 12% 9%
Trachoma 0% 0% 2% 9%
Refractive Error 48% 27% 54% 14%
Others 51% 64% 5% 36%
Total 100% 100% 100% 100%
48 Where low vision is defined as rating of vision of between 6/12 and 6/60 and blindness as a rating of less than
6/60. Source: Taylor et al., April 2013.

Approach
University of Melbourne PwC 28
Sources: (a) Arnold et al., 2009, pp 204-205. (b) National Indigenous Eye Health Survey (2009) cited in Taylor et al., 2011, page 2.
Table 14 shows that the low vision and blindness amongst Indigenous Australians are more common amongst adults and that the major causes are the four conditions highlighted in Table 15. Together with these prevalence rates, Australian Bureau of Statistics data on the regional distribution of the Indigenous population49 and on the forecast population growth to 2025, PwC estimated the total number of Indigenous Australians with low vision and blindness caused by the main four conditions between 2015 and 2025. This is shown in Table 16.
It is this group of people that are referred to in the remaining sections of this appendix as the Number of Indigenous Australians with vision impairment (where Indigenous Australians are also referred to as Aboriginal and Torres Strait Islanders or ATSI in diagrams)
Table 16: Number of Indigenous Australians expected to be affected by low vision and blindness as a result of trachoma, diabetic retinopathy, cataract or refractive error between 2015 and 2024
Age group Estimated population affected between 2015 and 2024
Low vision
Children (5-15) 2,600
Young adults (16-39) 9,700
Senior adults (40-64) 11,600
Retirement age adults (65+) 7,000
Sub-total 30,800
Blindness^
Children (5-15) 200
Young adults (16-39) 600
Senior adults (40-64) 1,800
Retirement age adults (65+) 800
Sub-total 3,400
Total 34,200
Source: PwC analysis.
Note: Totals may not add due to rounding. ^ Excludes blindness caused by diabetic retinopathy as it is assumed there is no recovery from this disease once blind.
As the NIEHS did not provide prevalence rates for the 16-39 age category, PwC has made a simplifying assumption prevalence rates for this age group. PwC assumes a liner extrapolation of the prevalence rates between the 5-15 year old and the 40-49 year old age groups. Evidence suggests that this is not an unreasonable assumption as when a whole town was tested, the prevalence rates showed a similar pattern to this assumption (see Figure 10).
49 Australian Bureau of Statistics, 30 August 2013. Table 1 Estimated resident Aboriginal and Torres Strait Islander
population, States and territories, Remoteness Areas–5-year age groups (to 75 and over)–30 June 2011; Australian Bureau of Statistics, 30 April 2014. Table 9 Estimated and projected Aboriginal and Torres Strait Islander population, Series B(a), Single year of age, Sex, Australia(b)

Approach
University of Melbourne PwC 29
Figure 10: Prevalence of vision impairment by eye – comparison of NIEHS data and a survey of the population of a small Indigenous Australian town
Source: Burnett, 2009, Figure 4.1.
An important consideration when analysing Indigenous Australian specific data are the limitations in the way it is collected. Some of these concerns are noted below in Box 1. Noting these limitations, we believe the best available data sources have been used in the estimation of the number of Indigenous Australians with low vision or blindness.

Approach
University of Melbourne PwC 30
Box 1: General limitations of Indigenous specific surveys
Inconsistencies in the Indigenous status question
The standard question, responses and recording categories for Aboriginal and Torres Strait Islander identification have been endorsed nationally but are not used in all data collections or across all jurisdictions. This limits the ability to compare the data produced.
Under-identification
For administrative data, the main limitation in Indigenous statistics is undercounting or under-identification. This happens when clients are not asked about their Indigenous status, the standard question is asked inconsistently, or recorded inaccurately. For example, a person's Indigenous status may be recorded as 'non-Indigenous' or 'not stated' (instead of 'No' 'Yes, Aboriginal' and/or 'Yes, Torres Strait Islander'). These incorrectly recorded responses are included in systems for monitoring and understanding the health and welfare of Aboriginal and Torres Strait Islander Australians so this 'incorrect' or 'missing' information raises problems for analysing the data and drawing conclusions. Because we don't know whether the characteristics of these 'missing' Aboriginal and Torres Strait Islander clients are different to those that have been reported as Aboriginal and/or Torres Strait Islander, we do not know whether the available data are biased.
The degree of undercounting or under-identification in data sets can vary across jurisdictions, sectors and service providers. This makes it difficult to measure the gap in health outcomes between Indigenous and non-Indigenous Australians, and to monitor progress in closing the gap.
Under-identification also creates difficulties in understanding Aboriginal and Torres Strait Islander people's preferences in health and welfare services, and which services and policies deliver the best outcomes. This limits researchers and policy-makers in understanding what works to overcome Indigenous disadvantage and improve health outcomes.
Source: PwC’s Indigenous Consulting
Costs to government The cost inputs to the analysis are based on two key data sources:
the ‘Cost of close the gap for vision of Indigenous Australians: On estimating the extra resources required’ (2013)50
the ‘Additional Annual Capped Costs to Close the Gap for Vision’ (2015).51
In 2013 it was estimated that a total of $45.5m, and of that an additional $28.1m above what was already funded (in 2011 dollars), would be required to close the gap for Indigenous eye health (see Table 17) – with respect to the eye conditions of cataract, refractive error and diabetic retinopathy.
50 Hsueh et al., 2013.
51 University of Melbourne, 2015.
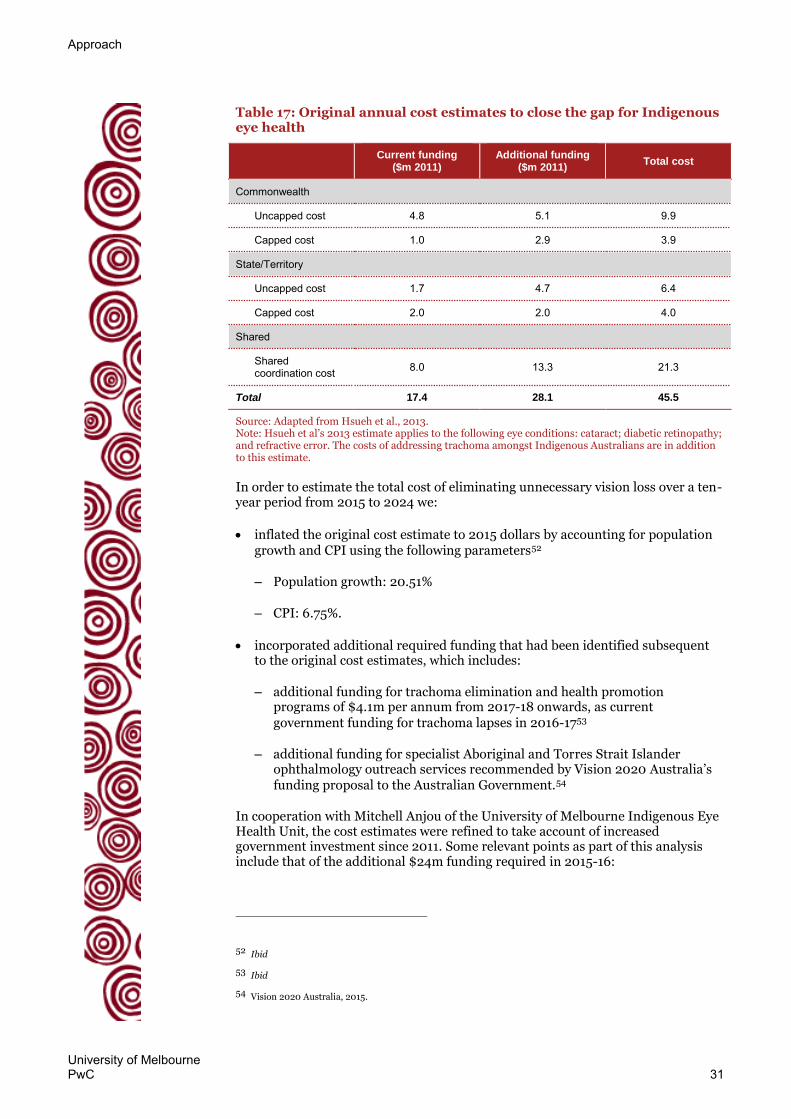
Approach
University of Melbourne PwC 31
Table 17: Original annual cost estimates to close the gap for Indigenous eye health
Current funding
($m 2011) Additional funding
($m 2011) Total cost
Commonwealth
Uncapped cost 4.8 5.1 9.9
Capped cost 1.0 2.9 3.9
State/Territory
Uncapped cost 1.7 4.7 6.4
Capped cost 2.0 2.0 4.0
Shared
Shared coordination cost 8.0 13.3 21.3
Total 17.4 28.1 45.5
Source: Adapted from Hsueh et al., 2013. Note: Hsueh et al’s 2013 estimate applies to the following eye conditions: cataract; diabetic retinopathy; and refractive error. The costs of addressing trachoma amongst Indigenous Australians are in addition to this estimate.
In order to estimate the total cost of eliminating unnecessary vision loss over a ten-year period from 2015 to 2024 we:
inflated the original cost estimate to 2015 dollars by accounting for population growth and CPI using the following parameters52
– Population growth: 20.51%
– CPI: 6.75%.
incorporated additional required funding that had been identified subsequent to the original cost estimates, which includes:
– additional funding for trachoma elimination and health promotion programs of $4.1m per annum from 2017-18 onwards, as current government funding for trachoma lapses in 2016-1753
– additional funding for specialist Aboriginal and Torres Strait Islander ophthalmology outreach services recommended by Vision 2020 Australia’s funding proposal to the Australian Government.54
In cooperation with Mitchell Anjou of the University of Melbourne Indigenous Eye Health Unit, the cost estimates were refined to take account of increased government investment since 2011. Some relevant points as part of this analysis include that of the additional $24m funding required in 2015-16:
52 Ibid
53 Ibid
54 Vision 2020 Australia, 2015.

Approach
University of Melbourne PwC 32
– 51% is capped funding ($12.1m) and 49% is uncapped funding ($11.8m)
– 70% is commonwealth ($16.7m) – split 57% ($9.5m) capped and 43% uncapped ($7.2m)
– 30% is state/territory ($7.2m) – split 36% ($2.6m) capped and 64% uncapped ($4.6m).
The result of this analysis is presented in Table 18.
Table 18: Estimated cost of closing the gap for Indigenous eye health, 2015-2024 (undiscounted, $2015)
2015-16 to 2016-17
$m p.a %
2017-18 onwards
$m p.a %
Total over 10 years
$m
Total over 10 years
$m, population
growth^
Current funding:*
Diabetic retinopathy, cataract, refractive error 12 19% 12 19% 118 129
Trachoma 4 7% 0 0% 8 8
Coordination and other costs+ 24 38% 24 38% 240 262
Subtotal current funding 40 63% 36 57% 366 400
Additional funding required:*
Diabetic retinopathy, cataract, refractive error 14 22% 14 22% 138 151
Trachoma 1 1% 5 8% 41 46
Coordination and other costs+
9 14% 9 14% 92 101
Subtotal additional funding required
24 37% 28 44% 272 298
Total funding required 64 100% 64 100% 638 697
* Includes Australian Government capped and uncapped costs and State and territory government capped and uncapped costs.
The capped State/Territory costs are assumed to be 49% funded as per 2011. The uncapped Commonwealth and State/Territory costs are assumed to be 40% funded as per 2011. The uncapped Commonwealth and State/Territory costs are distributed 61% Commonwealth/39% State/Territory as per 2011.
+ Coordination and other costs include Commonwealth and State/Territory coordination; State/Territory Low Cost Spectacles, Patient Assisted Transport; governance
^ Costs are grown in line with the average Indigenous Australian population growth rate over the 2015 to 2024 period (2.0%) per Australian Bureau of Statistics, 30 April 2014.
Source: PwC analysis; Anjou, 2015; Hsueh et al., 2013; Macklin et al., 2013; University of Melbourne, 2015; Vision 2020 Australia, 2015.
Benefits The approach to quantifying the benefits included in the CBA are described below.
Productivity to individuals Figure 11 illustrates the approach to calculating the benefits from productivity returns to individuals. Benefits are estimated for Indigenous people who experience vision impairment and are either employed or unemployed. The ‘productivity to individual’ benefit is a sum of these two subcomponents.

Approach
University of Melbourne PwC 33
Figure 11: Approach to calculating productivity to individual benefits
Source: PwC
1. Number of Indigenous Australians with vision impairment
As described above, this refers to the estimated number of Indigenous people with low vision or blindness caused by trachoma, diabetic retinopathy, cataract or refractive error.55
In this instance, the population is the working age population (those aged 16-64) with low vision or blindness. As the CBA is undertaken over a 10 year period, the benefits to those who are aged 55 or older are reduced as it is assumed that people retire at age 65 on average.56
2. Success rate of treatment
Success rates for treatments of trachoma (surgery and antibiotics), diabetic retinopathy, cataract or refractive error were considered in the calculations of benefits as, although close to 100%, not all recipients of treatment will have a full recovery from their condition. The following success rates were assumed:
Trachoma – 80 percent (80 percent success rate for surgeries and 100 percent success rate for antibiotic treatment but with an 80 percent coverage rate – PwC assumption based on other PwC analysis of the trachoma SAFE strategy)57
Cataract – 97.20 percent (Barry et al. 2012)
Diabetic retinopathy – 98 percent (Kempen, 2004)
Refractive error – 99.96 percent (Keeffe & Taylor, 2001).
3. Employment rate uplift for unemployed
PwC estimated that 26 percent of the visually impaired working-age Indigenous Australians are employed and 74 percent are not employed. This is based on:
the employment rate for the general Australian visually impaired population ranges between 32 and 36 percent58
55 Noting that this excludes blindness caused by diabetic retinopathy as it is assumed there is no recovery from this
disease once blind.
56 The benefits to individuals in the 40-64 age group are scaled back by applying a weighting of 84 percent to account
for the projected number of people aged between 55 and 64 relative to the total projected number of people aged between 40 and 64 as forecast by the ABS for the 2015-2024 period.
57 In 1997, the WHO organised the Alliance for the “Global Elimination of Trachoma by 2020” and recommended the
‘SAFE’ strategy as a basic framework for dealing with trachoma. The strategy consists of: surgery, antibiotic treatment, facial cleanliness and environmental change. The SAFE Strategy is currently being implemented in over 30 countries to eliminate the backlog of the disease
Number of ATSI with vision impairment
(16-64)
Employment uplift for
unemployed
Increase in income for
unemployed1
3 4
Success rate of treatment
2
Productivity to individual
Proportion already
employed
Increase in income for employed
5 6

Approach
University of Melbourne PwC 34
the employment rate for the general Australian working age population averaged 61.7 percent over the last 10 years59
amongst the general Indigenous working-age population the employment rate is 47.5 percent.60
In the 2013 report for the Fred Hollows Foundation PwC assumed that upon the restoration of sight, persons who were previously avoidably blind or visually impaired are less likely to secure a well-paid job based on a likely lower standard of education and/or less work experience. However, there may be instances where some persons treated from avoidable blindness and visual impairment are able to earn an average income.61
The same approach is applied here. We assume that if the eye conditions of the visually-impaired Indigenous population were treated, some of those who are unemployed could enter the workforce and find work. Our estimate of the employment rate uplift for unemployed is that the gap between the employment rate of the general Indigenous population (47.5 percent) and that assumed for the visually impaired Indigenous population (26 percent) could be by closed by half. As a result 11 percent of the visually impaired Indigenous population who are not employed currently will become employed.
This assumption is conservative when compared to that applied in the Value of Sight, where it is assumed the gap between the employment rate of the visually impaired and the general population is completely closed.62 However, in the context of the Council of Australian Governments’ 2008 target to halve the gap between Indigenous and non-Indigenous employment rates by 2018, this assumption is not unreasonable.63 The latest annual report on Closing the Gap noted that this gap has not been closing and it has actually widened since 2008.64 In this context, a conservative assumption of halving the gap between the employment rate of visually impaired Indigenous Australians and the Indigenous average is not unreasonable. If the actual employment rates achieved are higher than this, then the economic returns will be greater.
4. Increase in income for unemployed
We assume that those who are currently unemployed due to blindness are accessing the Disability Support Pension ($782 for a single person per fortnight)65 and those who are unemployed due to low vision are accessing the Newstart Allowance ($519 per fortnight for a single person with no child).66 The increase in
58 Vision Australia, 2012, page 7; Gordon, K. et al., 2011.
59 Australian Bureau of Statistics, 16 April 2015.
60 Australian Bureau of Statistics, 6 June 2014.
61 PwC, 2013, page 35.
62 PwC, 2013, page 35.
63 Council of Australian Governments, 2008, page 11.
64 Australian Government, 2015, page 18.
65 Department of Human Services, 12 June 2015.
66 Department of Human Services, 30 June 2015.

Approach
University of Melbourne PwC 35
income is the difference between these welfare payments and the average Indigenous wage ($787 per week)67 according to the ABS 2011 Census.
5. Proportion already employed
For those who are employed already, the improvement in their vision will enable them to work more effectively. As a result we estimate that the 26 percent of visually impaired Indigenous people who are already employed (see ‘3. Employment rate uplift for unemployed’ above) will be able to earn a higher wage.
6. Increase in income for employed
We assumed that those who are currently employed earn between 63 percent and 100 percent (applying a midpoint 82 percent) of the average annual income for employed Indigenous people. This is based on Rein et al 2006 who reported that the average annual earnings of the blind are 63 percent of a person with normal vision.68 Once treated, we assume their earnings will match the average annual income for employed Indigenous people.
Productivity to carers Figure 12 shows the approach applied in estimating the productivity benefits to carers of Indigenous visually impaired who, through the improved condition of their patients, are able to use their time in other ways. This accounts for the opportunity cost of carer’s time as although their time may be volunteered and not come at a financial cost to those who are visually impaired, carers could be working or spending their time in leisure instead.
Figure 12: Approach to calculating productivity to carer benefits
Source: PwC
1. Number of Indigenous Australians with vision impairment
As described above, this refers to the estimated number of Indigenous people with low vision or blindness caused by trachoma, diabetic retinopathy, cataract or refractive error.69
The advisory group of May 7 discussed that all age groups and both low vision and blind Indigenous people would receive some form of care, although to different degrees.
2. Success rate of treatment
This has also described above under the ‘productivity to individual’ section.
67 This based on 2011 census data, adjusted for inflation to 2015 dollars. Sources: Australian Bureau of Statistics,
November 2012, Table 13.1 Weekly Personal Income, Aboriginal and Torres Strait Islander people; Australian Bureau of Statistics, 22 April 2015.
68 Rein et al., 2006.
69 Noting that this excludes blindness caused by diabetic retinopathy as it is assumed there is no recovery from this
disease once blind.
Number of ATSI with vision impairment
Amount of carer’s time
1 3
Success rate of treatment
2
Productivity to carer
Value of carer’s time
4

Approach
University of Melbourne PwC 36
3. Amount of carer’s time
It is assumed that blind Indigenous people receive 7.5 percent of a full time equivalent carer’s time. In reference to a 37.5 hour working week, this equates to a carer providing 2.8 hours per week.
It is assumed the low vision Indigenous people receive 3.8 percent of a full time equivalent carer’s time. This would equate to 1.4 hours per week.
This range in the time budget carers provide is based on the rates applied in PwC’s 2013 Value of Sight report for the Fred Hollows Foundation. The assumptions applied here were:
The time lost in taking care of the dependent blind is between 5 and 10 percent of the productive time of one economically productive member of the family of each blind person70
The average visually impaired person received the care of 0.75 of a carer – the midpoint between 0.5 and 1.0 carers cited in the Value of Sight report71
4. Value of carer’s time
Various approaches can be taken to value the time of carers and volunteers. The approach taken here is to use the minimum wage as the basis of the value of carers’ time.72
Health costs avoided The PwC 2013 Value of Sight report for the Fred Hollows Foundation noted that the two main health comorbidities that are caused by visual impairment are falls and depression.73 By improving the sight of Indigenous people, it is expected there will be fewer instances of falls and other deleterious health impacts.
While the Value of Sight report quantified fall costs only due to the available information, the advisory group of May 7 emphasised the importance of other comorbidities such as depression. For the purposes of this analysis, the impacts of depression have therefore also been considered.
The approach to estimating these benefits are illustrated in Figure 13.
70 PwC, 2013, page 36.
71 ibid.
72 This approach is noted in: Department of Communities, 2008.
73 PwC, 2013, page 38.

Approach
University of Melbourne PwC 37
Figure 13: Approach to calculating health costs avoided benefit
Source: PwC
1. Success rate of treatment
This is described above under the productivity to individual section.
2. Number of Indigenous Australians with vision impairment (40+)
As described above, this refers to the estimated number of Indigenous people with low vision or blindness caused by trachoma, diabetic retinopathy, cataract or refractive error.74 In the instances of the fall costs, the over 40 Indigenous low vision and blind population are assumed to be the main cohort that benefit from fewer falls.
3. Average cost per fall
Various reports present the cost per fall and, averaged across all visually impaired and blind persons, this equates to US$133 in 2009.75 Converted to 2015 Australian dollars, this is $194.76
However, evidence shows the cost to service remote areas is higher; health expenditure for Indigenous people in remote/very remote areas is 1.7 times greater than for Indigenous people in major cities.77 After adjusting for the Indigenous population that live in remote areas, this adds 30 percent to the average cost per fall.
The resulting average cost of falls per visually impaired person per annum is $252.
4. Number of Indigenous Australians with vision impairment (blind only, 5+)
As described above, this refers to the estimated number of Indigenous people with low vision or blindness caused by trachoma, diabetic retinopathy, cataract or refractive error.78 In regards to depression, we consider only the blind population but for all age groups.
74 Noting that this excludes blindness caused by diabetic retinopathy as it is assumed there is no recovery from this
disease once blind.
75 Cruess et al., 2008.
76 Applying inflation and exchange rate data from the following sources: Australian Bureau of Statistics 22 April
2015; Reserve Bank of Australia, 2015.
77 Australian Institute of Health and Welfare, 2015.
78 Noting that this excludes blindness caused by diabetic retinopathy as it is assumed there is no recovery from this
disease once blind.
Number of ATSI with vision impairment
(40+)
Average cost per fall
2 3
Success rate of treatment
1
Health costs avoided
Annual expenditure on mental health
5
Proportion with depression that
will benefit
6Number of ATSI
with vision impairment
(blind only, 5+)
4
Approach
University of Melbourne PwC 38
5. Annual expenditure on mental health
The White Cloud Foundation reports the prevalence of depression has ranged between 6.8 and 10.3 percent of the population over the last 10 years.79 Using the midpoint of this range, this equates to an estimated 1.98 million people with depression in 2012-1380 when the total expenditure on community mental health related services was $1.8 billion, or $911 per person. Adjusting for inflation of the health industry up to 201581, this equates to an estimated cost of community mental health related services per depressed Australian of $969.
PwC also considered UK evidence of the cost of depression for visually impaired people. It was estimated in a 2003 report that depression costs £391.97 per person.82 Adjusting for exchange rates and inflation, this is an estimated $1,300 per person in Australia.83
For the purposes of this analysis, the Australian estimate is applied, noting that this may also be a conservative estimate.
6. Proportion with depression that will benefit
Based on the above data from the White Cloud Foundation, 8.55 percent (midpoint of 6.8 and 10.3 percent) of the general Australian population is estimated to have depression. As cited in the PwC 2013 Value of Sight report Horowitz (2003)
examined the link between depression and visual impairment, and found that visually impaired adults were 2 to 5 times more likely to experiencing depression symptoms compared to their non-impaired peers. Taking the midpoint of this range equates to an estimated 30 percent of visually impaired Australians with depression.
Given the conditions that might also be compounding the impact of depression upon visually impaired Indigenous people (e.g. diabetes, older age, low income from not being able to work due to eye condition etc.), PwC assumes that treating the eye conditions of those with depression will result in half of the cohort benefitting from reduced mental health issues.
Tax burden avoided An economic concept that is considered in similar studies in this field is the tax burden (also referred to as ‘dead weight loss’) that is generally associated with raising tax. This represents the concept that there is a negative cost upon society for every dollar of tax that is raised.
In the context of this CBA, we have estimated the benefits arising from avoiding the need to spend (and therefore raise) tax payer funds for health and welfare as by treating Indigenous eye conditions there will be fewer instances of falls and depression and less need for welfare as more people will be able to work.
The approach to calculating the benefit is illustrated in Figure 14.
79 White Cloud Foundation, 2014.
80 Based on the Estimated Resident Population (ERP) for Australia of 23,117,400 in June 2013. Source: Australian
Bureau of Statistics, 25 June 2015.
81 Australian Bureau of Statistics, 22 April 2015.
82 Meads, C, and C Hyde. 2003.
83 Applying inflation and exchange rate data from the following sources: Australian Bureau of Statistics, 22 April
2015; Reserve Bank of Australia, 2015.
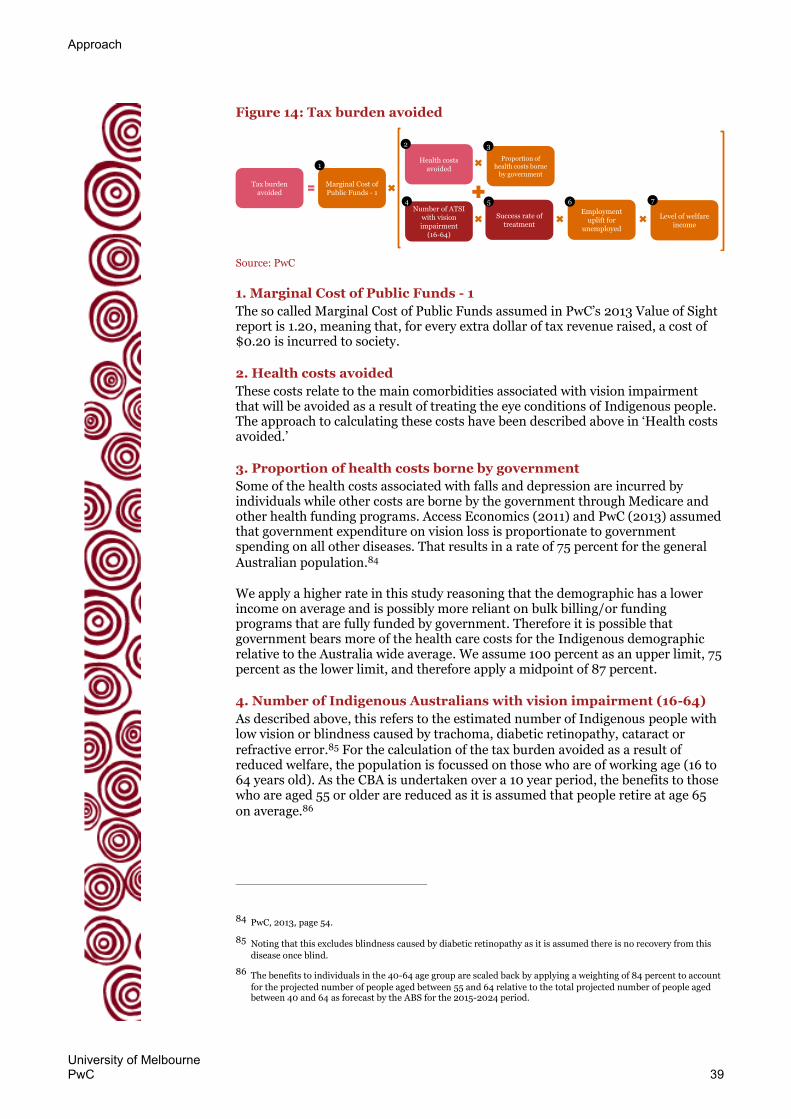
Approach
University of Melbourne PwC 39
Figure 14: Tax burden avoided
Source: PwC
1. Marginal Cost of Public Funds - 1
The so called Marginal Cost of Public Funds assumed in PwC’s 2013 Value of Sight report is 1.20, meaning that, for every extra dollar of tax revenue raised, a cost of $0.20 is incurred to society.
2. Health costs avoided
These costs relate to the main comorbidities associated with vision impairment that will be avoided as a result of treating the eye conditions of Indigenous people. The approach to calculating these costs have been described above in ‘Health costs avoided.’
3. Proportion of health costs borne by government
Some of the health costs associated with falls and depression are incurred by individuals while other costs are borne by the government through Medicare and other health funding programs. Access Economics (2011) and PwC (2013) assumed that government expenditure on vision loss is proportionate to government spending on all other diseases. That results in a rate of 75 percent for the general Australian population.84
We apply a higher rate in this study reasoning that the demographic has a lower income on average and is possibly more reliant on bulk billing/or funding programs that are fully funded by government. Therefore it is possible that government bears more of the health care costs for the Indigenous demographic relative to the Australia wide average. We assume 100 percent as an upper limit, 75 percent as the lower limit, and therefore apply a midpoint of 87 percent.
4. Number of Indigenous Australians with vision impairment (16-64)
As described above, this refers to the estimated number of Indigenous people with low vision or blindness caused by trachoma, diabetic retinopathy, cataract or refractive error.85 For the calculation of the tax burden avoided as a result of reduced welfare, the population is focussed on those who are of working age (16 to 64 years old). As the CBA is undertaken over a 10 year period, the benefits to those who are aged 55 or older are reduced as it is assumed that people retire at age 65 on average.86
84 PwC, 2013, page 54.
85 Noting that this excludes blindness caused by diabetic retinopathy as it is assumed there is no recovery from this
disease once blind.
86 The benefits to individuals in the 40-64 age group are scaled back by applying a weighting of 84 percent to account
for the projected number of people aged between 55 and 64 relative to the total projected number of people aged between 40 and 64 as forecast by the ABS for the 2015-2024 period.
Proportion of health costs borne
by government
3
Success rate of treatment
Tax burden avoided
Level of welfare income
7Number of ATSI
with vision impairment
(16-64)
4
Health costs avoided
2
Marginal Cost of Public Funds - 1
1
5
Employment uplift for
unemployed
6
Approach
University of Melbourne PwC 40
5. Success rate of treatment
This is described above under the ‘productivity to individual’ section.
6. Employment uplift for unemployed
As noted above, we assume that the gap between the employment rate of the general Indigenous population (47.5 percent) and that assumed for the visually impaired Indigenous population (26 percent) can be by closed by half.
7. Level of welfare income
We assume that those who are currently unemployed due to blindness are accessing the Disability Support Pension ($782 for a single person per fortnight)87 and those who are unemployed due to low vision are accessing the Newstart Allowance ($519 per fortnight for a single person with no child).88
Profile of benefits assumed
In addition to the above assumptions, we have considered how the backlog of cases of vision impairment might be reduced and the impact of the current funding and additional funding upon the achievement of the benefits.
We assume that the backlog of Indigenous people with untreated vision impairment in 2015 will be reduced over a five year period. This assumption is relevant to the goal of eliminating trachoma by 2020 for example.89 It is noted that this is a more aggressive rate than that assumed in the global Value of Sight study PwC undertook in 2013 where the backlog was assumed to be reduced at an even rate over the 10 year period of analysis.90 In addition to the backlog, we assume new instances of vision impairment over the analysis period – which result from applying the current prevalence rates to the growing Indigenous population – are treated as they occur.
In regards to the share of benefits between the current funding profile and the additional funding required we have assumed, on the advice of Professor Taylor and the University of Melbourne Indigenous Eye Health Unit, that:
Under the current funding profile, one-third of those with vision impairment caused by diabetic retinopathy, cataract and refractive error will benefit and that those with vision impairment caused by trachoma will benefit during the 2015 and 2016 years as funding is committed to for these periods
Under the additional funding profile, the other two-thirds of those vision impairment caused by diabetic retinopathy, cataract and refractive error will benefit.
This benefit profile suggests that although current funding covers approximately 60 percent of the total cost of addressing the problem (see Table 18 above), it is achieving less than a proportional share of the benefits. This reflects the relative
87 Department of Human Services, 12 June 2015.
88 Department of Human Services, 30 June 2015.
89 Taylor et al., April 2013, page 6.
90 PwC, 2013, page 7.

Approach
University of Melbourne PwC 41
inefficiencies of the current funding as has been presented in the Roadmap to Close the Gap on Indigenous Eye Health. The Roadmap noted that, for example:91
Efficient eye care requires co-ordination along the pathway of care.
Currently the referral pathway currently is a ‘leaky pipe’ with a blockage at its end; it is often very inefficient and wasteful of services; many people drop out and because of this, others do not enter.
Co-ordination and links between Aboriginal Health Services, clinics and hospitals could be better.
Referral for those found to have diabetic eye disease is not prompt enough.
The provision of adequate co-ordination will yield tremendous increases in efficiency and dramatically improve patient outcomes.
The project team estimates that with only a doubling of funding, cataract surgery will increase seven times, diabetic examinations five times and glasses use 2.5 times.92
The combination of the time lapse over which the backlog is reduced and the share of benefits assumed for the current and additional levels of eye services is illustrated in Figure 15.
Figure 15: Profile of benefits assumed
Source: PwC
Fiscal impacts In addition to estimating the costs and benefits to Australia from treating vision impairment amongst Indigenous people, this report has considered the impact upon government. This following fiscal impacts are considered:
91 Taylor et al., 2011.
92 Taylor et al., 2012, page 129.
2015 2020 2025
Hypothetical base case –no eye care services
Number of Indigenous Australians
with unnecessary vision loss Current eye care services
and programs
Implementation of the Roadmap
0
The number of Indigenous Australians with unnecessary
vision loss increases over time if no care is provided
The number of Indigenous Australians with unnecessary
vision loss reduces by 1/3rd
but current services and programs cannot meet the
100% of the need
The remaining 2/3rd of Indigenous Australians who
have not received appropriate eye care from
current funding are treated by implementing the
Roadmap which Closes the Gap in Indigenous eye health
2/3
1/3

Approach
University of Melbourne PwC 42
Costs to government These are the same as the costs presented in the CBA.
Increased income tax These are as a result of the increased income levels of unemployed and employed people who were blind or who had low vision and who are now able to work or are more productive at work. These people are assumed to earn the average ATSI income level rather than the Disability Support Pension (in the case of unemployed blind), the Newstart Allowance (in the case of unemployed people with low vision) or a reduced wage (in the case of employed people with blindness or low vision).
As set out in the CBA we also assume that carers of vision impaired ATSI people who are treated will now be able to use their time in other ways. As an estimated 55 percent of Queenslanders aged over 18 who volunteered in 2004 were working93, we assume that this proportion of carers for the vision impaired will be able to allocate their time budget (7.5 percent in the case of carers for blind and 3.8 percent for carers of low vision) to work instead. We assume their income is equivalent to the average Indigenous Australian income.
The Australian Tax Office rates for income tax in the 2015-16 financial year are applied to estimate the change in income tax for the Commonwealth Government.
Increased ‘indirect tax’ This refers to the Goods and Services Tax and other transactional taxes that are applied to individuals’ after tax income. The approach applied is similar to that applied in Access Economics’ 2004 Clear Insights report where an indirect tax rate of 15.51 percent is applied to 65 percent of after tax earnings.94
The increase in indirect tax is calculated by applying it to those formerly unemployed and employed visually impaired Indigenous people and their carers who now earn a higher income.
Reduced health costs As described above in the CBA, we assume that the government saves health costs as a result of avoided falls and instances of depression. The element included in the estimation of the fiscal impact is the government’s share of the costs it would bear.
Reduced welfare costs The CBA assumes that individuals who are blind, of working age and unemployed receive the Disability Support Pension while those who have low vision, are of working age and unemployed receive the Newstart Allowance. For the segment of these people who are treated and are able to work, the government will save on welfare costs. These are included in the estimation of the fiscal impacts.
93 Department of Communities, 2008.
94 Access Economics, 2004, page 67.

Approach
University of Melbourne PwC 43
Disability Adjusted Life Years The DALY is equal to the sum of the YLD and YLL.95 The approach applied in this report to estimating DALYs is to estimate the YLD component but not the YLL component due to the availability of information.
This estimate uses the prevalence YLD method as described in World Health Organization, 2015b, which is to multiply the number of prevalent cases by the disability weighting.
The estimated number of prevalent cases over the 10 year period is described above and summarised in Table 16 as 30,800 Indigenous Australians with low vision and 3,400 blind Indigenous Australians.
Due to differences of opinion from experts in the field over the disability weightings (Taylor et al, 2013), we have estimated the YLD using both the 2010 Global Burden of Disease disability weightings and the 2004 Global Burden of Disease disability weightings.
The 2004 disability weightings are 0.170 for distance vision: moderate impairment and 0.600 for distance vision blindness. The 2010 disability weightings are 0.033 for distance vision: moderate impairment and 0.195 for distance vision blindness.96
This results in an estimated 7,300 YLDs under the 2004 disability weightings or 1,700 YLDs under the 2010 disability weightings.
The total number of DALYs averted by closing the gap would be higher than this were the number of years of life lost due to premature death (YLL) able to be taken into account. This is evident from other studies where it is shown the DALYs for eye disease includes both YLD and YLL components. However it is evident from such studies that the YLD part comprises a larger share of DALYs for eye diseases.97
95 World Health Organization, 2015b.
96 World Health Organization, 2013, page 84.
97 Deloitte Access Economics, 2015, page 36-37.

University of Melbourne PwC 44
Appendix B Sensitivity analysis
The following section undertakes sensitivity analysis based on the proportion of Indigenous eye care needs that are met by current services and programs versus the proportion that will be met through the implementation of the recommendations in the Roadmap, which translates to the proportion of benefit generated.
Approach adopted for this report
As described in Appendix A, the share of benefits between the two scenarios is assumed to be one third for current funding and two thirds for additional funding (noting the difference for trachoma). This means that current eye care services and programs are assumed to address one third of the total need, while the additional funds required to implement that Roadmap are assumed to address the remaining two thirds of the total need – refer to Figure 15 for a graphical illustration of this.
This is based on the advice of Professor Taylor and the University of Melbourne Indigenous Eye Health Unit that there are inefficiencies in the current eye care services system, which mean the current funding will address just one third of the total benefit despite representing around 60 percent of total cost.
The results of the CBA with this assumption are summarised below. The impact of this assumption is that the $308 million cost of current services and programs is not completely offset by the $278 million in benefits generated. Therefore there is a net cost from the current service level of $30 million and a BCR of 0.9.
Table 19: Total cost and benefit over 10 years for the elimination of unnecessary vision loss for Indigenous Australians, 1/3:2/3 benefit share
Current services &
programs ($m discounted, 2015)
Implementation of the Roadmap
($m discounted, 2015)
Total value ($m discounted, 2015)
Total costs -$308 -$227 -$534
Total benefits $278 $578 $856
Net benefit -$30 $351 $321
Benefit cost ratio 0.9 2.5 1.6 Source: PwC
Alternative approaches
We have also tested two, more conservative, benefit profiles:
A 50:50 benefit profile, as a midpoint of sharing the benefits between current and additional funding (Table 20)
A 60:40 benefit profile, which mirrors the split of total cost between current funding and additional funding required (Table 21).
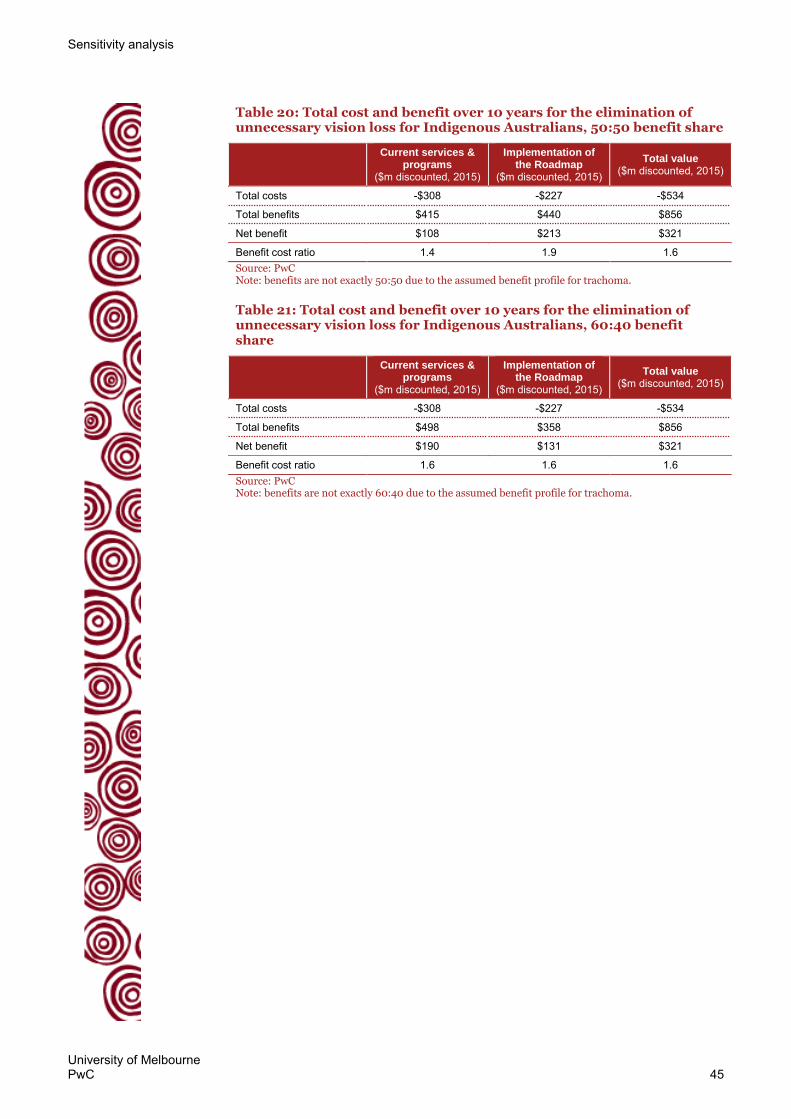
Sensitivity analysis
University of Melbourne PwC 45
Table 20: Total cost and benefit over 10 years for the elimination of unnecessary vision loss for Indigenous Australians, 50:50 benefit share
Current services &
programs ($m discounted, 2015)
Implementation of the Roadmap
($m discounted, 2015)
Total value ($m discounted, 2015)
Total costs -$308 -$227 -$534
Total benefits $415 $440 $856
Net benefit $108 $213 $321
Benefit cost ratio 1.4 1.9 1.6 Source: PwC Note: benefits are not exactly 50:50 due to the assumed benefit profile for trachoma.
Table 21: Total cost and benefit over 10 years for the elimination of unnecessary vision loss for Indigenous Australians, 60:40 benefit share
Current services &
programs ($m discounted, 2015)
Implementation of the Roadmap
($m discounted, 2015)
Total value ($m discounted, 2015)
Total costs -$308 -$227 -$534
Total benefits $498 $358 $856
Net benefit $190 $131 $321
Benefit cost ratio 1.6 1.6 1.6 Source: PwC Note: benefits are not exactly 60:40 due to the assumed benefit profile for trachoma.

University of Melbourne PwC 46
Appendix C Advisory group for the economic analysis of Indigenous eye health
The participants in the 7 May Advisory group workshop included:
Susan Forrester, Victorian Aboriginal Community Controlled Health Organisation (VACCHO)
Anne Peek, South Eastern Melbourne Medicare Local
Guy Gillor, Aboriginal Medical Service Western Sydney (AMSWS)
Roman Zwolak, Grampians Region Indigenous Eye Health Project Officer
David Dunt, University of Melbourne
Catherine Waterhouse, Australian Department of Health
Skye Cappuccio, Optometry Australia
Suzanne Lyon, Royal Australian and New Zealand College of Ophthalmologists (RANZCO)
Arthur Hsueh, University of Melbourne
Professor Hugh Taylor, University of Melbourne Indigenous Eye Health Unit
Mitchell Anjou, University of Melbourne Indigenous Eye Health Unit
Peggy Chiang, University of Melbourne Indigenous Eye Health Unit
Emma Stanford, University of Melbourne Indigenous Eye Health Unit.

University of Melbourne PwC 47
Appendix D Bibliography
Access Economics, Clear Insight: The economic impact and cost of vision loss in Australia, 2004.
American Foundation for the Blind, ‘AFB survey finds drug labeling puts people with vision loss at serious medical risk’ 13 January 2009, Available at: http://www.afb.org/info/about-us/press-room/press-release-archive/afb-survey-finds-drug-labeling-puts-people-with-vision-loss-at-serious-medical-risk/1245 Accessed 6 July 2015.
Arnold, A.-L., Dunn, R.A., Taylor, H.R., Keeffe, J., Fox, S., Goujon, N., Xie, J., Still, R., Burnett, A., Marolia, M., Shemesh, T., Carrigan, J. and Stanford, E., National Indigenous Eye Health Survey: Minum Barreng (Tracking Eyes) - Full report, Centre for Eye Research Australia, 12 October 2009.
Australian Bureau of Statistics, ‘2011 Census QuickStats: All people – usual residents, Australia’, 28 March 2013, Available at: http://www.censusdata.abs.gov.au/census_services/getproduct/census/2011/quickstat/0?opendocument&navpos=220 Accessed 6 July 2015.
_________, 4430.0 Survey of Disability, Ageing and Carers, 2009, Released 16 December 2010.
_________, 2076.0 Census of Population and Housing: Characteristics of Aboriginal and Torres Strait Islander Australians, 2011, Released November 2012.
_________, 3238.55 Estimates of Aboriginal and Torres Strait Islander Australians, Jun 2011, Released 30 August 2013.
_________, 3238.0 Estimates and Projections, Aboriginal and Torres Strait Islander Australians, 2001 to 2026, Released 30 April 2014.
_________, 4727.0.55.006 - Australian Aboriginal and Torres Strait Islander Health Survey: Updated Results, 2012–13, Released 6 June 2014.
_________, 6202.0 - Labour Force, Australia, Mar 2015, Released 16 April 2015.
_________, 6401.0 - Consumer Price Index, Australia, Mar 2015, Released 22 April 2015.
_________, 3101.0 - Australian Demographic Statistics, Dec 2014, Released 25 June 2015.
Australian Government, Closing the Gap: Prime Minister’s report 2015, 2015.
Australian Institute of Health and Welfare, ‘Australia’s health system’, 2015, Available at: http://www.aihw.gov.au/australias-health/2014/health-system/ Accessed 6 July 2015.
Barry, P., Henry, Y., Lundstrom, M., Rosen, P. & Stenevi, U. ‘Evidence-based guidelines for cataract surgery: Guidelines based on data in the European Registry
Bibliography
University of Melbourne PwC 48
of Quality Outcomes for Cataract and Refractive Surgery database’. Journal of Cataract and Refractive Surgery, 38(6), June 2012, pp. 1086-93.
Burnett, A., Vision impairment in Aboriginal and Torres Strait Islander peoples: A toolkit to assess prevalence and impact, PhD Thesis, University of New South Wales, December 2009.
Better Health Channel, ‘Diabetic retinopathy’, State Government of Victoria, 22 June 2015, Available at: http://www.betterhealth.vic.gov.au/bhcv2/bhcarticles.nsf/pages/Diabetic_retinopathy?open Accessed 6 July 2015
Council of Australian Governments, ‘National Indigenous reform agreement (Closing the Gap)’, 2008, Available at: http://www.federalfinancialrelations.gov.au/content/npa/health_indigenous/indigenous-reform/national-agreement_sept_12.pdf Accessed 10 July 2015.
Cruess, A.F., Zlateva, G., Xu, X., ‘Economic burden of bilateral neovascular age-related macular degeneration: multi-country observational study’, PharmacoEconomics, 26(1), 2008.
Deloitte Access Economics, The economic impact of diabetic macular oedema, 2015.
Department of Communities, The economic value of volunteering in Queensland report, May 2008.
Department of Health and Ageing, Guidelines for preparing submissions to the Pharmaceutical Benefits Advisory Committee (Version 4.3), Australian Government, December 2008.
Department of Health and Ageing and enHealth Council, Guidelines for Economic Evaluation of Environmental Health Planning and Assessment. Volume 1 — The Guidelines, Commonwealth of Australia, January 2003.
Department of Human Services, ‘Disability support pension’, 12 June 2015, Available at: http://www.humanservices.gov.au/customer/services/centrelink/disability-support-pension Accessed 6 July 2015.
_________, ‘Newstart Allowance’, 30 June 2015, Available at: http://www.humanservices.gov.au/customer/services/centrelink/newstart-allowance Accessed 6 July 2015.
Gordon, K., Crues, A. and Bellan, L., ‘The cost of vision loss in Canada’, Canadian Journal of Ophthalmology, 46(4), 2011.
Horowitz, A., ‘Depression and vision and hearing impairments in later life’, Generations, 27(1), 2003, pp. 32-38.
Hsueh, Y., Brando, A., Dunt, D., Anjou, M.D., Boudville, A, and Taylor, H., 'Cost of close the gap for vision of Indigenous Australians: On estimating the extra resources required', The Australian Journal of Rural Health, 21, 2013, pp. 329–335.
Long, R.G., Boyette, L.W. and Griffin-Shirley N., ‘Older persons and community travel: the effect of visual impairment’, Journal of Visual Impairment and Blindness, 90, 1996, pp. 302-313.

Bibliography
University of Melbourne PwC 49
Keeffe, K., Chou, S.L. and Lamoureaux, E.L., ‘The cost of care for people with impaired vision in Australia’, Archives of Ophthalmology, 127(10), 2009, pp. 1377-1381.
Keeffe, J. and Taylor, H. ‘World blindness: a 21st century perspective’. The British Journal of Ophthalmology, 85, 2001, pp. 261-266.
Kempen, J. ‘The prevalence of refractive errors among adults in the United States, Western Europe and Australia’, Archives of Ophthalmology, 122(4), 2004, pp. 495-505.
Macklin, J., Garrett, P., Dreyfus M. and Snowdon, W., Closing the Gap on Indigenous disadvantage, 14 May 2013.
Meads, C. and Hyde, C.. ‘What is the cost of blindness?’, The British Journal of Ophthalmology, 87.10, 2003, pp. 1201–1204.
Nash, F., New agreement will continue Australia's efforts to eradicate trachoma, Commonwealth of Australia, 10 July 2014.
National Aboriginal Community Controlled Health Organisation, ‘Definitions’, 2014, Available at: http://www.naccho.org.au/aboriginal-health/definitions/ Accessed 6 July 2015.
Nyman, S.R., Gosney M.A., Victor, C.R., ‘Psychosocial impact of visual impairment in working age adults’, British Journal of Ophthalmology, 94, 2010, pp. 1427-1431.
Productivity Commission, Valuing the future: the social discount rate in cost-benefit analysis, 22 April 2010.
PwC, The value of sight: The Fred Hollows Foundation – A quantification of the benefits associated with eliminating avoidable blindness and visual impairment, February 2013.
Rein, D., Zhang, P., Wirth, K., ‘The economic burden of major adult visual disorders in the United States’, Archives Ophthalmology, 124, 2006.
Reserve Bank of Australia, ‘Historical data’, 2015, Available at: http://www.rba.gov.au/statistics/historical-data.html#exchange-rates Accessed 6 July 2015.
Taylor, H., Email correspondence with PwC, 7 July 2015.
Taylor, H., Boudville, A., Anjou, M. and McNeil, R., The Roadmap to Close the Gap for Vision, Indigenous Eye Health Unit, Melbourne School of Population Health, The University of Melbourne, September 2011.
________, The Roadmap to Close the Gap for Vision, Indigenous Eye Health Unit, Melbourne School of Population and Global Health, The University of Melbourne, April 2013.
Taylor, H., Jonas, J., Keeffe, J., Leasher, J., Naidoo, K., Pesudovs, K. and Resnikoff, S., ‘Disability weights for vision disorders in Global Burden of Disease study’, The Lancet, 381, January 5, 2013.
Tseng, V., Yu, F., Lum, F., Coleman, A., ‘Risk fractures following cataract surgery in medicare beneficiaries’, The Journal of the American Medical Association, 308 (5), 2012.
Bibliography
University of Melbourne PwC 50
University of Melbourne, 'Additional annual capped costs to close the gap for vision', February 2015.
Vision 2020 Australia, Close the Gap in Aboriginal and Torres Strait Islander eye health and vision care: Sector funding proposal, April 2015.
Vision Australia, Employment research survey report 2012, May 2012.
White Cloud Foundation, ‘Depression facts’, 2014, Available at: http://www.whitecloudfoundation.org/depression-facts Accessed 6 July 2015.
World Health Organization, WHO methods and data sources for global burden of disease estimates 2000-2011, Department of Health Statistics and Information Systems, WHO, Geneva, November 2013.
________, ‘Health statistics and information systems: Estimates for 2000–2012’, 2015a, Available at: http://www.who.int/healthinfo/global_burden_disease/estimates/en/index2.html Accessed 6 July 2015.
________, ‘Health statistics and information systems: Metrics: Disability-Adjusted Life Year (DALY)’, 2015b, Available at: http://www.who.int/healthinfo/global_burden_disease/metrics_daly/en/ Accessed 6 July 2015.
________, ‘Prevention of blindness and visual impairment: Priority eye diseases’, 2015c, Available at: http://www.who.int/blindness/causes/priority/en/index4.html Accessed 6 July 2015

www.pwc.com.au
© 2015 PricewaterhouseCoopers. All rights reserved. PwC refers to the Australian member firm, and may sometimes refer to the PwC network. Each member firm is a separate legal entity. Please see www.pwc.com/structure for further details. Liability limited by a scheme approved under Professional Standards Legislation