the value of targeted therapies in lung cancer
TRANSCRIPT
The Value of Targeted Therapies in Lung Cancer
CitationRomanus, Dorothy. 2014. The Value of Targeted Therapies in Lung Cancer. Doctoral dissertation, Harvard University.
Permanent linkhttp://nrs.harvard.edu/urn-3:HUL.InstRepos:13070030
Terms of UseThis article was downloaded from Harvard University’s DASH repository, and is made available under the terms and conditions applicable to Other Posted Material, as set forth at http://nrs.harvard.edu/urn-3:HUL.InstRepos:dash.current.terms-of-use#LAA
Share Your StoryThe Harvard community has made this article openly available.Please share how this access benefits you. Submit a story .
Accessibility

The Value of Targeted Therapies in Lung Cancer
A dissertation presented
by
Dorothy Romanus
to
The Committee on Higher Degrees in Health Policy
In partial fulfillment of the requirements for the degree of
Doctor of Philosophy in the subject of
Health Policy
Harvard University Cambridge, Massachusetts
June, 2014

© 2014 Dorothy Romanus
All rights reserved.

iii
Professor David M. Cutler, Ph.D. Dorothy Romanus
The Value of Targeted Therapies in Lung Cancer
Abstract
The goal of this dissertation was to examine the realized value of targeted
therapies in routine care and to identify opportunities for improving the return on medical
spending for these technologies.
Chapter 1 investigated the value of targeted therapies in lung cancer patients
who were treated in routine care. This observational, claims-based analysis used
propensity score, and instrumental variable methods, combined with a Kaplan Meier
Sample Average estimator to calculate lifetime costs and life expectancy. An
incremental comparison showed that the realized value of targeted therapies in routine
care was unfavorable relative to chemotherapy treatment. Subgroup analyses revealed
that initial erlotinib therapy yielded effectiveness results that are substantially lower than
efficacy survival outcomes in molecularly guided trials. Our results indicated that in
routine care, chemotherapy was the most cost effective strategy. The unexpectedly low
outcomes with first-line erlotinib suggested that some of the value of this treatment was
not being realized in practice.
Chapter 2 examined the practice patterns of targeted therapies and utilization of
predictive biomarker testing in routine care to better understand the observed gaps
between trial-based and ‘real-world’ outcomes with these agents. In our nationally
representative cohort of lung cancer patients, we found that the vast majority of patients

iv
did not undergo molecular testing to inform first-line therapy. Our prediction models for
biomarker screening and first-line treatment suggested that phenotypic enrichment
criteria guided selection for testing and initiation of erlotinib therapy. Since clinical
characteristics do not adequately discriminate between mutation positive and wild type
tumors, these practices signal the need for wider dissemination of biomarker screening
to accurately target patients towards improving therapeutic gains with erlotinib.
Chapter 3 assessed the cost-effectiveness of multiplexed predictive biomarker
screening to inform treatment decisions in lung cancer patients. Using a micro-
simulation model to evaluate the incremental value of molecularly guided therapy
compared to chemotherapy in unselected patients, we found that personalized therapy
is a cost effective strategy. Our results indicated that better value of targeted therapies
in lung cancer is achievable through molecularly guided treatment.
v
Table of Contents
CHAPTER 1 THE VALUE OF TARGETED THERAPY IN LUNG CANCER: AN OBSERVATIONAL ANALYSIS OF ELDERLY MEDICARE POPULATION ................... 1
1.1 INTRODUCTION .......................................................................................................... 1 1.2 METHODS ................................................................................................................. 3
1.2.1 Data Sources ............................................................................................................... 3 1.2.2 Study participants ........................................................................................................ 4 1.2.3 Treatment Classification ............................................................................................... 5 1.2.4 Life expectancy ............................................................................................................ 6 1.2.5 Costs ........................................................................................................................... 6 1.2.6 Phases of care ............................................................................................................. 6 1.2.7 Patient Characteristics ................................................................................................. 7 1.2.8 Statistical Methods ...................................................................................................... 9
1.3 RESULTS ................................................................................................................ 17 1.3.1 Baseline Characteristics ............................................................................................. 17 1.3.3 Costs ......................................................................................................................... 22 1.3.4 Cost-Effectiveness Analysis ...................................................................................... 24 1.3.5 Sensitivity Analyses ................................................................................................... 26 1.3.6 Instrumental Variable Analysis .................................................................................. 28
1.4 DISCUSSION ........................................................................................................... 28 1.5 APPENDIX ............................................................................................................... 34 1.6 REFERENCES ......................................................................................................... 38
CHAPTER 2 ARE WE USING MOLECULARLY GUIDED THERAPY FOR LUNG CANCER IN ROUTINE CARE? ANALYSIS OF MEDICARE PATIENTS WITH STAGE IV NON-SMALL CELL LUNG CANCER (NSCLC) ........................................................ 46
2.1 ABSTRACT ............................................................................................................... 47 2.2 INTRODUCTION ........................................................................................................ 49 2.3 METHODS ................................................................................................................ 50
2.3.1 Study Participants ....................................................................................................... 50 2.3.2 Molecular Test Identification ...................................................................................... 52 2.3.3 First-line Treatment Classification ............................................................................. 53 2.3.4 Patient and Practice Characteristics .......................................................................... 53 2.3.5 Statistical Methods .................................................................................................... 54
2.4 RESULTS ................................................................................................................ 55 2.4.1 Baseline Characteristics ............................................................................................ 55 2.4.2 Predictors of Molecular Testing ................................................................................. 57
2.5 DISCUSSION ........................................................................................................... 63
vi
2.6 REFERENCES .......................................................................................................... 67 2.7 APPENDIX ............................................................................................................... 70
CHAPTER 3 COST-EFFECTIVENESS OF MULTIPLEXED PREDICTIVE BIOMARKER SCREENING IN NON-SMALL CELL LUNG CANCER .......................... 72
3.1 ABSTRACT .............................................................................................................. 73 3.2 INTRODUCTION ........................................................................................................ 75 3.3 METHODS ................................................................................................................ 76
3.3.1. Model and Treatment Strategies ............................................................................... 76 3.3.2. Natural History ........................................................................................................... 80 3.3.3. Clinical Outcomes ...................................................................................................... 80 3.3.4. Quality of Life ............................................................................................................. 81 3.3.5. Genomic Markers ...................................................................................................... 81 3.3.6. Costs ......................................................................................................................... 84 3.3.7. Cost Effectiveness Analysis ...................................................................................... 84 3.3.8. Sensitivity Analyses ................................................................................................... 85
3.4 RESULTS ................................................................................................................. 85 3.4.1. Sensitivity Analyses ................................................................................................... 86
3.5 DISCUSSION ............................................................................................................ 88 3.6 REFERENCES ........................................................................................................... 93 3.7 APPENDIX .............................................................................................................. 100
3.7.1 Natural History .......................................................................................................... 100 3.7.2 Survival Analysis ...................................................................................................... 103 3.7.3 Treatment Conditional Outcomes ............................................................................. 105 3.7.4 Best Response and Adverse Drug Event Rates ...................................................... 110 3.7.5 Utilities ...................................................................................................................... 110
vii
List of Tables
Table 1.1. Baseline Characteristics. .............................................................................. 18
Table 1.2. Cost Effectiveness Analysis Results by Treatment Category ‘Ever’. ............ 21
Table 1.3. Cost Effectiveness Analysis Results by First-Line Therapy. ......................... 21
Table 1.4. Costs by Category of Spending and Treatment (2013 $). ........................... 23
Table 1.5. Monthly Costs by Phase of Care and Treatment (2013 $). .......................... 25
Table 1.6. Sensitivity Analyses. ..................................................................................... 27
Table 1.A.1. Predicted Survival According to Treatment for Unadjusted, Doubly-Robust and Instrumental Variable Results. .......................................................................... 36
Table 1.A.2. Predicted Costs According to Treatment for Unadjusted, Doubly-Robust and Instrumental Variable Results. .......................................................................... 37
Table 2.1. Characteristics according to molecular testing status. .................................. 56
Table 2.2. Predictors of molecular testing ...................................................................... 58
Table 2.A.1. Codes Used in Defining Molecular Tests. .................................................. 70
Table 2.A.2. Predictors of first line erlotinib therapy. ...................................................... 71
Table 3.1 Strategies. ...................................................................................................... 79
Table 3.2 Model parameters and ranges for sensitivity analyses. .................................. 82
Table 3.3 Cost Effectiveness Results. ........................................................................... 86
Table 3.A.1. Baseline characteristics among Stage IV NSCLC patients by treatment group. ..................................................................................................................... 102
Table 3.A.2. Calibration results of simulation model parameters compared with randomized trials. ................................................................................................... 106
Table 3.A.3. Best response and adverse event probabilities by treatment. ................ 110
Table 3.A.4. Predictive model of utilities in lung cancer based on best response to therapy and adverse events. .................................................................................. 111
viii
List of Figures
Figure 1.A.1. Hazard functions by treatment group. The vertical lines correspond to the cut-point on the K-M survival curve where probability of survival is 20% or less. ... 34
Figure 1.A.2. Doubly robust survival curves and piecewise exponential model calibration. ................................................................................................................ 35
Figure 2.1. Flow diagram of study cohort ....................................................................... 51
Figure 2.2. Adjusted relationships between patient and practice characteristics and receipt of first-line erlotinib therapy (yello bars) and undergoing a molecular test (blue bars) for Stage IV NSCLC. Proportions are the average predicted probabilities adjusted for other covariates in regression models (Table 2.2 and Appendix). ................................................................................................................ 60
Figure 2.3. Kaplan-Meier curves depicting time to hospice admission from initiation of first line therapy among Stage IV NSCLC patients admitted to a hospice. .............. 62
Figure 3.1. Model structure depicting health states and transitions. ............................. 78
Figure 3.2. Sensitivity analyses. Tornado diagram of influential parameters on the incremental-cost effectiveness ratio (ICER) of ‘Test-treat’ vs. ‘No Test’ strategies. 87
Figure 3.A.1. Natural history model calibration. ............................................................ 104
Figure 3.A.2. Calibration of treatment conditional survival curves. .............................. 107

ix
Acknowledgements
My journey towards the completion of this dissertation was made
possible through the support of many. First and foremost, this work would
not have come to fruition without the unwavering support of my husband,
Piotr Romanus. He was my constant source of encouragement and
emotional support. To my children, Alex and Nelia, who patiently sacrificed
many weekends without mom. They were my unceasing reminder of the
things that matter most in life.
I would not have even begun this odyssey without the help of Jane
Weeks. She was a beacon of brilliance with an uncanny gift for mentorship.
Her guidance and generosity have irrevocably shaped my professional path.
Her untimely departure has left a void in so many peoples’ lives.
I will remain forever indebted to my dissertation committee. To David
Cutler, who in the midst of reforming the national health policy, among his
multitude of other commitments, always made his students a priority. His
incisive inquiry and astute analysis of many interim results decisively
ameliorated my work. To Mary Beth Landrum, for her statistical and content
expertise, and also for letting me share mutual kid anecdotes, which helped
me cope. To Scott Gazelle, for his steadfast support from the beginning of
the PhD program and through the toughest times. I was really fortunate to
have such a special committee.

x
I would also not have arrived at this destination without the support of Nick
Menzies, Sue Goldie and Milt Weinstein. They were there for me during my trials and
tribulations. Milt was an instrumental pillar and champion.
To my mom, Maria Kruk, with whom the journey ultimately began. Bearing
witness to her struggles and unyielding work ethic in the midst of life behind the Iron
Curtain and then during immigration has toughened my resolve.
I am indebted to you all and I thank you from the bottom of my heart.
Dorothy Romanus

xi
To Piotr, Alex and Nelia
1
Chapter 1 The Value of Targeted Therapy in Lung Cancer: An Observational Analysis of Elderly Medicare Population
1.1 Introduction
The burden of lung cancer is large both in terms of its impact on those afflicted
by the disease and in economic terms. Lung cancer is the leading cause of cancer-
related mortality, with 160,000 deaths estimated to occur nationwide in 2014, which
represents 27% of all cancer deaths.[1] In 2010, medical spending for cancer reached
$125 billion, with 10% attributable to lung cancer care alone. Over the next decade,
these costs are projected to grow by 27% taking into account only the aging of the
population.[2] Structural changes such as technology advances will put further
inflationary pressure on the growing costs for cancer care.
The introduction of targeted therapies in the treatment of advanced non-small cell
lung cancer (NSCLC) represents an innovation that has profoundly changed the
landscape of prognosis in select patients, but these treatments come with a high price
tag.[3-5] The two targeted therapies that gained approval by the Federal Drug
Administration (FDA) for treatment of patients with locally advanced or metastatic
NSCLC before 2013 are bevacizumab and erlotinib. The latter is an orally administered
epidermal growth factor tyrosine kinase inhibitor (EGFR TKI).[6] It has demonstrated a
remarkable efficacy in patients whose tumors harbor EGFR drug sensitizing mutations
compared to chemotherapy alone, with median progression free survival (PFS) of 9.4
vs. 5.2 months (p-value <0.0001).[7] The role of EGFR mutations as a predictive
biomarker for response to erlotinib has been clearly elucidated, but in practice,

2
molecular screening is widely underutilized.[8, 9] Bevacizumab was approved for
initial treatment of advanced, non-squamous NSCLC, based on a phase III randomized
clinical trial (ECOG 4599), which demonstrated a statistically significant but clinically
modest median overall survival (OS) benefit of 2 months compared to chemotherapy
alone.[10, 11] Trial-based results, however, may not be directly generalizable to the
majority of patients who are treated in the community, since trials are conducted under
strictly controlled protocols to increase the internal validity of findings. Patients treated
in clinical trials generally constitute a highly selected, healthier and younger group
compared to the general lung cancer population.[12, 13] Case in point is a recent
analysis of non-trial patients with advanced NSCLC, which compared survival
outcomes of carboplatin and paclitaxel chemotherapy combination with and without the
addition of bevacizumab. Unlike the earlier ECOG trial findings, this observational
analysis of an elderly patient cohort indicated no significant OS benefit for the
bevacizumab combination (hazard ratio of 1.01 (95% CI, 0.89-1.16)).[11, 14]
There is an increasing awareness among the oncology community and policy
makers that while some targeted therapies hold the promise of substantial outcome
improvements in cancer, they are associated with high costs. Bevacizumab costs
$7,400 for a 3-week cycle to treat an average patient.[15] The corresponding cost for
erlotinib is around $3,400.[16] While the acquisition costs for these drugs are high, it is
important to examine not just the costs of the drug but also the total costs associated
with management of patients who receive these therapies, in tandem with the
outcomes. Traditional economic analyses that estimate the value of medical

3
interventions to inform decision-makers have been based on efficacy data from trials.
To date, the cost-effectiveness of both erlotinib and bevacizumab in NSCLC has been
evaluated using these efficacy endpoints.[17, 18] In contrast, an evaluation based on
routine care that incorporates contemporary practice patterns and effectiveness
outcomes may help illuminate the actual realized value of these innovations. Such a
population based analysis may help inform decisions surrounding translational research
funding and coverage policies.
To assess the value of targeted therapies in routine care, we compared the
relative cost effectiveness of management with best supportive care (BSC) versus
treatment with chemotherapy alone or with targeted therapy among patients with
advanced NSCLC. The analysis was done from a payer perspective in the United
States using a lifetime horizon.
1.2 Methods
1.2.1 Data Sources
We used data from the National Cancer Institute’s Surveillance, Epidemiology,
and End Results (SEER) program linked to Medicare claims. The SEER program
collects information from 17 cancer registries, which cover approximately 28% of the
US population.[19] SEER captures information on cancer sites, histology, stage, grade,
and dates of diagnosis and death, as well as patient demographic characteristics for all
persons diagnosed with a cancer residing in one of the cancer registries. SEER data
for patients with diagnoses from January 1, 2007 through December 31, 2009, matched
to Medicare claims data from January 1, 2006, through December 31, 2010 were

4
available for patients with fee-for-service (FFS) coverage. Information from claims for
inpatient and outpatient hospital, skilled nursing facility, home health agency, and
hospice care, as well as physician services, prescription drugs and durable medical
equipment was included in the analysis.
1.2.2 Study participants
Patients with pathologically confirmed non-squamous, stage IV NSCLC
diagnosed between January 1, 2007 and December 31, 2009 were included. Stage at
diagnosis based on the SEER derived staging algorithms was used to identify patients
with advanced disease. To increase the homogeneity of patients, we excluded patients
who underwent primary cancer surgery.[20] Patients were also excluded if they had
other cancers diagnosed either before or after the index NSCLC diagnosis (to avoid
chemotherapy misclassification bias). Patients enrolled in either a health maintenance
organization (HMO), or only in part A or B Medicare at any time during the observation
period, starting 12 months prior to diagnosis and ending at death or last follow up, were
excluded to ensure a complete history of claim records. The primary comparison
groups were based on receipt of any targeted therapy (bevacizumab, erlotinib), with or
without chemotherapy, starting from index diagnosis (Figure 1.1). Specifically, we
compared three groups: 1) targeted treatment group, which comprised of patients who
were treated with bevacizumab or erlotinib, with or without chemotherapy, at some point
after diagnosis of stage IV NSCLC ; 2) chemotherapy group, consisting of patients who
received chemotherapy alone and no targeted therapy at any point after diagnosis; 3)
remaining patients were categorized to the best supportive care (BSC) group, if there
was no evidence of systemic therapy receipt (chemotherapy or targeted therapy).

5
Figure 1.1. Flow diagram of study cohort
NSCLC, non-small cell lung cancer
†targeted therapy includes bevacizumab and erlotinib
1.2.3 Treatment Classification
We identified systemic therapy use from Medicare claims. Claims for individual
drugs and therapy administration were flagged using International Classification of
Disease Version 9 (ICD-9) diagnostic and procedure codes, and the diagnosis related
group (DRG) codes in the inpatient hospital files. Healthcare Common Procedure
Coding System codes (HCPCS) and National Drug Codes (NDC) were used to identify
systemic therapy administration in the outpatient, physician, durable medical equipment
and Medicare Part D files using previously described methods.[21, 22]
26 427 Pa.ents diagnosed with non-‐squamous stage IV NSCLC
between 2007-‐2009
5 260 managed with best suppor.ve care
3 191 treated with chemotherapy alone
1 834 treated with targeted therapy ± chemotherapy†
16 142 Excluded 5389 Age at diagnosis <66 y 2225 Not pathologically confirmed 2878 Not eligible for Medicare Part A and B 5212 Enrolled in Medicare HMO 438 Primary cancer surgery
6
1.2.4 Life expectancy
The primary health outcome was life expectancy, which was estimated from
index diagnosis of stage IV NSCLC to date of death or censoring. We used information
reported in the Medicare files on death dates from any cause, which were
administratively censored for survival outcomes on 12/31/2011. At the end of follow up,
only a small proportion of patients were censored, ranging from 2.1% in the BSC group
to 6.7% in the target therapy treatment group. Survival time after the first year from
diagnosis was discounted using a 3% annual rate.[23]
1.2.5 Costs
Our economic outcome of interest was lifetime spending. Total costs for each
participant were calculated by summing the Medicare Part A, B and D reimbursements,
primary insurance payments and patient-liability costs (deductibles and co-payments
that are the patient’s responsibility).[24] Costs were expressed in real terms, in 2013$,
by adjustment for general price inflation using the GDP Deflator, a measure of price
inflation over time for all goods and services in the economy.[25] Costs incurred after
one year from diagnosis were discounted using a 3% annual rate.[23]
1.2.6 Phases of care
Since costs of cancer care tend to exhibit a U shaped distribution over time
(Appendix) and the entire cost histories are not observed for censored cases, we
partitioned costs into three phases: initial, continuing, and terminal. This approach
utilizes all information for participants who contribute data for a particular period. Thus,
histories of long- and short-time survivors are represented in this calculation. The
phase-specific approach can be used to estimate lifetime costs for incident cases that
7
are cumulative from date of diagnosis to death by combining phase-specific cost
estimates with survival models when the entire cost history is not observed.[26]
The length of each phase was based on observed U-shaped patterns of costs
over time (Appendix). Accordingly, we defined the duration of the initial phase as the
month of diagnosis and the following 2 months The terminal phase comprised the last 3
months of life, and the continuing phase as the remainder of the time and was therefore
of variable duration. The initial phase captures the primary course of therapy. The
continuing phase includes surveillance activities for detecting and treating recurrences.
The terminal phase applies to care received at the end of life. Cost data were
partitioned into 3-monthly intervals from diagnosis. A hierarchy was used to allocate the
observation time to costing phases. Among patients who died, costs were first assigned
to the terminal phase, then to the initial period, and any remaining time to the continuing
period. Among censored patients, costs were assigned to the initial phase first then any
costs incurred in the remaining time were categorized as the continuing phase.
1.2.7 Patient Characteristics
Characteristics expected to be related to treatment selection and some that may
also potentially affect the outcomes of interest were identified for analytic strategies to
reduce selection bias.[27] Socio-demographic and clinical characteristics included age,
gender, race/ethnicity, marital status, US census tract level education and income,
histology, presence of brain metastases, proxy indicator for acculturation using zip code
level proportion of population who were born outside of the US, enrolment in Medicaid,
and urban residence. Factors that may influence access to treatment included whether
the patient was treated in a teaching hospital, census tract-level managed care

8
penetration, hospital bed and physician density (per 100,000 inhabitants), hospital
referral region (HRR), and year of diagnosis. Hospital referral regions (HRR) were
developed by Dartmouth Atlas of Health Care based on referral patterns to hospitals for
Medicare patients. These regions represent areas with similar practice patterns.[28]
There are 81 HRRs represented in the SEER regions in 2007. Patients were assigned
to their HRR based on their residence zip code at the time of diagnosis of NSCLC. We
calculated a comorbidity score that combines the conditions in the traditionally
employed Charlson and Elixhauser indices using the method described by Gagne, et
al.[29] We modified the score by excluding cancer conditions (Dr. Joshua Gagne,
personal communication). The combined score has demonstrated a higher accuracy in
predicting mortality in elderly patients using an external validation dataset compared to
the individual indices. In addition, the combined score uses weights from more recent
data and it reflects changes in prognosis of diseases stemming from improvements in
medical care.[29] Each of the 18 conditions included in the combined score were further
coded as indicator variables. Proxy measures of patient health and performance status
at baseline included inpatient length of stay within one year prior to diagnosis, use of
skilled nursing and home health care services, use of home oxygen and activities of
daily living (ADL) aids (walkers, wheelchairs, hospital beds), as well as pre-diagnosis
medical costs.[30] Claims starting from 12 months to 2 months prior to diagnosis were
used for derivation of comorbidity scores, pre-diagnosis costs and indicators of
functional status. The 2 months immediately prior to diagnosis were excluded to avoid
including claims for treating symptoms of undiagnosed cancer.
9
1.2.8 Statistical Methods
Propensity Score Analysis
To balance observed baseline characteristics across treatment groups, we
constructed a multinomial logistic regression model by regressing treatment (categorical
variable with 3 levels: BSC, chemotherapy, and targeted therapy) on variables that
potentially confound the treatment and outcome pathway and baseline covariates
associated with treatment selection. The final model included 43 patient and provider
characteristics. A weight representing the inverse of the predicted probability of
treatment (IPW) from the multivariable logistic regression model was calculated for each
patient. The conditional predicted probability of treatment is the propensity score (PS).
We compared the distributions of these characteristics with and without applying IPW.
To evaluate the quality of the PS weighting, we assessed the balance in baseline
characteristics across treatment groups using standardized differences - the absolute
difference in means divided by the pooled standard deviation. By convention,
standardized differences of 10% or less are interpreted to signal a ‘good’ balance
across groups.[27]
Life Expectancy
The estimation of life expectancy for the main analysis proceeded in two parts.
First, an estimate of mean life expectancy was constructed based on the observed data
(restricted mean). This was accomplished using a doubly robust estimation method
which combines inverse probability weighting by propensity score with multivariate
nonparametric Cox proportional hazard (PH) modeling of the relationship between
covariates and survival for each treatment group. We checked the proportionality of
10
hazards assumption by comparing the log-cumulative hazard plots by treatment which
confirmed that the PH assumption was not violated. Next, because the aim of the
analysis was to estimate mean life expectancy over a lifetime horizon and since the
observed survival curves did not reach a survival probability of zero (albeit, the extent of
censoring was small, ranging from 2.1% in the BSC group to 6.7% in the target therapy
treatment group), we opted to use parametric modeling to extrapolate survival beyond
the observation period (extended means).[31, 32] First, we fit parametric models
(Weibull, exponential, log-logistic, log-normal and gamma) to the IPW, adjusted survival
curve for each treatment group. The Akaike’s information criterion (AIC) test was used
to select the model with the best fit.[32] However, even the best fitting model did not
appear suitably to fit the IPW, adjusted survival curve. Hence, a more flexible
parametric method was adopted.[31] Briefly, we fit piecewise exponential models to the
IPW, adjusted survival curves for each treatment group (Appendix). Then we examined
the kernel-smoothed hazard functions from the Cox PH models (Appendix). A long-
term stable hazard trend was observed in all treatment groups when the survival
probability reached 20% and lower. Using this cut point, the estimated hazard rates
from the fitted piecewise-exponential models were averaged conditioning on treatment
group. The tails of the IPW Cox PH model based survival function were fit using an
exponential model with the rate parameter estimated using the average hazard rates
from the piecewise exponential models for each treatment group to project survival
beyond the observation period (Appendix).[33] Therefore, the extended mean life
expectancy for each treatment group was based on a composite survival-function

11
estimator, using the IPW Cox PH based survival function and exponential parametric
models beyond last follow up.
Phase-‐Specific Costs
We carried out a doubly robust estimation of phase-specific costs in which
inverse-propensity weighting was combined with regression modeling with baseline
covariates, including HRR fixed effects, and calendar year. We modeled phase-specific
costs using generalized linear models (GLMs) with an Extended Estimating Equations
(EEE) estimator.[34, 35] Briefly, the EEE model allows estimation of a flexible mean
and variance function based on the data, which has been shown to reduce bias and
increase efficiency compared to user specified parameters.[34] The semi-parametric
EEE model can be implemented using the pglm command in STATA, which has been
constructed by Basu.[35] This command simultaneously estimates the link and
variance parameters from the data along with the regression parameters. All models
were based on a doubly-robust estimator, with inclusion of IPW and baseline covariates.
We used robust standard errors clustered at the patient level to account for correlation
between cost observations for each patient. Post-estimation procedures were used to
generate predicted costs. Both terminal and continuing phase costs depended on
duration of survival, calendar year, and treatment group (Appendix). Several functional
forms (e.g. main effects for time trends and survival length with and without interactions)
were fit and models were selected based on goodness of fit tests: the Pearson
correlation test, which tests the correlation between residuals and predicted costs on
raw scale to determine systematic bias in prediction of costs; the Hosmer-Lemeshow
test, which evaluates the calibration of predicted means across deciles with sample

12
means.[34, 36] The models with the best fit for the phase specific costs had a
Pearson correlation coefficient ranging from -0.01 to 0.01, and no systematic patterns
across deciles of predicted costs.
Lifetime cost estimation approach
We combined phase-specific cost predictions with survival curves to estimate
lifetime costs using the Kaplan-Meier Sample Average (KMSA) estimator based on a
previously proposed approach.[26, 37] Separate KMSA estimates were calculated for
each treatment group. We calculated the sum of a weighted average of predicted 3-
monthly costs over the 4-year period during which Medicare costs data was available.
The KMSA estimator for expected total spending prior to censoring for costs (December
31, 2010) is:
𝐸 = 𝑝! ∗ 𝐸!!!!
where: i=3-monthly intervals from diagnosis, range: 1 up to 16, i=1 represents the first
3 months of diagnosis, 𝑝!= doubly robust, IPW Cox PH probability of surviving to period
i using SEER-Medicare data, 𝐸! = average modeled cost using EEE estimator incurred
in period i among participants surviving to this time; costs for participants dying in period
i are included; costs for participants who were censored in period i are excluded. This
part of the KMSA estimator constitutes the restricted mean analysis since it does not
include extrapolation of costs beyond the date of censoring, on December 31, 2010.
The restricted mean approach was used in sensitivity analyses to examine the impact of
modeling specifications on the outcome of interest.

13
Since restricted means would underestimate costs for patients who were alive
after December 31, 2010, we relied on extrapolated cost predictions to estimate the
extended mean lifetime spending. The KMSA estimator for extrapolated costs was
calculated as follows:
𝐸∗ = 𝑝!∗ ∗ 𝐸!∗
!
where: j=3-monthly period from diagnosis, range: 5 up to 26 (when <0.5% of patients
remained alive), 𝑝!= fitted survival probability based on the composite survival-function
estimator, 𝐸!∗ = expected expenditure in period j, s.t.
𝐸!∗ = 𝑑! ∗ 𝑡 + (1− 𝑑! ) * 𝑐,
where: 𝑑! = rate of dying in period j, 𝑡 = predicted average cost in terminal phase in
period j , 𝑐 = predicted average cost in continuing phase in period j.
The KMSA estimator of expected total cumulative costs is:
𝐸+𝐸∗
This extended mean estimate of lifetime costs was used in the main analysis.
Cost Effectiveness Analysis
We calculated the incremental cost-effectiveness by first ranking the strategies in
order of increasing effectiveness. Strategies that were strongly dominated, i.e., those
that had a lower effectiveness and higher costs, were eliminated. Incremental cost

14
effectiveness ratios (ICERs) were calculated for each strategy in relation to the next
best strategy. The ICER is a ratio of the difference in lifetime mean costs divided by the
difference in mean life expectancy. Strategies with a higher ICER that were less
effective than another strategy were eliminated by extended dominance. The ICERs
were recalculated for the remaining strategies that were not eliminated by either strong
or extended dominance.[38]
Subgroup analysis
To explore the value of first-line treatment with specific targeted therapies in the
non-trial setting, we selected subgroups of patients who began targeted therapy
treatment with first line bevacizumab combination therapy, erlotinib alone, or a doublet
chemotherapy alone. The date of the first systemic therapy claim within 120 days from
diagnosis was used to define the start date of first line treatment.[14] Cancer-directed
treatments with dates within 29 days from initiation of therapy were flagged for the
purpose of identifying combination therapies.[20] We estimated the extended means
for life expectancy and costs for each group using methods described above. These
estimates were adjusted for factors listed in Table 1.1 and discounted at 3% per
annum.
Sensitivity Analyses
We conducted several sensitivity analyses of lifetime cost and life expectancy
estimation using restricted means to evaluate the influence of model specification on
these outcomes. These included IPW models with HRR fixed effects and IPW models
without HRR fixed effects.
15
Instrumental Variable Methods
While PS methods can adjust for observed confounders that bias the
treatment effect, these methods do not mitigate bias due to unobserved differences in
known or unknown prognostic factors between the treated and untreated groups and
across geographic areas. We investigated 1-year survival probability and costs to
compare the consistency of results using PS analytic approaches and instrumental
variable (IV) analyses. Consistent results across these analytic methods would signal
that the causal effects were not influenced by omitted variables. The intuition behind
IV methods is to compare groups not according to treatment they received, but rather
according to the likelihood of receiving treatment, the instrument. The IV has to predict
treatment choice but cannot be independently associated with the outcome, other than
through its effect on treatment.[39] The IV can be regarded as a randomization
mechanism, therefore, observed and unobserved characteristics should be similar
across levels of the instrument. Area-level practice patterns are commonly used in IV
approaches to adjust for selection bias in health services research.[40-42] This
approach accounts for differences between patients across treatment groups, but it
makes the assumption that potential confounders are randomly distributed across the
geographic areas. We further account for possible unobserved confounding at the
area level by including geographic area fixed effects. For example, this approach would
account for the documented significant geographic variation in smoking patterns.[43]
Smoking not only increases the risk of mortality in cancer patients, but is also correlated
with predictors of treatment choice and response.[8, 44] To account for confounders
both at the patient and area level, we used annual treatment rates within each HRR as
the IV with fixed area effects to control for fixed unobserved differences between areas.
16
We first divided patients into quintiles according to annual rate of diffusion of
targeted therapy in the HRR of residence, such that the number of patients in each
quintile was approximately equal. We repeated the process for a second IV that
estimated the annual rate of diffusion of chemotherapy treatment alone in each HRR.
We constructed the instruments by calculating the rate of treatment by year within each
HRR (chemotherapy or targeted therapy). We tested the relationship between each IV
on each treatment type (chemotherapy and targeted therapy) using the F-test to assess
whether each IV explained a significant portion of the variation in treatment choice. We
also compared baseline characteristics by quintile of treatment diffusion for each IV
separately to examine whether patients stratified according to rate of diffusion of each
treatment type were similar in observed characteristics. Tests for trend were
conducted across quintiles of adoption rates to assess whether patients were
comparable across levels of each IV.
We adopted the two-stage least squares (2SLS) estimation approach for our IV-
based sensitivity analysis. The outcomes considered for our sensitivity analysis were
survival and cumulative costs at 1 year post diagnosis. In each stage, we included
baseline covariates to control for residual differences between treatment groups and
HRR fixed effects to control for area-level confounders. First, we estimated the
probability of receiving targeted therapy as a function of baseline characteristics, HRR
fixed effects and targeted therapy annual adoption rate at the HRR level. We repeated
the prediction model for receipt of chemotherapy alone. In the second stage, we
included both predicted probabilities of treatment (of targeted therapy and of
chemotherapy), baseline characteristics and HRR fixed effects as covariates to predict

17
1-year survival probabilities and cumulative costs by treatment group. We compared
the IV-based predicted outcomes to IPW analyses and non-weighted analyses using the
same set of covariates.
1.3 Results
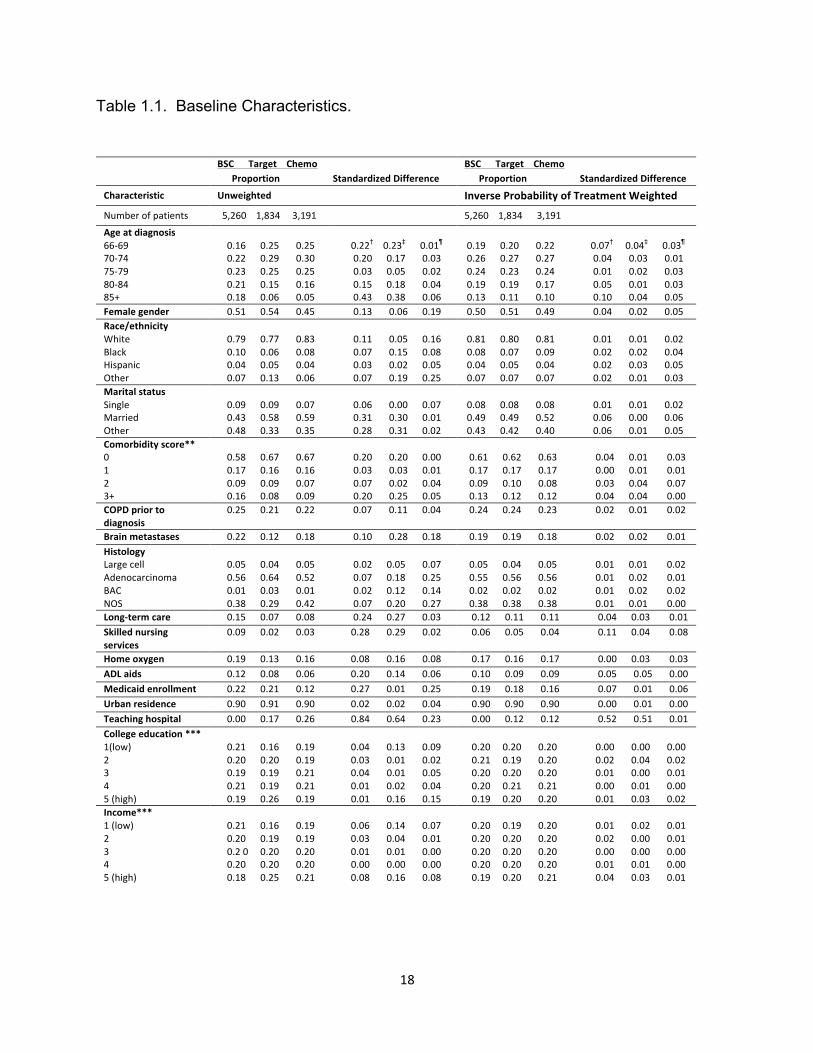
1.3.1 Baseline Characteristics
A total of 10,285 patients met our eligibility criteria. Within this cohort, 3,191
(31%) received chemotherapy alone and for 1,834 (18%) patients treatment included a
targeted therapy after diagnosis with Stage IV NSCLC. Among the targeted therapy
group, 591 (32%), 1,119 (61%) and 112 (6%) of patients received erlotinib,
bevacizumab, or both drugs (with and without chemotherapy), respectively, during their
course of disease. Table 1.1 compares the patient, provider and area-level
characteristics according to treatment group before and after weighting using the
inverse probability of treatment (IPW, see a full list of covariates in Appendix). As
expected, in the unweighted comparisons there was evidence of treatment selection
bias. Patients who received any form of systemic therapy were more likely to be
younger, married, have no comorbidities, and to be receiving care at a teaching
hospital. Treated patients had fewer proxy indicators of poor PS at baseline (requiring
home health care and skilled nursing services, ADL aids or hospitalization) and lower
18
Table 1.1. Baseline Characteristics.
BSC Target Chemo Proportion Standardized Difference
BSC Target Chemo Proportion Standardized Difference
Characteristic Unweighted Inverse Probability of Treatment Weighted
Number of patients 5,260 1,834 3,191 5,260 1,834 3,191
Age at diagnosis 66-‐69 0.16 0.25 0.25 0.22† 0.23‡ 0.01¶ 0.19 0.20 0.22 0.07† 0.04‡ 0.03¶ 70-‐74 0.22 0.29 0.30 0.20 0.17 0.03 0.26 0.27 0.27 0.04 0.03 0.01 75-‐79 0.23 0.25 0.25 0.03 0.05 0.02 0.24 0.23 0.24 0.01 0.02 0.03 80-‐84 0.21 0.15 0.16 0.15 0.18 0.04 0.19 0.19 0.17 0.05 0.01 0.03 85+ 0.18 0.06 0.05 0.43 0.38 0.06 0.13 0.11 0.10 0.10 0.04 0.05 Female gender 0.51 0.54 0.45 0.13 0.06 0.19 0.50 0.51 0.49 0.04 0.02 0.05 Race/ethnicity White 0.79 0.77 0.83 0.11 0.05 0.16 0.81 0.80 0.81 0.01 0.01 0.02 Black 0.10 0.06 0.08 0.07 0.15 0.08 0.08 0.07 0.09 0.02 0.02 0.04 Hispanic 0.04 0.05 0.04 0.03 0.02 0.05 0.04 0.05 0.04 0.02 0.03 0.05 Other 0.07 0.13 0.06 0.07 0.19 0.25 0.07 0.07 0.07 0.02 0.01 0.03 Marital status Single 0.09 0.09 0.07 0.06 0.00 0.07 0.08 0.08 0.08 0.01 0.01 0.02 Married 0.43 0.58 0.59 0.31 0.30 0.01 0.49 0.49 0.52 0.06 0.00 0.06 Other 0.48 0.33 0.35 0.28 0.31 0.02 0.43 0.42 0.40 0.06 0.01 0.05 Comorbidity score** 0 0.58 0.67 0.67 0.20 0.20 0.00 0.61 0.62 0.63 0.04 0.01 0.03 1 0.17 0.16 0.16 0.03 0.03 0.01 0.17 0.17 0.17 0.00 0.01 0.01 2 0.09 0.09 0.07 0.07 0.02 0.04 0.09 0.10 0.08 0.03 0.04 0.07 3+ 0.16 0.08 0.09 0.20 0.25 0.05 0.13 0.12 0.12 0.04 0.04 0.00 COPD prior to diagnosis
0.25 0.21 0.22 0.07 0.11 0.04 0.24 0.24 0.23 0.02 0.01 0.02
Brain metastases 0.22 0.12 0.18 0.10 0.28 0.18 0.19 0.19 0.18 0.02 0.02 0.01 Histology Large cell 0.05 0.04 0.05 0.02 0.05 0.07 0.05 0.04 0.05 0.01 0.01 0.02 Adenocarcinoma 0.56 0.64 0.52 0.07 0.18 0.25 0.55 0.56 0.56 0.01 0.02 0.01 BAC 0.01 0.03 0.01 0.02 0.12 0.14 0.02 0.02 0.02 0.01 0.02 0.02 NOS 0.38 0.29 0.42 0.07 0.20 0.27 0.38 0.38 0.38 0.01 0.01 0.00 Long-‐term care 0.15 0.07 0.08 0.24 0.27 0.03 0.12 0.11 0.11 0.04 0.03 0.01 Skilled nursing services
0.09 0.02 0.03 0.28 0.29 0.02 0.06 0.05 0.04 0.11 0.04 0.08
Home oxygen 0.19 0.13 0.16 0.08 0.16 0.08 0.17 0.16 0.17 0.00 0.03 0.03 ADL aids 0.12 0.08 0.06 0.20 0.14 0.06 0.10 0.09 0.09 0.05 0.05 0.00 Medicaid enrollment 0.22 0.21 0.12 0.27 0.01 0.25 0.19 0.18 0.16 0.07 0.01 0.06 Urban residence 0.90 0.91 0.90 0.02 0.02 0.04 0.90 0.90 0.90 0.00 0.01 0.00 Teaching hospital 0.00 0.17 0.26 0.84 0.64 0.23 0.00 0.12 0.12 0.52 0.51 0.01 College education *** 1(low) 0.21 0.16 0.19 0.04 0.13 0.09 0.20 0.20 0.20 0.00 0.00 0.00 2 0.20 0.20 0.19 0.03 0.01 0.02 0.21 0.19 0.20 0.02 0.04 0.02 3 0.19 0.19 0.21 0.04 0.01 0.05 0.20 0.20 0.20 0.01 0.00 0.01 4 0.21 0.19 0.21 0.01 0.02 0.04 0.20 0.21 0.21 0.00 0.01 0.00 5 (high) 0.19 0.26 0.19 0.01 0.16 0.15 0.19 0.20 0.20 0.01 0.03 0.02 Income*** 1 (low) 0.21 0.16 0.19 0.06 0.14 0.07 0.20 0.19 0.20 0.01 0.02 0.01 2 0.20 0.19 0.19 0.03 0.04 0.01 0.20 0.20 0.20 0.02 0.00 0.01 3 0.2 0 0.20 0.20 0.01 0.01 0.00 0.20 0.20 0.20 0.00 0.00 0.00 4 0.20 0.20 0.20 0.00 0.00 0.00 0.20 0.20 0.20 0.01 0.01 0.00 5 (high) 0.18 0.25 0.21 0.08 0.16 0.08 0.19 0.20 0.21 0.04 0.03 0.01

19
Table 1.1. (Continued)
*Other covariates included in PS estimation: Alcohol abuse, Cardiac arrhythmias, CHF, Chronic
pulmonary disease, Coagulopathy, Complicated diabetes, Deficiency anemias, Dementia, Fluid and electrolyte disorder, HIV/AIDS, Hemiplegia, Hypertension, Liver disease, PVD, Psychosis, Pulmonary circulation disorder, Renal failure, Weight loss, hospital days for COPD prior to cancer diagnosis, census tract level hospital bed and physician density, managed care penetration, proportion foreign born, hospital length of stay within a year prior to cancer diagnosis, hospital referral region not shown (see Appendix) **determined using Charlson and Elixhauser combined score †chemotherapy vs. BSC ‡targeted therapy vs. BSC ¶targeted therapy vs. chemotherapy *** census tract quintile
medical costs prior to diagnosis. Patients treated with targeted therapy compared to
chemotherapy alone were more likely to be female, non-Hispanic, non-white, or non-
black, have a histopathologic diagnosis of adenocarcinoma and Medicaid co-insurance,
live in areas with high managed care penetration, and areas with a highly educated and
foreign born population. Compared to the chemotherapy alone treatment group, those
treated with targeted therapy were less likely to have brain metastases or to be treated
at a teaching hospital. In the IPW analyses, the balance in the baseline characteristics
across the treatment groups improved considerably. All standardized differences were
notably smaller than 10% with the exception of a higher proportion of systemic therapy
patients who were managed at a teaching hospital compared to the BSC group.
BSC Target Chemo Proportion Standardized Difference
BSC Target Chemo Proportion Standardized Difference
Characteristic Unweighted Inverse Probability of Treatment Weighted Prior year costs (quintile) 1 (low) 0.21 0.17 0.20 0.03 0.11 0.08 0.20 0.19 0.20 0.00 0.03 0.02 2 0.18 0.22 0.22 0.09 0.10 0.01 0.19 0.20 0.20 0.02 0.02 0.00 3 0.18 0.23 0.21 0.07 0.11 0.04 0.20 0.21 0.20 0.01 0.02 0.01 4 0.18 0.23 0.21 0.07 0.13 0.06 0.20 0.19 0.20 0.02 0.03 0.04 5 (high) 0.24 0.15 0.16 0.20 0.24 0.04 0.21 0.21 0.19 0.04 0.01 0.06 Year of diagnosis 2007 0.34 0.34 0.34 0.01 0.00 0.01 0.34 0.33 0.34 0.01 0.02 0.01 2008 0.34 0.32 0.34 0.01 0.05 0.05 0.34 0.34 0.34 0.01 0.01 0.00 2009 0.32 0.34 0.32 0.00 0.04 0.04 0.32 0.33 0.32 0.00 0.02 0.01
20
1.3.2 Life Expectancy
Patients who were ever exposed to cancer-directed treatment during their course
of disease with Stage IV lung cancer had a longer survival compared to those managed
with BSC. Based on undiscounted survival time and doubly robust, IPW Cox PH
models, the median overall survival estimates were 2.4 (IQR, 1.3-5.2), 6.5 (IQR, 3.3-
13.1), and 9.8 (IQR, 4.7-17.2) months in the BSC, chemotherapy and targeted therapy
groups, respectively. Surprisingly, our subgroup analysis based on first-line therapy
exposure, revealed that the adjusted median survival for patients selected for first line
erlotinib therapy in routine care was only marginally longer compared to a
counterfactual group of patients managed with BSC, 4.7 (IQR, 2.7-11.5) months vs. 2.6
(IQR, 1.3-5.5) months. A much longer median adjusted OS was observed for those
treated with first line doublet chemotherapy, 8.1 months (IQR, 4.1-15.5), and for patients
who initiated combination therapy with bevacizumab, 10.5 months (IQR, 5.6-18.3).
Discounted mean life expectancy and lifetime costs adjusted for inflation (2013 $)
are shown in Tables 1.2 and 1.3 by treatment ‘ever’ category and for first-line treatment
subgroups, respectively. These lifetime estimates are based on IPW, doubly-robust
analyses and projections beyond last censored observation. The largest discounted
mean life expectancy improvement, of 5.4 months, was seen in patients ever treated
with chemotherapy alone relative to those managed with BSC (Table 1.2). Patients
who received targeted therapy at some point, lived on average 2.4 months longer
compared to cases treated with chemotherapy alone (Table 1.2). Based on first-line
therapy subgroup analyses (Table 1.3), the mean life expectancy increased by only 1.2
months for treatments that combined bevacizumab with a chemotherapy doublet vs.

21
chemotherapy alone. The mean survival associated with first line erlotinib therapy was
substantially shorter compared to treatment with a chemotherapy doublet, 8.5 vs. 12.2
months.
Table 1.2. Cost Effectiveness Analysis Results by Treatment Category ‘Ever’.
Treatment* Mean Lifetime
Cost†
Cost Difference
Mean Life Expectancy†
(months)
Mean Life Expectancy
(years)
Change in Life
Expectancy (years)
ICER‡ ($/LY)
BSC¶ $45,556 5.28 0.44
Any Chemotherapy $86,039 $40,483 10.66 0.89 0.45 90,297
Targeted $125,119 $39,080 13.02 1.16 0.20 198,712
Table 1.3. Cost Effectiveness Analysis Results by First-Line Therapy.
Treatment** Mean Lifetime
Cost†
Cost Difference
Mean Life Expectancy†
(months)
Mean Life Expectancy
(years)
Change in Life
Expectancy (years)
ICER ($/LY)
BSC¶ $47,902 5.17 0.43
Erlotinib $83,732 dominated 8.51 0.71 dominated dominated
Doublet Chemotherapy $95,154 $47,252 12.21 1.02 0.59 80,543
Bevacizumab $149,987 $54,833 13.43 1.12 0.10 548,330 *patients grouped into treatment categories based on receipt of treatment anytime after diagnosis; based on projected costs and survivalbeyond last observed data (extended means) † based on doubly robust estimators (inverse probability weighting by propensity score and multivariate outcome regression models); models were adjusted for age, race, gender, marital status, comorbidity score, individual comorbidities, histology, brain metastases, enrollment in Medicaid, urban residence, hospital teaching status, pre-‐diagnosis costs, indicators of functional status prior to diagnosis (skilled nursing, long-‐term care, hospital stays, use of home oxygen, ADL aids), census level college education, income, physician density, hospital bed density, managed care penetration, proxy indicator for acculturation (proportion foreign born), year of diagnosis, and hospital referral region ‡ICER=incremental cost effectiveness ratio, ratio of difference in mean lifetime costs (2013 $) to mean life years ; after 1 year, costs and survival length discounted by 3% per annum ¶BSC=best supportive care **patients grouped into treatment categories based on first-‐line therapy initiation within 120 days from diagnosis

22
1.3.3 Costs
On average, the discounted cost of medical management with BSC over a
lifetime was $45,600 (2013 US$). The corresponding lifetime cost estimates for the
chemotherapy and targeted therapy groups were $86,000 and $125,100, respectively,
or approximately $40,000 more for each technological advance (Table 1.2).
Patients who initiated therapy with a bevacizumab-based combination treatment,
had the highest lifetime costs of around $150,000 (Table 1.3). Costs for those who
were treated with first-line chemotherapy were approximately $55,000 lower over a
lifetime compared to the first-line bevacizumab group.
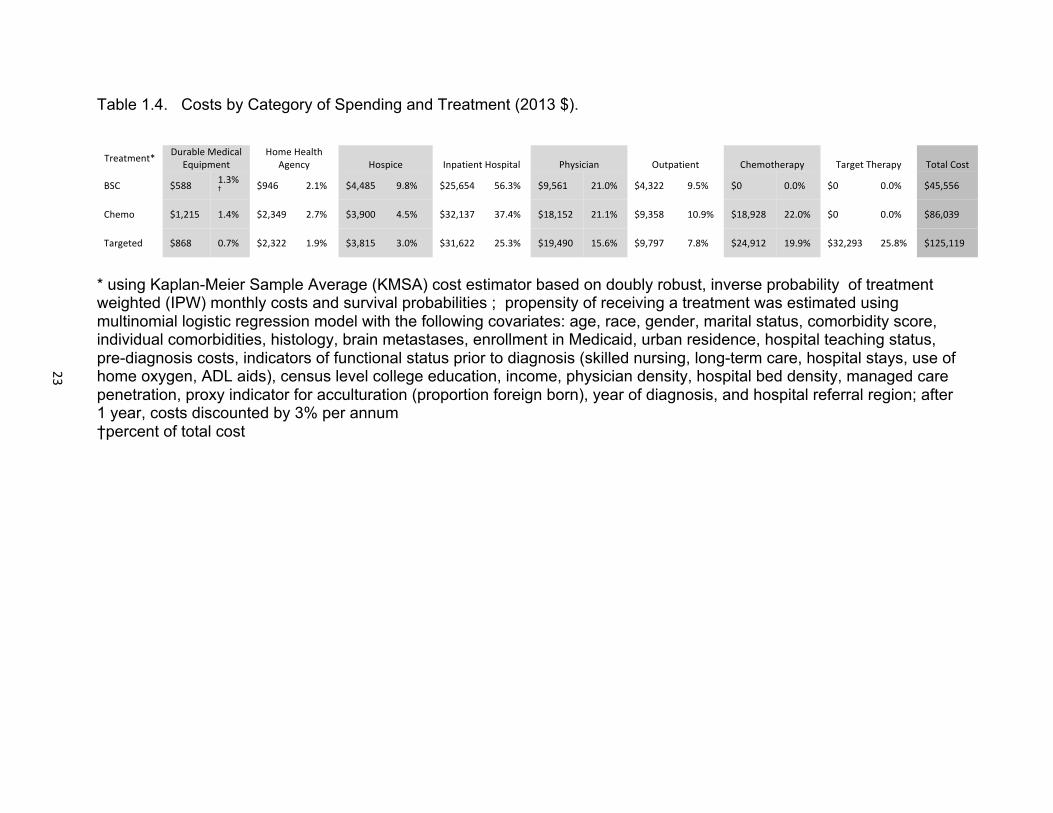
We also decomposed the cumulative medical expenditures by service type and
into monthly spending by phase of care (Table 1.4 and 1.5). First, we carried out a
comparison of mean IPW monthly costs by phase of care between the BSC patients
and each of the treatment groups prior to initiation of therapy to examine whether
residual unobserved confounders may explain the differences in cumulative and
monthly costs. These analyses revealed no significant differences in monthly costs
(data not shown), bolstering the case that group differences in cumulative and monthly
costs arose from survival differences and treatment-related management.
The decomposed estimates revealed that systemic therapy costs account for the
largest proportion of medical care costs. In the targeted therapy group, a quarter of the
overall spending, or $32,300, was attributable to costs related to targeted treatments,
and another 20% of total costs, approximately $25,000, was spent on chemotherapy
(drug costs and administration costs). Similarly, in the chemotherapy treatment only
group, drug related costs accounted for a substantial proportion (22.0%) of the total
expenditures (Table 1.4).
23
Table 1.4. Costs by Category of Spending and Treatment (2013 $).
Treatment* Durable MedicalEquipment
Home Health Agency Hospice Inpatient Hospital Physician Outpatient Chemotherapy Target Therapy Total Cost
BSC $588 1.3%† $946 2.1% $4,485 9.8% $25,654 56.3% $9,561 21.0% $4,322 9.5% $0 0.0% $0 0.0% $45,556
Chemo $1,215 1.4% $2,349 2.7% $3,900 4.5% $32,137 37.4% $18,152 21.1% $9,358 10.9% $18,928 22.0% $0 0.0% $86,039
Targeted $868 0.7% $2,322 1.9% $3,815 3.0% $31,622 25.3% $19,490 15.6% $9,797 7.8% $24,912 19.9% $32,293 25.8% $125,119
* using Kaplan-Meier Sample Average (KMSA) cost estimator based on doubly robust, inverse probability of treatmentweighted (IPW) monthly costs and survival probabilities ; propensity of receiving a treatment was estimated using multinomial logistic regression model with the following covariates: age, race, gender, marital status, comorbidity score, individual comorbidities, histology, brain metastases, enrollment in Medicaid, urban residence, hospital teaching status, pre-diagnosis costs, indicators of functional status prior to diagnosis (skilled nursing, long-term care, hospital stays, use of home oxygen, ADL aids), census level college education, income, physician density, hospital bed density, managed care penetration, proxy indicator for acculturation (proportion foreign born), year of diagnosis, and hospital referral region; after 1 year, costs discounted by 3% per annum †percent of total cost
24
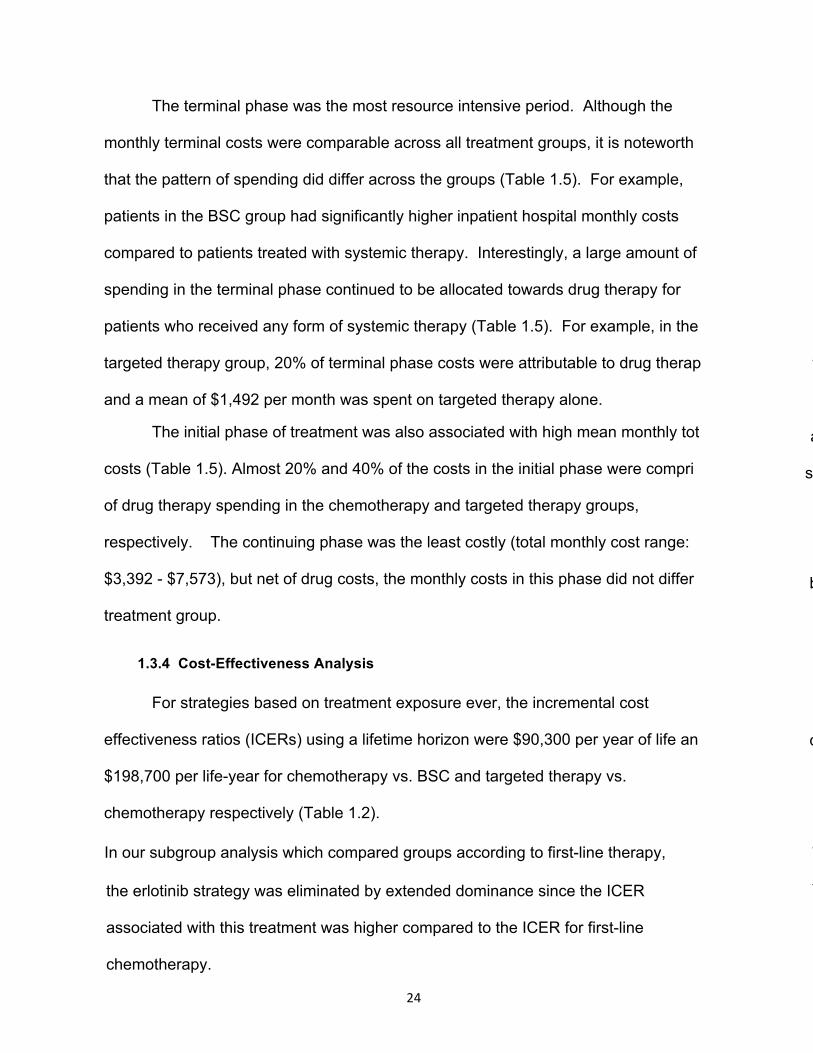
The terminal phase was the most resource intensive period. Although the
monthly terminal costs were comparable across all treatment groups, it is noteworth y
that the pattern of spending did differ across the groups (Table 1.5). For example,
patients in the BSC group had significantly higher inpatient hospital monthly costs
compared to patients treated with systemic therapy. Interestingly, a large amount of
spending in the terminal phase continued to be allocated towards drug therapy for
patients who received any form of systemic therapy (Table 1.5). For example, in the
targeted therapy group, 20% of terminal phase costs were attributable to drug therap y,
and a mean of $1,492 per month was spent on targeted therapy alone.
The initial phase of treatment was also associated with high mean monthly tot al
costs (Table 1.5). Almost 20% and 40% of the costs in the initial phase were compri sed
of drug therapy spending in the chemotherapy and targeted therapy groups,
respectively. The continuing phase was the least costly (total monthly cost range:
$3,392 - $7,573), but net of drug costs, the monthly costs in this phase did not differ by
treatment group.
1.3.4 Cost-Effectiveness Analysis
For strategies based on treatment exposure ever, the incremental cost
effectiveness ratios (ICERs) using a lifetime horizon were $90,300 per year of life an d
$198,700 per life-year for chemotherapy vs. BSC and targeted therapy vs.
chemotherapy respectively (Table 1.2).
In our subgroup analysis which compared groups according to first-line therapy, y,
tedthe erlotinib strategy was eliminated by extended dominance since the ICER
associated with this treatment was higher compared to the ICER for first-line
chemotherapy.

25
Table 1.5. Monthly Costs by Phase of Care and Treatment (2013 $).
Treatment*
Phase Total Costs Costs without Drug Therapy
Inpatient Hospital Costs
Outpatient Costs
Physician Costs
Hospice Costs
Home Health
Care Costs
Durable Medical
Equipment Costs
Chemotherapy Costs
Targeted Therapy Costs
Mean (95% CI) 2013 US $
Targeted Therapy
Initial
Continuing
Terminal
11,874 (11,460-‐12,288)
7,573 (7,245-‐7,901)
12,015 (11,400-‐12,630)
7,247 (6,877-‐7,617)
2,927 (2,750-‐3,105)
9,619 (9,041-‐10,198)
3,359 (3,066-‐3,651)
907 (804-‐1,011)
5,575 (5,081-‐6,070)
1,323 (1,235-‐1,411)
583 (535-‐631)
761 (573-‐948)
2,308 (2,194-‐2,422)
1,080 (1,020-‐1,141)
1,717 (1,615-‐1,819)
14 (1-‐26) 125
(78-‐171) 1,065
(958-‐1,171)
147 (122-‐171)
149 (123-‐175)
389 (334-‐444)
97 (78-‐116)
79 (63-‐96)
113 (99-‐127)
1,902 (1,724-‐2,080)
2,058 (1,867-‐2,249)
903 (797-‐1,009)
2,726 (2,542-‐2,909)
2,587 (2,396-‐2,779)
1,492 (1,362-‐1,623)
Chemotherapy
Initial
Continuing
Terminal
10,168 (9,847-‐10,490)
5,139 (4,897-‐5,381)
11,850 (11,444-‐12,257)
8,329 (8,009-‐8,650)
3,190 (2,992-‐3,389)
10,685 (10,283-‐11,088)
3,820 (3,553-‐4,087)
1,169 (1,032-‐1,305)
6,351 (5,993-‐6,708)
1,555 (1,481-‐1,629)
594 (554-‐634)
785 (736-‐835)
2,717 (2,622-‐2,811)
1,084 (1,014-‐1,154)
2,046 (1,958-‐2,133)
11 (5-‐17) 122
(89-‐154) 1,034
(961-‐1,107)
143 (120-‐166)
143 (123-‐163)
360 (329-‐390)
84 (76-‐93)
82 (71-‐94)
110 (101-‐119)
1,839 (1,745-‐1,933)
1,949 (1,812-‐2,086)
1,165 (1,090-‐1,240)
n/a
BSC
Initial
Continuing
Terminal
8,493 (8,074-‐8,913)
3,392 (3,106-‐3,678)
12,711 (12,351-‐13,071)
8,493 (8,074-‐8,913)
3,392 (3,106-‐3,678)
12,711 (12,351-‐13,071)
4,759 (4,412-‐5,106)
1,027 (863-‐1,191)
8,203 (7,876-‐8,531)
1,192 (1,040-‐1,345)
636 (542-‐730)
633 (597-‐668)
2,079 (1,984-‐2,174)
1,071 (912-‐1,230)
2,049 (1,984-‐2,115)
222 (188-‐256)
420 (334-‐505)
1,469 (1,409-‐1,529)
158 (138-‐178)
123 (101-‐144)
261 (243-‐280)
83 (73-‐93)
81 (67-‐94)
90 (83-‐97)
n/a n/a
*estimates based on inverse probability of treatment weighted (IPW) monthly costs; propensity of receiving a treatmentwas estimated using multinomial logistic regression model with the following covariates: age, race, gender, marital status, comorbidity score, individual comorbidities, histology, brain metastases, enrollment in Medicaid, urban residence, hospital teaching status, pre-diagnosis costs, indicators of functional status prior to diagnosis (skilled nursing, long-term care, hospital stays, use of home oxygen, ADL aids), census level college education, income, physician density, hospital bed density, managed care penetration, proxy indicator for acculturation (proportion foreign born), year of diagnosis, and hospital referral region
25
26
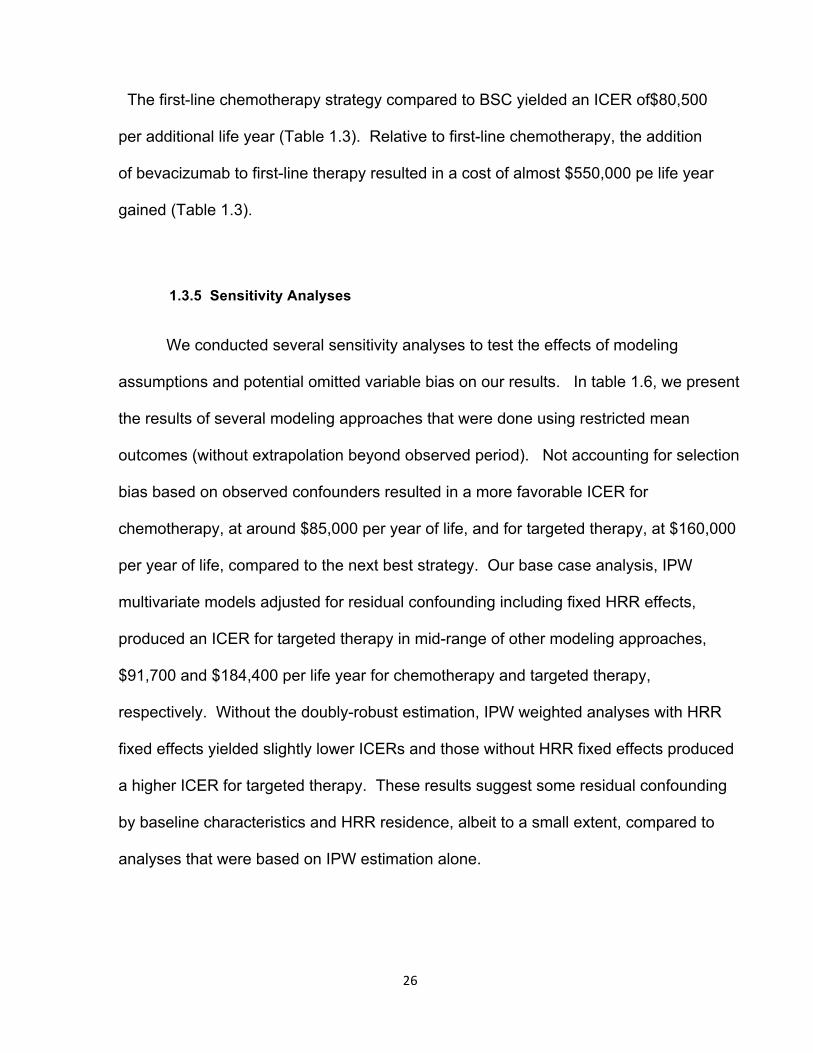
The first-line chemotherapy strategy compared to BSC yielded an ICER of$80,500
per additional life year (Table 1.3). Relative to first-line chemotherapy, the addition
of bevacizumab to first-line therapy resulted in a cost of almost $550,000 pe life year
gained (Table 1.3).
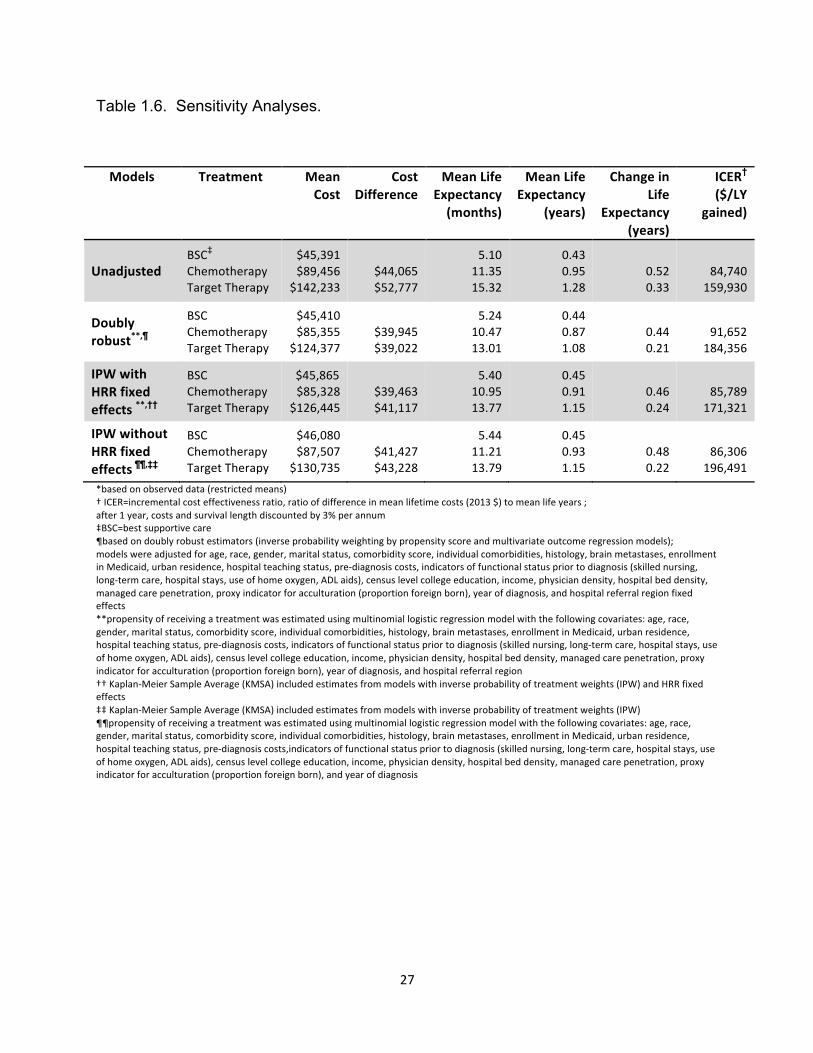
1.3.5 Sensitivity Analyses
We conducted several sensitivity analyses to test the effects of modeling
assumptions and potential omitted variable bias on our results. In table 1.6, we present
the results of several modeling approaches that were done using restricted mean
outcomes (without extrapolation beyond observed period). Not accounting for selection
bias based on observed confounders resulted in a more favorable ICER for
chemotherapy, at around $85,000 per year of life, and for targeted therapy, at $160,000
per year of life, compared to the next best strategy. Our base case analysis, IPW
multivariate models adjusted for residual confounding including fixed HRR effects,
produced an ICER for targeted therapy in mid-range of other modeling approaches,
$91,700 and $184,400 per life year for chemotherapy and targeted therapy,
respectively. Without the doubly-robust estimation, IPW weighted analyses with HRR
fixed effects yielded slightly lower ICERs and those without HRR fixed effects produced
a higher ICER for targeted therapy. These results suggest some residual confounding
by baseline characteristics and HRR residence, albeit to a small extent, compared to
analyses that were based on IPW estimation alone.
27
Table 1.6. Sensitivity Analyses.
Models Treatment Mean Cost
Cost Difference
Mean Life Expectancy (months)
Mean Life Expectancy
(years)
Change in Life
Expectancy (years)
ICER† ($/LY
gained)
Unadjusted BSC‡
Chemotherapy Target Therapy
$45,391 $89,456
$142,233 $44,065 $52,777
5.10 11.35 15.32
0.43 0.95 1.28
0.52 0.33
84,740 159,930
Doubly robust**,¶
BSC Chemotherapy Target Therapy
$45,410 $85,355
$124,377 $39,945 $39,022
5.24 10.47 13.01
0.44 0.87 1.08
0.44 0.21
91,652 184,356
IPW with HRR fixed effects **,††
BSC Chemotherapy Target Therapy
$45,865 $85,328
$126,445 $39,463 $41,117
5.40 10.95 13.77
0.45 0.91 1.15
0.46 0.24
85,789 171,321
IPW without HRR fixed effects ¶¶,‡‡
BSC Chemotherapy Target Therapy
$46,080 $87,507
$130,735 $41,427 $43,228
5.44 11.21 13.79
0.45 0.93 1.15
0.48 0.22
86,306 196,491
*based on observed data (restricted means)† ICER=incremental cost effectiveness ratio, ratio of difference in mean lifetime costs (2013 $) to mean life years ; after 1 year, costs and survival length discounted by 3% per annum ‡BSC=best supportive care ¶based on doubly robust estimators (inverse probability weighting by propensity score and multivariate outcome regression models); models were adjusted for age, race, gender, marital status, comorbidity score, individual comorbidities, histology, brain metastases, enrollment in Medicaid, urban residence, hospital teaching status, pre-‐diagnosis costs, indicators of functional status prior to diagnosis (skilled nursing, long-‐term care, hospital stays, use of home oxygen, ADL aids), census level college education, income, physician density, hospital bed density, managed care penetration, proxy indicator for acculturation (proportion foreign born), year of diagnosis, and hospital referral region fixed effects **propensity of receiving a treatment was estimated using multinomial logistic regression model with the following covariates: age, race, gender, marital status, comorbidity score, individual comorbidities, histology, brain metastases, enrollment in Medicaid, urban residence, hospital teaching status, pre-‐diagnosis costs, indicators of functional status prior to diagnosis (skilled nursing, long-‐term care, hospital stays, use of home oxygen, ADL aids), census level college education, income, physician density, hospital bed density, managed care penetration, proxy indicator for acculturation (proportion foreign born), year of diagnosis, and hospital referral region †† Kaplan-‐Meier Sample Average (KMSA) included estimates from models with inverse probability of treatment weights (IPW) and HRR fixed effects ‡‡ Kaplan-‐Meier Sample Average (KMSA) included estimates from models with inverse probability of treatment weights (IPW) ¶¶propensity of receiving a treatment was estimated using multinomial logistic regression model with the following covariates: age, race, gender, marital status, comorbidity score, individual comorbidities, histology, brain metastases, enrollment in Medicaid, urban residence, hospital teaching status, pre-‐diagnosis costs,indicators of functional status prior to diagnosis (skilled nursing, long-‐term care, hospital stays, use of home oxygen, ADL aids), census level college education, income, physician density, hospital bed density, managed care penetration, proxy indicator for acculturation (proportion foreign born), and year of diagnosis

28
1.3.6 Instrumental Variable Analysis
The instruments using HRR-by-year rates of the adoption of targeted therapy and
chemotherapy significantly predicted the likelihood of lung cancer treatment choices (F
= 147 and 125, p-value <.001, respectively for targeted therapy and chemotherapy).
The likelihood of receiving treatment was significantly associated with the quintile of the
instruments - chemotherapy receipt increased from 17.8% to 45.0% and targeted
therapy ranged from 6.3% to 30.5% from the lowest quintile to the highest quintile of the
instruments. Patient characteristics according to the lowest and highest quintile of each
instrument were reasonably balanced across the quintiles of the instruments (see
Appendix). Residual differences were controlled for in the doubly-robust estimation.
The instrumental variable analyses indicated that the incremental 6-month and 12-
month differences between strategies in overall survival and cumulative costs were not
significantly different from differences estimated by the doubly-robust IPW approach.
1.4 Discussion
We performed a cost-effectiveness analysis of targeted therapies outside the
clinical trial setting in a population-based study of elderly patients with Stage IV NSCLC.
Our results indicate that targeted therapy given in routine care generates a modest
survival benefit compared to chemotherapy alone. Unlike most cost-effectiveness
analyses, which are based on decision analytic models with efficacy inputs from
selected clinical trial participants, we based our study on the real-world setting to reflect
effectiveness and expenditure outcomes using contemporary practice patterns. Our

29
results suggest that the incremental cost-effectiveness ratio for targeted therapy of
$198,700 per additional life year exceeds the WHO acceptable willingness to pay
threshold for a cost-effective intervention of $150,000 per life year.[45] In a subgroup
analysis, we found that initiation of bevacizumab in combination with chemotherapy
yielded an ICER of almost $550,000 per life-year. First-line erlotinib therapy was a
dominated strategy since it resulted in an ICER that was higher than that for first-line
doublet chemotherapy, yet its effectiveness in terms of life expectancy was lower, 8.5
months vs. 12.2 months, respectively.
Our results for first-line bevacizumab-based therapy are consistent in value with
an economic analysis which used efficacy outcomes from the landmark trial (ECOG
4599) comparing carboplatin and paclitaxel with and without bevacizumab that yielded
an ICER of $309,000 per life year from the US payer perspective.[18, 46] Both, our
observational study and the trial-based cost-effectiveness analysis suggest that
bevacizumab treatment is associated with a low economic value. The survival
outcomes observed in our study among patients who were treated with bevacizumab in
the first line setting were comparable to those reported by Zhu, et al.[14] In that
observational study of patients aged 65 years or older, the median OS for bevacizumab
in combination with carboplatin and paclitaxel was 9.7 months and the 1-year survival
probability was 39.6%, outcomes that were not significantly different from carboplatin
and paclitaxel combination therapy alone. More careful selection of patients in a trial
setting yielded results for overall survival that ranged from non-significant to a 2-month
significant benefit in the ECOG 4599 trial for bevacizumab combination therapy
compared to chemotherapy alone.[11, 47, 48] In contrast to the known predictive

30
biomarkers which correlate with response to erlotinib, factors predictive of response or
toxicity with bevacizumab in non-squamous cell tumors are yet to be elucidated.[49]
Future research should focus on identifying predictive markers to guide bevacizumab
therapy towards subgroups of patients who are more likely to benefit from addition of
bevacizumab to first-line chemotherapy.
Our finding of a surprisingly low adjusted median OS of 4.7 months for patients
selected for first line erlotinib therapy in routine care compared to a counterfactual group
of patients treated with first line doublet chemotherapy of 8.1 months warrants a closer
examination of treatment prescribing patterns. In a companion observational analysis of
elderly lung cancer patients, we found that only 5.2% of Stage IV non-squamous
NSCLC patients had a claim for a molecular test prior to initiation of first-line therapy.(ref
3rd paper) This finding is corroborated by another study which also reported that
biomarker screening is underutilized in routine care. In that study, only 12% of US
acute-care hospitals ordered the EGFR assay in 2010, which represented 5.7% of
guideline-directed patients.[9] Yet, outcomes with erlotinib therapy are correlated with
EGFR mutation status and therefore dependent on molecular testing. While unselected
patients with advanced NSCLC have response rates of 8% to 9% and median
progression-free survival (PFS) of 3.4 months with erlotinib, those whose tumors
harbour drug sensitizing EGFR mutations have response rates of 68% and median PFS
of 12 months on erlotinib.[8] In a recent trial of first line erlotinib therapy in patients with
tumors positive for the EGFR drug sensitizing mutations, median overall survival was
19.3 months.[7] The lower median OS found in our observational cohort compared to
the results in that trial may be due, in part, to differences in age and functional status.

31
Still, a three-fold difference in median OS, coupled with the low proportion of patients
with evidence of molecular testing suggest that molecularly guided therapy is
underutilized in routine practice. One way to optimize the value of erlotinib therapy is to
condition its use on EGFR positive status. Commercial EGFR mutation assays were
first marketed in 2005 and many laboratory-developed tests (LDTs) for EGFR mutations
are available, providing ready access to EGFR testing.[9] In addition, ascertainment
of predictive biomarker status prior to selection of TKI therapy in all patients with non-
squamous, advanced stage NSCLC has been endorsed by professional societies
including the American Society for Clinical Oncology (ASCO), the College of American
Pathologists (CAP), the International Association for the Study of Lung Cancer (IASLC),
the Association for Molecular Pathology (AMP), as well as NCCN.[8, 50, 51]
Evidence suggests that better value for EGFR TKIs, in terms of return on medical
spending, is achievable through universal molecular testing of guideline-recommended
patients. Handorf et al. conducted a cost effectiveness analysis of EGFR mutation
testing to inform first-line treatment in patients with stage IV NSCLC in the United
States. Compared to standard of care with carboplatin and paclitaxel combination
chemotherapy, testing followed by erlotinib treatment in EGFR mutation positive tumors,
or chemotherapy in wild type tumors yielded ICERs in the range of $110,600 to
$122,200 per QALY. Compared with carboplatin, pemetrexed and bevacizumab as the
standard of care, the testing strategy had ICERs of $25,500 to $44,000 per QALY.[17]
In a separate analysis, we also found that EGFR mutation and anaplastic lymphoma
kinase (ALK) rearrangement guided therapy in non-squamous, Stage IV NSCLC
patients yields good value with an ICER of $150,000 per QALY compared to cisplatin-
32
pemetrexed treatment in unselected patients.(ref 1st paper) The effect of EGFR
mutation guided therapy on the health care budget appears to have a small impact. In a
plan of 500,000 members, the budget impact did not exceed $0.019 per member per
month in one analysis.[52] Taken as a whole, the return on medical spending for
erlotinib would be improved by better targeting of patients most likely to benefit from this
TKI through molecular testing.
The limitations of our study need to be considered in the interpretation of our
findings. We relied on observational data in our analysis, which is subject to selection
biases. We mitigated the imbalance between treatment groups with the use of doubly
robust methods, which included propensity score estimation with 43 potential
confounders of treatment selection and outcomes. We included proxy indicators of
known predictors of therapy choice, such as performance status, and smoking history,
as well as phenotypic characteristics that have been shown to correlate with EGFR drug
sensitizing mutations.[8, 30] We further adjusted for residual confounding and
unobserved area-level confounders by using a doubly robust estimator, including fixed
HRR effects. Still, propensity score methods will estimate a causal effect that is
unbiased to the extent that there are no omitted variables which confound the
relationship between treatment and the outcome. To account for potential omitted
variable bias, in our sensitivity analyses, we conducted instrumental variable analyses.
All results yielded consistent findings.
From an external validity standpoint, the results of our analysis are generalizable
to most elderly patients (65 years of age and older) who are managed in the community
setting. The SEER population is generally representative of the US population.[53]
33
The median age of NSCLC patients at diagnosis is 71 years and two thirds of NSCLC
patients are 65 or older at the time of diagnosis.[54] In addition, our analysis is based
mainly on patients who were not enrolled in a clinical trial, thus the results are
generalizable to the majority of patients afflicted by this disease. However, our analysis
does not reflect treatment patterns and costs in managed care populations, who have
been shown to differ systematically from FFS beneficiaries.[55] Furthermore, the
results are restricted to direct medical costs and thus do not include time costs, or costs
due to lost productivity. These metrics were outside the scope of the present analysis.
In an era of a growing cost burden of cancer care, the cost of targeted therapies
has come under increased scrutiny mostly as a response to the sticker shock from drug
prices.[3-5, 16, 56] Based on treatment patterns in routine care, the economic value
generated by targeted therapies in the setting of advanced NSCLC is unfavorable
relative to conventional benchmarks. Improvements in cost-effectiveness may be
possible using predictive molecular marker testing to identify patients with drug
sensitizing mutations that predispose to a favorable response to therapy. Future policy
efforts aimed at incentivizing molecularly guided therapy should be evaluated towards
broader implementation of screening for genetic markers. Such policies may include
value-based benefit designs that reduce patient cost-sharing with accompanying
evidence of positive results for EGFR drug sensitizing mutations, or reference pricing
whereby reimbursement level for targeted therapies to providers is made contingent on
the evidence base, or guideline recommendations (e.g., with higher reimbursement in
cases of guideline-concordant care).

34
1.5 Appendix
Figure 1.A.1. Hazard functions by treatment group. The vertical lines correspond to the cut-point on the K-M survival curve where probability of survival is 20% or less.

35
Figure 1.A.2. Doubly robust survival curves and piecewise exponential model calibration.
0 0.1 0.2 0.3 0.4 0.5 0.6 0.7 0.8 0.9 1
0 1.842105263
3.717105263
5.592105263
7.467105263
9.473684211
11.57894737
13.79483904
16.76494635
20.72508942
25.18220379
29.98820267
35.46136421
48.68507924
survival probability
month from diagnosis
Best SupporMve Care
KM, IPW
piecewise, ave. hazard
0 0.1 0.2 0.3 0.4 0.5 0.6 0.7 0.8 0.9 1
0 2.565789474
5.032894737
7.5 10
12.58124681
15.4555442
18.32984159
22.4816045
26.73252601
30.94940244
37.89979533
46.17157647
survival probability
month from diagnosis
Chemotherapy
KM, IPW
piecewise, ave. hazard
0 0.1 0.2 0.3 0.4 0.5 0.6 0.7 0.8 0.9 1
0 3.092105263
5.559210526
8.059210526
10.72368421
13.28385284
15.99846704
19.03244762
22.96065406
26.73252601
31.44550555
37.86969124
50.11719128
Survival probability
month from diagnosis
Targeted therapy
KM, IPW
piecewise, ave. hazard
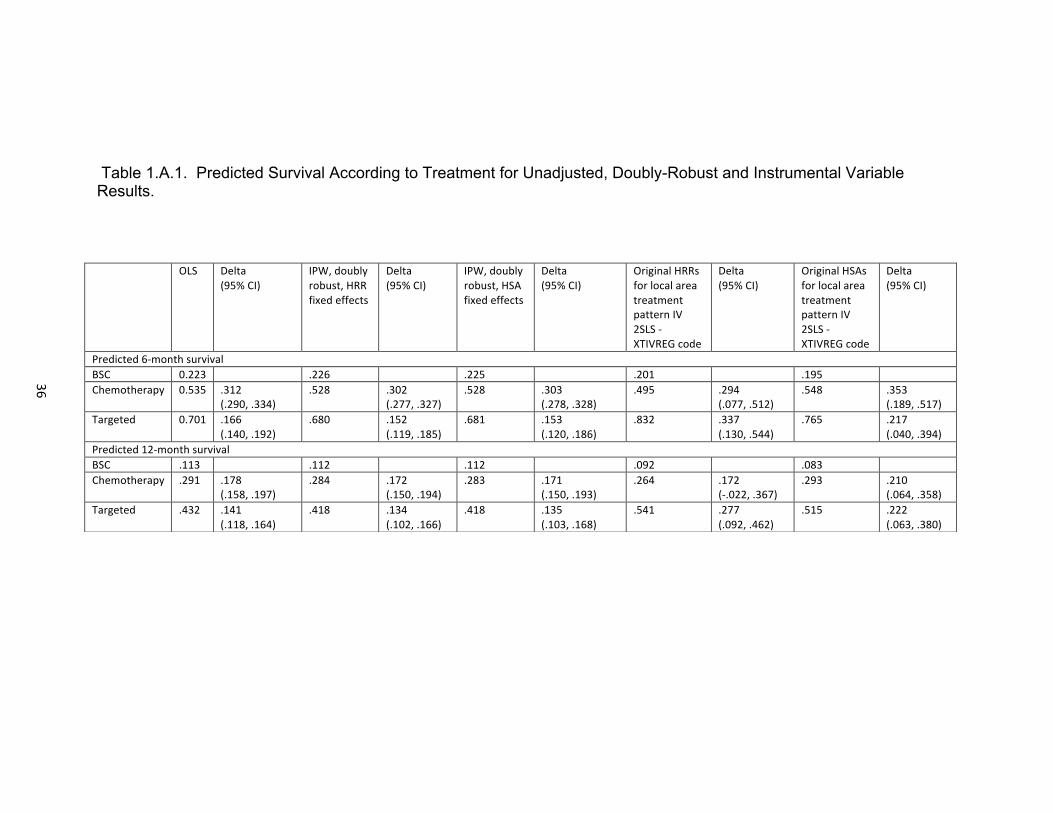
36
Table 1.A.1. Predicted Survival According to Treatment for Unadjusted, Doubly-Robust and Instrumental Variable Results.
OLS Delta (95% CI)
IPW, doubly robust, HRR fixed effects
Delta (95% CI)
IPW, doubly robust, HSA fixed effects
Delta (95% CI)
Original HRRs for local area treatment pattern IV 2SLS -‐ XTIVREG code
Delta (95% CI)
Original HSAs for local area treatment pattern IV 2SLS -‐ XTIVREG code
Delta (95% CI)
Predicted 6-‐month survival BSC 0.223 .226 .225 .201 .195 Chemotherapy 0.535 .312
(.290, .334) .528 .302
(.277, .327) .528 .303
(.278, .328) .495 .294
(.077, .512) .548 .353
(.189, .517) Targeted 0.701 .166
(.140, .192) .680 .152
(.119, .185) .681 .153
(.120, .186) .832 .337
(.130, .544) .765 .217
(.040, .394) Predicted 12-‐month survival BSC .113 .112 .112 .092 .083 Chemotherapy .291 .178
(.158, .197) .284 .172
(.150, .194) .283 .171
(.150, .193) .264 .172
(-‐.022, .367) .293 .210
(.064, .358) Targeted .432 .141
(.118, .164) .418 .134
(.102, .166) .418 .135
(.103, .168) .541 .277
(.092, .462) .515 .222
(.063, .380)

37
Table 1.A.2. Predicted Costs According to Treatment for Unadjusted, Doubly-Robust and Instrumental Variable Results.
Mean Predicted 6-‐month cost
OLS Delta (95% CI)
IPW, doubly robust,
OLS, HRR fixed
effects
Delta (95% CI)
IPW, doubly robust,
OLS, HSA fixed
effects
Delta (95% CI)
Original HRRs for local area treatment pattern IV
2SLS -‐ XTIVREG
code
Delta (95% CI)
Original HSAs for local area treatment pattern IV
2SLS -‐ XTIVREG
code
Delta (95% CI)
Mean Predicted 6-‐month cost BSC 36,703 36,533 36,562 36,523 35,421 Chemotherapy 49,834 13,131
(11,671, 14,591)
49,533 13,000 (11,474, 14,526)
49,437 12,875 (11,354, 14,397)
52,562 16,039 (1,526, 30,552)
55,818 20,397 (9,299, 31,494)
Targeted 62,932 13,098 (11,367, 14,829)
60,528 10,995 (9,027, 12,964)
60,380 10,943 (8,919, 12,967)
58,702 6,140 (-‐7,688, 19,968)
57,019 1,202 (-‐10,815, 13,219)
Mean Predicted 12-‐month cost BSC 41,621 41,395 41,376 40,625 41,612 Chemotherapy 65,456 23,835
(21,973, 25,812)
65,051 23,656 (21,443, 25, 869)
64,968 23,591 (21,355, 25,828)
69,411 28,785 (9,723, 47,847)
71,309 29,698 (15,147, 44,248)
Targeted 94,268 28,812 (26,395, 30,946)
89,818 24,767 (21,652, 27,883)
89,933 24,966 (21,781, 28,151)
90,243 20,832 (2,670, 38,995)
85,400 14,091 (-‐1,666, 29,847)
38
1.6 References
1. Institute, N.C. Lung Cancer. April 12, 2014]; Available from:
http://www.cancer.gov/cancertopics/types/lung.
2. Mariotto, A.B., et al., Projections of the cost of cancer care in the United States:
2010-2020. J Natl Cancer Inst, 2011. 103(2): p. 117-28.
3. Kelly, R.J., B.E. Hillner, and T.J. Smith, Cost effectiveness of crizotinib for
anaplastic lymphoma kinase-positive, non-small-cell lung cancer: who is going to
blink at the cost? J Clin Oncol, 2014. 32(10): p. 983-5.
4. Pauly, M.V., Is high and growing spending on cancer treatment and prevention
harmful to the United States economy? J Clin Oncol, 2007. 25(2): p. 171-4.
5. Experts in Chronic Myeloid, L., The price of drugs for chronic myeloid leukemia
(CML) is a reflection of the unsustainable prices of cancer drugs: from the
perspective of a large group of CML experts. Blood, 2013. 121(22): p. 4439-42.
6. Institute, N.C. FDA Approval for Erlotinib Hydrochloride. March 30, 2014];
Available from: http://www.cancer.gov/cancertopics/druginfo/fda-erlotinib-
hydrochloride. .
7. Rosell, R., et al., Erlotinib versus standard chemotherapy as first-line treatment
for European patients with advanced EGFR mutation-positive non-small-cell lung
cancer (EURTAC): a multicentre, open-label, randomised phase 3 trial. Lancet
Oncol, 2012. 13(3): p. 239-46.
8. Lindeman, N.I., et al., Molecular testing guideline for selection of lung cancer
patients for EGFR and ALK tyrosine kinase inhibitors: guideline from the College

39
of American Pathologists, International Association for the Study of Lung Cancer,
and Association for Molecular Pathology. J Thorac Oncol, 2013. 8(7): p. 823-59.
9. Lynch, J.A., et al., Utilization of epidermal growth factor receptor (EGFR) testing
in the United States: a case study of T3 translational research. Genet Med, 2013.
15(8): p. 630-8.
10. Institute, N.C., FDA Approval for Bevacizumab.
11. Sandler, A., et al., Paclitaxel-carboplatin alone or with bevacizumab for non-
small-cell lung cancer. N Engl J Med, 2006. 355(24): p. 2542-50.
12. Langer, C.J., Neglected and underrepresented subpopulations: elderly and
performance status 2 patients with advanced-stage non-small-cell lung cancer.
Clin Lung Cancer, 2006. 7 Suppl 4: p. S126-37.
13. Langer, C.J., Elderly patients with lung cancer: biases and evidence. Curr Treat
Options Oncol, 2002. 3(1): p. 85-102.
14. Zhu, J., et al., Carboplatin and paclitaxel with vs without bevacizumab in older
patients with advanced non-small cell lung cancer. JAMA, 2012. 307(15): p.
1593-601.
15. Services, C.f.M.M. Medicare Part B Drug Average Sales Price. 2014 May 16,
2014]; Available from: http://www.cms.gov/Medicare/Medicare-Fee-for-Service-
Part-B-
Drugs/McrPartBDrugAvgSalesPrice/index.html?redirect=/mcrpartbdrugavgsalesp
rice.

40
16. Fojo, T. and C. Grady, How much is life worth: cetuximab, non-small cell lung
cancer, and the $440 billion question. J Natl Cancer Inst, 2009. 101(15): p. 1044-
8.
17. Handorf, E.A., et al., Cost effectiveness of personalized therapy for first-line
treatment of stage IV and recurrent incurable adenocarcinoma of the lung. J
Oncol Pract, 2012. 8(5): p. 267-74.
18. Goulart, B. and S. Ramsey, A trial-based assessment of the cost-utility of
bevacizumab and chemotherapy versus chemotherapy alone for advanced non-
small cell lung cancer. Value Health, 2011. 14(6): p. 836-45.
19. Institute, N.C. SEER-Medicare Linked Database. [cited 2013; Available from:
http://appliedresearch.cancer.gov/seermedicare/.
20. Davidoff, A.J., et al., Chemotherapy and survival benefit in elderly patients with
advanced non-small-cell lung cancer. J Clin Oncol, 2010. 28(13): p. 2191-7.
21. Lamont, E.B., et al., Criterion validity of Medicare chemotherapy claims in Cancer
and Leukemia Group B breast and lung cancer trial participants. J Natl Cancer
Inst, 2005. 97(14): p. 1080-3.
22. Warren, J.L., et al., Utility of the SEER-Medicare data to identify chemotherapy
use. Med Care, 2002. 40(8 Suppl): p. IV-55-61.
23. Gold MR, S.J., Russell LB, Weinstein MC, Cost-Effectiveness in Health and
Medicine. 1996, New York: Oxford University Press.
24. Cipriano, L.E., et al., Lung cancer treatment costs, including patient
responsibility, by disease stage and treatment modality, 1992 to 2003. Value
Health, 2011. 14(1): p. 41-52.
41
25. Analysis, B.o.E. Chain-type price indexes for gross domestic product, 1964-2012.
2012 [cited 2013 June 2, 2013]; Available from:
http://www.gpo.gov/fdsys/granule/ERP-2013/ERP-2013-table7/content-
detail.html.
26. Brown, M.L., et al., Obtaining long-term disease specific costs of care:
application to Medicare enrollees diagnosed with colorectal cancer. Med Care,
1999. 37(12): p. 1249-59.
27. Douglas Faries, A.L., Josep Maria Haro, Robert Obenchain, Analysis of
Observational Health Care Data Using SAS. 2010, Cary, NC, USA: SAS
Publishing.
28. School, D.M., The Dartmouth Atlas of Health Care, 1998. 1998, Dartmouth
Medical School: Hanover NH.
29. Gagne, J.J., et al., A combined comorbidity score predicted mortality in elderly
patients better than existing scores. J Clin Epidemiol, 2011. 64(7): p. 749-59.
30. Davidoff, A.J., et al., A novel approach to improve health status measurement in
observational claims-based studies of cancer treatment and outcomes. J Geriatr
Oncol, 2013. 4(2): p. 157-65.
31. Gelber, R.D., A. Goldhirsch, and B.F. Cole, Parametric extrapolation of survival
estimates with applications to quality of life evaluation of treatments. International
Breast Cancer Study Group. Control Clin Trials, 1993. 14(6): p. 485-99.
32. Latimer, N.R., Survival analysis for economic evaluations alongside clinical trials-
-extrapolation with patient-level data: inconsistencies, limitations, and a practical
guide. Med Decis Making, 2013. 33(6): p. 743-54.

42
33. Bagust, A. and S. Beale, Survival Analysis and Extrapolation Modeling of Time-
to-Event Clinical Trial Data for Economic Evaluation: An Alternative Approach.
Med Decis Making, 2013.
34. Basu, A., D. Polsky, and W.G. Manning, Estimating Treatment Effects on
Healthcare Costs under Exogeneity: Is There a 'Magic Bullet'? Health Serv
Outcomes Res Methodol, 2011. 11(1-2): p. 1-26.
35. Basu, A., Extended generalized linear models: Simultaneous estimation of
flexible link and variance functions. The Stata Journal, 2005. 5(4): p. 501-516.
36. Buntin, M.B. and A.M. Zaslavsky, Too much ado about two-part models and
transformation? Comparing methods of modeling Medicare expenditures. J
Health Econ, 2004. 23(3): p. 525-42.
37. Etzioni, R., et al., The impact of including future medical care costs when
estimating the costs attributable to a disease: a colorectal cancer case study.
Health Econ, 2001. 10(3): p. 245-56.
38. Hunink M, G.P., Siegel J, et al., Decision-Making in Health and Medicine:
Integrating Evidence and Values. 2001, New York, NY: Cambridge University
Press.
39. Landrum MB, A.J., Causal Effect of Ambulatory Specialty Care on Mortality
Following Myocardial Infarction: A Comparison of Propensity Score and
Instrumental Variable Analyses. Health Serv Outcomes Res Methodol, 2001. 2:
p. 221-245.

43
40. Earle, C.C., et al., Effectiveness of chemotherapy for advanced lung cancer in
the elderly: instrumental variable and propensity analysis. J Clin Oncol, 2001.
19(4): p. 1064-70.
41. Hadley, J., et al., Comparative effectiveness of prostate cancer treatments:
evaluating statistical adjustments for confounding in observational data. J Natl
Cancer Inst, 2010. 102(23): p. 1780-93.
42. Lu-Yao, G.L., et al., Survival following primary androgen deprivation therapy
among men with localized prostate cancer. JAMA, 2008. 300(2): p. 173-81.
43. Chahine, T., S.V. Subramanian, and J.I. Levy, Sociodemographic and
geographic variability in smoking in the U.S.: a multilevel analysis of the 2006-
2007 Current Population Survey, Tobacco Use Supplement. Soc Sci Med, 2011.
73(5): p. 752-8.
44. Byers, T.E., et al., The impact of socioeconomic status on survival after cancer in
the United States : findings from the National Program of Cancer Registries
Patterns of Care Study. Cancer, 2008. 113(3): p. 582-91.
45. Bank, T.W. GDP per capita (current US$). 2014 April 10, 2014]; Available from:
http://data.worldbank.org/indicator/NY.GDP.PCAP.CD.
46. PA, G. Examining the cost and cost-effectiveness of adding bevacizumab to
carboplatin and paclitaxel in advanced non-small cell lung cancer. in American
Society of Clinical Oncology. 2006. Atlanta, GA.
47. Reck, M., et al., Phase III trial of cisplatin plus gemcitabine with either placebo or
bevacizumab as first-line therapy for nonsquamous non-small-cell lung cancer:
AVAil. J Clin Oncol, 2009. 27(8): p. 1227-34.

44
48. Patel J, S.M., Garon EB, et al., A randomized, open-label, phase 3, superiority
study of pemetrexed (Pem)+carboplatin (Cb)+bevacizumab (B) followed by
maintenance Pem+B versus paclitaxel (Pac)+Cb+B followed by maintenance B
in patients with stage IIIB or IV non-squamous non-small cell lung cancer. J Thor
Oncol, 2012. 7(15): p. S336-S338.
49. Lauro S, O.C., Righini R, Marchetti P, The Use of Bevacizumab in Non-Small
Cell Lung Cancer: An Update. Anticancer Research, 2014. 34: p. 1537-1546.
50. Keedy, V.L., et al., American Society of Clinical Oncology provisional clinical
opinion: epidermal growth factor receptor (EGFR) Mutation testing for patients
with advanced non-small-cell lung cancer considering first-line EGFR tyrosine
kinase inhibitor therapy. J Clin Oncol, 2011. 29(15): p. 2121-7.
51. Oncology, N.C.P.G.i., Non-Small Cell Lung Cancer. 2014.
52. Bajaj, P.S., et al., Targeted Erlotinib for First-Line Treatment of Advanced Non-
Small Cell Lung Cancer: A Budget Impact Analysis. J Med Econ, 2014.
53. Program, S. Characteristics of the SEER Population Compared With the Total
United States Population. 2014 April 12, 2014]; Available from:
http://seer.cancer.gov/registries/characteristics.html.
54. Society, A.C. Lung Cancer (Non-Small Cell). 2014 April 12, 2014]; Available
from: http://www.cancer.org/cancer/lungcancer-non-smallcell/detailedguide/non-
small-cell-lung-cancer-key-statistics.
55. Morgan, R.O., et al., The Medicare-HMO revolving door--the healthy go in and
the sick go out. N Engl J Med, 1997. 337(3): p. 169-75.
45
56. Ramsey, S.D., How should we pay the piper when he's calling the tune? On the
long-term affordability of cancer care in the United States. J Clin Oncol, 2007.
25(2): p. 175-9.

46
CHAPTER 2 ARE WE USING MOLECULARLY GUIDED THERAPY FOR LUNG CANCER IN ROUTINE CARE? ANALYSIS OF MEDICARE PATIENTS WITH STAGE IV NON-SMALL CELL LUNG CANCER (NSCLC)
Dorothy Romanus, Massachusetts General Hospital and Harvard University, Boston, MA
David Cutler, Harvard University, Cambridge, MA
Nancy Keating, Harvard Medical School, Boston, MA
Elizabeth Lamont, Harvard Medical School, Boston, MA
G. Scott Gazelle, Massachusetts General Hospital and Harvard Medical School, Boston, MA
Mary Beth Landrum, Harvard Medical School, Boston, MA

47
2.1 Abstract
Purpose
Patients who test positive for epidermal growth factor receptor (EGFR) somatic
alterations derive significant clinical benefits from erlotinib, but the extent to which
individual lung cancer patients undergo molecular testing in routine care is not known.
Prevalence and factors associated with testing in routine care were determined in
elderly patients with stage IV NSCLC from SEER-Medicare.
Patients and Methods
We identified patients with squamous- and non-squamous-cell diagnosis of Stage IV
NSCLC occurring between 2007 and 2009. The main outcome, molecular testing, was
identified with relevant medical billing codes. Multivariable logistic regression was used
to assess characteristics that independently determine the choice of molecular testing.
Results
Among 7,678 patients, only 4.9% underwent a molecular test. The strongest predictor
of molecular testing was treating physician affiliation with a NCI cancer center (adjusted
proportion: 9.9% at NCI cancer centers vs. 4.7% outside). Among the minority of
patients who were tested, molecular testing was independently associated with
phenotypic enrichment using known correlates of EGFR mutations (female gender, East
Asian origin, non-squamous-cell histology, no history of COPD which was a proxy for
being a non-smoker). Older age, enrollment in Medicaid, and admission to hospice
decreased the likelihood of testing but increased the probability of first-line erlotinib
48
therapy. Among the 6.5% of patients who were treated with first-line erlotinib, only 8.9%
of patients were tested prior to erlotinib initiation.
Conclusion
During the study period, the vast majority of lung cancer patients did not undergo
molecular testing in routine care. Actions towards population-wide dissemination of
molecular testing through provider education and payer mandates to submit molecular
test results prior to reimbursement for targeted therapies may encourage adoption of
these technologies.

49
2.2 Introduction
Treatment outcomes in advanced lung cancer have plateaued at a median
overall survival (OS) of 10 to 12 months with traditional chemotherapy combinations, but
targeted treatment innovations are changing the landscape of prognosis in lung cancer.
The burden of lung cancer is substantial. It is the leading cause of cancer related
mortality, representing 27% of all cancer deaths. In the United States alone,
approximately 160,000 patients will die from this disease in 2014.1 Evidence points to
significant clinical benefits from therapies that target molecular pathways in patients
who test positive for oncogenic driver mutations, but the extent to which individual lung
cancer patients undergo molecular testing in routine care is not known.2,3
Patients whose tumors are identified to carry epidermal growth factor receptor
(EGFR) somatic alterations and who are treated with erlotinib have shown remarkable
improvements in median progression free survival (PFS) compared to chemotherapy
alone, 9.4 vs. 5.2 months.2 On the other hand, controlled trial-based evidence
suggests that conventional chemotherapy confers better outcomes in patients with
EGFR wild type tumors compared to EGFR TKI therapy.3-6 EGFR gene mutations are
more prevalent in non-squamous tumors, women, patients of East Asian origin and in
those with no history of smoking.4 While phenotypic characteristics associated with
these gene mutations have been elucidated, these attributes do not adequately
discriminate between EGFR mutation positive and wild type tumors. There is a general
consensus that phenotypic characteristics should not be used to select or exclude
patients for treatment or molecular testing.4 By 2007, the National Comprehensive
Cancer Network (NCCN) Lung Cancer guidelines acknowledged the predictive value of

50
EGFR gene mutations for response to erlotinib.10 Beginning in 2010, guideline
recommendations endorsed population-wide molecular screening for EGFR gene
mutations in all advanced non-squamous, stage IV NSCLC cases to inform treatment
choices.4,7,8
In this analysis, our goal was to estimate the prevalence of molecular screening
in routine care and to assess factors that determine the choice to conduct molecular
testing in a nationally representative cohort of elderly patients with stage IV NSCLC.
2.3 Methods
2.3.1 Study Participants
We identified patients with pathologically confirmed squamous cell and non-
squamous cell incident diagnosis of Stage IV NSCLC occurring between January 1,
2007 and December 31, 2009. We used data from the National Cancer Institute’s
Surveillance, Epidemiology, and End Results (SEER) program linked to Medicare Part
A, B and D claims. The SEER program collects information from 17 cancer registries,
which cover approximately 28% of the US population.9
To ascertain comorbidity burden and pre-diagnosis medical costs at baseline and
to determine lung cancer treatment practice patterns after diagnosis, patients who were
continuously enrolled in Medicare Part A and B beginning eight months prior to
diagnosis and those who were also eligible for Parts A, B and D one year post diagnosis
were included. To ensure completeness of claim history, patients who were in a health
maintenance organization (HMO) plan at any point during the observation period were
excluded. In addition, patients were excluded if they had other concurrent cancers

51
diagnosed either before or after the index NSCLC diagnosis. In the primary analysis,
we compared patient groups according to whether or not they underwent a molecular
test after diagnosis and prior to treatment initiation (Figure 2.1). In a secondary
analysis in which we examined determinants of first-line therapy, we classified patients
into three groups based on first-line treatment initiation within 120 days of diagnosis: 1)
erlotinib group; 2) chemotherapy group, which comprised of patients who were treated
with chemotherapy, with or without bevacizumab; 3) remaining patients were
categorized to the best supportive care (BSC) group, if there was no evidence of
systemic therapy receipt (chemotherapy or targeted therapy) within 120 days from
diagnosis.
Figure 2.1. Flow diagram of study cohort
33 068 PaQents diagnosed with first and only cancer;
Stage IV NSCLC between 2007-‐2009
377 with a molecular test 7 301 with no molecular test
25 390 Excluded 6 420 Age at diagnosis <66 y 2 039 Not pathologically confirmed 5 340 Not enrolled in Medicare Part A and B 6 308 Enrolled in Medicare HMO 5 283 No Medicare Part D Coverage

52
2.3.2 Molecular Test Identification
During the observation period between 2007 and 2010, a unique Healthcare
Common Procedure Coding System (HCPCS) code to allow identification of EGFR
mutation testing did not exist. Instead, providers deferred to a ‘stacking’ method to bill
for EGFR gene mutation analysis using HCPCS codes that represented the steps and
techniques used in performing a molecular pathology test. We used the Genzyme
Genetics (the sole distributor of the commercial EGFR assay in 2010) test stack of
HCPCS codes to identify any claim in the outpatient file with at least one of these codes
(see Appendix). Even in 2010, the vast majority of laboratories (99%) were not
accredited by the Clinical Laboratory Improvement Amendments (CLIA) program to
conduct cytogenetic testing and ordered molecular testing through commercial
reference laboratories.10 Those that were accredited and conducted EGFR mutation
analysis with laboratory developed tests (LDTs) also used the ‘stacking’ method for
billing purposes with a combination of the HCPCs codes outlined in the
Appendix.(personal communication: J. Fahey, December 2013). We also flagged
HCPCS code 83912 (‘Interpretation and report’) in the physician claims file, as an
indicator of a molecular test. This code corresponds to the professional component of
the molecular test bill and appears in the physician file irrespective of whether the test
was conducted as part of an inpatient or an outpatient encounter. (personal
communication: J.Fahey, December 2013) Therefore, while a specific molecular test,
such as KRAS or EGFR gene mutation analysis, could not be identified in the claims
during the index period, performance of any molecular test was identifiable. The index
period for molecular test classification encompassed claims with dates ranging from 45
days prior to diagnosis through 30 days after the start of first line therapy, or 150 days
53
after diagnosis for patients who were managed with BSC. Both the index period and
the composition of our analytic cohort, which comprised newly diagnosed stage IV
NSCLC patients with lung cancer being the first and only cancer, mitigated
misclassification bias of a molecular test order for other conditions.
2.3.3 First-line Treatment Classification
We identified cancer directed systemic therapy use from Medicare claims.
Claims for individual drugs were flagged using HCPCS codes and National Drug Codes
(NDC) in the outpatient, physician, durable medical equipment and Medicare Part D
files using previously described methods.11,12 The date of the first systemic therapy
claim within 120 days from diagnosis was used to define the start date of first line
treatment.13
2.3.4 Patient and Practice Characteristics
We identified several potential factors that may impact decisions surrounding
molecular testing and first line treatment choice. These spanned phenotypic
characteristics that are correlated with presence of drug sensitizing EGFR gene
mutations in NSCLC - race, female gender, histology, and smoking history using
presence of COPD as a proxy indicator. Additional characteristics included: age;
ethnicity; comorbidity score; hospice enrollment after diagnosis; marital status; presence
of brain metastases; enrollment in Medicaid; sample acquisition method (histology,
cytology); urban residence; US Census tract level household income, college education;
year of diagnosis and SEER Region. 14 A proxy measure of poor performance status
(PS) prior to diagnosis was also included based on bills starting from 8 months prior to
diagnosis. Services typically associated with poor functional status were coded as
54
dummies (inpatient or skilled nursing facility stay, home health visit, use of home
oxygen, or ADL aids (any bill for equipment such as walkers, hospital beds,
wheelchairs), personal communication: E. Lamont, November, 2013).15 These
indicators were summed up as a count (0, 1, 2+) to derive the proxy PS index.
Furthermore, we summed up medical spending for the eight-month period prior to
diagnosis as another proxy indicator of health status (excluding 2 months most proximal
to diagnosis to exclude costs related to cancer diagnosis and staging). Practice
characteristics, namely National Cancer Institute (NCI) cancer center designation,
cooperative group affiliation, and hospital teaching status, were also included.
2.3.5 Statistical Methods
Bivariate analyses using the χ2 test were conducted to compare the distributions
in baseline characteristics according to molecular test status. Next, we used logistic
regression to identify patient and practice characteristics associated with a molecular
test order. Included in the model were variables with a p-value <0.20 on bivariate
testing. Marginal, adjusted probabilities were calculated for each variable in the
multivariable model. A parallel method was used to construct a multivariable model
using multinomial logistic regression to identify patient, disease and practice
characteristics associated with first line treatment (erlotinib, chemotherapy, BSC; see
Appendix). We also conducted survival analyses to explore the relationship between
time to hospice admission from initiation of first-line therapy and molecular testing.
Kaplan-Meier survival curves were generated and subgroups were compared using the
log rank test. All analyses were conducted using SAS, version 9.2.

55
2.4 Results
2.4.1 Baseline Characteristics
Among 7,678 incident cases diagnosed with Stage IV non-squamous and
squamous cell NSCLC between 2007 and 2009, who met our inclusion criteria (Figure
2.1), only 377 (4.9%) underwent a molecular test. Table 2.1 summarizes patient and
practice characteristics according to whether or not a molecular test was performed.
Among patients who were tested compared to those who were not, a higher proportion
were females (58.4% vs. 51.2%), of East Asian origin (11.4% vs. 7.2%), with no history
of COPD (a proxy indicator of smoking, 84.9% vs. 71.5%) and had non-squamous cell
tumors (88.6% vs. 76.3%). In addition, younger patients, those with no proxy indicators
of poor PS, and no comorbidities had a higher likelihood of being tested. Hospice
admission after diagnosis and enrollment in Medicaid were both associated with a lower
probability of a molecular test. Persons treated at NCI designated cancer centers and
at practices with a cooperative group affiliation were also more likely to undergo
molecular testing (10.1% vs. 2.0%, and 30.8% vs. 16.1%, respectively). A higher
proportion of patients who received any systemic cancer-directed therapy (7.8%)
underwent a molecular test compared to those managed with BSC (1.7%), but
unadjusted prevalence of testing was low across all treatment categories.

56
Table 2.1. Characteristics according to molecular testing status.
Characteristic* Molecular Test (n=377)
No Molecular Test (n=7,301)
Age at diagnosis, years 66-69 70-74 75-79 80-84
85+
107 (28.4) 104 (27.6) 90 (23.9) 59 (15.7) 17 (4.5)
1,636 (22.4) 1,950 (26.7) 1,697 (23.2) 1,257 (17.2) 761 (10.4)
Gender Female 220 (58.4) 3,737 (51.2) Race White
Black East Asian
Other
314 (83.3) 14 (3.7) 43 (11.4) 6 (1.6)
5,951 (81.5) 753 (10.3) 525 (7.2) 72 (1.0)
Ethnicity Hispanic 19 (5.0) 414 (5.7) Baseline PS indicator, count 0
1 2+
220 (58.4) 100 (26.5) 57 (15.1)
3,141 (43.0) 2,186 (29.9) 1,974 (27.0)
Marital Status Married 206 (54.6) 3,256 (44.6) Comorbidity Index 0
1 2
3+
262 (69.5) 59 (15.7) 28 (7.4) 28 (7.4)
4,210 (57.7) 1,314 (18.0) 682 (9.3)
1,095 (15.0) COPD Yes
No 57 (15.1)
320 (84.9) 2,079 (28.5) 5,222 (71.5)
Histology Non-squamous cell Squamous cell
334 (88.6) 43 (11.4)
5,573 (76.3) 1,728 (23.7)
Sample acquisition method Histology Cytology
309 (82.0) 68 (18.0)
5,440 (74.5) 1,861 (25.5)
Brain Metastases Present 69 (18.3) 1,296 (17.8) Hospice admission Yes 149 (39.5) 4,370 (59.9) Prior Year Medicaid Yes 72 (19.1) 2,617 (35.8) First-line Treatment Erlotinib 43 (11.4) 457 (6.3)
Chemotherapy with/without bevacizumab 270 (61.7) 3,244 (44.4) Best supportive care 64 (17.0) 3,600 (49.3)
Urban Residence Yes 355 (94.2) 6,299 (86.3) Cooperative Group affiliation Yes 116 (30.8) 1,175 (16.1) NCI Cancer Center Yes 38 (10.1) 146 (2.0) Teaching Hospital Yes 102 (27.1) 1,053 (14.4)
College education (census tract quintile) 1 (low) 2 3 4
5 (high)
34 (9.0) 58 (15.4) 80 (21.2) 77 (20.4)
128 (34.0)
1,733 (23.7) 1,551 (21.2) 1,354 (18.6) 1,350 (18.5) 1,309 (17.9)
Income (census tract quintile) 1 (low) 2 3 4
5 (high)
40 (10.6) 54 (14.3) 79 (21.0) 78 (20.7) 126 (33.4)
1,784 (24.4) 1,573 (21.5) 1,381 (18.9) 1,320 (18.1) 1,239 (17.0)
1-yr Cost pre diagnosis (quintile) 1 (low) 2 3 4
5 (high)
63 (16.7) 87 (23.1) 92 (24.4) 70 (18.6) 65 (17.2)
1,176 (16.1) 1,436 (19.7) 1,460 (20.0) 1,583 (21.7) 1,646 (22.5)
Year of diagnosis 2007 2008 2009
40 (10.6) 88 (23.3)
249 (66.1)
2,538 (34.8) 2,447 (33.5) 2,316 (31.7)
Region Northeast South
Midwest West
122 (32.4) 52 (13.8) 35 (9.3)
168 (44.6)
1,321 (18.1) 2,123 (29.1) 1,155 (15.8) 2,702 (37.0)

57
2.4.2 Predictors of Molecular Testing
Table 2.2 summarizes the significant characteristics, which determined the
decision to perform a molecular test. First, the strongest independent predictor of
molecular testing was affiliation with a NCI cancer center (adjusted proportion: 9.9% at
NCI cancer centers vs. 4.7% outside). Second, the multivariable prediction model
suggested that molecular testing was also associated with phenotypic enrichment using
known correlates of EGFR mutations. The adjusted predicted probabilities of
undergoing a molecular test by phenotype were: 5.5% for females vs. 4.3% for males;
3.3% for non-squamous cell vs. 2.3% for squamous cell histology; 8.0% for East Asian
vs. 3.1% for Black racial origin for example; and 5.3% for no COPD (a proxy indicator of
smoking status) vs. 3.4% for COPD, respectively (p-values <0.01). Notably among all
gender-race groups, East Asian, female patients had the highest probability of being
tested and also of initiating first-line erlotinib therapy (Figure 2.2). But, even among this
patient subgroup, the adjusted proportions with testing and TKI treatment were only
8.9% and 14.2%, respectively. As expected, histological tissue samples were
associated with a higher probability of molecular testing than cytological samples
(adjusted proportions: 5.4% vs. 3.4%).

58
Table 2.2. Predictors of molecular testing
Characteristic Odds Ratio (OR) 95% CI for OR P-value
Adjusted Probability of a
Molecular Test (%) Gender
Male Female
Reference 1.35
Reference 1.08, 1.69 <0.01
4.3 5.5
Age at diagnosis, years 66-69 70-74 75-79 80-84
85+
Reference 0.82 0.80 0.68 0.35
Reference 0.61, 1.11 0.59, 1.09 0.48, 0.96 0.20, 0.60
0.20 0.16 0.03
<0.01
6.1 5.3 4.6 4.0 3.4
Race White Black
East Asian Other
Reference 0.61 1.91 1.33
Reference 0.35, 1.08 1.28, 2.85 0.53, 3.37
0.10 <0.01
0.55
4.8 3.1 8.0 6.5
Baseline PS indicator 0 1
2+
Reference 0.82 0.70
Reference 0.63, 1.06 0.50, 0.96
0.13 0.03
5.4 4.8 3.7
Histology Non-squamous cell
Squamous cell Reference
0.47 Reference 0.34, 0.66 <0.01
3.3 2.3
COPD Yes No
Reference 1.71
Reference 1.26, 2.33 <0.01
3.4 5.3
Sample acquisition method Histology Cytology
Reference 0.58
Reference 0.43, 0.77 <0.01
5.4 3.4
Prior year, Medicaid Yes No
Reference 2.07
Reference 1.52, 2.82 <0.01
3.0 5.8
Income (census tract quintile) 1 (Low)
2 3 4
5 (High)
Reference 1.28 1.71 1.53 2.31
Reference 0.83, 1.97 1.13, 2.58 1.00, 2.34 1.53, 3.47
0.26 0.01
<0.05 <0.01
3.4 4.0 4.7 5.5 6.3
NCI Cancer Center No
Yes Reference
2.59 Reference 1.62, 4.12 <0.01
4.7 9.9
Cooperative Group Affiliation No
Yes Reference
1.39 Reference 1.05, 1.84 0.02
4.6 6.1
Hospice No
Yes Reference
0.49 Reference 0.39, 0.62 <0.01
6.5 3.6
Region Northeast
South Midwest
West
Reference 0.41 0.39 0.69
Reference 0.28, 0.59 0.26, 0.59 0.52, 0.91
<0.01 <0.01
0.01
7.0 3.3 3.1 5.3
Year of diagnosis 2007 2008 2009
Reference 2.44 7.03
Reference 1.66, 3.59 4.97, 9.95
<0.01 <0.01
1.6 3.7 9.0
59
Patient characteristics that are not correlated with EGFR mutation status, namely
younger age and better baseline PS, also affected the likelihood of molecular testing.
For example, the youngest patients in our cohort (aged 66 to 69 years) were more likely
to have a molecular test (6.1%) compared to the age group 80 to 84 years (4.0%).
Interestingly, an opposite relationship emerged between age and the likelihood of
receipt of first-line erlotinib (Figure 2.2). Older age was associated with a higher
probability of treatment with the oral TKI (adjusted proportion: 3.8% for age group 66 to
69 years vs. 9.0% for age group 80 to 84 years). Persons with no indicators of a poor
PS had a 5.4% adjusted probability of testing compared to 3.7% in those with 2 or more
indicators of poor PS. Controlling for age, indicators of a poor PS, and other significant
characteristics, admission to a hospice after diagnosis of NSCLC was a strong
determinant of both molecular testing and initiation of first-line erlotinib therapy.
Patients who enrolled in hospice care had a significantly lower likelihood of undergoing
molecular testing (adjusted proportion: 3.6% with vs. 6.5% without hospice admission,
p-value <0.01), but a significantly higher likelihood of initiating first-line erlotinib therapy
(7.2% with vs. 5.6% without hospice admission, p-value <0.01).
NCI Cancer Center designation notwithstanding, other practice characteristics
that independently determined testing included Medicaid enrollment and cooperative
group affiliation. Notably, Medicaid enrollment was a negative independent predictor of
molecular testing (adjusted proportion: 3.0% with Medicaid vs. 5.8% without), but it was
a positive predictor of first-line erlotinib therapy (adjusted proportion: 7.4% with
Medicaid vs. 6.1% without, Figure 2.2).

60
Figure 2.2. Adjusted relationships between patient and practice characteristics and receipt of first-line erlotinib therapy (yello bars) and undergoing a molecular test (blue bars) for Stage IV NSCLC. Proportions are the average predicted probabilities adjusted for other covariates in regression models (Table 2.2 and Appendix).
0% 2% 4% 6% 8% 10% 12% 14% 16%
East Asian/Female
East Asian/Male
White/Female
Black/Female
White/Male
Black/Male
0% 2% 4% 6% 8% 10% 12% 14% 16%
Squamous Cell
Non-‐squamous Cell
COPD
No COPD
0% 2% 4% 6% 8% 10% 12% 14% 16%
85+
80-‐84
75-‐79
70-‐74
66-‐69
adjusted proporQon receiving intervenQon
0% 2% 4% 6% 8% 10% 12% 14% 16%
NCI Cancer Center
non-‐NCI Cancer Center
CooperaQve Group
non-‐CooperaQve Group
Medicaid
No Medicaid
adjusted proporQon receiving intervenQon
1st-‐line Erlo-nib MolecularTest
61
Likewise, more patients treated at practices with a cooperative group affiliation
underwent molecular testing (adjusted proportion: 6.1% vs. 4.6%), but fewer were
treated with first-line erlotinib (adjusted proportion: 6.8% vs. 7.2%) compared to patients
from other centers. Furthermore, some regions appeared to be earlier adopters of
molecular testing in lung cancer, albeit the rates of utilization were low across all
regions. For instance, in the Northeast, which ranked highest in molecular test
adoption rates, the adjusted proportion was only 7.0%. Although we did observe a
significant time trend for molecular testing after controlling for other predictors, still only
9.0% of patients were tested in 2009, from a low of 1.6% in 2007.
Given that hospice admission emerged as a significant indicator of both
molecular testing and of first-line erlotinib therapy initiation, we explored the association
between the start of treatment and time to admission to a hospice and according to
whether or not molecular testing was performed (Figure 2.3). Among patients who
received hospice care, the median time to hospice admission was 3.3 months after start
of first-line erlotinib and 6.6 months after initiation of chemotherapy-based treatment (p-
value<0.0001). The median time to hospice admission from start of first-line erlotinib
was 3.2 months among persons who did not undergo molecular testing (n=310) and 8.9
months among those who were tested (n=20), p-value=0.03. Twenty-five percent of
patients who did not have molecular testing were admitted to a hospice approximately
within one month (35 days) after starting first-line erlotinib compared to 2.8 months if
they were tested (Figure 2.3).
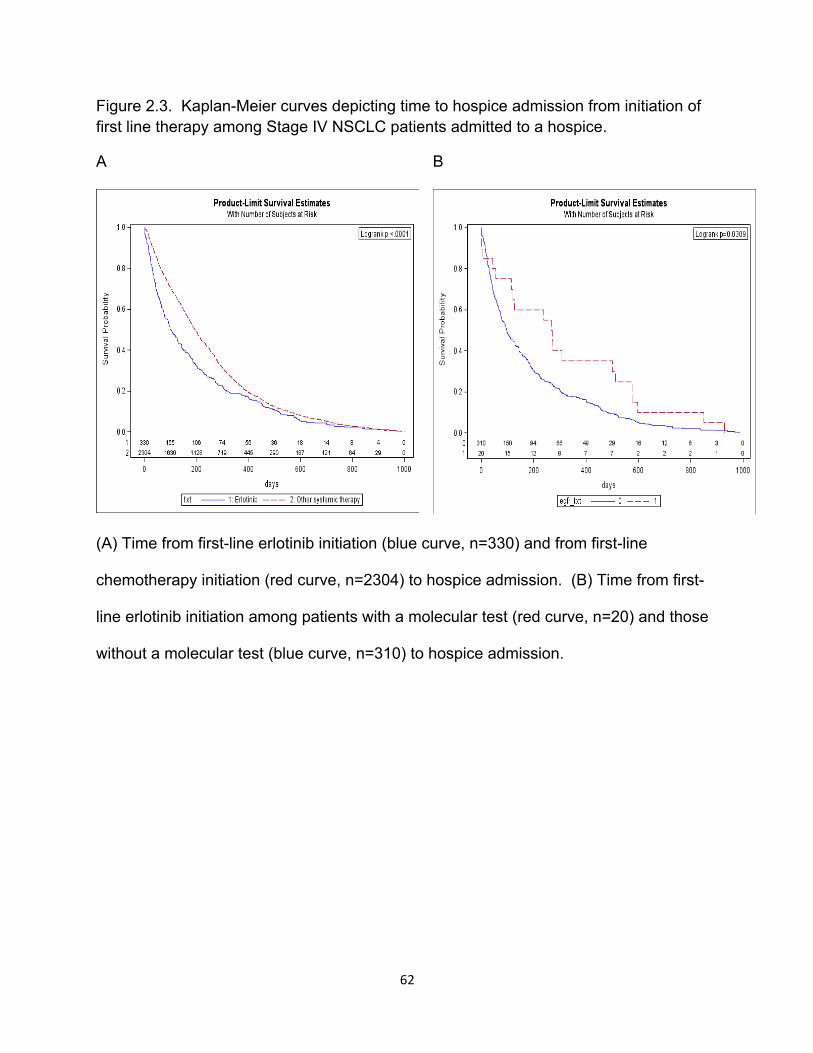
62
Figure 2.3. Kaplan-Meier curves depicting time to hospice admission from initiation of first line therapy among Stage IV NSCLC patients admitted to a hospice.
A B
(A) Time from first-line erlotinib initiation (blue curve, n=330) and from first-line
chemotherapy initiation (red curve, n=2304) to hospice admission. (B) Time from first-
line erlotinib initiation among patients with a molecular test (red curve, n=20) and those
without a molecular test (blue curve, n=310) to hospice admission.

63
2.5 Discussion
Molecularly guided therapy has revolutionized the prognosis of lung cancer.
Using the SEER-Medicare linked data, we evaluated practice patterns of molecular
testing in routine care among patients with stage IV NSCLC diagnosed between 2007
and 2009. In our population-based study, only 4.9% of eligible patients underwent
molecular testing. The determination to conduct molecular testing was influenced by
phenotypic characteristics that are correlated with EGFR mutations, younger age, and
better performance status. Patients enrolled in Medicaid and those admitted to hospice
after diagnosis were significantly less likely to undergo molecular testing, but had a
higher likelihood of initiating first-line erlotinib therapy. The strongest predictor of having
a molecular test was receipt of care at an NCI designated cancer center.
Corroborating evidence of the underuse of predictive biomarker screening in lung
cancer comes from a hospital-level analysis by Lynch et al.10 In that paper, the authors
estimated that in 2010, only 12% of US acute care hospitals ordered an EGFR assay,
which represented 5.7% of newly diagnosed lung cancer patients. From our analysis of
individual patients, the adjusted proportion of patients diagnosed in 2009 who had any
type of molecular test was 9.0%. This estimate may include non-EGFR molecular tests,
such as KRAS gene mutation testing. Still, it appears that molecular testing is
performed in a minority of patients who are treated in routine care. Even at centers of
excellence, the NCI cancer centers, the adjusted proportion of patients who were tested
was only 9.9%. These findings call for a closer examination of the barriers to
dissemination of molecular testing. For example, new evidence suggests that
64
physicians may have a low confidence in genomic knowledge.16 These knowledge
gaps may signal important patient-access barriers at the provider level.
Our results further indicate that in routine care clinical enrichment criteria were
used to select patients for molecular testing. All clinical characteristics associated with
EGFR mutations (female gender, smoking history, East Asian race) were independent
predictors of molecular testing. Such clinical enrichment practices do not have
adequate discriminatory power as a pre-screening tool.4 One study reported that
basing molecular screening on clinical enrichment criteria may lead to undiagnosing
over half of patients who carry drug sensitizing mutations.17 With the advent of
multiplexed test platforms, population-wide screening for predictive biomarkers in lung
cancer followed by molecularly guided therapy is a cost effective approach
(D.Romanus, Cost-Effectiveness of Multiplexed Predictive Biomarker Screening in Non-
Small Cell Lung Cancer. Manuscript submitted for publication). At the payer level,
payment for targeted therapies with identifiable predictive molecular markers could be
made contingent on evidence of test results to encourage molecularly guided therapy.
First-line therapy with erlotinib in patients harboring EGFR sensitizing mutations
is the accepted standard of care.7,18 Utilization of first-line TKI therapy in unselected
patients is controversial.3 In our analysis, only 8.6% of patients had a molecular test
prior to initiation of first-line erlotinib. Among patients on first-line erlotinib, 66% were
admitted to a hospice. In unselected patients, the median time to hospice admission
was 3 months and a quarter of patients were admitted within approximately one month
from initiation of first-line erlotinib. First-line treatment with erlotinib in unselected

65
patients and its value in the setting of an imminent hospice admission warrant closer
examination in future research.
Several limitations need to be taken into account when interpreting our results.
We were unable to categorize tests by specific molecular markers due to the lack of
billing codes that would identify each genetic mutation tested. We flagged any code
that was part of the stack of codes used for billing for an EGFR gene mutation test
during the period we analyzed to indicate that a molecular test was conducted. Even if
our estimates represent the upper bound of EGFR mutation testing to inform first line
therapy, our results suggest a gross underutilization of molecularly guided therapy. This
analysis was based on a cohort of elderly patients with fee-for-service (FFS) and
Medicare Part D benefits. While two-thirds of lung cancer patients are older than 65 at
time of diagnosis, beneficiaries of FFS and Medicare D coverage may differ
systematically from those in Medicare Advantage.19,20
Using the most recent SEER-Medicare data, we found that molecularly guided
therapy was underutilized in routine care of patients diagnosed with advanced NSCLC
between 2007 and 2009. The minority of patients who did undergo molecular testing
(4.9%) appeared to be selected for testing based on clinical enrichment criteria and
nonmedical factors, such as practice setting and socioeconomic status. Actions
towards population-wide dissemination of molecular testing through provider education
and payer mandates to submit molecular test results prior to reimbursement for targeted
therapies may encourage adoption of these technologies. Future studies should be
conducted to evaluate the impact of recent guideline recommendations for population-

66
wide EGFR mutation screening on the dissemination of genomic testing and molecularly
guided therapy.4,7

67
2.6 References
1. Society AC: What are the key statistics about lung cancer?,
2. Rosell R, Carcereny E, Gervais R, et al: Erlotinib versus standard
chemotherapy as first-line treatment for European patients with advanced EGFR
mutation-positive non-small-cell lung cancer (EURTAC): a multicentre, open-label,
randomised phase 3 trial. Lancet Oncol 13:239-46, 2012
3. Mok TS, Wu YL, Thongprasert S, et al: Gefitinib or carboplatin-paclitaxel
in pulmonary adenocarcinoma. N Engl J Med 361:947-57, 2009
4. Lindeman NI, Cagle PT, Beasley MB, et al: Molecular testing guideline for
selection of lung cancer patients for EGFR and ALK tyrosine kinase inhibitors: guideline
from the College of American Pathologists, International Association for the Study of
Lung Cancer, and Association for Molecular Pathology. J Thorac Oncol 8:823-59, 2013
5. Maemondo M, Inoue A, Kobayashi K, et al: Gefitinib or chemotherapy for
non-small-cell lung cancer with mutated EGFR. N Engl J Med 362:2380-8, 2010
6. Mitsudomi T: Erlotinib, gefitinib, or chemotherapy for EGFR mutation-
positive lung cancer? Lancet Oncol 12:710-1, 2011
7. Network NCC: NCCN Clinical Practice Guidelines in Oncology - Non-
Small Cell Lung Cancer, 2013
8. Keedy VL, Temin S, Somerfield MR, et al: American Society of Clinical
Oncology provisional clinical opinion: epidermal growth factor receptor (EGFR) Mutation
testing for patients with advanced non-small-cell lung cancer considering first-line EGFR
tyrosine kinase inhibitor therapy. J Clin Oncol 29:2121-7, 2011
68
9. SEER-Medicare Linked Database. Health Services and Economics
Branch, Division of Cancer Control and Population Sciences, National Cancer Institute,
U.S. National Institutes of Health,
10. Lynch JA, Khoury MJ, Borzecki A, et al: Utilization of epidermal growth
factor receptor (EGFR) testing in the United States: a case study of T3 translational
research. Genet Med 15:630-8, 2013
11. Warren JL, Harlan LC, Fahey A, et al: Utility of the SEER-Medicare data to
identify chemotherapy use. Med Care 40:IV-55-61, 2002
12. Lamont EB, Herndon JE, 2nd, Weeks JC, et al: Criterion validity of
Medicare chemotherapy claims in Cancer and Leukemia Group B breast and lung
cancer trial participants. J Natl Cancer Inst 97:1080-3, 2005
13. Zhu J, Sharma DB, Gray SW, et al: Carboplatin and paclitaxel with vs
without bevacizumab in older patients with advanced non-small cell lung cancer. JAMA
307:1593-601, 2012
14. Gagne JJ, Glynn RJ, Avorn J, et al: A combined comorbidity score
predicted mortality in elderly patients better than existing scores. J Clin Epidemiol
64:749-59, 2011
15. Davidoff AJ, Zuckerman IH, Pandya N, et al: A novel approach to improve
health status measurement in observational claims-based studies of cancer treatment
and outcomes. J Geriatr Oncol 4:157-65, 2013
16. Gray SW, Hicks-Courant K, Cronin A, et al: Physicians' attitudes about
multiplex tumor genomic testing. J Clin Oncol 32:1317-23, 2014
69
17. Atherly AJ, Camidge DR: The cost-effectiveness of screening lung cancer
patients for targeted drug sensitivity markers. Br J Cancer 106:1100-6, 2012
18. Mok T, Yang JJ, Lam KC: Treating patients with EGFR-sensitizing
mutations: first line or second line--is there a difference? J Clin Oncol 31:1081-8, 2013
19. Morgan RO, Virnig BA, DeVito CA, et al: The Medicare-HMO revolving
door--the healthy go in and the sick go out. N Engl J Med 337:169-75, 1997
20. Riley GF, Potosky AL, Klabunde CN, et al: Stage at diagnosis and
treatment patterns among older women with breast cancer: an HMO and fee-for-service
comparison. JAMA 281:720-6, 1999

70
2.7 Appendix
Table 2.A.1. Codes Used in Defining Molecular Tests.
CARRIER CLAIMS
83912 MOLECULAR DIAGNOSTICS; INTERPRETATION AND REPORT
OUTPATIENT CLAIMS
83890 MOLECULAR DIAGNOSTICS; MOLECULAR ISOLATION OR EXTRACTION, EACH NUCLEIC ACID TYPE (IE, DNA OR RNA)
83891 MOLECULAR DIAGNOSTICS; ISOLATION OR EXTRACTION OF HIGHLY PURIFIED NUCLEIC ACID, EACH NUCLEIC ACID TYPE (IE, DNA OR RNA)
83892 MOLECULAR DIAGNOSTICS; ENZYMATIC DIGESTION, EACH ENZYME TREATMENT
83894 MOLECULAR DIAGNOSTICS; SEPARATION BY GEL ELECTROPHORESIS (EG, AGAROSE, POLYACRYLAMIDE), EACH NUCLEIC ACID PREPARATION
83896 MOLECULAR DIAGNOSTICS; NUCLEIC ACID PROBE, EACH
83898 MOLECULAR DIAGNOSTICS; AMPLIFICATION, TARGET, EACH NUCLEIC ACID SEQUENCE
83900 MOLECULAR DIAGNOSTICS; AMPLIFICATION, TARGET, MULTIPLEX, FIRST 2 NUCLEIC ACID SEQUENCES
83901 MOLECULAR DIAGNOSTICS; AMPLIFICATION, TARGET, MULTIPLEX, EACH ADDITIONAL NUCLEIC ACID SEQUENCE BEYOND 2 (LIST SEPARATELY IN ADDITION TO CODE FOR PRIMARY PROCEDURE)
83902 MOLECULAR DIAGNOSTICS; REVERSE TRANSCRIPTION
83903 MOLECULAR DIAGNOSTICS; MUTATION SCANNING, BY PHYSICAL PROPERTIES (EG, SINGLE STRAND CONFORMATIONAL POLYMORPHISMS [SSCP], HETERODUPLEX, DENATURING GRADIENT GEL ELECTROPHORESIS [DGGE], RNA’ASE A), SINGLE SEGMENT, EACH
83904 MOLECULAR DIAGNOSTICS; MUTATION IDENTIFICATION BY SEQUENCING, SINGLE SEGMENT, EACH SEGMENT
83907 MOLECULAR DIAGNOSTICS; LYSIS OF CELLS PRIOR TO NUCLEIC ACID EXTRACTION (EG, STOOL SPECIMENS, PARAFFIN EMBEDDED TISSUE), EACH SPECIMEN
83909 MOLECULAR DIAGNOSTICS; SEPARATION AND IDENTIFICATION BY HIGH RESOLUTION TECHNIQUE (EG, CAPILLARY ELECTROPHORESIS), EACH NUCLEIC ACID PREPARATION
83914 MUTATION IDENTIFICATION BY ENZYMATIC LIGATION OR PRIMER EXTENSION, SINGLE SEGMENT, EACH SEGMENT (EG, OLIGONUCLEOTIDE LIGATION ASSAY [OLA], SINGLE BASE CHAIN EXTENSION [SBCE], OR ALLELE-‐SPECIFIC PRIMER EXTENSION [ASPE])
83912 MOLECULAR DIAGNOSTICS; INTERPRETATION AND REPORT
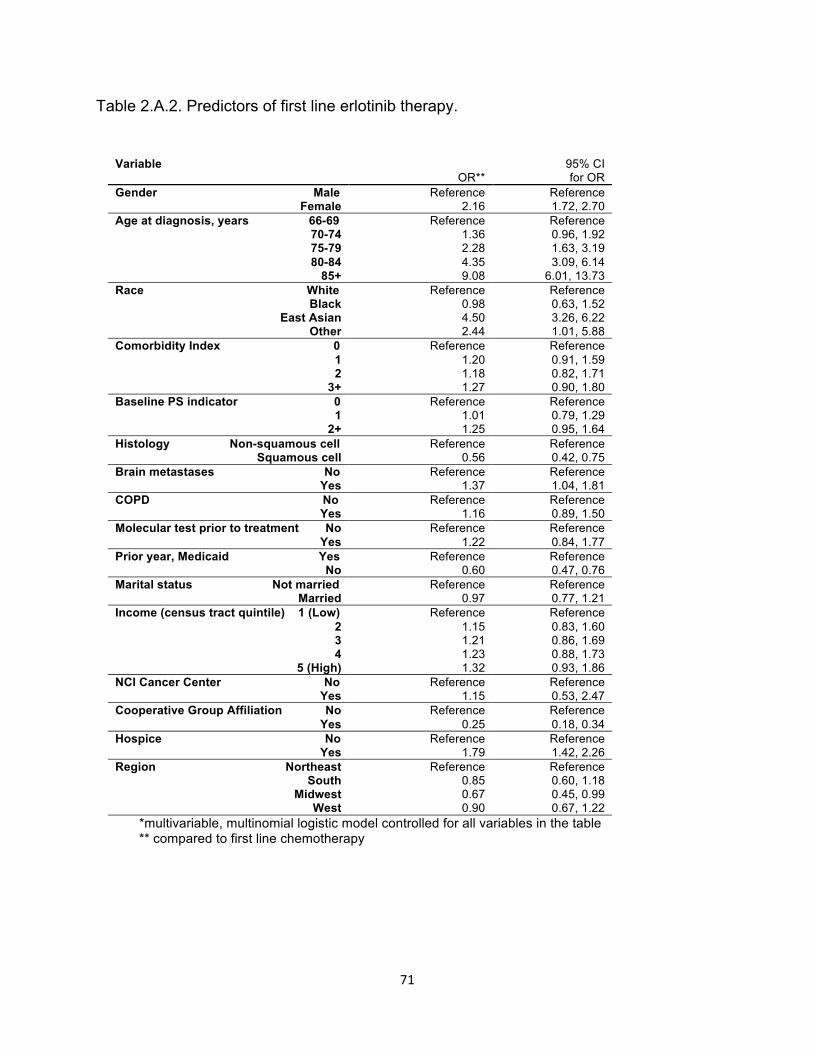
71
Table 2.A.2. Predictors of first line erlotinib therapy.
Variable OR**
95% CI for OR
Gender Male Female
Reference 2.16
Reference 1.72, 2.70
Age at diagnosis, years 66-69 70-74 75-79 80-84
85+
Reference 1.36 2.28 4.35 9.08
Reference 0.96, 1.92 1.63, 3.19 3.09, 6.14
6.01, 13.73 Race White
Black East Asian
Other
Reference 0.98 4.50 2.44
Reference 0.63, 1.52 3.26, 6.22 1.01, 5.88
Comorbidity Index 0 1 2
3+
Reference 1.20 1.18 1.27
Reference 0.91, 1.59 0.82, 1.71 0.90, 1.80
Baseline PS indicator 0 1
2+
Reference 1.01 1.25
Reference 0.79, 1.29 0.95, 1.64
Histology Non-squamous cell Squamous cell
Reference 0.56
Reference 0.42, 0.75
Brain metastases No Yes
Reference 1.37
Reference 1.04, 1.81
COPD No Yes
Reference 1.16
Reference 0.89, 1.50
Molecular test prior to treatment No Yes
Reference 1.22
Reference 0.84, 1.77
Prior year, Medicaid Yes No
Reference 0.60
Reference 0.47, 0.76
Marital status Not married Married
Reference 0.97
Reference 0.77, 1.21
Income (census tract quintile) 1 (Low) 2 3 4
5 (High)
Reference 1.15 1.21 1.23 1.32
Reference 0.83, 1.60 0.86, 1.69 0.88, 1.73 0.93, 1.86
NCI Cancer Center No Yes
Reference 1.15
Reference 0.53, 2.47
Cooperative Group Affiliation No Yes
Reference 0.25
Reference 0.18, 0.34
Hospice No Yes
Reference 1.79
Reference 1.42, 2.26
Region Northeast South
Midwest West
Reference 0.85 0.67 0.90
Reference 0.60, 1.18 0.45, 0.99 0.67, 1.22
*multivariable, multinomial logistic model controlled for all variables in the table** compared to first line chemotherapy
72
CHAPTER 3 COST-EFFECTIVENESS OF MULTIPLEXED PREDICTIVE BIOMARKER SCREENING IN NON-SMALL CELL LUNG CANCER
Dorothy Romanus, Massachusetts General Hospital and Harvard University, Boston, MA
Stephanie Cardarella, Dana-‐Farber Cancer Institute and Harvard Medical School, Boston, MA
David Cutler, Harvard University, Cambridge, MA
Mary Beth Landrum, Harvard Medical School, Boston, MA
Neal Lindeman, Brigham and Women’s Hospital and Harvard Medical School, Boston, MA
G. Scott Gazelle, Massachusetts General Hospital and Harvard Medical School, Boston, MA
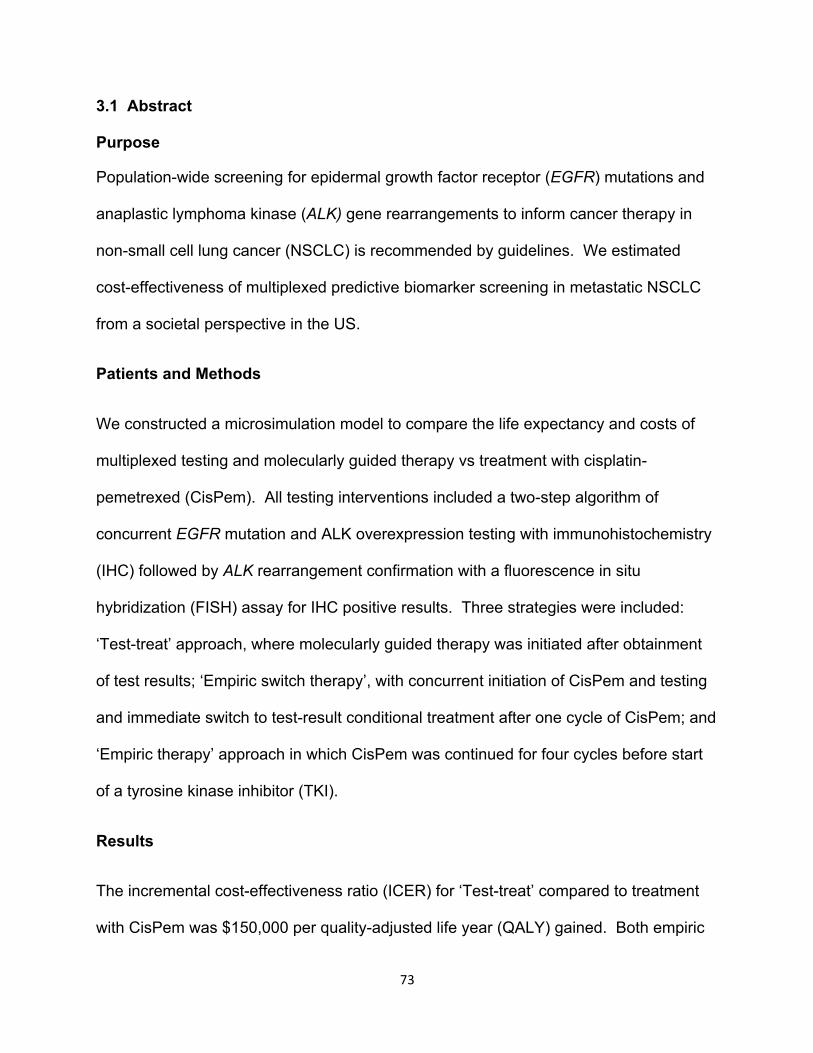
73
3.1 Abstract
Purpose
Population-wide screening for epidermal growth factor receptor (EGFR) mutations and
anaplastic lymphoma kinase (ALK) gene rearrangements to inform cancer therapy in
non-small cell lung cancer (NSCLC) is recommended by guidelines. We estimated
cost-effectiveness of multiplexed predictive biomarker screening in metastatic NSCLC
from a societal perspective in the US.
Patients and Methods
We constructed a microsimulation model to compare the life expectancy and costs of
multiplexed testing and molecularly guided therapy vs treatment with cisplatin-
pemetrexed (CisPem). All testing interventions included a two-step algorithm of
concurrent EGFR mutation and ALK overexpression testing with immunohistochemistry
(IHC) followed by ALK rearrangement confirmation with a fluorescence in situ
hybridization (FISH) assay for IHC positive results. Three strategies were included:
‘Test-treat’ approach, where molecularly guided therapy was initiated after obtainment
of test results; ‘Empiric switch therapy’, with concurrent initiation of CisPem and testing
and immediate switch to test-result conditional treatment after one cycle of CisPem; and
‘Empiric therapy’ approach in which CisPem was continued for four cycles before start
of a tyrosine kinase inhibitor (TKI).
Results
The incremental cost-effectiveness ratio (ICER) for ‘Test-treat’ compared to treatment
with CisPem was $150,000 per quality-adjusted life year (QALY) gained. Both empiric

74
treatment approaches had less favorable ICERs. ‘Test-treat’ and ‘Empiric switch
therapy’ yielded higher expected outcomes in terms of QALYs and life-years (LYs) than
‘Empiric therapy’. These results were robust across plausible ranges of model inputs.
Conclusion
From a societal perspective, our cost-effectiveness results support the value of
multiplexed genetic screening and molecularly guided therapy in metastatic NSCLC.
75
3.2 Introduction
The expansion of targeted therapeutic options for metastatic NSCLC is a
welcome advance in a disease that historically has been resistant to treatment. Of the
estimated 230,000 incident lung cancer cases annually, approximately 85% are
diagnosed with NSCLC.[1, 2] Most patients present with advanced disease, and
adenocarcinoma is the most common histologic subtype. [2] Somatic mutations in
EGFR and ALK gene rearrangements are found in 9.5% and 3.9% of unselected
NSCLCs, respectively.[3] Patients whose tumors carry a sensitizing mutation of EGFR
or ALK gene rearrangements experience higher response rates, longer progression-free
survival (PFS), and improved quality of life when treated with a TKI compared to
platinum-based doublet chemotherapy.[6-7] Guidelines recommend the ascertainment
of EGFR and ALK mutational status to help guide first-line systemic therapy in all
patients with non-squamous, advanced NSCLC.[8] According to these
recommendations, over 130,000 newly diagnosed NSCLC patients each year should
undergo predictive biomarker screening.[9] But, biomarker screening appears to be
underutilized in routine care. Only 12% of acute-care hospitals in the US used the
EGFR assay in 2010, which represented only 5.7% of guideline-directed patients. [8, 9]
Even among patients whose tumors are tested for predictive biomarkers,
uncertainty surrounding the optimal timing of TKI therapy initiation adds to the
complexity of treatment decision-making.[10] The time required to perform molecular
tests with sufficient tissue for analysis may tip the scale towards commencing empiric
treatment with chemotherapy. Once test results reveal the presence of an actionable
mutation after empiric therapy is begun, indirect evidence suggests that continuation of

76
chemotherapy for four to six cycles before switching to a TKI may optimize
outcomes.[10, 11] In the present analysis, we compared a number of TKI initiation
strategies.
Additionally, turn-around-time (TAT), the time from tissue sample acquisition to
reporting of test results, and tissue sample adequacy are important considerations in
patients with metastatic NSCLC. Multiplex detection of mutations has the advantage of
tissue preservation and faster TAT. To date, economic analyses of screening for drug
sensitivity biomarkers in lung cancer have restricted their focus on single
biomarkers.[12-21] We examined two molecular markers, EGFR mutations and ALK
rearrangements, for which the evidence is sufficiently mature to support population-wide
screening.[8] The goal of this paper was to assess the cost-effectiveness of multiplexed
predictive biomarker screening from a societal perspective in patients newly diagnosed
with metastatic NSCLC living in the US.
3.3 Methods
3.3.1. Model and Treatment Strategies
We constructed a microsimulation, state-transition model to estimate the life
expectancy and costs of four strategies: a ‘No Test’ approach, treatment with cisplatin-
pemetrexed chemotherapy and no biomarker testing; two different empiric treatment
strategies in which cisplatin-pemetrexed was initiated with concurrent biomarker testing.
In one, the ‘Empiric therapy’ strategy, chemotherapy was continued for four cycles
followed by TKI maintenance treatment in mutation-positive patients. In the other, the
‘Empiric switch therapy’, patients initiated first-line chemotherapy and those with

77
mutation positive tumors switched to a TKI immediately upon return of test results; and
finally, the ‘Test-treat’ strategy, in which treatment was initiated only after results of
testing became available. The simulated study population comprised of newly
diagnosed stage IV NSCLC patients with non-squamous histology.
Figure 3.1 depicts the structure of the model. For all testing strategies, patients
entered the model in the prescreen state on the day the test was ordered. If the sample
was suitable for testing, the patient transitioned to the test sequence health states. With
a daily cycle length, we were able to model wait times for test results prior to initiation of
therapy. Patients with insufficient tumor samples from initial diagnostic samples
transitioned to the rebiopsy prescreen state to account for elapsed time in determining
appropriateness for a rebiopsy and for performing the procedure. Patients who did not
undergo a rebiopsy, or whose rebiopsy samples were inadequate for testing,
transitioned to the treatment states. Multiplexed molecular testing proceeded according
to a two-step test sequence: concurrent EGFR mutation and ALK overexpression
assays followed by ALK FISH confirmation for ALK IHC positive results (1+, 2+, or
3+).[8] Mortality risk in the above health states was modeled based on the natural
history of advanced NSCLC for the ‘Test-treat’ approach, and first-line cisplatin-
pemetrexed therapy for the empiric treatment strategies.
Patients in the ‘No test’ strategy entered the model in the first-line cisplatin-
pemetrexed treatment state (Figure 3.1). Upon progression on each therapy, patients
transitioned to the next line of therapy based on treatment conditional disease risk of
progression. Treatment sequences for the other strategies (Table 3.1) followed the
same model structure.

78
Figure 3.1. Model structure depicting health states and transitions.
Maint. Pem
1st line Cis/Pem
2nd line Docetax
3rd line Erlotinib
No Test Strategy Treatment Scenario
Dead
Test Sequence
EGFR/ALK IHC test
Dead
ALK FISH Test
for IHC +
Treatment
Model entry Transition between states
Pre-test States
Prescreen
Rebiopsy prescreen
Test sequence
Dead
Treatment Rebiopsy
Treatment
4th line BSC
No#Test#Strategy#
Test#Strategy#
Adequate#1ssue#
Inadequate#1ssue#
Inadequate#1ssue#
Adequate#1ssue#

79
Table 3.1 Strategies.
*CisPem therapy was administered for up to 4 cycles; upon progression on CisPem,patients transitioned to the next line of therapy †TKI maintenance treatment was initiated in presence of drug-sensitizing mutations upon completion of 4 cycles of CisPem ¶Patients with drug-sensitizing mutations switched to a TKI at time of test results after receiving one cycle of empiric CisPem therapy
Abbreviations: CisPem, cisplatin and pemetrexed doublet; Pem, pemetrexed; DTX, docetaxel; Erlot, erlotinib; BSC, best supportive care; Criz, crizotinib; ALK, anaplastic lymphoma kinase; IHC, immunohistochemistry; FISH, fluorescence in situ hybridization;
For the main analysis, we chose a time horizon of two years to capture the major
health and economic consequences in metastatic NSCLC. This duration obviated the
need for projecting survival outcomes beyond the primary clinical trial data.[22] Benefits
Strategy Test Treatment
No test None CisPem* ► Pem ► DTX ► Erlot ►BSC
Empiric therapy†
EGFR/ALK IHC ► ALK FISH for ALK IHC 1-3+
Empiric CisPem x 4 cycles ► test result conditional treatment: EGFR +: Erlot ► DTX ► BSC ALK +: Criz ► DTX ► BSC Other: CisPem* ► Pem ► DTX ► Erlot ►BSC
Empiric- switch therapy¶
EGFR/ALK IHC ► ALK FISH for ALK IHC 1-3+
Empiric CisPem x 1 cycle ► test result ► test result conditional treatment: EGFR +: Erlot ► CisPem* ► DTX ► BSC ALK +: Criz ► CisPem* ► DTX ► BSC Other: CisPem* ► Pem ► DTX ► Erlot ►BSC
Test-treat
EGFR/ALK IHC ► ALK FISH for ALK IHC 1-3+
EGFR +: Erlot ► CisPem* ► DTX ►BSC ALK +: Criz ► CisPem* ► DTX ►BSC Other: CisPem* ► Pem ► DTX ►Erlot ► BSC
80
and costs were discounted at 3% per annum. Analyses were performed in TreeAge Pro
2013 (TreeAge Software, Inc.; Williamstown, MA).
3.3.2. Natural History
We used data from Surveillance, Epidemiology, and End Results (SEER)-
Medicare to model the natural history of untreated, metastatic NSCLC for simulated
patients who were awaiting molecular test results. Predicted probabilities from a Cox
proportional hazards (PH) model for incident SEER cases with Stage IV NSCLC and a
pathologic diagnosis of non-squamous histology, aged 66-69 years old with diagnoses
between 2007 and 2009, who were managed with BSC were generated. The model
was weighted using the inverse conditional probability of exposure to chemotherapy to
balance observable covariates between treatment naïve and chemotherapy treated
patients. Time dependent transitional probabilities for the simulation model were
calibrated to the predicted survival probabilities from the Cox PH model using a
piecewise-exponential approach.
3.3.3. Clinical Outcomes
Randomized trials (RCTs) for initiation and maintenance therapy with erlotinib
and crizotinib in EGFR mutation and ALK rearrangement positive patients, respectively,
were identified for calculating treatment-conditional progression and survival estimates.
Efficacy data for other therapies were pulled from RCTs that enrolled molecularly
unselected patients. The trial-based median estimates for treatment-specific overall
survival (OS) and PFS were used as calibration targets. Transition probabilities were
calculated using a constant hazard assumption.
81
3.3.4. Quality of Life
We estimated utilities based on a mixed model, which included parameters for
best tumor response and toxicities commonly encountered with chemotherapy
treatments in NSCLC (neutropenia, febrile neutropenia, fatigue, diarrhea, nausea and
vomiting, rash and hair loss).[23] We used rates for best tumor response, and grade 3
and 4 adverse drug events (ADEs) from RCTs to calculate treatment-specific utilities
based on the mixed model (Table 3.2).[23] Disutilities for ADEs were incorporated in
the first month of therapy.[14, 24]
3.3.5. Genomic Markers
Prevalence rates of biomarkers were drawn from a population-based registry
(Table 3.2) of 10,000 NSCLC patients who were enrolled for routine screening of
predictive biomarkers.[3] The cumulative TAT for test results is congruent with
guidelines, which recommend that EGFR and ALK testing both be completed within 10
working days of receiving the specimen in the laboratory.[8]
We estimated that 30% of patients would undergo a rebiopsy and 85% of repeat
biopsies would yield adequate samples for molecular testing.[13] The distribution of
repeat biopsy techniques (bronchoscopic, or transthoracic needle aspiration of primary
cancer, and metastatic site needle aspirations) and pneumothorax complication rates
were based on a prior analysis.[13]
We used ALK FISH positivity as the reference standard for presence of ALK
rearrangements.[7, 8] Estimates for IHC test performance were taken from the largest
published case series evaluating a novel 5A4 monoclonal antibody (Table 3.2). [25]
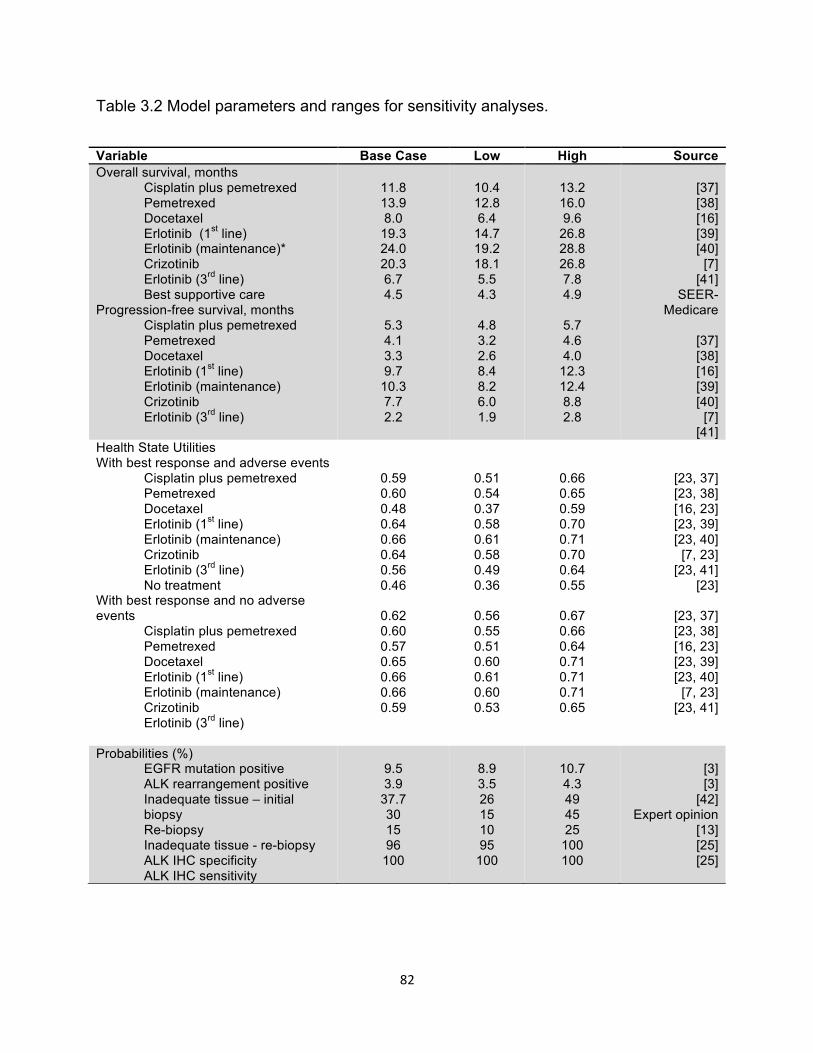
82
Table 3.2 Model parameters and ranges for sensitivity analyses.
Variable Base Case Low High Source Overall survival, months
Cisplatin plus pemetrexed Pemetrexed Docetaxel Erlotinib (1st line) Erlotinib (maintenance)* Crizotinib Erlotinib (3rd line) Best supportive care
Progression-free survival, months Cisplatin plus pemetrexed Pemetrexed Docetaxel Erlotinib (1st line) Erlotinib (maintenance) Crizotinib Erlotinib (3rd line)
11.8 13.9 8.0
19.3 24.0 20.3 6.7 4.5
5.3 4.1 3.3 9.7
10.3 7.7 2.2
10.4 12.8 6.4
14.7 19.2 18.1 5.5 4.3
4.8 3.2 2.6 8.4 8.2 6.0 1.9
13.2 16.0 9.6
26.8 28.8 26.8 7.8 4.9
5.7 4.6 4.0
12.3 12.4 8.8 2.8
[37] [38] [16] [39] [40]
[7] [41]
SEER-Medicare
[37] [38] [16] [39] [40]
[7] [41]
Health State Utilities With best response and adverse events
Cisplatin plus pemetrexed Pemetrexed Docetaxel Erlotinib (1st line) Erlotinib (maintenance) Crizotinib Erlotinib (3rd line) No treatment
With best response and no adverse events
Cisplatin plus pemetrexed Pemetrexed Docetaxel Erlotinib (1st line) Erlotinib (maintenance) Crizotinib Erlotinib (3rd line)
0.59 0.60 0.48 0.64 0.66 0.64 0.56 0.46
0.62 0.60 0.57 0.65 0.66 0.66 0.59
0.51 0.54 0.37 0.58 0.61 0.58 0.49 0.36
0.56 0.55 0.51 0.60 0.61 0.60 0.53
0.66 0.65 0.59 0.70 0.71 0.70 0.64 0.55
0.67 0.66 0.64 0.71 0.71 0.71 0.65
[23, 37] [23, 38] [16, 23] [23, 39] [23, 40]
[7, 23] [23, 41]
[23]
[23, 37] [23, 38] [16, 23] [23, 39] [23, 40]
[7, 23] [23, 41]
Probabilities (%) EGFR mutation positive ALK rearrangement positive Inadequate tissue – initial biopsy Re-biopsy Inadequate tissue - re-biopsy ALK IHC specificity ALK IHC sensitivity
9.5 3.9
37.7 30 15 96
100
8.9 3.5 26 15 10 95
100
10.7 4.3 49 45 25
100 100
[3] [3]
[42] Expert opinion
[13] [25] [25]

83
Table 3.2 (continued)
*probability of survival = 0.6; median survival probability not reported†includes time for delivery of tissue sample to the laboratory
Abbreviations: ALK, anaplastic lymphoma kinase; IHC, immunohistochemistry; FISH, fluorescence in situ hybridization; EGFR, epidermal growth factor receptor; IHC, immunohistochemistry; FISH, fluorescence in situ hybridization; TAT, turnaround time from receipt of specimen to report of test results.
Turnaround time (TAT), days† With no re-biopsy With re-biopsy
12 24
7 13
16 34
[8],Expert Opinion
Costs, 2013 US$ EGFR mutation assay ALK IHC assay ALK FISH assay
Cisplatin and pemetrexed Drug acquisition (per 21 day cycle) Premedication Administration, monitoring Adverse drug event treatment
Pemetrexed maintenance Drug acquisition (per 21 day cycle) Premedication Administration, monitoring Adverse drug event treatment
Docetaxel Drug acquisition (per 21 day cycle) Premedication Administration, monitoring Adverse drug event treatment
Erlotinib Drug acquisition (per 21 day cycle) Premedication Administration, monitoring Adverse drug event treatment
1st line 3rd line Maintenance
Crizotinib Drug acquisition (per 21 day cycle) Premedication Administration, monitoring Adverse drug event treatment
Disease progression, per month Patient time, per hour Travel, per 30 mile round trip
$201 $136 $489
$5,721 $254 $446 $760
$5,689 $6
$276 $304
$937 $8
$329 $2,525
$3,982 $0
$165
$358 $727 $358
$8,041 $0
$165 $550
$5,457 $19 $15
$201 $136 $489
$4,577 $203 $357 $608
$4,551 $5
$221 $243
$750 $6
$263 $2,020
$3,186 $0
$132
$286 $582 $286
$6,433 $0
$132 $440
$5,283 $10 $8
$718 $217 $598
$6,865 $305 $535 $912
$6,827 $7
$331 $365
$1,124 $10
$395 $3,030
$4,778 $0
$198
$430 $872 $430
$9,649 $0
$198 $660
$5,605 $29 $23
[43, 44] [43, 44] [43, 44]
[45] [45, 46] [43, 44] [43-47]
[45] [45, 46] [43, 44] [43-47]
[45] [45, 46] [43, 44] [43-47]
[46] [45, 46] [43, 44]
[43-47] [43-47] [43-47]
[46] [45, 46] [43, 44] [43-47]
[26] [48] [49]

84
3.3.6. Costs
Cancer-related medical costs, costs of travel and patient time spent seeking
medical care were included in the model (Table 3.2). We used the Centers for
Medicare and Medicaid Services (CMS) reimbursement rates for each biomarker assay
in our base case analysis, and for other direct medical costs, including drug
administration, imaging and ADEs. Costs for treatment specific ADEs were assumed
to accrue in the first month of therapy.[14, 24] The average sale price (ASP) and
average wholesale price (AWP) were used to value injectable and orally administered
drugs, respectively. With the exception of cisplatin-pemetrexed chemotherapy, which
was administered up to four cycles, patients were assumed to accrue drug-related costs
up to the time of progression. Costs for rebiopsy and related complications were
derived from the analysis by Handorf, et al.[13] The cost for treating progressive
disease was based on lung cancer attributable costs in the last year of life.[26] All costs
in the model were adjusted to 2013 values using the GDP deflator series.[27]
3.3.7. Cost Effectiveness Analysis
We calculated the incremental cost-effectiveness by ranking the strategies in
order of increasing effectiveness. Strongly dominated strategies, those that had a
lower, or equal effectiveness and higher costs, were eliminated. Incremental cost
effectiveness ratios (ICERs) were calculated for each strategy in relation to the next
best strategy. The ICER is a ratio of the difference in mean costs divided by the
difference in mean QALYs. Strategies with a higher ICER that were less effective than
85
another strategy were eliminated by extended dominance. The ICERs were
recalculated for the remaining non-dominated strategies.[28]
3.3.8. Sensitivity Analyses
We conducted sensitivity analyses to evaluate which parameters were most
influential on model results. Where available, the ranges used for the parameters
corresponded to the 95% CIs (Table 3.2). Costs were varied ±20% and plausible
ranges for TATs were used based on expert opinion. We also simulated the lifetime (5
year) costs and effectiveness where prognosis beyond trial observation period was
modeled using exponential distributions. Additionally, model outputs were generated
based on commercial prices for molecular assays. Finally, we ran a sensitivity analysis
for the transition probability of dying while awaiting test results based on treatment
naïve patients who were randomized to best supportive care (BSC) in a RCT.[29]
3.4 Results
Multiplexed testing approaches of ‘Test-treat’ and ‘Empiric switch’ were most
effective (Table 3.3). Both yielded an average life expectancy of 0.97 life years (LY),
and 0.56 QALYs. The ‘Empiric therapy’ approach, in which chemotherapy was
continued for four cycles before initiation of molecularly guided therapy, was less
effective (0.95 LY and 0.55 QALYs). Because the ‘Empiric switch’ approach was more
expensive than the ‘Test-treat’ strategy (but equally effective), it was ruled out by strong
dominance. The ‘Empiric therapy’ approach was eliminated by extended dominance
since it was associated with a higher ICER than the ‘Test-treat’ approach. Compared
with the ‘No test’ strategy, the ‘Test-treat’ approach of concurrent EGFR mutation and
ALK IHC testing followed by ALK FISH confirmation prior to initiation of any therapy
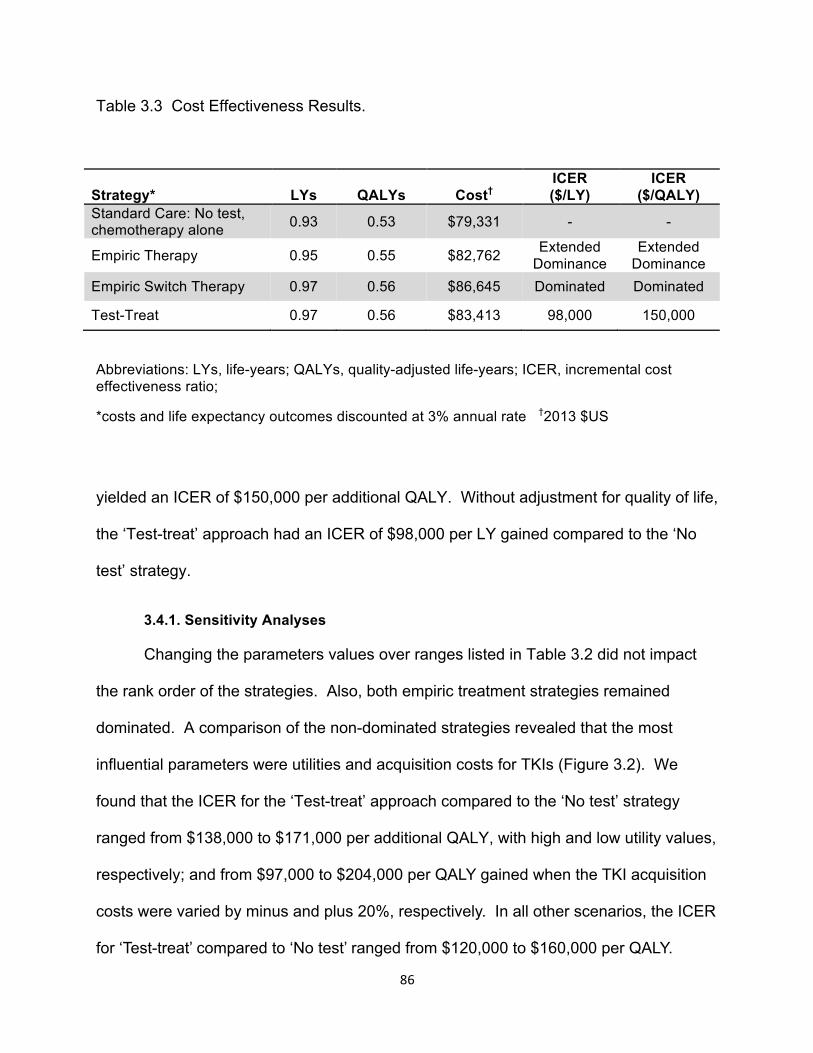
86
Table 3.3 Cost Effectiveness Results.
Abbreviations: LYs, life-years; QALYs, quality-adjusted life-years; ICER, incremental cost effectiveness ratio;
*costs and life expectancy outcomes discounted at 3% annual rate †2013 $US
yielded an ICER of $150,000 per additional QALY. Without adjustment for quality of life,
the ‘Test-treat’ approach had an ICER of $98,000 per LY gained compared to the ‘No
test’ strategy.
3.4.1. Sensitivity Analyses
Changing the parameters values over ranges listed in Table 3.2 did not impact
the rank order of the strategies. Also, both empiric treatment strategies remained
dominated. A comparison of the non-dominated strategies revealed that the most
influential parameters were utilities and acquisition costs for TKIs (Figure 3.2). We
found that the ICER for the ‘Test-treat’ approach compared to the ‘No test’ strategy
ranged from $138,000 to $171,000 per additional QALY, with high and low utility values,
respectively; and from $97,000 to $204,000 per QALY gained when the TKI acquisition
costs were varied by minus and plus 20%, respectively. In all other scenarios, the ICER
for ‘Test-treat’ compared to ‘No test’ ranged from $120,000 to $160,000 per QALY.
Strategy* LYs QALYs Cost† ICER ($/LY)
ICER ($/QALY)
Standard Care: No test, chemotherapy alone 0.93 0.53 $79,331 - -
Empiric Therapy 0.95 0.55 $82,762 Extended Dominance
Extended Dominance
Empiric Switch Therapy 0.97 0.56 $86,645 Dominated Dominated
Test-Treat 0.97 0.56 $83,413 98,000 150,000

87
Figure 3.2. Sensitivity analyses. Tornado diagram of influential parameters on the incremental-cost effectiveness ratio (ICER) of ‘Test-treat’ vs. ‘No Test’ strategies.
Test-treat vs. Test
ICER ($/QALY)
TKI, tyrosine kinase inhibitor; ALK, anaplastic lymphoma kinase rearrangement; EGFR,
epidermal growth factor drug sensitizing mutation; TAT, turn-around time; BSC, best-
supportive care; IHC, immunohistochemistry; QALY, quality-adjusted life year.
80,000 100,000 120,000 140,000 160,000 180,000 200,000 220,000
Probability of rebiopsy
ALK IHC test specificity
Cost of BSC
TAT
EGFR mutation frequency
Probability of adequate initial tissue sample
Discount rate
ALK rearrangement frequency
Probability of progression and mortality with therapy
Utilities
TKI price
88
Commercial prices for assays had a small effect on the ICER ($167,000 per
QALY for the ‘Test-treat’ vs. ‘No test’ strategy). Extrapolation of long-term survival
lowered the ICER for ‘Test-treat’ to $148,000 compared to ‘No Test’. With a trial-based
mortality risk in the pre-treatment health states (using a piecewise exponential model
with survival probabilities of 97% and 90% at 1 and 2 months after diagnosis,
respectively), the same dominance pattern was observed and the ICER remained stable
for the ‘Test-treat’ strategy compared to ‘No Test’ ($153,000/QALY).[29]
Varying the proportion of patients for whom multiplexed molecular testing is
ordered showed that decreasing this proportion to 5%, from 100% in the base-case
analysis, would lower the outcomes in terms of expected QALYs to 0.54 for all testing
strategies. Both empiric treatment strategies would still be dominated, and the ICER for
‘Test-treat’ compared to the ‘No test’ strategy would be $166,000/QALY.[9]
3.5 Discussion
Concurrent EGFR mutation and ALK IHC testing with ALK FISH confirmation for
tumors that overexpress the ALK protein prior to initiation of therapy yielded an ICER of
$150,000 per QALY gained compared to no testing and treatment with chemotherapy
alone. Whether or not an ICER of $150,000 provides good value is contingent upon
the willingness-to-pay threshold, which serves as a guide of how much society is willing
to pay for an additional QALY. The World Health Organization (WHO) defines
interventions with ICERs within three times the GDP per capita as being cost effective
($155,000 in the US). [30] Others posit that a threshold of $200,000 per QALY may be
more appropriate based on empirical data of ICERs for commonly used
interventions.[31, 32] Using these benchmarks, our results suggest that multiplexed

89
testing followed by molecularly guided therapy in metastatic NSCLC provides good
value from a societal perspective.
Our simulation study confirms that waiting for test results prior to initiation of
treatment optimizes outcomes in newly diagnosed patients with metastatic NSCLC.[10]
While empiric therapy in which chemotherapy is initiated concurrently with testing for
mutations, followed by an immediate switch to molecularly guided therapy at the time
test results become available yielded the same life expectancy as the test then treat
approach, the former strategy was dominated since it was more expensive.
Continuation of empiric chemotherapy for four cycles before switching to test-result
conditional treatment yielded less favorable outcomes than the above two approaches,
both in terms of QALYs and LYs. This strategy was eliminated by extended dominance.
These results were robust to variations over plausible ranges of model parameters.
In sensitivity analyses, the ICER was highly sensitive to drug acquisition costs.
At lower TKI prices, (80% of brand name product price), the ICER for the ‘Test-treat’
strategy decreased to $97,000/QALY compared to standard treatment with
chemotherapy. Over time, once generic versions of TKIs become available, these
innovations will confer even better value. The optimal price point that maximizes social
welfare, while minimizing the impact on technological innovation, is outside the scope of
this analysis. However, growing concerns over the increasing cost burden of these
innovations on patients deserve scrutiny.[33-35] Patient access to these drugs may be
impeded by onerous out of pocket costs. One way to attenuate the impact of cost
sharing may be through value based benefit design. Arguably, breakthrough therapies
that offer substantial improvement in outcomes and are placed into lower cost sharing
90
tiers would benefit society as a whole from healthier patients who remain productive, as
they are able to access these beneficial treatments.
We were unable to identify published economic analyses that examined
multiplexed testing in advanced NSCLC. Handorf, et al. evaluated the cost effectiveness
of molecularly guided first-line therapy using EGFR mutation testing in the US from a
payer perspective. The ICERs for testing with and without rebiopsy and EGFR mutation
guided treatment ranged from $110,644 to $122,219 per QALY gained compared to
treatment with a carboplatin-paclitaxel doublet.[13] Similar to our analysis, the cost-
effectiveness results from that study support the value of molecularly guided therapy.
Another recently published study examined the cost-effectiveness of ALK
rearrangement testing alone prior to first-line crizotinib treatment in ALK-positive tumors
or cisplatin-gemcitabine combination chemotherapy in wild type tumors.[21] From a
Canadian public health perspective, that analysis generated an ICER of $255,970 per
additional QALY for molecularly guided therapy compared to chemotherapy. The
authors concluded that genetic testing and treatment with molecularly guided therapy
was not cost-effective. Several differences between our analysis and the Canadian
study are worth noting. First, we combined multiplexed testing in our analysis, which de
facto produces better outcomes for the molecular testing strategy since more patients
benefit from testing. Second, in our analysis, the mean life expectancy with doublet
chemotherapy using a lifetime horizon was 12.2 months, an estimate that is identical to
a separate analysis we conducted based on SEER-Medicare patients with newly
diagnosed Stage IV NSCLC (data not shown). On the other hand, Djalalov et al.
reported a mean life expectancy of 7.4 months in patients who initiated therapy with

91
first-line cisplatin and gemcitabine.[21] Third, our utility weights were appreciably higher
for crizotinib and some other overlapping treatments, such as third-line erlotinib therapy.
These differences in part explain the disparities in our respective studies.
Our results are subject to modeling assumptions and need to be interpreted in
this context. For example, due to treatment crossover after progression and lack of
direct comparisons in RCTs, we relied on single-arm data for our parameters.
Furthermore, we used data from PROFILE 1007, a phase 3 RCT of second-line
crizotinib, to inform hazard rates in our model for OS and PFS.[7] These estimates
apply to a small subset of patients in our model, those with ALK rearrangement positive
status. Any bias introduced into the model would thus be marginal given the size of this
subgroup.[36] Overall, varying the hazard rates for treatment effects in sensitivity
analyses revealed that the base case results were robust to these assumptions. Also,
we used Medicare reimbursements as a proxy for the societal costs of test assays.
However, the true costs of the tests may vary across providers. But even with
commercial test prices, the ICER for the ‘Test-treat’ compared to the ‘No test’ strategy
increased to $167,000 per additional QALY, which is still below commonly acceptable
willingness-to-pay thresholds.[31]
In summary, our analysis suggests that multiplexed testing for EGFR mutations
and ALK overexpression with an IHC assay followed by ALK rearrangement
confirmation with FISH for IHC positive results and biomarker conditional treatment is a
cost effective strategy compared to treatment with chemotherapy and no testing in
metastatic NSCLC. Empiric cisplatin-pemetrexed therapy for four cycles with
concurrent molecular testing prior to initiation of TKI maintenance therapy generated

92
inferior outcomes compared to waiting for test results before treatment, and compared
to ‘Empiric switch therapy’ in which chemotherapy initiated treatment was immediately
switched to molecularly guided therapy when test results became available.
93
3.6 References
1. Society, A.C. Key statistics about lung cancer. 2013 [cited 2013 June 4, 2013];
Available from: http://www.cancer.org/cancer/lungcancer-non-
smallcell/detailedguide/non-small-cell-lung-cancer-key-statistics.
2. Owonikoko, T.K., et al., Lung cancer in elderly patients: an analysis of the
surveillance, epidemiology, and end results database. J Clin Oncol, 2007. 25(35):
p. 5570-7.
3. Barlesi F, B.H., Beau-Faller M, et al. Biomarkers France: Preliminary results of
routine EGFR, HER2, KRAS, BRAF, PI3KCA mutations detection and EML4-ALK
gene fusion assessment on the first 10,000 non-small cell lung cancer (NSCLC)
patients. in 2013 ASCO Annual Meeting. 2013. Chicago, Illinois.
4. Mok, T.S., et al. Gefitinib or carboplatin-paclitaxel in pulmonary adenocarcinoma.
N Engl J Med, 2009. 361(10): p. 947-57.
5. Sequist, L.V., et al., Phase III study of afatinib or cisplatin plus pemetrexed in
patients with metastatic lung adenocarcinoma with EGFR mutations. J Clin
Oncol, 2013. 31(27): p. 3327-34.
6. Thongprasert, S., et al., Health-related quality-of-life in a randomized phase III
first-line study of gefitinib versus carboplatin/paclitaxel in clinically selected
patients from Asia with advanced NSCLC (IPASS). J Thorac Oncol, 2011. 6(11):
p. 1872-80.
7. Shaw, A.T., et al., Crizotinib versus chemotherapy in advanced ALK-positive lung
cancer. N Engl J Med, 2013. 368(25): p. 2385-94.

94
8. Lindeman, N.I., et al., Molecular testing guideline for selection of lung cancer
patients for EGFR and ALK tyrosine kinase inhibitors: guideline from the College
of American Pathologists, International Association for the Study of Lung Cancer,
and Association for Molecular Pathology. J Thorac Oncol, 2013. 8(7): p. 823-59.
9. Lynch, J.A., et al., Utilization of epidermal growth factor receptor (EGFR) testing
in the United States: a case study of T3 translational research. Genet Med, 2013.
15(8): p. 630-8.
10. Moran, T. and L.V. Sequist, Timing of epidermal growth factor receptor tyrosine
kinase inhibitor therapy in patients with lung cancer with EGFR mutations. J Clin
Oncol, 2012. 30(27): p. 3330-6.
11. Cappuzzo, F., et al., Erlotinib as maintenance treatment in advanced non-small-
cell lung cancer: a multicentre, randomised, placebo-controlled phase 3 study.
Lancet Oncol, 2010. 11(6): p. 521-9.
12. Atherly, A.J. and D.R. Camidge, The cost-effectiveness of screening lung cancer
patients for targeted drug sensitivity markers. Br J Cancer, 2012. 106(6): p. 1100-
6.
13. Handorf, E.A., et al., Cost effectiveness of personalized therapy for first-line
treatment of stage IV and recurrent incurable adenocarcinoma of the lung. J
Oncol Pract, 2012. 8(5): p. 267-74.
14. Carlson, J.J., et al., The potential clinical and economic outcomes of
pharmacogenomic approaches to EGFR-tyrosine kinase inhibitor therapy in non-
small-cell lung cancer. Value Health, 2009. 12(1): p. 20-7.

95
15. Arrieta O, A.P., Lopez RJ, Polanco AC., Cost-effectiveness analysis of EGFR
mutation testing in patients with advanced non small-cell lung cancer (ANSCLC)
treated with gefitinib or carboplatin-paclitaxel. Value Health, 2010. 13(2 Suppl 3):
p. A37-38.
16. Chen W, E.P., Levin L, Krahn M., Cost-effectiveness of epidermal growth factor
receptor gene mutation testing in the selection of first-line therapy for patients
with advanced non-small cell lung cancer in Ontario. Value Health, 2011. 14(3):
p. A82.
17. Jacob J, H.M., Brattstrbm D., Cost-effectiveness of gefitinib versus doublet
chemotherapy in first-line treatment of non-small cell lung cancer (NSCLC) in
Sweden. Value Health, 2010. 13(7): p. A270.
18. Lopes GD, S.J., Tan D, Do Y, Mok T, Finkelstein E., Cost-effectiveness of
epidermal growth-factor receptor mutation testing and first-line treatment with
gefitinib for advanced non-small-cell lung cancer. EJC Suppl, 2011. 9(1): p. 2.
19. Shiroiwa T, M.Y., Tsutani K., Cost-effectiveness analysis of EGFR testing and
gefitinib for nonsmall-cell lung cancer (NSCLC) in Japan. Value Health, 2012.
15(4): p. A67.
20. Borget, I., et al., Cost-effectiveness of three strategies for second-line erlotinib
initiation in nonsmall-cell lung cancer: the ERMETIC study part 3. Eur Respir J,
2012. 39(1): p. 172-9.
21. Djalalov, S., et al., Cost effectiveness of EML4-ALK fusion testing and first-line
crizotinib treatment for patients with advanced ALK-positive non-small-cell lung
cancer. J Clin Oncol, 2014. 32(10): p. 1012-9.
96
22. Gold MR, S.J., Russell LB, Weinstein MC, Cost-Effectiveness in Health and
Medicine. 1996, New York: Oxford University Press.
23. Nafees, B., et al., Health state utilities for non small cell lung cancer. Health Qual
Life Outcomes, 2008. 6: p. 84.
24. Westwood ME, J.M., Whiting P, van Asselt T, Ramaekers B, Armstrong N, Misso
K, Severens J, Kleijnen J., Epidermal growth factor receptor tyrosine kinase
(EGFR-TK) mutation testing in adults with locally advanced or metastatic non-
small-cell lung cancer: a systematic review and cost-effectiveness analysis. A
Diagnostic Assessment Report. 2012.
25. Paik, J.H., et al., Screening of anaplastic lymphoma kinase rearrangement by
immunohistochemistry in non-small cell lung cancer: correlation with
fluorescence in situ hybridization. J Thorac Oncol, 2011. 6(3): p. 466-72.
26. Yabroff, K.R., et al., Cost of care for elderly cancer patients in the United States.
J Natl Cancer Inst, 2008. 100(9): p. 630-41.
27. Analysis, B.o.E. Chain-type price indexes for gross domestic product, 1964-2012.
2012 [cited 2013 June 2, 2013]; Available from:
http://www.gpo.gov/fdsys/granule/ERP-2013/ERP-2013-table7/content-detail.html.
28. Hunink M, G.P., Siegel J, et al., Decision-Making in Health and Medicine:
Integrating Evidence and Values. 2001, New York, NY: Cambridge University
Press.
29. Roszkowski, K., et al., A multicenter, randomized, phase III study of docetaxel
plus best supportive care versus best supportive care in chemotherapy-naive
97
patients with metastatic or non-resectable localized non-small cell lung cancer
(NSCLC). Lung Cancer, 2000. 27(3): p. 145-57.
30. Bank, T.W. GDP per capita (current US$). 2014 April 10, 2014]; Available from:
http://data.worldbank.org/indicator/NY.GDP.PCAP.CD.
31. Ubel, P.A., et al., What is the price of life and why doesn't it increase at the rate
of inflation? Arch Intern Med, 2003. 163(14): p. 1637-41.
32. Mullins, C.D., et al., Comparative and cost-effectiveness of oxaliplatin-based or
irinotecan-based regimens compared with 5-fluorouracil/leucovorin alone among
US elderly stage IV colon cancer patients. Cancer, 2012. 118(12): p. 3173-81.
33. Experts in Chronic Myeloid, L., The price of drugs for chronic myeloid leukemia
(CML) is a reflection of the unsustainable prices of cancer drugs: from the
perspective of a large group of CML experts. Blood, 2013. 121(22): p. 4439-42.
34. Hall S. The Cost of Living.; Available from: http://nymag.com/news/features/cancer-
drugs-2013-10/.
35. Bach P, Wittes R. In Cancer Care, Cost Matters. Available from:
http://www.nytimes.com/2012/10/15/opinion/a-hospital-says-no-to-an-11000-a-month-
cancer-drug.html?_r=0.
36. Mok, T., J.J. Yang, and K.C. Lam, Treating patients with EGFR-sensitizing
mutations: first line or second line--is there a difference? J Clin Oncol, 2013.
31(8): p. 1081-8.
37. Scagliotti, G.V., et al., Phase III study comparing cisplatin plus gemcitabine with
cisplatin plus pemetrexed in chemotherapy-naive patients with advanced-stage
non-small-cell lung cancer. J Clin Oncol, 2008. 26(21): p. 3543-51.
98
38. Paz-Ares, L., et al., Maintenance therapy with pemetrexed plus best supportive
care versus placebo plus best supportive care after induction therapy with
pemetrexed plus cisplatin for advanced non-squamous non-small-cell lung
cancer (PARAMOUNT): a double-blind, phase 3, randomised controlled trial.
Lancet Oncol, 2012. 13(3): p. 247-55.
39. Rosell, R., et al., Erlotinib versus standard chemotherapy as first-line treatment
for European patients with advanced EGFR mutation-positive non-small-cell lung
cancer (EURTAC): a multicentre, open-label, randomised phase 3 trial. Lancet
Oncol, 2012. 13(3): p. 239-46.
40. Brugger, W., et al., Prospective molecular marker analyses of EGFR and KRAS
from a randomized, placebo-controlled study of erlotinib maintenance therapy in
advanced non-small-cell lung cancer. J Clin Oncol, 2011. 29(31): p. 4113-20.
41. Shepherd, F.A., et al., Erlotinib in previously treated non-small-cell lung cancer.
N Engl J Med, 2005. 353(2): p. 123-32.
42. Jackman, D.M., et al., Phase II clinical trial of chemotherapy-naive patients > or =
70 years of age treated with erlotinib for advanced non-small-cell lung cancer. J
Clin Oncol, 2007. 25(7): p. 760-6.
43. Clinical Laboratory Fee Schedule. 2012 [cited 2013 May 12, 2013]; Available
from: http://www.cms.gov/Medicare/Medicare-Fee-for-Service-
Payment/ClinicalLabFeeSched/Gapfill-Pricing-Inquiries.html.
44. Physician Fee Schedule. 2012 [cited 2013 May 15, 2013]; Available from:
http://www.cms.gov/apps/physician-fee-schedule/search/search-
results.aspx?Y=1&T=0&HT=0&CT=3&H1=88381&M=5.

99
45. BDIPharma. HCPCS Codes & Medicare Payment. 2013 [cited 2013 June 2,
2013]; Available from: http://www.bdipharma.com/services-hcpcs-codes-medicare-
payment.aspx.
46. Price Rx Pro. [cited May 15, 2013]; Available from: https://pricerx.medispan.com
47. MS-Diagnosis-Related Group (MS-DRG) Weights (2008-2013). 2013 [cited 2013
May 19, 2013]; Available from:
http://www.herc.research.va.gov/resources/faq_f03.asp.
48. Usual Weekly Earnings of Wage and Salary Workers. 2013 [cited 2013 May 17,
2013]; Available from: http://www.bls.gov/news.release/wkyeng.toc.htm.
49. Privately Owned Vehicle (POV) Mileage Reimbursement Rates. 2013 [cited
2013 May 21, 2013]; Available from: http://www.gsa.gov/.

100
3.7 Appendix
3.7.1 Natural History
To model the natural history of untreated advanced NSCLC while simulated
patients were awaiting molecular marker test results and for those in the BSC strategy,
we used the Surveillance, Epidemiology, and End Results (SEER)-Medicare linked
database to identify incident cases of advanced NSCLC patients with pathologic
diagnosis of non-squamous histology, aged 66-69 years old, who were diagnosed
between 2007 and 2009. The SEER population-based registries, which represent 28%
of the US population, provide a rich repository of data related to tumor characteristics
and prognosis.[7] The patient-level linked Medicare data (CMS) provide claims
information for fee-for-service (FFS) coverage for services provided in hospitals,
outpatient clinics, physician encounters, durable medical equipment, hospice, home
health care and prescription medications covered by Medicare Part D plans. We used
predicted probabilities from a Cox model probability weighted using the inverse
conditional probability of exposure to systemic therapy to balance observable covariates
between treatment naïve and treated patients. Time dependent transitional probabilities
for the simulation model were calibrated to the predicted survival probabilities from the
Cox model using a piecewise-exponential approach.
Patients with Stage IV NSCLC who were diagnosed during 2007-2009 were
identified form the SEER database. Further inclusion criteria included: age 66 to 69 (the
ages were selected to parallel the median ages reported in the clinical trials which were
used for treatment efficacy estimates); non-squamous histology (adenocarcinoma, large
cell, NOS; BAC histology was excluded from the analysis); first and only cancer

101
diagnosis; continuous enrollment in FFS. The minimum follow up was 12 months after
diagnosis. Classification into the systemic treatment group was based on any claim for
systemic therapy (in hospital, physician, outpatient, Medicare D, home health care and
durable equipment claims files) within 60 days of diagnosis. To ensure that patients
included in the analysis were representative of those who would be candidates for
systemic therapy, we matched patients based on 39 characteristics, which included
proxy indicators for performance status at diagnosis (2 variables: claims for home
oxygen therapy and claims for activity of daily living aids). (We would like to thank Dr.
Lamont for providing us with the algorithm for the performance status indicators).
A propensity score logistic regression model was estimated, using receipt of
systemic therapy as the outcome variable and the above variables that may affect
treatment selection as the covariates. Inverse propensity score weighting (IPW) was
used to assess the balance in baseline characteristics. All standardized differences for
IPW weighted analyses of each covariate between the treatment groups were less than
0.10 indicating the groups were well balanced on baseline characteristics (Table 3.A.1)
across treatment groups among the 11,443 included patients.

102
Table 3.A.1. Baseline characteristics among Stage IV NSCLC patients by treatment group.
Unweighted means Weighted means Systemic therapy N=5050
%
BSC N=6393
%
Standardized Difference
Systemic Therapy N=5050
%
BSC N=6393
%
Standardized Difference
Female 48 51 0.057 50 50 0.001 Age
66-69 70-74 75-79 80-84
85+
25 30 25 15
5
17 23 23 21 16
0.208 0.171 0.035 0.154 0.381
21 26 24 18 11
20 26 24 18 11
0.004 0.006 0.001 0.003 0.006
Race Hispanic
White Black
Other race
4 82
7 8
4 80
9 7
0.017 0.050 0.081 0.023
4 80
8 8
4 80
8 7
0.004 0.005 0.003 0.008
Marital status Single
Married Unknown
7 58 35
9 44 47
0.060 0.284 0.255
8 51 42
8 51 41
0.005 0.000 0.003
Median household income in census tract $50,515 $48,105 0.107 $49,067 $49,066 0.000 Proportion with college degree in census tract 25.3 24.1 0.072 24.5 24.6 0.047 Gagne comorbidity score
0 1 2
3+
67 16
8 9
59 17
9 15
0.184 0.035 0.038 0.201
62 17
8 13
62 17
8 12
0.012 0.000 0.000 0.018
Histology Adenocarcinoma
Large cell BAC NOS
56 5 2
37
56 5 2
37
0.004 0.020 0.001 0.013
56 5 2
37
56 5 2
37
0.003 0.000 0.002 0.003
Brain metastases 16 21 0.137 19 19 0.002 MDs in county, (per 100,000) 238.5 240.1 0.012 238.1 239.5 0.081 Hospital beds in county, (per 100,000) 320.9 322.2 0.006 323.7 320.2 0.131 Managed care penetration (%) 19.7 20.6 0.071 20.2 20.3 0.020 Foreign born (%) 13.0 12.9 0.009 13.0 12.9 0.038 Hospital days pre dx 3.0 4.8 0.224 4.3 4.1 0.108 Home health care enrolment pre dx 8 14 0.217 12 11 0.021 SNF enrolment pre dx 3 8 0.233 6 6 0.002 Pre-diagnosis costs, within 1 year of diagnosis, mean (SD) $6,884 $10,053 0.172 $8,985 $8,752 0.080 State buy-in 16 21 0.133 19 19 0.004 Alcohol abuse 0 1 0.037 1 1 0.000 CHF 9 13 0.136 11 11 0.016 Cardiac arrhythmias 11 15 0.115 14 13 0.014 Chronic pulmonary disease 22 25 0.083 24 24 0.009 Coagulopathy 2 2 0.005 2 2 0.014 Complicated diabetes 5 6 0.048 6 6 0.008 Deficiency anemias 11 14 0.089 13 12 0.009 Dementia 1 3 0.153 2 2 0.007 Fluid and electrolyte dis 4 8 0.140 7 6 0.012 HIV/AIDS 0 0 0.003 0 0 0.008 Hemiplegia 0 1 0.064 0 0 0.005 Hypertension 53 52 0.023 53 52 0.010 Liver disease 13 15 0.037 14 14 0.009 Peripheral vascular disor 11 15 0.129 13 13 0.011 Psychosis 2 3 0.077 3 2 0.005 Pulmonary circulation dis 1 2 0.043 1 1 0.001 Renal failure 4 7 0.123 6 6 0.013 Weight loss 0 1 0.092 1 1 0.031 COPD ER/hosp prior to diagnosis 2 3 0.081 2 2 0.011 Home Oxygen Therapy Aids 15 18 0.076 18 17 0.016 ADL Aids 7 11 0.141 10 10 0.016
103
3.7.2 Survival Analysis
Non-parametric Kaplan-Meier survival curves are useful in characterizing the
survival function and do not require any distributional assumptions, however,
adjustment for confounding using IPW is not feasible with this approach. We thus
pursued both semi-parametric models (Cox model) and parametric models (exponential,
Weibull, generalized gamma, log-logistic and log-normal) to adjust for IPW. Models
were fit with treatment indicator as the sole covariate and weighted using the IPW. All
models were analyzed using SAS (version 9.3). Goodnness-of-Fit statistics using the
corrected Akaike information criterion (AICc) were used to compare the fit of the hazard
function across models. The Cox model was associated with the lowest AICc value
and was thus deemed to have the best fit to the data.
Furthermore, to attenuate survivor treatment selection bias, we opted to express
the treatment variable as a time-dependent covariate in the Cox PH model. (6) The
predicted survival probabilities from the Cox PH models and the calibrated probabilities
from the simulation model are shown below. Time dependent transitional probabilities
for the simulation model were calibrated to the Cox predicted survival probabilities using
a piecewise-exponential approach.

104
Figure 3.A.1. Natural history model calibration.
Top panel: The overall predicted survival probabilities from Cox PH models for systemic therapy and treatment naïve groups (green and blue lines, respectively) are shown. Predictions from separate specifications of Cox PH models are shown: solid lines correspond to estimates with treatment as a fixed covariate; dashed lines correspond to time-varying treatment covariate specification. Bottom panel: Red curve represents the calibrated survival probability curve from the simulation model; dashed blue line corresponds to the predicted survival probabilities for treatment naïve group with chemotherapy as a time-varying covariate; grey curves correspond to the 96% CI. All Cox PH model results are inverse probability weighted for propensity to receive systemic therapy within 60 days from diagnosis.
0.75 0.76 0.77 0.78 0.79 0.8
0.81 0.82 0.83 0.84 0.85 0.86 0.87 0.88 0.89 0.9
0.91 0.92 0.93 0.94 0.95 0.96 0.97 0.98 0.99
1
0 2 4 6 8 10 12 14 16 18 20 22 24 26 28 30 32 34 36 38 40 42 44
surv
ival
pro
babi
lity
day
0.75 0.76 0.77 0.78 0.79 0.8
0.81 0.82 0.83 0.84 0.85 0.86 0.87 0.88 0.89 0.9
0.91 0.92 0.93 0.94 0.95 0.96 0.97 0.98 0.99
1
0 2 4 6 8 10 12 14 16 18 20 22 24 26 28 30 32 34 36 38 40 42 44
surv
ival
pro
babi
lity
day

105
3.7.3 Treatment Conditional Outcomes
The model simulated progression-free and overall treatment conditional survival
using exponential models. Studies that met inclusion criteria for estimation of these
efficacy parameters comprised of phase 3 randomized trials. With the exception of first-
line crizotinib and switch maintenance erlotinib, we were able to identify studies for all
other lines of treatment that met the inclusion criteria. The PROFILE 1007 trial
evaluated the efficacy of crizotinib in the second line treatment.[9] The PROFILE 1014
trial is currently enrolling patients in the first line setting, but the results will not be
available for some time (personal communication, Dr. Shaw). There is an ongoing
debate about the consistency of outcome results with targeted therapies between first
and second line therapy given no direct comparisons of the two approaches.[10]
Indirect comparisons suggest relatively better outcomes in first line setting compared to
second line, but the evidence is based on retrospective analyses or small sample sizes.
The use of PROFILE 1007 results in the first line setting in our model applies to a small
subset of patients with ALK rearrangement positive status (<5%). Any bias introduced
into a model would thus be marginal given the size of the subgroup and it would be in
favor of the standard care strategy.
The median estimates from trials were used as the calibration targets. The
hazard rates were changed iteratively to approximate the arm-specific median survival
estimates from eligible trials.
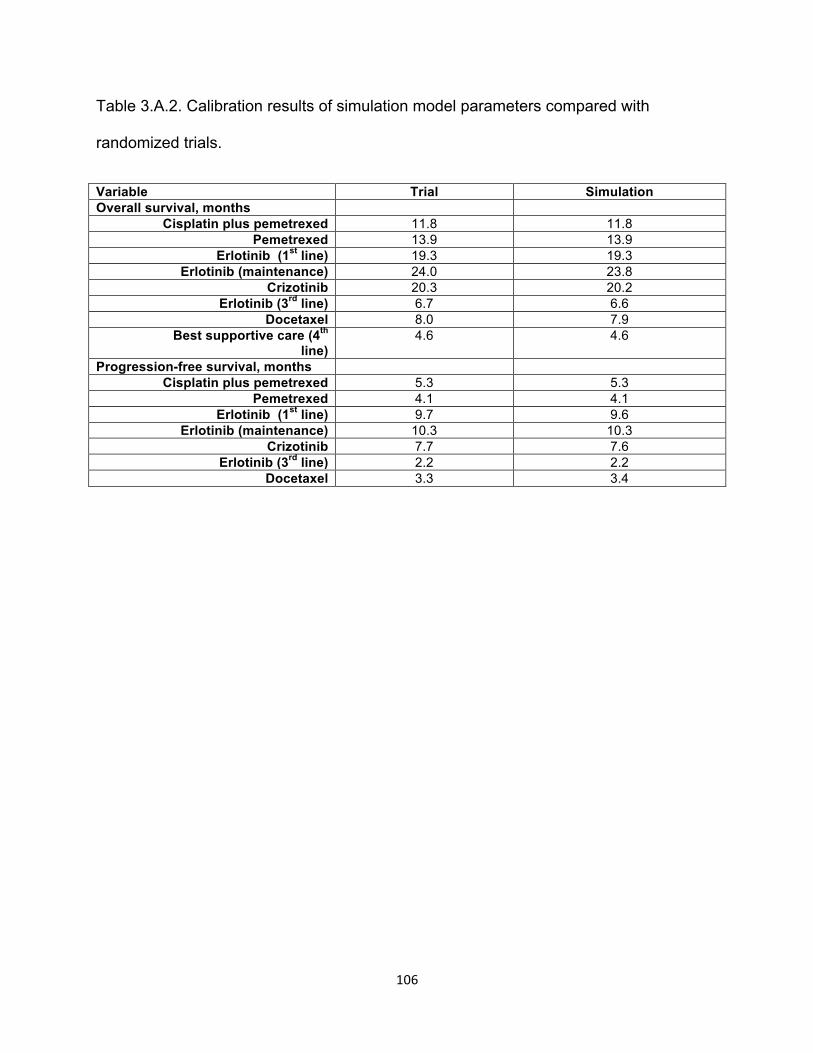
106
Table 3.A.2. Calibration results of simulation model parameters compared with
randomized trials.
Variable Trial Simulation Overall survival, months
Cisplatin plus pemetrexed 11.8 11.8 Pemetrexed 13.9 13.9
Erlotinib (1st line) 19.3 19.3 Erlotinib (maintenance) 24.0 23.8
Crizotinib 20.3 20.2 Erlotinib (3rd line) 6.7 6.6
Docetaxel 8.0 7.9 Best supportive care (4th
line) 4.6 4.6
Progression-free survival, months Cisplatin plus pemetrexed 5.3 5.3
Pemetrexed 4.1 4.1 Erlotinib (1st line) 9.7 9.6
Erlotinib (maintenance) 10.3 10.3 Crizotinib 7.7 7.6
Erlotinib (3rd line) 2.2 2.2 Docetaxel 3.3 3.4
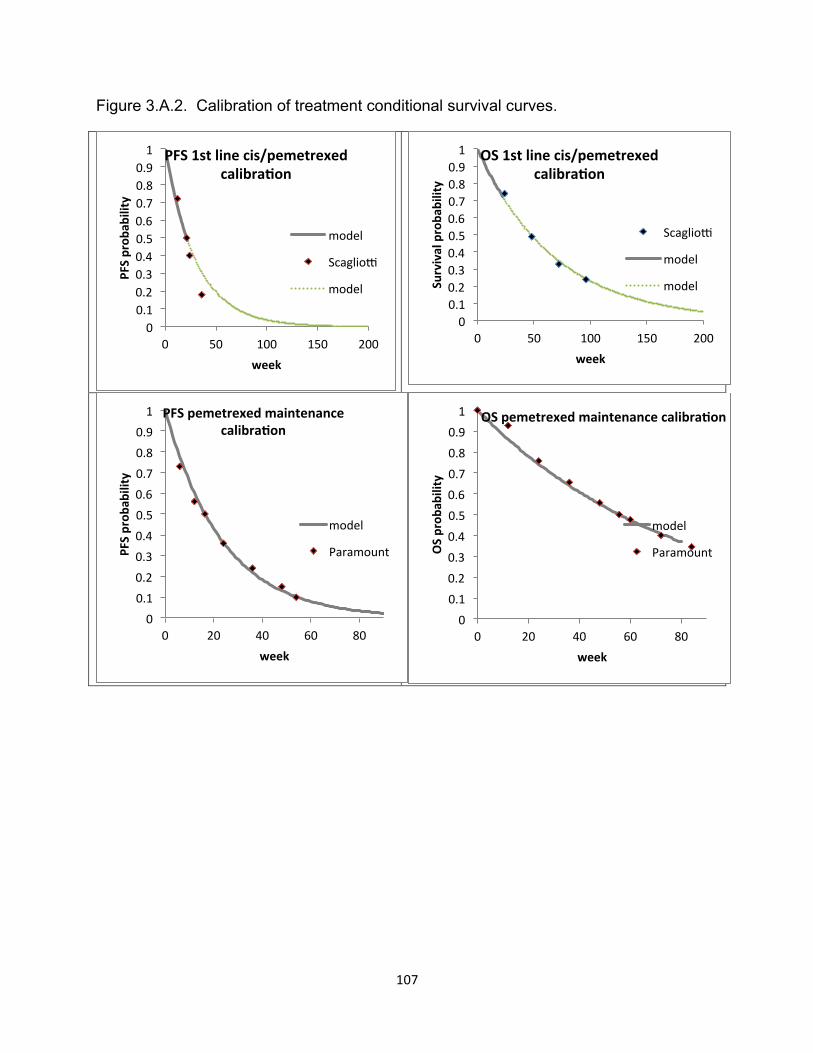
107
Figure 3.A.2. Calibration of treatment conditional survival curves.
0 0.1 0.2 0.3 0.4 0.5 0.6 0.7 0.8 0.9 1
0 50 100 150 200
PFS prob
ability
week
PFS 1st line cis/pemetrexed calibra-on
model
Scagliom
model
0 0.1 0.2 0.3 0.4 0.5 0.6 0.7 0.8 0.9 1
0 50 100 150 200
Survival proba
bility
week
OS 1st line cis/pemetrexed calibra-on
Scagliom
model
model
0 0.1 0.2 0.3 0.4 0.5 0.6 0.7 0.8 0.9 1
0 20 40 60 80
PFS prob
ability
week
PFS pemetrexed maintenance calibra-on
model
Paramount
0 0.1 0.2 0.3 0.4 0.5 0.6 0.7 0.8 0.9 1
0 20 40 60 80
OS prob
ability
week
OS pemetrexed maintenance calibra-on
model
Paramount
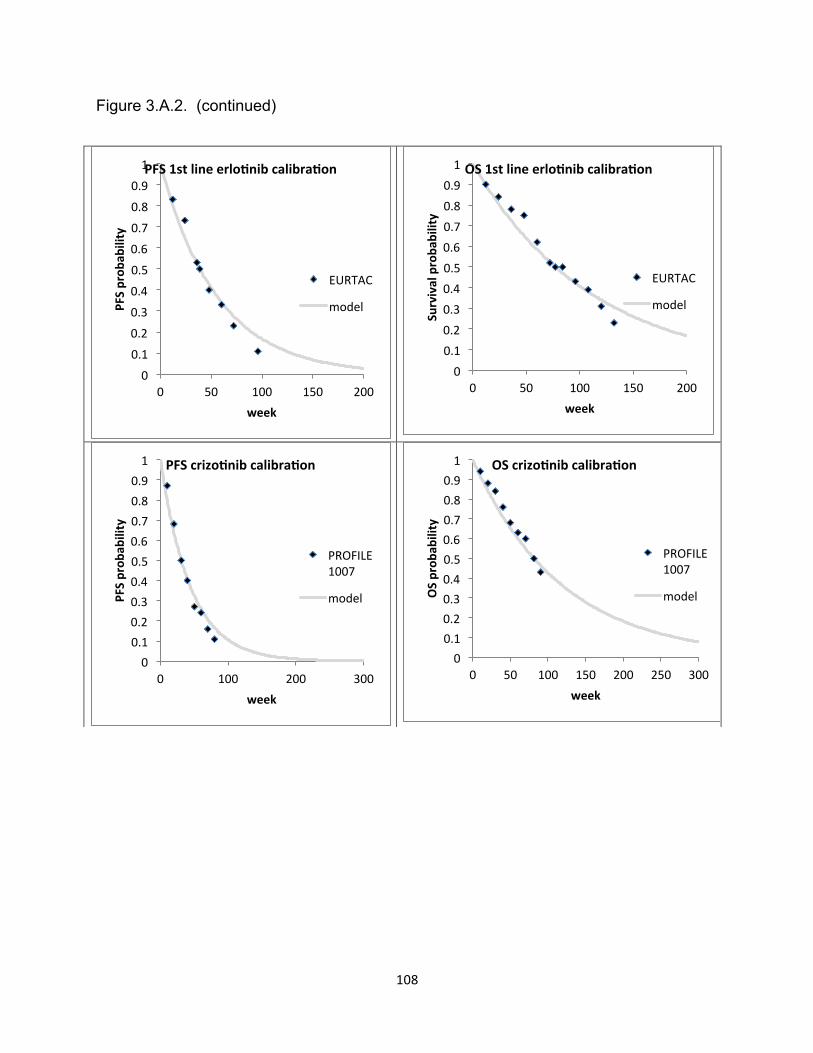
108
Figure 3.A.2. (continued)
0
0.1
0.2
0.3
0.4
0.5
0.6
0.7
0.8
0.9
1
0 50 100 150 200
PFS prob
ability
week
PFS 1st line erlo-nib calibra-on
EURTAC
model
0 0.1 0.2 0.3 0.4 0.5 0.6 0.7 0.8 0.9 1
0 50 100 150 200
Survival proba
bility
week
OS 1st line erlo-nib calibra-on
EURTAC
model
0 0.1 0.2 0.3 0.4 0.5 0.6 0.7 0.8 0.9 1
0 100 200 300
PFS prob
ability
week
PFS crizo-nib calibra-on
PROFILE 1007
model
0 0.1 0.2 0.3 0.4 0.5 0.6 0.7 0.8 0.9 1
0 50 100 150 200 250 300
OS prob
ability
week
OS crizo-nib calibra-on
PROFILE 1007
model

109
Figure 3.A.2. (continued)
Model predicted survival probabilities (grey curves) are juxtaposed with survival
probabilities from randomized clinical trials included in the model (diamonds). Non-
solid curves correspond to model predictions that extend beyond the analytical time.
0
0.1
0.2
0.3
0.4
0.5
0.6
0.7
0.8
0.9
1
0 50 100 150 200
PFS prob
ability
week
PFS 3rd line erlo-nib calibra-on
model
BR21
0 0.1 0.2 0.3 0.4 0.5 0.6 0.7 0.8 0.9 1
0 50 100 150 200
OS prob
ability
week
OS 3rd line erlo-nib calibra-on
model
BR21

110
3.7.4 Best Response and Adverse Drug Event Rates
Best response rates (CR/PR, SD, PD) were pulled from the randomized trials
that we included for efficacy endpoints. Prevalence of grade 3 and 4 adverse drug
events (ADE) were obtained from the same trials (Table 3.A.3). ADE and best
response frequencies were assumed to be fixed in our model.
Table 3.A.3. Best response and adverse event probabilities by treatment.
3.7.5 Utilities
Treatment specific utilities were calculated based on the prediction model
reported by Nafees et al. (Table 3.A.4).[11] Time spent in each health state was
weighted by a utility for that state to estimate QALYs. Utilities were drawn from a
community-based study in advanced NSCLC from the UK.[11] The authors elicited
societal based utility values from 100 participants of the general community using the
standard gamble approach. The predictive model for health state utilities generated by
the authors is shown in Table 3.A.4. The model was a function of tumor progression
Therapy* Erlotinib 1st line
Crizotinib Erlotinib maintenance
Cisplatin/ pemetrexed
Pemetrexed Erlotinib 3rd line
Docetaxel
Source EURTAC PROFILE SATURN Scagliotti PARAMOUNT BR21 meta
Best response
CR/PR** 0.58 0.66 0.55 0.31 0.03 0.09 0.09
PD** 0.07 0.06 0.00 0.23 0.28 0.38 0.46
Grade 3/4 ADE
Neutropenia 0.00 0.13 0.00 0.15 0.04 0.00 0.32
Febrile Neutropenia
0.00 0.01 0.01 0.01 0.01 0.00 0.06
fatigue 0.06 0.02 0.00 0.07 0.04 0.16 0.28
N&V 0.00 0.02 0.00 0.13 0.01 0.00 0.26
diarrhea 0.05 0.00 0.02 0.00 0.00 0.11 0.12
hair loss 0.00 0.00 0.00 0.12 0.00 0.00 0.38
rash 0.13 0.00 0.09 0.00 0.00 0.16 0.07

111
state (CR/PR, SD, PD) and grade 3-4 toxicities associated with treatment (neutropenia,
febrile neutropenia, fatigue, diarrhea, nausea and vomiting, rash and hair loss), domains
which demonstrated an impact on HRQOL in prior studies. We calculated utilities
based on the Nafees model and trial-based best response rates (CR/PR, SD, PD) and
prevalence rates of grade 3 and 4 adverse drug events (ADEs) (Table 3.A.3). ADE and
best response frequencies were treated as fixed values. Consistent with other reports,
disutilities for ADEs were incorporated for the first month of therapy while remaining
months on therapy were weighted using weights calculated using best response rates
only.[12] All patients in the BSC health state were assumed to be in the progressive
state with no additional disutilities based on symptoms.
Table 3.A.4. Predictive model of utilities in lung cancer based on best response to
therapy and adverse events.
Utility Base case
estimate
Standard error
Source
Intercept 0.6532 0.02223 Nafees 2009 PD -0.1798 0.02169 Nafees 2009 CR/PR 0.0193 0.006556 Nafees 2009 Neutropenia -0.08973 0.01543 Nafees 2009 FN -0.09002 0.01633 Nafees 2009 Fatigue -0.07346 0.01849 Nafees 2009 N&V -0.04802 0.01618 Nafees 2009 Diarrhea -0.0468 0.01553 Nafees 2009 Alopecia -0.04495 0.01482 Nafees 2009 Rash -0.03248 0.01171 Nafees 2009