the value proposition of the safety...
TRANSCRIPT

The Value Proposition of the Safety Professional Do Safety Professionals actually reduce fatalities?
By
Dave Rebbitt
An Applied Research Project Presented In Partial Fulfillment For The Degree in the Masters
Of Business Administration
Athabasca University September 2012

i
Table of Contents LIST OF TABLES ............................................................................................................ iii
LIST OF FIGURES ..........................................................................................................iv
ABSTRACT ..................................................................................................................... v
INTRODUCTION ............................................................................................................. 1
DEFINITIONS ................................................................................................................. 3
BACKGROUND .............................................................................................................. 4
The early years ............................................................................................................ 4
Getting organized ........................................................................................................ 5
What gets measured .................................................................................................... 5
Fatalities as a measure ................................................................................................ 6
Safety becomes a profession ...................................................................................... 9
The next wave – safety certifications ........................................................................... 9
Defining the Safety Professional ................................................................................ 12
How many professionals are there? .......................................................................... 13
TRENDS IN FATALITIES .............................................................................................. 15
Linking Performance .................................................................................................. 17
High risk industries .................................................................................................... 20
The construction industry puzzle ............................................................................... 23
THE CANADIAN PICTURE ........................................................................................... 27
Canadian Safety Professionals .................................................................................. 29
Alberta ....................................................................................................................... 34
Alberta Construction Industry .................................................................................... 38
RESEARCH QUESTIONS ............................................................................................ 42
LITERATURE REVIEW ................................................................................................. 43
RESEARCH DESIGN .................................................................................................... 45
RESEARCH FINDINGS AND ANALYSIS ..................................................................... 46
International results ................................................................................................... 46
International Construction Results ............................................................................. 47
National Canadian Results ........................................................................................ 48

ii
Canadian Alberta Results .......................................................................................... 49
Canadian Alberta Construction Results ..................................................................... 50
ANALYSIS ..................................................................................................................... 51
Regression Analysis International.............................................................................. 51
United Kingdom Regression .................................................................................. 51
Unites States Regression ....................................................................................... 52
Canada Regression Analysis ................................................................................. 53
Construction Regression Analysis ............................................................................. 54
Canadian Analysis ..................................................................................................... 55
Alberta ....................................................................................................................... 55
Alberta Construction .................................................................................................. 58
ANALYSIS RESULTS ................................................................................................ 61
RECOMMENDATIONS ................................................................................................. 63
CONCLUSION .............................................................................................................. 64
REFERENCES .............................................................................................................. 66
APPENDIX A: International Fatality Numbers ............................................................... 73
APPENDIX B: International Construction Numbers ...................................................... 74
APPENDIX C: Canadian Fatality Numbers ................................................................... 75
APPENDIX D: Canadian Construction Fatalities ........................................................... 76
APPENDIX E: Alberta Fatalities .................................................................................... 77
iii
LIST OF TABLES
Table 1. Total Number of Health and Safety Personnel ................................................ 11
Table 2. Total workforce numbers by Country and Year ............................................... 12
Table 3. Number of Health and Safety personnel per 100,000 Workers ....................... 12
Table 4. Total active safety professionals in United States and Canada ....................... 14
Table 5. Number of Safety Professionals per 100,000 workers .................................... 14
Table 6. Ratio or number of safety practitioners per professional ................................. 14
Table 7. National Fatalities, UK, USA & Canada ........................................................... 15
Table 8. Fatality Rates per 100,000 Workers ................................................................ 16
Table 9. Construction workforces in the UK, USA and Canada .................................... 21
Table 10. Construction Fatalities as a Percentage of National Fatalities....................... 22
Table 11. Construction traumatic fatalities by country ................................................... 22
Table 12. International Construction Fatalities .............................................................. 22
Table 13. Number of practitioners per 100,000 Construction Workers .......................... 25
Table 14. Canadian Traumatic Fatalities by Province ................................................... 28
Table 15. Workforce figures for Canadian provinces..................................................... 28
Table 16. Canadian National and Provincial Fatality Rates ........................................... 29
Table 17. CRSPs across Canada 2000-2011 ............................................................... 29
Table 18. Number of CRSPs per 100,000 workers ....................................................... 30
Table 19. Unadjusted density of CRSPs per 100,000 workers ...................................... 30
Table 20. Fatality rates of three most populous provinces ............................................ 30
Table 21. Percentage of workforce engaged in construction industry ........................... 31
Table 22. Percentage of fatalities attributable to the construction industry.................... 31
Table 23. Number of CRSPs not supervising employees.............................................. 31
Table 24. Number of respondents (n) to BCRSP Salary surveys .................................. 32
Table 25. Adjusted Number of CRSPs and Practitioners in Canada ............................. 32
Table 26. Adjusted rates of professionals and practitioners in Canada ......................... 32
Table 27. Adjusted rates of professionals per 100,000 workers .................................... 32
Table 28. Alberta Ratio or CRSPs to Practitioners per 100,000 Workers...................... 34
Table 29. CRSPs per 100,000 workers ......................................................................... 34
Table 30. Alberta fatality rate ........................................................................................ 35
Table 31. Alberta Fatality Rate including Farm Fatalities .............................................. 37
Table 32. Alberta Construction Fatalities Percentage ................................................... 38
Table 33. Alberta Construction Fatality Rate ................................................................. 38
Table 34. Percentage of CRSPs employed in Construction .......................................... 39

iv
LIST OF FIGURES
Figure 1. Heinrich's Pyramid 1931 Source: Roughton 2008 ............................................ 6
Figure 3. Injury Pyramid Source: HSE Executive 1975 ................................................... 7
Figure 2. Injury Pyramid Source: Roughton 2008 ........................................................... 7
Figure 4. National Fatality Rates ................................................................................... 17
Figure 5. United Kingdom practitioners related to fatality rate ....................................... 18
Figure 6. United States Total Practitioners and Fatalities.............................................. 18
Figure 7. United States Total Fatalities and Professionals ............................................ 19
Figure 8. Canada Total Practitioners and Fatalities ...................................................... 19
Figure 9. Canada Total Professionals and Fatalities ..................................................... 20
Figure 10. Construction Traumatic Fatality Rates per 100,000 Workers ....................... 23
Figure 11. Construction Safety Practitioners and Fatalities per 100,000 Workers ........ 25
Figure 12. Canada Practitioners and Fatalities per 100,000 workers ............................ 33
Figure 13. Canada Professionals and Fatalities per 100.000 workers .......................... 33
Figure 14. CRSPs and National Construction Fatalities per 100,000 Workers .............. 34
Figure 15. Alberta Practitioners and Fatalities per 100,000 workers ............................. 35
Figure 16. Alberta Professionals and fatalities per 100.000 workers ............................. 36
Figure 17. Ontario Fatalities and CRSPs per 100,000 Workers .................................... 36
Figure 18. British Columbia Rates per 100,000 Workers .............................................. 37
Figure 20. Alberta Construction industry CRSPs and Fatality Rate .............................. 39
Figure 21. Alberta Construction Fatalities and Practitioners Rate ................................. 40
Figure 22. Construction Fatality Rates .......................................................................... 40
Figure 23. United Kingdom Regression ......................................................................... 52
Figure 24. United States Regression............................................................................. 52
Figure 25. Canada Regression ..................................................................................... 53
Figure 26. United States Construction Regression ....................................................... 54
Figure 27. Canadian Regression adjusted for CRSPs included in NOC ....................... 55
Figure 28. Alberta Regression ....................................................................................... 56
Figure 29. Ontario Regression ...................................................................................... 56
Figure 30. British Columbia Regression ........................................................................ 57
Figure 31. British Columbia Regression with single independent variable .................... 57
Figure 32. Alberta Regression with single independent variable ................................... 58
Figure 33. Alberta Construction Regression .................................................................. 59
Figure 34. Ontario Construction Regression ................................................................. 59
Figure 35. British Columbia Construction Regression ................................................... 60

v
ABSTRACT
Business support functions are difficult to measure and health and safety is no different
than any other business support function. The profession is a young one, only 35 years
old in Canada and 60 years old in the United Kingdom. That was when certifying bodies
were formed to regulate the new profession. The professional movement was started by
groups of people looking for ways to save lives and prevent injuries. These efforts were
very successful early in the 20th century but the reduction in fatality rates has flattened
out in the last 20 years.
Another interesting development has taken place in that time. The demand for safety
professionals cannot possibly be met by the current production levels and this has been
the case for many years. This has led to larger numbers of people with certifications
from a wide variety of sources are entering the field. Many high risk industries such as
construction prize industry experience over formal education and training and seem to
employ a disproportionate number of these practitioners.
After all this time there is no emphatic answer to the most basic of questions – do safety
professionals save lives? This is their purpose and the reason for the profession, but
how successful is it in today’s world of slowly reducing or flat fatality rates? If it is felt
that these professionals are saving lives, then what about those with certifications or
other qualifications? Can these practitioners be just as effective even in high risk
industries like construction?
There have been research papers exploring the benefit of professionals and even their
impact on injury rates. The effectiveness of professionals versus practitioners is hotly
debated within the industry, particularly in construction. Injury rates are the usual
primary measure of effectiveness. However, injury rates are an unreliable measure as
classification methods differ or do not exist at all.
This paper looks at traumatic fatalities in three countries and ends up looking more
closely at Canada, the province of Alberta and the Alberta construction industry in terms
of safety professional or practitioner effectiveness in preventing traumatic fatalities.
Traumatic fatalities are those that are caused by a workplace incident that results in
fatality. They do not include occupational disease fatalities that can have a smoothing
affect on the fatality rates and mask trends. The curious performance of the construction
industry that seems to be statistically flat in terms of fatalities is also examined.
The evolution of the safety profession is explored. From the early tragedy of the triangle
shirtwaist factory fire that led to the formation of the first safety association in the United
States in 1911, to the formation of the Board of Canadian Registered Safety
Professionals in 1976.

vi
Using a collection of data from the United States, United Kingdom and Canada the
relationship between practitioners and professionals is examined along with their
relationship to fatality rates.
Finally, linear regression analysis finally provides a stark picture of the effectiveness
and value proposition of the safety professional.

1
INTRODUCTION
From a strategy and organizational analysis viewpoint, it is difficult to establish the
effectiveness or value proposition of people focussed corporate services such as HR,
IT, and Health and Safety. These disciplines provide a service and produce no real
product so many assessments of effectiveness or quality of that service are subjective
and coloured by the perceptions and experiences of the person assessing the service.
As a long time Health and Safety Professional, I consistently encounter varied and
ineffective methods of demonstrating value or effectiveness in the safety profession.
Safety is a young profession and only became officially recognized in Canada since
1976 with the formation of the Board of Canadian Registered Safety Professionals
(BCRSP). This organization was created for the sole purpose of certifying professionals
and governing the profession.
Demonstrating the value brought to an organization by a safety professional is usually
fairly difficult and this function tends to be viewed simply as necessary overhead. So
how can an organization determine if it is getting value from employing a safety
professional? While it can be said that the safety professional is responsible for the
creation, fielding and monitoring of a safety management system, many of the
measures suggested determining the effectiveness of the safety professional simply
focus on things like the number of injuries, which is not really something the safety
professional can directly control.
The safety professionals arose out of a commitment by a group of people to save lives,
reduce injuries and reduce workplace related illnesses. The is - Do Safety
Professionals prevent injuries and save lives? Has the profession been successful and
does it remain so? Surprisingly, there is little or no empirical research to demonstrate
safety professionals are successfully preventing injuries illnesses and workplace
fatalities. This determination is made more difficult by the fact that safety has struggled
to gain legitimacy as a profession which has resulted in many more people in the health
and safety profession that are not certified professionals. Very little attention or analysis
has been devoted to determining if these “practitioners” are as effective as safety
professionals. While many argue they are, but again there is no objective evidence that
supports either side of the argument.
We can only look at data that is reliable so looking at injuries is out as many are not
reported or properly classified if such a standard exists. Recordkeeping in the G8
countries should be reliable and obtainable however language barriers would limit this
study to only the three English speaking countries (Canada, United Kingdom, and the
United States).

2
If safety professionals are meant to reduce fatalities, then analyzing the variation
between numbers of professionals and fatality trends may be enlightening in terms of
the effectiveness of professionals and practitioners. It may also provide some insight
into why fatalities are flattening out or may even be rising despite the last 90 years of
effort to reduce them.

3
DEFINITIONS
BCRSP
Board of Canadian Registered Safety Professionals. The professional certification body
for safety professionals in Canada.
BCSP
Board of Certified Safety Professionals. The professional certification body in the United
States.
IOSH
Institute of Occupation Safety and Health. The professional certification body for health
and safety professionals in the United Kingdom.
OSHA
Occupational health and Safety Administration. OSHA regulates workplace health and
Safety in the Unites States
Practitioner.
A person employed in safety more than 50% of the time and who may have extensive
experience or training but has not met the requirements of a third party certifying body
Safety professional.
A person who is certified by a body that exists for that purpose. The certifying body
would not provide the training necessary for the certification or designation and would
be a recognized legal entity. The term is also synonymous with health and safety
professionals, HSE Professionals, and other terms used to describe professionals
operating in the Health and safety, or health safety and environment capacity.
Traumatic Fatality.
An acute incident occurring in the workplace that leads to death or where the cause of
death is not an occupational disease.

4
BACKGROUND
The early years
Not so many years ago, the safety profession was born. Although efforts in workplace
safety date back as far as recorded history, modern safety management was borne out
of the industrial revolution. The first legislation on workplace safety dates back to the
1802 when England passed its first act to protect textile workers (Trades Union
Congress [TUC], 2010).
Early legislation was generally targeted at compensation for injured workers. Prior to the
British Workmen’s Compensation Act in 1897, workmen were deemed to have assumed
the risk associated with employment (Glegg, 1899). Other countries were setting up
similar schemes to compensate injured workers. Germany had enacted a compulsory
scheme in 1884 requiring a sick fund that was contributed to by workers and employers
(Glegg, 1899). These early efforts were the first time that injuries began to cost
employers money. Injuries were becoming something viewed as controllable by the
employer rather than the worker.
Countries in North America soon followed suit with the United States seeing activities to
compensate workers as early as 1902 when the state of Maryland passed a worker’s
compensation law (Institute of Medicine [IM], 2000). In Canada, the first Workers
compensation board was set up in the province of Ontario in 1914 under the Workmen’s
Compensation Act (AWCBC).
The idea that workplace injuries and deaths were socially unacceptable did not really
take root until the 20th century. The modern safety movement really began when HW
Heinrich made a study of the causes of workplace injuries for the insurance industry.
This was the first recognition that injuries were not “accidental” but caused by a number
of factors.
Although Heinrich’s methods and findings in his 1931 book “Industrial Accident
Prevention, A Scientific Approach” remain debated, it marked the beginning of the
modern safety profession. Heinrich was honoured for his work, but his assertion that the
unsafe acts of workers were the principle causes of accidents has been demonstrated
as simplistic (Manuele, 2011, p. 52). In fact, Heinrich's methods were not even scientific
by today’s standards (Erickson, 2011, p. 57). Despite the obvious faults in Heinrich’s
conclusions his work is still widely quoted and referred to. With the facts pointed out by
Manuele et al. that we now realize accidents result from multiple and interacting causal
factors, with only a small number of these lying within control of the worker (Manuele,
2011).

5
Getting organized
Many workplace safety associations were formed in the early 20th century for the
purpose of reducing injuries and deaths in the workplace. Some were formed after an
occurrence that caught widespread public attention. The American Society of Safety
Engineers (ASSE) was founded in 1911 as the United Association of Casualty
Inspectors with 62 members. This was six months after the tragic fire that occurred on
March 25, 1911, when 146 female garment workers died in the Triangle Shirtwaist
Factory fire (ASSE).
The fire was on the top three floors of a 10 story building in New York City and occurred
in the later afternoon just before the shift ended. There were 450 workers in the factory
that day. The doors in the factory were locked to prevent theft or opened inward. The
doors could not be opened when the workers all rushed towards them, pushing them
closed. The fire department arrived but their ladders only reached to the 7th floor as
workers began jumping out of the windows to escape the flames. The rush of workers to
the single fire escape caused it to collapse throwing them to the ground. Safety nets
and blankets were unable to arrest the fall of workers jumping from floors so high (Fox
Business, 2011). It is the national outrage from this incident which led to improvements
in the workplace safety standards in New York (OSHA, 2012).
The Canadian Society of Safety Engineers (CSSE) was formed in 1949 (CSSE) and the
Royal Society for the Prevention of Accidents (Rosa) was formed in was formed in 1916
to address an "alarming increase in traffic accidents” (RoSPA).
What gets measured
Health and Safety departments all over the world measure what are known as lagging
indicators (things that have already happened). Many organizations measure their
performance on the number of failures (injuries) per 100 employees. Key measures
usually revolve around injuries per 100 workers using a standard formula.
The 200,000 is indicative of the hours worked by 100 persons for a year. Companies
usually measure rates for first aid, medical aid (doctor’s assistance or medical attention
required), and lost time injuries (worker misses next shift or shifts after the incident).
Companies also track days workers are away from work and days workers are on
alternate duties as a way to indicate performance.

6
Measuring incidents or injuries is problematic as these are on symptoms or errors in the
safety system. Additionally, standards for classifying injuries and reporting them can
differ widely. In the US the Bureau of Labour Statistics has clear definition for injury
types and requires injuries, illnesses and fatalities be reported to the agency in
accordance with legislation. However, even this is open to some interpretation as well
(Wiatrowski, 2004). Canada lacks any uniform standard and even those that do exist
such as the one from the Canadian Association of Petroleum Producers (CAPP) are rife
with loopholes. With no national Canadian standard, injury figures are ultimately
unreliable. In Britain reporting is also legislated, but only for certain injuries or injuries
that result in time lost from work (HSE Executive). Injuries have a very low level of
confidence for measuring performance and are subject to a large number of variables
and are subject to confusion (Petersen, 2003).
This leaves overall injury reporting somewhat unreliable as a means for comparison of
performance or even to judge performance. There also is the issue of unreported
injuries with only an estimated 60% of injuries actually being reported (Shannon &
Lowe, 2002).
Fatalities as a measure
In Health and Safety there is a belief originally postulated by Heinrich that there is a ratio or relationship between the number of serious injuries or fatalities, and the number of minor injuries or incidents that do not result in an injury (Roughton, 2008). Heinrich’s original numbers from his 1931 book are shown in Figure 1. He suggested that for every 29 minor injuries there was a major injury. This was the first time a ratio of expected occurrences was presented.
Figure 1. Heinrich's Pyramid 1931 Source: Roughton, 2008

7
This idea was improved upon by Bird in 1969 (Bird & Germain, 1996, p. 5). Bird showed
that serious accidents could be linked to fatalities when using a larger data set. He
suggest that 600 incidents or “near misses would lead to 30 accidents causing damage,
which in turn would lead to 10 minor injuries and relate to 1 serious or major injury (Bird
& Germain, 1996, p. 5).
These ratios have been argued for years. However, a subsequent 1974 study by the
HSE Executive in the United Kingdom (Health and Safety Executive, 2011). This study
further refined the idea of the ratio which had stood the test of time. The pyramid is seen
below (Health and Safety Executive, 2011, p. 13) as Figure 3.
Figure 3. Injury Pyramid Source: HSE Executive, 1975
Figure 2. Injury Pyramid Source: Roughton, 2008

8
For years safety professionals have looked at this ratio as predictive of fatalities or
major injuries. However, injury reporting is far from perfect and most countries do not
have national systems to collect statistics. It would be reasonable to believe that most
countries would at least have accurate fatality reporting for workplaces even if injury
reporting was poor.
Even in these cases not all figures can be used for comparisons. A good example of
this is the Russian Federation where 1994 fatalities are 10.6 per 100,000 workers and
lost day cases due to injuries are 0.50 (Rinefort, Petrick, & Schukin, 2001). Clearly in
view of the ratios established these numbers are unreliable. Particularly where we see
the numbers for the USA where injury reporting is mandated by law at 9.0 for fatalities
and 3.9 for lost day cases.
With this information it seems that only fatalities and only those in western countries are
reliable numbers. These numbers, from the G8 countries can be said to be reliable in
the proper context.
The problem with measuring fatalities is the many causes of workplace fatalities. The
leading cause of workplace fatalities is motor vehicle accidents, which are in at least
some cases not controllable by the employer and certainly not within the control of the
worker. Additionally fatalities are attributed in the year which they occur. Those
attributed to occupational disease may be 10 or even 20 years removed from the actual
event that resulted in the exposure that caused the illness. This can have a smoothing
effect on the numbers and make it very difficult to see trends or the realistic picture.
Numbers of deaths from diseases like mesothelioma (cancer caused by asbestos) are
still rising in Canada and not expected to peak in the United Kingdom until the 2010-
2020 period (Sharpe & Hardt, 2006, pp. 67-68).
Relying on these ratios safety professionals often infer that they have prevented injuries
or even prevented fatalities. This is obviously very difficult to prove even if the ratios are
valid. Looking at the larger workforce, it may be possible to infer an effect from safety
professionals but only using a valid measure such as traumatic fatalities, which is those
fatalities that result from a workplace injury or event rather than an occupational
disease. Unfortunately, many Canadian provinces do not track traumatic fatalities
resulting from motor vehicle accidents separately and so the most valid measure is one
of traumatic fatalities.
We can look at traumatic fatalities overall from each of the three countries. Data is
available from Canada, the United States, and United Kingdom.

9
Safety becomes a profession
In the early days, many safety professionals simply did their best with what was at hand.
This led to an informal networking and sharing of ideas that is carried on even today.
There were no college diplomas or degree programs available for people in the
profession and much of the learning was through seminars and conferences. All people
in the safety profession continue to have the same goal - to reduce the human suffering
caused by injuries and fatalities.
The actual profession was borne when certifying bodies began to appear to set
standards of practice, education, and competence. These bodies did not offer the
training that led to certification but were true professional certification bodies much like
those used for more familiar professions such as engineers of doctors. The first of these
was formed in the UK in 1949 as the Institution of Occupational Safety and Health
(IOSH). Later, in North America the ASSE helped form the Board of Certified Safety
Professionals (BCSP) in 1969 and the CSSE helped form the Board of Canadian
Registered Safety Professionals (BCRSP) in 1976.
There is a great deal of debate over what a “Safety Professional” actually is. The use of
qualifications or certifications as designations is rampant and there are some who even
question whether safety is a profession.
The next wave – safety certifications
Over the last 10 or 20 years there has been an explosion in “safety certifications” from a
wide variety of organizations (Adams, Brauer, Karas, Bresnahan, & Murphy, 2004).
Over the last 10 years many certification have even been available online. Official
sounding organizations like the “World Safety Organization” offer safety training and
certifications of a wide variety through their website (World Safety Organization). Some
are much less sophisticated offering certification in only 40 hours of instruction (Certified
Occupational Safety Specialist). In Canada even legitimate safe work focussed
organizations such the Alberta Construction Safety Association offer a safety
certification “Construction Safety Officer” that has become the standard for oil and gas
and construction jobs in the province. This is similar to the “Health and Safety
Professional” certification offered by the New Brunswick Safety Council.
Some of these qualifications are sold as professional designations and the obvious
motivation is business and profit. Others may be well meaning attempts to address a
need that is outstripping supply.

10
It may be that safety professionals are the minority of people operating within the safety
and health discipline today. For example in Alberta there are only about 1,000 practicing
safety professionals today with only about 10% or 100 working in construction
(Assessment Strategies, 2011). However, between January 2006 and the fall of 2011
the Alberta Construction Safety Association certified 2,828 construction safety officers
(ACSA, 2011) or approximately 500 per year.
In the past 20 years an myriad of safety “certifications” has sprung up to address the
shortage of professionals or the needs of specific industries. In the past 10 years some
of these certifications have even been available via correspondence of online. Many
employers do not see the difference between certified safety professionals and those
with certifications provided by a training body, company, or school.
This group that we can term “practitioners” is identified within the population along with
safety professionals and some cases other related specialties by occupation or
speciality codes.
In each country there are National or Standard Occupation Codes (NOC/SOC) that describe specific occupations. In the United Kingdom the one that describes Occupational Health and Safety Professionals is SOC 3567. SOC 3567 is “Health and Safety officer, Occupational hygienist, Safety adviser, Safety officer” (Office of National Statistics, 2000) and it includes safety supervisors but not safety managers (SOC 1239) who are included in a wide range of management classifications. Unfortunately the only count that is available is for SOC 3567. In the United States, the Bureau of Labour Statistics (BLS) keeps a wide variety of workplace data including the number of people in the safety profession. In the case of the US there are three codes that apply. The original code was 29-9010 and after 2003 the codes used were 29-9012 and 29-9011. These codes are described as:
29-9011 Occupational Health and Safety Specialists
Review, evaluate, and analyze work environments and design programs and procedures to control, eliminate, and prevent disease or injury caused by chemical, physical, and biological agents or ergonomic factors. May conduct inspections and enforce adherence to laws and regulations governing the health and safety of individuals. May be employed in the public or private sector. Includes environmental protection officers. Illustrative examples: Industrial Hygienist, Health and Safety Inspector, Environmental Health Sanitarian

11
29-9012 Occupational Health and Safety Technicians
Collect data on work environments for analysis by occupational health and safety specialists. Implement and conduct evaluation of programs designed to limit chemical, physical, biological, and ergonomic risks to workers. Illustrative examples: Construction Health and Safety Technician, Ergonomics Technician, Occupational Health and Safety Technologist (OHST)
Unfortunately as in other cases, managers and directors in the profession are classified along with other managers on other disciplines. Additionally there are some activities that are not directly related to those working in the purely occupational health and safety arena. However, figures for these occupation codes are available. Finally in Canada, Statistics Canada also has an occupation code for safety professionals. The earlier code (C163) gave way to the new code 2263 (Statistics Canada):
2263 - Inspectors in public and environmental health and occupational
health and safety
Inspectors in this unit group evaluate and monitor health and safety hazards and develop strategies to control risks in the workplace. They inspect restaurants, public facilities, industrial establishments, municipal water systems and other workplaces to ensure compliance with government regulations regarding sanitation, pollution control, the handling and storage of hazardous substances and workplace safety. They are employed throughout the private and public sectors.
As in other cases the occupation code contains jobs not strongly linked to those working in occupational health and safety but the difference would likely make up for those missed who are in management positions. Using these codes we can see the number of people employed in these codes in each country in the table below. Table 1. Total Number of Health and Safety Personnel
Occupation Code 2000 2001 2002 2003 2004 2005 2006 2007 2008 2009 2010
USA1 29-9010 and 29-
9011/9012 after
2003
32,390 38,800 39,060 44,700 47,550 44,970 52,240 56,720 63,790 61,920 64,720
UK23567 30,000 30,000 27,000 34,000 32,000 35,000 34,000 35,000 48,000 42,000 34,000
Canada3 2263/C163 13,600 16,000 17,600 16,200 16,900 22,700 25,300 23,900 29,700 31,300 31,900
2. UK Office of National Statistics Annual Q2 report of employment status, occupational and sex. Year 2000 figures are estimated
3. Statistics Canada Labour Force Survey Custom Tabulation
1. US Bureau of labour Statistics (BLS) Occupational Employment Statistics (OES) Survey
We can quickly see from the numbers that the UK has a fairly static number of people working in the field and the Unites States and Canada are showing growth in this area.

12
Pure numbers can be made more relevant when we extrapolate the number of personnel in these occupation codes with regard to the total workforce in each country. Table 2. Total workforce numbers by Country and Year
2000 2001 2002 2003 2004 2005 2006 2007 2008 2009 2010
United States1 129,738,980 127,980,410 127,523,760 127,420,170 128,127,360 130,307,840 132,604,980 134,354,250 135,185,230 130,647,610 127,097,160
United Kingdom227,200,000 27,643,000 27,852,000 28,132,000 28,635,000 28,665,000 28,926,000 29,100,000 29,475,000 28,870,000 28,774,000
Canada3 14,854,900 14,956,500 15,475,000 15,772,600 15,996,200 16,220,600 16,515,900 16,939,800 17,103,800 16,853,300 17,132,900
1. US Bureau of labour Statistics (BLS) Occupational Employment Statistics (OES) Survey
3. Statistics Canada Cansim Table 282-0054
2. UK Office of National Statistics Annual Q2 report of employment status, occupational and sex. Year 2000 figures are estimated
With total workforce numbers and the number of people in the identified occupation codes it is possible to determine how many people there are engaged in front line health and safety or in the health and safety discipline in each country. This number can best be represented by the number of health and safety personnel per 100,000 workers as seen below. Table 3. Number of Health and Safety personnel per 100,000 Workers
2000 2001 2002 2003 2004 2005 2006 2007 2008 2009 2010
USA 24.97 30.32 30.63 35.08 37.11 34.51 39.40 42.22 47.19 47.39 50.92
UK1110.29 108.53 96.94 120.86 111.75 122.10 117.54 120.27 162.85 145.48 118.16
Canada 91.55 106.98 113.73 102.71 105.65 139.95 153.19 141.09 173.65 185.72 186.19
1. Year 2000 number is based on estimates
There are, of course problems with these numbers other than inclusion of other sorts of
disciplines. These numbers do not capture the many part time safety personnel.
Companies may have an HR advisor or coordinator who is also tasked with health and
safety duties. In industrial or construction settings, one of the front line workers may be
tasked with formal health and safety responsibilities in addition to their own role.
Defining the Safety Professional With safety being such a young profession, they are many people who claim professional certification is essential and modern safety professionals must have expertise in a wide variety of areas (Lawrence, 2008). There are also those who claim only basic skills are needed and certification is unnecessary and of questionable value.
This can be more prevalent in the construction industry (Donaghy, 2009) where experiential learning is valued most. There is some research that certainly suggests that safety professionals have a marked impact on the workplace. Unfortunately there is very little scholarly research into health and safety and most efforts are directed into areas of industrial hygiene dealing with chemical exposures (Behm, 2002, p. 38). In business terms this has resulted in jargon that is considered “irrelevant, shallow and inconsistent with standard business terminology” (Blair, 2004, p. 6).
Defined what a safety professional is has been the focus of much rhetoric and
disagreement. The experiential nature of the work dealing with people is
overemphasized by some groups and downplayed by others. Possibly the best article
written on defining a safety professional is the February 1998 article by then Vice

13
President of ASSE professional affairs, Jerry Williams (Williams, 1998). His comments
are applicable across the profession regardless of country. He made several key points
of defining a profession.
1. Academic preparation to meet academic standards set out by certification body;
2. Work experience within the profession;
3. Certification through a third party;
4. Mastered and applies sound knowledge of professions technical and managerial
aspects; and
5. A professional code of conduct.
Professionals are certified by a third party body that exists to oversee and regulate a
profession. There are many examples of this, such a doctors, lawyers, and engineers to
name a few. Certification bodies usually will not provide any training towards
certification unless it is training on ethics, legal duties of the code of conduct.
Certification bodies usually set the standard for academic requirements for the
profession. While this varies over different countries, it is invariably a degree of diploma
in the discipline of the profession or a related discipline. The requirement for work
experience is common but can vary in length. All professions have a code of conduct to
which their members can be held accountable before their peers in order to assure
professional conduct.
The final aspect in safety designations is continuing professional development
requirements. This is common in most countries and audited on a rotating basis by the
certifying body. This adds a sixth and critical requirement since safety is a young and
still evolving profession.
In order to meet these requirements, many of the early safety associations separated
from or spawned the certification bodies that exist today. Using these definitions there
are only is only a single body in each of the countries of focus.
Canada – Board of Canadian Registered Safety Professionals – CRSP Designation United Kingdom – Institute of Occupational Safety and Health – Charter Member United States - Board of Certified Safety Professionals – CSP Designation How many professionals are there?
All professional organizations do tend to keep track of their members and so finding out how many professionals there are in a given year is not difficult, once we have defined what a professional is. The number of professionals is tracked fairly well by the North American associations but unfortunately accurate numbers are not available from IOSH in the United Kingdom.

14
Table 4. Total active safety professionals in United States and Canada
2000 2001 2002 2003 2004 2005 2006 2007 2008 2009 2010
United States1 9910 9990 10106 10245 10582 10768 11062 11344 11789 12243 12574
Canada2 1264 1338 1487 1594 1766 1950 2284 2490 2785 3015 3341
1. Board of Certified Safety professionals Figures for 2000 and 2001 estimated
2. Board of Canadian Registered Safety Professionals
The number of safety professionals has grown between the year 2000 and 2010. Both the Unites States and Canada show significant growth. Average annualized growth for the Unites States is 2.63% and Canada has shown average growth of 10.25%. Canada also displays the largest growth in the occupation code number in Table 1. Professionals only make up a portion of the total numbers of people in safety. They are far outnumbered by others in the field (practitioners). Becoming a certified or registered safety professional, or a chartered member of IOSH requires a certain amount of time or experience in practice, so these practitioners make up some of the numbers as they progress towards achieving a designation. Only a percentage of safety professionals are actually involved in front line service delivery. Using the unadjusted numbers we can see the number of safety professionals per 100,000 workers in the Table 5. Table 5. Number of Safety Professionals per 100,000 workers
2000 2001 2002 2003 2004 2005 2006 2007 2008 2009 2010
United States 7.64 7.81 7.92 8.04 8.26 8.26 8.34 8.44 8.72 9.37 9.89
Canada 8.51 8.95 9.61 10.11 11.04 12.02 13.83 14.70 16.28 17.89 19.50
The numbers of professionals is significantly lower than the numbers quoted in Table 3. If we combine the results in table 3 and 5 we can see a ratio of the numbers of professionals to practitioners per 100,000 workers in both the Unites States and Canada. Table 6. Ratio or number of safety practitioners per professional
2000 2001 2002 2003 2004 2005 2006 2007 2008 2009 2010
United States 2.27 2.88 2.87 3.36 3.49 3.18 3.72 4.00 4.41 4.06 4.15
Canada 9.76 10.96 10.84 9.16 8.57 10.64 10.08 8.60 9.66 9.38 8.55
Although these numbers are not adjusted to reflect the number of professionals engaged in management or supervisory activities placing them in other occupation codes, it is plain to see that there is a growing trend in the Unites States where practitioners have doubled in relation to professionals. In Canada, professionals are routinely outnumbered about 10 to 1 in a trend that seems flat.

15
TRENDS IN FATALITIES
There has been ample evidence over the last 90 years that safety programs or systems
that are well conceived and executed can save lives and reduce injuries (Greer, 2001).
A properly designed and implemented management system can be very successful in
meeting the goal of reducing incidents, injuries, and eliminating fatalities. However,
those company or workplace specific systems are usually designed and implemented
by professionals. While the effectiveness of such systems in not in question, it is only by
inference that we can say that the safety professional has affected the outcome or has
affected the outcomes more than someone not certified.
While the early efforts in safety were successful in what were very dangerous
workplaces at the time, things have changed along with thinking and methods. A
flattening of fatality and injury rates along with rising numbers of people in the safety
discipline begs explanation.
Fatality rates have begun to level out over the last 10 years, particularly in high risk
industries like construction and agriculture. Overall, national fatality rates show a slow
downward trend.
Table 7. National Fatalities, UK, USA & Canada
2000 2001 2002 2003 2004 2005 2006 2007 2008 2009 2010
United States1 5920 5915 5534 5575 5764 5734 5840 5657 5214 4551 4690
United Kingdom2 292 251 227 236 223 217 233 233 179 147 171
Canada3 386 365 321 320 287 322 268 272 279 253 235
3. Source is regulatory agencies of worker compensation boards in provinces. Federal workplaces, Quebec, Yukon, Northwest Territories, and Nunuvit are excluded.
1. Does not include fatalities from World Trade Centre attack. Source is Bureau of Labour Statistics
2. UK HSE Executive. RIDDOR data
Although significantly smaller in population, Canada also shows consistently higher
fatalities than the United Kingdom that has approximately twice the population. This can
be explained in reporting differences. The United Kingdom does not count motor vehicle
fatalities for workers while at work or in the course of work (Parlimentary Advisory
Council for Transport Safety, 2006). This practice results in much lower number and
hence lower rates as fatalities from motor vehicle accident are the leading cause of
workplace fatalities according to the National Safety Council accounting for almost half
of all occupational deaths on the job (National Safety Council, 2011, p. 51). In the
Canadian province of Alberta motor vehicle accidents also account for almost half of
workplace fatalities.
Different philosophies in terms of regulatory approach may also have an effect. The
United Kingdom relies primarily on a performance based approach that focuses on
outcomes. The philosophy is one of identifying and managing risk (HSE Executive,
2006). Canada can be said to be more focussed on compliance philosophies (Ontario
Ministry of Labour, 2010, p. 45) where the focus is on complying with specific legislated
requirements. This is a standard prescriptive approach where the focus in based upon

16
compliance with the prescribed legal standards. It can be said that no jurisdiction is
entirely compliance or performance based. However, the United Kingdom is much more
focussed on risk management (HSE Executive, 2006, p. 20). In the United States, much
like Canada there is a mix of both prescriptive and performance based approaches (US
Department of Labour, 2012). Inevitably when there is a major incident in Canada or the
United States, the response is almost invariably prescriptive in the form of legislative
change or more regulations defining the minimum requirements that must be complied
with (Macza, 2008). Performance based standards and legislation do hold benefits for
Canada and the United States (Coglianese, Nash, & Olmstead, 2002), but these
countries have been slower to adopt this approach than the United Kingdom and do not
necessarily embrace a risk management philosophy.
Fatality rates are a function of work force population as shown in Table 2. Using these
numbers it is possible to calculate the fatality rate per 100,000 workers for each country.
Table 8. Fatality Rates per 100,000 Workers
2000 2001 2002 2003 2004 2005 2006 2007 2008 2009 2010
United States 4.56 4.62 4.34 4.38 4.50 4.40 4.40 4.21 3.86 3.48 3.69
United Kingdom 1.06 0.91 0.82 0.84 0.78 0.76 0.81 0.80 0.61 0.51 0.59
Canada1 3.37 3.17 2.70 2.64 2.33 2.57 2.10 2.08 2.11 1.95 1.78
1. Does not include Federal workplaces, Quebec, Yukon, Northwest Territories, or Nunuvit
The rates show that Canada and the United States have very similar rates, which may
be due to their proximity and similar legislative styles in terms of the approach taken to
occupational health and safety legislation. The United Kingdom shows significantly
lower rates than the North American countries. Even taking into account the fact that the
United Kingdom discounts almost half of occupational fatalities because they involve
motor vehicles (47% according to the National Safety Council in 2011 et al), allowing for
that number would still show lower numbers than the United States and Canada.
Doubling the United Kingdom rate for 2010 would be 1.18 which shows considerably
better performance overall. The rates are graphically represented below.

17
0.00
0.50
1.00
1.50
2.00
2.50
3.00
3.50
4.00
4.50
5.00
2000 2001 2002 2003 2004 2005 2006 2007 2008 2009 2010
United States United Kingdom Canada
Figure 4. National Fatality Rates
In this case the numbers do not seem to spiking as they did in the Unites States in the
1980s (Scherer, Petrick, & Quinn, 1996, p. 11). The rates show a consistent, but slight
downward trend. It may be that the economic recession in 2009 could have had an
effect in the workplace and explain some of the change in numbers in 2009/2010. In two
cases we see a slight increase from 2009 to 2010.
Linking Performance
The United Kingdom Health and Safety Executive have assumed a leadership role in
health and safety studies and research. A report entitled “Superior Safety Performance
the IOSH names “health and safety competence” as one of the three key elements of
successful Health and Safety Management (Cameron, Hare, & Duff, 2007, p. 10). It also
shows that companies within the construction industry that employ safety professionals
had an accident frequency half that of other companies (Cameron, Hare, & Duff, 2007,
p. 47). This agrees with another IOSH report on the impact of expert health and safety
advice, showing that in house safety professionals are superior to external consultants
or a mix (Cameron, Hare, & Roy, 2008).
We can look at the number of safety practitioners as identified by the National
Occupation Codes in each country and the comparison to fatalities in those countries.

18
0.00
0.20
0.40
0.60
0.80
1.00
1.20
0.00
20.00
40.00
60.00
80.00
100.00
120.00
140.00
2000 2001 2002 2003 2004 2005 2006 2007 2008 2009 2010
Practitioners per 100,000 workers Fatalities per 100,000 workers
Figure 5. United Kingdom practitioners related to fatality rate
We can see that the number of practitioners is very high using the left hand axis
compared the number of fatalities (right hand axis). The data sets do trend significantly
well together. Unfortunately the numbers of practicing professionals is not available in
the United Kingdom so we must look to the United States and Canada for that data.
0.00
5.00
10.00
15.00
20.00
25.00
30.00
35.00
40.00
45.00
2000 2001 2002 2003 2004 2005 2006 2007 2008 2009 2010
Fatalities per 100,000 workers Practitioners per 100,000 workers
Figure 6. United States Total Practitioners and Fatalities In the above chart for the United States, we see that the number of practitioners has been rising significantly while fatality numbers have changed little. In the US in 1999 there were about 10,000 safety professionals for a workforce of 139 million and deunionization may have negatively affected that ratio (Rosen, 2000, p. 458).
19
0.00
2.00
4.00
6.00
8.00
10.00
12.00
2000 2001 2002 2003 2004 2005 2006 2007 2008 2009 2010
Fatalities per 100,000 workers Professionals per 100,000 workers
Figure 7. United States Total Fatalities and Professionals
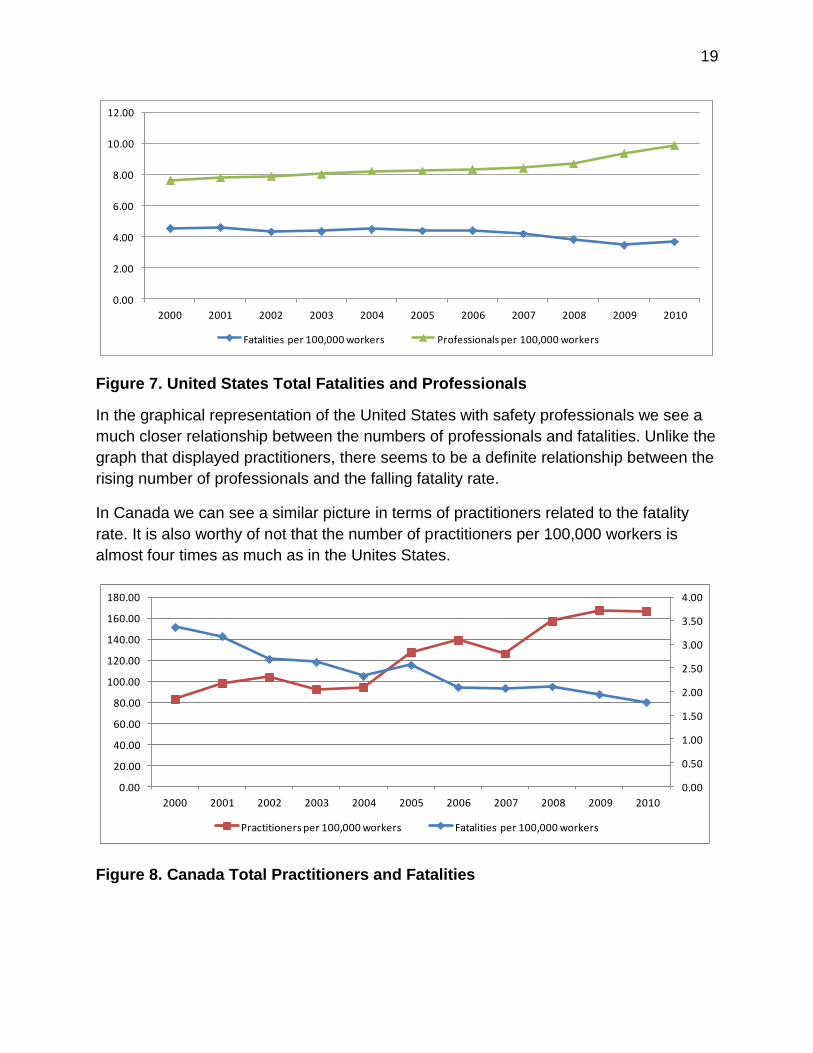
In the graphical representation of the United States with safety professionals we see a
much closer relationship between the numbers of professionals and fatalities. Unlike the
graph that displayed practitioners, there seems to be a definite relationship between the
rising number of professionals and the falling fatality rate.
In Canada we can see a similar picture in terms of practitioners related to the fatality
rate. It is also worthy of not that the number of practitioners per 100,000 workers is
almost four times as much as in the Unites States.
0.00
0.50
1.00
1.50
2.00
2.50
3.00
3.50
4.00
0.00
20.00
40.00
60.00
80.00
100.00
120.00
140.00
160.00
180.00
2000 2001 2002 2003 2004 2005 2006 2007 2008 2009 2010
Practitioners per 100,000 workers Fatalities per 100,000 workers
Figure 8. Canada Total Practitioners and Fatalities

20
The number of practitioners in Canada and the fatality seem related. Practitioners seem
to be rising as the fatality rate falls. However the relationship is exaggerated by the two
different scales on the graph with the lower scale for fatalities being on the right.
0.00
5.00
10.00
15.00
20.00
25.00
2000 2001 2002 2003 2004 2005 2006 2007 2008 2009 2010
Fatalities per 100,000 workers Professionals per 100,000 workers
Figure 9. Canada Total Professionals and Fatalities
The relationship of professionals to reduction in the number of fatalities seems to follow
the pattern seen in the United Sates numbers where rising numbers of professionals
seem to correspond with a reduction in the fatality rate.
High risk industries
In many cases construction is seen as the most dangerous overall industry by many.
However, this is far from the truth. While construction remains a high risk sector, the
highest risk sector in all countries tends to be agriculture. Agriculture routinely tops the
list for fatalities in Canada, Unites States, and the United Kingdom. Agriculture tends to
use large complicated equipment with many moving parts and workers are often
working alone. The workforce in agriculture also has a large range from teenagers to
farmers over 70 years old.
In the United Kingdom, farm or agricultural fatalities consistently are the highest of any
industrial group (HSE Executive). The United States does not fully regulate farms but
also sees this as a high fatality sector, with construction fourth after mining and
transportation (National Safety Council, 2011, p. 52). The regulator in the United States
(OSHA) also views farms as high risk (OSHA). Several exemptions on legislation affect
the safety standards at farms (Runyan). This exemption of farms from formal safety
regulation also extends to Canada where one major province (Alberta) still exempt
farms from safety regulation (Government of Alberta, 1995). Estimates of farm related
deaths in Alberta would make it the highest fatality industry in the province (The

21
Canadian Press, 2012). Other provinces have moved towards regulation in this area
such as Ontario in 2006. This has been the topic of much discussion and argument
amongst the agriculture industry and government. The view is certainly that regulating
the industry would have significant cost to government as the provinces must in fund
regulation unless the farm is deemed to fall under federal jurisdiction. The agricultural
industry also views complying with safety standards that were mostly drafted in
response to industrial situations as costly. However, with uneven regulation and
reporting, the real picture on farm safety remains elusive. One report from the Canadian
Agriculture Safety Association gives the number of farm fatalities in Canada at 1,769
from 1990-2005 or an average of 110 fatalities per year in a country that shows
approximately 300 traumatic fatalities per year – a number that does not include
agricultural fatalities (Canadian Agricultural Injury Survellance Program, 2008).
In all three countries construction is identified as a high risk industry. Construction may
have slightly different classifications by country, but overall the similarities certainly
outweigh the differences. Where North America is fairly consistent with an industry
labelled simply construction, the statistic in the United Kingdom are framed around
“Skilled Trades Occupations”. This classification unfortunately includes weavers,
printers and farmers which are arguably not construction workers.
The construction workforce is considerably smaller and in most cases represents a
small percentage of the national workforce. The United States average approximately
5% of the national workforce in construction. In Canada and the United Kingdom it is
close to double that as seen in the Table 9. It is also noteworthy that Canada seems to
have the only construction workforce that is not static but actually rising as a percentage
of the overall work force.
Table 9. Construction workforces in the UK, USA and Canada
2000 2001 2002 2003 2004 2005 2006 2007 2008 2009 2010
United States1 6,187,360 6,239,430 6,124,600 6,776,700 6,891,440 7,215,240 7,633,080 7,671,680 7,456,300 6,497,870 5,662,980
% of workforce 4.77% 4.88% 4.80% 5.32% 5.38% 5.54% 5.76% 5.71% 5.52% 4.97% 4.46%
United Kingdom2 3,210,000 3,247,000 3,271,000 3,239,000 3,252,000 3,244,000 3,149,000 3,288,000 3,221,000 3,050,000 3,094,000
% of workforce 11.70% 11.75% 11.74% 11.51% 11.36% 11.32% 10.89% 11.30% 10.93% 10.56% 10.75%
Canada3 648,800 661,400 708,400 747,600 815,300 850,400 900,300 937,100 991,900 946,100 974,600
% of workforce 5.66% 5.75% 5.96% 6.16% 6.62% 6.80% 7.06% 7.17% 7.50% 7.28% 7.39%
3. Canadian figures do not include Quebec Yukon, Northwest Territories, or Nunuvit. Statistics Canada Cansim table 282-0007
1. Bureau of Labour Statistics (BLS) National Occupation System (NOS) estimates
2. Numbers for the year 2000 are estimated. Office of National Statistics (ONS) report EMP16 2nd Quarter
In looking at construction traumatic facilities we see a substantial portion of national fatalities are attributed to this high hazard industry. In the United States, construction workers represent and average, over the 11 years as shown in Table 9, 5.2% of the workforce. In the United Kingdom the construction workforce is approximately 11% of the workforce on average. In Canada where the construction workforce is rising it accounts for an average of approximately 7% of the work force.

22
Table 10. Construction Fatalities as a Percentage of National Fatalities
2000 2001 2002 2003 2004 2005 2006 2007 2008 2009 2010 Avg
United States 18.83% 20.73% 20.33% 20.20% 21.24% 20.68% 20.99% 20.82% 18.58% 17.93% 16.01% 19.67%
United Kingdom 35.96% 31.87% 30.84% 30.08% 30.94% 27.65% 33.91% 30.90% 29.05% 27.89% 29.24% 30.76%
Canada 19.17% 21.64% 20.87% 34.38% 24.39% 27.95% 33.96% 31.99% 30.82% 36.36% 33.62% 28.65%
As we see in Table 10, construction fatalities represent a disproportionate percentage of the fatalities. The United States has the smallest percentage of workers engaged in construction shows almost 30% of fatalities comes from a sector where only 5% of the workforce is employed. The United Kingdom shows the highest average percentage of national fatalities in construction at 30% and also the highest percentage of workforce engaged in construction at 11%. Canada shows the lowest percentage of national fatalities in construction at just under 20% and comes in the middle with an average of 7% of the workforce engaged in construction. Table 11. Construction traumatic fatalities by country
2000 2001 2002 2003 2004 2005 2006 2007 2008 2009 2010 Average
United States 18.02 19.65 18.37 16.62 17.76 16.44 16.06 15.36 13.00 12.56 13.26 16.10
United Kingdom 3.27 2.46 2.14 2.19 2.12 1.85 2.51 2.19 1.61 1.34 1.62 2.12
Canada1 11.87 12.55 10.45 15.65 9.93 11.64 11.11 9.92 10.28 9.94 9.23 11.14
1. Canadian figures do not include Federal Workplaces, Quebec, Yukon, Northwest Territories, or Nunuvit.
When looking at the national fatality rates in comparison, it is understandable to see
why construction has garnered so much attention in the United States and the United
Kingdom. Canada, lacking any national tracking and attention to these sorts of statistics,
remains somewhat unaware of the affect that the construction industry has on
workplaces fatalities.
Table 12. International Construction Fatalities
2000 2001 2002 2003 2004 2005 2006 2007 2008 2009 2010
United States1 1115 1226 1125 1126 1224 1186 1226 1178 969 816 751
United Kingdom2 105 80 70 71 69 60 79 72 52 41 50
Canada3 77 83 74 117 81 99 100 93 102 94 90
1. Bureau of Labour Statistics (BLS) annual news release
2. Office of National Statistics (ONS)
3. Canadian figures do not include Federal workplaces Quebec Yukon, Northwest Territories, or Nunuvit. Data for Ontario in the year 2000 is estimated.
Canada is the only country showing an increase in the number of fatalities, with 90 in
2010 versus 77 in 2000. The drop from 102 in 2009 to 940 in 2010 could be attributed to
the recession that began in early 2009.
As we see from the fatality rates, the construction industry rates are four or five times
higher than the national rates for each country as shown in Table 8. This is confirmation
of construction as a high hazard industry and also one that is showing little improvement
over the time period covered. Using the full data range an improvement of only 2.0% a
year is noted for Canada and the USA with a 4.6% annual average improvement for the
United Kingdom. There are some large variations in the data such as 2002-2003 in the
United States where we see a sharp decrease of almost 10% in single year. 2005-2006
in the United Kingdom shows an annual increase of 36%. Even Canada in 2003-2004

23
shows a reduction of 57%. There is a consistent reduction trend but it is subject to
significant variations and the improving economies may lead to higher fatality rates in
2011-2013.
0.00
5.00
10.00
15.00
20.00
25.00
2000 2001 2002 2003 2004 2005 2006 2007 2008 2009 2010
United States United Kingdom Canada
Figure 10. Construction Traumatic Fatality Rates per 100,000 Workers
Overall construction fatality rates are falling but not as quickly as overall fatality rates
nationally in each of the countries. This may be explained by the loss of manufacturing
jobs in the three countries along with increasing automation. Manufacturing is the
industry sector that also is one of the highest risk industries in terms of fatalities. All of
the countries show significant decreases in manufacturing jobs. Canada lost one in
seven manufacturing jobs between 2004 and 2008 for a total of 322,000 jobs (Bernard).
In the United States has also seen a sharp drop in manufacturing jobs and a continuing
decreasing trend that can be traced back to the 1960s (US Department of Commerce,
2010). In the US manufacturing has fallen from the largest employer in 1972 to the sixth
largest after the hospitality industry in 2012 (Goldstein & Vo, 2012). In the United
Kingdom a similar trend is also evident with a steady drop in the number of
manufacturing jobs (UK Department for Business Innovation & Skills, 2010).
The construction industry puzzle
All safety organizations seek to reduce injuries and fatalities. In fact, safety is really
about lives (Ceniceros, 2009) and that is where the focus has always been in preventing
harm. The only gauge we have is annual fatality numbers that are no longer dropping as
they have in the past. Between 1912 and 1999 US fatalities dropped 90% (Greer, 2001)
but reductions these days are small and some industries like construction are
statistically flat. This is the case in the US, Canada, and the United Kingdom and has
garnered particular attention in the UK and the US. In 2008, the UK commissioned an

24
inquiry into “the unacceptable level of fatalities in the construction industry” (Donaghy,
2009). In the US, concern of construction fatalities is also apparent with construction
having the highest incident rates 1992-2002 (Choi, Kapp, & Cole, 2006, p. 41). The
Occupational Safety and Health Administration (OSHA) in the United States, has
dedicated considerable attention to the construction injury due to higher injury and
fatality rates (OSHA, 2008).
Only one study has linked the number of safety professionals to results directly. The
study conducted by Professor J. Hinze in the United States construction industry shows
a strong relationship between the ratio of safety professionals to employees and safety
performance (Cameron, Hare, & Duff, Superior Safety Performance, 2007, p. 15). This
research shows a relationship between the injury rate per 100,000 employees and the
number of safety personnel as shown in Figure 4.
Figure 4. Table from Hinze study Source: Cameron, Hare, & Duff, 2007 Although many of the same activities and processes are required for injury prevention those activities do not necessarily prevent fatalities. As some have correctly pointed out, preventing incidents further down the pyramid does not necessarily mean preventing a fatality (Krause, Groover, & Martin, 2010, p. 50) as health and safety systems are complex. It is these complexities that may require safety professionals and expert advice as proposed by IOSH (Cameron, Hare, & Duff, The impact of expert health and safety advice, 2007, p. 7). However, there is clearly a ratio established between serious incidents (including fatalities) and less serious ones such as minor injuries. Many other studies have inferred a link between safety professionals and results, but there are other elements in the workplace such as the surging numbers of people or practitioners with other certifications.

25
Unfortunately, the numbers of safety persons employed in construction is not easily
available. The United States Bureau of Labour Statics does have such statistics and
using these numbers we can show the number of safety people employed by National
Occupation Code in the main construction industry (industry code 23). Prior to 2003, the
industry was broken down into segments that included:
Industry code 15: Building Construction General Contractors and Operative
Builders,
Industry code 16: Heavy Construction Other Than Building Construction
Contractors, and
Industry code 17: Construction Special Trade Contractors.
The numbers of practitioners and rate per 100,000 workers in construction are
represented in Table 13.
Table 13. Number of practitioners per 100,000 Construction Workers
2000 2001 2002 2003 2004 2005 2006 2007 2008 2009 2010
Occ Codes 29-
9010, 9011,90121 420 1210 1300 1443 1720 1080 1290 1700 2010 2300 2580
# per 100,000 6.79 19.39 21.23 21.29 24.96 14.97 16.90 22.16 26.96 35.40 45.56
1. Source US Bureau of Labor Statistics, Department of Labor Occupational Employment Statistics (OES) Survey
Table 13 shows a rising ratio of practitioners in construction. By 2010 the ratio is
approaching the national numbers shown in Table 3 but far below this number in 2000
where the national ratio is 24.97.
0.00
5.00
10.00
15.00
20.00
25.00
30.00
35.00
40.00
45.00
50.00
2000 2001 2002 2003 2004 2005 2006 2007 2008 2009 2010
Practitioners Fatality rate
Figure 11. Construction Safety Practitioners and Fatalities per 100,000 Workers
There are clearly a sharply rising number of people entering the safety field in
construction. However, there sharply rising numbers since 2005 do not seem to have
significantly impacted the fatality rate.

26
Some high risk industries like agriculture and construction prize experience over
education and tend to employ safety personnel who may not have a college diploma or
university degree. In construction many safety people are trades or craft workers who
have switched roles. It is in the construction industry where the question on
effectiveness of professionals versus practitioners is most often asked and debated.

27
THE CANADIAN PICTURE
Canada is the country that lags the Unites States and the United Kingdom in terms of
health and safety legislation, creation of associations and finally the establishment of
safety as a profession. In Canada the safety profession seems to be in a strong growth
phase.
Unlike some the other countries, health and safety is primarily regulated by provinces.
Each has its own legislation and there are significant differences. Each province also
has its own Worker’s Compensation Board. In each province, statistics are kept in
relation to priorities for the regulators and the provincial WCB. Canadian federally
regulated workplaces like airports, harbours and federal government operation do not
routinely keep statistics that differentiate between traumatic fatalities and occupational
disease fatalities. There is no national repository of information relating to workplace
safety. Although Statistics Canada does fulfil some of those functions like the United
Kingdom’s, Office of National Statistics, or the United States’ Bureau of Labour
Statistics it does not track information in detail related to workplace safety.
There is no comparative agency in Canada that mimics the function of the HSE
executive in the United Kingdom or OSHA in the United States. The Association of
Worker Compensation Boards of Canada does gather basic performance data such as
fatalities, and injuries. As we have seen, injuries in Canada are subjectively classified
with no national standard or even regulatory reporting requirements such as those seen
in the United States or the United Kingdom. Fatalities remain the only reliable measure.
Unfortunately some worker compensation boards only track claims and not their cause
as is the case for some regulators. In some cases, such as Quebec, the data is simply
not easily available.
There Association of Worker Compensation Board of Canada (AWCBC) and data is
available on a national basis. However, the data set is not a rich one and only contains
basic information concerning number of claims and not necessarily the types of claims.
In the case of fatalities only the number is tracked and no differentiation is made
between those that result from occupational disease or from acute incidents in the
workplace. This has been identified as a barrier in other research, particular a 2006
research paper on fatalities in Canada (Sharpe & Hardt, 2006). Numbers from worker
compensation boards are not entirely reliable since in Canada not all workers are
covered by compensation Boards and coverage requirements vary across the country
(Sharpe & Hardt, 2006, pp. 18-19).
In each province different information is available so it is not actually possible to extract
a number of fatalities nationwide that are related to motor vehicle accidents as can be
done in the United States or as is done in the United Kingdom. With no standard

28
methodology employed across the country and the figures being provided by both
regulatory agencies and worker compensation boards, fatalities are the only universal
measure that can be applied.
Table 14. Canadian Traumatic Fatalities by Province
2000 2001 2002 2003 2004 2005 2006 2007 2008 2009 2010
Newfoundland1 21 14 10 9 10 13 8 7 6 25 13
PEI2 0 4 2 0 3 1 1 3 2 2 0
Nova Scotia3 14 15 12 19 24 15 12 6 20 16 12
New Brunswick4 7 13 11 8 6 10 7 8 11 12 6
Ontario5 125 104 106 103 95 79 83 95 71 66 71
Manitoba6 25 28 17 16 16 19 15 31 24 19 14
Saskatchewan7 35 29 16 15 6 14 6 7 9 11 8
Alberta8 60 48 46 46 44 46 37 47 52 41 43
British Columbia9 99 110 101 104 83 125 99 68 84 61 68
Canada10 386 365 321 320 287 322 268 272 279 253 235
7. Saskatchewan numbers provided by the Worker's Compensation Board on request.
8. Alberta numbers provided by Worker's Compensation Board on request.
9. British Columbia numbers acquired from WorkSafe BC Statistical reports
10. Canadian numbers do not include Federal workplaces, Quebec, Yukon, Northwest Territories, and Nunuvit.
6. Manitoba numbers acquired from Worker's Compensation Board Statistical Reports
1. Newfoundland numbers provided by Worker's Health Safety and Compensation Commission on request.
2. PEI numbers provided by Worker's Compensation Board on request.
3. Nova Scotia numbers provided by Nova Scotia Labour on request.
4. New Brunswick numbers provided by WorkSafe New Brunswick on request.
5. Ontario numbers provided by the Worker's Safety and Insurance Board on request.
The number of fatalities varies widely in relation to the workforce in each province.
Workforce figures appear below.
Table 15. Workforce figures for Canadian provinces
2000 2001 2002 2003 2004 2005 2006 2007 2008 2009 2010
Newfoundland 199,800 206,100 205,100 208,700 208,700 210,300 215,500 215,600 213,000 210,900 219,800
PEI 61,100 62,500 63,300 65,000 67,000 67,400 66,900 67,500 67,200 69,000 68,800
Nova Scotia 411,600 423,100 427,000 434,700 442,600 441,800 444,100 452,100 453,800 454,400 449,000
New Brunswick 334,400 333,500 344,800 344,000 348,800 346,700 346,700 358,000 358,600 359,300 352,300
Ontario 5,892,800 5,934,400 6,124,900 6,259,600 6,338,800 6,411,600 6,480,100 6,626,100 6,670,100 6,542,200 6,658,900
Manitoba 551,700 559,700 571,800 571,400 582,800 583,200 589,600 602,500 610,100 607,100 622,300
Saskatchewan 467,700 452,700 476,600 475,100 485,600 477,200 501,200 505,800 518,300 519,200 522,600
Alberta 1,598,200 1,638,200 1,700,500 1,754,400 1,787,700 1,844,700 1,941,700 2,003,100 2,069,500 2,009,600 2,029,800
British Columbia 1,938,600 1,895,500 1,971,000 2,022,300 2,053,300 2,124,300 2,172,000 2,246,500 2,257,500 2,227,900 2,269,600
Canada111,455,900 11,505,700 11,885,000 12,135,200 12,315,300 12,507,200 12,757,800 13,077,200 13,218,100 12,999,600 13,193,100
1. Statistics Canada Cansim Table 282-0054 Annual December numbers
Using the data we can see the most populous provinces having the largest overall
workforce. Ontario has the most workers by a large margin with British Columbia and
Alberta rounding out the top three. With this data we can see the wide range of fatality
rates across the country.

29
Table 16. Canadian National and Provincial Fatality Rates
2000 2001 2002 2003 2004 2005 2006 2007 2008 2009 2010
Newfoundland 10.51 6.79 4.88 4.31 4.79 6.18 3.71 3.25 2.82 11.85 5.91
PEI 0.00 6.40 3.16 0.00 4.48 1.48 1.49 4.44 2.98 2.90 0.00
Nova Scotia 3.40 3.55 2.81 4.37 5.42 3.40 2.70 1.33 4.41 3.52 2.67
New Brunswick 2.09 3.90 3.19 2.33 1.72 2.88 2.02 2.23 3.07 3.34 1.70
Ontario 2.12 1.75 1.73 1.65 1.50 1.23 1.28 1.43 1.06 1.01 1.07
Manitoba 4.53 5.00 2.97 2.80 2.75 3.26 2.54 5.15 3.93 3.13 2.25
Saskatchewan 7.48 6.41 3.36 3.16 1.24 2.93 1.20 1.38 1.74 2.12 1.53
Alberta 3.75 2.93 2.71 2.62 2.46 2.49 1.91 2.35 2.51 2.04 2.12
British Columbia 5.11 5.80 5.12 5.14 4.04 5.88 4.56 3.03 3.72 2.74 3.00
Canada 3.37 3.17 2.70 2.64 2.33 2.57 2.10 2.08 2.11 1.95 1.78
Fatality rates vary widely but the overall national trend is showing a positive reduction
over the time period shown. Overall there is a reduction from 2000 to 2010 of 47% or an
annual reduction of just over 4% nationally.
Canadian Safety Professionals
Canadian safety professionals (CRSPs) are spread across Canada. They are primarily
employed in Ontario and Alberta. A 10 year breakdown appears in the table below.
Table 17. CRSPs across Canada 2000-2011
YEAR 1976 2000 2001* 2002 2003 2004 2005 2006 2007 2008 2009 2010 2011
TOTAL** 74 1756 1873 2047 2196 2428 2633 2899 3182 3516 3871 4216 4509
ACTIVE** 1264 1338 1487 1594 1766 1950 2284 2490 2785 3015 3341 3576
ALBERTA 14 313 342 393 434 496 563 679 760 873 970 1103 1210
BC 0 107 117 134 148 169 192 231 259 297 330 375 411
MANITOBA 2 50 52 56 59 64 69 79 84 92 97 105 109
NEW BRUNSWICK 1 42 42 45 45 47 49 54 55 56 56 57 55
NEWFOUNDLAND 1 47 49 54 58 63 69 80 87 96 103 113 120
NOVA SCOTIA 2 60 62 68 72 78 85 97 104 114 121 132 138
ONTARIO 41 534 556 607 640 696 755 869 930 1020 1083 1177 1235
PEI 0 6 6 7 7 7 8 9 9 10 10 11 11
QUEBEC 7 10 11 13 14 16 19 23 26 30 33 38 42
SASKATCHEWAN 1 39 42 48 53 60 67 80 89 102 113 127 139
TERRITORIES 1 9 9 10 10 11 11 12 13 13 14 14 14
INTERNATIONAL 4 47 48 52 54 58 62 71 74 80 84 89 92
* Figures from 2001-2009 and 2011 were extrapolated using provincial numbers from 2000 and 2010 along with annual totals provided by BCRSP.
** Total and total active figures were obtained from BCRSP
Over a ten year period the number of CRSPs in Canada has more than doubled where
practitioners have almost tripled. In 2010, approximately 33% of CRSPs were working in
Alberta and 35% in Ontario. These two provinces account for 68% of all working
CRSPs. In this time the number of CRSPs in Alberta has more than tripled. Ontario has
retained the highest number of CRSPs accounting for 45% of all CRSPs in the year
2000 compared with the 2011 showing 35%. This drop of 10% over ten years is
explained by the rising numbers of CRSPs in BC and Alberta, the only provinces to
show and overall gain in the percentage of CRSPs.

30
The density of professionals across Canada can also be calculated using workforce
numbers from Statistics Canada and appear in the table below.
Table 18. Number of CRSPs per 100,000 workers
2000 2001 2002 2003 2004 2005 2006 2007 2008 2009 2010
Alberta 19.58 20.90 23.10 24.75 27.72 30.54 34.95 37.96 42.21 48.29 54.34
Newfoundland 23.52 23.92 26.47 27.62 30.31 32.90 37.25 40.20 45.06 48.78 51.41
Nova Scotia 14.58 14.76 15.97 16.53 17.66 19.19 21.94 23.06 25.20 26.72 29.40
Saskatchewan 8.34 9.33 10.08 11.08 12.27 14.08 16.03 17.67 19.67 21.68 24.30
Ontario 9.06 9.37 9.92 10.22 10.99 11.78 13.41 14.03 15.29 16.56 17.68
Manitoba 9.06 9.26 9.87 10.36 11.00 11.87 13.44 14.00 15.10 16.02 16.87
British Columbia 5.52 6.17 6.80 7.32 8.23 9.04 10.64 11.52 13.17 14.82 16.52
New Brunswick 12.56 12.68 12.93 13.14 13.54 14.13 15.49 15.22 15.74 15.65 16.18
PEI 9.82 9.84 10.45 10.54 10.93 11.56 13.13 13.64 14.70 14.84 15.99
The greatest density of safety professionals is concentrated in Newfoundland and
Alberta. Strangely, Newfoundland has the highest fatality rate in 2010 and the highest
average over the years studied. Alberta is in the middle of the pack in terms of 2010
fatality rates and number three after Ontario and BC in numbers of fatalities. It would
stand to reason that if safety professionals were effective that the provinces with the
highest density would have the fewest fatalities. Ontario has the lowest fatality numbers
in both 2010 values and average. However Ontario has less than the average density
and sits in the middle of the pack. British Columbia, the other most populous province
sits near the lower end in terms of density as well. In comparing the three we see some
striking differences.
Table 19. Unadjusted density of CRSPs per 100,000 workers
2000 2001 2002 2003 2004 2005 2006 2007 2008 2009 2010
Alberta 19.58 20.90 23.10 24.75 27.72 30.54 34.95 37.96 42.21 48.29 54.34
Ontario 9.06 9.37 9.92 10.22 10.99 11.78 13.41 14.03 15.29 16.56 17.68
British Columbia 5.52 6.17 6.80 7.32 8.23 9.04 10.64 11.52 13.17 14.82 16.52
Table 20. Fatality rates of three most populous provinces
2000 2001 2002 2003 2004 2005 2006 2007 2008 2009 2010 AVG
Ontario 2.12 1.75 1.73 1.65 1.50 1.23 1.28 1.43 1.06 1.01 1.07 1.44
Alberta 3.75 2.93 2.71 2.62 2.46 2.49 1.91 2.35 2.51 2.04 2.12 2.54
British Columbia 5.11 5.80 5.12 5.14 4.04 5.88 4.56 3.03 3.72 2.74 3.00 4.38
Intuitively, the expectation is that Alberta with a superior density would have a superior
performance. Instead we see that Alberta has good performance but not as good as
Ontario. Ontario, with a similar density to British Columbia has the lowest fatality rate in
Canada both in terms of an average over the data set and the 2010 figures.
The answer is suggested by several factors. The numbers involved in high risk
industries like construction could be responsible for Alberta and British Columbia not
performing as well as Ontario.

31
Table 21. Percentage of workforce engaged in construction industry
2000 2001 2002 2003 2004 2005 2006 2007 2008 2009 2010 Avg
Ontario 5.28% 5.56% 5.70% 6.06% 6.03% 6.33% 6.37% 6.07% 6.49% 6.28% 6.42% 6.05%
Alberta 8.05% 7.76% 8.13% 8.40% 9.32% 8.60% 9.32% 9.73% 9.77% 9.91% 10.39% 9.03%
British Columbia 5.52% 5.29% 5.84% 5.90% 7.32% 8.00% 8.33% 9.09% 9.13% 8.45% 7.81% 7.34%
Canada 5.66% 5.75% 5.96% 6.16% 6.62% 6.80% 7.06% 7.17% 7.50% 7.28% 7.39% 6.67%
The table above shows that Alberta and British Columbia have a larger portion of the
population engaged in construction than Ontario and that while they are above the
national average, Ontario is below it. So part of the explanation for Ontario’s good
performance may be the lower percentage of workers engaged in high risk industries
such as construction and manufacturing. The percentage of fatalities attributed to
construction also supports this as seen in the table below. Once again Ontario is below
the national average while Alberta and British Columbia are above it. Alberta also
shows the highest proportion of fatalities attributable to construction with an average of
almost one 50%.
Table 22. Percentage of fatalities attributable to the construction industry
2000 2001 2002 2003 2004 2005 2006 2007 2008 2009 2010 Avg
Ontario 16.00% 19.23% 18.87% 25.24% 18.95% 20.25% 32.53% 18.95% 21.13% 31.82% 28.17% 22.83%
Alberta 35.00% 33.33% 36.96% 52.17% 54.55% 56.52% 62.16% 53.19% 67.31% 41.46% 48.84% 49.23%
British Columbia 32.32% 29.09% 26.73% 42.31% 33.73% 30.40% 37.37% 44.12% 39.29% 49.18% 47.06% 37.42%
Canada 19.95% 22.74% 23.05% 36.56% 28.22% 30.75% 37.31% 34.19% 36.56% 37.15% 38.30% 31.34%
As previously stated many professionals are not employed in front line service deliver
and so would appear in a different occupation code. Using the BCRSP salary survey it
is possible to determine how many CRSPs would actually appear in the C163/2263
National Occupation Code. Table 12 of the survey shows the number of respondents
that do not supervise other employees and so would fit into the National Occupation
Code. The number of survey respondents and the percentages of those with no
employees appear in the following tables.
Table 23. Number of CRSPs not supervising employees
Western Central Atlantic National
2005 Salary Survey 49.50% 57.00% 62.00% 54.30%
2007 Salary Survey 46.00% 56.80% 56.70% 51.40%
2009 Salary Survey 45.10% 61.60% 56.90% 53.00%
2011 Salary Survey 49.30% 62.60% 62.20% 55.70%
Average 47.48% 59.50% 59.45% 53.60%
Overall Average 55.01%
The overall average is 55%. This tells us that only 55% of CRSPs actually fit in the
specific National Occupation Code. The survey data is valid as response to the survey
(n) is very strong.

32
Table 24. Number of respondents (n) to BCRSP Salary surveys
2005 2007 2009 2011
Survey n= 735 929 679 1,129
With this information we can extrapolate how many CRSPs (55%) are actually working
in front line safety positions (and included in the NOC Code) along with how many
practitioners there must be and the ratio of practitioners to professionals.
Table 25. Adjusted Number of CRSPs and Practitioners in Canada
2000 2001 2002 2003 2004 2005 2006 2007 2008 2009 2010
CRSPs1 695 736 818 877 971 1,073 1,256 1,370 1,532 1,659 1,838
Practitioners 12,905 15,264 16,782 15,323 15,929 21,627 24,044 22,530 28,168 29,641 30,062
Practitioners/CRSPs 18.56 20.74 20.52 17.48 16.40 20.16 19.14 16.45 18.39 17.87 16.36
1. CRSPs have been reduced to 55% of the total number to reflect those not included in the National Occupation Code
It is clear that professionals are greatly outnumbered and the values from table 6 which
used unadjusted numbers to determine a ratio have almost doubled.
Table 26. Adjusted rates of professionals and practitioners in Canada
2000 2001 2002 2003 2004 2005 2006 2007 2008 2009 2010
CRSPs 4.68 4.92 5.29 5.56 6.07 6.61 7.61 8.09 8.96 9.84 10.73
Practitioners 86.87 102.06 108.45 97.15 99.58 133.33 145.58 133.00 164.69 175.88 175.46
With these adjusted rates we can also adjust the provincial rates to a more accurate
value, which is almost half of that displayed in Table 19.
Table 27. Adjusted rates of professionals per 100,000 workers
2000 2001 2002 2003 2004 2005 2006 2007 2008 2009 2010
Alberta 10.77 11.50 12.71 13.61 15.25 16.80 19.23 20.88 23.22 26.56 29.89
Ontario 4.98 5.15 5.45 5.62 6.04 6.48 7.37 7.72 8.41 9.11 9.72
British Columbia 3.04 3.39 3.74 4.03 4.53 4.97 5.85 6.34 7.24 8.15 9.09
With the additional data from the BCRSP and a more refined data set we can one again
graph the Canadian fatalities to clarify the relationship based on the number calculated
in Table 16.

33
0.00
0.50
1.00
1.50
2.00
2.50
3.00
3.50
4.00
0.00
20.00
40.00
60.00
80.00
100.00
120.00
140.00
160.00
180.00
2000 2001 2002 2003 2004 2005 2006 2007 2008 2009 2010
Practitioners Fatality rate
Figure 12. Canada Practitioners and Fatalities per 100,000 workers
The graph shows a relationship between the two values as did its predecessor.
However, once again a secondary axis (on the left) is necessary to show the high
number of practitioners compared to the fatality rate. This is not necessary in the graph
showing the relationship of professionals to fatalities below.
0.00
2.00
4.00
6.00
8.00
10.00
12.00
2000 2001 2002 2003 2004 2005 2006 2007 2008 2009 2010
CRSPs
Fatality rate
Figure 13. Canada Professionals and Fatalities per 100.000 workers
The relationship is more strongly demonstrated in this graph than its predecessor.
There seems to be a direct correlation between the number of CRSPs and the fatality
rate. If we look at construction fatalities and CRSPs Canada wide we see a similar
correlation.

34
0.00
2.00
4.00
6.00
8.00
10.00
12.00
14.00
16.00
18.00
2000 2001 2002 2003 2004 2005 2006 2007 2008 2009 2010
CRSPs Fatality rate
Figure 14. CRSPs and National Construction Fatalities per 100,000 Workers
Alberta
Alberta is one of the busiest provinces in Canada in terms of construction activity. It also
has one of the highest concentrations of safety professionals in Canada, second only to
Ontario. Using existing data already presented we can show the number of safety
professionals employed in front line positions in Alberta and also compare that to the
number of fatalities to see if there is a similar correlation as seen in previous data.
Table 28. Alberta Ratio or CRSPs to Practitioners per 100,000 Workers
2000 2001 2002 2003 2004 2005 2006 2007 2008 2009 2010 2011
CRSPs 10.77 11.50 12.71 13.61 15.25 16.80 19.23 20.88 23.22 26.56 29.89 24.42
Practitioners 116.33 106.59 124.85 97.17 93.80 154.32 298.42 207.58 232.29 251.97 236.66 338.80
Ratio 10.80 9.27 9.83 7.14 6.15 9.19 15.52 9.94 10.00 9.48 7.92 13.88
The ratios seen are similar to the national one even thought the numbers for both front
line professionals and practitioners are higher. The density of CRSPs in construction in
Alberta is approximately similar to that shown in Table 28. In fact the density of CRSPs
in construction in the other two most populous provinces is also substantially somewhat
greater in construction.
Table 29. CRSPs per 100,000 workers
2000 2001 2002 2003 2004 2005 2006 2007 2008 2009 2010 Avg
Alberta 10.77 11.50 12.71 13.61 15.25 16.80 19.23 20.88 23.22 26.56 29.89 18.22
Construction 13.39 14.82 15.62 16.20 16.36 19.53 20.63 21.45 23.77 26.81 28.78 19.76
Ontario 4.98 5.15 5.45 5.62 6.04 6.48 7.37 7.72 8.41 9.11 9.72 6.91
Construction 9.43 9.26 9.56 9.27 10.01 10.24 11.58 12.72 12.96 14.50 15.15 11.34
British Columbia 3.04 3.39 3.74 4.03 4.53 4.97 5.85 6.34 7.24 8.15 9.09 5.49
Construction 5.49 6.41 6.40 6.83 6.18 6.21 7.03 6.98 7.94 9.65 11.63 7.34
Canada 6.07 6.40 6.88 7.22 7.89 8.58 9.85 10.47 11.59 12.76 13.93 9.24
Construction 10.72 11.13 11.55 11.73 11.91 12.61 13.95 14.61 15.44 17.53 18.85 13.64
In Alberta the numbers of CRSPs in construction was higher than the provincial
numbers in the early years of the time series, becoming less by 2010. In Ontario and

35
British Columbia, the higher density of CRSPs in construction compared to the
provincial number has been maintained.
Table 30. Alberta fatality rate
2000 2001 2002 2003 2004 2005 2006 2007 2008 2009 2010 2011
Fatalities1 60 48 46 46 44 46 37 47 52 41 43 38
Work force2 1,598,200 1,638,200 1,700,500 1,754,400 1,787,700 1,844,700 1,941,700 2,003,100 2,069,500 2,009,600 2,029,800 2,230,100
Fatality rate 3.75 2.93 2.71 2.62 2.46 2.49 1.91 2.35 2.51 2.04 2.12 1.70
1. Traumatic fatalities. Source Alberta Worker's Compensation Board
2. Source Statistics Canada Cansim 282-0054 December numbers
The Alberta fatality rate is one of the lowest in Canada but not lower than the traumatic
fatality rate of Ontario, which is 1.07 for 2010. Additionally, averaging the data for 2000-
2010 Alberta shows a value of 2.29 with an overall improvement of only 22% against
the average compared with a national average of almost 27%. The 2011 figure shows
the second time that Alberta has managed to post a fatality rate of less than 2.00. On a
rolling 11 year window Alberta seems to be underperforming in comparison to Ontario
or BC.
Using this data we can again show the relationship between practitioners and
professionals in Alberta.
0.00
0.50
1.00
1.50
2.00
2.50
3.00
3.50
4.00
0.00
50.00
100.00
150.00
200.00
250.00
300.00
350.00
400.00
2000 2001 2002 2003 2004 2005 2006 2007 2008 2009 2010 2011
Practitioners Fatality rate
Figure 15. Alberta Practitioners and Fatalities per 100,000 workers
The graph on practitioners versus the fatality rate shows a similar relationship to the
Canadian national numbers. Data for 2011 is included to show the sharp rise in number
of positions as a result of increased economic activity in Alberta.

36
0.00
5.00
10.00
15.00
20.00
25.00
30.00
2000 2001 2002 2003 2004 2005 2006 2007 2008 2009 2010 2011
CRSPs Fatality rate
Figure 16. Alberta Professionals and fatalities per 100.000 workers Once again we see the strong relationship between number of CRSPs and the
traumatic fatality rate. This relationship is also present in the province of Ontario and
British Columbia despite their lower density of professionals and even practitioners.
0.00
2.00
4.00
6.00
8.00
10.00
12.00
14.00
16.00
18.00
20.00
2000 2001 2002 2003 2004 2005 2006 2007 2008 2009 2010
CRSPs Fatality rate
Figure 17. Ontario Fatalities and CRSPs per 100,000 Workers
In looking at Figure 17 we see that even with the lower density of safety professionals
there seems to be an inverse relationship. The relationship demonstrated to
practitioners is similarly weak.

37
0.00
1.00
2.00
3.00
4.00
5.00
6.00
7.00
8.00
2000 2001 2002 2003 2004 2005 2006 2007 2008 2009 2010
CRSPs Fatality rate
Figure 18. British Columbia Rates per 100,000 Workers
In British Columbia the relationship may be questioned particularly when looking at the
rise in fatality rate from 2004 to 2005 with no change in the trend for CRSPs.
In reviewing the posted investigation reports of fatalities in Alberta for the latest year
available (2009) there is a striking fact that comes to light. Although only 10 fatalities
were investigated (Government of Alberta), only two of the employers could be
confirmed as having a safety professional on staff at the time of the fatality. Most
companies were small contractors or sole proprietors although some were on worksites
where the owners were large companies. Of the 38 indentified fatalities in the province
only 4 of those employers could be confirmed as having a safety professional on staff at
the time of the incident. It cannot be clear if there was a safety professional directly
involved in the operation or worksite at the time of the fatality.
Alberta has the highest density of safety practitioners and professionals but it is also the
only province in this group that does not include farm fatalities. Farm fatalities are
available from the Alberta Government Ministry of Agriculture and Rural Development
website (Government of Alberta, 2012). If farm fatalities are added to the total fatalities
in the province the fatality performance moves further to the middle of the pack. Looking
at farm fatalities included in the provincial numbers paints a picture that puts Alberta
firmly in the middle of the pack.
Table 31. Alberta Fatality Rate including Farm Fatalities
2000 2001 2002 2003 2004 2005 2006 2007 2008 2009 2010 2011 Avg
Farm Fatalities1 19 13 19 13 11 16 13 11 15 12 19 13 14.50
Traumatic Fatalities 60 48 46 46 44 46 37 47 52 41 43 38 45.67
Total Fatalities 79 61 65 59 55 62 50 58 67 53 62 51 60.17
Workforce 1,598,200 1,638,200 1,700,500 1,754,400 1,787,700 1,844,700 1,941,700 2,003,100 2,069,500 2,009,600 2,029,800 2,230,100 1,883,958
Rate 4.94 3.72 3.82 3.36 3.08 3.36 2.58 2.90 3.24 2.64 3.05 2.29 3.25
1. Source Government of Alberta Farm Fatality Statistics. Workers aged 18 and over
The number of farm fatalities only excludes child deaths in order to reflect the numbers
of a normal workforce, as farm work includes a larger age range than the normal

38
workforce. With a 2010 rate of 3.05, Alberta is much closer to British Columbia in
performance with a rate of 3:00 than Ontario with a rate of 1.07. Including farm fatalities
would put Alberta just ahead of Nova Scotia and Newfoundland. This would place
Alberta number 6 of the 8 provinces for which figures are more than zero for 2010. In
terms of averages Alberta would be in the middle of the pack. Considering the sheer
numbers of practitioners in the province this is surprising.
Alberta Construction Industry
In terms of safety, the Alberta construction industry is somewhat unique. In order to
meet the demand for safety personnel that has soared up to 8,100 for all industries in
2011 in the NOC 2263, a certification was created. As previously discussed, the Alberta
Construction Safety Association awards a National Construction Safety Officer (NCSO)
certification after completion of some core and elective courses (Alberta Construction
Safety Association).
Table 32. Alberta Construction Fatalities Percentage
2000 2001 2002 2003 2004 2005 2006 2007 2008 2009 2010 2011 Avg
Fatalities 60 48 46 46 44 46 37 47 52 41 43 38 45.67
Farm Fatalities 19 13 19 13 11 16 13 11 15 12 19 13 14.50
Total Fatalities 79 61 65 59 55 62 50 58 67 53 62 51 60.17
Construction 21 16 17 24 24 26 23 25 35 17 21 21 22.50
Percentage 26.58% 26.23% 26.15% 40.68% 43.64% 41.94% 46.00% 43.10% 52.24% 32.08% 33.87% 41.18% 37.81%
As already established construction is a high risk industry and in Alberta construction
accounts for almost 50% of the annual traumatic fatalities according to Alberta WCB
figures. When farm fatalities are included that percentage drops to about 34%, which is
less than that of British Columbia. This percentage is still higher than Ontario as shown
in Table 21. 34% is also lower than the national average of 38%.
Table 33. Alberta Construction Fatality Rate
2000 2001 2002 2003 2004 2005 2006 2007 2008 2009 2010 2011 Avg
Fatalities1 21 16 17 24 24 26 23 25 35 17 21 21 22.50
Work force2 128,600 127,100 138,300 147,400 166,600 158,600 180,900 195,000 202,100 199,100 210,800 217,500 172,667
Fatality rate 16.33 12.59 12.29 16.28 14.41 16.39 12.71 12.82 17.32 8.54 9.96 9.66 13.28
1. Traumatic fatalities. Source Alberta Worker's Compensation Board
2. Source Statistics Canada Cansim 282-0054 December numbers
The Alberta construction fatality rate is understandably much higher than the provincial
number as shown in Table 29. Lower number of workers and more fatalities is indicative
of a high risk industry.
In order to determine the approximate number of CRSPs employed in the construction
industry, we must look to the BCRSP Salary Survey which is conducted every two years
by BCRSP. The salary survey categorizes responses by employment. Table 10 in the
surveys shows the percentage of respondents’ employment by industry. The relevant
data appears below.

39
Table 34. Percentage of CRSPs employed in Construction
Year Western Central Atlantic National
2005 8.00% 6.30% 6.50% 7.10%
2007 11.30% 9.20% 12.40% 10.60%
2009 12.20% 6.30% 8.30% 9.40%
2011 9.40% 8.70% 10.90% 9.30%
10.23% 7.63% 9.53% 9.10%
Logically, since construction is a high risk industry it would make sense for a greater
proportion or CRSPs to be employed in construction but it appears that this is not the
case. While it is possible to determine how many CRSPs are employed in construction,
it is not possible to determine how many safety personnel are employed overall in
construction. Construction does have a high density of safety personnel. Ratios that are
common on construction sites range from 50:1 down to 25:1, or even 15:1
Using data already presented we can determine the relationship of CRSPs to the
construction fatality rate in Alberta and also the number of CRSPs per 100,000
construction workers.
0.00
5.00
10.00
15.00
20.00
25.00
30.00
2000 2001 2002 2003 2004 2005 2006 2007 2008 2009 2010 2011
CRSPs Fatality rate
Figure 19. Alberta Construction industry CRSPs and Fatality Rate
Even in construction where we see few CRSPs the relationship seems a strong one.
The effect on the Alberta economy can be seen as a reduction in fatalities in 2008-2010.

40
0.00
2.00
4.00
6.00
8.00
10.00
12.00
14.00
16.00
18.00
20.00
0.00
50.00
100.00
150.00
200.00
250.00
300.00
350.00
400.00
2000 2001 2002 2003 2004 2005 2006 2007 2008 2009 2010 2011
Practitioners Fatality rate
Figure 20. Alberta Construction Fatalities and Practitioners Rate
The relationship between practitioner density and the fatality rate is difficult to see in the
graph particularly since a secondary axis must be used to represent the two data sets.
0.00
5.00
10.00
15.00
20.00
25.00
30.00
35.00
40.00
2000 2001 2002 2003 2004 2005 2006 2007 2008 2009 2010 2011
Alberta Ontario British Columbia
Figure 21. Construction Fatality Rates In comparing the construction fatality rates we see a correlation between Ontario and
Alberta with both looking statistically similar. The British Columbia rate shows significant
variation in 2003 but shows a flattening out in the last three years 2007 to 2010. In
terms of construction fatality rates each of the provinces retain their relationship with
Ontario having the lowest overall average followed by BC. Looking at the 2009 Alberta
construction fatalities investigated by the regulator, of 11 identified in the report
available (Government of Alberta, 2009), none could be verified as having a safety
professional on staff at the time of the fatality.
Although there appears to be a relationship between the density of professionals and
the fatality rate. British Columbia shows the lowest density of CRSPs and the lowest

41
density in construction. Alberta has a density at least twice as high as the other
provinces but shows a density that is the provincial average in 2010. Alberta should
have superior performance but instead we see average performance.

42
RESEARCH QUESTIONS
The existing literature will be reviewed to determine if there are any applicable theories
or data regarding the relationship between the numbers of safety professionals and
performance with particular attention to fatality reduction. Additionally other literature will
be reviewed that is applicable to the effectiveness of safety professionals and/or
practitioners in preventing workplace incidents. The essential questions to satisfy the
research objective include:
1. Do safety professionals prevent fatalities?
2. Are safety professionals more effective than other safety personnel in preventing
fatalities?
3. Are safety professionals less or more effective in preventing fatalities in high risk
industries like construction?

43
LITERATURE REVIEW
This applied research paper proposes to explore the relationship of fatality rates and the
number of practicing health and safety professionals. It compares this relationship with
that of those practicing in the health and safety field who do not have a professional
designation. The paper will also explore if the relationships are the same of different in a
high risk industry like construction.
This paper will explore these specific questions for the first time. There is little research
of literature on this topic. It is clear that there has been a great reduction in workplace
fatalities since the urbanization of western country population in the industrial revolution
bringing factory environments and mass production. Fatalities have fallen substantially
in the 20th century (Greer, 2001). However the reason for these reductions in fatalities
could be many. Many in the safety profession believe the credit lies, in large part, with
the efforts of safety professionals and organizations.
Since the safety profession still struggles to build an identify after a fairly short time in
existence, many certifications exist and a debate constantly rages over whether
certifications are “professional” and whether those with a diploma or degree are more or
less effective than those with experience who are self taught as the early pioneers in the
profession were.
There is clear evidence that practitioners outnumber professionals by a wide margin.
There is very little study devoted to the effect on the growing number of people in the
safety industry and if it is having a desirable affect on workplace safety. Only one
accessible published study shows that safety professionals are more effective than
practitioners. The study, done by IOSH in the United Kingdom, shows that professionals
are twice as effective as others in terms of reducing the injury rate (Cameron, Hare, &
Duff, 2007). The same study also refers to an American study done by the Construction
Industry Institute in the United States which shows the ratio of safety professionals to
workers does affect the injury rate. The higher the qualification or training level of safety
managers also has a direct affect on company accident or incident rates (Cameron,
Hare, & Roy, 2008).
However, injury rates are not a very reliable method of gauging performance because
definitions and reporting requirements can differ. There is also ample evidence that not
all injuries are actually reported (Shannon & Lowe, 2002; Rinefort, Petrick, & Schukin,
2001; Sharpe & Hardt, 2006, p. 19).

44
Professional organizations are not producing certified professionals quickly enough to
meet demand and so there are many people involved as front line safety people that
may have little or no training in the discipline. There is no clear evidence that
professionals are more or less effective than others. There is also no evidence that the
reductions in workplace fatalities are due to adding safety people or professionals to the
workplace.

45
RESEARCH DESIGN
Based on a review of the research questions and the literature review, the research
design utilizes a quantitative perspective to complete an analysis of international,
national and Canadian provincial fatalities and their relation to safety professionals in
practice. Additionally, the study will also review the construction industry to determine
whether or not the same relationship exists.

46
RESEARCH FINDINGS AND ANALYSIS
Overall the results present a consistent picture. On the surface there seems to be a
relationship between the numbers of active safety professionals and the fatality rate.
Limitations in the available data do not allow for better or more exact numbers in many
cases. The overall growth of the safety industry has left a gap which is being filled by
practitioners who may have limited education and skills.
The demand for safety professionals far outpaces supply and continues to do so. This
has been the subject of some study in the US, showing projections well above supply.
The NIOSH National Assessment of the Occupational Safety and Health Workforce in
2011 paints a picture of fast rising demand that cannot be met by current college and
university capacity (McAdams, Kerwin, Olivo, & Goksel, 2011). Other publications also
echo the concern that many safety professionals are within 10 years of retirement
(Warren).
International results
Canada lacks a national body that gives an overall picture of injury or fatality
performance in the same way as OSHA in the United States or the HSE executive in the
United Kingdom. Basic injury and fatality data is tracked nationally by the Association of
Worker’s Compensation Boards of Canada (AWCBC). However, no traumatic fatality
data is available.
Using fatalities as the key measure has a much higher degree of confidence than
injuries as reporting requirements and classification methods vary. Eliminating the
fatalities caused by occupational disease gives a better picture of real time performance
as the exposure that causes the disease and leads to a fatality in occupational disease
cases can by over 20 years removed from the year of the actual fatality. Even so, one of
the major differences is that the United Kingdom does not track workplace fatalities
caused by motor vehicle accidents, which can account for over 40% of fatalities. This
gives the United Kingdom fatality rate and much lower value than would normally be the
case. However, even allowing for this discrepancy, the United Kingdom posts the lowest
overall fatality rate.
In looking at the international picture we can see that overall the relationship between
the practitioners in the United Kingdom, United States and Canada show a similar
relationship. We also see that Canada with a higher density of safety professionals has
a lower fatality rate than the United States. The ratio of safety professionals to
practitioners is much lower in the United States at the national level with a ratio of 4:1 in
2010 compared with Canada’s 8:1.

47
Although fatalities overall have been in sharp decline in the early and middle parts of the
20th century, the latter part shows a flattening of the curve. There can be several factors
responsible for this. The loss of manufacturing jobs and move to automation in that
industry can be credited with some part of the reduction, but how much is unclear.
In looking at high hazard industries construction was chosen as numbers were more
readily available. The highest industry in terms of fatalities is generally thought to be
agriculture but agriculture is not regulated in the same way in the countries studied. The
fatality rates for construction in all three countries show a statistically flattening
performance. There seems to be no good explanation for this phenomenon. Reduction
over the 11 years studied is slight at best and this industry has garnered special
attention in the United Kingdom and the United States. The construction industry tends
to prize experience over education as it is an industry with many trades where learning
is a combination of classroom and experiential on the job training. Even in this high
hazard industry the United Kingdom outperforms Canada with the United States posting
the highest fatality rates.
Some of the variation observed can be attributed to the regulatory approach and
structure in each country. The North American countries tend to have a more
prescriptive structure based on rules and regulations where the focus tends to be on
compliance where the United Kingdom has a focus that is more on risk management or
risk reduction.
The United Kingdom shows stable numbers of people in the occupation code for health
and safety professions over the period of the data. The United States and Canada both
show growth in the number or professionals and practitioners with the numbers for both
at least doubling in the 11 years studied. Overall there does seem to be a strong link
between the numbers of safety professionals and the fatality rates, but that is not
conclusive in itself.
International Construction Results
The high risk industries like construction are bound to show higher rates. However the
rates for Canada and the US are much higher even though the United States shows the
lowest percentage of the population engaged in construction. The United Kingdom has
the highest percent of workforce engaged in Construction but the lowest overall rate. As
noted each country tends to have its own definitions on which workers would be
classified as being in the construction industry.
The construction industry has garnered a lot of attention for its high fatality rate in the
United States and the United Kingdom in an attempt to find ways to reduce the number
of fatalities. Although there is a slight trend in reduction, the performance is flat overall.

48
It is not possible to determine the number of safety professionals or practitioners
engaged in the construction industry in any of the countries with the exception of the
United States. The rising numbers of people serving as health and safety practitioners
in the construction industry in the United States does not seem to have had a significant
impact in the industry.
Although various studies denote the ratio of safety people or professionals to workers in
construction is related to injury performance that same effect does not seem to be
present where fatalities are concerned. Falling injury rates and flat fatality rates seem
the norm across all countries without a plausible explanation since there is an implied
relationship between fatalities and other injury types as we have seen through Bird and
Germain et al.
Without the data on the number of safety professionals and practitioners for each
country involved in the construction industry it is not possible to determine if there is a
uniform relationship between the numbers of people involved in construction safety and
the fatality rate. However, in the United States there seems to be little relationship. This
is not a surprising result considering the sharp rise in practitioners.
An assumption can be made that practitioners may be mentored by professionals and
thereby eventually become certified professionals themselves. However, some ratios
suggested for group mentoring of youths at 4:1 (Karcher, Kuperminc, Portwood, Sipe, &
Taylor, 2006, p. 713; Sherk, 2006, p. 2) would not be possible where we see the density
of safety professionals to practitioners in Canada at 8:1. It seems unlikely that any
safety professionals could have a mentoring relationship with 8 practitioners.
National Canadian Results
Canada presents an interesting picture in itself. The different regulatory framework
leads to many different focuses and approaches. Getting reliable figures for fatalities is
problematic at best with each province having its own regulatory agency and worker
compensation board. In some cases the two are combined. Some employers fall under
federal jurisdiction and are spread across the country. These tend to be federal
government departments and ports of entry to the country like airports and shipping
ports.
Methods of classifying and tracking injuries and fatalities vary in across the country but
all jurisdictions identified were able to provide traumatic fatality rates. There is a wide
range of fatality rates and density of safety professionals. Canada reflects what we see
in other countries with rising numbers of people shown in the occupation code that
relates to safety professionals and practitioners. Clearly demand is also outstripping
supply in terms of safety professionals. We see professionals representing only a small

49
portion of the overall number of people shown employed within the occupation code for
health and safety practitioners.
With a focus on the three most populous provinces for which data was available, some
interesting results are seen. Ontario with the lowest fatality rate has only a moderate
density of safety professionals. In fact in 2010 Alberta and Ontario has similar numbers
of practitioners and professionals but Alberta had a significantly higher fatality rate due
to the significant difference in work force size.. British Columbia shows the highest
fatality rate and has a density of professionals similar to Ontario.
In each province we see a strong relationship between the number of professionals for
each 100,000 workers and the fatality rate. There seems to be a much weaker
relationship between the fatality rate and the density of practitioners. The relationship
between professionals and the fatality rate in construction overall seems to show a
relationship as well at a national level.
Canadian Alberta Results
Alberta seems to differ significantly when compared with the other populous provinces
such as BC and Ontario. Alberta has the highest density of people working in the health
and safety occupational code but lags Ontario significantly in terms of average fatality
rate. British Columbia has one of the highest average fatality rates over the period of the
study but has a similar density of safety professionals to Ontario. While most provinces
show that the number of people working in health and safety roles has doubled, in
Alberta the number has quadrupled from 2,000 in the year 2000 to 8,100 twelve years
later in 2011. This corresponds to high density of practitioners which is twice that of
Ontario and triples that of British Columbia at 338 per 100,000 workers.
Inexplicably, Alberta has a higher fatality rate than Ontario despite having a far higher
density of health and safety practitioners. Alberta even has a density of professionals
which is three times that of Ontario and British Columbia. There still seems to be a link
to the density of safety professionals and the fatality rate as in other cases but a weak
link to the density of practitioners if any at all. Strangely, when farm fatalities are
included as they are in other provinces, Alberta demonstrates merely average
performance in terms of the fatality rate

50
Canadian Alberta Construction Results
Unfortunately it is not possible to get a breakdown of the numbers of people under the
National occupation Code 2283 that are employed in the construction industry and so
we have only the numbers of professionals to rely on. In Alberta we see a construction
fatality rate twice that of Ontario. With an industry responsible for 50% of all fatalities we
see only about 10% of CRSPs (in western Canada) involved. Of course since this
industry is approximately 10% of the Alberta workforce, but has twice the average
national density of health and safety professionals.
The density of CRSPs in other provinces has been higher than the construction industry
than the provincial number. However Alberta shows a slightly higher density in 2000
than the provincial overall density and moves to a lower density than the provincial
number in 2010. Ontario retains a density almost 60% higher in construction and British
Columbia maintains a density 30% in 2010 where it was double in 2000. The Alberta
ratios of practitioner to professionals make any kind of peer learning or mentoring on a
wide scale very unlikely. It is ironic that in construction, journeyperson to apprentice
ratios range from 1:1 to 1:5 (Alberta Apprenticeship & Industry Training, 2011) which is
a far cry from the ratio of practitioner to professionals at 14:1 at the provincial level
which is almost certainly higher in the construction industry.
Considering the patterns seen in other provinces, one would expect that Alberta would
have the lowest fatality rate in Canada. Alberta has the second largest number of
people employed in the National Occupation Code for health and safety practitioners in
Canada. Alberta also has the highest density of practitioners and CRSPs in the
construction industry. It has a lower density of safety professionals than the provincial
average in an industry that is responsible for almost half of the traumatic fatalities in
2010. This may be a telling statistic.
In comparison to British Columbia, Alberta is certainly doing better in terms of fatality
rates with a rate almost half that of British Columbia, however British Columbia has a
much lower density of practitioners and CRSPs than the other provinces studied.

51
ANALYSIS
The data collected and the results certainly seem to indicate there is a relationship
between the number of professionals or practitioners and the fatality rate. Comparison
of the number of health and safety professionals or practitioners and fatalities per
100,000 workers has shown a stronger relationship between the fatality rate and
professionals.
It appears that raising the density of professionals should lower fatality rates. Although
there seems to be a weaker relationship between the fatality rate and practitioners, it
appears that raising the numbers of practitioners may also have the effect of lowering
the fatality rate. The exception appears to be Alberta where higher densities of health
and safety people does not seem to have affected the fatality rate
In order to analyze the results and the data linear regression analysis will be utilized.
Regression analysis describes the relationship between variables (Thomas & Maurice,
2008, p. 119) or used to obtain the causal relationship between two variables (Gupta,
SPSS for beginners, 1999). Regression analysis establishes a correlation between
variables but not causation (Dizikes, 2010). It would be incorrect to say, for example
that higher numbers of people employed in the health and safety field will definitely
cause a reduction in fatality rates. We may only be able to determine the correlation
between higher or lower number of health and safety personnel and the fatality rate.
The relationship between the time series variables of fatalities to the variable of
professionals or practitioners is one that must be subjected to a more than rigorous
analysis.
Regression Analysis International
Using the established variables of the national fatality rates along with the density per
100,000 workers of professionals (when available) and practitioners, each country’s
data will be analyzed. The regression output will be provided along with an explanation
of the output.
United Kingdom Regression
The numbers of professionals are not available for the United Kingdom, so only the
number of people in the Standard Occupational Code 3567 will be analyzed in
reference to the fatality rate.

52
SUMMARY OUTPUT
Regression Statistics
Multiple R 0.237230381
R Square 0.056278254
Adjusted R Square -0.048579718
Standard Error 0.158427224
Observations 11
ANOVA
df SS MS F Significance F Significant at 10%
Regression 1 0.013470967 0.013470967 0.53670935 0.482442248 No .53<3.36
Residual 9 0.225892669 0.025099185
Total 10 0.239363636
Significant at 10%
Coefficients Standard Error t Stat P-value Lower 95% Upper 95% Lower 95.0% Upper 95.0%
Intercept 0.5361105 0.325265956 1.648221989 0.133709516 -0.19969221 1.27191321 -0.19969221 1.27191321 No 1.65<1.83
Practitioners 0.002222685 0.00303395 0.732604498 0.482442248 -0.004640586 0.009085956 -0.004640586 0.009085956 No .73<1.83
FINV 1% 3.36
TINV 10% 1.83
TINV 1% 3.25
Figure 22. United Kingdom Regression
The first step we must take is to test the significance of the model sometimes called an
F test. The F Statistic (FINV) for 99% confidence can be calculated or found through the
use of tables. For the equation to be statistically significant at 99% the value of F must
be greater than the calculated FINV of 3.36. If the significance of F is greater than .05
we can typically conclude the model is not statistically significant (Gupta, 2000).
The analysis demonstrates that there is no correlation between the number of people
employed in health and safety and the national fatality rate of the United Kingdom.
Unites States Regression
Both professional densities and that of practitioners are available for United States.
SUMMARY OUTPUT
Regression Statistics
Multiple R 0.90934981
R Square 0.82691709
Adjusted R Square 0.78364636
Standard Error 0.17509005
Observations 11
ANOVA
df SS MS F Significance F Significant at 1% Confidence
Regression 2 1.171711441 0.58585572 19.11031113 0.000897464 Yes 19.11>8.65 99.91%
Residual 8 0.245252196 0.030656524
Total 10 1.416963636
Significant at 10% Confidence
Coefficients Standard Error t Stat P-value Lower 95% Upper 95% Lower 95.0% Upper 95.0%
Intercept 7.90819433 1.205162241 6.561933371 0.000176257 5.129085218 10.68730344 5.129085218 10.68730344 Yes 6.56>1.86 99.98%
Practitioners -0.0100016 0.017784727 -0.562369479 0.589270616 -0.051013241 0.031010066 -0.051013241 0.031010066 No .56<1.86
Professionals -0.4021946 0.197632682 -2.035061233 0.076256059 -0.857936393 0.053547172 -0.857936393 0.053547172 Yes 2.03>1.85 92.37%
FINV 1% 8.65
TINV 10% 1.86
TINV 1% 3.36
Figure 23. United States Regression

53
Once again we must test the analysis to determine the statistical significance using the F value. The value of F is greater than the calculated value at 1% of 8.65. The level of confidence in the equation is 99.99%. To determine the next value we would examine in the R Square that explains the percentage of deviation in the dependant variable (fatality rate) that is explained by the other variables (practitioners and professionals). The value is .8269 which indicates that the variables explain 82.69% of the deviation in the fatality rate. Similarly the Adjusted R Square tells us that 78.36% of the dependent variable (fatalities) is explained by the independent variables (Gupta, 2000). With the regression valid we must then assess the significance of the variables. This is done using a t-test. This will determine if the value is significant and so not equal to zero and also avoid a type 1 error of assuming a variable is statistically significant when it is not (Thomas & Maurice, 2008, pp. 128-129). The calculated T value (TINV) for 10% is1.86. The dependant variable and professional variable are both larger than this so they are significant at a minimum of 90% confidence. The value for practitioners is lower and so is not statistically significant. The level of actual level of confidence is very high that there is no type 1 error. The negative value or negative slope of the variables demonstrates an inverse
relationship to the dependant variable of fatalities. As expected, this suggests higher
densities of safety professionals may result in lower fatalities.
Canada Regression Analysis
SUMMARY OUTPUT
Regression Statistics
Multiple R 0.904788985
R Square 0.818643108
Adjusted R Square 0.773303885
Standard Error 0.241093593
Observations 11
ANOVA
df SS MS F Significance F Significant at 1% Confidence
Regression 2 2.099045582 1.049522791 18.05595802 0.001081773 Yes 19.11>8.65 99.89%
Residual 8 0.465008964 0.05812612
Total 10 2.564054545
Significant at 10% Confidence
Coefficients Standard Error t Stat P-value Lower 95% Upper 95% Lower 95.0% Upper 95.0%
Intercept 3.907421439 0.32247348 12.11703187 1.99096E-06 3.16379626 4.651046617 3.16379626 4.651046617 Yes 6.56>1.86 99.99%
Practitioners 0.004625007 0.008157491 0.566964409 0.586290027 -0.014186202 0.023436216 -0.014186202 0.023436216 No .56<1.86
Professionals -0.157695623 0.067522648 -2.335447859 0.047753834 -0.313403128 -0.001988118 -0.313403128 -0.001988118 Yes 2.33>1.86 95.22%
FINV 1% 8.65
TINV 10% 1.86
TINV 1% 3.36
Figure 24. Canada Regression
Like the United States regression this data is also compelling. The model is statistically
significant with 99.89% confidence. 81.86% of the variation in the fatality rate is
explained by the variables. The variable for practitioners is not statistically significant
once again. However, we find that the dependant variable is 99.99% significant but the

54
professional’s variable is only 95.22% significant. The negative slope also reinforces the
inverse correlation between the numbers of professionals and the fatality rate.
Overall the regression on an international level shows that there is a strong correlation
between the number of safety professionals and the reduction in the traumatic fatality
rate. The analysis also shows that there is no correlation between practitioners and the
fatality rate. This supports the earlier results showing the stronger relationship between
the professionals and the reducing fatality rate. In each case there is a valid model and
a very high confidence level.
Construction Regression Analysis
Unfortunately it is not possible to determine in any country the exact numbers of
professionals that are working in construction. The United States has data on the
number of practitioners in each industry which would allow a regression based on that
data.
SUMMARY OUTPUT
Regression Statistics
Multiple R 0.690495171
R Square 0.476783581
Adjusted R Square 0.418648423
Standard Error 1.79365214
Observations 11
ANOVA
df SS MS F Significance F Significant at 1% Confidence
Regression 1 26.38510801 26.38510801 8.201295052 0.018664687 Yes 26.38>10.56 98.13%
Residual 9 28.95469199 3.217187998
Total 10 55.3398
Significant at 10% Confidence
Coefficients Standard Error t Stat P-value Lower 95% Upper 95% Lower 95.0% Upper 95.0%
Intercept 19.7560577 1.386472739 14.24914976 1.76071E-07 16.61963847 22.89247693 16.61963847 22.89247693 Yes 14.24>1.83 100.00%
Practitioners -0.157335921 0.054939749 -2.86379033 0.018664687 -0.281618266 -0.033053575 -0.281618266 -0.033053575 Yes 2.86>1.83 98.13%
FINV 1% 10.56
TINV 10% 1.83
TINV 1% 3.25
Figure 25. United States Construction Regression
As we are using the total number of practitioners including professionals, it is
unsurprising that the R Square only shows the variable of practitioners accounting for
47.67% of the variation in construction fatalities. The model is valid with 98.13%
confidence and both variables are also statistically significant. The negative slope of the
practitioner variable indicated an inverse relationship. It is surprising that there is
statistical significance since there was none at the national level for practitioners. The
United States also has a ratio of practitioners to professionals that is half that of
Canada. It is unknown what proportion of this group is professionals and so we cannot
draw the conclusion that practitioners or professionals have established a correlation.
BCSP in the Unites States also offers a Construction Health and Safety Technician
certification (BCSP) which would be included in the number of practitioners but has not
been included on the numbers of professionals in this paper. Based on the national

55
regression it is likely that it is professionals that have the stronger relationship since the
growth is more linear and slower than practitioners with a lower level of density.
Additionally, the national ratio of practitioners to professionals is 4:1 which would
suggest an appreciable number of those included in the industry are professionals. This
view can be supported by the fact the relationship is much weaker than the overall
relationship that professionals have to national fatality rates.
Canadian Analysis
In advancing the Canadian analysis the numbers within the national occupation codes
must be adjusted to reflect that only 55% of all CRSPs would fit into that code. The
number of practitioners must also be found by deducting the number of active CRSPs in
each year. The resulting overall analysis shows slight changes from the unadjusted one.
SUMMARY OUTPUT
Regression Statistics
Multiple R 0.904931247
R Square 0.818900561
Adjusted R Square 0.773625702
Standard Error 0.240922404
Observations 11
ANOVA
df SS MS F Significance F Significant at 1% Confidence
Regression 2 2.099705707 1.049852853 18.08731309 0.001075644 Yes 19.11>8.65 99.99%
Residual 8 0.464348839 0.058043605
Total 10 2.564054545
Significant at 10% Confidence
Coefficients Standard Error t Stat P-value Lower 95% Upper 95% Lower 95.0% Upper 95.0%
Intercept 3.905632823 0.322454441 12.11220043 1.99702E-06 3.162051549 4.649214098 3.162051549 4.649214098 Yes 12.11>3.36 99.99%
Practitioners 0.004650979 0.008153535 0.570424828 0.584050894 -0.014151107 0.023453065 -0.014151107 0.023453065 No .57<1.86
Professionals -0.29065704 0.128966084 -2.25374789 0.054249094 -0.588053363 0.006739283 -0.588053363 0.006739283 Yes 2.25>1.86 94.58%
FINV 1% 8.65
TINV 10% 1.86
TINV 1% 3.36
Figure 26. Canadian Regression adjusted for CRSPs included in NOC Once more we see that the practitioner variable is not statistically significant. Notably the slope value for professionals has grown showing that professionals have a greater inverse affect on fatalities than implied in the previous regression. It is clear that in Canada safety professionals do have a strong inverse relationship with the fatality rate accounting for up to 81.89% of the variation with almost 95% confidence. Alberta
Canadian Provinces have widely varying performance and the three most populous
provinces in the data set have been selected for comparison to determine if they mimic
the findings of the national level.

56
SUMMARY OUTPUT
Regression Statistics
Multiple R 0.812400475
R Square 0.659994531
Adjusted R Square 0.584437761
Standard Error 0.345529618
Observations 12
ANOVA
df SS MS F Significance F Significant at 1% Confidence
Regression 2 2.085775217 1.042887609 8.735081241 0.007792675 Yes 19.11>8.02 99.99%
Residual 9 1.074516449 0.119390717
Total 11 3.160291667
Significant at 10% Confidence
Coefficients Standard Error t Stat P-value Lower 95% Upper 95% Lower 95.0% Upper 95.0%
Intercept 3.599598345 0.307010792 11.7246639 9.38098E-07 2.905091683 4.294105006 2.905091683 4.294105006 Yes 11.72>1.83 99.99%
Practitioners -0.002609532 0.002336479 -1.116864899 0.292980149 -0.007895015 0.002675951 -0.007895015 0.002675951 No .56<1.83
Professionals -0.041029885 0.034936467 -1.174414232 0.270366712 -0.120061665 0.038001896 -0.120061665 0.038001896 No 1.17<1.83 72.96%
FINV 1% 8.02
TINV 10% 1.83
TINV 1% 3.25
Figure 27. Alberta Regression
The Alberta regression shows a different pattern than the other regressions in that
neither independent variable is significant at 10%. This is a surprising result for the
province that has the highest concentration of safety professionals and practitioners and
merits further investigation.
We can compare the performance of the other two provinces (Ontario and British
Columbia) in regression to determine if this is also the case.
SUMMARY OUTPUT
Regression Statistics
Multiple R 0.963623977
R Square 0.92857117
Adjusted R Square 0.910713962
Standard Error 0.104637783
Observations 11
ANOVA
df SS MS F Significance F Significant at 1% Confidence
Regression 2 1.138698384 0.569349192 51.999797 2.60312E-05 Yes 51.93>8.65 99.99%
Residual 8 0.087592525 0.010949066
Total 10 1.226290909
Significant at 10% Confidence
Coefficients Standard Error t Stat P-value Lower 95% Upper 95% Lower 95.0% Upper 95.0%
Intercept 2.698429937 0.142390137 18.95096098 6.21895E-08 2.370077692 3.026782183 2.370077692 3.026782183 Yes 18.95>1.86 99.99%
Practitioners -0.005409288 0.001368287 -3.953329073 0.004216283 -0.008564563 -0.002254013 -0.008564563 -0.002254013 Yes 3.95>1.86 99.99%
Professionals -0.092477395 0.042551335 -2.173313603 0.061500092 -0.19060095 0.005646159 -0.19060095 0.005646159 Yes 2.17>1.86 99.58%
FINV 1% 8.65
TINV 10% 1.86
TINV 1% 3.36
Figure 28. Ontario Regression
The Ontario regression output shows the opposite of the Alberta regression. The model
is statistically significant to 99.99% and the independent variables account for 92.85%
of the variation in the fatality rate. All variables are significant with over 99% confidence.
Both practitioners and professionals show an inverse relationship to fatalities as
demonstrated by the negative values of the slope coefficients. However, the value for
professionals is considerably larger demonstrating a larger effect on fatalities.

57
SUMMARY OUTPUT
Regression Statistics
Multiple R 0.877022233
R Square 0.769167997
Adjusted R Square 0.711459996
Standard Error 0.610673576
Observations 11
ANOVA
df SS MS F Significance F Significant at 1% Confidence
Regression 2 9.941076814 4.970538407 13.32861972 0.002839122 Yes 13.32>8.65 99.99%
Residual 8 2.983377731 0.372922216
Total 10 12.92445455
Significant at 10% Confidence
Coefficients Standard Error t Stat P-value Lower 95% Upper 95% Lower 95.0% Upper 95.0%
Intercept 7.779736667 0.764599034 10.17492348 7.4563E-06 6.016568133 9.542905202 6.016568133 9.542905202 Yes 10.17>1.86 99.99%
Practitioners -0.010677938 0.006815583 -1.566694648 0.155820466 -0.0263947 0.005038825 -0.0263947 0.005038825 No 1.56<1.86
Professionals -0.468157395 0.135135621 -3.46435228 0.008513125 -0.779780695 -0.156534095 -0.779780695 -0.156534095 Yes 3.46>1.86 99.15%
FINV 1% 8.65
TINV 10% 1.86
TINV 1% 3.36
Figure 29. British Columbia Regression The British Columbia regression output is similar to the national results. The model is statistically significant with the independent variables explaining 76.92% of the variation in the fatality rate. Only the independent variable for professionals is statistically significant at 10% with a confidence of over 99%. A regression using only a single variable for professionals returns an R Square of 69% with a much stronger coefficient. SUMMARY OUTPUT
Regression Statistics
Multiple R 0.835670345
R Square 0.698344926
Adjusted R Square 0.664827696
Standard Error 0.65817317
Observations 11
ANOVA
df SS MS F Significance F Significant at 1% Confidence
Regression 1 9.025727256 9.025727256 20.8354007 0.001357357 Yes 13.32>8.65 99.99%
Residual 9 3.89872729 0.433191921
Total 10 12.92445455
Significant at 10% Confidence
Coefficients Standard Error t Stat P-value Lower 95% Upper 95% Lower 95.0% Upper 95.0%
Intercept 6.957496596 0.599280591 11.60974793 1.01994E-06 5.601829718 8.313163474 5.601829718 8.313163474 Yes 10.17>1.86 99.99%
Professionals -0.574629884 0.125888854 -4.564581109 0.001357357 -0.859410255 -0.289849512 -0.859410255 -0.289849512 Yes 3.46>1.86 100.00%
FINV 1% 10.56
TINV 10% 1.83
TINV 1% 3.25
Figure 30. British Columbia Regression with single independent variable
Since the variable for professionals was close to meeting the t-test for statistical
significance, in the Alberta regression, running the regression without the practitioners
as an independent variable may have an effect as was the case for British Columbia.

58
SUMMARY OUTPUT
Regression Statistics
Multiple R 0.782860305
R Square 0.612870257
Adjusted R Square 0.574157283
Standard Error 0.349777487
Observations 12
ANOVA
df SS MS F Significance F Significant at 1% Confidence
Regression 1 1.936848766 1.936848766 15.8311333 0.002605862 Yes 15.83>10.04 99.99%
Residual 10 1.223442901 0.12234429
Total 11 3.160291667
Significant at 1% Confidence
Coefficients Standard Error t Stat P-value Lower 95% Upper 95% Lower 95.0% Upper 95.0%
Intercept 3.630121561 0.309551317 11.72704285 3.62608E-07 2.940398247 4.319844874 2.940398247 4.319844874 Yes 11.72>3.17 99.99%
Professionals -0.07418605 0.018645166 -3.978835672 0.002605862 -0.115730067 -0.032642032 -0.115730067 -0.032642032 Yes 3.97>3.17 99.74%
FINV 1% 10.04
TINV 10% 1.81
TINV 1% 3.17
Figure 31. Alberta Regression with single independent variable
Not surprisingly, the new regression for Alberta shows a statistically significant model
with a statistically significant independent variable. The confidence in the professional
variable is over 99% and accounts for 61.28% of the variation in the fatality rate. This is
lower than other provinces.
Overall there is a clear correlation between the numbers of safety professionals and the
fatality rate at a provincial level. Surprisingly there is also a correlation between
practitioners and the fatality rate as well. However, the coefficient value for practitioners
is quite low at .0054 indicated a small effect. However in Alberta’s case the practitioner
variable had a significant effect on the regression. When removed the single variable
made the model significant to a high level. The result is the virtually the same with or
without farm fatalities taken into account. It is surprising that Alberta did not have
stronger results as the rising numbers of safety professionals are showing a strong
correlation with falling fatality rates at a high level of confidence in the larger sample
sizes at the national and international levels.
Alberta Construction
Looking at Alberta construction industry, we can know roughly how many professionals
there are employed in the industry but have no way of knowing how many practitioners
are employed in the industry. Since the construction industry in Alberta is responsible
for roughly half of all traumatic fatalities, it will be a good test to determine if
professionals are as effective in construction as generally in all industries.

59
SUMMARY OUTPUT
Regression Statistics
Multiple R 0.612135024
R Square 0.374709288
Adjusted R Square 0.312180217
Standard Error 2.426464732
Observations 12
ANOVA
df SS MS F Significance F Significant at 1% Confidence
Regression 1 35.28258907 35.28258907 5.992561228 0.03437694 Yes 35.28>10.04 96.56%
Residual 10 58.87731093 5.887731093
Total 11 94.1599
Significant at 10% Confidence
Coefficients Standard Error t Stat P-value Lower 95% Upper 95% Lower 95.0% Upper 95.0%
Intercept 18.2442732 2.147409089 8.495946716 6.92654E-06 13.4595476 23.0289988 13.4595476 23.0289988 Yes 8.49>1.81 100.00%
Professionals -0.316631861 0.129344621 -2.447970839 0.03437694 -0.604829636 -0.028434086 -0.604829636 -0.028434086 Yes 2.44>1.81 96.56%
FINV 1% 10.04
TINV 10% 1.81
TINV 1% 3.17
Figure 32. Alberta Construction Regression
As we see in the previous Alberta regression the R square is quite low showing that
only 37.47% of the variation in the fatality rate is due to the variable of professionals.
The model is statistically significant to a high degree of confidence and so are the
variables. If we see the same pattern for the provincial numbers we should see much
stronger correlations and higher R square percentages for Ontario and British
Columbia.
SUMMARY OUTPUT
Regression Statistics
Multiple R 0.537667755
R Square 0.289086614
Adjusted R Square 0.210096238
Standard Error 0.997801397
Observations 11
ANOVA
df SS MS F Significance F Significant at 10% Confidence
Regression 1 3.643694993 3.643694993 3.659770069 0.088030431 Yes 3.65>3.36 91.20%
Residual 9 8.960468643 0.995607627
Total 10 12.60416364
Significant at 10% Confidence
Coefficients Standard Error t Stat P-value Lower 95% Upper 95% Lower 95.0% Upper 95.0%
Intercept 7.797336212 1.353997104 5.758753982 0.000273268 4.734381972 10.86029045 4.734381972 10.86029045 Yes 5.75>1.83 99.97%
Professionals -0.446491455 0.233392153 -1.913052553 0.088030431 -0.974461186 0.081478276 -0.974461186 0.081478276 Yes 1.91>1.83 91.20%
FINV 1% 10.56
FINV 10% 3.36
TINV 10% 1.83
TINV 1% 3.25
Figure 33. Ontario Construction Regression The Ontario regression is also somewhat problematic. The model is only significant but only at 91.20% and the variation in fatalities is only 28.90% explained by the variable of professionals, which is somewhat lower than Alberta.

60
SUMMARY OUTPUT
Regression Statistics
Multiple R 0.736295927
R Square 0.542131692
Adjusted R Square 0.491257436
Standard Error 5.218961653
Observations 11
ANOVA
df SS MS F Significance F Significant at 1% Confidence
Regression 1 290.2518079 290.2518079 10.65630696 0.009769771 Yes 10.65>10.56 99.02%
Residual 9 245.1380466 27.23756074
Total 10 535.3898545
Significant at 1% Confidence
Coefficients Standard Error t Stat P-value Lower 95% Upper 95% Lower 95.0% Upper 95.0%
Intercept 37.20352095 4.751974961 7.829065022 2.62927E-05 26.45380678 47.95323513 26.45380678 47.95323513 Yes 7.82>3.25 100.00%
Professionals -3.258626401 0.998231363 -3.264399938 0.009769771 -5.516782625 -1.000470177 -5.516782625 -1.000470177 Yes 3.36>3.25 99.02%
FINV 1% 10.56
TINV 10% 1.83
TINV 1% 3.25
Figure 34. British Columbia Construction Regression The British Columbia regression output is more in line with national and previous provincial outputs. The model is significant with a confidence of over 99%. The professional variable explains 54.21% of the variation in the construction fatality rate. The strong value of the slope coefficient is the highest of all the regressions. Overall the provinces have produced mixed results with Ontario, the province with the highest population, and lowest density of professionals showing only 29% of the variation in fatalities explained by the density of professionals. It also has a lower level of confidence n the model at only 91.20%. Alberta comes in the middle, where it invariably sits in this group in terms of performance, with 37% or the variation explained but high confidence in the model and the variables. British Columbia shows the strongest results with high confidence levels and 54% of the variation explained by the density of professionals. Clearly there is a real effect from safety professionals even at the provincial level. In all three cases we see larger coefficients than the national number of -0.29 indicting a greater affect in changing the variation of these variables. The large size of the British Columbia coefficient at -3.25 indicates that a change in the density of safety professionals would have the most effect in that province. Alberta having the highest density of practitioners and professionals inexplicably does not have the lowest fatality rate. It goes to reason that a large portion of practitioners would work in the construction industry considering the densities observed on actual sites and by other reports referenced in this paper on the subject. A possible explanation lies in the hypothesis that higher density would drive down fatality rates. While the regression has established some correlation for professionals, there is a point at which the diminishing level of return is reached. It is possible that adding more practitioners to the construction industry will not affect the fatality rate as we see that fatalities are much more likely in companies that do not have safety professionals on staff. It may be that the level of diminishing return has already been surpassed considering that the density of practitioners in Alberta has jumped 50% from 2012 to 2011.

61
ANALYSIS RESULTS
Overall the analysis provided a strong case to answer the research questions posed.
1. Do safety professionals prevent fatalities?
It has been demonstrated that safety professionals working in companies do
have an effect on the fatality rates and there is a strong correlation between the
density of safety professionals and the fatality rate. The results and analysis
overwhelmingly support the first research question. Safety professionals are
effective at saving lives.
2. Are safety professionals more effective than other safety personnel in
preventing fatalities?
The regression analysis was instrumental in showing that safety professionals
are not just effective in reducing fatalities but they are much more effective than
practitioners as implied in much of the literature and research undertaken.
3. Are safety professionals less or more effective in preventing fatalities in high
risk industries like construction?
In high risk industries and construction in particular safety professionals are
effective, but seem less effective than overall at a national or international level.
This result is surprising but without reliable figures to compare with practitioners,
this result can be questioned particularly where we see a correlation between the
construction fatality rate and Unites States total practitioners and professionals
employed in construction.
For Canada estimated numbers of professionals in construction based on survey
percentages were used and the accuracy is not total. Safety professionals do not
appear to be as effective in the construction industry for reasons that cannot be
known with the current data available. Professionals are more effective than
practitioners as supported by the national and provincial data.
The research, results and finally the analysis demonstrate emphatically that safety
professionals do have a solid value proposition and that they have been, and are,
effective in preventing fatalities as they have set out to do. The analysis also
demonstrated that practitioners are significantly less effective at preventing fatalities and
even ineffective in some cases. This is particularly true in the case of Alberta and British
Columbia.
The rapidly rising numbers of practitioners has no demonstrable effect on fatality rates.
Provinces with the highest density of practitioners have some of the highest fatality

62
rates. Ontario shows some effect from practitioners in relation to fatalities while other
provinces show none at all.
The density of practitioners in Alberta is over 300 per 100,000 workers in 2011 which is
up approximately 50% from the previous year. It may be assumed that most of these
positions went into the construction industry but that is uncertain. The sheer numbers of
practitioners in Alberta preclude any sort of mentoring by the much smaller numbers of
professionals. Construction normally shows the highest density of safety practitioners
and in this case it certainly seems that the level of diminishing returns has been passed.
In British Columbia the regression for professionals shows a large coefficient at a high
level of confidence indicating that increasing the number of professionals would cause a
fall in the fatality rate.

63
RECOMMENDATIONS
While most of the results are emphatic, some results merit further study and
explanation. To that end it is recommended that:
1. The hypothesis that the practitioners working in construction in Alberta has reached
or passed the diminishing level or return should be examined. The sharply rising
numbers of practitioners do not seem to have an appreciable effect on the fatality
rate. A larger scale study of the industry and the density of practitioners should be
undertaken.
2. The Association of Worker’s Compensation Boards of Canada should continue
working to collect meaningful data from compensation boards standardize terms and
classification to track fatalities, traumatic fatalities, fatalities caused by motor vehicle
accidents, and fatalities caused by occupational disease.
3. IOSH track active chartered members and attempt to replicate the regression
analysis to determine if there are similar findings.
4. British Columbia consider the effect of increasing the density of safety professionals
as a strategy to lowering the provincial and provincial construction fatality rate.
5. The Canadian National and Provincial Construction Associations should actively
encourage practitioners to obtain their professional designation in order to increase
their effectiveness.
6. The Unites States Board of Certified Safety professionals should study the
effectiveness of professionals engaged in construction in relation to the numbers
found for overall practitioners.
7. The Board of Canadian Registered Safety Professionals should use the information
in this paper to help educate employers in the value proposition of safety
professionals.

64
CONCLUSION
The research paper set out to answer some simple questions. Primarily it was focussed
on whether safety professionals did save lives in a time when fatality rates were
flattening out and in high risk industries performance looks flat or showing only slight
improvement. The paper also explored whether the sharply rising numbers of
certifications were having an effect and if this group was as effective as professionals.
It is not surprising that we saw a strong correlation between numbers of professionals
and numbers of fatalities. The data and analysis show a strong correlation between
rising numbers of professionals and falling fatality rates. This was true at the national
level for the United States and Canada. It was also true for the three Canadian
provinces looked at and the construction industry in those provinces.
Surprisingly, the analysis showed that the numbers of practitioners have little or no
correlation to reductions in fatalities in all three countries. In Canada only one province
(Ontario) showed a slight correlation demonstrated by a very low coefficient. Only the
United States numbers of practitioners in construction showed a correlation about the
same as Canadian professionals in construction at 47% or the variation explained along
and a significant level of confidence and a coefficient that demonstrates a significant
effect. This may be explained by the ratio in the United States of professionals to
practitioners which is half that of Canada and the additional certification offered by
BCSP such as the Construction Health and Safety Technician (BCSP) which was not
included in the numbers of professionals.
The extraordinarily high ratio of practitioners to professionals in Alberta in 2010 of 14:1
is a ratio far too high to suggest there is any kind of mentoring taking place. The very
high density of 338 per 100,000 workers in 2011 is by far the highest number in Canada
and yet the fatality rate remains near 10 per 100,000 workers. Even the provincial
fatality rate, once agricultural or farm fatalities are added in places Alberta in the middle
of the pack. With such an overwhelming number of practitioners with it is surprising that
there is no link to effectiveness in preventing fatalities. In the construction industry,
where such practitioners are more common, perhaps quantity is not the answer.
The research paper has demonstrated that safety professionals save lives and are
much more effective at this than practitioners. The cause of workplace fatalities are
complex and as the analysis has shown that professionals cannot account for all of the
variation in the fatality rate. There are certainly other factors that can also account for
the variation in the fatality such as the recent recession as suggested in the paper.
There can be no suggestion that reducing fatalities only requires adding more safety
professionals as this is a highly simplistic view. Additionally we have seen that it is
possible that there is a diminishing level of return that this paper was unable to quantify

65
for practitioners and professionals. The data clearly show that quality in safety
professionals is more prudent than quantity of practitioners.
Safety professionals reduce the risk of fatalities and, according to Alberta results;
companies with safety professionals are less likely to experience a fatality. Additional
research can shed more light on the value of a safety professional to an organization.
However, this paper has clearly demonstrated that value to organizations, industries,
and families. Safety professionals do save lives and are much more effective at it that
any other stakeholder or group.

66
REFERENCES
ACSA. (2011, Fall). NCSO Corner. The ACSA Advisor, p. 6.
Adams, P. S., Brauer, R. L., Karas, B., Bresnahan, T. F., & Murphy, H. (2004,
December). Professional Certification. Professional Safety, pp. 26-31.
Alberta apprenticeship and industry training. (2011, January 31). Changes to
Journeyperson to Apprentice Ratios . Retrieved from Alberta apprenticeship and
industry training: http://www.tradesecrets.gov.ab.ca/
Alberta Construction Safety Association. (n.d.). National Construction Safety Officer
(NCSO). Retrieved from ACSA: http://www.acsa-safety.org/page.php?s=2&p=4
ASSE. (n.d.). A brief history of the American Society of Safety Engineers. Retrieved
from American Society of Safety Engineers:
http://www.asse.org/about/history.php
Assessment Strategies. (2011). BCRSP Annual Salary Survey. Mississauga, Ontario:
BCRSP.
AWCBC. (n.d.). Worker's Compensation Timeline. Retrieved from Association of
Workers' Compensation Boards of Canada:
http://www.awcbc.org/en/print_page.asp?pagename=workerscompensationtimeli
ne.asp&
BCSP. (n.d.). Construction Health and Safety Technician. Retrieved from BCSP:
http://www.bcsp.org/chst
Behm, M. (2002, July). Too Few PhDs in Safety. Professional Safety, pp. 38-40.
Bernard, A. (n.d.). Trends in manufacturing employment . Retrieved from Statistics
Canada: http://www.statcan.gc.ca/pub/75-001-x/2009102/article/10788-eng.htm
Bird, F. E., & Germain, G. L. (1996). Practical Loss Control Leadership, Revised Edition.
Loganville, Georgia, USA: Det Norske Veritas.
Blair, E. H. (2004, Spring). Critical Competancies for SH&E Managers - Implications for
Educators. The Journal of SH&E Research.
Cameron, D. I., Hare, D. B., & Duff, D. R. (2007). Superior Safety Perfromance.
Retrieved from IOSH:

67
http://www.iosh.co.uk/information_and_resources/research_and_development/re
search_fund/published_research.aspx
Cameron, D. I., Hare, D. B., & Duff, D. R. (2007). The impact of expert health and safety
advice. Wigston, Leicestershire, UK: IOSH.
Cameron, D. I., Hare, D. B., & Roy, D. (2008). The impact of expert health and safety
advice. Retrieved from IOSH:
http://www.iosh.co.uk/information_and_resources/research_and_development/re
search_fund/published_research.aspx
Canadian Agricultural Injury Survellance Program. (2008). Agricultural Fatalities in
Canada 1990-2005. Retrieved from Canadain Agricultual Safety Association:
http://cair-sbac.ca/natfull.pdf
Ceniceros, R. (2009, December). Workplace safety is about people's lives. Business
insurance, pp. 43-44. Retrieved from Business insurance.
Certified Occupational Safety Specialist. (n.d.). Certified Occupational Safety Specialist
(COSS) Program. Retrieved from Certified Occupational Safety Specialist:
http://www.coss.net/
Choi, S. D., Kapp, E. A., & Cole, W. M. (2006, July). Educating Construction Safety
Professionals. Professional Safety, pp. 41-45.
Coglianese, C., Nash, J., & Olmstead, T. (2002). Performance-Based Regulation:
Prospects and Limitations in Health, Safety and Environmental Protection.
Retrieved from Harvard University: http://www.hks.harvard.edu/m-
rcbg/Events/Papers/RPPREPORT3.pdf
CSSE. (n.d.). About CSSE. Retrieved from Canadian Society of Safety Engineering:
http://www.csse.org/about_csse/organization_overview.htm
Dizikes, P. (2010, March 16). Explained: Regression analysis. Retrieved from MIT
news: http://web.mit.edu/newsoffice/2010/explained-reg-analysis-0316.html
Donaghy, R. (2009). One Death is too Many. Government of the United Kingdom.
Erickson, J. A. (2011, August 2). What was Heinrich thinking. Retrieved from Industrial
Safety and Health News: http://www.ishn.com/articles/91461-what-was-heinrich-
thinking
Fox Business. (2011, March 23). Behind the Triangle Shirtwaist Factory Fire. Retrieved
from Fox Business.

68
Glegg, A. T. (1899). Commentary on the Workmen's Compensation Act 1897. Retrieved
from Cornell University Library Archive:
http://archive.org/details/cu31924002279382
Goldstein, J., & Vo, L. T. (2012, March 21). What America does for Work. Retrieved
from National Public Radio:
http://www.npr.org/blogs/money/2012/03/20/149015363/what-america-does-for-
work
Government of Alberta. (1995). FARMING AND RANCHING EXEMPTION
REGULATION. Retrieved from Alberta Queens Printer:
http://www.qp.alberta.ca/574.cfm?page=1995_027.cfm&leg_type=Regs&isbncln=
0779706161
Government of Alberta. (2009, December 31). Workplace Incident Fatalities
Investigated in 2009. Retrieved from Alberta Employment:
http://employment.alberta.ca/documents/WHS/WHS-PUB_wpfatal_2009.pdf
Government of Alberta. (2012). Alberta Farm Fatality Statistics. Retrieved from Alberta
Agriculture and Rural Development:
http://www1.agric.gov.ab.ca/$department/deptdocs.nsf/all/aet5237
Government of Alberta. (n.d.). Fatality Reports. Retrieved from Employment Alberta:
http://employment.alberta.ca/SFW/781.html
Greer, M. (2001, October). 90 Years of progress in safety. Professional Safety, pp. 20-
25.
Gupta, V. (1999). SPSS for beginners. VJBooks.
Gupta, V. (2000, April 23). Regression explained in simple terms. Retrieved from
mywebspace:
https://mywebspace.wisc.edu/rlbrown3/web/library/regression_explained.pdf
Health and Safety Executive. (2011). Successful Health and Safety Management
HSG65. Retrieved from Health and Safety Executive:
http://www.hse.gov.uk/pubns/priced/hsg65.pdf
HSE Executive. (2006, June 28). Tthe Health and Safety Risks and Regulatory Strategy
Related to Energy Developments. Retrieved from HSE Executive:
http://www.hse.gov.uk/consult/condocs/energyreview/energyreport.pdf
HSE Executive. (n.d.). About health and safety in agriculture. Retrieved from HSE
Executive: http://www.hse.gov.uk/agriculture/hsagriculture.htm

69
HSE Executive. (n.d.). What must I report? Retrieved from HSE Executive:
http://www.hse.gov.uk/riddor/what-must-i-report.htm
Institute of Medicine. (2000). Safe Work in the 21st Century:Education and Training
Needs for the next decade's Occupational, Health and Safety Personnel.
Washiington DC: National Academy Press. Retrieved from National Academies
Press: http://www.nap.edu/openbook.php?record_id=9835&page=236
Karcher, M. A., Kuperminc, G. P., Portwood, S. G., Sipe, C. L., & Taylor, A. S. (2006).
Mentoring Programs: A Framework to inform program development, research,
and evaluation. Retrieved from SMILE:
http://utsasmile.org/pdf/Karcher_ProgramFrameworkJCP06.pdf
Krause, T. R., Groover, D. R., & Martin, D. K. (2010, June). Preventing Incidents &
Fatalities. Professional Safety, pp. 46-53.
Lawrence, T. (2008, November). Championing the SH&E Professional. Professional
Safety, pp. 40-42.
Macza, M. (2008, September 3). A Canadian Perspective of the History of Process
Safety Management Legislation. Retrieved from ACM Facility Safety:
http://www.acm.ab.ca/uploadedFiles/003_Resources/Articles_in_ProcessWest/A
%20Canadian%20Perspective%20of%20the%20History%20of%20PSM%20Legi
slation.pdf
Manuele, F. A. (2011, October). Reviewing Heinrich. Professional safety, pp. 52-61.
McAdams, M. T., Kerwin, J. J., Olivo, V., & Goksel, H. A. (2011, October 3). National
Assessment of the Occupational Safety and Health Workforce. Retrieved from
NIOSH: http://www.cdc.gov/niosh/oshworkforce/pdfs/NASHW_Final_Report.pdf
National Safety Council. (2011). Injury Facts 2011. Retrieved from National Safety
Council: http://www.nsc.org/Documents/Injury_Facts/Injury_Facts_2011_w.pdf
Office of National Statistics. (2000). Standard Occupation Coding 2000 Volume 2.
London, UK: The Stationary Office.
Ontario Ministry of Labour. (2010, December 10). Expert Advisory Panel on
Occupational Health and Safety. Retrieved from Ontario Ministry of labour:
http://www.labour.gov.on.ca/english/hs/pdf/eap_report.pdf
OSHA. (2008). OSHA Factbook. Occupational Safety and Health Administration US
Department of Labour.

70
OSHA. (2012, June 16). THE TRIANGLE SHIRTWAIST FACTORY FIRE. Retrieved
from Occupational Health and Safety Administration:
http://www.osha.gov/oas/trianglefactoryfire.html
OSHA. (n.d.). Agricultural Operations. Retrieved from OSHA:
http://www.osha.gov/SLTC/agriculturaloperations/index.html
Parlimentary Advisory Council for Transport Safety. (2006, July). Road Safety Bill:Work-
Related Road Safety. Retrieved from http://www.pacts.org.uk/docs/pdf-
bank/RS%2520Bill%2520PACTS%2520Briefing%2520WorkRelated-July06.pdf
Petersen, D. (2003). Techniques of Safety Management, 4th Ed. Des Plaines, Illionois:
American Society of Safety Engineers.
Rinefort, F. C., Petrick, J. A., & Schukin, V. (2001, May). Occupational Safety & Health
in Russia. Professional Safety, pp. 19-23.
Rosen, J. (2000, Jul/Aug). Assessment of training needs for occupational safety and
health personnel in the United States: A Labour Perspective. AIHA Journal, pp.
456-460.
RoSPA. (n.d.). History of RoSPA. Retrieved from Royal Society for the Prevention of
Accidents: http://www.rospa.com/about/history/default.aspx
Roughton, J. (n.d.). The Accident Pyramid. Retrieved from Safety Culture Plus:
http://emeetingplace.com/safetyblog/2008/07/22/the-accident-pyramid/
Runyan, J. (n.d.). Federal Laws and Regulations Affecting Farm Safety . Retrieved from
National Agriculture Safety Database:
http://nasdonline.org/document/1842/d001777/federal-laws-and-regulations-
affecting-farm-safety.html
Scherer, R. F., Petrick, J. A., & Quinn, J. F. (1996, Fall). Sources of Injury: Occupational
Safety Trends. Review of Business, pp. 11-14.
Shannon, H. S., & Lowe, G. S. (2002). How Many Injured Workers Do Not File Claims
for Workers’ Compensation Benefits? American Journal of Industrial Medicine,
pp. 467-473.
Sharpe, A., & Hardt, J. (2006, December). Five Deaths a Day: Workplace Fatalities in
Canada, 1993-2005. Retrieved from Centre for the Study of Living Standards:
http://www.csls.ca/reports/csls2006-04.pdf
Sherk, J. (2006, April). Mentoring Tactics. Retrieved from Mentoring.org:
http://www.mentoring.org/downloads/mentoring_1327.pdf

71
Statistics Canada. (n.d.). National Occupational Classification (NOC) 2011. Retrieved
from Statistics Canada:
http://www23.statcan.gc.ca:81/imdb/p3VD.pl?Function=getVDDetail&db=imdb&di
s=2&adm=8&TVD=122372&CVD=122376&CPV=2263&CST=01012011&MLV=4
&CLV=4&CHVD=
The Canadian Press. (2012, August 20). Alberta government erasing farm workers,
labour federation says. Retrieved from OHS Canada:
http://www.ohscanada.com/news/alberta-government-erasing-farm-workers-
labour-federation-says/1001635630/
Thomas, C. R., & Maurice, S. C. (2008). Managerial Economics (9th ed.). New York,
NY: McGraw-Hill Irwin.
Trades Union Congress. (2010, September). The Case for Health and Safety. Retrieved
from Trades Union Congress:
http://www.tuc.org.uk/extras/the_case_for_health_and_safety.pdf
UK Department for Business Innovation & Skills. (2010, December). Manufacturing in
the UK: Supplementary analysis. Retrieved from UK Department for Business
Innovation & Skills: http://www.bis.gov.uk/assets/biscore/business-
sectors/docs/m/10-1334-manufacturing-in-the-UK-supplementary-analysis
US Department of Commerce. (2010, July). The State of Manufacturing in the United
States International Trade Administration. Retrieved from US Department of
Commerce:
http://trade.gov/manufactureamerica/facts/tg_mana_003019.asp#P35_4119
US Department of Labour. (2012, August 20). Expert Forum on the Use of
Performance-Based Regulatory Models in the U.S. Oil and Gas Industry,
Offshore and Onshore. Retrieved from US Department of Labour:
http://www.osha.gov/pls/oshaweb/owadisp.show_document?p_table=FEDERAL_
REGISTER&p_id=23267
Warren, J. (n.d.). Safety & Security. Retrieved from Justice Institue of British Columbia:
http://www.bcbusinessonline.ca/files/files/JIBC.pdf
Wiatrowski, W. J. (2004, December). Occupational injury and illness:New recordkeeping
requirements. Retrieved from Bureau of Labour Statistics:
http://www.bls.gov/opub/mlr/2004/12/art2full.pdf
Williams, J. L. (1998, February). Defining the Safety Profesisonal. Professional Safety,
p. 13.

72
World Safety Organization. (n.d.). Retrieved from World Safety Organization:
http://www.worldsafety.org/

73
APPENDIX A: International Fatality Numbers
2000 2001 2002 2003 2004 2005 2006 2007 2008 2009 2010
United States1 5920 5915 5534 5575 5764 5734 5840 5657 5214 4551 4690
United Kingdom2 292 251 227 236 223 217 233 233 179 147 171
Canada3 386 365 321 320 287 322 268 272 279 253 235
3. Source is regulatory agencies of worker compensation boards in provinces. Federal workplaces, Quebec, Yukon, Northwest Territories, and Nunuvit are excluded.
Workforce persons
United States1 129,738,980 127,980,410 127,523,760 127,420,170 128,127,360 130,307,840 132,604,980 134,354,250 135,185,230 130,647,610 127,097,160
United Kingdom2 27,443,000 27,643,000 27,852,000 28,132,000 28,635,000 28,665,000 28,926,000 29,100,000 29,475,000 28,870,000 28,774,000
Canada3 11,455,900 11,505,700 11,885,000 12,135,200 12,315,300 12,507,200 12,757,800 13,077,200 13,218,100 12,999,600 13,193,100
1. Bureau of Labour Statistics (BLS) Occupational Employment Statistics (OES) Estimates
3. Statistics Canada Cansim Table 282-0054
Total rate
2000 2001 2002 2003 2004 2005 2006 2007 2008 2009 2010
United States 4.56 4.62 4.34 4.38 4.50 4.40 4.40 4.21 3.86 3.48 3.69
United Kingdom 1.06 0.91 0.82 0.84 0.78 0.76 0.81 0.80 0.61 0.51 0.59
Canada1 3.37 3.17 2.70 2.64 2.33 2.57 2.10 2.08 2.11 1.95 1.78
1. Does not include Federal workplaces, Quebec, Yukon, Northwest Territories, or Nunuvit
1. Does not include fatalities from World Trade Centre attack. Source is Bureau of Labour Statistics
2. UK HSE Executive. RIDDOR data
2. Office of National Statistics (ONS) Report EMP16: All in employment by status, occupation & sex. 2nd quarter annually. Figures for year 2000 are estimated.

74
APPENDIX B: International Construction Numbers
2000 2001 2002 2003 2004 2005 2006 2007 2008 2009 2010
United States1 1115 1226 1125 1126 1224 1186 1226 1178 969 816 751
United Kingdom2 105 80 70 71 69 60 79 72 52 41 50
Canada3 77 83 74 117 81 99 100 93 102 94 90
Construction Workforce persons
2000 2001 2002 2003 2004 2005 2006 2007 2008 2009 2010
United States1 6,187,360 6,239,430 6,124,600 6,776,700 6,891,440 7,215,240 7,633,080 7,671,680 7,456,300 6,497,870 5,662,980
% of workforce 4.77% 4.88% 4.80% 5.32% 5.38% 5.54% 5.76% 5.71% 5.52% 4.97% 4.46%
United Kingdom2 3,210,000 3,247,000 3,271,000 3,239,000 3,252,000 3,244,000 3,149,000 3,288,000 3,221,000 3,050,000 3,094,000
% of workforce 11.70% 11.75% 11.74% 11.51% 11.36% 11.32% 10.89% 11.30% 10.93% 10.56% 10.75%
Canada3 648,800 661,400 708,400 747,600 815,300 850,400 900,300 937,100 991,900 946,100 974,600
% of workforce 5.66% 5.75% 5.96% 6.16% 6.62% 6.80% 7.06% 7.17% 7.50% 7.28% 7.39%
Total rate construction
2000 2001 2002 2003 2004 2005 2006 2007 2008 2009 2010
United States 18.02 19.65 18.37 16.62 17.76 16.44 16.06 15.36 13.00 12.56 13.26
United Kingdom 3.27 2.46 2.14 2.19 2.12 1.85 2.51 2.19 1.61 1.34 1.62
Canada1 11.87 12.55 10.45 15.65 9.93 11.64 11.11 9.92 10.28 9.94 9.23
Construction fatalities as a percentage of total
2000 2001 2002 2003 2004 2005 2006 2007 2008 2009 2010
United States 18.83% 20.73% 20.33% 20.20% 21.24% 20.68% 20.99% 20.82% 18.58% 17.93% 16.01%
United Kingdom 35.96% 31.87% 30.84% 30.08% 30.94% 27.65% 33.91% 30.90% 29.05% 27.89% 29.24%
Canada 19.95% 22.74% 23.05% 36.56% 28.22% 30.75% 37.31% 34.19% 36.56% 37.15% 38.30%
3. Canadian figures do not include Quebec Yukon, Northwest Territories, or Nunuvit. Statistics Canada Cansim table 282-0007
1. Bureau of Labour Statistics (BLS) annual news release
2. Office of National Statistics (ONS)
1. Bureau of Labour Statistics (BLS) national Occupation System (NOS) estimates
2. Numbers for the year 2000 are estimated. Office of National Statistics (ONS) report EMP16 2nd Quarter
3. Canadian figures do not include Federal workplaces Quebec Yukon, Northwest Territories, or Nunuvit. Data for Ontario in the year 2000 is estimated.
1. Canadian figures do not include Federal Workplaces, Quebec, Yukon, Northwest Territories, or Nunuvit.

75
APPENDIX C: Canadian Fatality Numbers
2000 2001 2002 2003 2004 2005 2006 2007 2008 2009 2010
Newfoundland1 21 14 10 9 10 13 8 7 6 25 13
PEI2 0 4 2 0 3 1 1 3 2 2 0
Nova Scotia3 14 15 12 19 24 15 12 6 20 16 12
New Brunswick4 7 13 11 8 6 10 7 8 11 12 6
Ontario5 125 104 106 103 95 79 83 95 71 66 71
Manitoba6 25 28 17 16 16 19 15 31 24 19 14
Saskatchewan7 35 29 16 15 6 14 6 7 9 11 8
Alberta8 60 48 46 46 44 46 37 47 52 41 43
British Columbia9
99 110 101 104 83 125 99 68 84 61 68
Canada10 386 365 321 320 287 322 268 272 279 253 235
Labour Force
2000 2001 2002 2003 2004 2005 2006 2007 2008 2009 2010
Newfoundland 199,800 206,100 205,100 208,700 208,700 210,300 215,500 215,600 213,000 210,900 219,800
PEI 61,100 62,500 63,300 65,000 67,000 67,400 66,900 67,500 67,200 69,000 68,800
Nova Scotia 411,600 423,100 427,000 434,700 442,600 441,800 444,100 452,100 453,800 454,400 449,000
New Brunswick 334,400 333,500 344,800 344,000 348,800 346,700 346,700 358,000 358,600 359,300 352,300
Ontario 5,892,800 5,934,400 6,124,900 6,259,600 6,338,800 6,411,600 6,480,100 6,626,100 6,670,100 6,542,200 6,658,900
Manitoba 551,700 559,700 571,800 571,400 582,800 583,200 589,600 602,500 610,100 607,100 622,300
Saskatchewan 467,700 452,700 476,600 475,100 485,600 477,200 501,200 505,800 518,300 519,200 522,600
Alberta 1,598,200 1,638,200 1,700,500 1,754,400 1,787,700 1,844,700 1,941,700 2,003,100 2,069,500 2,009,600 2,029,800
British Columbia 1,938,600 1,895,500 1,971,000 2,022,300 2,053,300 2,124,300 2,172,000 2,246,500 2,257,500 2,227,900 2,269,600
Canada111,455,900 11,505,700 11,885,000 12,135,200 12,315,300 12,507,200 12,757,800 13,077,200 13,218,100 12,999,600 13,193,100
Fatals per 100,000 employees
2000 2001 2002 2003 2004 2005 2006 2007 2008 2009 2010
Newfoundland 10.51 6.79 4.88 4.31 4.79 6.18 3.71 3.25 2.82 11.85 5.91
PEI 0.00 6.40 3.16 0.00 4.48 1.48 1.49 4.44 2.98 2.90 0.00
Nova Scotia 3.40 3.55 2.81 4.37 5.42 3.40 2.70 1.33 4.41 3.52 2.67
New Brunswick 2.09 3.90 3.19 2.33 1.72 2.88 2.02 2.23 3.07 3.34 1.70
Ontario 2.12 1.75 1.73 1.65 1.50 1.23 1.28 1.43 1.06 1.01 1.07
Manitoba 4.53 5.00 2.97 2.80 2.75 3.26 2.54 5.15 3.93 3.13 2.25
Saskatchewan 7.48 6.41 3.36 3.16 1.24 2.93 1.20 1.38 1.74 2.12 1.53
Alberta 3.75 2.93 2.71 2.62 2.46 2.49 1.91 2.35 2.51 2.04 2.12
British Columbia 5.11 5.80 5.12 5.14 4.04 5.88 4.56 3.03 3.72 2.74 3.00
Canada 3.37 3.17 2.70 2.64 2.33 2.57 2.10 2.08 2.11 1.95 1.78
7. Saskatchewan numbers provided by the Worker's Compensation Board on request.
8. Alberta numbers provided by Worker's Compensation Board on request.
9. British Columbia numbers acquired from WorkSafe BC Statistical reports
10. Canadian numbers do not include Federal workplaces, Quebec, Yukon, Northwest Territories, and Nunuvit.
1. Statistics Canada Cansim Table 282-0054 Annual December numbers
6. Manitoba numbers acquired from Worker's Compensation Board Statistical Reports
1. Newfoundland numbers provided by Worker's Health Safety and Compensation Commission on request.
2. PEI numbers provided by Worker's Compensation Board on request.
3. Nova Scotia numbers provided by Nova Scotia Labour on request.
4. New Brunswick numbers provided by WorkSafe New Brunswick on request.
5. Ontario numbers provided by the Worker's Safety and Insurance Board on request.

76
APPENDIX D: Canadian Construction Fatalities
2000 2001 2002 2003 2004 2005 2006 2007 2008 2009 2010
Newfoundland12 6 1 2 3 1 0 3 1 3 3
PEI2 0 2 1 0 0 0 0 0 1 1 0
Nova Scotia31 0 1 2 1 1 2 0 3 2 1
New Brunswick40 3 1 1 0 2 2 2 1 4 2
Ontario520 20 20 26 18 16 27 18 15 21 20
Manitoba61 4 6 3 1 1 3 8 4 5 3
Saskatchewan70 0 0 15 6 14 6 7 9 11 8
Alberta818 12 10 17 13 17 14 19 19 15 10
British Columbia932 32 27 44 28 38 37 30 33 30 32
Canada1074 79 67 110 70 90 91 87 86 92 79
Construction Labour Force
2000 2001 2002 2003 2004 2005 2006 2007 2008 2009 2010
Newfoundland 9,500 8,900 10,300 8,400 12,700 10,800 12,700 13,800 16,000 15,300 16,100
PEI 3,000 4,700 4,300 4,000 3,900 5,100 5,400 4,400 4,600 5,800 4,700
Nova Scoitia 25,500 22,900 23,700 26,600 28,600 27,500 27,400 29,300 32,300 32,700 32,900
New Brunswick 17,100 17,300 18,300 17,400 18,000 17,800 21,200 23,500 22,300 23,400 27,800
Ontario 311,400 330,100 349,400 379,600 382,500 405,700 412,500 401,900 432,800 410,900 427,200
Manitoba 25,100 25,800 25,200 24,200 26,900 28,700 28,900 34,200 36,700 33,500 39,700
Saskatchewan 21,500 24,300 23,700 20,700 25,700 26,200 30,400 30,900 39,100 37,200 38,100
Alberta 128,600 127,100 138,300 147,400 166,600 158,600 180,900 195,000 202,100 199,100 210,800
British Columbia 107,100 100,300 115,200 119,300 150,400 170,000 180,900 204,100 206,000 188,200 177,300
Canada1
648,800 661,400 708,400 747,600 815,300 850,400 900,300 937,100 991,900 946,100 974,600
Fatals per 100,000 employees
2000 2001 2002 2003 2004 2005 2006 2007 2008 2009 2010
Newfoundland 21.05 67.42 9.71 23.81 23.62 9.26 0.00 21.74 6.25 19.61 18.63
PEI 0.00 42.55 23.26 0.00 0.00 0.00 0.00 0.00 21.74 17.24 0.00
Nova Scoitia 3.92 0.00 4.22 7.52 3.50 3.64 7.30 0.00 9.29 6.12 3.04
New brunswick 0.00 17.34 5.46 5.75 0.00 11.24 9.43 8.51 4.48 17.09 7.19
Ontario 6.42 6.06 5.72 6.85 4.71 3.94 6.55 4.48 3.47 5.11 4.68
Manitoba 3.98 15.50 23.81 12.40 3.72 3.48 10.38 23.39 10.90 14.93 7.56
Saskatchewan 0.00 0.00 0.00 72.46 23.35 53.44 19.74 22.65 23.02 29.57 21.00
Alberta 14.00 9.44 7.23 11.53 7.80 10.72 7.74 9.74 9.40 7.53 4.74
British Columbia 29.88 31.90 23.44 36.88 18.62 22.35 20.45 14.70 16.02 15.94 18.05
Canada 11.41 11.94 9.46 14.71 8.59 10.58 10.11 9.28 8.67 9.72 8.11
6. Manitoba numbers acquired from Worker's Compensation Board Statistical Reports
1. Newfoundland numbers provided by Worker's Health Safety and Compensation Commission on request.
2. PEI numbers provided by Worker's Compensation Board on request.
3. Nova Scotia numbers provided by Nova Scotia Labour on request.
4. New Brunswick numbers provided by WorkSafe New Brunswick on request.
5. Ontario numbers provided by the Worker's Safety and Insurance Board on request. * Numbers for year 2000 are estimated
7. Saskatchewan numbers provided by the Worker's Compensation Board on request.
8. Alberta numbers provided by Worker's Compensation Board on request.
9. British Columbia numbers acquired from WorkSafe BC Statistical reports
10. Canadian numbers do not include Quebec, Yukon, Northwest Territories, and Nunuvit.
1. Numbers from December of each year. Statistics Canada Cansim 282-0007

77
APPENDIX E: Alberta Fatalities
Alberta fatalities
2000 2001 2002 2003 2004 2005 2006 2007 2008 2009 2010 2011
Fatalities1 60 48 46 46 44 46 37 47 52 41 43 38
Work force2 1,598,200 1,638,200 1,700,500 1,754,400 1,787,700 1,844,700 1,941,700 2,003,100 2,069,500 2,009,600 2,029,800 2,230,100
Fatality rate 3.75 2.93 2.71 2.62 2.46 2.49 1.91 2.35 2.51 2.04 2.12 1.70
Fatalities construction
2000 2001 2002 2003 2004 2005 2006 2007 2008 2009 2010 2011
Fatalities 60 48 46 46 44 46 37 47 52 41 43 38
Farm Fatalities 19 13 19 13 11 16 13 11 15 12 19 13
Total Fatalities 79 61 65 59 55 62 50 58 67 53 62 51
Construction 21 16 17 24 24 26 23 25 35 17 21 21
Percentage 26.58% 26.23% 26.15% 40.68% 43.64% 41.94% 46.00% 43.10% 52.24% 32.08% 33.87% 41.18%
Construction fatality rate
2000 2001 2002 2003 2004 2005 2006 2007 2008 2009 2010 2011
Fatalities1 21 16 17 24 24 26 23 25 35 17 21 21
Work force2 128,600 127,100 138,300 147,400 166,600 158,600 180,900 195,000 202,100 199,100 210,800 217,500
Fatality rate 16.33 12.59 12.29 16.28 14.41 16.39 12.71 12.82 17.32 8.54 9.96 9.66
1. Traumatic fatalities. Source Alberta Worker's Compensation Board
2. Source Statistics Canada Cansim 282-0054 December numbers
1. Traumatic fatalities. Source Alberta Worker's Compensation Board
2. Source Statistics Canada Cansim 282-0054 December numbers