the volunteer monitor's guide to quality assurance project plans
TRANSCRIPT

The VolunteerMonitor's Guide To
Quality AssuranceProject Plans
United StatesEnvironmental ProtectionAgency
Office of Wetlands,Oceans and Watersheds4503F
EPA 841-B-96-003September 1996

The Volunteer Monitor’s Guide to
Quality AssuranceProject Plans

Dear Reader:
Across the country, volunteers are monitoring the condition of streams, rivers, lakes,reservoirs, estuaries, coastal waters, wetlands, and wells. The number and variety of theseprojects are continually on the rise. So, too, is the complexity of the monitoring volunteersconduct and the uses of the data they collect.
One of the most difficult issues facing volunteer environmental monitoring programstoday is data credibility. Potential data users are often skeptical about volunteer data -- they mayhave doubts about the goals and objectives of the project, about how volunteers were trained,about how samples were collected, handled and stored, or about how data were analyzed andreports written. A key tool in breaking down this barrier of skepticism is the quality assuranceproject plan.
The quality assurance project plan, or QAPP, is a document that outlines the proceduresthat those who conduct a monitoring project will take to ensure that the data they collect andanalyze meets project requirements. It is an invaluable planning and operating tool that outlinesthe project’s methods of data collection, storage and analysis. It serves not only to convinceskeptical data users about the quality of the project’s findings, but also to record methods, goalsand project implementation steps for current and future volunteers and for those who may wishto use the project’s data over time.
Developing a QAPP is a dynamic, interactive process that should ideally involve qualityassurance experts, potential data users, and members of the volunteer monitoring project team. It is not an easy process. This document is designed to encourage and facilitate the developmentof volunteer QAPPs by clearly presenting explanations and examples. Readers are urged toconsult, as well, the additional resources listed in the appendices to this document, and to contacttheir state or U.S. Environmental Protection Agency (EPA) Regional quality assurance staff forspecific information or guidance on their projects.
Sincerely,Geoffrey H. Grubbs, DirectorAssessment and Watershed Protection Division

Contents:
Executive Summary . . . . . . . . . . . . . . . . . . . . . . . . . . . . . . . . . . . . . . . . . . . . . i
Chapter 1 Introduction . . . . . . . . . . . . . . . . . . . . . . . . . . . . . . . . . . . . . . . . 1
Chapter 2 Developing a QAPP . . . . . . . . . . . . . . . . . . . . . . . . . . . . . . . . . . 7
Chapter 3 Some Basic QA/QC Concepts . . . . . . . . . . . . . . . . . . . . . . . . . 15
Chapter 4 Elements of a QAPP . . . . . . . . . . . . . . . . . . . . . . . . . . . . . . . . 23
Appendix A Glossary . . . . . . . . . . . . . . . . . . . . . . . . . . . . . . . . . . . . . . . . . . 41
Appendix B EPA Regional Contacts . . . . . . . . . . . . . . . . . . . . . . . . . . . . . . 45
Appendix C References . . . . . . . . . . . . . . . . . . . . . . . . . . . . . . . . . . . . . . . . 49
Appendix D Abbreviated QAPP Form . . . . . . . . . . . . . . . . . . . . . . . . . . . . . 51
AcknowledgementsThis manual was developed by the U.S. Environmental Protection Agencythrough contract no. 68-C3-0303 with Tetra Tech, Inc. The project manager wasAlice Mayio, USEPA Office of Wetlands, Oceans, and Watersheds. Principalauthors include Margo Hunt, USEPA Region 2; Alice Mayio, USEPA; MartinBrossman, USEPA; and Abby Markowitz, Tetra Tech, Inc.
The authors wish to thank the many reviewers who provided constructive andinsightful comments to earlier drafts of this document. This guidance manualwould not have been possible without their invaluable advice and assistance.
Original illustations by Dave Skibiak and Emily Faalasli of Tetra Tech, Inc., andElizabeth Yuster of the Maryland Volunteer Watershed Monitoring Association.
September 1996

Executive Summary i
EXECUTIVE SUMMARY
EPA-funded monitoring
programs must have an
EPA-approved QAPP
before sample collection
begins. However, even
programs that do not
receive EPA money
should consider
developing a QAPP,
especially if data might
be used by state, federal,
or local resource
managers.
he Quality Assurance Project Plan, or QAPP, is a written document thatToutlines the procedures a monitoring project will use to ensure that thesamples participants collect and analyze, the data they store and manage,
and the reports they write are of high enough quality to meet project needs.
U.S. Environmental Protection Agency-fundedmonitoring programs must have an EPA-approvedQAPP before sample collection begins. However,even programs that do not receive EPA moneyshould consider developing a QAPP, especially ifdata might be used by state, federal, or localresource managers. A QAPP helps the data userand monitoring project leaders ensure that thecollected data meet their needs and that the qualitycontrol steps needed to verify this are built into theproject from the beginning.
Volunteer monitoring programs have longrecognized the importance of well-designedmonitoring projects; written field, lab, and data management protocols; trainedvolunteers; and effective presentation of results. Relativelyfew programs, however, have tackled the task of preparing acomprehensive QAPP that documents these importantelements.
This document is designed to help volunteer programcoordinators develop such a QAPP.
Steps to Developing a QAPP
Developing a QAPP is a dynamic, interactive process thatshould ideally involve state and EPA regional QA experts,

ii The Volunteer Monitor’s Guide to Quality Assurance Project Plans
A QAPP helps the data
user and monitoring
project leaders ensure
that the data collected
meet their needs.
potential data users, and key members of the volunteer monitoring project. Thereare 11 steps a volunteer monitoring project coordinator might take to prepare aQAPP. These are:
Step 1: Establish a small team whose members will serve as advisors inhelping you develop the QAPP by offering feedback and guidancethroughout the entire process.
Step 2: Determine the goals & objectives of your project--why it’s needed,who will use the data, and how the data will be used.
Step 3: Collect background information to help you in designing yourproject.
Step 4: Refine your project’s goals once you’ve collected more information.
Step 5: Design your project’s sampling, analytical & data requirements--essentially, what, how, when, and where you’ll be monitoring.
Step 6: Develop an implementation plan that lays out project logistics.
Step 7: Draft your standard operating procedures (SOPs) & QAPP.
Step 8: Solicit feedback on your draft SOPs & QAPP from state or EPAregional QA contacts and potential data users.

Executive Summary iii
The “PARCC”Parameters
Taken together, the termsPrecision, Accuracy,Representativeness,Completeness, andComparability, comprisethe major data qualityindicators used to assessthe quality of your data. It is essential tounderstand these termsand to address them inyour QAPP. Chapter 3of this document includesa discussion of these indicators and givesexamples of how to evaluate the quality of yourdata in relation to these terms.
According to EPA
guidance, 24 distinct
elements can be
included in a QAPP,
although not all
elements may be
necessary for all
programs.
Step 9: Revise your QAPP based on reviewcomments and submit it for approval.
Step 10: Once your QAPP is approved, begin yourmonitoring program.
Step 11: Evaluate and refine your project over time,and reflect any major changes in a revisedQAPP.
Basic QA/QC Concepts
It is important to understand the terminology ofquality assurance and quality control in order todevelop a QAPP. Key definitions include:
Precision -- the degree of agreement among repeated measurements of thesame characteristic. It may be determined by calculating the standarddeviation, or relative percent difference, among samples taken from thesame place at the same time.
Accuracy -- measures how close your results are to a true or expected valueand can be determined by comparing your analysis of astandard or reference sample to its actual value.
Representativeness -- the extent to whichmeasurements actually represent the trueenvironmental condition or population at the time asample was collected.
Completeness -- the comparison between the amountof valid, or usable, data you originally planned tocollect, versus how much you collected.
Comparability -- the extent to which data can becompared between sample locations or periods of timewithin a project, or between projects.
Elements of a QAPP
According to EPA guidance, 24 distinct elements can be included in a QAPP,although not all elements may be necessary for all programs. Which elementsyou end up including in your QAPP depends on your project's goals, objectives, scope, data uses, and on the guidance you receive from your state or

iv The Volunteer Monitor’s Guide to Quality Assurance Project Plans
EPA regional quality assurance contacts. The 24 elements are grouped into fouroverall categories and are listed below:
Project Management (elements 1-9)1. Title and Approval Page2. Table of Contents3. Distribution List4. Project/Task Organization5. Problem Identification/ Background6. Project/Task Description7. Data Quality Objectives for Measurement Data8. Training Requirements/Certification9. Documentation and Records
Measurement/Data Acquisition (elements 10-19)10. Sampling Process Design11. Sampling Methods Requirements12. Sample Handling and Custody Requirements13. Analytical Methods Requirements14. Quality Control Requirements15. Instrument/Equipment Testing, Inspection, and Maintenance
Requirements16. Instrument Calibration and Frequency17. Inspection/Acceptance Requirements for Supplies18. Data Acquisition Requirements19. Data Management
Assessment and Oversight (elements 20-21)20. Assessment and Response Actions21. Reports
Data Validation and Usability (elements 22-24)22. Data Review, Validation, and Verification Requirements23. Validation and Verification Methods24. Reconciliation with Data Quality Objectives
Chapter 1: Introduction 1
Chapter 1:
INTRODUCTION
Top 20ParametersAssessed by
VolunteerMonitors
Water temperaturepH
Dissolved OxygenMacroinvertebrates
Debris clean-upHabitat assessments
NitrogenPhosphorusTurbidity
Coliform bacteriaSecchi depth
Aquatic vegetationFlow
Birds/WildlifeFish
Watershed mappingRainfall
Photographic surveysSalinity
Sediment assessments
Source: Directory of VolunteerEnvironmental MonitoringPrograms, 4th Edition
cross the country, volunteers are monitoring the condition of streams,Arivers, lakes, reservoirs, estuaries, coastal waters, wetlands, and wells. The number and variety of these projects is continually on the rise; so,
too, is the complexity of the monitoring they conduct and theuses of the data they collect.
Most volunteer monitoring projects evaluate the chemical,physical, or biological condition of waters in a given watershed. They may address different kinds of waters—e.g., streams with associated embayments—and they may conduct several types ofmonitoring activities. Some projects may address only one typeof monitoring in one type of waterbody, e.g., nutrient samplingin estuaries. Morecomprehensive projects maytake basic chemicalmeasurements of conditionssuch as dissolved oxygen levels,pH, or salinity, evaluate thephysical condition of streamsidehabitat, and evaluate thebiological condition of aquaticinsects or vegetation.
Not only do volunteer projects monitor many differentparameters and types of waters, they are also organized andsupported in many different ways. Volunteer monitoringprojects may be associated with state, interstate, local, or federalagencies, with environmental organizations or universities, or may be entirelyindependent. Financial support may come from government grants, partnershipswith business, endowments, independent fundraising efforts, corporate donations,membership dues, or a combination of any and all of these sources. Most
volunteer projects are fairly small and have verysmall budgets--based on EPA's latest Directory ofVolunteer Environmental Monitoring Programs,4th Edition, we know that the median programsize is 25 volunteers, and the median annualbudget is under $5,000. However, there are alsovolunteer programs with over 1,000 volunteersand those with annual budgets of more than$50,000.

Volunteer Monitoring Data Uses
53
84
120
127
160
213
225
226
288
333
439
Number of Programs
305(b)
Legislation
Enforcement
Water Classif/Stds
Habitat Restoration
Watershed PlanningNPS Assessment
Research
Local Decisions
Problem Identification
Education
0 100 200 300 400 500
2 The Volunteer Monitor’s Guide to Quality Assurance Project Plans
Source: Directory of Volunteer Environmental MonitoringPrograms, 4th Edition
Although the goals and
objectives of volunteer
projects vary greatly,
virtually all volunteers
hope to educate
themselves and others
about water quality
problems and thereby
promote a sense of
stewardship for the
environment.
Although the goals andobjectives of volunteerprojects vary greatly, virtually all volunteers hopeto educate themselves andothers about water qualityproblems and therebypromote a sense ofstewardship for theenvironment. Many projects,in fact, establish these astheir goals. These projectsmight be called primarilyeducation oriented.
Other projects seek a moreactive role in themanagement of local waterresources, and therefore
strive to collect data that can be used in making water quality managementdecisions. Common uses of volunteer data include local planning decisions, suchas identifying where to route a highway; local priority setting, such asdetermining which county lakes require restoration; screening for potentialpollution problems, which might then be investigated more thoroughly by waterquality agencies; and providing data for state water quality reports, which mightthen be used for statewide or national priority setting. Projects doing this type ofmonitoring might be called primarily data oriented. Data oriented volunteerprojects, in particular, must continuously wrestle with the issue of credibility.
They must prove to skeptics that their volunteers collectgood-quality data that is:
= consistent over time and within projects and groupmembers
= collected and analyzed using standardized andacceptable techniques
= comparable to data collected in other assessments usingthe same methods
These projects must adopt protocols that are straightforwardenough for volunteers to master and yet sophisticatedenough to generate data of value to resource managers.
This delicate and difficult path cannot be successfullynavigated without a quality assurance plan that details a

Chapter 1: Introduction 3
Why Should You Developa QAPP?
The QAPP is an invaluable planning andoperating tool that should be developed in the earlystages of the volunteer monitoring project.
Even if a volunteer monitoring project does notreceive any EPA money through grants, thecoordinating group should still consider developing a
QAPP, especially if it is a data orientedproject and seeks tohave its informationused by state, federal, orlocal resourcemanagers.
Few water qualityagencies will usevolunteer data unless
methods of datacollection, storage, and analysis can be documented. Clear and concise documentation of procedures alsoallows newcomers to the project to continuemonitoring using the same methods as those whocame before them.
This is particularly important to a volunteer projectthat may see volunteers come and go and that intendsto establish a baseline of water quality information thatcan be compared over time.
A Quality Assurance
Project Plan, or QAPP,
is a written document
outlining the procedures
a monitoring project
will use to ensure the
data it collects and
analyzes meets project
requirements.
project's standard operating procedures in the field and lab,outlines project organization, and addresses issues such astraining requirements, instrument calibration, and internalchecks on how data are collected, analyzed, and reported. Just how detailed such a plan needs to be depends to a largeextent on the goals of the volunteer monitoring project.
What Is a Quality AssuranceProject Plan?
A Quality Assurance Project Plan, or QAPP, is a writtendocument outlining the procedures a monitoring project willuse to ensure the data it collects and analyzes meets projectrequirements. The U.S. Environmental Protection Agency(EPA) has issued interim guidance that establishes up to 24distinct elements of a QAPP (see Appendix C: References). Together, these elements of a QAPP comprise a project's quality assurancesystem. As we will discuss below, not all 24 elements need be addressed in everyQAPP.
By law, any EPA-funded monitoring project must have an EPA-approved QAPPbefore it can begin collecting samples. Thepurpose of this requirement is to ensure that thedata collected by monitoring projects are ofknown and suitable quality and quantity.Typical sources of EPA funding for volunteermonitoring projects include Lake WaterQuality Assessment Grants (under Section 314of the Clean Water Act) or grants under thenonpoint source pollution control program(Section 319 of the Clean Water Act). Qualityassurance staff in each of EPA's 10 regionaloffices are available to review volunteermonitoring QAPPs and have authority torecommend approval or disapproval of QAPPs. In addition, volunteer monitoring coordinatorsand individual EPA project officers in the EPARegions may be able to assist projects seekingadvice on the preparation of QAPPs. (SeeAppendix A, Regional Quality AssuranceContacts.)
About This Document
The purpose of this document is to providevolunteer monitoring programs with theinformation they need to develop a quality

4 The Volunteer Monitor’s Guide to Quality Assurance Project Plans
The purpose of this
document is to provide
volunteer monitoring
programs with the
information they need to
develop a quality assurance
project plan.
assurance project plan. It does not suggest specific field,laboratory, or analytical techniques or procedures, and isnot a "how to" manual. It is organized as follows:
Executive Summary introduces the reader to the stepsinvolved in developing a QAPP, fundamental QA/QCconcepts, and the basic elements of a QAPP.
Chapter 1: Introduction provides background onvolunteer monitoring, discusses the purposes of QAPPs,and outlines the structure of this document.
Chapter 2: Developing a QAPP outlines the steps avolunteer monitoring project should take as it moves toward developing a qualityassurance system, documenting its procedures in a QAPP, seeking approval of itsQAPP, and updating the QAPP over time.
Chapter 3: QA/QC: Basic Concepts introduces basic quality assurance/qualitycontrol (QA/QC) concepts and definitions that are needed in developing a qualityassurance system and a QAPP. Examples from a fictional project--the VolunteerCreek Monitoring Project--are used to illustrate these concepts.
Chapter 4: Elements of a QAPP presents the basic elements of a volunteermonitoring quality assurance project plan (QAPP), again with examples from theQAPP of the fictional Volunteer Creek Monitoring Project.
Appendix A: Glossary defines various terms and concepts associated with qualityassurance and control.
Appendix B: EPA Regional Contacts is a list of people within EPA who canassist, and offer guidance to, volunteer monitoring programs. Each of the 10

Chapter 1: Introduction 5
Volunteer monitoring
programs are strongly
urged to consult the
references listed in
Appendix C for further
information on quality
assurance/quality control
and the Quality Assurance
Project Plan process.
EPA regions has a volunteer monitoring coordinator as well as QA staff. Thisappendix also shows which states and U.S. territories are within each of the 10regions.
Appendix C: References is a list of documents andarticles relevant to volunteer monitoring and qualityassurance issues. All EPA volunteer monitoringdocuments are available by contacting the NationalVolunteer Monitoring Coordinator at USEPA. Theaddress is given in the appendix.
Appendix D: Abbreviated QAPP Form is an example ofthe layout and structure of a quality assurance projectplan. Some programs may wish to adapt this form to fittheir plan.
◆◆◆◆◆
This document is not intended as a stand-alone referencedocument. Volunteer monitoring programs are stronglyurged to consult the references listed in Appendix C forfurther information on quality assurance/quality control and the QualityAssurance Project Plan process.

6 The Volunteer Monitor’s Guide to Quality Assurance Project Plans

Chapter 2: Developing a QAPP 7
Chapter 2:
DEVELOPING A QAPP
STEPS TO DEVELOPING AQAPP
step 1: Establish a QAPP team
step 2: Determine the goals & objectives of your project
step 3: Collect background information
step 4: Refine your project
step 5: Design your projects sampling, analytical & datarequirements
step 6: Develop an implementation plan
step 7: Draft your standard operating procedures (SOPs) &QAPP
step 8: Solicit feedback on your draft SOPs & QAPP
step 9: Revise your QAPP & submit it for final approval
step 10: Begin your monitoring project
step 11: Evaluate and refine your QAPP
he purpose of this chapter is to discuss the steps a volunteer monitoringTprogram might take in preparing a quality assurance project plan(QAPP). If your plan does not need to be approved by EPA (that is, you
are not receiving EPA grant or contract money to conduct your monitoring), youneed not submit your QAPP for EPAapproval. In that case, consult yourdata users, such as the state or countywater quality agency, regarding theirQAPP requirements.
Developing a QAPP is a dynamic,interactive process. Seek as muchfeedback as possible from those whohave gone before you in the QAPPdevelopment process. You will beinvesting a substantial amount of timeand energy, but don’t be discouraged. The person who writes the QAPP isusually the one who ends up with themost technical expertise andmonitoring insights. Your efforts willpay off in a living document thathelps current and future volunteers,staff, and data users understandexactly how your project works.
STEP 1
Establish a small QAPP team
It will be helpful to pull together a small team of two or three people who canhelp you develop the QAPP. Include representatives from groups participating inthe monitoring project who have technical expertise in different areas of theproject.
Take the time to establish contact with your state, local or EPA QualityAssurance Officer, or other experienced volunteer organizations. Remember, ifyou are getting any EPA funding through a grant or contract, EPA must approveyour QAPP. However, even if EPA approval isn’t needed, you can consult with

8 The Volunteer Monitor’s Guide to Quality Assurance Project Plans
Why are you developing
this monitoring project?
Who will use its
information, and how will it
be used? If you don't have
answers to these questions,
you may flounder when it
comes time to put your
QAPP down on paper.
EPA QA representatives if you need advice. Let them know a bit about yourproject, and find out if they have any resources that might help you out (such as acopy of an approved volunteer monitoring QAPP, or specific regional guidanceon preparing plans). Also ask your QA contact if he or she would be willing to
review your draft plan.
STEP 2
Determine thegoals andobjectives of yourproject
Why are you developing thismonitoring project? Who willuse its information, and how willit be used? What will be the basisfor judging the usability of thedata collected? If you don't haveanswers to these questions, youmay flounder when it comes timeto put your QAPP down on paper.
Project goals could include, for example:
= identifying trends in a lake to determine if nuisancevegetation problems are on the rise
= monitoring in conjunction with the county healthdepartment to be sure a beach is safe for swimmers
= teaching local elementary schoolers about streammacroinvertebrates
= monitoring the effectiveness of a stream restorationproject
Write down your goal. The more specific your project'sgoal, the easier it will be to design a QAPP. Identify theobjectives of your project--that is, the specific statements
of how you will achieve your goal. For example, if your project's goal is toidentify trends in a lake plagued by nuisance vegetation, your objectives might beto collect three years of data on weed beds, algae, and nutrients, and to developyearly reports for nearby lake residents.
Chapter 2: Developing a QAPP 9
Knowing the use of the
collected data will help
you determine the right
kind of data to collect,
and the level of effort
necessary to collect,
analyze, store, and
report it...Each use of
volunteer data has
potentially different
requirements.
Knowing the use of the collected data will help youdetermine the right kind of data to collect, and the level ofeffort necessary to collect, analyze, store, and report it. Volunteer monitoring data can be used to screen forproblems, educate youth and the community, supplementstate agency data, help set statewide priorities for pollutioncontrol, and a myriad of other uses. Each use of volunteerdata has potentially different requirements.
Your project should be designed to meet the needs of yourdata users. Data users can include the volunteersthemselves, state water quality analysts, local planningagencies, parks staff, or many others. You will alsoprobably need to strike a balance between data quality andavailable resources.
STEP 3
Collect background information
As you learn more about the area you are choosing to monitor, you will be betterable to design an effective monitoring project. Begin by contacting programs andagencies that might already monitor in your area. Talk to the state water qualityagency, the county and/or city environmental office, local universities, andneighboring volunteer monitoring programs. Ask about their sampling locations,what parameters they monitor and what methods they use.
If they are already monitoring in your chosen area, find out if they will share theirdata, and identify what gaps exist that your project could fill. If no monitoring isongoing, find out what kind of data your local or state agencies could use (if oneof your goals is that these agencies use your data), where they would prefer youlocate your sampling sites, and what monitoringmethods they recommend. Governmentagencies are not likely to use your dataunless it fills a gap in their monitoringnetwork and was collected usingapproved protocols.
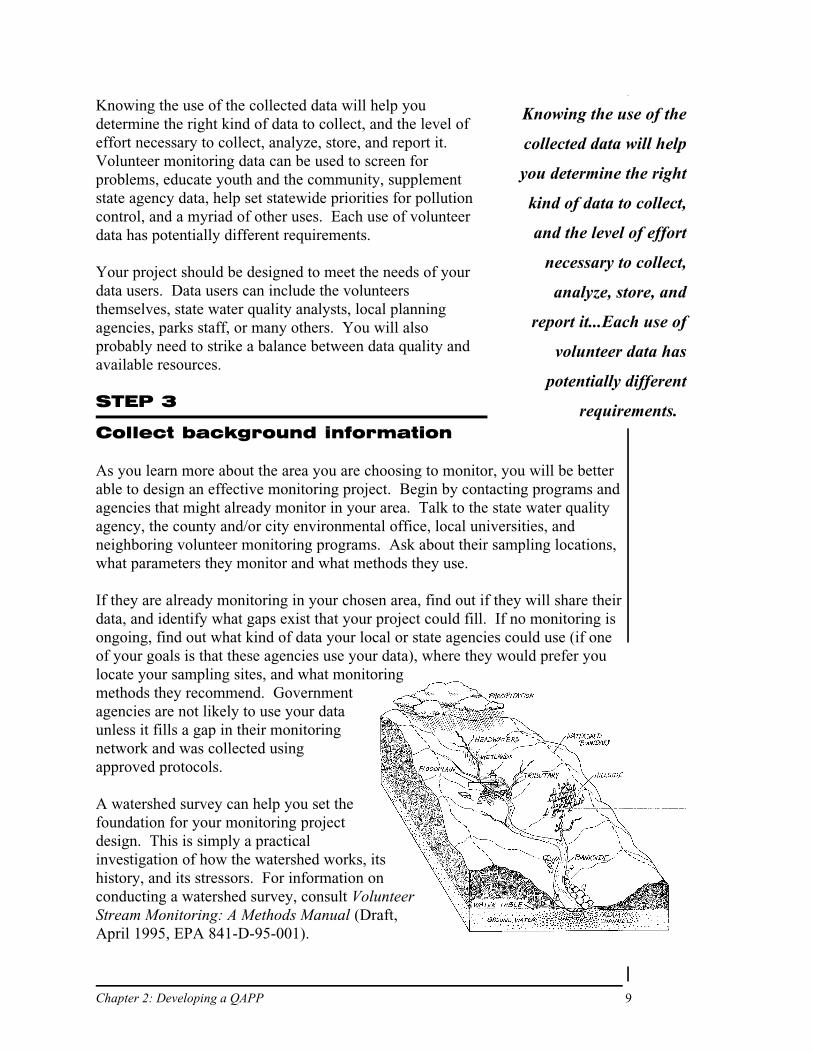
A watershed survey can help you set thefoundation for your monitoring projectdesign. This is simply a practicalinvestigation of how the watershed works, itshistory, and its stressors. For information onconducting a watershed survey, consult VolunteerStream Monitoring: A Methods Manual (Draft,April 1995, EPA 841-D-95-001).

10 The Volunteer Monitor’s Guide to Quality Assurance Project Plans
Once you've collected
background information
for your project and
coordinated with
potential data users, you
may find it necessary to
refine your original
project goals and
objectives.
STEP 4
Refine your project
Once you've collected background information for your project and coordinatedwith potential data users, you may find it necessary to refine your original projectgoals and objectives. You may have found, for example, that the county already
regularly monitors weed and algae growth in your lake. Inthat case, your project might better examine nutrient inputsfrom tributaries, lake water clarity, or other parameters.
Don't hesitate to reevaluate your project goals andobjectives. Now is the best possible time to do so: beforeyou've invested time, money, and effort in equipmentpurchases, training, grant proposals and quality assuranceplan development.
STEP 5
Design your project’s sampling,analytical, and datarequirements
Once you feel comfortable with your project's goals and objectives, and havegathered as much background information as possible on the area you will bemonitoring, it is time to focus on the details of your project. Convene a planningcommittee consisting of the project coordinator, key volunteers, scientificadvisors, and data users, along with your QAPP team. This committee shouldaddress the following questions:
= What parameters or conditions will you monitor, and which are mostimportant to your needs? Which are of secondary importance?
= How good does your monitoring data need to be?
= How will you pick your sampling sites, and how will you identify them overtime?
= What methods or protocols will you use for sampling and analyzing samples?
= When will you conduct the monitoring?
= How will you manage your data and ensure your data are credible?

Chapter 2: Developing a QAPP 11
Your standard operating
procedures (SOPs) are
the details on all the
methods you expect
your volunteers to use.
This can serve as the
project handbook you
give your volunteers.
As a general rule, it is a good idea to start small and build to a more ambitiousproject as your volunteers and staff grow more experienced.
STEP 6
Develop an implementation plan
You've done the hard part once you've developed your monitoring project design. The next step is to decide the particulars -- the logistics, if you will. These are,essentially, the whos and whens of your project.
Determine who will carry out individual tasks such as volunteer training, datamanagement, report generation, assuring lab and field quality assurance, andrecruiting volunteers. If you send your samples to an outside lab, choose the laband specify why you chose it.
Set up schedules for when you will recruit and trainvolunteers, conduct sampling and lab work, produce reports,and report back to volunteers or the community.
STEP 7
Draft your standard operatingprocedures and QAPP
Now it's time to actually write your standard operatingprocedures and develop a draft QAPP. Your standardoperating procedures (SOPs) are the details on all themethods you expect your volunteers to use and can serve asthe project handbook you give your volunteers. Remember,there are many SOPs already available for sampling andanalytical procedures. Where possible,adapt your procedures from existingmethods and modify them as needed to fityour project objectives. Be sure toreference and cite any existing methodsand documents you use in your project.
You should append your standardoperating procedures to your QAPP andrefer to them throughout the QAPPdocument. Use the elements described inChapter 4 as your guide in developing adraft QAPP. Your written plan can beelaborate or simple, depending on your project goals.

12 The Volunteer Monitor’s Guide to Quality Assurance Project Plans
Based on the comments
you receive from the
review of your draft
plan, you may have to
revise your QAPP.
STEP 8
Solicit feedback on your draft SOPs andQAPP
Draft QAPP in hand, your next step is to run the draft by people "in the know." These are, primarily, state and EPA Regional volunteer monitoring coordinatorsand Quality Assurance Officers, EPA project officers, and any other agency data
users (such as a representative from the county planningoffice or Natural Resource Conservation Service, if you arecollecting data you hope they will use). Ask for theirfeedback and suggestions. Expect their review to take up totwo or three months (times will vary).
While you are waiting for comments, you should probablytry out your procedures with volunteers on a trial basis, tosee if they really work. Don't plan to use the data at thisearly stage, however; you will probably be finding quirks inyour plan, and the data will not be accepted by your data
users until the QAPP is approved and accepted.
You may find that some of your QA contacts resist the idea of reviewing yourdraft plan. This is because they are often quite overburdened. Don't give up;after a reasonable time has elapsed since you submitted your plan, call back andinquire if you should submit the draft elsewhere for review. Solicit all thecomments you can, from as many sources as possible.
STEP 9
Revise your QAPP and submit it for finalapproval
Based on the comments you receive from the review of your draft plan, you mayhave to revise your QAPP. This could involve simply being more specific aboutexisting methods and quality control procedures in the plan, or actually modifyingyour procedures to meet agency requirements. Once you have revised or fine-tuned your QAPP, submit it to the proper agency for formal approval.
Final review/approval can take a couple of months. During this time, you may beasked to incorporate additional comments, although this is less likely if you hadpreviously asked the approving official to review your draft.
Note: If you are developing a QAPP simply to document your methods and arenot working in cooperation with a state, local, or federal agency, you need notsubmit a QAPP for review and approval.

Chapter 2: Developing a QAPP 13
STEP 10
Once the QAPP is approved, begin yourmonitoring project
Once you've received EPA and/or state approval of your QAPP, your monitoringproject can begin. Follow the procedures described in your QAPP to trainvolunteers and staff, conduct sampling, analyze samples, compileresults, and develop any reports.
STEP 11
Evaluate and refineyour project over time
As time goes on, you may decide toimprove on sampling techniques, siteselection, lab procedures or any of the other elements of yourmonitoring project design. Project evaluation should occurduring the course of your project rather than after the project or asampling season is completed.
If you make any substantive changes in your QAPP, document them and seekEPA/state approval for the changes. A phone call to your QA official can helpyou determine if the changes require a new QAPP. Also, always be prepared forformal audits or QC inquiries from data users during the course of your project.

14 The Volunteer Monitor’s Guide to Quality Assurance Project Plans

Chapter 3: Some Basic QA/QC Concepts 15
Chapter 3:
SOME BASIC QA /QC
CONCEPTS
QA ensures that your
data will meet defined
standards of quality
with a stated level of
confidence.
QC Measures
Internal Quality Control is a set ofmeasures that the project undertakesamong its own samplers and within itsown lab to identify and correct analyticalerrors. Examples include lab analysttraining and certification, properequipment calibration anddocumentation, laboratory analysis ofsamples with known concentrations orrepeated analysis of the same sample, andcollection and analysis of multiplesamples from the field.
External Quality Control is a set ofmeasures that involves laboratories andpeople outside of the program. Thesemeasures include performance audits byoutside personnel, collection of samplesby people outside of the program from afew of the same sites at the same time asthe volunteers, and splitting some of thesamples for analysis at another lab.
External and internal QC measures aredescribed in more detail in the “QCSamples” box at the end of this chapter.
s coordinator of a volunteer monitoring program, you are probablyAinvolved in many aspects of project planning, sample collection,laboratory analysis, data review, and data assessment. You should be
considering quality assurance and quality control activities in every one of thesesteps.
Quality assurance (QA) refers to the overall managementsystem which includes the organization, planning, datacollection, quality control, documentation, evaluation, andreporting activities of your group. QA provides theinformation you need to ascertain the quality of your dataand whether it meets the requirements of your project. QAensures that your data will meet defined standards of qualitywith a stated level of confidence.
Quality control (QC) refers to the routine technical activitieswhose purpose is, essentially, error control. Since errorscan occur in either the field, the laboratory or in theoffice, QC must be part of each of these functions. QCshould include both internal and external measures (seeside box).
Together, QA and QC help you produce data of knownquality, enhance the credibility of your group inreporting monitoring results, and ultimately save timeand money. However, a good QA/QC program is onlysuccessful if everyone consents to follow it and if allproject components are available in writing. The QualityAssurance Project Plan (QAPP) is the written record ofyour QA/QC program.
This chapter is designed to introduce you to theterminology of quality assurance/quality control. Thekey terms we will be addressing are: precision, accuracy(sometimes referred to as bias), representativeness,completeness, comparability, and sensitivity. You will

16 The Volunteer Monitor’s Guide to Quality Assurance Project Plans
Measures of precision,
accuracy,
representativeness,
completeness,
comparability, and
sensitivity help us
evaluate sources of
variability and error and
thereby increase
confidence in our data.
be seeing these terms again, so you may want to spend sometime getting to know them.
In natural systems, such as streams, lakes, estuaries, andwetlands, variability is a factor of life. Changes intemperature, flow, sunlight, and many other factors affectthese systems and the animals that inhabit them. Variabilityalso occurs when we attempt to monitor such systems. Eachof us reads, measures, and interprets differently; we mayalso apply different levels of effort in how we monitor. Theequipment we use may be contaminated, broken orincorrectly calibrated. These and many other differencescan lead to variability in monitoring results. Measures ofprecision, accuracy, representativeness, completeness,comparability, and sensitivity help us evaluate sources ofvariability and error and thereby increase confidence in ourdata.
Because all projects have different goals, data users and uses, capabilities, andmethods, this document cannot tell you what levels of precision, accuracy,representativeness, completeness, comparability, and sensitivity are acceptable foryour individual project. You will need to consult your advisory panel (inparticular, your data users), the laboratory you deal with, and peer reviewers to
determine acceptance criteria for yourmonitoring project.
Precision
Precision is the degree of agreementamong repeated measurements of thesame characteristic on the samesample or on separate samplescollected as close as possible in timeand place. It tells you how consistentand reproducible your field orlaboratory methods are by showingyou how close your measurements areto each other. It does not mean thatthe sample results actually reflect the"true" value, but rather that yoursampling and analysis are givingconsistent results under similarconditions.
Typically, precision is monitoredthrough the use of replicate samples or

sn
i 1
(X1 X)2
n 1
RSDs
X×100
RPD(X1 X2)×100
(X1 X2)÷2
Chapter 3: Some Basic QA/QC Concepts 17
STANDARD DEVIATIONSTANDARD DEVIATION
The Volunteer Creek Monitoring Project wants to determine theprecision of its temperature assessment procedure. They havetaken 4 replicate samples:
Replicate 1 (X ) = 21.1 C10
Replicate 2 (X ) = 21.1 C20
Replicate 3 (X ) = 20.5 C30
Replicate 4 (X ) = 20.0 C40
To determine the Standard Deviation (s), use the followingformula:
where x = measured value ofi
the replicate, x = mean ofreplicate measurements, n =number of replicates, = thesum of the calculations for eachmeasurement value--in this case,X through X1 4
First, figure out the mean, oraverage of the sample measurements. Mean = (X + X + X + X )1 2 3 4
÷ 4. In this example, the mean is equal to 20.68 C.0
Then, for each sample measurement (X through X ), calculate the1 4
next part of the formula. For X and X , the calculation would1 2
look like this:
(21.1 - 20.68) = (-0.42) = 0.1764 = 0.05882 2
4-1 3 3
For X the calculation would be 0.0108; and for X it would be3 4
0.1541
Finally, add together the calculations for each measurement andfind the square root of the sum: 0.0588 + 0.0588 + 0.0108 +0.1541 = 0.2825. The square root of 0.2825 is 0.5315.
So, the standard deviation for temperature is 0.532 (rounded off).
RELATIVE STANDARDRELATIVE STANDARDDEVIATIONDEVIATION
If we use the same replicate measurements asabove in the standard deviation example, wecan determine the Relative StandardDeviation (RSD), or coefficient of variation,using the following formula:
where s =standarddeviation and x = mean ofreplicate samples.
We know s = 0.5315 and that x = 20.68. So,the RSD = 2.57. This means that ourmeasurements deviate by about 2.57%.
RELATIVE PERCENTRELATIVE PERCENTDIFFERENCEDIFFERENCE
If the Volunteer Creek project had only two replicates (21.1 C0
and 20.5 C) they would use Relative Percent Difference (RPD)0
to determine precision.
where X = the larger of1
the two values and X =2
the smaller of the twovalues. In this example,X = 21.1 and X = 20.5 . 1 2
0 0
RPD = (21.1-20.5) x 100 = 60.00 = 2.88(21.1+20.5) ÷ 2 20.8
So, in this example, the RPD between our sample measurements is2.88%.
measurements. Replicate samples aretwo or more samples taken from thesame place at the same time.
When you have many replicatesamples, determine precision bycalculating the standard deviation(s)of the samples. The standarddeviation indicates the range ofvariation in the measurements you'vetaken. Many of today's calculatorsperform the standard deviationcalculation.
The relative standard deviation(RSD), or coefficient of variation,expresses the standard deviation as apercentage. This is generally easierfor others to understand. The smallerthe relative standard deviation (orstandard deviation), the more preciseyour measurements.
When you have only two replicatesamples, determine precision bycalculating the relative percentdifference (RPD) of the two samples. Again, the smaller the relative percentdifference, the more precise yourmeasurements.

InaccurateInaccurate
Accurate Inaccurate
18 The Volunteer Monitor’s Guide to Quality Assurance Project Plans
ACCURACY
Attendance at QC training sessions is required for VolunteerCreek monitors. In the field, monitors use a Jones Wide-RangepH Kit, which covers a full range of expected pH values. Duringa recent training session, the monitors recorded the followingresults when testing a pH standard buffer solution of 7.0 units.
7.57.46.7
7.26.87.3
6.57.26.8
7.07.47.2
Accuracy = average value - true value
The average of these measurements is equal to 7.08 units. Sincewe know that the reference or “true” value is 7.0 units, thedifference between the average pH value is off or biased by + 0.08units. This level of accuracy is satisfactory for the data qualityobjectives of the project.
PRECISION, BIAS, ANDACCURACY
Accuracy
Accuracy is a measure of confidence in a measurement. The smaller thedifference between the measurement of a parameter and its "true" or expected
value, the more accurate themeasurement. The more precise orreproducible the result, the morereliable or accurate the result.
Measurement accuracy can bedetermined by comparing a samplethat has a known value, such as astandard reference material or aperformance evaluation sample, to avolunteer's measurement of thatsample (see note below). Increasingly, however, somescientists, especially those involvedwith statistical analysis ofmeasurement data, have begun to usethe term "bias" to reflect this error inthe measurement system and to use"accuracy" as indicating both thedegree of precision and bias (see"bullseye" figure at left). For thepurpose of this document, the term"accuracy" will be used.
If you are concerned that other components of a sample matrix (e.g., soil orsludge) may be interfering with analysis of a parameter, one way to measureaccuracy is to add a known concentration of the parameter to a portion of the
sample. This is called a spikedsample. The difference between theoriginal measurement of theparameter in the sample and themeasurement of the spiked sampleshould equal (or be close to) the addedamount. The difference indicatesyour ability to obtain an accuratemeasurement.
For many parameters such as secchidepth and macroinvertebrateabundance, no standard reference orperformance evaluation samples exist. In these cases, the trainer's results maybe considered the reference value to

Chapter 3: Some Basic QA/QC Concepts 19
which the volunteer's results are compared. Thisprocess will help evaluate if the volunteermeasurements are biased as compared to thetrainer's.
If you are monitoring biological conditions bycollecting and identifying specimens, maintaininga voucher collection is a good way to determine ifyour identification procedures are accurate. Thevoucher collection is a preserved archive of theorganisms your volunteers have collected andidentified. An expert taxonomist can then provide a "true"value by checking the identification in the voucher collection.
It is important to note that the relationship between a vouchercollection and accurate identification cannot be expressednumerically in your QAPP. Rather, the QAPP document shouldindicate that you have a voucher collection and describe how it isused to evaluate consistent accurate identification in yourprogram.
Note: Standard reference material (in the form of solids or solutions with acertified known concentration of pollutant) can be obtained from a variety ofcompanies, including the National Institute of Standard and Technologies, thatsell quality control, proficiency, or scientific reference materials.
Representativeness
Representativeness is the extent to which measurements actually depict the trueenvironmental condition or population you are evaluating. A number of factorsmay affect the representativeness of your data. For instance, are your samplinglocations indicative of the waterbody? Data collected just below a pipe outfall is not representative of an entire stream. Minimizing the effects of variation iscritical in the development of your sampling design.
Completeness
Completeness is a measure of the number of samples you must take to be able touse the information, as compared to the number of samples you originallyplanned to take. Since there are many reasons why your volunteers may notcollect as many samples as planned, as a general rule you should try to take moresamples than you determine you actually need. This issue should be discussedwithin your QAPP team and by peer reviewers before field activities begin.

%C=v
Tx100
20 The Volunteer Monitor’s Guide to Quality Assurance Project Plans
COMPLETENESS
The Volunteer Creek Monitoring project planned to collect 20samples, but because of volunteer illness and a severe storm, only17 samples were actually collected. Furthermore, of these, twosamples were judged invalid because too much time elapsedbetween sample collection and lab analysis. Thus, of the 20samples planned, only 15 were judged valid.
The following formula is used to determine PercentCompleteness (%C).
where v = the number of plannedmeasurements judged valid and T = thetotal number of measurements.
In this example, v = 15 and T = 20. Inthis case, percent completeness would
be 75 percent. Is this enough information to be useful?
To calculate percent completeness,divide the number of measurementsthat have been judged valid by thetotal number of measurements youoriginally planned to take and thenmultiply by 100.
Remember, completenessrequirements can be lowered if extrasamples are factored into the project. The extra samples in turn, increase thelikelihood of more representative data.
Comparability
Comparability is the extent to whichdata from one study can be compared
directly to either past data from the current project or data from another study. For example, you may wish to compare two seasons of summer data from yourproject or compare your summer data set to one collected 10 years ago by statebiologists.
Using standardized sampling and analytical methods, units of reporting, and siteselection procedures helps ensure comparability. However, it is important to keep in mind that sometypes of monitoring rely heavily on best professionaljudgement and that standard methods may not alwaysexist.
Detection Limit
The term detection limit can apply to monitoring andanalytical instruments as well as to methods. In general,detection limit is defined as the lowest concentration ofa given pollutant your methods or equipment can detectand report as greater than zero. Readings that fall below the detection limit aretoo unreliable to use in your data set. Furthermore, as readings approach thedetection limit (that is, as they go from higher, easier-to-detect concentrations tolower, harder-to-detect concentrations) they become less and less reliable. Manufacturers generally provide detection limit information with high-grademonitoring equipment such as meters.
Measurement Range
The measurement range is the range of reliable measurements of an instrument ormeasuring device. Preassembled kits usually come with information indicating

Chapter 3: Some Basic QA/QC Concepts 21
The general rule is that
10% of samples should
be quality control (QC)
samples.
the measurement range that applies. For example, you mightpurchase a kit that is capable of detecting pH falling between 6.1and 8.1. However, pH can theoretically range from 0.0 to 14.00. If acidic conditions (below 6) are a problem in the waters youare monitoring, you will need to use a kit or meter that issensitive to the lower pH ranges.
Quality Control (QC) Samples
Contamination is a common source of error in both samplingand analytical procedures. QC samples help you identify whenand how contamination might occur. For most projects, there isno set number of field or laboratory QC samples which must betaken. The general rule is that 10% of samples should be QC
samples. This means that if 20 samples arecollected, at least one additional sample mustbe added as a QC sample. The laboratorymust also run its own QC samples. For a newmonitoring project or for a new analyticalprocedure, it is a good idea to increase thenumber of QC samples(up to 20%) until youhave full confidence inthe procedures you areusing.
When the project is over, determine data quality byevaluating the results of all the QC samples and determiningprecision and accuracy. For QC samples that are not blindto the lab, require the lab to calculate and report precision and accuracy results. Lab reported precision and accuracy results can then be checked during datavalidation.
The decision to accept data, reject it, or accept only a portion of it is should bemade after analysis of all QC data. Various types of QC samples are described inthe box on the next page.

22 The Volunteer Monitor’s Guide to Quality Assurance Project Plans
QC SAMPLES
= A field blank is a “clean” sample, producedin the field, used to detect analytical problems during the whole process(sampling, transport, and lab analysis). Tocreate a field blank, take a clean samplingcontainer with "clean" water (i.e., distilledor deionized water that does not containany of the substance you are analyzingfor) to the sampling site. Other samplingcontainers will be filled with water fromthe site. Except for the type of water inthem, the field blank and all site samplesshould be handled and treated in the sameway. For example, if your method callsfor the addition of a preservative, thisshould be added to the field blank in thesame manner as in the other samples.When the field blank is analyzed, itshould read as analyte-free or, at aminimum, the reading should be afactor of 5 below all sample results.
= An equipment or rinsate blank is a“clean” sample used to check thecleanliness of sample collectionequipment. This type of blank isused to evaluate if there iscarryover contamination from reuseof the same sampling equipment. A sample of distilled water iscollected in a sample containerusing regular collectionequipment and analyzed as asample.
= A split sample is one sample that is dividedequally into two or more sample containersand then analyzed by different analysts orlabs. Split samples are used to measureprecision. Samples should be thoroughlymixed before they are divided. Large errorscan occur if the analyte is not equallydistributed into the two containers. Asample can be split in the field, called a fieldsplit, or in the laboratory, a lab split. The
lab split measures analytical precision whilethe field split measures both analytical andfield sampling precision. In addition, asample split in the field and submitted to thelaboratory without informing the laboratoryrepresents a blind sample. Split samples canalso be submitted to two differentlaboratories for analysis to measure thevariability in results between laboratoriesindependently using the same analyticalprocedures.
= Replicate samples are obtained when twoor more samples are taken from the samesite, at the same time, using the samemethod, and independently analyzed inthe same manner. When only twosamples are taken, they are sometimesreferred to as duplicate samples. Thesetypes of samples are representative of thesame environmental condition.Replicates (or duplicates) can be used todetect both the natural variability in theenvironment and that caused by fieldsampling methods.
= Spiked samples are samples towhich a known concentration of theanalyte of interest has been added. Spiked samples are used tomeasure accuracy. If this is done inthe field, the results reflect theeffects of preservation, shipping,laboratory preparation, andanalysis. If done in the laboratory,they reflect the effects of theanalysis from the point when thecompound is added, e.g. just priorto the measurement step. Percentrecovery of the spike material isused to calculate analytical accuracy.

Chapter 4: Elements of a QAPP 23
Chapter 4:
ELEMENTS OF A QAPP
ELEMENTS OF A QAPP
Project Management (elements 1-9)
1. Title and Approval Page2. Table of Contents3. Distribution List4. Project/Task Organization5. Problem Identification/ Background6. Project/Task Description7. Data Quality Objectives for Measurement Data8. Training Requirements/ Certification9. Documentation and Records
Measurement/Data Acquisition (elements 10-19)
10. Sampling Process Design11. Sampling Methods Requirements12. Sample Handling and Custody Requirements13. Analytical Methods Requirements14. Quality Control Requirements15. Instrument/Equipment Testing, Inspection, and
Maintenance Requirements16. Instrument Calibration and Frequency17. Inspection/Acceptance Requirements for Supplies18. Data Acquisition Requirements19. Data Management
Assessment and Oversight (elements 20-21)
20. Assessment and Response Actions21. Reports
Data Validation and Usability (elements 22-24)
22. Data Review, Validation, and VerificationRequirements
23. Validation and Verification Methods24. Reconciliation with Data Quality Objectives
his chapter discusses the 24 elements of a Quality Assurance Project Plan,Tas outlined in EPA quality assurance guidance, EPA Requirements forQuality Assurance Project Plans for Environmental Data Operations
(EPA QA/R-5, August 1994). It is very likely that not all elements will apply toyour project. This is an issue that should be discussed with your QAPP team andany group who will be approving the QAPP. If your project does not require all24 elements, indicate in your QAPP which elements you will not be including. This will make review and approval of your QAPP faster and easier.
Throughout this chapter, brief examples are included. The examples are drawnfrom a fictional monitoring project--the Volunteer Creek Monitoring Project. They are not intended to becomprehensive, but rather simply tohelp illustrate the type of informationthat might be included in the elementsof a QAPP. For more information, youmay wish to contact other volunteermonitoring programs with approvedQAPPs.
TITLE AND1 APPROVAL PAGEYour title page should include thefollowing:
= title and date of the QAPP
= names of the organizationsinvolved in the project
= names, titles, signatures, anddocument signature dates of allappropriate approving officialssuch as project manager, projectQA officer, and, if the project isfunded by EPA, the EPA projectmanager and QA officer.

PROJECT MANAGERLucy Nugent
Volunteer CreekWatershed Association
FIELD LEADERSam Gracey
Volunter CreekWatershed Association
LABORATORY LEADERTessa Berry
Professor of Biologyat State University
DATA PROCESSINGLEADER
Zoe RubenVolunteer Creek
Watershed Association
QA OFFICERRufus Tabs
County Departmentof Public Works
QA OFFICERTessa Berry
Professor of Biologyat State University
24 The Volunteer Monitor’s Guide to Quality Assurance Project Plans
ELEMENT 4 Project/Task Organization
In addition to the project officers shown, theVolunteer Creek Monitoring Project also has anAdvisory Panel consisting of representativesfrom EPA, the state Department ofEnvironmental Conservation (DEC), and theCounty Department of Public Works (DPW). Each of the leaders shown serves on theAdvisory Panel. Major responsibilities of allpersonnel are detailed in the Volunteer CreekSOPs, attached to this document. The primarydata users are the state DEC and the CountyDPW.
TABLE OF CONTENTS2 A Table of Contents should include section headings with appropriatepage numbers and a list of figures and tables.
DISTRIBUTION LIST3 List the individuals and organizations that will receive a copy of yourapproved QAPP and any subsequent revisions. Include representatives
of all groups involved in your monitoring effort.
PROJECT/4 TASK
ORGANIZATIONIdentify all key personneland organizations that areinvolved in your program,including data users. Listtheir specific roles andresponsibilities. In manymonitoring projects, oneindividual may haveseveral responsibilities. An organizational chart isa good way to graphicallydisplay the roles of keyplayers.

Chapter 4: Elements of a QAPP 25
ELEMENT 5 Problem Definition/Background
Volunteer Creek flows through an urbanizing watershed. As more communities are built, the quantity ofstormwater runoff will increase. Working together, local residents and government agencies have developedplans to implement best management practices, or BMPs, designed to minimize the potential negative waterquality impacts to Volunteer Creek.
The organizers of the monitoring project, including the Volunteer Creek Watershed Association, the CountyDepartment of Public Works and the State Department of Natural Resources, want to document conditions ofthe stream before and after development to evaluate the effects of stormwater management BMPs.
The data collected will be used by the county and state to evaluate how well these BMPs are working and tohelp identify specific problems that require further attention or study. The watershed association will also usethe data to educate residents on the connections between land-use and water quality.
PROBLEM DEFINITION / BACKGROUND5 In a narrative, briefly state the problem your monitoring project isdesigned to address. Include any background information such as
previous studies that indicate why this project is needed. Identify how your datawill be used and who will use it.
PROJECT/TASK DESCRIPTION6 In general terms, describe the work your volunteers will perform andwhere it will take place. Identify what kinds of samples will be taken,
what kinds of conditions they will measure, which are critical, and which are ofsecondary importance. Indicate how you will evaluate your results--that is, howyou will be making sense out of what you find. For example, you may becomparing your water quality readings to State or EPA standards, or comparingyour macroinvertebrate evaluations to State-established reference conditions orhistorical information.
MAJOR TASK CATEGORIES J F M A M J J A S O N Dvolunteer recruitment, training, and re-training X X X X X X
monthly pH, temp., turbidity, & dissolved oxygen sampling X X X X X X X X X X X X
seasonal macroinvertebrate & habitat assessments X X X
lab analysis X X X
data processing, analysis & reporting X X X X X X
26 The Volunteer Monitor’s Guide to Quality Assurance Project Plans
ELEMENT 6 Project/Task Description
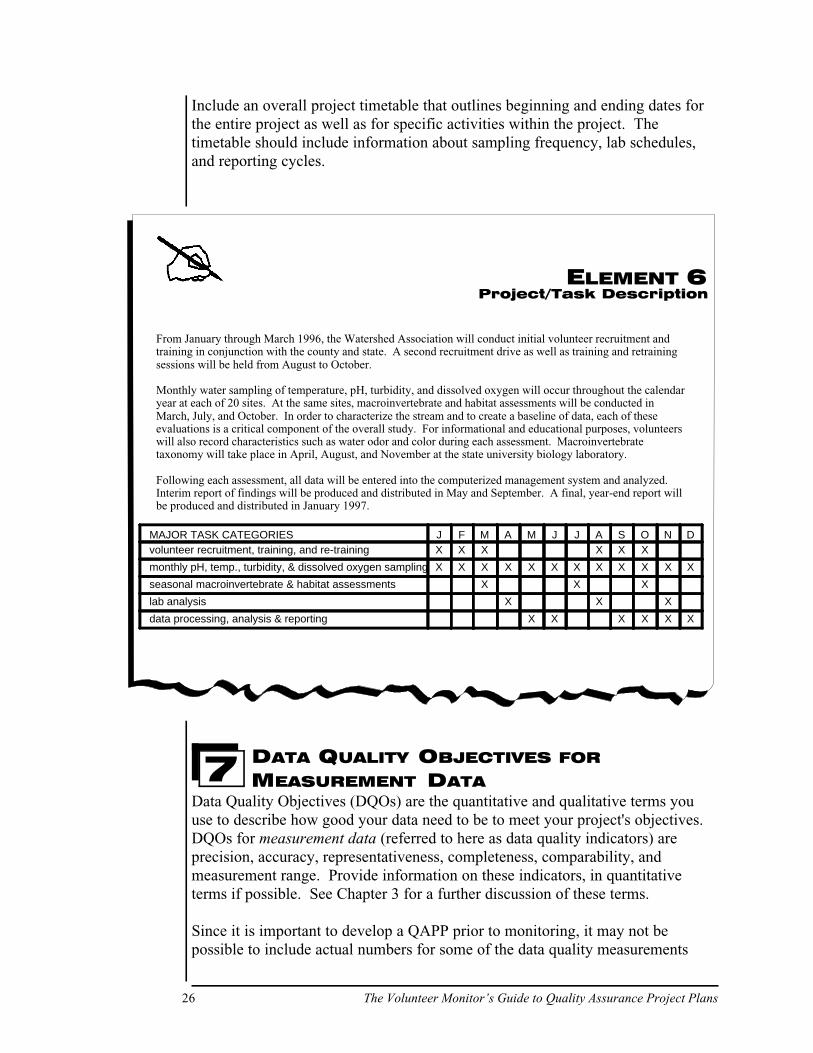
From January through March 1996, the Watershed Association will conduct initial volunteer recruitment andtraining in conjunction with the county and state. A second recruitment drive as well as training and retrainingsessions will be held from August to October.
Monthly water sampling of temperature, pH, turbidity, and dissolved oxygen will occur throughout the calendaryear at each of 20 sites. At the same sites, macroinvertebrate and habitat assessments will be conducted inMarch, July, and October. In order to characterize the stream and to create a baseline of data, each of theseevaluations is a critical component of the overall study. For informational and educational purposes, volunteerswill also record characteristics such as water odor and color during each assessment. Macroinvertebratetaxonomy will take place in April, August, and November at the state university biology laboratory.
Following each assessment, all data will be entered into the computerized management system and analyzed. Interim report of findings will be produced and distributed in May and September. A final, year-end report willbe produced and distributed in January 1997.
Include an overall project timetable that outlines beginning and ending dates forthe entire project as well as for specific activities within the project. Thetimetable should include information about sampling frequency, lab schedules,and reporting cycles.
DATA QUALITY OBJECTIVES FOR7 MEASUREMENT DATAData Quality Objectives (DQOs) are the quantitative and qualitative terms youuse to describe how good your data need to be to meet your project's objectives. DQOs for measurement data (referred to here as data quality indicators) areprecision, accuracy, representativeness, completeness, comparability, andmeasurement range. Provide information on these indicators, in quantitativeterms if possible. See Chapter 3 for a further discussion of these terms.
Since it is important to develop a QAPP prior to monitoring, it may not bepossible to include actual numbers for some of the data quality measurements

Matrix Parameter Precision Accuracy MR*water pH ±20% ±0.5 3 to 10.5 unitswater temperature ±20%
water dissolved oxygen ±20% ±0.3mg/L 1 to 20 mg/lwater turbidity ±20% ±0.2mg/L 0 to 1000 NTU
Chapter 4: Elements of a QAPP 27
ELEMENT 7 Data Quality Objectives for
Measurement Data
Precision, Accuracy, Measurement RangeThe following table illustrates the precision, accuracy andmeasurement range for the Volunteer Creek pH, temperature,turbidity, and dissolved oxygen assessments.
* MR = measurement range
RepresentativenessIn the Volunteer Creek project's assessment, representativenessdepends largely on randomized sampling. The creek is a high-gradient stream with a predominance of riffle habitats. Monitoringsites selected for this study are indicative of that habitat type and theprogram uses sampling techniques developed for high-gradientstreams. In addition, for the macroinvertebrate collection, volunteerssample at three locations within the riffle and then composite(combine) the samples so as to be more generally reflective of theentire riffle habitat.
ComparabilityOne of the ways that the Volunteer Creek program ensurescomparability is to follow the monitoring protocol established by theState for assessment and analysis. Volunteers also use standardizedtaxonomic keys to identify macroinvertebrates to the family level.
CompletenessThere are no legal or compliance uses anticipated for the VolunteerCreek data. In addition, there is no fraction of the planned data thatmust be collected in order to fulfill a statistical criteria. It is expectedthat samples will be collected from at least 90% of the sites unlessunanticipated weather conditions prevent sampling.
within the first version of thedocument. You will need,however, to discuss your goalsor objectives for data qualityand the methods you will useto make actual determinationsafter monitoring has begun. You must also discuss at whatpoint changes will be made ifproject specifications are notachieved. Data qualityindicators should be given foreach parameter you aremeasuring, in each "matrix"(i.e., substance you aresampling from, such as wateror sediment). The easiest wayto present quantitativeinformation is in a table.
In some types of monitoring, particularly macroinvertebratemonitoring and habitatassessment, some data qualityindicators cannot bequantitatively expressed. Inthat case, you can fulfill thisrequirement of the QAPP byciting and describing themethod used and by providingas many of the data qualityindicators as possible (e.g.,completeness, representativeness, andcomparability) in narrativeform.
Precision is the degree ofagreement among repeatedmeasurements of the samecharacteristic, or parameter, and gives information about the consistency of yourmethods.
Accuracy is a measure of confidence that describes how close a measurement isto its “true” value.

28 The Volunteer Monitor’s Guide to Quality Assurance Project Plans
ELEMENT 8 Training Requirements/
Certification
Volunteer Creek monitors participate in a two-day fieldtraining course conducted by state and local water qualitypersonnel. On the first day, volunteers are instructedhow to calibrate equipment and perform physical andchemical tests and analyses. The second day is devoted tomacroinvertebrate and habitat sampling. Volunteers forthe taxonomy lab receive a separate day of training. Allparticipants are required to attend an annual refreshercourse as well.
Performance is evaluated in the field and the lab. Duringinitial and renewal training sessions, volunteers performa simultaneous dip-in determination of pH, temperature, and dissolved oxygen. Volunteers also determineturbidity levels of water samples using meters at the lab. In addition, during training, participants conductmacroinvertebrate sampling in small groups withtrainers. To evaluate volunteer skill in the taxonomy lab,volunteers are trained and re-trained using previouslyidentified samples from earlier assessments.
Volunteer CreekMonitoring Project
__________Training Session
9:00 amTODAY
Measurement Range is the range ofreliable readings of an instrument ormeasuring device, as specified by themanufacturer.
Representativeness is the extent to whichmeasurements actually represent the trueenvironmental condition.
Comparability is the degree to which datacan be compared directly to similarstudies. Using standardized sampling,analytical methods, and units of reportinghelps to ensure comparability.
Completeness is the comparison betweenthe amount of data you planned to collectversus how much usable data youcollected, expressed as a percentage.
TRAINING REQUIREMENTS / CERTIFICATION8 Identify any specialized training or certification requirements yourvolunteers will need to successfullycomplete their tasks. Discuss howyou will provide such training, whowill be conducting the training, andhow you will evaluate volunteerperformance.

Site #: Site Location:
Date: / / Time: AM PM
Team Captain: Phone #:
Address:
Other Monitoring Team Members:
VOLUNTEER CREEK MONITORING PROJECT
Chapter 4: Elements of a QAPP 29
ELEMENT 9 Documentation and Records
Each Volunteer Creek field sampling sheet must be completed on-site at the time sampling occurs. Volunteersrecord site number, location, the date and time the sample was collected, and the name of each team member. Contact information for the team captain or monitor responsible for returning field sheets andmacroinvertebrate samples to the watershed association office is also included on each field sheet.
Volunteers make a copy of each field sheet and keep the copy with their records. The original is returned to theVolunteer Creek Watershed Association office along with the macroinvertebrate sample (if taken). Field sheetsare archived for three years. After macroinvertebrate samples have been identified, laboratory record sheets aremaintained in the watershed association office for three years. Hard copies of all data as well as computerback-up disks aremaintained by theAssociation. Amacroinvertebratevoucher collection ismaintained by thestate universitybiology lab for fiveyears.
DOCUMENTATION AND RECORDS9 Identify the field and laboratory information and records you need forthis project. These records may include raw data, QC checks, field data
sheets, laboratory forms, and voucher collections. Include information on howlong, and where, records will be maintained. Copies of all forms to be used in theproject should be attached to the QAPP.

Happy Lakes Community
Townhouses
Happy Lake
Site #2
Site #1
Volunteer Creek Blvd. Site #3
Volunteer Park
Picnic Area
Site #4
Urban C
reek
Volunteer C
reek
30 The Volunteer Monitor’s Guide to Quality Assurance Project Plans
ELEMENT 10 Sampling Process Design
Volunteer Creek monitoring sites are sampled monthly for pH, temperature, turbidity, and dissolved oxygen. InMarch, July and October, a macroinvertebrate and habitat assessment is conducted at each site. Monitoring sites areidentified by a number and a location.
If possible, volunteers are asked to wait at least 10 days after a heavy rain or snowfall before sampling. If this is notpossible, they are instructed to contact the Field Leader so that this information can be noted immediately. Inaddition, if volunteers cannot conduct the scheduled sampling, they are instructed to contact the Field Leader assoon as possible, so that an alternative monitor can be found. Volunteers are instructed to work in teams of at leasttwo people. Three team members are recommended for the macroinvertebrate sampling. If a scheduled teamcannot conduct the sampling together, the team captainis instructed to contact the Field Leader so thatarrangements can be made for a substitute.
Prior to final site selection, permission to accessthe stream is obtained from all property owners. If for some reason access to the site is a problem,the team captain is instructed to contact the FieldLeader. All constraints and safety plans aredetailed in the Volunteer Creek SOPs.
Four, or 20%, of the sampling sites surroundVolunteer Creek Boulevard, which is beingwidened to accommodate growing residential andcommercial development. They are located asfollows:
Site #1 adjacent to the new townhomedevelopment in the Happy LakesCommunity
Site #2 downstream of the confluence with UrbanCreek
Site #3 at the crossing of Volunteer CreekBoulevard
Site #4 within Volunteer Park, adjacent to thepicnic area
SAMPLING PROCESS DESIGN10 Outline the experimental design of the project includinginformation on types of samples required, sampling frequency,
sampling period (e.g., season), and how you will select sample sites and identifythem over time. Indicate whether any constraints such as weather, seasonalvariations, stream flow or site access might affect scheduled activities, and howyou will handle those constraints. Include site safety plans. You may cite thesections of your program's SOPs which detail the sampling design of the project,in place of extensive discussion.

Matrix Parameter Sampling Equipment
Sample Holding Container
Method Sample Preservative
Maximum Holding Time
water pH Jones pH color comparator kits
screw top, glass sample bottle
none immediately
water temperature Smith armored thermometer
none, measurement taken instream
none immediately
water dissolved oxygen Jones DO kit screw top, glass sample bottle
none immediately
water turbidity Jones turbidity meter screw top glass sample bottle
store on ice 48 hours
substrate macroinvertebrates 3' X 3' kicknet; 500 micron mesh
1 liter plastic wide-mouth bottle
90% ethyl alcohol
6 weeks
Chapter 4: Elements of a QAPP 31
ELEMENT 11 Sampling Methods Requirements
The Volunteer Creek SOP, attached to this document, contains detailed information on all sampling protocolsand equipment. The table below summarizes a portion of this information.
SAMPLING METHODS REQUIREMENTS11 Describe your sampling methods. Include information onparameters to be sampled, how samples will be taken, equipment
and containers used, sample preservation methodsused, and holding times (time between takingsamples and analyzing them). If samples arecomposited (i.e., mixed), describe how this will
be done. Describeprocedures fordecontaminationand equipment-cleaning. (Forexample, kick netsneed to bethoroughly rinsedand examined for clinging organisms betweensampling events.) Most of this information can bepresented in a table or you may also cite any SOPsthat contain this information.

VOLUNTEER CREEK PROJECTMACROINVERTEBRATE SAMPLE LABEL
FIELD INFORMATION:
Site #: Location:
Sample Number of
Preservation Method: Gear:
Date: / / Time: AM PM
Team Captain:
Phone #:
LAB INFORMATION:
Date: / / Time: AM PM
Analyst:
Phone #:
32 The Volunteer Monitor’s Guide to Quality Assurance Project Plans
ELEMENT 12 Sample Handling and Custody Requirements
All macroinvertebrate samples collected as part of theVolunteer Creek project are labeled in the field. Thechain-of-custody for these samples is as follows: Inthe field, samples are the responsibility of, and staywith, the team captain. Once samples have beencollected they are returned, by the monitoring teamcaptain, to the Volunteer Creek WatershedAssociation office for temporary storage. The dateand time of arrival is recorded by the Field Leaderwho is then responsible for transporting samples tothe university laboratory for analysis. The date andtime of arrival is also recorded at the lab by theLaboratory Leader. After samples are analyzed,laboratory information is added to the label. Samplesare then stored and maintained in the university'sbiological lab for a minimum of three years. A chain-of-custody form is used to record all transport andstorage information
SAMPLE HANDLING AND CUSTODY12 REQUIREMENTSSample handling procedures apply to projects that bring samples from the field tothe lab for analysis, identification, or storage.
These samples should be properlylabeled in the field. At aminimum, the sample identificationlabel should include samplelocation, sample number, date andtime of collection, sample type,sampler's name, and method usedto preserve sample.
Describe the procedures used tokeep track of samples that will bedelivered or shipped to a laboratory for analysis. Include any chain-of-custodyforms and written procedures field crews and lab personnel should follow whencollecting, transferring, storing, analyzing, and disposing of samples.

Chapter 4: Elements of a QAPP 33
ELEMENT 13 Analytical Methods
Requirements
In the Volunteer Creek project, pH, temperature anddissolved oxygen are measured using protocolsoutlined in the Citizen's Program for the ChesapeakeBay's Citizen Monitoring Manual. Protocols formeasuring turbidity come from the EPA document,Volunteer Stream Monitoring: A Methods Manual. Macroinvertebrate and habitat assessment methods andequipment are based on the protocols established bythe state monitoring program. Each of these protocolsis detailed in the Volunteer Creek SOP, attached to thisdocument.
ELEMENT 14 Quality Control Requirements
Replicate samples for all measurement parameters aretaken at three (randomly selected) sites of the 20Volunteer Creek monitoring sites during eachsampling period (i.e. monthly for pH, temperature,turbidity, and dissolved oxygen and seasonally formacroinvertebrates). Additional QC samples include split samples and field blanks, each taken at 10% of thesites.
In addition, at least three of the macroinvertebratesamples will be reidentified by the laboratory leaderduring each lab session. Both a macroinvertebratevoucher and reference collection will be maintained. Ifsampler problems are found, the data is either thrown-out or qualified, depending on the degree of theproblem, and arrangements made for monitorretraining. All volunteers are retrained at least once ayear in both field and lab procedures by professionalpersonnel.
ANALYTICAL METHODS REQUIREMENTS13 List the analytical methods and equipment needed for the analysisof each parameter, either in the field or the lab. If your program
uses standard methods, citethese. If your program'smethods differ from thestandard or are not readilyavailable in a standardreference, describe theanalytical methods or citeand attach the program'sSOPs.
QUALITY CONTROL REQUIREMENTS14 List the number andtypes of field and
laboratory quality control samplesyour volunteers will take. (SeeChapter 3 for a discussion of qualitycontrol samples.) This informationcan be presented in a table. If you usean outside laboratory, cite or attachthe lab's QA/QC plan.
QC checks for biological monitoringprograms can be describednarratively, and, if appropriate, shouldinclude discussion of replicate samplecollection, cross checks by differentfield crews, periodic sorting checks oflab samples, and maintenance ofvoucher and reference collections. Describe what actions you will take ifthe QC samples reveal a sampling oranalytical problem.
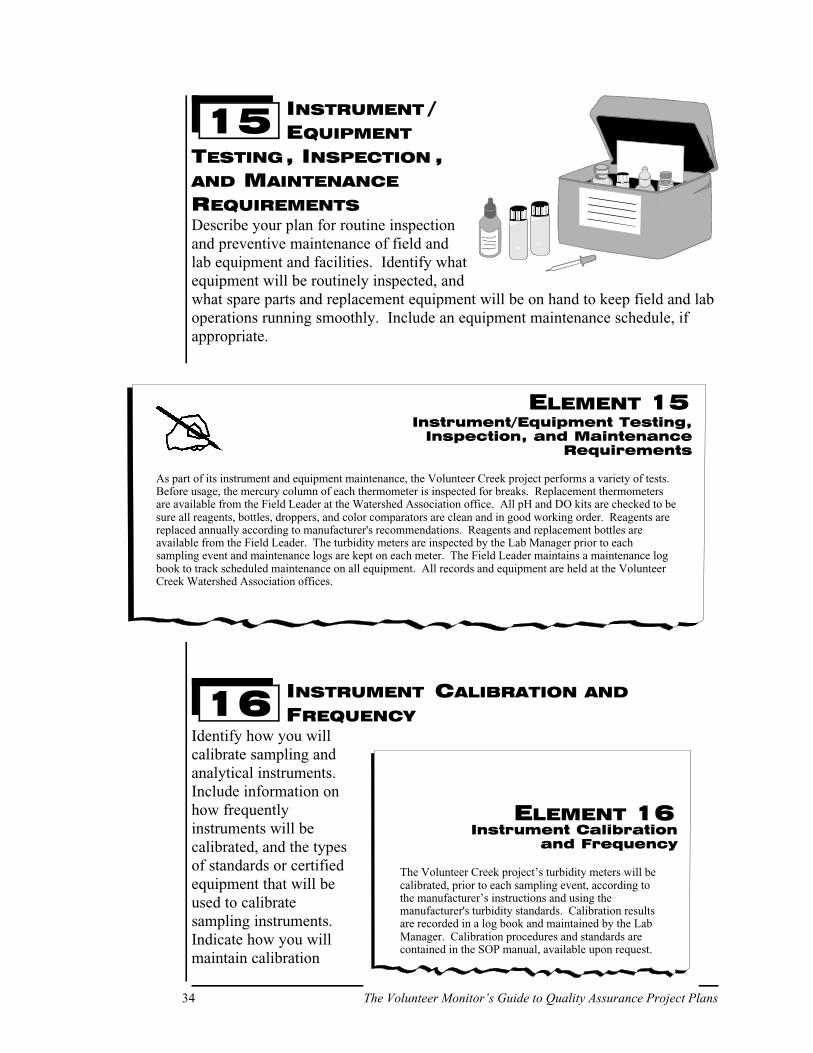
34 The Volunteer Monitor’s Guide to Quality Assurance Project Plans
ELEMENT 15 Instrument/Equipment Testing,
Inspection, and Maintenance Requirements
As part of its instrument and equipment maintenance, the Volunteer Creek project performs a variety of tests. Before usage, the mercury column of each thermometer is inspected for breaks. Replacement thermometersare available from the Field Leader at the Watershed Association office. All pH and DO kits are checked to besure all reagents, bottles, droppers, and color comparators are clean and in good working order. Reagents arereplaced annually according to manufacturer's recommendations. Reagents and replacement bottles areavailable from the Field Leader. The turbidity meters are inspected by the Lab Manager prior to eachsampling event and maintenance logs are kept on each meter. The Field Leader maintains a maintenance logbook to track scheduled maintenance on all equipment. All records and equipment are held at the VolunteerCreek Watershed Association offices.
ELEMENT 16 Instrument Calibration
and Frequency
The Volunteer Creek project’s turbidity meters will becalibrated, prior to each sampling event, according tothe manufacturer’s instructions and using themanufacturer's turbidity standards. Calibration resultsare recorded in a log book and maintained by the LabManager. Calibration procedures and standards arecontained in the SOP manual, available upon request.
INSTRUMENT /15 EQUIPMENT
TESTING, INSPECTION ,AND MAINTENANCE
REQUIREMENTSDescribe your plan for routine inspectionand preventive maintenance of field andlab equipment and facilities. Identify whatequipment will be routinely inspected, andwhat spare parts and replacement equipment will be on hand to keep field and laboperations running smoothly. Include an equipment maintenance schedule, ifappropriate.
INSTRUMENT CALIBRATION AND16 FREQUENCYIdentify how you willcalibrate sampling andanalytical instruments. Include information onhow frequentlyinstruments will becalibrated, and the typesof standards or certifiedequipment that will beused to calibratesampling instruments. Indicate how you willmaintain calibration

Chapter 4: Elements of a QAPP 35
ELEMENT 17 Inspection and Acceptance Requirements for Supplies
The Volunteer Creek project uses kick-nets formacroinvertebrate assessments. The nets are 3' X 3'attached to cylindrical wooden poles. The mesh usedis 500 micron and is consistent with that used by thestate monitoring program. Netting, cut intoappropriate size squares, is purchased from a scientificsupply house. Poles and hardware are purchased froma local supplier. All supplies and equipment arepurchased under the supervision of the Field Leader.
Nets are assembled by shop students at VolunteerCreek High School. After assembly, all nets areinspected by the Field Leader. Any net that does notmeet standards is taken apart and reassembled, ifpossible. Nets that cannot be reassembled are used foreducational demonstrations. Kits and extra reagentsare ordered from Smith and Jones Chemical SupplyCompany and inspected upon arrival by the FieldLeader. Broken bottles and incomplete kits areshipped back to the manufacturer for replacement.
ELEMENT 18 Data Acquisition Requirements
For the Volunteer Creek macroinvertebrate assessmentanalysis, pollution tolerance values assigned toorganisms and metric calculation formulas are takenfrom the literature and documentation provided by thestate water quality agency. U.S.G.S. 7.5 minutetopographic maps are used to identify site locations,land-use activities, and landscape features during aninitial watershed survey.
records and ensure that records can be traced to each instrument. Instrumentcalibration procedures for biological monitoring programs should include routineprocedures that ensure that equipment is clean and in working order.
INSPECTION17 AND
ACCEPTANCE
REQUIREMENTS FOR
SUPPLIESDescribe how you determine ifsupplies such as sample bottles, nets,and reagants are adequate for yourprogram's needs.
DATA ACQUISITION REQUIREMENTS18 Identify any types ofdata your project uses
that are not obtained through yourmonitoring activities. Examples ofthese types of data include historicalinformation, information fromtopographical maps or aerial photos,or reports from other monitoringgroups. Discuss any limits on the useof this data resulting from uncertaintyabout its quality.

36 The Volunteer Monitor’s Guide to Quality Assurance Project Plans
ELEMENT 19 Data Management
Field data sheets are inspected and signed by the sampling team captain before leaving the site. Field sheets aregiven to the field leader at the end of the sampling day for review. Within 72 hours, the field leader will contact anysamplers whose field sheets contain significant errors or omissions.
The lab manager will review sample labels for turbidity and macroinvertebrate samples and remove from the datasetany that cannot be attributed to specific samplers, have not been properly preserved, or that exceed the maximumholding time. The laboratory manager will also sign-off on lab bench sheets after all QC checks have beencompleted. These bench sheets will be transported to the Watershed Association offices so that the data can beentered.
All data will be entered into a “Volbase” computerized spreadsheet/data base program designed for this project andcompatible with hardware and software used by both the state and county water resource agencies. As a QC check,finalized data will be reviewed by a second individual.
DATA19 MANAGEMENTTrace the path your data take, from fieldcollection and lab analysis to data storageand use. Discuss how you check foraccuracy and completeness of field andlab forms, and how you minimize andcorrect errors in calculations, data entry toforms and databases, and report writing. Provide examples of forms and checklists. Identify the computer hardware andsoftware you use to manage your data.
ASSESSMENTS AND20 RESPONSE ACTIONSDiscuss how you evaluate field, lab, and data managementactivities, organizations (such as contract labs) and individuals inthe course of your project. These can include evaluations ofvolunteer performance (for example, through field visits by staff orin laboratory refresher sessions); audits of systems such asequipment and analytical procedures; and audits of data quality(e.g., comparing actual data results with project quality objectives).
Include information on how your project will correct any problemsidentified through these assessments. Corrective actions mightinclude calibrating equipment more frequently, increasing the
Chapter 4 : Elements of a QAPP 37
ELEMENT 20 Assessment and Response Actions
Review of Volunteer Creek field activities is the responsibility of the Field Leader, in conjunction with theProject Manager and the Quality Assurance Officer. Each field team will be accompanied and theirperformance evaluated by one of these individuals once a year. If possible, volunteers in need of performanceimprovement will be retrained on-site during the evaluation. In addition, volunteers attend yearly trainingrenewal workshops. If errors in sampling techniques are consistently identified, retraining may be scheduledmore frequently.
All field and laboratory activities may be reviewed by state and EPA quality assurance officers as requested. Systems and data quality audits are performed by the QA Officer twice yearly. Any identified proceduralproblems will be corrected based on recommendations from the QA Officer.
ELEMENT 21 Reports
Volunteer Creek Interim reports will be produced anddistributed in May (data collected from January-April)and September (data collected from May-August). Ayear-end report will be produced and distributed inJanuary of the following year (data collected fromSeptember-December, as well as full-year results). TheProject Manager is responsible for all report productionand distribution. Reports will be forwarded to thecounty, state, regional EPA office, and other membersof the Advisory Panel. These reports will consist ofdata results, interpretation of data (if possible),information on project status, volunteer highlights,results of QC audits and internal assessments. Summaries of all reports, highlighting the assessmentresults, project status, and volunteer achievements, willbe distributed to all volunteers and WatershedAssociation members.
number of regularly scheduled training sessions, or rescheduling field or labactivities.
REPORTS21 Identify the frequency, content, and distribution of reports to datausers, sponsors, and
partnership organizations that detailproject status, results of internalassessments and audits, and how QAproblems have been resolved.

38 The Volunteer Monitor’s Guide to Quality Assurance Project Plans
ELEMENT 22 Data Review, Validation, and Verification Requirements
All Volunteer Creek field and laboratory data is reviewed by the Project Manager, QA Officer, and Data ProcessingLeader to determine if the data meet QAPP objectives. In addition, personnel from the State Department of NaturalResources who are not directly connected to this project will also review data on a quarterly basis. Decisions toreject or qualify data are made by the Project Manager and the QA Officer.
ELEMENT 23 Validation and Verification
Methods
As part of the Volunteer Creek protocol, any samplereadings out of the expected range are reported to theField Leader. A second sample is taken by the FieldLeader as soon as possible to verify the condition. 10-20% of the macroinvertebrate samples are reidentifiedas a method of verifying data. and ensuring dataquality. If an error of greater than 5% is found, allsamples from that sampling period will be reidentifiedand the taxonomist(s) retrained.
Once the data has been entered into the VolunteerCreek database, the Data Processing Leader will printout the data and proofread it against the original datasheets. Errors in data entry will be corrected. Outliersand inconsistencies will be flagged for further review,or discarded. Problems with data quality will bediscussed in the interim and final reports to data users.
DATA REVIEW, VALIDATION AND22 VERIFICATION REQUIREMENTSState how you review data and make decisions regarding accepting, rejecting, orqualifying the data. All that is needed here is a brief statement of what will bedone, by whom.
VALIDATION AND VERIFICATION23 METHODSDescribe the procedures you use to validate and verify data. This can include, forexample, comparing computer entries to field data sheets; looking for data gaps;analyzing quality control data such as chain of custody information, spikes, andequipment calibrations; checking calculations; examining raw data for outliers ornonsensical readings; andreviewing graphs, tablesand charts. Include adescription of how errors,if detected, will becorrected, and howresults will be conveyedto data users.

Chapter 4 : Elements of a QAPP 39
ELEMENT 24 Reconciliation with Data Quality Objectives
As soon as possible after each sampling event, calculations and determinations for precision, completeness, andaccuracy will be made and corrective action implemented if needed. If data quality indicators do not meet theproject’s specifications, data may be discarded and resampling may occur. The cause of failure will beevaluated. If the cause is found to be equipment failure, calibration/ maintenance techniques will be reassessedand improved. If the problem is found to be sampling team error, team members will be retrained. Anylimitations on data use will be detailed in both interim and final reports, and other documentation as needed.
If failure to meet project specifications is found to be unrelated to equipment, methods, or sample error,specifications may be revised for the next sampling season. Revisions will be submitted to the state and EPAquality assurance officers for approval.
RECONCILIATION WITH DATA QUALITY24 OBJECTIVESOnce the data results are compiled, describe the process for determining whetherthe data meet project objectives. This should include calculating and comparingthe project’s actual data quality indicators (precision, accuracy, completeness,representativeness, and comparability) to those you specified at the start of theproject, and describing what will be done if they are not the same. Actions mightinclude discarding data, setting limits on the use of the data, or revising theproject's data quality objectives.

40 The Volunteer Monitor’s Guide to Quality Assurance Project Plans

Appendix A: Glossary 41
Appendix A:
GLOSSARY
Data Quality Objectives
(DQOs) specify the quality
of the data needed in
order to meet the
monitoring project's
goals.
Accuracy. A data quality indicator, accuracy is the extent of agreement betweenan observed value (sampling result) and the accepted, or true, value of theparameter being measured. High accuracy can be defined as a combinationof high precision and low bias.
Analyte. Within a medium, such as water, an analyte is a property or substance tobe measured. Examples of analytes would include pH, dissolved oxygen,bacteria, and heavy metals.
Bias. Often used as a data quality indicator, bias is the degree of systematic errorpresent in the assessment or analysis process. When bias is present, thesampling result value will differ from the accepted, ortrue, value of the parameter being assessed.
Blind sample. A type of sample used for quality controlpurposes, a blind sample is a sample submitted to ananalyst without their knowledge of its identity or composition. Blind samples are used to test theanalyst’s or laboratory’s expertise in performing thesample analysis.
Comparability. A data quality indicator, comparability is thedegree to which different methods, data sets, and/ordecisions agree or are similar.
Completeness. A data quality indicator that is generally expressed as apercentage, completeness is the amount of valid data obtained compared tothe amount of data planned.
Data users. The group(s) that will be applying the data results for some purpose. Data users can include the monitors themselves as well as governmentagencies, schools, universities, businesses, watershed organizations, andcommunity groups.
Data quality objectives (DQOs). Data quality objectives are quantitative andqualitative statements describing the degree of the data’s acceptability orutility to the data user(s). They include indicators such as accuracy,precision, representativeness, comparability, and completeness. DQOsspecify the quality of the data needed in order to meet the monitoring

42 The Volunteer Monitor’s Guide to Quality Assurance Project Plans
project's goals. The planning process for ensuring environmental data are ofthe type, quality, and quantity needed for decision making is called the DQOprocess.
Detection limit. Applied to both methods and equipment, detection limits are thelowest concentration of a target analyte that a given method or piece ofequipment can reliably ascertain and report as greater than zero.
Duplicate sample. Used for quality control purposes, duplicate samples are twosamples taken at the same time from, and representative of, the same sitethat are carried through all assessment and analytical procedures in anidentical manner. Duplicate samples are used to measure natural variabilityas well as the precision of a method, monitor, and/or analyst. More than twoduplicate samples are referred to as replicate samples.
Environmental sample. An environmental sample is a specimen of any materialcollected from an environmental source, such as water or macroinvertebratescollected from a stream, lake, or estuary.
Equipment or rinsate blank. Used for quality control purposes, equipment orrinsate blanks are types of field blanks used to check specifically forcarryover contamination from reuse of the same sampling equipment (seefield blank).
Field blank. Used for quality control purposes, a field blank is a “clean” sample(e.g., distilled water) that is otherwise treated the same as other samplestaken from the field. Field blanks are submitted to the analyst along withall other samples and are used to detect any contaminants that may beintroduced during sample collection, storage, analysis, and transport.
Instrument detection limit. The instrument detection limit is the lowestconcentration of a given substance or analyte that can be reliably detected byanalytical equipment or instruments (see detection limit).
Matrix. A matrix is a specific type of medium, such as surface water or sediment,in which the analyte of interest may be contained.
Measurement Range. The measurement range is the extent of reliable readingsof an instrument or measuring device, as specified by the manufacturer.
Method detection limit (MDL). The MDL is the lowest concentration of a givensubstance or analyte that can be reliably detected by an analytical procedure(see detection limit).

Appendix A: Glossary 43
Quality Assurance (QA) is
an integrated
management system
designed to ensure that a
product or service meets
defined standards of
quality with a stated level
of confidence.
Performance evaluation (PE) samples. Used for qualitycontrol purposes, a PE sample is a type of blindsample. The composition of PE samples is unknown tothe analyst. PE samples are provided to evaluate theability of the analyst or laboratory to produce analyticalresults within specified limits.
Precision. A data quality indicator, precision measures thelevel of agreement or variability among a set ofrepeated measurements, obtained under similarconditions. Precision is usually expressed as astandard deviation in absolute or relative terms.
Protocols. Protocols are detailed, written, standardizedprocedures for field and/or laboratory operations.
Quality assurance (QA). QA is an integrated managementsystem designed to ensure that a product or service meets defined standardsof quality with a stated level of confidence. QA activities involve planningquality control, quality assessment, reporting, and quality improvement.
Quality assurance project plan (QAPP). A QAPP is a formal written documentdescribing the detailed quality control procedures that will be used toachieve a specific project’s data quality requirements.
Quality control (QC). QC is the overall system of technical activities designed tomeasure quality and limit error in a product or service. A QC programmanages quality so that data meets the needs of the user as expressed in aquality assurance project plan.
Relative standard deviation (RSD). RSD is the standard deviation of a parameterexpressed as a percentage and is used in the evaluation of precision.
Relative percent difference (RPD). RPD is an alternative to standard deviation,expressed as a percentage and used to determine precision when only twomeasurement values are available.
Replicate samples. See duplicate samples.
Representativeness. A data quality indicator, representativeness is the degree towhich data accurately and precisely portray the actual or true environmentalcondition measured.
Sensitivity. Related to detection limits, sensitivity refers to the capability of amethod or instrument to discriminate between measurement responses

44 The Volunteer Monitor’s Guide to Quality Assurance Project Plans
Standard Reference
Materials (SRMs) are
produced by the U. S.
National Institute of
Standards and
Technology (NIST) and
characterized for absolute
content independent of
any analytical method.
representing different levels of a variable of interest.The more sensitive a method is, the better able it is todetect lower concentrations of a variable.
Spiked samples. Used for quality control purposes, a spikedsample is a sample to which a known concentration ofthe target analyte has been added. When analyzed, thedifference between an environmental sample and theanalyte’s concentration in a spiked sample should beequivalent to the amount added to the spiked sample.
Split sample. Used for quality control purposes, a splitsample is one that has been equally divided into two ormore subsamples. Splits are submitted to differentanalysts or laboratories and are used to measure theprecision of the analytical methods.
Standard reference materials (SRM). An SRM is a certified material orsubstance with an established, known and accepted value for the analyte orproperty of interest. Employed in the determination of bias, SRMs are usedas a gauge to correctly calibrate instruments or assess measurement methods. SRMs are produced by the U. S. National Institute of Standards andTechnology (NIST) and characterized for absolute content independent ofany analytical method.
Standard deviation(s). Used in the determination of precision, standard deviationis the most common calculation used to measure the range of variationamong repeated measurements. The standard deviation of a set ofmeasurements is expressed by the positive square root of the variance of themeasurements.
Standard operating procedures (SOPs). An SOP is a written document detailingthe prescribed and established methods used for performing projectoperations, analyses, or actions.
True value. In the determination of accuracy, observed measurement values areoften compared to true, or standard, values. A true value is one that hasbeen sufficiently well established to be used for the calibration ofinstruments, evaluation of assessment methods or the assignment of valuesto materials.
Variance. A statistical term used in the calculation of standard deviation,variance is the sum of the squares of the difference between the individualvalues of a set and the arithmetic mean of the set, divided by one less thanthe numbers in the set.

Appendix B: EPA Regional Contacts 45
Appendix B:
EPA REGIONAL CONTACTS
Which EPA region are you in?
Region 1: CT, MA, ME, VT, NH, RIRegion 2: NY, NJ, VI, PRRegion 3: DE, DC, MD, PA, VA, WVRegion 4: AL, FL, GA, KY, MS, NC, SC, TN, Region 5: IL, IN, MI, MN, OH, WIRegion 6: AR, LA, NM, OK, TXRegion 7: IA, KS, MO, NERegion 8: CO, MT, ND, SD, UT, WYRegion 9: AZ, CA, NV, GU, HI, ASRegion 10: AK, ID, OR, WA
ach of EPA’s 10 Regional offices has a volunteer monitoring coordinatorEand quality assurance officers who can be of assistance to volunteerprograms. Listed below are the contact names for each region, as of
September 1, 1996. These contacts may change over time.
EPA RegionalVolunteer MonitoringCoordinators
Diane SwitzerUSEPA Region 1 (EMS-LEX)60 Westview StreetLexington, MA 02173617-860-4377
Diane CalessoUSEPA Region IIEnvironmental Services Division2890 Woodbridge AvenueRaritan Depot Bldg. 10Edison, NJ 08837-3679908-906-6999 [email protected]
Pete WeberUSEPA Region III3WP13841 Chestnut Bldg.Philadelphia, PA 19107215-566-5749
Chuck KanetskyUSEPA Region III841 Chestnut Bldg.Philadelphia, PA 19107215-566-2735
David MelgaardUSEPA Region IVWatershed Section345 Courtland StreetAtlanta, GA 30365404-347-2126 (x6590)
Tom DavenportUSEPA Region V77 W. Jackson Blvd. Chicago, IL 60604312-886-7804
Mike BiraUSEPA Region VI (6WQS)1445 Ross Avenue12th Floor, Suite 120Dallas, TX 75202-2733214-665-6668

46 The Volunteer Monitor’s Guide to Quality Assurance Project Plans
Jerry PittUSEPA Region VII726 Minnesota AvenueKansas City, KS913-551-7766
Paul McIverUSEPA Region VIII999 18th Street, Suite 500Denver, CO 80202-2405303-312-6056
Phil JohnsonUSEPA Region VIII999 18th Street, Suite 500Denver, CO 80202-2405303-312-6084
Ed LiuUSEPA Region IX75 Hawthorne StreetSan Francisco, CA 94105415-744-1934
Andrea LindsayUSEPA Region X1200 Sixth AvenueSeattle, WA 98101206-553-1287
Drew PufferGulf of Mexico ProgramBuilding 1103Stennis Space Ctr, MS 39529-620601-688-3913
Alice Mayio, National VolunteerMonitoring Coordinator USEPA (4503F)401 M Street, SWWashington, DC 20460202-260-7018
Regional QualityAssurance Officers
Nancy Barmakian USEPA Region INew England Regional Lab60 Westview StreetLexington, MA 02173-3185617-860-4684
Robert RunyonUSEPA Region II2890 Woodbridge AvenueEdison, NJ 08837908-321-6645
Charles Jones, Jr.USEPA (3ES00) Region III841 Chestnut Street, 8th FloorPhiladelphia, PA 19107215-566-7210
Diann SimsUSEPA (3ES30) Region IIICentral Regional Lab201 Defense Highway, Suite 200Annapolis, MD 21401
Claudia WaltersUSEPA Region IIIChesapeake Bay Program Office410 Severn Avenue, Suite 109Annapolis, MD 21403
Gary BennettUSEPA/Region IV960 College Station RoadAthens, GA 30605-2720706-546-3287
Willie HarrisMQAB/ESD/EPA (5SMQA)Region V77 West JacksonChicago, IL 60604
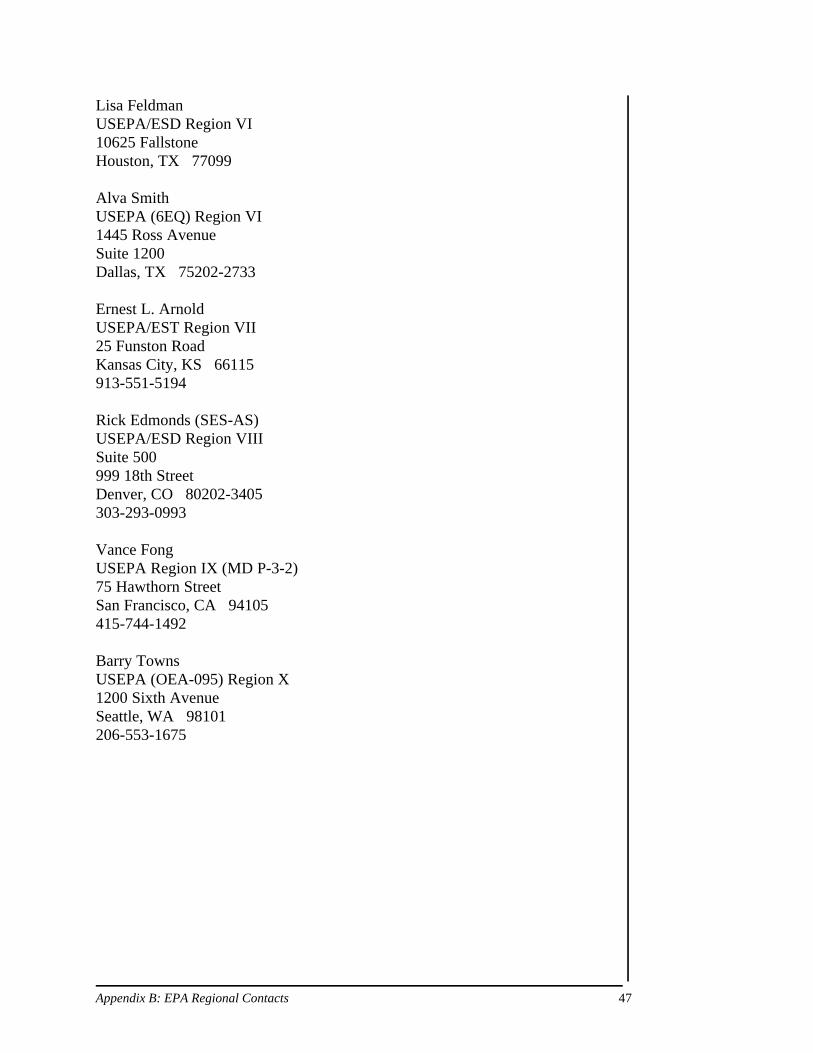
Appendix B: EPA Regional Contacts 47
Lisa FeldmanUSEPA/ESD Region VI10625 FallstoneHouston, TX 77099
Alva SmithUSEPA (6EQ) Region VI1445 Ross AvenueSuite 1200Dallas, TX 75202-2733
Ernest L. ArnoldUSEPA/EST Region VII25 Funston RoadKansas City, KS 66115913-551-5194
Rick Edmonds (SES-AS)USEPA/ESD Region VIIISuite 500999 18th StreetDenver, CO 80202-3405303-293-0993
Vance FongUSEPA Region IX (MD P-3-2)75 Hawthorn StreetSan Francisco, CA 94105415-744-1492
Barry TownsUSEPA (OEA-095) Region X1200 Sixth AvenueSeattle, WA 98101206-553-1675

48 The Volunteer Monitor’s Guide to Quality Assurance Project Plans

Appendix C: References 49
Appendix C:
REFERENCES
The following presentation paper topics, specificallyrelavant to quality assurance and quality control issues,are contained in the proceedings documents from pastnational volunteer monitoring conferences:
Proceedings of Third National Citizens’ VolunteerWater Monitoring Conference.
• Goal Setting and Organizing• Study Design• Training Monitors• Integrated Monitoring Systems• Enforcement and Compliance Monitoring• Procedures for Collecting Quality Data• Meeting Scientific Standards for Biological
Monitoring• Deciding Data Objectives• River and Stream Monitoring Techniques• Lake Monitoring Techniques• Wetland Monitoring Techniques• Estuary Monitoring Techniques• Computer Data Management• Data Application and Presentation
Proceedings Fourth National Citizens’ VolunteerMonitoring Conference.
• Designing Your Water Quality Study• Assuring Quality Data• Defining Data Use• Using Your Data to Evaluate Your Volunteer
Monitoring Program• Geographic Information Systems and Volunteer
Monitoring Data• Managing Your Data: Some Basic Principles• Data Analysis for the Technically Impaired• Macroinvertebrate Monitoring• Bacteria Testing• Monitoring Restoration and Pollution Prevention
Activities
Both of these documents are available upon request fromthe EPA National Volunteer Monitoring Coordinator.
Directory of Volunteer Environmental Monitoring Programs, 4th Edition. EPA841-B-94-001, January 1994. U.S. Environmental Protection Agency,Office of Water, Washington, DC.
EPA Requirements for Quality Assurance Project Plans (QAPP) forEnvironmental Data Operations. EPA/QA/R-5. August 1994. U.S.Environmental Protection Agency,Office of Water, Washington, DC.
Generic Quality Assurance Project PlanGuidance for Programs UsingCommunity Level BiologicalAssessment in Wadable Streams andRivers. EPA 841-B-95-004, July 1995. U.S. Environmental Protection Agency,Office of Water, Washington, DC.
Guidance for Data Quality Assessment. EPA QA/G-9, March 1995. U.S.Environmental Protection Agency,Office of Research and Development,Washington, DC.
Guidance for the Preparation of StandardOperating Procedures (SOPs) forQuality-Related Documents. EPAQA/G-6. November 1995. U.S.Environmental Protection Agency,Quality Assurance Division.
Integrating Quality Assurance into TribalWater Programs: A Resource Guidefor Reliable Water Quality DataCollection. U.S. EnvironmentalProtection Agency Region 8, Denver,Colorado.

50 The Volunteer Monitor’s Guide to Quality Assurance Project Plans
Proceedings of the Fourth National Citizen’s Volunteer Water MonitoringConference. EPA 841/R-94-003, February 1995. U.S. EnvironmentalProtection Agency, Office of Water, Washington, DC.
Proceedings of the Third National Citizen’s Volunteer Water MonitoringConference. EPA 841/R-92-004, September 1992. U.S. EnvironmentalProtection Agency, Office of Water, Washington, DC.
Volunteer Estuary Monitoring: A Methods Manual. EPA 842-B-93-004,December 1993. U.S. Environmental Protection Agency, Office of Water,Washington, DC.
Volunteer Lake Monitoring: A Methods Manual. EPA 440/4-91-002,December 1991. U.S. Environmental Protection Agency, Office of Water,Washington, DC.
The Volunteer Monitor: Building Credibility. Volume 4, number 2, Fall 1992. Eleanor Ely, ed. San Francisco, CA.
The Volunteer Monitor: Managing and Presenting Your Data. Volume 7,number 1, Spring 1995. Eleanor Ely, ed. San Francisco, CA.
Volunteer Stream Monitoring: A Methods Manual (Field Test Draft). EPA 841D 95-001. April 1995. U.S. Environmental Protection Agency, Office ofWater, Washington, DC.
Volunteer Water Monitoring: A Guide for State Managers. EPA 440/4-90-010,August 1990. U.S. Environmental Protection Agency, Office of Water,Washington, DC.

Appendix D: Abbreviated QAPP Form 51
Appendix D:
ABBREVIATED QAPP FORM
hat follows is an example of an optional abbreviated quality assurance project planWform. You may be able to use it as a model for your project’s QAPP. However, besure to consult your state or EPA regional QA officers to determine if use of this form
(or a modified version) is acceptable to them, and for specific information on required elementsfor your project.
1. Title and Approval Page
(Project Name)
(Responsible Agency)
(Date)
Project Manager Signature
Name/Date
Project QA Officer Signature
Name/Date
USEPA Project Manager Signature
Name/Date
USEPA QA Officer Signature
Name/Date
2. Table of Contents
List sections with page numbers, figures, tables, references, and appendices (attach pages).

52 The Volunteer Monitor’s Guide to Quality Assurance Project Plans
3. Distribution List
Names and telephone numbers of those receiving copies of this QAPP. Attach additional page,if necessary.
i.
ii.
iii.
iv.
v.
vi.
vii.
viii.
ix.
x.
4. Project/Task Organization
List key project personnel and their corresponding responsibilities.
Name Project Title/Responsibility
Advisory Panel (contact)
Project Manager
QA Officer
Field/Sampling Leader
Laboratory Manager/Leader
5. Problem Definition/Background
A. Problem Statement

Appendix D: Abbreviated QAPP Form 53
B. Intended Usage of Data
6. Project/Task Description
A. General Overview of Project
B. Project Timetable
Activity Projected Start Date Anticipated Date ofCompletion

54 The Volunteer Monitor’s Guide to Quality Assurance Project Plans
7. Measurement Quality Objectives
A. Data Precision, Accuracy, Measurement Range
Matrix Parameter Measurement Accuracy PrecisionRange
B. Data Representativeness
C. Data Comparability
D. Data Completeness
Parameter No. Valid Samples No. Valid Samples Percent CompleteAnticipated Collected &
Analyzed

Appendix D: Abbreviated QAPP Form 55
8. Training Requirements and Certification
A. Training Logistical Arrangements
Type of Volunteer Training Frequency of Training/Certification
B. Description of Training and Trainer Qualifications
9. Documentation and Records
10. Sampling Process Design
A. Rationale for Selection of Sampling Sites

56 The Volunteer Monitor’s Guide to Quality Assurance Project Plans
B. Sample Design Logistics
Type of Number of Sampling SamplingSample/ Samples Frequency Period
Parameter
Biological
Physical
Chemical
11. Sampling Method Requirements
Parameter Sampling Equipment Sampling Method
12. Sample Handling and Custody Procedures

Appendix D: Abbreviated QAPP Form 57
13. Analytical Methods Requirements
14. Quality Control Requirements
A. Field QC Checks
B. Laboratory QC Checks
C. Data Analysis QC Checks
15. Instrument/Equipment Testing, Inspection, andMaintenance Requirements
Equipment Type Inspection Frequency Type of Inspection
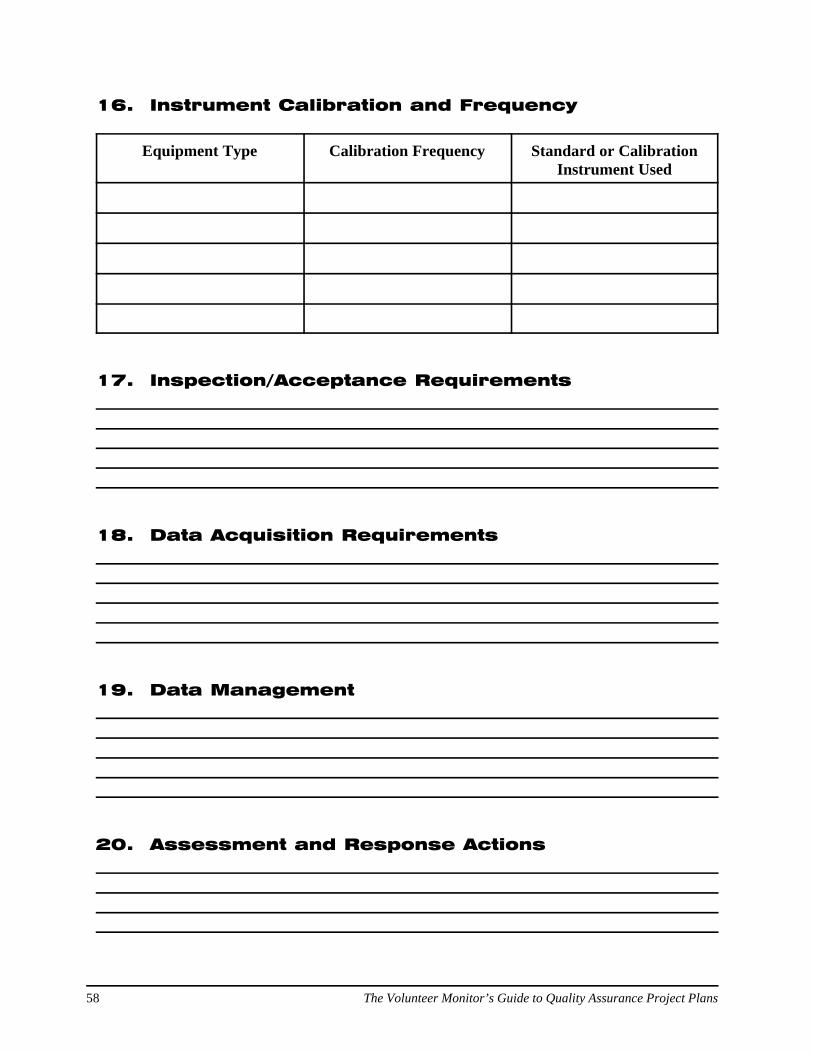
58 The Volunteer Monitor’s Guide to Quality Assurance Project Plans
16. Instrument Calibration and Frequency
Equipment Type Calibration Frequency Standard or CalibrationInstrument Used
17. Inspection/Acceptance Requirements
18. Data Acquisition Requirements
19. Data Management
20. Assessment and Response Actions

Appendix D: Abbreviated QAPP Form 59
21. Reports
22. Data Review, Validation, and Verification
23. Validation and Verification Methods
24. Reconciliation with DQO’s