the voracity and scarcity effects of export booms and ... · the voracity and scarcity effects of...
TRANSCRIPT
The Voracity and Scarcity Effects of Export Booms and Busts on Firm Bribery
Joël Cariolle, Research Officer
Foundation for Researches and Studies on International Development (FERDI),
Clermont-Ferrand, France,

The opinions expressed and arguments employed herein are solely those of the authors and do not
necessarily reflect the official views of the OECD or of its member countries.
This document and any map included herein are without prejudice to the status of or sovereignty over
any territory, to the delimitation of international frontiers and boundaries and to the name of any
territory, city or area.
This paper was submitted as part of a competitive call for papers on integrity, anti-corruption and trade
in the context of the 2016 OECD Integrity Forum.

1
Abstract
The evidence of a “voracity effect” of revenue windfalls fostering rent-seeking and corruption is
widely documented by the literature. However, the reverse hypothesis of a “scarcity effect” of
revenue downfalls, stimulating corruption by creating resource shortages, finds theoretical
foundations but less empirical support. This paper tests the concomitance of a voracity and
scarcity effect, by examining the effect of export booms and busts on firm bribery within a multi-
level estimation framework. Based on 19,712 bribe reports of firms located in 36 developing
countries, estimations support a positive effect of both export booms and busts on bribery, when
financial and democratic institutions are failing. Conversely, a robust negative effect of booms
and busts is evidenced when institutions are better off. Therefore, consistent with the literature,
this paper gives additional evidence on the importance of institutional safeguards against
corrupt practices in times of abundance. But more importantly, it provides new insights into
their importance in times of shortage.
Keywords
corruption, rent-seeking, export instability, booms, busts, financial markets, democracy,
institutions

2
1. INTRODUCTION
The resource curse literature provides theoretical predictions and empirical findings that
support a ‘voracity effect’ of resource booms on growth, prevailing in weak institutional contexts
(Tornell and Lane, 1999; Sachs and Warner, 2001; Mehlum et al., 2006). According to these
studies, windfalls are detrimental to integrity in the public and private sectors because they
stimulate the ‘grabbing hand’ rather than the ‘productive hand’ of economic agents, especially
when institutions cannot keep agents away from entering in rent-seeking activities.
Conversely, the hypothesis of a ‘scarcity effect’, according to which corrupt behaviors could be
stimulated by revenue shortfalls, has not yet been considered by empirical studies. However, the
theoretical literature on queuing models (Lui, 1985) and auction models (Saha, 2001) of bribery
provides interesting insights into how corrupt behaviors help jumping the queue or diverting
rationed public goods. In these models, economic agents compete for scarce resources, thereby
giving strong discretionary powers to those who are charged with their allocation, and inciting
them to extract bribes. Therefore, both positive and adverse shocks may foster corrupt practices,
especially when institutions are ‘grabber-friendly’ rather than ‘producer-friendly’ (Mehlum et
al., 2006).
However, the possibility of concomitant voracity and scarcity effects has not yet been explored
by the literature. To test the coexistence of these two effects, I estimate the separate effects of
aggregate export booms and busts on firm-level bribery, and I emphasize the role institutions in
this relationship. Multi-level cross-section estimations are conducted, by exploiting micro-level
data on 19,712 bribe reports from firms located in 36 developing countries. A significant and
robust positive effect of both export booms and busts on firms’ informal payments is found
when pillars of democracy are weak and when financial markets are imperfect. Conversely, a
significant and robust negative effect of booms and busts on bribery is evidenced when
democratic and financial institutions are better off.
The next section presents the literature review and the analytical framework. The third section
details the data and explains the multi-level estimation framework. The fourth section exposes
empirical results. The fifth section concludes.

3
2. LITERATURE REVIEW AND ANALYTICAL FRAMEWORK
Many studies point out that if countries with weak institutions undergo resource windfalls, rent-
seeking behaviors are likely to spread and growth rates are likely to fall (Tornell and Lane, 1999;
Mehlum et al., 2006; Voors et al., 2011). This rise in opportunistic rent-seeking behaviors in a
context of resource abundance underlies the ‘voracity effect’ of shocks, highlighted by Tornell
and Lane (1999).
By contrast, theoretical papers suggest that rent-seeking and corruption may also spread in
contexts of resource scarcity. They argue that when public goods are rationed, corruption can
act as grease in resource allocation or redistribution mechanisms (Lui, 1985; Bardhan, 1997).
Therefore, one can also expect that falls in public and private revenues foster corruption by
making economic agents competing for scarce resources.
2.1. The symmetric effects of shocks on corruption
The influential work of Tornell and Lane (1999) gives interesting theoretical insights into how
‘voracious’ appetites for wealth accumulation are stimulated by temporary resource windfalls.
Their predictions have found strong empirical support from the resource curse literature (Sachs
and Warner, 1995; Mehlum et al., 2006; Van der Ploeg, 2011; Voors et al. 2011), which provides
various empirical evidence of the positive effect of economic booms on rent-seeking and
corruption. Public and private agents are therefore likely to engage in bribery, extortion or
embezzlement, when opportunities for corrupt transactions flourish. Therefore, such
‘opportunistic’ corrupt behaviors should spread during positive shocks and decline during
negative ones.
The question of how corrupt transactions expand during adverse shocks has been less
addressed by the empirical literature. It can however find interesting answers in queuing
models (Lui, 1985) or auction models (Saha, 2001) of bribery. These models focus on the
demand-side of bribery and emphasize how public servants may personally benefit from public
resource scarcity by extracting bribes from people competing for rationed public resources.
Moreover, it has been shown that public resource shortages can be exacerbated by corrupt
public officials who can artificially slow down the speed of the queue or generate additional red
tape, in order to extract more bribes from individuals (Aidt, 2003). In other words, when
resources get scarce, countries may be stuck in a high-corruption equilibrium (Mehlum et al.
2003), and bribery may become an informal pricing signal of public resource scarcity.
From the supply side of bribery, adverse shocks may put firms under economic or financial
stress, and may incite them to bribe in order to relieve the state burden and to get privileged
access to public resources. Therefore, corruption may be a way for both public and private

4
agents to cushion economic hardships. Such ‘survival’ corrupt behaviors underlie the scarcity
effect of shocks on corruption, characterized by a rise (decline) in survival corruption during
adverse (positive) shocks.
As a result, the effect of positive and negative shocks on corruption may be symmetric. The
following sub-section stresses how institutional safeguards against malpractices can make this
symmetric effect either positive or negative.
2.2. The role of institutions.
In their seminal work, Murphy et al. (1991) show that talents in an economy are split between
productive activities, which are conducive to growth through enhanced productivity and
innovations; and rent-seeking activities, which are harmful to growth by their negative effect on
productivity and institutions (Murphy et al. 1993). Building upon this literature, I state that i)
the voracity and scarcity effects of shocks on corruption depends on the attractiveness of rent-
seeking compared to production, and ii) that this relative attractiveness relies on the
institutional framework.
Mehlum et al. (2006) propose a theoretical model stressing how the direction of the effect of
natural resource windfalls on growth depends on whether institutions are more favorable to
producers (‘producer-friendly institutions’) or to rent-seekers (‘grabber friendly institutions’).
Could a same conditional effect hold during adverse shocks? In fact, good institutions – i.e.
effective rule of law, efficient financial markets, well-functioning democracy, and so on. – make
countries more resilient (Rodrik, 1998, 2000), and therefore help keeping productive activities
appealing during economic hardships.
To sum up, one can expect that opportunistic corruption spreads during positive shocks, and
that survival corruption spreads during negative shocks when institutions are ‘grabber friendly’.
On the contrary, opportunistic and survival corrupt behaviors are likely to decrease during
positive and negative shocks, respectively, when institutions are ‘producer friendly’. Table 1
summarizes this symmetric effect of positive and negative shocks, conditional on institutions.

5
Table 1. Institutions, asymmetric corrupt transactions, and the symmetric effect shocks.
Economic shocks
Institutions Positive shocks Negative shocks
Grabber-friendly institutions + opportunistic corruption + survival corruption
Producer-friendly institutions - survival corruption - opportunistic corruption
3. EMPIRICAL FRAMEWORK
This analytical framework is tested by analyzing the effect of rises and falls in export proceeds
on firms’ informal payments, conditional on the quality of institutions, in a sample of developing
countries. Corruption is therefore expressed as a function of positive shocks, negative shocks,
and a set of controls, including institutional variables:
𝐶𝑜𝑟𝑟𝑢𝑝𝑡𝑖𝑜𝑛 = 𝐸{𝑝𝑜𝑠𝑖𝑡𝑖𝑣𝑒 𝑠ℎ𝑜𝑐𝑘𝑠, 𝑛𝑒𝑔𝑎𝑡𝑖𝑣𝑒 𝑠ℎ𝑜𝑐𝑘𝑠|𝐼𝑛𝑠𝑡𝑖𝑡𝑢𝑡𝑖𝑜𝑛𝑠, 𝐶𝑜𝑛𝑡𝑟𝑜𝑙𝑠} (1)
Multi-level estimations of this corruption equation are conducted using micro data on firms’
bribery as dependent variable, macro-level measures of exports booms and export busts as
interest variables, along with a set of micro-level controls, macro-level controls, and sector-
dummy variables. Data sources and summary statistics are provided in Appendix A.
3.1. WBES data on firms’ experience of bribery and firms’ characteristics
The WBES data provides a comprehensive and comparable-internationally firm-level
assessment of business environment conditions around the world, encompassing a wide range
of information on the supply-side of bribery along with other firm-level characteristics.1 From
this dataset, two dependent variables reflecting bribe prevalence among firms are used.
The first dependent variable is the size of informal payments reported by firms, expressed as a
share of their total sales. This dependent variable is bi-dimensional because an increase in this
variable can be both induced by an increase in the incidence and/or an increase in the size of
bribes. However, it has been contended that respondents may under-report or over-report bribe
amounts (Clarke, 2011). One way to circumvent this problem is to derive from the first
1 WBES data has been collected according to a stratified random sampling with replacement, based on firm size, geographic location and sector of activity. Enterprises were interviewed between 2006 and 2014 and asked the following question: “We’ve heard that establishments are sometimes required to make gifts or informal payments to public officials to “get things done” with regard to customs, taxes, licenses, regulations, services etc. On average, what percent of total annual sales, or estimated total annual value, do establishments like this one pay in informal payments or gifts to public officials for this purpose?”

6
dependent variable a second and complementary dependent variable, equal to one if a firm has
reported an informal payment, and zero if it has reported no informal payment. The first
dependent variable will be termed “bribe payment”, while the second one will be termed “bribe
incidence”.
I also draw from the WBES dataset a range of firm-level controls that are expected to affect their
inclination to engage in corruption. Building on studies on the determinants of firm-level
corruption (Svensson, 2003; Hellman et al., 2003; Dabla-Norris et al., 2008; Diaby and Sylwester,
2015), I control for the logarithm of a firm’s total annual sales, for the share of direct and
indirect exports in total sales, for the firm’s size (using dummy variables for medium-size and
large-size firms, based on their number of employees), for the firm’s share of public ownership,
for its share of working capital funded by internal funds, its share of working capital funded by
public and private commercial banks, and its sector of activity (using sector dummies).
3.2. Export instability variables
The emphasis placed by this study on export fluctuations is first justified. The rationale behind
export boom and bust variables is then explained.
3.2.1. Export shocks as a major and primary source of macroeconomic instability in developing
countries.
The emphasis placed on export fluctuations is justified for various reasons. First, in developing
countries, the instability in export earnings has been pinpointed as a major source of output
fluctuations (Guillaumont, 2009; Guillaumont and Chauvet, 2001), with a dramatic impact on
growth, investment, tax receipt, redistribution policy, and development outcomes (Balassa,
1989; Bevan et al. 1993; Easterly et al., 1993; Guillaumont et al. 1999). Export windfalls and
downfalls therefore seriously affect, directly and indirectly, revenue inflows in the whole
economy, thereby disrupting households and firms’ economic decisions, including decisions to
engage in corrupt transactions.
Second, export instability is a primary source and mostly-exogenous of macroeconomic
instability, caused by external shocks such as ups and down in international commodity prices,
in the terms of trade, in international interest rates, but also internal shocks such as natural
resource discoveries or climate-related shocks (Jones and Olken, 2010). By contrast, focusing on
the effect of intermediate instabilities – related to growth, public spending or investment –
would lead to a possible downward bias if governance is good and the country is resilient
(Rodrik, 2000; Guillaumont, 2009), or an upward bias if governance is bad and the country is not
resilient (Acemoglu et al., 2003).
7
3.2.2. Identifying corruption responses to asymmetric shocks
The literature often introduces periodic shock variables to study their impact on institutional
outcomes (Voors et al., 2011). However, such an approach applied to corrupt transactions abuts
on the inertia of corruption levels. In fact, one can expect corrupt transactions to spread in
response to irregular and abrupt patterns of export fluctuations rather than regular or normal
fluctuations. Corruption decisions, by their very illegal or illicit nature, probably come after
successive shocks, especially when sharp fluctuations challenge institutional safeguards against
malpractices and make them unable keeping production more attractive than rent-seeking.
Therefore, the focus is placed on the effect of transitory booms and busts of exports, distributed
around a trend estimated over the last 15 years, exhibiting both deterministic and stochastic
paths.2 Variables of export booms and busts are derived from the four-year (t; t-3) skewness of
the distribution of exports around their trend:
2/32
3
ˆ
ˆ1
ˆ
ˆ1
100
T
it
itit
T
it
itit
it
y
yy
T
y
yy
TSkewness with T=[t;t-3] (2)
Where yit is the observed constant value of export in country i at time t, and �̂�it the mixed trend.
As stressed by Rancière et al. (2008), the skewness provides a de facto measure of the
asymmetry and abruptness of shocks around a reference value. The four-year calculation time
window has been chosen to capture the effect of short-run fluctuations. It therefore does not
reflect the asymmetry property of the entire export distribution, since enlarging the time
windows would come at the cost of having similar values of skewness for remote and recent
abrupt shocks, with a possible shift in their effect on bribe prevalence.3 Therefore, this variable
reflects the abruptness and asymmetry of shocks in light of the recent history of export
fluctuations.
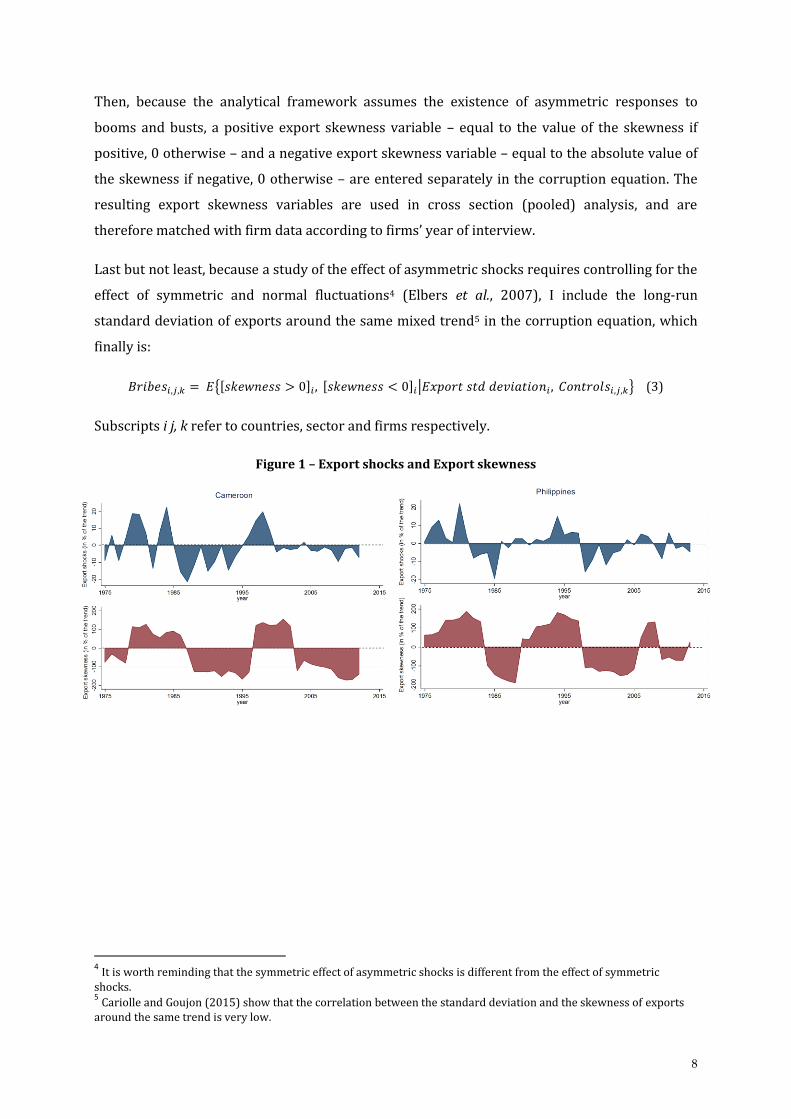
The time correlation between export shocks and export skewness series is illustrated in figure 1
for Pakistan, Philippines, Colombia, and Cameroon. One can see that, contrary to periodic export
shocks variables, the skewness of exports synthetizes well the asymmetry of fluctuations in the
recent history of shocks.
2 That is, a trend with the following shape: yt = α0 + α1. t + α2. yt−1 + ξt with y the constant value of exports, �t a zero-mean i.i.d disturbance term, t a 15 year time trend. See Cariolle and Goujon (2015) for a detailed discussion on
this trend estimation method. 3 Enlarging the time window to six does not change estimated relationships (hereafter presented) but lowers their
significance.
8
Then, because the analytical framework assumes the existence of asymmetric responses to
booms and busts, a positive export skewness variable – equal to the value of the skewness if
positive, 0 otherwise – and a negative export skewness variable – equal to the absolute value of
the skewness if negative, 0 otherwise – are entered separately in the corruption equation. The
resulting export skewness variables are used in cross section (pooled) analysis, and are
therefore matched with firm data according to firms’ year of interview.
Last but not least, because a study of the effect of asymmetric shocks requires controlling for the
effect of symmetric and normal fluctuations4 (Elbers et al., 2007), I include the long-run
standard deviation of exports around the same mixed trend5 in the corruption equation, which
finally is:
𝐵𝑟𝑖𝑏𝑒𝑠𝑖,𝑗,𝑘 = 𝐸{[𝑠𝑘𝑒𝑤𝑛𝑒𝑠𝑠 > 0]𝑖 , [𝑠𝑘𝑒𝑤𝑛𝑒𝑠𝑠 < 0]𝑖|𝐸𝑥𝑝𝑜𝑟𝑡 𝑠𝑡𝑑 𝑑𝑒𝑣𝑖𝑎𝑡𝑖𝑜𝑛𝑖 , 𝐶𝑜𝑛𝑡𝑟𝑜𝑙𝑠𝑖,𝑗,𝑘} (3)
Subscripts i j, k refer to countries, sector and firms respectively.
Figure 1 – Export shocks and Export skewness
4 It is worth reminding that the symmetric effect of asymmetric shocks is different from the effect of symmetric
shocks. 5 Cariolle and Goujon (2015) show that the correlation between the standard deviation and the skewness of exports
around the same trend is very low.

9
3.3. Institutional quality and other macro-level control variables
To test the effect of export booms and busts conditional on the quality of institutions, I
emphasize two separate dimensions of the institutional framework affecting the relative cost of
engaging corrupt transactions: on the one hand, key features of democracy affecting the
probability for corrupt agents of getting caught and sanctioned (Brunetti and Weder, 2003;
Bhattacharyya and Hodler, 2010, 2015), and supporting the protection of property rights and
the freedom of choice (Farhadi et al., 2015); and on the other hand, the performance of financial
markets, which determines the cost of alternative financial resources and the opportunity cost of
diverting resources through corruption (Altunbas and Thornton, 2012).
Democracy variables are drawn from the Freedom House (FH) database, which provides three
sets of variables reflecting three dimensions of modern democracies: the extent of civil liberties
(CL), of political rights (PR), and the freedom of the press (FotP).6 To proxy the imperfection of
financial market, I use three variables drawn from the World Development Indicators: the share
of domestic credit provided by the banking sector in GDP as a proxy for access to credit markets
(used as control variable in the baseline equation), the share of money and quasi-money (M2) in
GDP as an alternative proxy the overall financial development, and the index of credit
information depth which reflects the quality of credit information available through public or
private credit registries. These institutional variables will be separately used as interaction
terms in the corruption equation.
Finally, the baseline corruption equation comprises macro-level controls reflecting determinants
of corruption (Mauro, 1995; La Porta et al., 1999; Treisman, 2000) - that is, the GDP per capita,
the primary completion rate, the share of natural resource rents in GDP, the share of
government expenditures in GDP, the share of trade (exports plus imports) in GDP, the
6 Description of indices is given at https://freedomhouse.org/. The FotP Index ranges from 0 (the most free) to 100 (the least free), the CL and PR indices range from 1 (the most free) to 7 (the least free).

10
logarithm of the population, and the durability of the polity. Since James (2015) pointed out the
importance of sectorial characteristics in channeling the effect of revenue windfalls on
institutional quality, I also use sector dummies to control for it, including unobserved sector-
specific shocks. In the same way as for instability variables, country-level control variables are
matched with micro-level variables according to years of survey rounds.
3.4. Empirical method
The effect of export booms and busts on bribe payments and bribery incidence is estimated
within a three-level (country-sector-firm) estimation framework, based on a maximum
likelihood procedure. In fact, multi-level analysis is particularly fitted for this problematic, as it
takes into account the contextual nature of corrupt transactions (Martin et al., 2007), and allows
controlling for intra-class correlation between observations that could underlie a possible
contagion effects of corrupt transactions (Andvig and Moene, 1990). Therefore, adopting a
multi-level empirical framework should yield significant value to the study of macro-level
determinants of micro-level corrupt transactions.
3.4.1. General econometric framework
Pooled estimations of the following baseline econometric model are conducted:
𝐵𝑟𝑖𝑏𝑒𝑖,𝑗 ,𝑘 = 𝛽0 + 𝛽1. [𝑠𝑘𝑒𝑤 > 0]𝑖 + 𝛽2. [𝑠𝑘𝑒𝑤 < 0]𝑖 + 𝛽3. 𝑋𝑖 + 𝛽5. 𝑌𝑖,𝑗,𝑘 + 𝑑𝑗 + 휀𝑖,𝑗,𝑘 (4)
Where the dependent variable Bribei,j,k is either the amount or the incidence of informal
payments, Xi the macro-level controls, Yi,j,k the micro-level controls, dj the sector dummies and εi,j,k
an i.i.d residual.
In a second step, drawing on a similar specification as Murphy et al. (1991) and Bhattacharyya
and Hodler (2010), I estimate the effect of export booms and busts conditional on institutional
quality, by adding to the baseline model in equation (4) the interaction between export
skewness variables (skew) and institutional variables (instit), which gives:
𝐵𝑟𝑖𝑏𝑒𝑖,𝑗,𝑘 = 𝛿0 + 𝛿1. [𝑠𝑘𝑒𝑤 > 0]𝑖 + 𝛿2. [𝑠𝑘𝑒𝑤 < 0]𝑖 + 𝛿3. [𝑠𝑘𝑒𝑤 > 0 × 𝑖𝑛𝑠𝑡𝑖𝑡]𝑖 + 𝛿4. [𝑠𝑘𝑒𝑤 < 0 ×
𝑖𝑛𝑠𝑡𝑖𝑡]𝑖 + 𝛿5. 𝑖𝑛𝑠𝑡𝑖𝑡𝑖 + 𝛿6. 𝑋𝑖 + 𝛿7. 𝑌𝑖,𝑗,𝑘 + 𝑑𝑗 + 휀𝑖,𝑗,𝑘 (5)
3.4.2. Multi-level analysis
In a single-level estimation framework, it is assumed that observations are independent, i.e. that
residuals are uncorrelated at different layers of the data structure, are zero-mean and have
constant variance (Hox, 2010). However, various arguments regarding the very nature of
corruption decisions can be invoked to relax this assumption. First, previous studies highlighting

11
the holistic origin and the potential structuring role of corrupt systems in economic transactions
(Williamson, 2009; Andvig, 2006, Graef, 2005) strongly suggest that corruption is context-
dependent. In fact, in the same way as exam performances are markedly affected by unobserved
class and school characteristics, corruption decisions are driven by imbricated sector-level
(Diaby and Sylvester, 2015) and country-level (Martin et al. 2007) characteristics. Second, it has
been shown that “corruption may corrupt” (Andvig and Moene, 1990), suggesting that corrupt
transactions may be contagious within a given group of individuals and are therefore correlated
to each other. This problem of intra-class correlation induces loss of efficiencies and biases in
coefficient estimations (Hox, 2010). Third, amounts of reported informal payments as well as
missing data are also likely to be influenced by sector and country unobserved features. For all
these reasons, a multi-level framework is particularly relevant for the analysis of firms’
corruption decisions. The effect of export booms and busts on bribe payments and bribery
incidence is therefore estimated within a three-level (country-sector-firms) estimation
framework.
In three-level estimations, the total residual (εi,j,k) is modelled as a function of a country-level
(λi), a sector-level (μi,j), and a firm-level (νi,j,k) components, so that εi,j,k = λi + μi,j + νi,j,k. It is
assumed that these error components are random, i.e. that 𝐸{λi|𝑋𝑖 , 𝑌𝑖,𝑗,𝑘 , 𝑑𝑗} = 0,
𝐸{μi,j|𝑋𝑖 , 𝑌𝑖,𝑗,𝑘 , 𝑑𝑗, λi } = 0, and 𝐸{νi,j,k|𝑋𝑖 , 𝑌𝑖,𝑗,𝑘 , 𝑑𝑗, λi, μi,j } = 0. In addition to random intercepts,
the model also associates a country-level random component θ to the coefficients before export
skewness-related variables (including interaction terms modelled in equation (5)).7 Applied to
equation (4), the augmented three-level model is therefore the following:
𝐵𝑟𝑖𝑏𝑒𝑖,𝑗 ,𝑘 = 𝛽′0 + (𝛽′1 + 𝜃1,𝑖′ ). [𝑠𝑘𝑒𝑤 > 0]𝑖 + (𝛽′2 + 𝜃2,𝑖
′ ). [𝑠𝑘𝑒𝑤 < 0]𝑖 + 𝛽3. 𝑋𝑖 + 𝛽5. 𝑌𝑖,𝑗,𝑘 + 𝑑𝑗 +
λi + μi,j + ν𝑖,𝑗,𝑘 (4’)
The same decomposition of coefficients before shock-related variables applies to equation (5).
When the binary dependent variable on corruption incidence is used, I perform a probabilistic
linear multi-level modelling of equations (4) and (5), based on a maximum likelihood estimation
procedure, in order to avoid convergence problems (Caudill, 1988).8
3.4.3. Endogeneity issues
There are various reasons to expect that multi-level estimates of equations (4) and (5) reflect
the causal effect of export booms and busts on firms’ bribes. First, the literature on the
7 Random coefficients at the sector-level are not included since in the WBES dataset some firms are grouped within sectors which are not clearly defined. 8 due to the presence of sector dummy variables in our model. The resulting estimates are consistent with estimates obtained from a single-level Probit estimation framework. The latter can be provided upon request.
12
measurement of structural economic vulnerability (Guillaumont, 2009, Guillaumont and
Chauvet, 2001) considers the instability of exports around a random and deterministic trend as
a structural variable independent from policy-related factors, the latter being reflected in the
trend rather than in fluctuations around it. Second, and more importantly, even though export
shocks could be caused by poor policies (as suggested in Acemoglu et al. (2003) and Raddatz
(2007)), it is unlikely that a transaction undertaken by a single firm has macro-level
consequences (Farla, 2014). This argument should also hold when using democracy and
financial market variables as interaction terms in equation (5). However, as mentioned earlier,
corrupt transactions may be contagious within groups of firms (Andvig and Moene (1990)). In
statistical terms, this phenomenon is reflected by intra-class correlation, which could induce a
reverse causality bias if the contagious nature of bribes makes country exports fluctuating and
institutions failing.
Fortunately, the advantage of the three-level estimation framework set earlier is that it controls
for this source of endogeneity (Hox, 2010), in so far as this contagion effect plays at the sector
and/or the country-levels. Last but not least, three-level modeling takes into account sector-level
and country-level unobserved factors influencing firms inclination to report bribe payments or
stay silent, as well as inclination to under or over-report them. For all these reasons, we expect
estimates of the effect of booms and busts on bribery to be unaffected by reverse causality,
measurement error and omitted variable biases.
4. EMPIRICAL RESULTS
The baseline estimation sample consists of pooled data covering 19,712 firms, surveyed in 2006,
2007, 2009, 2010, 2011, and 2012, and located in 36 developing countries. Countries with less
than 30 observations have been removed from the sample. Summary statistics of variables used
in the empirical analysis, and statistics related to bribery and firms’ exports by country and
region are detailed in Appendix.
4.1. Preliminary evidence
Figure 4 exposes preliminary graphical evidence on the relationship between the skewness of
exports and bribery variables. In graph 4a), variables of bribe payments and bribe incidence
have been averaged by different ranges of skewness values for an extended sample of
developing countries. It shows that the prevalence of bribery is strictly increasing with the
intensity of positive shocks, supporting at first sight the existence of opportunistic corruption
spreading with export booms, consistently with the literature’s findings. A positive correlation
between the intensity of export busts and bribe prevalence is also apparent but nonlinear. Graph
4b) plots country averages of bribe payments and incidence against average values of export

13
skewness for the estimation sample. It provides additional illustration of the symmetric positive
correlation between export booms, export busts and corruption prevalence in developing
countries.
Figure 4. Export booms and busts and bribe prevalence in developing countries
a) Average bribe payment and incidence according to different ranges of export shocks intensity
Sample: 80 developing countries, 41,182 observations.
b) Graphical illustration of the correlation between country averages of export skewness and country averages of bribe prevalence in the estimation sample
Estimation sample: 36 developing countries, 19,712 observations.
4.2. Main results
To further the analysis, estimates of equation (4) are reported in table 2, and support previous
graphical relationships.9 Three-level estimates in columns (1) and (2) show a positive and
significant effect of export booms and export busts on the size of bribe payments, with an effect
9 Estimates of micro and macro-level controls are not reported but are displayed and commented in Cariolle (2016).

14
of booms of slightly larger magnitude than the effect busts. Estimation with the corruption
incidence variable in column (2) also points to a positive symmetric effect of booms and busts on
corruption incidence, but in less reliable confidence level.
Therefore, this first bunch of evidence highlights a consistent positive symmetric effect of export
booms and busts on firms’ bribery, but this symmetric effect seems reflected on the average size
of bribes rather than on their incidence. The stability of export skewness coefficients after
controlling for micro and macro-level determinants of bribery suggests that export movements
are independent from other controls. To sum up, these first estimations support that corruption
expands during both positive and negative shocks, thereby suggesting that most countries in the
baseline sample do not have strong-enough institutions to prevent firms from entering in
corruption during economic upheavals.
Table 2. The baseline equation – three-level estimations.
Dependent variable: Bribe payments Bribe incidence
(1) (2) (3) (4)
Export skewness >0 0.012*** (0.01) 0.010*** (0.01) 0.001** (0.05) 0.001 (0.31)
Export skewness <0 0.005*** (0.01) 0.004** (0.02) 0.001 (0.23) 0.001 (0.42)
Export standard deviation -0.004*** (0.00) 0.006 (0.77) -0.000 (0.47) 0.005*** (0.00)
Macro-controls No Yes No Yes
Micro-controls No Yes No Yes
Dummies firm size No Yes No Yes
Dummies sector No Yes No Yes
Wald Stat 71.51*** 162.39*** 23.37*** ..
LR Stat 567.44*** 257.7*** 1935*** 1223.8***
#Countries/#obs 36(19,712)
Controls are not reported. Standard errors are clustered by country. When possible, estimates are rounded up to three decimal spaces. P-values in parenthesis. *significant at 10%; **significant at 5%; ***significant at 1%.
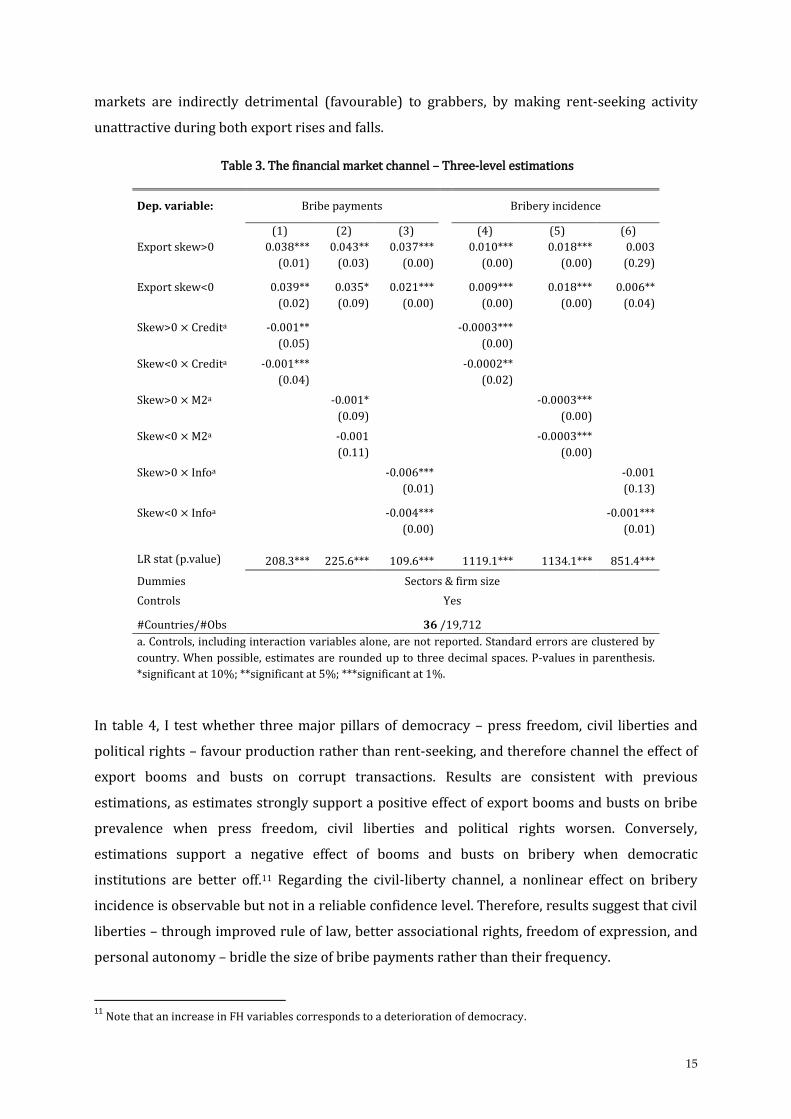
Table 3 reports multi-level estimates of equation (5), using as interaction terms the three
variables of financial market performance, separately. It provides significant and robust
evidence of a symmetric effect of export booms and busts conditional on financial market well-
functioning: export booms and busts are found to increase bribery when access to financial
services is restricted and when financial information is opaque, while they are found to reduce it
when access to financial services is improved and when financial information is more
transparent.10 Thus, empirical evidence strongly support that improved (failing) financial
10 Financial variable thresholds above/below which the direction of the effect reverses , and the number of countries above/below these thresholds, can be provided on request.
15
markets are indirectly detrimental (favourable) to grabbers, by making rent-seeking activity
unattractive during both export rises and falls.
Table 3. The financial market channel – Three-level estimations
Dep. variable: Bribe payments Bribery incidence
(1) (2) (3) (4) (5) (6)
Export skew>0 0.038***
(0.01)
0.043**
(0.03)
0.037***
(0.00)
0.010***
(0.00)
0.018***
(0.00)
0.003
(0.29)
Export skew<0 0.039**
(0.02)
0.035*
(0.09)
0.021***
(0.00)
0.009***
(0.00)
0.018***
(0.00)
0.006**
(0.04)
Skew>0 × Credita -0.001**
(0.05)
-0.0003***
(0.00)
Skew<0 × Credita -0.001***
(0.04)
-0.0002**
(0.02)
Skew>0 × M2a -0.001*
(0.09)
-0.0003***
(0.00)
Skew<0 × M2a -0.001
(0.11)
-0.0003***
(0.00)
Skew>0 × Infoa -0.006***
(0.01)
-0.001
(0.13)
Skew<0 × Infoa -0.004***
(0.00)
-0.001***
(0.01)
LR stat (p.value) 208.3*** 225.6*** 109.6*** 1119.1*** 1134.1*** 851.4***
Dummies Sectors & firm size
Controls Yes
#Countries/#Obs 36 /19,712
a. Controls, including interaction variables alone, are not reported. Standard errors are clustered by
country. When possible, estimates are rounded up to three decimal spaces. P-values in parenthesis.
*significant at 10%; **significant at 5%; ***significant at 1%.
In table 4, I test whether three major pillars of democracy – press freedom, civil liberties and
political rights – favour production rather than rent-seeking, and therefore channel the effect of
export booms and busts on corrupt transactions. Results are consistent with previous
estimations, as estimates strongly support a positive effect of export booms and busts on bribe
prevalence when press freedom, civil liberties and political rights worsen. Conversely,
estimations support a negative effect of booms and busts on bribery when democratic
institutions are better off.11 Regarding the civil-liberty channel, a nonlinear effect on bribery
incidence is observable but not in a reliable confidence level. Therefore, results suggest that civil
liberties – through improved rule of law, better associational rights, freedom of expression, and
personal autonomy – bridle the size of bribe payments rather than their frequency.
11
Note that an increase in FH variables corresponds to a deterioration of democracy.

16
To sum up, there are strong and robust empirical evidence, consistent with literature’s findings,
of a nonlinear symmetric effect of export sharp fluctuations on bribery, conditional on the
quality of financial markets and democratic institutions. On the one hand, the credit provided
domestically by the private sector and the depth of the financial information, and on the other
hand, an independent press and enforced political rights, appear as effective institutional
safeguards against the prevalence of corruption responses to shocks.
Table 4. The democracy channel – Three-level estimations.
Multi-level estimations
Dep. variable: Bribe payments Bribery incidence
(1) (2) (3) (4) (5) (6)
Export skew>0 -0.025***
(0.00)
-0.022***
(0.00)
-0.006
(0.19)
-0.003*
(0.08)
-0.003
(0.44)
-0.002***
(0.00)
Export skew<0 -0.031***
(0.01)
-0.018**
(0.02)
-0.016***
(0.00)
-0.016***
(0.01)
-0.007*
(0.09)
-0.009***
(0.00)
Skew>0 × FotPa 0.001***
(0.00)
0.0001**
(0.02)
Skew<0 × FotPa 0.001***
(0.01)
0.0003***
(0.00)
Skew>0 × CLa 0.012**
(0.00)
0.000
(0.62)
Skew<0 × CLa 0.008***
(0.00)
0.002
(0.19)
Skew>0 × PRa 0.007***
(0.01)
0.001***
(0.01)
Skew<0 × PRa 0.008***
(0.00)
0.003***
(0.00)
#Countries/#obs 36/19,712
Dummies Sector & firm size
Controls Yes
LR Test 160.6*** 159.9*** 197.6*** 1021.3*** 1017.7*** 1170.5***
Controls, including interaction variables alone, are not reported. Standard errors are clustered by country. P-values in parenthesis. *significant at 10%. When possible, estimates are rounded up to three decimal spaces. a. An increase in Freedom House’s indices corresponds to a deterioration of democracy.
4.3. Robustness check: four-level estimations
In robustness analysis, a four-level model is estimated, including years of interview as an
additional intermediary level in the data hierarchy, between the sector level and the firm level. It
is worth making sure that change in the modelling of the data structure does not alter previous
results. In fact, depending on country contexts, the overall confidence level towards surveyors
after repeated surveys may change. Ignoring this additional level in the data structure may
therefore eventually bias estimations.
The total residual (εi,j,k) in equations (4) and (5) is therefore modelled as a function of a country-
level random component (λi), a sector-level random component (μi,j), a year-level random

17
component (ρi,j,t) and a firm-level random component (νi,j,t,k), so that εi,j,t,k = λi + μi,j + ρi,j,t + νi,j,t,k.
The random slope component is kept at the country level. For convergence reason, we run four-
level estimation using the bribe-payment dependent variable only. Results are presented in
Appendix B. Estimated nonlinear relationships remain stable and significant, compared to three-
level estimates. Therefore, results are robust to the inclusion of the year of survey round as an
additional level of analysis in the model.
5. CONCLUDING REMARKS
This paper provides robust empirical evidence, consistent with literature’s findings, of a
“voracity effect” of export booms and a “scarcity effect” of export busts on bribe prevalence.
These effects are estimated within a three-level estimation framework, which allows a
contextualization of corrupt transactions at the sector and country-levels, thereby controlling
for sector and country unobserved features that could induce measurement errors, omitted
variable bias, and reverse causality bias.
Multi-level estimates support a nonlinear symmetric effect of export booms busts on bribe
payments and incidence, consistent with the resource curse literature (Mehlum et al., 2006;
Bhattacharyya and Hodler, 2010, 2015): export booms are found to foster bribe payments and
incidence when financial and democratic institutions are failing, and to reduce them when
institutions are better off. But more importantly, estimates point that export collapses in weak
institutional contexts may also be a curse, by inciting firms to compete for scarce resources and
to divert them through corruption and rent-seeking.
Last but not least, this study identifies policy levers that could dampen the positive symmetric
effect of export booms and busts on bribe prevalence: policies aimed at improving the
functioning of financial markets and supporting civil liberties, political rights and press freedom
should prevent firms from entering in corruption during economic booms and economic
hardships, by keeping productive activities more attractive than rent-seeking. In short, this
paper gives additional evidence on the importance of institutional safeguards against corrupt
practices in times of abundance, and new insights into their importance in times of shortage.

18
ACKNOWLEDGEMENTS
The author is grateful to Patrick Guillaumont, Elise Brezis, Bernard Gauthier, Jan Gunning,
Olivier Cadot, Michaël Goujon, Jean-louis Combes, Laurent Wagner, Gaëlle Balineau, Alexis Le
Nestour, Aurélia Lepine, as well as participants at research seminars at Navarra University
(Spain) and Gretha (Bordeaux), at the 2014 EPCS meeting in Cambridge (April, 4-6, 2014), at the
63th annual congress of the AFSE in Lyon (June, 18-16, 2014), and at the 2015 Ferdi workshop
“Commodity market instability and asymmetries in developing countries: Development impacts
and policies”, for helpful comments and suggestions. This paper benefited from the support of
the FERDI (Fondation pour les etudes et recherches sur le développement international) and the
French Government’s ‘Investissement d’Avenir’ programme (reference ANR-10-LABX-14-01).
Remaining errors are mine.

19
REFERENCES
Acemoglu, D., Johnson, S., Robinson, and Thaicharoen J Y. (2003). Institutional causes,
macroeconomic symptoms: instability, crises and growth. Journal of Monetary Economics, 50(1),
49-123.
Altunbas, Y., and Thornton, J. (2012). Does Financial Development Reduce Corruption?.
Economics Letters, 114(2), 221–223.
Andvig, J.C. (2006). Corruption and Fast Change. World Development, 34(2), 328-340.
Andvig, J. C., and Moene, K. O. (1990). How corruption may corrupt. Journal of Economic Behavior
& Organization, 13(1), 63-76.
Balassa, B. (1989). Temporary windfalls and compensation arrangements. Weltwirtschaftliches
Archiv, 125(1), 97-113.
Bardhan, P. (1997). Corruption and development: A review of issues. Journal of Economic
Literature, 35(3), 1320-1346.
Bevan, D., Collier, P. and J.W. Gunning (1993). Trade shocks in developing countries,
Consequences and policy responses. European Economic Review, 37(2-3), 557-565.
Bhattacharyya, S., and Hodler, R. (2015). Media freedom and democracy in the fight against
corruption. European Journal of Political Economy, 39, 13-24.
Bhattacharyya, S., and Hodler, R. (2010). Natural resources, democracy and
corruption. European Economic Review, 54(4), 608-621.
Cariolle, J., and M. Goujon (2015) Measuring Macroeconomic Instability: A critical Survey
Illustrated with Export Series. Journal of Economic Surveys, 29, 1-26.
Caudill, S. B. (1988). Practitioners corner: An advantage of the linear probability model over
probit or logit. Oxford Bulletin of Economics and Statistics, 50(4), 425-427.
Clarke, G.R.G. (2011). How Petty is Petty Corruption? Evidence from Firm Surveys in Africa.
World Development, 39(7), 1122-1132.
Dabla-Norris E., Gradstein, M. and G. Inchauste (2008). What causes firms to hide output? The
determinants of informality. Journal of Development Economics, 85, 1–27.
Diaby, A., and K. Sylwester (2015). Corruption and Market Competition: Evidence from Post-
Communist Countries. World Development, 66, 487–499.
Easterly, W., Kremer, M., Pritchett, L., and Summers, L. H. (1993). Good policy or good
luck?. Journal of Monetary Economics, 32(3), 459-483.
Elbers, C., Gunning, J.W., and B.H. Kinsey (2007). Growth and Risk: Methodology and Micro
Evidence. World Bank Economic Review, 21(1), 1-20.

20
Farhadi, M., Islam, M. R., & Moslehi, S. (2015). Economic Freedom and Productivity Growth in
Resource-rich Economies. World Development, 72, 109-126.
Farla, K. (2014). Determinants of firms’ investment behaviour: a multilevel approach. Applied
Economics, 46(34), 4231-4241.
Guillaumont, P. (2009). Caught in a trap: Identifying the Least Developed Countries. Economica.
Guillaumont, P., and L. Chauvet, (2001). Aid and Performance : A Reassessment. Journal of
Development Studies, 37(6), 66-92.
Guillaumont, P., Guillaumont-Jeanneney, S., and J-F. Brun (1999). How Instability Lowers African
Growth. Journal of African Economies. 8(1), 87-107.
Hellman, J. S., Jones, G., and D. Kaufmann (2003). Seize the state, seize the day: state capture and
influence in transition economies. Journal of Comparative Economics, 31(4), 751-773.
Hox, J.J. Multi-level Analysis, Techniques and Applications, Quantitative Methodology Series,
Rouledge, 2010.
James, A. (2015). The resource curse: A statistical mirage?. Journal of Development
Economics, 114, 55-63.
Jones, B.F., and B. Olken (2010). Climate Shocks and Exports. American Economic Review: Papers
& Proceedings, 100, 454–459.
La Porta, R., Lopez-de-Silanes, F., Shleifer, A., and Vishny, R. (1999). The quality of
government. Journal of Law, Economics, and Organization, 15(1), 222-279.
Lui, F.T. (1985). An Equilibrium Queuing Model of Bribery. Journal of Political Economy, 93(4),
760-781.
Martin, K. D., Cullen, J. B., Johnson, J. L., and Parboteeah, K. P. (2007). Deciding to bribe: A cross-
level analysis of firm and home country influences on bribery activity. Academy of Management
Journal, 50(6), 1401-1422.
Mauro, P. (1995). Corruption and growth. The Quarterly Journal of Economics, 110(3), 681-712.
Mehlum, H., Moene, K., and R. Torvik (2006). Institutions and the resource curse. Economic
Journal, 116(508), 1-20.
Mehlum, H., Moene, K., and R. Torvik (2003). Predator or prey? Parasitic enterprises in economic
development. European Economic Review, 47(2), 275-294.
Murphy, K.M., Shleifer, A., and R.W. Vishny (1993). Why is Rent-Seeking so Costly to Growth. The
American Economic Review, 83(2), 409-414.
Murphy, K.M., Shleifer, A., and R.W. Vishny (1991). The Allocation of Talent: Implication for
Growth. The Quarterly Journal of Economics, 106(2), 503-530.
21
van der Ploeg, F. (2011). Natural Resources: Curse or Blessing?. Journal of Economic Literature,
49(2), 366-420.
Raddatz, C. (2007). Are external shocks responsible for the instability of output in low-income
countries? Journal of Development Economics, 84, 155–187.
Rancière, R., Tornell, A., and F. Westermann (2008). Systemic crises and growth. The Quarterly
Journal of Economics, 123(1), 359-406.
Rodrik, D. (2000). Participatory Politics, Social Cooperation, and Economic Stability. American
Economic Review, 90(2), 140-144.
Rodrik, D. (1998). Why do more open economies have bigger governments? Journal of Political
Economy, 106(5), 997-1032.
Sachs, J. D., and A.M. Warner (2001). The curse of natural resources. European economic
review, 45(4), 827-838.
Saha, B. (2001). Red tape, incentive bribe and the provision of subsidy. Journal of Development
Economics, 65, 113–33.
Svensson, J. (2003). Who Must Pay Bribes and How Much? Evidence from a Cross Section of
Firms. The Quarterly Journal of Economics, 118(1), 207-230.
Tornell, A., and P.R. Lane (1999). The Voracity Effect. The American Economic Review. 89(1), 22-
46.
Treisman; D. (2000). The causes of corruption: a cross-national study. Journal of Public
Economics, 76(3), 399-457.
Voors, M.J., Bulte, E.H., and R. Damania (2011). Income Shocks and Corruption in Africa: Does a
Virtuous Cycle Exist?. Journal of African Economies, 20(3), 395-418.
Williamson, C.R. (2009). Informal institutions rule: institutional arrangements and economic
performance. Public Choice, 139(3-4), 371-387.

22
APPENDICES
A.SUMMARY STATISTICS
A.1. Sample summary statistics
Source Mean Std. Dev.
Bribe payments (in % of total sales)
WBES
1.133 4.718
Bribery incidence (in % of firms] 14.62 35.34
Log total sales 16.94705 3.199014
State ownership (% firms) 0.3216315 4.704202
Indirect exports (% of firm’s sales) 2.585486 12.82395
Direct exports (% of firm’s sales) 6.538187 20.46367
Internal funds (% of working capital) 65.99668 36.38616
Public and private commercial funding
(% of working capital) 13.36995 24.25725
% of large-size firms 18.71 39.00
% of medium-size firms 33.13 0.4707002
% of small-size firms 48.15 0.4996716
Export std dev (in % of trend)
World
Development
Indicators
(Doing Business)
10.33 22.40
Export skewness > 0 (in % of trend) 38.59 55.51
Export skewness < 0 (in % of trend) 76.21 69.10
Primary completion rate 90.27 16.89
GDP per capita (2005 Constant USD) 3616 2558
Log population 15.40 2.72
Dom. credit to private sector (% GDP) 34.74 20.61
M2 ( % of GDP) 42.45574 15.06237
Depth of credit info index 4.259334 2.117428
Gvt final consumption (% of GDP) 13.30 3.62
Trade openness (% in GDP) 66.88 27.89
Natural resource rents (% of GDP) 10.65 8.11
Political regime durability (in years) Polity IV 17.29 12.62
FotP global index
Freedom House
51.91 15.88
CL global Index 3.271053 1.135549
PR global Index 3.19166 1.665923
23
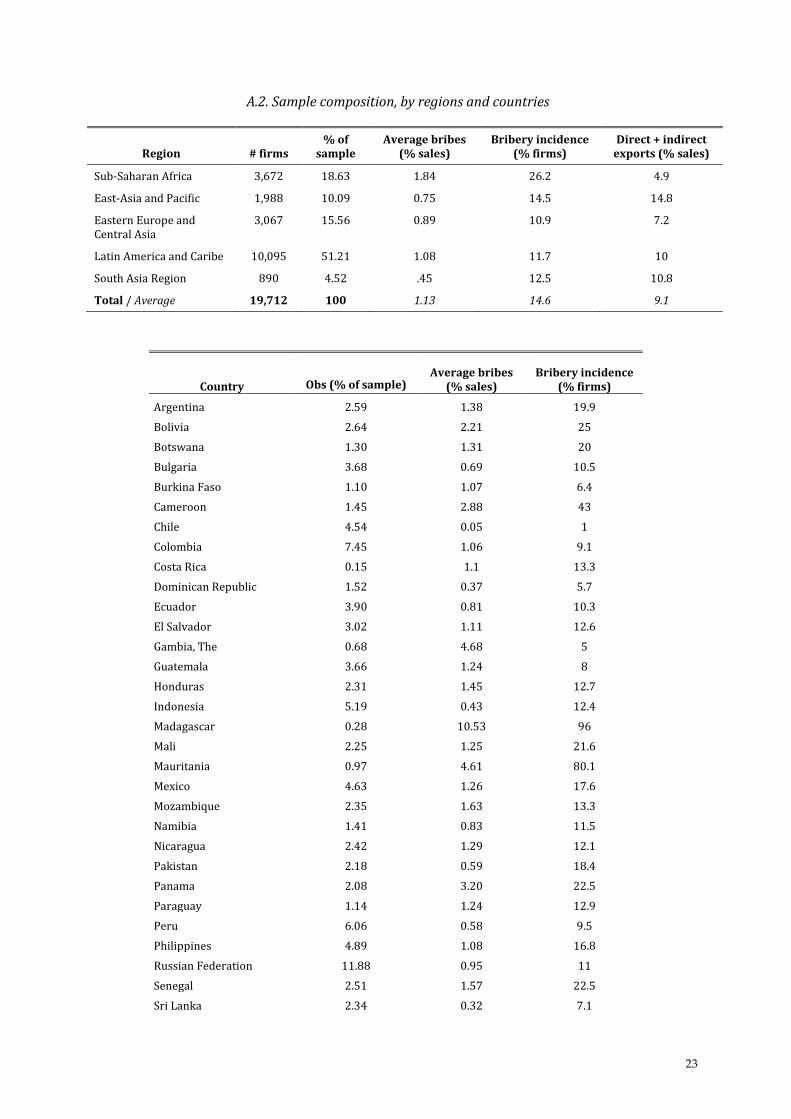
A.2. Sample composition, by regions and countries
Region # firms % of
sample Average bribes
(% sales) Bribery incidence
(% firms) Direct + indirect
exports (% sales)
Sub-Saharan Africa 3,672 18.63 1.84 26.2 4.9
East-Asia and Pacific 1,988 10.09 0.75 14.5 14.8
Eastern Europe and Central Asia
3,067 15.56 0.89 10.9 7.2
Latin America and Caribe 10,095 51.21 1.08 11.7 10
South Asia Region 890 4.52 .45 12.5 10.8
Total / Average 19,712 100 1.13 14.6 9.1
Country Obs (% of sample) Average bribes
(% sales) Bribery incidence
(% firms)
Argentina 2.59 1.38 19.9
Bolivia 2.64 2.21 25
Botswana 1.30 1.31 20
Bulgaria 3.68 0.69 10.5
Burkina Faso 1.10 1.07 6.4
Cameroon 1.45 2.88 43
Chile 4.54 0.05 1
Colombia 7.45 1.06 9.1
Costa Rica 0.15 1.1 13.3
Dominican Republic 1.52 0.37 5.7
Ecuador 3.90 0.81 10.3
El Salvador 3.02 1.11 12.6
Gambia, The 0.68 4.68 5
Guatemala 3.66 1.24 8
Honduras 2.31 1.45 12.7
Indonesia 5.19 0.43 12.4
Madagascar 0.28 10.53 96
Mali 2.25 1.25 21.6
Mauritania 0.97 4.61 80.1
Mexico 4.63 1.26 17.6
Mozambique 2.35 1.63 13.3
Namibia 1.41 0.83 11.5
Nicaragua 2.42 1.29 12.1
Pakistan 2.18 0.59 18.4
Panama 2.08 3.20 22.5
Paraguay 1.14 1.24 12.9
Peru 6.06 0.58 9.5
Philippines 4.89 1.08 16.8
Russian Federation 11.88 0.95 11
Senegal 2.51 1.57 22.5
Sri Lanka 2.34 0.32 7.1

24
Swaziland 1.42 1.26 40
Togo 0.51 0.91 12.9
Uruguay 2.51 0.17 4
Venezuela, RB 0.59 3.06 36.7
Zambia 2.39 1.12 16.1
Total / average 100.00 1.13 14.6

25
B. FOUR-LEVEL ESTIMATIONS
Dep. variable: Bribe payments
(1) (2) (3) (4) (5) (6) (7)
Export skew>0 0.010*** (0.01) 0.037*** (0.01) 0.041*** (0.00) 0.037*** (0.00) -0.025** (0.02) -0.022*** (0.00) -0.006 (0.20)
Export skew<0 0.003 (0.14) 0.037*** (0.01) 0.033*** (0.00) 0.021*** (0.00) -0.029*** (0.01) -0.018*** (0.00) -0.014** (0.00)
Financial market performancea
Skew>0 × Credit -0.001*** (0.00)
Skew<0 × Credit -0.001*** (0.00)
Skew>0 × M2 -0.001** (0.03)
Skew<0 × M2 -0.001*** (0.00)
Skew>0 × Info -0.006*** (0.00)
Skew<0 × Info -0.004*** (0.00)
Democracya
Skew>0 × FotP 0.001*** (0.01)
Skew<0 × FotP 0.001*** (0.00)
Skew>0 × CL 0.012*** (0.00)
Skew<0 × CL 0.008*** (0.00)
Skew>0 × PR 0.006*** (0.00)
Skew<0 × PR 0.007*** (0.00)
#Countries/#obs 36/19,712
Dummies Sector, firm size
Controls Yes
Wald Stat(pvalue) 136.1*** 141.4*** 134.1*** 589.2*** 145.9*** 181.3*** 178.3***
LR Test 254.3*** 226.8*** 242.7*** 876.6*** 235.9*** 204.5*** 202.7***
a. Controls, including interaction variables alone, are not reported. P-values in parenthesis. *significant at 10%; **significant at 5%; ***significant at 1%. When possible, estimates are rounded to three decimal spaces. CL is Freedom House’s Civil Liberty index, PR, Freedom House’s Political Right index, and FotP is Freedom House’s Freedom of the Press index. An increase in Freedom House’s indices corresponds to a deterioration of democracy.